Uplink Array System of Large or Small Aperture Antennas for the … · 2015-07-29 · Uplink Array...
18
Uplink Array System of Large or Small Aperture Antennas for the Deep Space Network; Calibration and Testbedl. Farid Amoozegar, Leslie Paal , James Layland, Robert Cesarone, Vahraz Jamnejad, Arnold Silva, Dave Losh, Bruce Conroy, Tim Cornish Jet Propulsion Laboratory California Institute of Technology Pasadena, CA 9 1 109 Farid.Amoozegar@j pl.nasa.gov (818) 354 -7428 Abstract-Recently, arraying of large or small and distributed reflector antennas for uplink applications has attracted attention for a capability upgrade to the Deep Space Network (DSN). This interest is driven by the desire to maximize the usefulness of existing DSN large apertures in case of spacecraft emergency and to develop the necessary knowledge of how the array of small and distributed reflector antennas can meet other future uplink throughput needs. The primary challenge for uplink arraying of distributed reflector antennas for deep space applications is the lack of feedback from deep space within a reasonably short period. Furthermore, the individual reflectors (and their transmitter subsystems) are thousands of wavelengths apart, which make the phase coherence of individual transmitted signals an extremely challenging task. Because of the return light time constraints, all closed-loop calibrations and relative phase adjustments for any coherent combination of signals from individual antennas shall be conducted no farther than near- Earth orbits. This paper discusses the large array background, scope, and evolution, and some of the lessons learned from preliminary studies of the uplink array. TABLE OF CONTENTS 1. INTRODUCTION ....................................... 1 2. UPLINK ARRAY TECHNOLOGY ............... 2 3. UPLINK ARRAY SYSTEM ......................... 4 5. CONCLUSION ......................................... 15 REFERENCE:^ ............................................. 17 BIOGRAPHY .............................................. .18 4. EXPERIMENTS AND LESSONS LEARNED. 9 1. INTRODUCTION I . I NASA s Strategic Plan NASA seeks increases in data volume by 10 to 100 times (Fig. 1) or perhaps even higher. In a previous paper [I], we discussed the options envisioned by NASA for the future DSN architecture. Specifically, one of the major options for an effective increase in DSN antenna aperture size is the design of a large array of distributed reflector antennas as illustrated in Fig. 2. Q1 'iii X100 - [r 2000 D SN E%t.ensico\s kmplr~?i?~ VDeciiiJm j ................... Pmtalpeof ', ~YmaArrOys ' ? hlplezrmntatiL0f Arrayloptical ................... ryela Generrak DSN) Figure 1 - DSN time scale of future data rate trends. The research effort regarding large arrays of distributed reflector antennas will also be relevant and beneficial to future NASA programs such as formation flying, modular structures for large apertures in space, interplanetary network and protocol development, spacecraft emergency, microwave power beam, and multiplatform lightweight synthetic aperture radar [2]. ' 0-7803-8155-6/04/$17.000 2004 IEEE * IEEEAC paper # 1254, Version 3, Updated November 4,2003 1
Transcript of Uplink Array System of Large or Small Aperture Antennas for the … · 2015-07-29 · Uplink Array...

Uplink Array System of Large or Small Aperture Antennas for the Deep Space Network;
Calibration and Testbedl. Farid Amoozegar, Leslie Paal , James Layland, Robert Cesarone,
Vahraz Jamnejad, Arnold Silva, Dave Losh, Bruce Conroy, Tim Cornish
Jet Propulsion Laboratory California Institute of Technology
Pasadena, CA 9 1 109
Farid.Amoozegar@j pl.nasa.gov (818) 354 -7428
Abstract-Recently, arraying of large or small and distributed reflector antennas for uplink applications has attracted attention for a capability upgrade to the Deep Space Network (DSN). This interest is driven by the desire to maximize the usefulness of existing DSN large apertures in case of spacecraft emergency and to develop the necessary knowledge of how the array of small and distributed reflector antennas can meet other future uplink throughput needs. The primary challenge for uplink arraying of distributed reflector antennas for deep space applications is the lack of feedback from deep space within a reasonably short period. Furthermore, the individual reflectors (and their transmitter subsystems) are thousands of wavelengths apart, which make the phase coherence of individual transmitted signals an extremely challenging task. Because of the return light time constraints, all closed-loop calibrations and relative phase adjustments for any coherent combination of signals from individual antennas shall be conducted no farther than near- Earth orbits. This paper discusses the large array background, scope, and evolution, and some of the lessons learned from preliminary studies of the uplink array.
TABLE OF CONTENTS
1. INTRODUCTION ....................................... 1 2. UPLINK ARRAY TECHNOLOGY ............... 2 3. UPLINK ARRAY SYSTEM ......................... 4
5. CONCLUSION ......................................... 15 REFERENCE:^ ............................................. 17 BIOGRAPHY .............................................. .18
4. EXPERIMENTS AND LESSONS LEARNED. 9
1. INTRODUCTION I . I NASA s Strategic Plan
NASA seeks increases in data volume by 10 to 100 times (Fig. 1) or perhaps even higher. In a previous paper [I], we discussed the options envisioned by NASA for the future DSN architecture. Specifically, one of the major options for an effective increase in DSN antenna aperture size is the design of a large array of distributed reflector antennas as illustrated in Fig. 2.
Q1 'iii X100 - [r
2000 D SN E%t.ensico\s k m p l r ~ ? i ? ~
V D e c i i i J m j ...................
Pmtalpeof ',
~ Y m a A r r O y s ' ? hlplezrmntatiL0f Arrayloptical ................... r y e l a Generrak DSN)
Figure 1 - DSN time scale of future data rate trends.
The research effort regarding large arrays of distributed reflector antennas will also be relevant and beneficial to future NASA programs such as formation flying, modular structures for large apertures in space, interplanetary network and protocol development, spacecraft emergency, microwave power beam, and multiplatform lightweight synthetic aperture radar [2] .
' 0-7803-8155-6/04/$17.000 2004 IEEE * IEEEAC paper # 1254, Version 3, Updated November 4,2003
1

Figure 2 - Large array for deep space (CSIRO-SKA).
1.2 Scope of Large Array in Transmit Mode
A detailed discussion of why a large-phased array of antennas is needed is in [3-71. The need for a large distributed transmitting array of reflectors has not been addressed well in the literature as of yet. Although this topic by itself (Le., scope of the large transmit array) requires a separate detailed discussion, we briefly outline two of the key motives for using large arrays in transmit mode and leave the more complete and detailed discussion of other large transmit array benefits to a future paper.
1.2. I Extremely Large Solar System Radar Concept
One of the major national assets within the DSN is the Goldstone Solar System Radar (GSSR), which is the largest of its kind in the world. GSSR primarily consists of a 70-m antenna with a 500-kW transmitter. GSSR provides images of Mercury, Venus, Mars, the satellites of Jupiter and Saturn, the Moon, and asteroids and comets. It also provides statistics of the orbital debris that result from spacecraft activities and the residual parts of the rockets. GSSR’s most interesting pictures are the ones jointly generated with the National Radio Astronomy Observatory’s (NRAO’s) Very Large Array (VLA) in the New Mexico desert. The probability of eventual decommissioning of the 70-m antenna would result in loss of a major national asset unless it was replaced with an alternate large-aperture antenna with transmit capability. Developing an array capable of communication as well as active radar sensing and passive astronomical observation helps with creating extremely large apertures for solar system exploration.
1.2.2 Spacecraft Emergency
For spacecraft emergencies, the improved uplink capability is critical. Valuable assets in space can be lost when there is no emergency uplink power to spacecraft. Moreover, emergency situations are typically sudden by nature and demand high- rate burst uplink to recover the spacecraft, particularly if the recovery demands payload software reconfiguration for future space instruments. Oddly enough, the ability to recover spacecraft (with unusual attitudes) has declined due to changes in spacecraft operating frequencies. Twenty years
ago, spacecraft had S-band command receivers and the DSN had 400 KW S-band transmitters on its 70-m antennas. Current spacecraA carry only X-band command receivers and only 20 KW X-band transmitters are installed on the antennas. To fill the need for higher effective isotropic radiated power (EIRP) requirements, the DSN can either increase transmit power or array antennas in uplink mode. Putting large X-band transmitters on the heavily subscribed 70-m antennas would leave them as a potential single point of failure. Therefore, emergency situations are another aspect that makes the large radio frequency (RF) array transmit capability a vital asset.
2. UPLINK ARRAY TECHNOLOGY 2. I Compact vs. Distributed Apertures
Traditional (filled or compact aperture) phased array systems have elements closely spaced at distances equivalent to a fraction of a wavelength (h/2). Yet, in such compact arrays, the phase error from one element to its adjacent one is less than approximately 20 degrees for all practical purposes. At m a - b a n d frequencies, this requirement implies element spacing of 1.5 and 0.5 cm, respectively. Even at such small element spacing, a substantial engineering effort is required to keep the phase and amplitude of the elements aligned in such a way that the total combined antenna pattern at the far field converges to a desired beam in all directions for the entire transmission bandwidth. At high frequencies of m a - band, the far field (2D2 /A) indicates that a big range, or a large test facility is required. For example, a 12-m and a 34-m antenna at X-band have a far field at approximately 10 and 70 km respectively. Alternatively, expensive equipment and computational methods are needed if the calibration takes place at near field conditions. For compact arrays at high frequencies, the calibration is normally conducted in near field through a technique called field aperture probe (FAP). Phase and amplitude of individual elements are measured through FAP sensing and are computationally converted to far field equivalent through Fast Fourier Transform methods. The theoretical far field patterns are then compared with the Fourier transform of the measured near field patterns.
For the filled aperture arrays, the close neighborhood of the compact array elements gives them almost uniform thermal and mechanical characteristics and the statistical element-to- element variations are well behaved. For distributed reflector arrays, the distance from one element to an adjacent element is thousands of wavelengths, and the thermal and mechanical characteristics of each element could be very different. Therefore, the price paid for the low cost of the reflector antennas and their wideband property is the phase coherence of individual elements.
As mentioned in the previous section, a more rigorous cost and performance evaluation and comparing a large transmit
2

array with a traditional phased array is beyond the scope of this paper, although it is currently under study at JPL.
2.2 Large Array Transmit Mode Phase Coherence
Amplitude and phase alignment for transmit arrays are the biggest challenge, which lead the study to the need for radar concepts and use of in-orbit targets for calibration. The array element-to-element coherence also consists of spatial coherence (looking at the same point of the target), polarization coherence, and timing coherence. The polarization and timing coherence mean that all reflector elements have exact, identical timing and polarization. Different factors may affect timing and polarization coherence to change. Timing coherence indicates the requirement of simultaneous commanding, or synchronization to within a p e c for a typical scenario. Synchronization for ranging is even more dependent on array geometry with respect to the target (image) point.
2.2. I Why Calibrating with Moving Targets in Earth Orbit
As explained in Section 2.1, our preliminary studies revealed that the near field examination of the large array of reflectors was not adequate for array calibration. In other words, there were too many nonlinear effects (e.g., thermal, mechanical, shadowing, azimuth and elevation differences of neighboring elements, timing, etc.) that disturb the one-to-one Fourier Transform relationship of the measured array near field to the computed far field. Even if we got a coherent phase relationship at the near field test point, we cannot generalize the results to the far field simply by standard FFT methods for reasons mentioned above. According to calculations conducted at JPL [8], we need the phase center location accuracy to within 1 mm on a point at far field. Furthermore, the phase center accuracy needs to be the same in all directions, which in turn indicates the need to calibrate against a moving target at far field as the antenna points in different directions. Target altitude, the time intervals during the target passes over the array, orbital uncertainties, the radar cross-section, and the target surface texture requirements are unknown and need to be researched.
Note that we need to point the individual antennas at the reference target and measure differential phase and amplitude. So the target itself does not cause any changes to the calibrating radar signal that echoes back from the target. We also need to determine how many targets are needed in the orbit and what type of receiver is needed (if any) with what power levels to correct for the phase errors. For the case of smaller-dimension antennas, e.g., 12-m, where the far field test could be achieved with the Calibration Tower method, the in-orbit targets are still required since we need an actual dynamic environment to calibrate for all directions. Calibrating either to a ground tower, to a near-Earth orbit target, or spacecraft requires many safety considerations as
3
well, particularly as the array center keeps pointing at different directions, possibly causing unintended interference to other systems. Phase errors may cause unwanted peaks due to inter-modulation effects in the unintended direction, causing interference or damage to other systems. Many of these peaks that are generated through intermodulation are not easy to capture at the near field before they add up coherently with other element contributions at the far field.
2.2.2 Design Trades between Transmit and Receive Modes
The efforts regarding the large receiving arrays of reflector antennas were initiated with a different perspective and rationale than transmit array systems. The large array of reflectors such as the VLA were originally conceptualized and designed for imaging the sky. The fundamental reason for the recent development of the large receiving array of reflectors for radio astronomy observation is that the background, not the receiver electronics, limits the receiver performance level below 10 GHz with current receiver technology. This means that the only other way to increase sensitivity is to increase the collecting area of square kilometer arrays (SKA). Greater than 100 parc seconds is required for new radio sources, which is not feasible with single apertures. Furthermore, the simultaneous need for wide angle of view (for sky coverage) and narrow angular resolution (for image resolution) points toward an array of small reflector antennas.
In the design for such receiving arrays, the size of the individual aperture is derived through individual antenna elements that set the high-end limit for field of view. The individual antenna element size, in turn, sets the high-end limit on primary beam bandwidth. This is why the primary cost factor for the large receiving array of reflectors is the individual antenna aperture size, not the electronics. To further illustrate this point, consider the array signal-to-noise ratio given in the following relation,
where S stands for the flux strength received from the source object, B is the effective system bandwidth, t is the observation time, and the system noise temperature is given by
where the second term, Le., the sky temperature is the dominating factor. The array's longest dimension, the baseline (also referred to as confusion length) is then determined by the minimum flux strength Sc-, which determines the image resolution and the necessary gain (G) of the entire array. The rain cell, atmospheric blob, and interference are other secondary factors that further adjust the
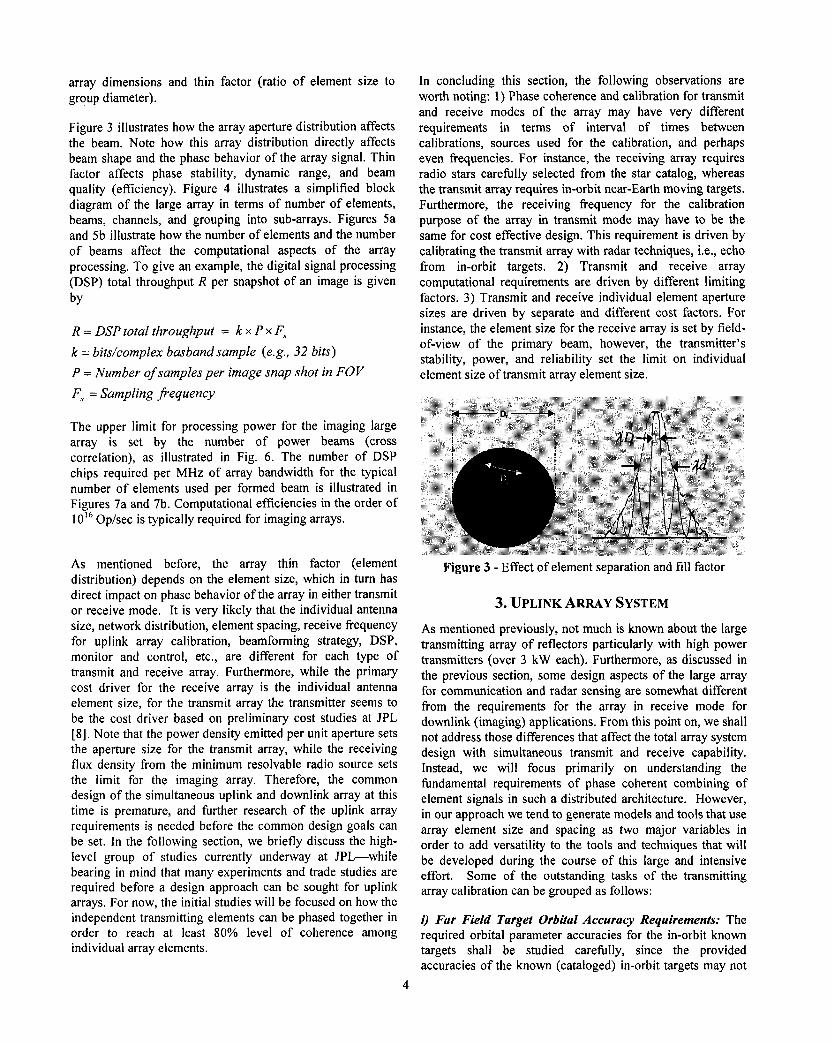
array dimensions and thin factor (ratio of element size to group diameter).
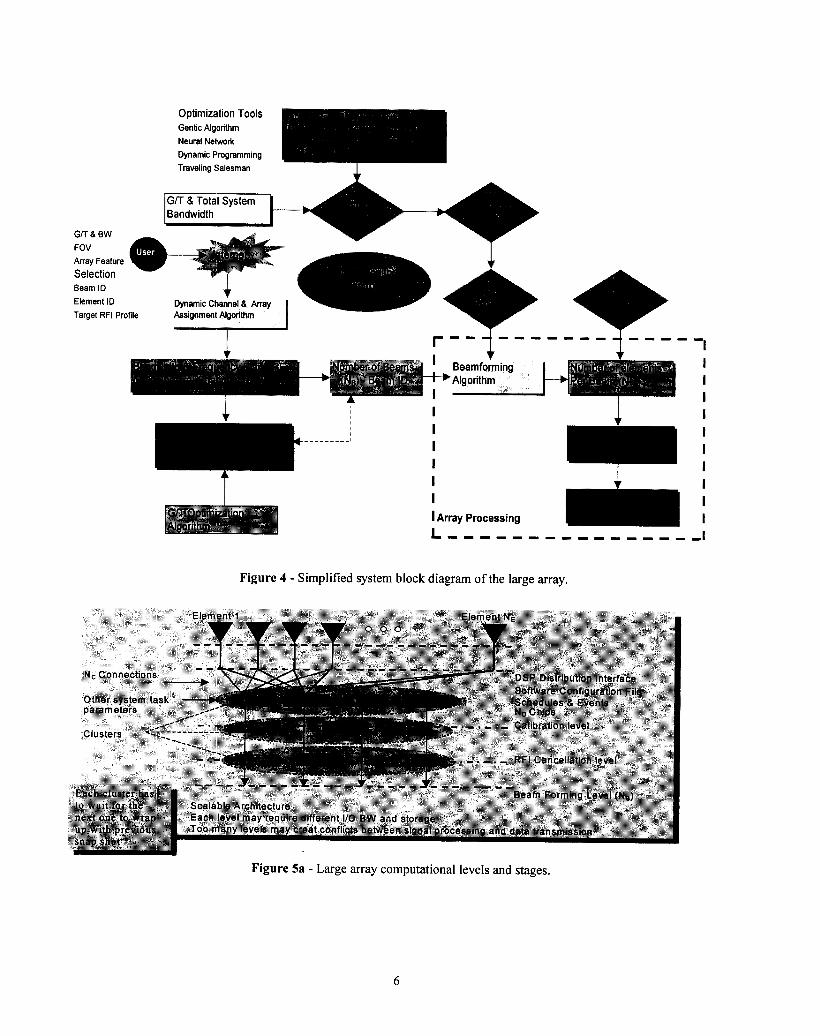
Figure 3 illustrates how the array aperture distribution affects the beam. Note how this array distribution directly affects beam shape and the phase behavior of the array signal. Thin factor affects phase stability, dynamic range, and beam quality (efficiency). Figure 4 illustrates a simplified block diagram of the large array in terms of number of elements, beams, channels, and grouping into sub-arrays. Figures 5a and 5b illustrate how the number of elements and the number of beams affect the computational aspects of the array processing. To give an example, the digital signal processing (DSP) total throughput R per snapshot of an image is given by
R = DSP total throughput = k x P x F,
k = bitslcomplex basband sample (e.g., 32 bits)
P = Number of samples per image snap shot in FOV
F,. = Sampling Ji-equency
The upper limit for processing power for the imaging large array is set by the number of power beams (cross correlation), as illustrated in Fig. 6 . The number of DSP chips required per MHz of array bandwidth for the typical number of elements used per formed beam is illustrated in Figures 7a and 7b. Computational efficiencies in the order of 1 0l6 Op/sec is typically required for imaging arrays.
As mentioned before, the array thin factor (element distribution) depends on the element size, which in turn has direct impact on phase behavior of the array in either transmit or receive mode. It is very likely that the individual antenna size, network distribution, element spacing, receive frequency for uplink array calibration, beamforming strategy, DSP, monitor and control, etc., are different for each type of transmit and receive array. Furthermore, while the primary cost driver for the receive array is the individual antenna element size, for the transmit array the transmitter seems to be the cost driver based on preliminary cost studies at JPL [SI. Note that the power density emitted per unit aperture sets the aperture size for the transmit array, while the receiving flux density from the minimum resolvable radio source sets the limit for the imaging array. Therefore, the common design of the simultaneous uplink and downlink array at this time is premature, and further research of the uplink array requirements is needed before the common design goals can be set. In the following section, we briefly discuss the high- level group of studies currently underway at J P L w h i l e bearing in mind that many experiments and trade studies are required before a design approach can be sought for uplink arrays. For now, the initial studies will be focused on how the independent transmitting elements can be phased together in order to reach at least 80% level of coherence among individual array elements.
In concluding this section, the following observations are worth noting: 1) Phase coherence and calibration for transmit and receive modes of the array may have very different requirements in terms of interval of times between calibrations, sources used for the calibration, and perhaps even frequencies. For instance, the receiving array requires radio stars carefully selected from the star catalog, whereas the transmit array requires in-orbit near-Earth moving targets. Furthermore, the receiving frequency for the calibration purpose of the array in transmit mode may have to be the same for cost effective design. This requirement is driven by calibrating the transmit array with radar techniques, Le., echo fkom in-orbit targets. 2) Transmit and receive array computational requirements are driven by different limiting factors. 3) Transmit and receive individual element aperture sizes are driven by separate and different cost factors. For instance, the element size for the receive array is set by field- of-view of the primary beam, however, the transmitter’s stability, power, and reliability set the limit on individual element size of transmit array element size.
Figure 3 - Effect of element separation and fill factor
3. UPLINK ARRAY SYSTEM As mentioned previously, not much is known about the large transmitting array of reflectors particularly with high power transmitters (over 3 kW each). Furthermore, as discussed in the previous section, some design aspects of the large array for communication and radar sensing are somewhat different from the requirements for the array in receive mode for downlink (imaging) applications. From this point on, we shall not address those differences that affect the total array system design with simultaneous transmit and receive capability. Instead, we will focus primarily on understanding the fundamental requirements of phase coherent combining of element signals in such a distributed architecture. However, in our approach we tend to generate models and tools that use array element size and spacing as two major variables in order to add versatility to the tools and techniques that will be developed during the course of this large and intensive effort. Some of the outstanding tasks of the transmitting array calibration can be grouped as follows:
i ) Far Field Target Orbital Accuracy Requirements: The required orbital parameter accuracies for the in-orbit known targets shall be studied carefully, since the provided accuracies of the known (cataloged) in-orbit targets may not
4

be adequate. Alternatively, the in-orbit targets may have to be coordinated with other agencies that have plans for placing small geometrical micro- (or nano-) satellites in orbits. For instance, the University Nano-satellite Program (UNP) consists of 10 nano-satellites (10 kg each) developed by 10 universities across the United States (sponsored by DoD, NASA, and industry) to illustrate distributed satellite capabilities and formation flying. They have command handling, meteorological sensing for orbit adjustments, cellular communication, and stereo imaging capability [9]. Therefore, they are potential candidates for in-orbit array calibration target needs as alternatives to other, cataloged in- orbit targets. If the space debris orbital accuracies or target surface quality are not adequate, and if the UNP targets don’t fit the specifications needed for array calibration, then alternate targets need to be found and planned. Note that the far field targets could also include the deep space targets if surface characteristics and round-trip time for calibration were not a problem. This task is probably the most time consuming effort and may need multiple organizations to cooperate.
ii) Determination of Radar Pulse Length: Pulse lengths of 0.5 to 1 millisecond are sufficient to detect the signals accurately and measure the phases at 100 km [SI. However, the duty cycle required to achieve sufficient phase accuracy without causing ambiguity will be hrther studied. The pulse code and waveform will also include other disturbances caused by atmospheric channel. The pulse waveform design should include methods of element timing and synchronization, as well as element identification so that adding or deleting elements can be controlled throughout calibration.
iii) Trades of Aperture Size and Partial Coherence: Preliminary study at JPL shows that perfect coherence is not necessary for a practical phased array of distributed independent platforms. The optimum phase coherence will result in N’P, (N = number of antenna elements and P, is independent transmitter average power) increase in power, which is a quadratic relationship. With a gracefid practical coherence of N’.* (Le., 80% of elements being in-phase) the relative phase stability will become much more achievable. Control of relative phase stability improves with a larger number of antennas. There is an optimal point for antenna diameter, separation, and 80% practical coherence level and cost. Software tools are required to identify the optimal distance versus individual element aperture size that meets the 80% coherence level. For instance, it is better to have more antennas with 80% partial coherence or fewer antennas with 100% coherence.
the Calibration Tower. This approach helps create a standard for array calibration from space-based large apertures and thereby lowers the cost of array calibration development through partnership with multiple organizations. That is, we may use the same types of targets in the orbit to calibrate large apertures from ground-to-space and space-to-ground.
v) Transmitter Differential Phase Stability: Before the phase errors accumulate as a result of antenna mechanical and thermal characteristics and other environmental factors, a good assessment of the relative phase differential of the exciters is necessary. We conducted some experiments with the existing DSN 34-m antennas, which are briefly described in Section 4. It should be noted that Exciter differential phase stability is perhaps the primary-and the only real-time- feedback loop for fast phase compensation. The main areas of the transmitter differential stability analysis and measurements can be outlined as follows: (1) frequency stability of the exciter subsystem, specifically the relative stability measurements between two or more exciters, (2) stability of the signal distribution between the Signal Processing and Control (SPC) and the transmitter at the antennas, (3) the stability of the transmitters, (4) differences in the antenna mechanical behavior as the antennas track a deep space target, (5) correlation of the results with predicted performance based on analysis, and ( 6 ) testing of the frequency predict files against the accuracy required for uplink array support. Once the ground systems are analyzed, several potential targets for arrayed uplink signal radiation demonstration will be selected and approached. The current baseline for such a test is a carrier modulated with a pseudo number (PN) sequence using standard bit error rate (BER) pattern that can be handled by the spacecraft as ranging signals. The returned pattern then can be analyzed for BER. The existing command subsystem cannot be used in the arrayed uplink because of its inability to synchronize two command generators (CMGs) (not a requirement). Moreover, the current DSN antenna systems were not designed to be arrayed in the transmit mode.
Relative stability of two or more exciters, driven by the same predict file is also necessary to test the short and long term relative stability of multiple exciters driven from the same reference. While the short and long-term stability of exciters is known, the relative stability between the two or more exciters has never been tested before. The exciters also need to be tested in static (fixed frequency) and dynamic (predict driven) modes. The accurate characterization of the potential error is key enabling information; if it cannot be modeled sufficiently, that would be an inhibiting factor.
iv) Calibration Tower Target: As will be explained later in this paper, in our preliminary studies of the Calibration Tower, we considered a horn antenna at the tower. However, it may also be necessary to use the same type of in-orbit targets and test them in the near field by placing the targets at
5
Grr & BW FOV Array Feature Selection Beam ID Element ID Target RFI Profile
I 1 I
T I I I
I I 1 I
Figure 4 - Simplified system block diagram of the large array.
Figure Sa - Large array computational levels and stages.
6
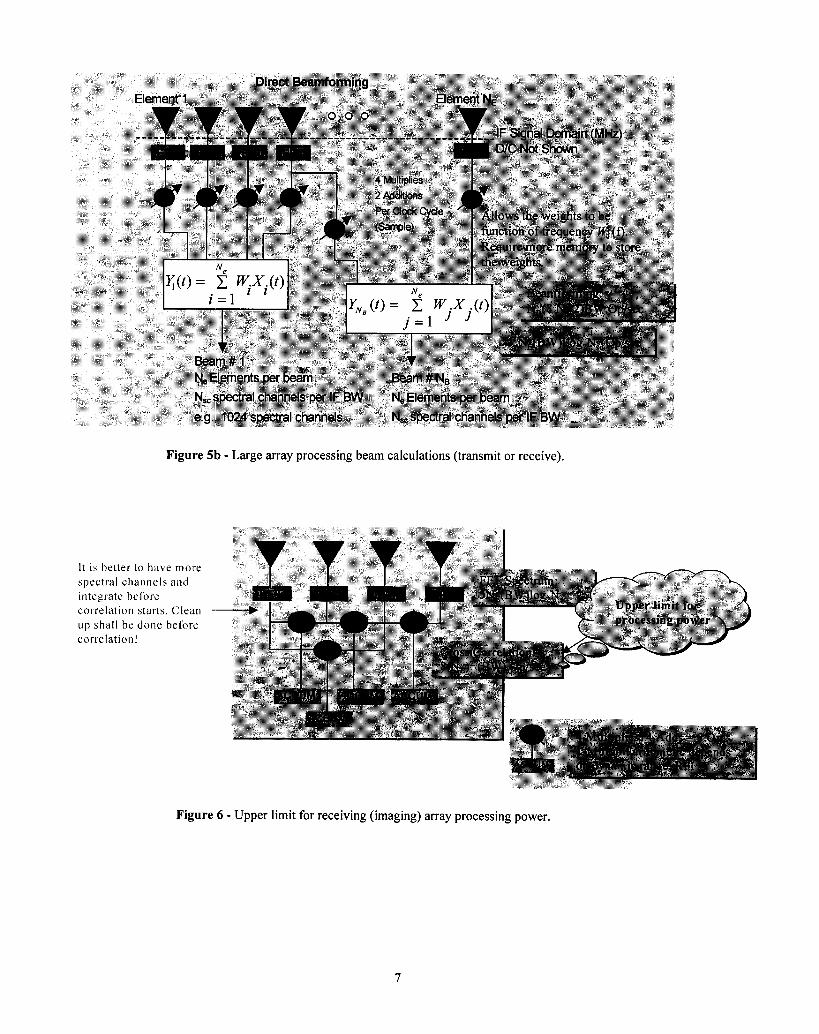
Figure 5b - Large array processing beam calculations (transmit or receive).
i t 15 hetler to h a r e more spectral charinels arid iiitcpratc bcl'orc coirclation starts. Clean up shall be done before cor re lat i o ti !
Figure 6 - Upper limit for receiving (imaging) array processing power.
7

0 20 40 60 80 100
Number of beam
Figure 7a - Using 1-Gflop DSP, e.g., TMS320C6701 4800 DSP Chips (30% efficiency) for 100 MHz BW is required for 64 Beams, 1024 Spectral Channels, and 20 elements per beam.
Cross Correlation GoplMHz I
v -
0 20 40 60 80 100 120
Number of Elements
Figure 7b - For 91 Elements, 1024 Spectral Channels, 100 MHz BW - 23000 DSP Chips of 1 Gflop @ 30% efficiency, or 2500 FPGA will be required.
vi ) Total Antenna Field Pattern: As part of modeling and simulation and analysis prior to, or in parallel with experiments, simple programs in MATLAB@ need to be developed that can calculate and plot the received signals at a receive antenna located at near, mid-, or far field of the multiple transmitting antennas in an array environment. To do a prediction of array performance at the far field, the combined field pattern must be known.
The programs should involve the convolution of the received field at the aperture of the receive antenna with the distribution of the field in the aperture of receive antenna in the transmit mode. The receiving antenna can be a circular or rectangular horn or any other type such as a dipole array
that might be utilized for the experiment. The field at the aperture of the horn, induced by the application of a unit voltage to the input of the horn, can be calculated by either a theoretical waveguide modal expansion or another simplified model.
This field is subsequently convolved with the received field at the aperture of the horn in order to calculate the final complex voltage at the input to the amplifier. Therefore, all actual geometries regarding the location of array elements, receiving antenna and their orientation need to be simulated.
8

This analysis will take into account the variation of the transmitted field amplitude and phase in the near-field zone across the aperture of the receiving horn. The receiving horn characteristics and its precise location with respect to the antenna elements will provide a meaningful simulation of the arraying effect in the far field. The most important outcome of this array field pattern formulation is the element pattern factorization, which helps assess array linearity when adding or deleting elements to the array.
vi0 Differential Holographic Measure: Holography is a technique that can be employed in evaluating the performance of the array aperture. Using holography, the distortion of the reflector surface due to gravity and temperature variations across the aperture can be recorded. These variations must be correlated with those of the other members of the array in order to provide information useful for studying the performance of the array. The advantage of the holography is that it provides complete information at many points across the aperture, simultaneously. However, the question of correlating this information with those of the other array elements, which must be simultaneous with the other elements or time tagged for later processing, constitutes a major area of investigation. The results will show if there are any major obstacles and help in interpreting the dish-probe results. Presently, there is only one set of equipment available at JPL for holography measurements, although a second one may be set up in the future depending on available funding. The appropriate methodology in using the holography, for example the number of the field points to measure and the duration of measurements, needs to be further studied and clarified.
viii) Spacecraft Receiver Characterization: A combination of simulation and analysis need to be conducted in order to determine the performance of the spacecraft receiver using an uplink array and to examine the sensitivity of the receiver to phase/amplitude differences in the uplink signals. There are four main areas of study in terms of receiver performance: (1) carrier lock sensitivity and tracking of the arrayed uplink and vector modeling of the arrayed signals, (2) command reception and BER performance, (3) effect of uplink arraying on radiometric measurements, and (4) automatic gain control (AGC) signal analysis for verifying the array signal reception at the spacecraft. Analysis is required to draw general conclusions and identify tradeoffs/trends while simulation is used to predict actual performance using DSN and spacecraft hardware characteristics. The final portion of the study deals with AGC signal analysis using the Telecom Forecast Predictor (TFP) software that allows us to simulate dropouts and AGC read-back over the mission lifetime for different flight profiles. Using TFP will help in any eventual incorporation of an uplink array link forecast into the TFP software. An uplink arraying testbed is currently under development at JPL in Signal Processing Workstation (SPW), which will include models of multiple DSN transmitters, atmospheric
effects, and the spacecraft transponders. Testbed simulation parameters will be based on DSN uplink characteristics, weather models as defined by the DSMS Telecommunications Link Design Handbook 8 10-5, and a model of the Small Deep Space Transponder (SDST) receiver module.
rjc) Error Budget with Sensitivity Simulation and Analysis: The advantage of the total budget is that it shows the relationship of errors at every stage of the array as the individual signal leaves the Exciter and arrives at the spacecraft receiver. The error budget provides the simulation a starting point for error sensitivity analysis through plots of phase error versus antenna elevation and error covariance matrices for adjacent element spacing.
x) Error Modeling and Calibration Algorithms: After error sensitivities are identified, quantified through simulation, and verified by field measurements, the next step is the development of error models and calibration algorithms. This is where the greatest challenge begins, since it goes hand-in-hand with design concepts of the actual array. All of the above-mentioned tasks provide the preliminary insight about finding methods that can be used for phasing the elements in the transmit array. Obviously, complete error modeling and calibration algorithms can only be defined for an array that has real design trades identified. However, much study in error modeling is required before the design of a large transmit array can be envisioned.
xi) Arraying of Existing DSN Antennas: Practically speaking, if uplink arraying is at all possible, it is worthwhile to add the uplink array capability to the existing DSN antennas. The advantage is not only the experience accumulated for the design of the large scalable array of smaller antennas (e.g., array of 12-m), but also the uplink capability with the existing 34-m antennas is extremely valuable to deep space network assets.
4. EXPERIMENTS AND LESSONS LEARNED If uplink arraying to deep space is at all possible, the most applicable and the most rational stepping stone is to examine the feasibility and cost of arraying the existing DSN antennas for such a task. In doing so, some experiments were conducted during last year at JPL in order to assess the current differential phase stability of the high-power transmitters that are installed on the DSN 34-m antennas. In particular, two of the 34-m DSN antennas (namely, DSS 24, and DSS 26) were selected for the experiments. Figure 8 illustrates the ultimate goal of these experiments. In the following sections, some of these experiments are briefly described, followed by lessons learned. 4. I Block Five Exciter Drflerential Stability Test
As the first step of uplink array study, this test’s objective was to examine the relative phase stability of two exciters
9

using the two Block-V Exciters (BVE) in the DTF-21 test facility at JPL. A simplified block diagram of the experiment setup is depicted in Fig. 9. The tests were intended to compare the unmodulated output from the two BVEs at a constant X-band carrier frequency. The results have identified some areas that require modifications or changes in the current DSN transmitter subsystem in order to make the uplink array an engineering reality for large (34-m) antennas. In the following paragraphs, the Exciter stability test is described followed by the preliminary results and the recommendation as to what the next step should be.
4. I. I Test Description
For this test, the two BVEs in DTF-21 were used. Both BVEs use common frequency and timing reference signals (FTS). They are located about 30 feet apart in the same computer room. One of the BVEs is “temperature compensated” and the other is not. Both BVEs were set to the same X-band frequency, with no modulation input. After the initial calibration and checkout, two long-term tests were run; one was overnight and the other was over a weekend (from Friday 17:45 to Monday 07:05). The X-band carrier signals were connected to a phase comparator that measured the instantaneous phase change and recorded the “I” and “Q” difference vectors at -2-second intervals during the overnight test and -20-second intervals during the weekend.
In the exciter frequency plan (Fig. lo), a fine control numerical controlled oscillator (NCO) 14-16 MHz (from 75 MHz clock) is up-converted with 90 MHz and 450 MHz (fixed) to 343-347 MHz. Next channel selection is done via a 1677-1788 MHz phased locked loop (PLL) generated local oscillator (LO), creating the S-band (2025-2120 MHz) carrier. A cavity oscillator-generated 5 100 MHz LO creates the X-band (7145-7235 MHz) carrier. Fiber optic cable is used to feed the output into the test equipment. The overall end-to-end RF chain of hardware for the complete test is illustrated in Fig. 11. Note that the first available feedback for any phase adjustment is the transmitter output. Additional closed-loop control of phase can be achieved through the use of several dish probes on the reflector surface of each antenna.
4.1.2 Exciter Differential Phase Test Results
Calibration tests of the phase comparator revealed minor non-linearities in the test setup. These non-linearities, while approaching 1/1 O* of measured values, did not significantly impact the end result. The actual tests focused on the long- term relative stability of the BVE outputs. Until now, all BVE output frequency stability was measured against the FTS standard only. Note that this was the first time relative stability tests were performed. Therefore, while we tried to learn about the relative stability of the two Exciters, finding ways for accurate measurement set up was also a goal for this preliminary experiment. The overnight test revealed a
total phase variation of almost 45” peak-to-peak; the long- term relative phase trend was nearly flat (Fig. 12a). As a minimum requirement to support the uplink arraying in open-loop mode, the frequency sources have to keep the relative phase accuracy within 30” at X-band (+/-l5’). The signal phase variation showed evidence of two distinct behavioral patterns (Fig. 12b and 12c). A period was observed that can be called “quiet,” represented by small swings (1.5”-2”, somewhat sinusoidal -20 minute repetition); secondly, a period of large swings (30” or more, no clear pattern, about 1 hour peak to peak) was also observed. We currently do not know the reason behind these distinct patterns, nor can we predict when they will be prevalent. Further data analysis is underway to correlate these phase fluctuations with design artifact, including thermal, mechanical, and other environmental effects.
Immediately after the start of the overnight test, from 0135 to 0700 UTC (see Fig. 12c DTF Overnight test), the phase variations exhibited several large swings, establishing the maximum peak-to-peak value (between 0135 to 0500 UTC). There were two very sharp phase jumps just before 0600 UTC in the positive direction and one in the negative direction just before 0700 UTC. These two transitions were very different from others.
Once transiting into the quiet period, stability was good, and the phase variation stayed within a 10” band for -7 hours (-0700 to 1400 UTC). Twice during this period, the phase jumped by 5” to a new stable value for about a half an hour, then returned to the same value (total of four transitions). During the weekend long test (see DTF Weekend Test), similar distinct phase variation patterns were found. The first 12 hours exhibited large swings, followed by an approximate 7-hour quiet period (less than 4” total variation). The next 12 or so hours exhibited the same large swings, followed by another approximately 7-hour quiet period. The relative phase difference during the quiet periods was the same as during the previous one. The rest of the test time, about 20 hours, was filled with two patterns of large swings, with only one (a short hour) of quiet period. Currently, the BVE design does not include a synchronization function, where the NCO’s phase angle resets and the loading of a new increment value can be done at the same time in two or more BVEs. Such capability would allow starting two BVEs at the same time with a known and constant phase difference. This was never a requirement. Because of this, there is no way to know the initial phase difference when combining two BVE outputs.
10

0
-..._.. --.. -* . -e.. -.
1, Spatially 2,Temporally 3. Carder Phase
4. Polarizations 5. &&@&
1.
.--
Figure 8 - Relative phase stability experiment to a deep space spacecraft.
Antenna Uplink Relative Phase Measurement Overview
I Hornantenna 2 RFtuFOUr 3 FO cable lrom prcbe to FO Patch Panel
FOPaldt , Pan&
- 4 PhaSe:Amplr!uos Test &I ' 5 FO-RFrx ti FO Cable lrum patch panel 10 test set 7 Computer
d .-- I
G201
Figure 9 - Test setup for the differential phase stability of 34-m DSN antennas.
11

Figure 10 - Block-V Exciter frequency conversion stages.
i f +Totej : \ I .
8 Timing
I I - - - - - - - - - - - - - - - - - - - - - - - - - - - - - - - - - - - - - - - - - - - - - - - - - - - - - - - hshedlines [- - - - - - ] r e p e n t p p s e d addionsfor admms8ation.
Figure 11 - Complete RF chain for the two 34-m antennas with command generators, transmitter’s feedback for phase compensation, and dish probes for reflector surface.
12

End o f Test 6 55 am PDT Thurs, Jun 1 2
(c)
Figure 12 - Differential phase stability test for different periods of time.
During the overnight test, the average phase difference was -15" (or 345") and during the weekend test it was 190". The initial phase is defined by the collective phase history of the BVE since last the hard reset. One of the frequency sources
is a numerically controlled oscillator in the BVE, which is responsible for the fine frequency definition within a band. The NCO's actions are software activated. The design criterion was to respond to the timed commands within one
13

second. Major rework of the BVE would be necessary to provide a true synchronization mechanism. Also, further tests and perhaps some spectral analysis would be required to clearly identify the details of the required upgrade.
Currently we do not have a good understanding of the reason behind the large swings. One possible reason is the residual difference between the two NCOs. When the increment value is not an integer divisor of the total count, the phase will jump one count after some number of cycles. Where the "roll-over" NCO would occur depends on the previous independent activities of the individual Exciters. Second, the channel selection LO is PLL-generated; third, a cavity oscillator generates the S- to X-band up-conversion. Minute differences in the equipment's environment (temperature, supply voltages, etc.) may force small corrective actions, generating the phase difference swings. It is actually quite remarkable that the total phase difference did not exceed 60" in 60+ hours and that the trend has no easily observable slope. Future additional testing with a setup where one frequency source is shared (temporarily) with the second generator could identify the major contributor to the large relative phase-difference swings.
Unfortunately the software-driven NCO design rules out the use of the BVEs in an uplink array without major rework. While the steady state behavior is borderline for an uplink array, as soon as we attempt frequency ramping, the approach is likely to fail. Since the software cannot be synchronized, nor is it deterministic to sub-nanosecond accuracy, any commanded Doppler or sweep frequency changes would destroy the initial phase relationship. One possible solution is to synchronize when the NCOs update the increment register. Given the need to keep the relative phase accuracy within 30" at X-band, this requirement translates to 0.0 1 -nanosecond relative accuracy in loading the new value into the NCO. The problem could be solved using NCOs that could be synchronized in a closed loop solution, where the phase relation is measured at the antenna and one of the BVEs is actively corrected. The feedback loop reaction time does not appear to be an issue, Le., the phase change rates are slow. While it is clear from the static evaluation of the existing exciters that coherent ramping is not practical, a quick test at DTF-21 (or at the SPC) can verify the results from the theoretical evaluation. This test can be short, since just the regular uplink acquisition ramp needs to be performed. It is anticipated that the expected plot will show that while the exciters are ramping, the phase relationship will be very disturbed; at resting frequencies, the relationship will be steady but at a random angle.
To identify the major contributors to the large relative phase-error swings, a series of tests need to be performed using two BVEs. This series of tests would require long (e.g., overnight) runs to eliminate potential false readings (where for several hours the phase relations did not change). As a final recommendation and follow up on the BVE frequency conversion mechanism, the evaluation of a new NCO design (or a commercial product) that can be synchronized sufficiently seems necessary. The expected cost of such component is about $5K. The Exciter group is looking into the replacement of the NCO with a lower cost product, and there may be an opening to leverage on the existing work.
In summary, the NCO has been identified as a key driver for closed-loop control of the long-term differential phase stability. However, other components in the RF chain of a transmitter subsystem still need to be examined. As an example, we may need several tests to separate the thermal effects from the antenna mechanical characteristics. The separation of mechanical and thermal effects is currently planned via a near-field test plan with a Calibration Tower so that both antennas can point at an elevation angle above the minimum FCC requirement.
4.2 Calibration Tower
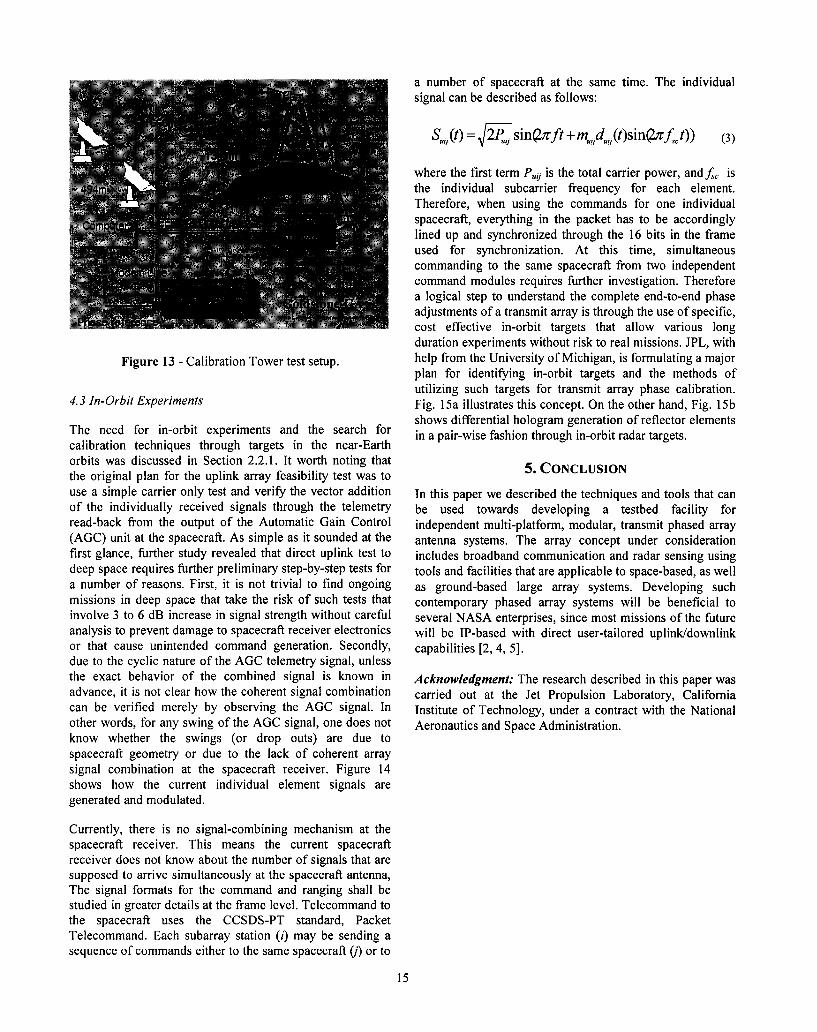
The Exciter differential stability test only helps identify the signals emerging from the RF subsystems of the transmitter. Assuming ideal conditions for the transmitter stability, the individual signals still need to go through various stages of possible distortions before they reach the spacecraft in deep space. Some example distortions following the exciter are antenna surface deformations due to environmental effects (different for each antenna), thermal distributions on antenna surface, mechanical differences between the individual antennas as they are scanned to point at the targets, and the difference in antenna phase centers as they scan through the sky. Fig. 13 illustrates a simplified diagram for the differential phase stability test for the antennas relative to a reference receiver placed on a tower in the neighborhood (-1.6 km) of the two 34-m antenna elements (- 1.4 km distanced). Precise locations of the individual antenna phase centers are required for this test. In particular, in the near- field experiment, the differential power density variations of individual antennas pose some challenges for adjusting the power levels as the two signals arrive at the receiver horn antenna on the tower. We defer the further details of the tower experiment to a future paper.
For ful l characterization of the current DSN equipment in an uplink array configuration, a short test (30 minutes) with Doppler adjustment needs to be performed. We anticipate a highly varying phase relationship in the ramp test.
14
a number of spacecraft at the same time. The individual signal can be described as follows:
Figure 13 - Calibration Tower test setup.
4.3 In-Orbit Experiments
The need for in-orbit experiments and the search for calibration techniques through targets in the near-Earth orbits was discussed in Section 2.2.1. It worth noting that the original plan for the uplink array feasibility test was to use a simple carrier only test and verify the vector addition of the individually received signals through the telemetry read-back from the output of the Automatic Gain Control (AGC) unit at the spacecraft. As simple as it sounded at the first glance, further study revealed that direct uplink test to deep space requires further preliminary step-by-step tests for a number of reasons. First, it is not trivial to find ongoing missions in deep space that take the risk of such tests that involve 3 to 6 dB increase in signal strength without careful analysis to prevent damage to spacecraft receiver electronics or that cause unintended command generation. Secondly, due to the cyclic nature of the AGC telemetry signal, unless the exact behavior of the combined signal is known in advance, it is not clear how the coherent signal combination can be verified merely by observing the AGC signal. In other words, for any swing of the AGC signal, one does not know whether the swings (or drop outs) are due to spacecraft geometry or due to the lack of coherent array signal combination at the spacecraft receiver. Figure 14 shows how the current individual element signals are generated and modulated.
Currently, there is no signal-combining mechanism at the spacecraft receiver. This means the current spacecraft receiver does not know about the number of signals that are supposed to arrive simultaneously at the spacecraft antenna, The signal formats for the command and ranging shall be studied in greater details at the frame level. Telecommand to the spacecraft uses the CCSDS-PT standard, Packet Telecommand. Each subarray station ( i ) may be sending a sequence of commands either to the same spacecraft (j) or to
where the first term P,, is the total carrier power, and& is the individual subcarrier frequency for each element. Therefore, when using the commands for one individual spacecraft, everything in the packet has to be accordingly lined up and synchronized through the 16 bits in the frame used for synchronization. At this time, simultaneous commanding to the same spacecraft from two independent command modules requires further investigation. Therefore a logical step to understand the complete end-to-end phase adjustments of a transmit array is through the use of specific, cost effective in-orbit targets that allow various long duration experiments without risk to real missions. JPL, with help from the University of Michigan, is formulating a major plan for identifying in-orbit targets and the methods of utilizing such targets for transmit array phase calibration. Fig. 15a illustrates this concept. On the other hand, Fig. 15b shows differential hologram generation of reflector elements in a pair-wise fashion through in-orbit radar targets.
5. CONCLUSION In this paper we described the techniques and tools that can be used towards developing a testbed facility for independent multi-platform, modular, transmit phased array antenna systems. The array concept under consideration includes broadband communication and radar sensing using tools and facilities that are applicable to space-based, as well as ground-based large array systems. Developing such contemporary phased array systems will be beneficial to several NASA enterprises, since most missions of the future will be IP-based with direct user-tailored uplinWdownlink capabilities [2,4, 51.
Acknowledgment: The research described in this paper was carried out at the Jet Propulsion Laboratory, California Institute of Technology, under a contract with the National Aeronautics and Space Administration.
15

Command Data t
Command Detector Unit (CDU)
_________
I Range Signal I I Antenna # 1
R l C
'a 1
Figure 14 - Subsystem diagram of individual path to the spacecraft receiver. Individual frames need to be synchronized.
Figure 15a - Ultimate calibration method envisioned for in-orbit target.
16

Amplitude Phase Figure 15b - Periodic pair-wise differential hologram generation of antenna array of reflectors using in-orbit targets.
REFERENCES [ 11 Farid Amoozegar, Vahraz Jamnejad, Robert Cesarone, “Trends In Development Of Broad-Band Phased Arrays For Tracking High Earth Orbit Satellites, Deep Space Vehicles, And Mobile Robotic Networks,” IEEE Aerospace Conference Proceedings, Big Sky, Montana, March 8-15,2003. http://www.vla.nrao.edu/genpub/overview/
[5] Space Surveillance Overview, Army Space Reference Text, Chapter 7, Section 6, http://www.tradoc.army.mil/dcscd/spaceweb/chap07f.htm
[6] NRAO, ‘LAn Overview of the Very Large Array,”
[2] Loren Lemmerman, Carol Raymond (JPL), Robert Shotwell (JPL), James Chase (JPL), Kul Bhasin Glenn Research Center), Robert Connerton (Goddard Space Flight Center), “Advanced Platform Technologies Enabling Efficient Distributed Sensing System for Earth Science,” Fourth International Academy of Astronautics (IAA) Symposium on Small Satellites for Earth Observation, Berlin, Germany, April 7-1 1,2003.
[3] W Imbriale, S. Weinreb, V. Jamnejad, et al., “Exploring the Next Generation Deep Space Network,” IEEE Aerospace Conference Proceedings, Big Sky, Montana, March 9-16,2002.
[4] Leonard Davis, “Bright Future for Solar Power Satellites,” http://www.space.com/businesstechnology/ technology/solarqower-sats-011017-1 .html, October 17, 200 1.
[7] George Resch, T.A. Cwik, Vahraz Jamnejad, R.T. Logan, R.B. Miller, D.H. Rogstad, “Synthesis of a Large Communications Aperture Using Small Antennas,” JPL Technical Report, Jet Propulsion Laboratory, California Institute of Technology, July 1, 1994.
[SI William Hurd, “Uplink Array Considerations and a System Concept,” Presentation to Deep Space Mission System (DSMS), Jet Propulsion Laboratory, California Institute of Technology, July 9,2003.
[9] Alvar Saenz Otero, “The SPHERE Satellite Formation Flight Testbed: Design and Initial Control,” Massamchusetts Institute of Technology, August 3 1, 2000.
17

BIOGRAPHY Farid Amoozegar received his Ph. D. degree in Electrical Engineering with a minor in Optics and Applied Math from the University of Arizona in 1994. He served as a lecturer at the University of Arizona for two years and joined Hughes Aircraft in 1996. While at Hughes, he worked on a number of programs, including Teledesic, Thuraya, K O , and Spaceway, and he participated in analysis, development, and integration and test of diflerent digital communication payloads utilizing phased array systems. He joined the Jet Propulsion Laboratory in October 2002 in the Communications System and Research Section. His areas of interest are wireless communications, multi-sensor multi- target tracking, and free space laser communications. His current projects include Optical Deep Space Network architecture study, Ka-band system phased array systems.
engineering, and
Vahraz Jamnejad is a principal engineer at the Jet Propulsion Laboratory, California Institute of Technology. He received his M.S. and Ph. D. in Electrical Engineering from the University of Illinois at Urbana- Champaign, specializing in electromagnetics and antennas. At JPL, he has been engaged in research and software and hardware development in various areas of spacecraft antenna technology and satellite communication systems. Among other things, he has been involved in the study, design, and development of ground and spacecraft antennas for future generations of Land Mobile Satellite Systems at L-band, Personal Access Satellite Systems at WKa-band, as well as feed arrays and reflectors for future planetary missions. His latest work on communication satellite systems involved the development of ground mobile antennas for WKa-band mobile terminal, for use with the ACTS satellite system. In the past few years, he has been active in research in parallel computational electromagnetics as well as in developing antennas for the MARS sample return orbiter. More recently, he has studied the applicability of large arrays of small aperture reflector antennas for the NASA Deep Space Network and is presently active in the preliminary design of a prototype array for this application. Over the years, he has received many U.S. patents and NASA certtjkates of recognition.
Robert Cesarone is current& involved in program management, strategy development and long range planning at the Jet Propulsion Laboratory, California Institute of Technology. His activities speciJically involve telecommunications and mission operations, including development of architectural options for the Deep Space
Network, NASA's network for tracking interplanetary spacecraft. He has held his present position since September I991 and has been employed at JPL since 1977. Prior to his current assignment, he held a number of positions within the Voyager Navigation Team, in particular that of lead trajectory and maneuver engineer for the Voyager 2 flybys of Uranus and Neptune. Prior to his arrival at JPL, he attended the University of Illinois, where he received a B. S. in Mathematics and an M. S. in Aeronautical and Astronautical Engineering. Mr. Cesarone has authored 34 technical and popular articles covering the Voyager Mission, trajectory design, gravity-assist and space navigation and telecommunications. He is an associate fellow of the American Institute of Aeronautics and Astronautics, a member of the World Space Foundation, and a recipient of the NASA Exceptional Service Medal.
18