Updates on the Basic Labor and Employment Statistics in ...
14
LABSTAT Updates (Vol.23 No. 6) Page 1 of 14 Quezon City, Philippines Labour Statistics Convention 160 (C160) and Labour Statistics Recommendation 170 (R170) • The Labour Statistics Convention (C160) as identified by the ILO is the only binding international standards in the field of labour statistics where the core mandate of the ILO Department of Statistics emanated. According to the ILO, the convention establishes the basic framework for the progressive elaboration of national labour statistics programmes. Countries ratifying it commit to regularly collect, compile and disseminate basic labour statistics on the main labour-related topics. • The following subjects should be the coverage of the labor statistics that member states that ratify C160 are obliged to published: (a) economically active population, employment, where relevant unemployment, and where Vol. 23 No. 6 May 2019 Updates on the Basic Labor and Employment Statistics in the Philippines The member states of the International Labour Organization (ILO) to which the Philippines is a member is composed of about 187 as of the latest count. These member countries usually meet every June of each year at the International Labour Conference (ILC) in Geneva, Switzerland. Each member state is represented by a delegation consisting of two (2) government delegates composed of an employer delegate and a worker delegate, and their respective advisers. The conference is sometimes called the “international parliament of labour” with its main task of crafting and adopting international labour standards in the form of Conventions and Recommendations. Conventions are international treaties and once adopted by the Conference are open to ratification by the member states. On the other hand, Recommendations are intended to guide national action and are not open to ratification, hence, not legally binding. Among the adopted Convention and Recommendation in 1985, the Labour Statistics Convention (C160) and the supplementary Labour Statistics Recommendation (R170) served as the guiding principles in the production of labor and employment statistics in the Philippine Statistical System (PSS). This issue of LABSTAT Updates presents an update on the basic labor and employment statistics generated in the PSS following the major provisions of Labour Statistics Convention 160 and Labour Statistics Recommendation 170. Included also in this issue are some presentations on the latest available labor and employment statistics compiled by the Philippine labor statistics system. Also found in Annex 1 is a summary of basic labor and employment statistics in the country with details on the data type, source material/agency, periodicity, data disaggregation and data release schedule.
Transcript of Updates on the Basic Labor and Employment Statistics in ...

LABSTAT Updates (Vol.23 No. 6) Page 1 of 14
Quezon City, Philippines
Labour Statistics Convention 160 (C160) and
Labour Statistics Recommendation 170 (R170)
• The Labour Statistics Convention
(C160) as identified by the ILO is the
only binding international standards in
the field of labour statistics where the
core mandate of the ILO Department
of Statistics emanated. According to
the ILO, the convention establishes
the basic framework for the
progressive elaboration of national
labour statistics programmes.
Countries ratifying it commit to
regularly collect, compile and
disseminate basic labour statistics on
the main labour-related topics.
• The following subjects should be the
coverage of the labor statistics that
member states that ratify C160 are
obliged to published:
(a) economically active population,
employment, where relevant
unemployment, and where
Vol. 23 No. 6 May 2019
Updates on the Basic Labor
and Employment Statistics in the Philippines
The member states of the International Labour Organization (ILO) to which the Philippines is a member
is composed of about 187 as of the latest count. These member countries usually meet every June of
each year at the International Labour Conference (ILC) in Geneva, Switzerland. Each member state is
represented by a delegation consisting of two (2) government delegates composed of an employer
delegate and a worker delegate, and their respective advisers. The conference is sometimes called the
“international parliament of labour” with its main task of crafting and adopting international labour
standards in the form of Conventions and Recommendations.
Conventions are international treaties and once adopted by the Conference are open to ratification by the
member states. On the other hand, Recommendations are intended to guide national action and are not
open to ratification, hence, not legally binding. Among the adopted Convention and Recommendation in
1985, the Labour Statistics Convention (C160) and the supplementary Labour Statistics Recommendation
(R170) served as the guiding principles in the production of labor and employment statistics in the
Philippine Statistical System (PSS).
This issue of LABSTAT Updates presents an update on the basic labor and employment statistics generated
in the PSS following the major provisions of Labour Statistics Convention 160 and Labour Statistics
Recommendation 170. Included also in this issue are some presentations on the latest available labor
and employment statistics compiled by the Philippine labor statistics system. Also found in Annex 1 is a
summary of basic labor and employment statistics in the country with details on the data type, source
material/agency, periodicity, data disaggregation and data release schedule.

LABSTAT Updates (Vol.23 No. 6) Page 2 of 14
possible visible
underemployment;
(b) structure and distribution of the
economically active population,
for detailed analysis and to serve
as benchmark data;
(c) average earnings and hours of
work (hours actually worked or
hours paid for) and, where
appropriate, time rates of wages
and normal hours of work;
(d) wage structure and distribution;
(e) labor cost;
(f) consumer price indices;
(g) household expenditure or, where
appropriate, family expenditure
and, where possible, household
income or, where appropriate,
family income;
(h) occupational injuries and, as far
as possible, occupational
diseases; and
(i) industrial disputes.
• On the other hand, the Labour
Statistics Recommendation 170
(R170) is the accompanying
guidelines of C160 that indicates the
basic coverage, frequency of
compilation and cross-classification
variables for each of the variables
specified in Articles 7 to 15 of C160.
• Part II of the said Recommendation
states that the following major
elements should be included in the
development of a national statistical
infrastructure:
(a) a comprehensive and up-to-date
register of establishments or
enterprises for the purposes of
surveys or censuses. Such a
register should be sufficiently
detailed to permit the selection
of samples of establishments or
enterprises;
(b) a coordinated system for the
implementation of surveys or
censuses of establishments or
enterprises;
(c) a capability for the
implementation of a continuous
and coordinated series of
national surveys of households
or individuals; and
(d) access for statistical purposes,
with appropriate safeguards for
their confidential use, to
administrative records (such as
those of employment services,
social security bodies, labour
inspection services).
• Since the time of the Labour
Statistics Convention and
Recommendation in 1985, progress
and developments in terms of data
collection (Computer-Assisted
Personal Interview), source of data
(big data), storage (cloud) and
dissemination methods (infographics
and videographics) have emerged.
The Standards Review Mechanism
Tripartite Working Group considered
C160 still relevant and adaptable to
these progress and encourages the
ILO to actively promote its
ratification by member states and
assist countries in complying with it.1
• For the Philippines, the labor
statistics system collects and
compiles basic labor and
employment statistics in different
frequencies and classifications as
recommended by R170. (See Annex
1 on page 11)
___________________________________ 1 Labour statistics in the international labour code: A case for the promotion and ratification of the Labour
Statistics Convention (C160, 1985), https://www.ilo.org/stat/Publications/WCMS_645952/lang--en/index.htm
LABSTAT Updates (Vol.23 No. 6) Page 3 of 14
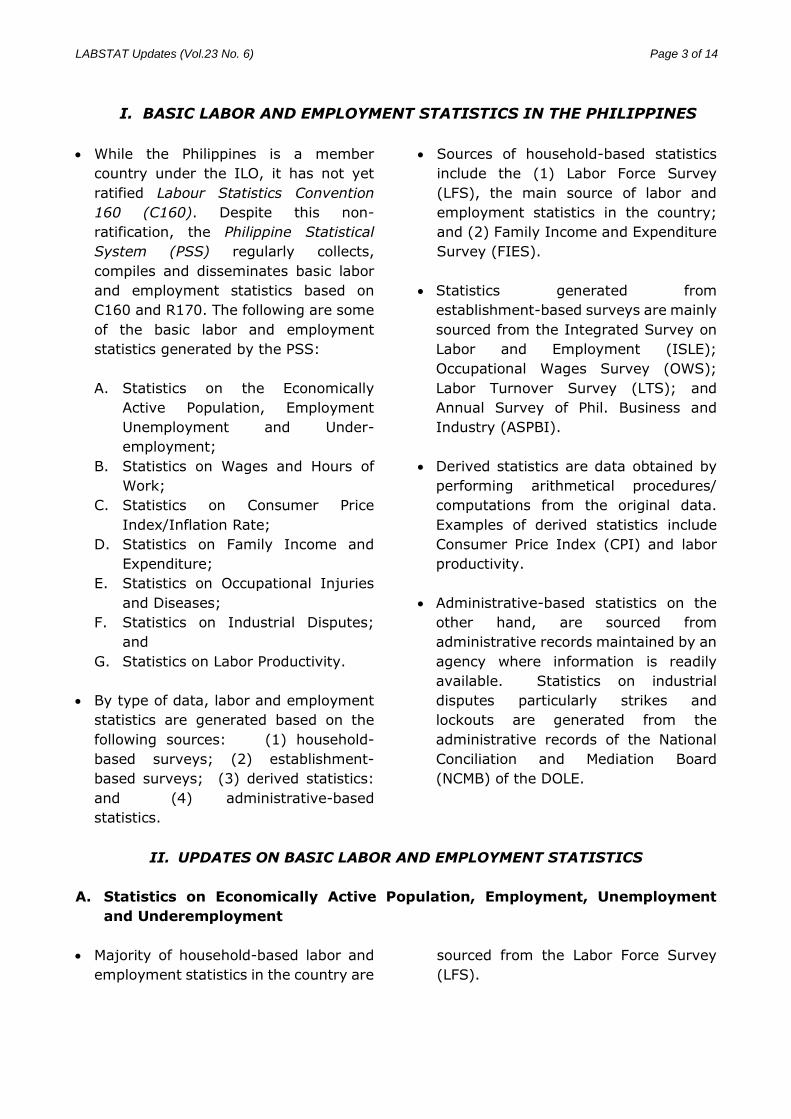
I. BASIC LABOR AND EMPLOYMENT STATISTICS IN THE PHILIPPINES
• While the Philippines is a member
country under the ILO, it has not yet
ratified Labour Statistics Convention
160 (C160). Despite this non-
ratification, the Philippine Statistical
System (PSS) regularly collects,
compiles and disseminates basic labor
and employment statistics based on
C160 and R170. The following are some
of the basic labor and employment
statistics generated by the PSS:
A. Statistics on the Economically
Active Population, Employment
Unemployment and Under-
employment;
B. Statistics on Wages and Hours of
Work;
C. Statistics on Consumer Price
Index/Inflation Rate;
D. Statistics on Family Income and
Expenditure;
E. Statistics on Occupational Injuries
and Diseases;
F. Statistics on Industrial Disputes;
and
G. Statistics on Labor Productivity.
• By type of data, labor and employment
statistics are generated based on the
following sources: (1) household-
based surveys; (2) establishment-
based surveys; (3) derived statistics:
and (4) administrative-based
statistics.
• Sources of household-based statistics
include the (1) Labor Force Survey
(LFS), the main source of labor and
employment statistics in the country;
and (2) Family Income and Expenditure
Survey (FIES).
• Statistics generated from
establishment-based surveys are mainly
sourced from the Integrated Survey on
Labor and Employment (ISLE);
Occupational Wages Survey (OWS);
Labor Turnover Survey (LTS); and
Annual Survey of Phil. Business and
Industry (ASPBI).
• Derived statistics are data obtained by
performing arithmetical procedures/
computations from the original data.
Examples of derived statistics include
Consumer Price Index (CPI) and labor
productivity.
• Administrative-based statistics on the
other hand, are sourced from
administrative records maintained by an
agency where information is readily
available. Statistics on industrial
disputes particularly strikes and
lockouts are generated from the
administrative records of the National
Conciliation and Mediation Board
(NCMB) of the DOLE.
II. UPDATES ON BASIC LABOR AND EMPLOYMENT STATISTICS
A. Statistics on Economically Active Population, Employment, Unemployment
and Underemployment
• Majority of household-based labor and
employment statistics in the country are
sourced from the Labor Force Survey
(LFS).
LABSTAT Updates (Vol.23 No. 6) Page 4 of 14
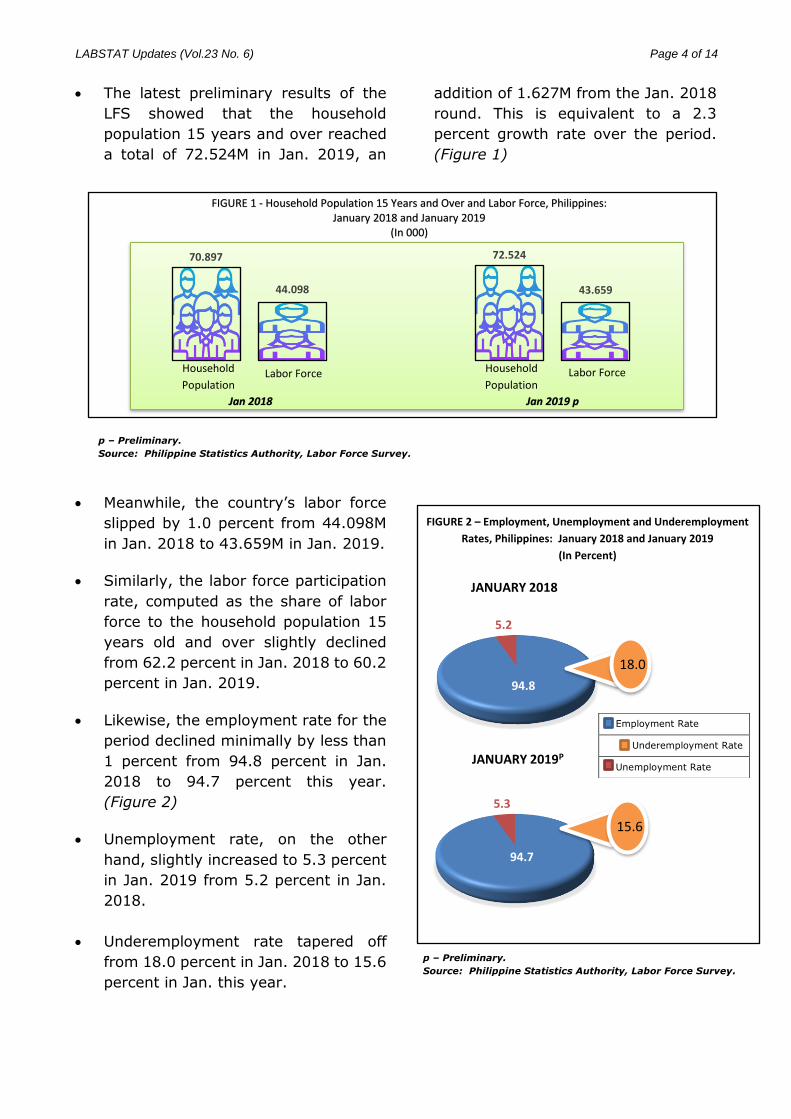
• The latest preliminary results of the
LFS showed that the household
population 15 years and over reached
a total of 72.524M in Jan. 2019, an
addition of 1.627M from the Jan. 2018
round. This is equivalent to a 2.3
percent growth rate over the period.
(Figure 1)
• Meanwhile, the country’s labor force
slipped by 1.0 percent from 44.098M
in Jan. 2018 to 43.659M in Jan. 2019.
• Similarly, the labor force participation
rate, computed as the share of labor
force to the household population 15
years old and over slightly declined
from 62.2 percent in Jan. 2018 to 60.2
percent in Jan. 2019.
• Likewise, the employment rate for the
period declined minimally by less than
1 percent from 94.8 percent in Jan.
2018 to 94.7 percent this year.
(Figure 2)
• Unemployment rate, on the other
hand, slightly increased to 5.3 percent
in Jan. 2019 from 5.2 percent in Jan.
2018.
• Underemployment rate tapered off
from 18.0 percent in Jan. 2018 to 15.6
percent in Jan. this year.
Employment Rate
Underemployment Rate
Unemployment Rate
94.7
5.3
JANUARY 2019P
94.8
5.2
JANUARY 2018
18.0
15.6
FIGURE 2 – Employment, Unemployment and Underemployment
Rates, Philippines: January 2018 and January 2019
(In Percent)
p – Preliminary.
Source: Philippine Statistics Authority, Labor Force Survey.
70.897 72.524
44.098 43.659
Jan 2018 Jan 2019 p
FIGURE 1 - Household Population 15 Years and Over and Labor Force, Philippines: January 2018 and January 2019
(In 000)
Household
Population
okP
Labor Force Household
Population Labor Force
p – Preliminary.
Source: Philippine Statistics Authority, Labor Force Survey.
LABSTAT Updates (Vol.23 No. 6) Page 5 of 14
117
90
6960
52 51 49 48 4741
0
20
40
60
80
100
120
140
FIGURE 3 - Top Ten Highly Paid Occupations, Philippines: 2016 (In 000 Php)
B. Statistics on Wages and Hours of Work
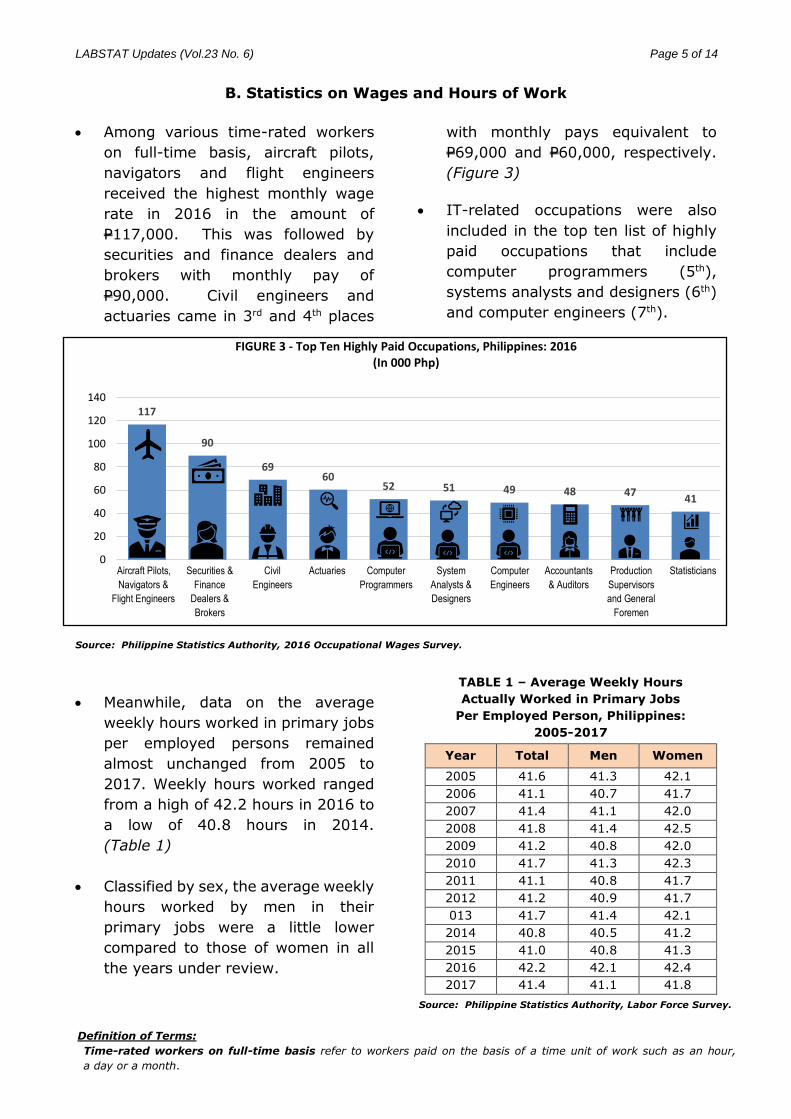
• Among various time-rated workers
on full-time basis, aircraft pilots,
navigators and flight engineers
received the highest monthly wage
rate in 2016 in the amount of
P117,000. This was followed by
securities and finance dealers and
brokers with monthly pay of
P90,000. Civil engineers and
actuaries came in 3rd and 4th places
with monthly pays equivalent to
P69,000 and P60,000, respectively.
(Figure 3)
• IT-related occupations were also
included in the top ten list of highly
paid occupations that include
computer programmers (5th),
systems analysts and designers (6th)
and computer engineers (7th).
Source: Philippine Statistics Authority, 2016 Occupational Wages Survey.
• Meanwhile, data on the average
weekly hours worked in primary jobs
per employed persons remained
almost unchanged from 2005 to
2017. Weekly hours worked ranged
from a high of 42.2 hours in 2016 to
a low of 40.8 hours in 2014.
(Table 1)
• Classified by sex, the average weekly
hours worked by men in their
primary jobs were a little lower
compared to those of women in all
the years under review.
TABLE 1 – Average Weekly Hours
Actually Worked in Primary Jobs
Per Employed Person, Philippines:
2005-2017
Year Total Men Women
2005 41.6 41.3 42.1
2006 41.1 40.7 41.7
2007 41.4 41.1 42.0
2008 41.8 41.4 42.5
2009 41.2 40.8 42.0
2010 41.7 41.3 42.3
2011 41.1 40.8 41.7
2012 41.2 40.9 41.7
013 41.7 41.4 42.1
2014 40.8 40.5 41.2
2015 41.0 40.8 41.3
2016 42.2 42.1 42.4
2017 41.4 41.1 41.8
Aircraft Pilots,
Navigators &
Flight Engineers
Securities &
Finance
Dealers &
Brokers
Civil
Engineers
Actuaries Computer
Programmers
System
Analysts &
Designers
Computer
Engineers
Accountants
& Auditors
Production
Supervisors
and General
Foremen
Statisticians
Source: Philippine Statistics Authority, Labor Force Survey.
Definition of Terms:
Time-rated workers on full-time basis refer to workers paid on the basis of a time unit of work such as an hour,
a day or a month.

LABSTAT Updates (Vol.23 No. 6) Page 6 of 14
C. Statistics on Consumer Price Index/Inflation Rate
• The Consumer Price Index (CPI) is an
indicator of the change in the
average prices of a fixed basket of
goods and services commonly
purchased by households relative to
a base year. Inflation rate (IR) on
the other hand, is defined as the
annual rate of change or the year-
on-year change in the CPI. Starting
2018, the CPI was rebased to 2012.
• Latest inflation rate data showed that
the headline inflation at the national
level was recorded at 3.0 percent in
April 2019. This is comparatively
lower (0.3%) than the 3.3 percent
inflation rate posted a month ago
and even much lower (1.5%)
compared to year-ago inflation rate
of 4.5 percent last April 2018.
(Table 2)
• On the other hand, the CPI for all
commodity group was computed at
119.6 in April 2019, higher relative
to the 116.1 index points recorded
during the same month in 2018.
TABLE 2 – Year-on-Year Inflation Rates and Consumer Price Index,
All Items, Philippines
(2012=100)
Indicator Apr 2019 Mar 2019 Apr 2018
INFLATION RATE
Headline 3.0 3.3 4.5
Core 3.4 3.5 3.5
CONSUMER PRICE
INDEX 119.6 119.3 116.1
D. Statistics on Family Income and Expenditure
• The Family Income and Expenditure
Survey (FIES) is the the main source
of data on family income and
expenditure, which include among
others, levels of consumption by item
of expenditure as well as sources of
income in cash and in kind.
• Results of the 2015 FIES reported that
the average annual income of a
Filipino family amounted to
approximately P267,000 in 2015 while
the average family expenditure
amounted to P215,000. The
remaining P52,000 out of the average
annual family income is the annual
average family savings during the
year . (Figure 4)
Source: Philippine Statistics Authority.
Definition of Terms:
Headline Inflation - measures changes in the cost of living based on movements in the prices of a specified
basket of major commodities. It refers to the annual rate of change or the year-on-year
change in the Consumer Price Index (CPI)
Core Inflation - a measure of inflation that aims to capture the permanent component of the inflationary
process that can be influenced by monetary policy
LABSTAT Updates (Vol.23 No. 6) Page 7 of 14
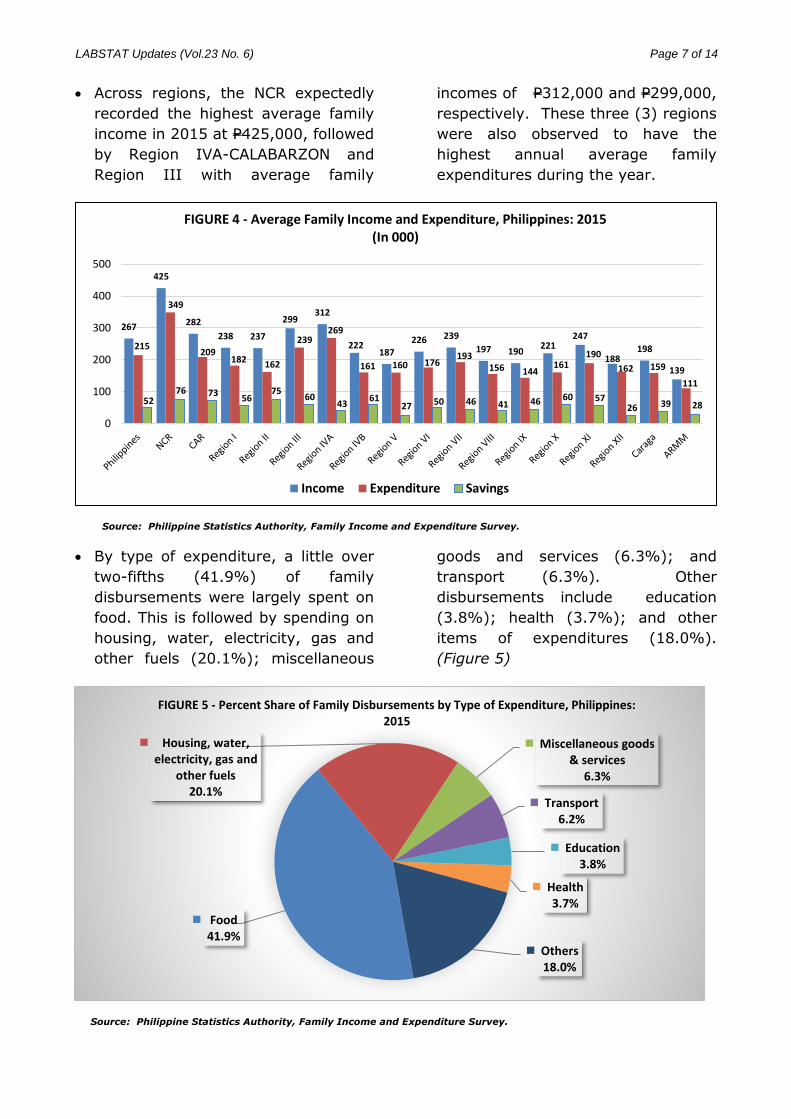
• Across regions, the NCR expectedly
recorded the highest average family
income in 2015 at P425,000, followed
by Region IVA-CALABARZON and
Region III with average family
incomes of P312,000 and P299,000,
respectively. These three (3) regions
were also observed to have the
highest annual average family
expenditures during the year.
• By type of expenditure, a little over
two-fifths (41.9%) of family
disbursements were largely spent on
food. This is followed by spending on
housing, water, electricity, gas and
other fuels (20.1%); miscellaneous
goods and services (6.3%); and
transport (6.3%). Other
disbursements include education
(3.8%); health (3.7%); and other
items of expenditures (18.0%).
(Figure 5)
E. Statistics on Occupational Injuries and Diseases
267
425
282
238 237
299312
222187
226 239
197 190221
247
188198
139
215
349
209182 162
239269
161 160 176193
156 144161
190
162 159
111
5276 73
5675
6043
6127 50 46 41 46 60 57
26 39 28
0
100
200
300
400
500
FIGURE 4 - Average Family Income and Expenditure, Philippines: 2015(In 000)
Income Expenditure Savings
Source: Philippine Statistics Authority, Family Income and Expenditure Survey.
Source: Philippine Statistics Authority, Family Income and Expenditure Survey.
Food41.9%
Housing, water, electricity, gas and
other fuels20.1%
Miscellaneous goods & services
6.3%
Transport6.2%
Education3.8%
Health3.7%
Others18.0%
FIGURE 5 - Percent Share of Family Disbursements by Type of Expenditure, Philippines: 2015
LABSTAT Updates (Vol.23 No. 6) Page 8 of 14
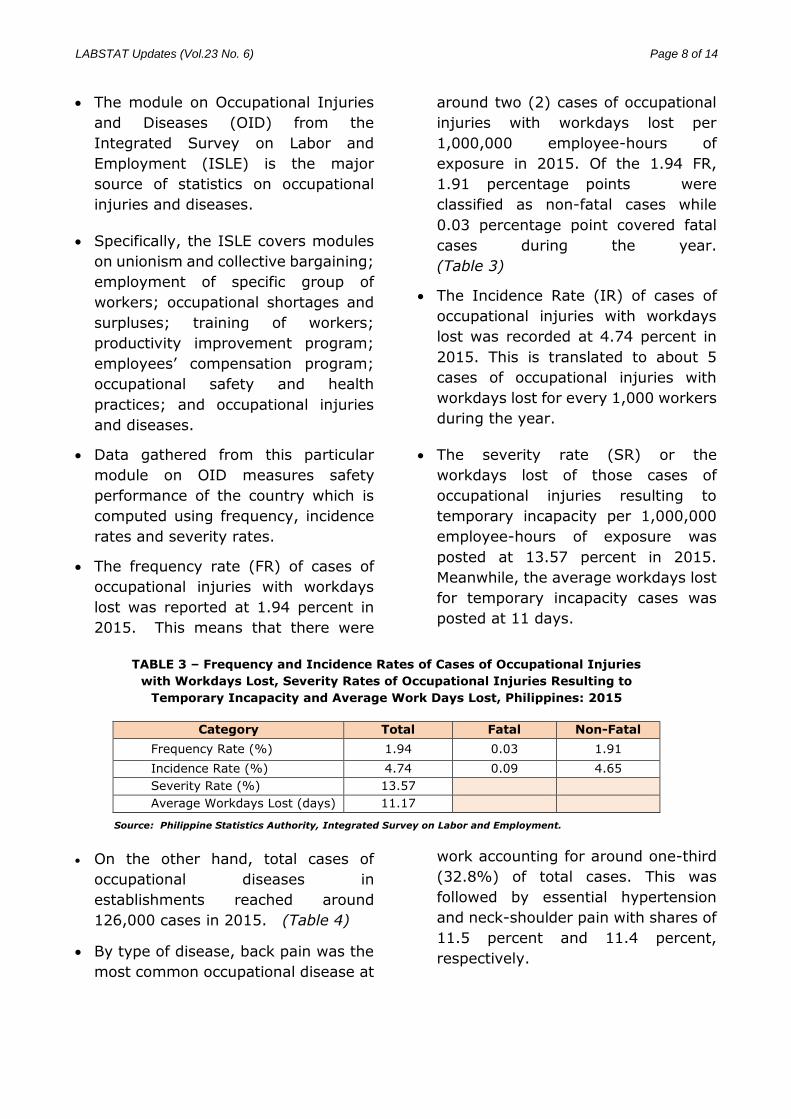
• The module on Occupational Injuries
and Diseases (OID) from the
Integrated Survey on Labor and
Employment (ISLE) is the major
source of statistics on occupational
injuries and diseases.
• Specifically, the ISLE covers modules
on unionism and collective bargaining;
employment of specific group of
workers; occupational shortages and
surpluses; training of workers;
productivity improvement program;
employees’ compensation program;
occupational safety and health
practices; and occupational injuries
and diseases.
• Data gathered from this particular
module on OID measures safety
performance of the country which is
computed using frequency, incidence
rates and severity rates.
• The frequency rate (FR) of cases of
occupational injuries with workdays
lost was reported at 1.94 percent in
2015. This means that there were
around two (2) cases of occupational
injuries with workdays lost per
1,000,000 employee-hours of
exposure in 2015. Of the 1.94 FR,
1.91 percentage points were
classified as non-fatal cases while
0.03 percentage point covered fatal
cases during the year.
(Table 3)
• The Incidence Rate (IR) of cases of
occupational injuries with workdays
lost was recorded at 4.74 percent in
2015. This is translated to about 5
cases of occupational injuries with
workdays lost for every 1,000 workers
during the year.
• The severity rate (SR) or the
workdays lost of those cases of
occupational injuries resulting to
temporary incapacity per 1,000,000
employee-hours of exposure was
posted at 13.57 percent in 2015.
Meanwhile, the average workdays lost
for temporary incapacity cases was
posted at 11 days.
TABLE 3 – Frequency and Incidence Rates of Cases of Occupational Injuries
with Workdays Lost, Severity Rates of Occupational Injuries Resulting to
Temporary Incapacity and Average Work Days Lost, Philippines: 2015
Category Total Fatal Non-Fatal
Frequency Rate (%) 1.94 0.03 1.91
Incidence Rate (%) 4.74 0.09 4.65
Severity Rate (%) 13.57
Average Workdays Lost (days) 11.17
• On the other hand, total cases of
occupational diseases in
establishments reached around
126,000 cases in 2015. (Table 4)
• By type of disease, back pain was the
most common occupational disease at
work accounting for around one-third
(32.8%) of total cases. This was
followed by essential hypertension
and neck-shoulder pain with shares of
11.5 percent and 11.4 percent,
respectively.
Source: Philippine Statistics Authority, Integrated Survey on Labor and Employment.
LABSTAT Updates (Vol.23 No. 6) Page 9 of 14
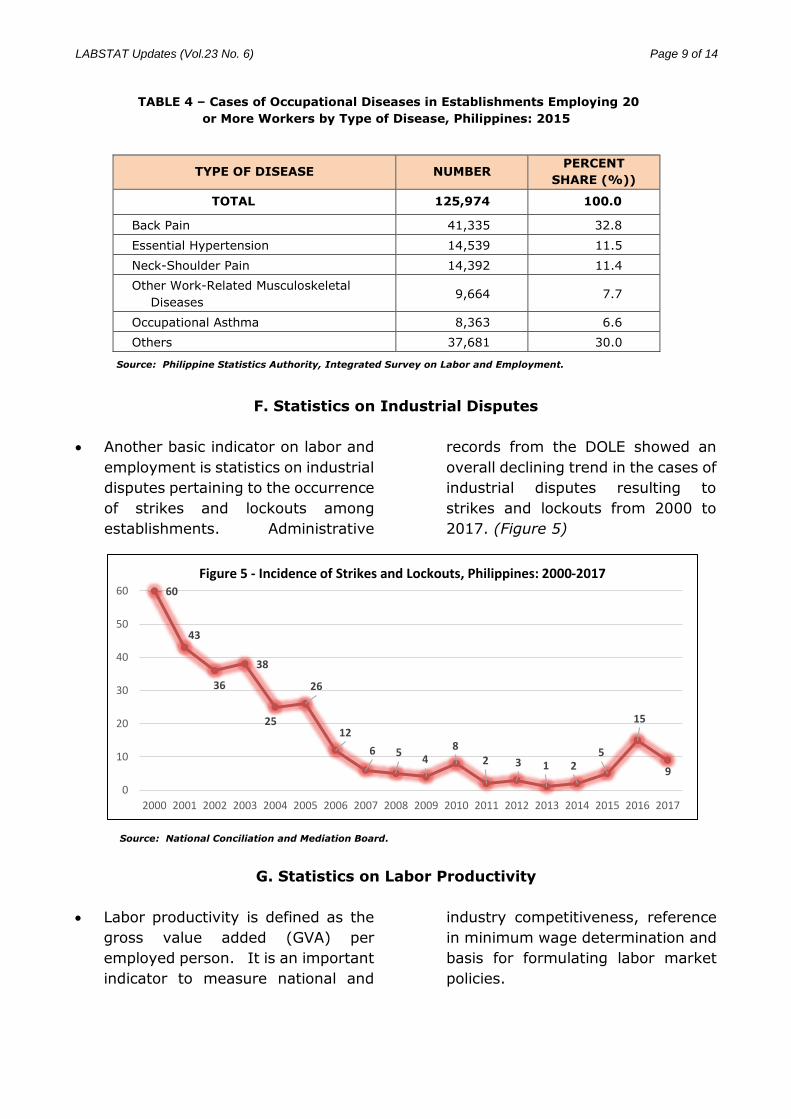
TABLE 4 – Cases of Occupational Diseases in Establishments Employing 20
or More Workers by Type of Disease, Philippines: 2015
TYPE OF DISEASE NUMBER PERCENT
SHARE (%))
TOTAL 125,974 100.0
Back Pain 41,335 32.8
Essential Hypertension 14,539 11.5
Neck-Shoulder Pain 14,392 11.4
Other Work-Related Musculoskeletal
Diseases 9,664 7.7
Occupational Asthma 8,363 6.6
Others 37,681 30.0
F. Statistics on Industrial Disputes
• Another basic indicator on labor and
employment is statistics on industrial
disputes pertaining to the occurrence
of strikes and lockouts among
establishments. Administrative
records from the DOLE showed an
overall declining trend in the cases of
industrial disputes resulting to
strikes and lockouts from 2000 to
2017. (Figure 5)
G. Statistics on Labor Productivity
• Labor productivity is defined as the
gross value added (GVA) per
employed person. It is an important
indicator to measure national and
industry competitiveness, reference
in minimum wage determination and
basis for formulating labor market
policies.
60
43
36
38
25
26
12
6 54
82 3 1 2
5
15
9
0
10
20
30
40
50
60
2000 2001 2002 2003 2004 2005 2006 2007 2008 2009 2010 2011 2012 2013 2014 2015 2016 2017
Figure 5 - Incidence of Strikes and Lockouts, Philippines: 2000-2017
Source: National Conciliation and Mediation Board.
Source: Philippine Statistics Authority, Integrated Survey on Labor and Employment.
LABSTAT Updates (Vol.23 No. 6) Page 10 of 14
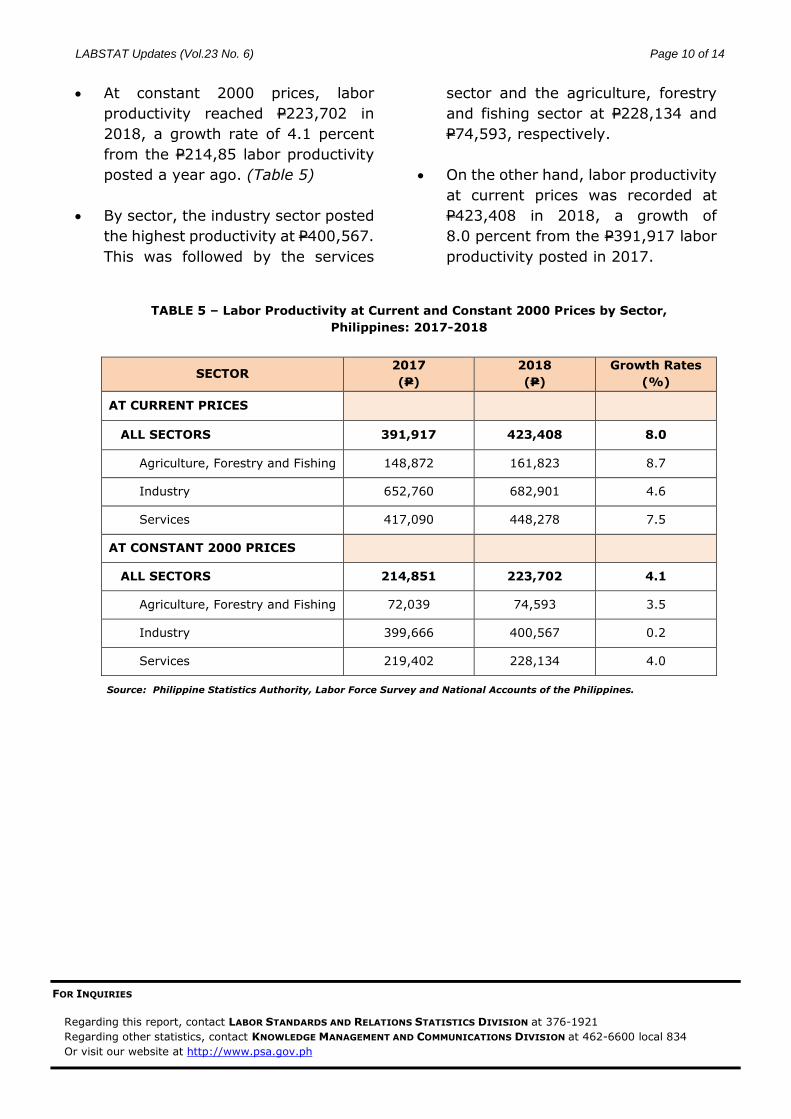
• At constant 2000 prices, labor
productivity reached P223,702 in
2018, a growth rate of 4.1 percent
from the P214,85 labor productivity
posted a year ago. (Table 5)
• By sector, the industry sector posted
the highest productivity at P400,567.
This was followed by the services
sector and the agriculture, forestry
and fishing sector at P228,134 and
P74,593, respectively.
• On the other hand, labor productivity
at current prices was recorded at
P423,408 in 2018, a growth of
8.0 percent from the P391,917 labor
productivity posted in 2017.
TABLE 5 – Labor Productivity at Current and Constant 2000 Prices by Sector,
Philippines: 2017-2018
SECTOR 2017
(P)
2018
(P)
Growth Rates
(%)
AT CURRENT PRICES
ALL SECTORS 391,917 423,408 8.0
Agriculture, Forestry and Fishing 148,872 161,823 8.7
Industry 652,760 682,901 4.6
Services 417,090 448,278 7.5
AT CONSTANT 2000 PRICES
ALL SECTORS 214,851 223,702 4.1
Agriculture, Forestry and Fishing 72,039 74,593 3.5
Industry 399,666 400,567 0.2
Services 219,402 228,134 4.0
Source: Philippine Statistics Authority, Labor Force Survey and National Accounts of the Philippines.
FOR INQUIRIES
Regarding this report, contact LABOR STANDARDS AND RELATIONS STATISTICS DIVISION at 376-1921
Regarding other statistics, contact KNOWLEDGE MANAGEMENT AND COMMUNICATIONS DIVISION at 462-6600 local 834
Or visit our website at http://www.psa.gov.ph
LABSTAT Updates (Vol.23 No. 6) Page 11 of 14
ANNEX 1 – Basic Labor and Employment Statistics of the Philippines
Basic Labor and
Employment Statistics
Data
Type Agency Source Periodicity Data Disaggregation Data Release Schedule
A. Statistics on the Economically Active Population, Employment, Unemployment and Underemployment
Economically active
population (Labor Force)
HB Philippine Statistics
Authority (PSA)
Labor Force Survey (LFS) Quarterly (January,
April, July, October)
Region, sex, age group, employment status (employed, unemployed, not in the labor force)
Preliminary: 35 days after reference period; Final: 6 months after reference period
Employment -do- -do- -do- -do- Region, sex, age group, highest grade completed, major industry group, major occupation group, class of worker, total hours worked, nature of employment
-do-
Unemployment -do- -do- -do- -do- Region, sex, age group, highest grade completed, job search method, number of weeks looking for work
-do-
Visible underemployment -do- -do- -do- -do- Region, sex, major occupation group -do-
B. Statistics on Wages and Hours Work
Wage Rates
- Agriculture HB Philippine Statistics
Authority (PSA)
Agricultural Wage Rate
Survey (ARWS)
Semestral Region, sex, wages by farm activity and type of labor, basis of payment
10 months after the
reference period
- Agriculture/
Non-agriculture
EB -do- Occupational Wages
Survey (OWS)
Biennial Benchmark occupations (accounting and bookkeeping clerks and unskilled laborers), selected occupations in selected industries
14 months after reference
period
Wage structure and
distribution
-do- -do- -do- -do- Basic pay/allowance; major and minor industry group
-do-
Average earnings -do- -do- Census/Annual Survey of
Philippine Business and
Industry (CPBI/ASPBI)
CPBI: every 5-6
years;
ASPBI: Annually
Region, major and minor industry group, employment size (Generated)
27 months after reference
period
Labor cost -do- -do- Labor Cost Survey (LCS);
Module of Integrated
Survey on Labor and
Employment (ISLE)
Every 6 years Level and composition: Major and minor industry group
22 months after reference
period
Total hours of work HB -do- LFS Quarterly (January,
April, July, October)
Region, sex and major occupation group
Preliminary: 35 days after reference period; Final: 6 months after reference period
Legend: HB – Household-Based; EB – Establishment-Based; DS – Derived Statistics; AS – Administrative-Based
LABSTAT Updates (Vol.23 No. 6) Page 12 of 14
ANNEX 1 – Basic Labor and Employment Statistics of the Philippines (Cont’d)
Basic Labor and
Employment Statistics
Data
Type Agency Source Periodicity Data Disaggregation Data Release Schedule
B. Statistics on Wages and Hours of Work (Cont’d.)
Average weekly hours
worked
HB Philippine Statistics
Authority (PSA)
Labor Force Survey (LFS) Quarterly (January,
April, July, October)
Region, sex, major industry group,
major occupation group, and class of
worker
6-7 months after reference
period
EB -do- CPBI/ASPBI CPBI: every 5-6
years;
ASPBI: Annually
Region, major and minor industry group, employment size (Generated)
27 months after reference
period
C. Statistics on Consumer Price Indices/Inflation Rate
Consumer Price Index
Inflation Rate
DS -do- Retail Price Survey (RPS)
of Selected Commodities
and Services for the
Generation of CPI
Monthly Region, province and selected cities, commodity group
5 days after the reference
period
D. Statistics on Family Income and Expenditures
Number of families HB -do- Family Income and
Expenditures Survey
(FIES)
Every 3 years Region, income calss, expenditure class, family size, main source of income, per capita income class
One year after the reference
year
Family income -do- -do- -do- -do- Region, income class, family size, income decile, per capita income decile
-do-
Family expenditures -do- -do- -do- -do- Region, income class, family size, expenditure group, income decile, per capita income decile
-do-
E. Statistics on Occupational Injuries and Diseases
Occupational injuiries EB -do- Integrated Survey on Labor
and Employment (ISLE)
Every 2 years 22 months after the
reference period
- Cases Major and minor industry group, employment size, incapacity for work, type of injury, part of the injured, cause of injury, agent of the injury
- Freequency/incidence
rates
Major and minor industry group, employment size, incapacity for work,
- Severity rate/average
days lost of temporary
incapacity cases
Major and minor industry group
- Occupational dseases -do- -do- -do- -do- Major and minor industry group; type of occupational disease
-do-

LABSTAT Updates (Vol.23 No. 6) Page 13 of 14
ANNEX 1 – Basic Labor and Employment Statistics of the Philippines (Cont’d)
Basic Labor and
Employment Statistics
Data
Type Agency Source Periodicity Data Disaggregation Data Release Schedule
F. Statistics on Industrial Disputes
Strikes and lockouts AS National
Conciliation and
Mediation Board
(NCMB)
Administrative Records - Region, major industry group, workers involved, mandays lost, issues involved;
2 weeks after reference
period
G. Statistics on Labor Productivity
Labor Productivity (all
economic units)
DS PSA National Accounts of the
Philippines; LFS
Annually Region, major and minor industry group 12 months after reference
year
Labor Productivity
(establishment-based)
DS -do- CPBI/ASPBI CPBI: every 5-6
years; ASPBI;
Annually
Major and minor industry group, employment size
27 months after reference
period
H. Publications/Yearbooks
Decent Work Statistics
(DeWS) – Philippines
HB,
EB,
AS,
DS
-do- Various sources Annually Sex, main economic activity, major occupation group
9 months after the reference
year
Gender Statistics on Labor
and Employment
-do- -do- -do- -do- Region, sex, major industry activity, major occupation group, age group
11 months after the
reference year
Compilation of Industry
Statistics on Labor and
Employment
-do- -do- -do- -do- Region, sex, major industry activity, major occupation group, age group
11 months after the
reference year
I. Other DOLE Administrative-Based Statistics
Employment Facilitation
Phil-Jobnet AS Bureau of Local
Employment (BLE)
Administrative Records Weekly Top 10 vacancies by occupation Weekly
Alien employment -do- -do- -do- Semestral;
Annually
Region, nationality, major industry group, major occupation group
3 months after reference
period
Overseas employment -do- Philippine
Overseas and
Employment
Administration
(POEA)
-do- Annually Sex, country of destination, skill/occupation 2 months after the reference
period

LABSTAT Updates (Vol.23 No. 6) Page 14 of 14
ANNEX 1 – Basic Labor and Employment Statistics of the Philippines (Cont’d)
Basic Labor and
Employment Statistics
Data
Type Agency Source Periodicity Data Disaggregation Data Release Schedule
I. Other DOLE Administrative-Based Statistics (Cont’d.)
Enrollees/graduates AS Technical
Education and
Skills Development
Authority (TESDA)
Administrative Records Annually Region, training program One month after reference
period
Workers assessed/
certified
-do- -do- -do- -do- Sector -do-
Social Protection and
Welfare
Livelihood projects and
beneficiaries
-do- Bureau of Workers
with Special
Concerns (BWSC)
-do- Quarterly Region, sex 7 days after reference
period
Labor standards
enforcement
-do- Bureau of Working
Conditions (BWC)
-do- Monthly Region 10 days after reference
period
Labor Relations
Labor organizations -do- Bureau of Labor
Relations (BLR)
-do- -do- Major industry group 2 weeks after reference
period
Collective bargaining -do- -do- -do- -do- -do- -do-
J. Statistics Related to Labor
Population HB PSA Census of Population and
Housing (CPH)
Every 10 years Province, sex, age group End of the year of reference
period
Population Projections DS PSA together with
IAC on Population
Projections
-do- -do- -do- 3 years after decade
censuses
Overseas Filipinos AS Commission on
Filipinos Overseas
(CFO)
Administrative Records Annually Country of destination 6 months after reference
period
Poverty statistics DS PSA FIES Every 3 years Region, province One year after FIES
reference period