Update of Renal Imaging
13
Update of Renal Imaging Nicolas Grenier, MD,* ,† Olivier Hauger, MD, PhD,* ,† Angela Cimpean, MD,* and Vinçent Pérot, MD* Significant technical improvements have allowed the use of radiological techniques to play a growing role in the imaging of renal diseases. Noninvasive ultrasound methods (ie, sonography and Doppler) are now positioned as first-line methods for the evaluation of renovascular diseases. Multidetector computed tomography is able to provide high spatial resolution images of the kidneys and renal arterial vessels. Magnetic resonance imaging, which provides higher signal-to-noise ratio and higher spatial and/or temporal resolution, can display both morphological information about renal parenchyma and vessels and functional data, including perfusion, filtration, diffusion, or oxygenation. In renovascular diseases, these techniques have the potential to drive new strategies, including Doppler sonography as a first-line method, followed by computed tomography angiography or magnetic resonance angiography, depending mainly on renal function. Imaging of paren- chymal renal diseases is developing toward more quantitative (volumetric and functional measurements) and more specific (through in vivo cell targeting) acquisitions for obtaining the adequate information on tissue characteristics relevant either for diagnosis or for prognosis or treatment follow-up. Semin Nucl Med 36:3-15 © 2006 Elsevier Inc. All rights reserved. D uring the last few decades, significant technical im- provements have allowed the use of radiological tech- niques to play a growing role in the imaging of renal diseases. Noninvasive ultrasound methods (sonography and Doppler) are now positioned as first-line methods for evaluation of renovascular diseases (RVDs). Multidetector computed to- mography (CT) is able to provide high spatial resolution images of the kidneys and renal arterial vessels (CT angiog- raphy). Finally, magnetic resonance imaging (MRI), provid- ing higher signal-to-noise ratio and higher spatial and/or temporal resolution, is now able to display both morpholog- ical information on renal parenchyma and vessels and func- tional data, such as perfusion, filtration, diffusion, or oxygen- ation. These techniques have the potential to create new strategies in imaging of renal diseases (as renovascular) and new opportunities for obtaining the adequate information on tissue characteristics relevant either for diagnosis or for prog- nosis or treatment follow-up. Imaging of RVD RVD is a complex entity, encompassing atherosclerotic arte- rial lesions, renal disease, and hypertension, leading to high renal and cardiovascular risk. The relationships among renal artery stenosis (RAS), hypertension, and renal function vary from patient to patient and are difficult to assess, but their severity and their association increase the patient’s risk. 1 Ath- erosclerotic nephropathy is a consequence of the association of multiple factors, this multiplicity of causal factors explain- ing the great heterogeneity of renal damage. The radiological imaging techniques available today have to achieve 4 objec- tives: (1) to detect and characterize the RAS in terms of ana- tomical and hemodynamical severity; (2) to assess the ana- tomical consequences of the RAS on the artery itself and on the renal parenchyma; (3) to assess the functional and cellu- lar consequences of the RAS on the kidney; and (4) to identify criteria of associated renal impairment related to RVD. Radiological Detection of RAS Stenoses that reduce the internal diameter by 60% produce a significant decrease in renal blood flow. They can be ather- omatous (60% of cases) or dysplastic (fibromuscular dyspla- sia, 35% of cases), 2 ostial or not ostial, and located in main, accessory, or segmental arteries. 3 The imaging techniques available are Doppler ultrasound (US), helical computed to- mographic angiography (CTA), and magnetic resonance an- *Service d’Imagerie Diagnostique et Interventionnelle de l’Adulte, Groupe Hospitalier Pellegrin, Bordeaux cedex, France. †ERT CNRS “Imagerie Moléculaire et Fonctionnelle,” Université Victor Se- galen-Bordeaux 2, Bordeaux, France. Address reprint requests to Nicolas Grenier, MD, Service d’Imagerie Diag- nostique et Interventionnelle de l’Adulte, Groupe Hospitalier Pellegrin, Place Amélie Raba Léon, 33,076 - Bordeaux cedex, France. E-mail: [email protected] 3 0001-2998/06/$-see front matter © 2006 Elsevier Inc. All rights reserved. doi:10.1053/j.semnuclmed.2005.08.001
Transcript of Update of Renal Imaging

UNV
DnNarmirititasntn
*
†
A
0d
pdate of Renal Imagingicolas Grenier, MD,*,† Olivier Hauger, MD, PhD,*,† Angela Cimpean, MD,* andinçent Pérot, MD*
Significant technical improvements have allowed the use of radiological techniques to playa growing role in the imaging of renal diseases. Noninvasive ultrasound methods (ie,sonography and Doppler) are now positioned as first-line methods for the evaluation ofrenovascular diseases. Multidetector computed tomography is able to provide high spatialresolution images of the kidneys and renal arterial vessels. Magnetic resonance imaging,which provides higher signal-to-noise ratio and higher spatial and/or temporal resolution,can display both morphological information about renal parenchyma and vessels andfunctional data, including perfusion, filtration, diffusion, or oxygenation. In renovasculardiseases, these techniques have the potential to drive new strategies, including Dopplersonography as a first-line method, followed by computed tomography angiography ormagnetic resonance angiography, depending mainly on renal function. Imaging of paren-chymal renal diseases is developing toward more quantitative (volumetric and functionalmeasurements) and more specific (through in vivo cell targeting) acquisitions for obtainingthe adequate information on tissue characteristics relevant either for diagnosis or forprognosis or treatment follow-up.Semin Nucl Med 36:3-15 © 2006 Elsevier Inc. All rights reserved.
IRrrafseoiittttlc
RSaosaa
uring the last few decades, significant technical im-provements have allowed the use of radiological tech-
iques to play a growing role in the imaging of renal diseases.oninvasive ultrasound methods (sonography and Doppler)
re now positioned as first-line methods for evaluation ofenovascular diseases (RVDs). Multidetector computed to-ography (CT) is able to provide high spatial resolution
mages of the kidneys and renal arterial vessels (CT angiog-aphy). Finally, magnetic resonance imaging (MRI), provid-ng higher signal-to-noise ratio and higher spatial and/oremporal resolution, is now able to display both morpholog-cal information on renal parenchyma and vessels and func-ional data, such as perfusion, filtration, diffusion, or oxygen-tion. These techniques have the potential to create newtrategies in imaging of renal diseases (as renovascular) andew opportunities for obtaining the adequate information onissue characteristics relevant either for diagnosis or for prog-osis or treatment follow-up.
Service d’Imagerie Diagnostique et Interventionnelle de l’Adulte, GroupeHospitalier Pellegrin, Bordeaux cedex, France.
ERT CNRS “Imagerie Moléculaire et Fonctionnelle,” Université Victor Se-galen-Bordeaux 2, Bordeaux, France.
ddress reprint requests to Nicolas Grenier, MD, Service d’Imagerie Diag-nostique et Interventionnelle de l’Adulte, Groupe Hospitalier Pellegrin,Place Amélie Raba Léon, 33,076 - Bordeaux cedex, France. E-mail:
001-2998/06/$-see front matter © 2006 Elsevier Inc. All rights reserved.oi:10.1053/j.semnuclmed.2005.08.001
maging of RVDVD is a complex entity, encompassing atherosclerotic arte-ial lesions, renal disease, and hypertension, leading to highenal and cardiovascular risk. The relationships among renalrtery stenosis (RAS), hypertension, and renal function varyrom patient to patient and are difficult to assess, but theireverity and their association increase the patient’s risk.1 Ath-rosclerotic nephropathy is a consequence of the associationf multiple factors, this multiplicity of causal factors explain-ng the great heterogeneity of renal damage. The radiologicalmaging techniques available today have to achieve 4 objec-ives: (1) to detect and characterize the RAS in terms of ana-omical and hemodynamical severity; (2) to assess the ana-omical consequences of the RAS on the artery itself and onhe renal parenchyma; (3) to assess the functional and cellu-ar consequences of the RAS on the kidney; and (4) to identifyriteria of associated renal impairment related to RVD.
adiological Detection of RAStenoses that reduce the internal diameter by �60% producesignificant decrease in renal blood flow. They can be ather-matous (60% of cases) or dysplastic (fibromuscular dyspla-ia, 35% of cases),2 ostial or not ostial, and located in main,ccessory, or segmental arteries.3 The imaging techniquesvailable are Doppler ultrasound (US), helical computed to-
ographic angiography (CTA), and magnetic resonance an-3
gsap
DWhsma
fwtnsmrsesoa
aa
dnrhpatiaashwcftws
U
4 N. Grenier et al
iography (MRA). Intravenous (IV) urography and IV digitalubtraction angiography (DSA) are no longer recommended,nd intra-arterial (IA) DSA is limited to prerevascularizationlanning.
oppler USith the advent of color encoding of the Doppler signal, US
as gained a major place in the detection of renal arterytenosis. To be of diagnostic use, a complete examinationust be undertaken, including B-mode, spectral sampling,
nd color imaging.The stenosis may be observed on color-flow images with
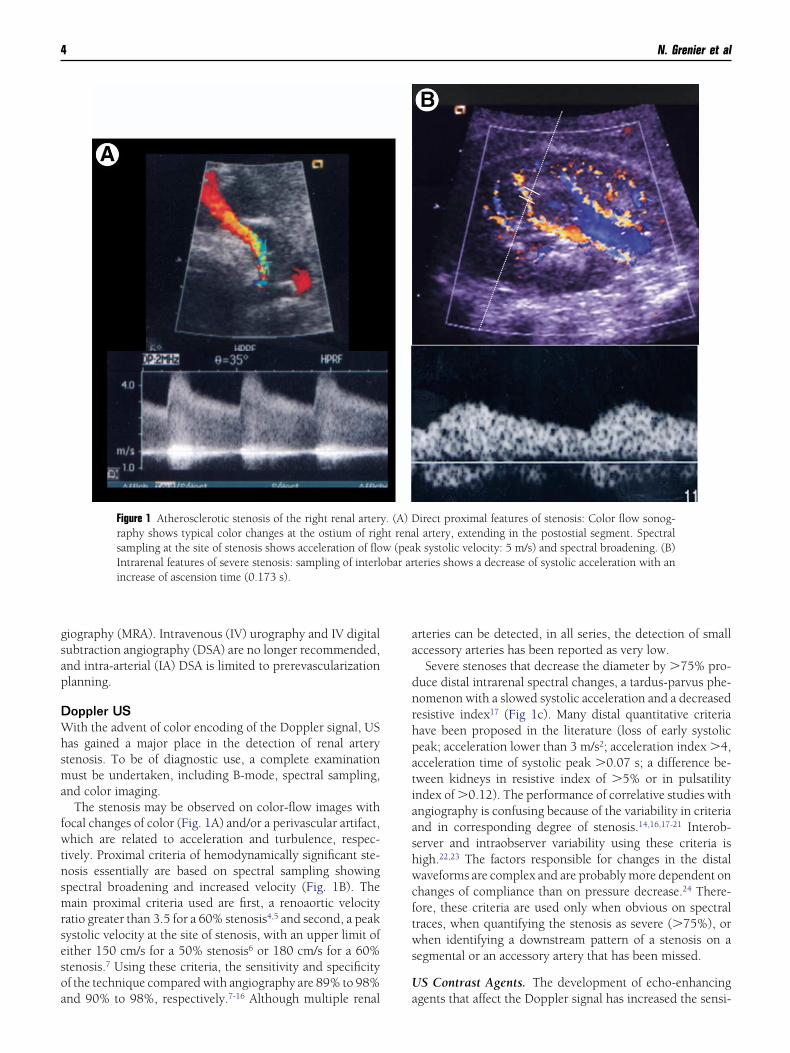
ocal changes of color (Fig. 1A) and/or a perivascular artifact,hich are related to acceleration and turbulence, respec-
ively. Proximal criteria of hemodynamically significant ste-osis essentially are based on spectral sampling showingpectral broadening and increased velocity (Fig. 1B). Theain proximal criteria used are first, a renoaortic velocity
atio greater than 3.5 for a 60% stenosis4,5 and second, a peakystolic velocity at the site of stenosis, with an upper limit ofither 150 cm/s for a 50% stenosis6 or 180 cm/s for a 60%tenosis.7 Using these criteria, the sensitivity and specificityf the technique compared with angiography are 89% to 98%
Figure 1 Atherosclerotic stenosis of the right renal arterraphy shows typical color changes at the ostium of rigsampling at the site of stenosis shows acceleration of floIntrarenal features of severe stenosis: sampling of interlincrease of ascension time (0.173 s).
nd 90% to 98%, respectively.7-16 Although multiple renal a
rteries can be detected, in all series, the detection of smallccessory arteries has been reported as very low.
Severe stenoses that decrease the diameter by �75% pro-uce distal intrarenal spectral changes, a tardus-parvus phe-omenon with a slowed systolic acceleration and a decreasedesistive index17 (Fig 1c). Many distal quantitative criteriaave been proposed in the literature (loss of early systoliceak; acceleration lower than 3 m/s2; acceleration index �4,cceleration time of systolic peak �0.07 s; a difference be-ween kidneys in resistive index of �5% or in pulsatilityndex of �0.12). The performance of correlative studies withngiography is confusing because of the variability in criteriand in corresponding degree of stenosis.14,16,17-21 Interob-erver and intraobserver variability using these criteria isigh.22,23 The factors responsible for changes in the distalaveforms are complex and are probably more dependent on
hanges of compliance than on pressure decrease.24 There-ore, these criteria are used only when obvious on spectralraces, when quantifying the stenosis as severe (�75%), orhen identifying a downstream pattern of a stenosis on a
egmental or an accessory artery that has been missed.
S Contrast Agents. The development of echo-enhancing
irect proximal features of stenosis: Color flow sonog-l artery, extending in the postostial segment. Spectralk systolic velocity: 5 m/s) and spectral broadening. (B)teries shows a decrease of systolic acceleration with an
y. (A) Dht renaw (peaobar ar
gents that affect the Doppler signal has increased the sensi-

tmabscis
Dotcsg5
CTrlabwv(v(mhcTDso
p1crmsnw
MMpaa8Ttainalt
CCfiopcmorom
AFDroii
VWana
Far
Fmpr
Update of renal imaging 5
ivity of detection of flow when it is too slow or too deep. Aulticenter study performed with the first commercialized
gent (Levovist; Schering, Berlin, Germany; made of micro-ubbles of air stabilized with galactose and palmitic agent)howed that the feasibility of the US examination was in-reased mainly in patients with a high body mass index andn patients with decreased renal function, although neitherensitivity nor specificity were significantly improved.8
oppler With Captopril. To overcome the lack of sensitivityf distal criteria for detecting proximal RAS, the administra-ion of captopril has been proposed,21,25 as a “stress test”:aptopril produces a vasodilatation and, when a proximaltenosis is present, increases the pulsus-tardus phenomenon,iving complete sensitivity and specificity for diagnosis of0% RAS. Its use in daily practice is not recommended.
TAhe use of slip-ring CT scanners capable of contiguous tubeotations coupled with continuous table incrementation al-ows for the volumetric acquisition of imaging data from thebdominal aorta, including renal arteries, during a singlereath hold. With single-ring CT scanners, Rubin and co-orkers26 showed that maximum intensity projections pro-ided better sensitivity (92%) than surface shaded display59%). However, Johnson and coworkers27 reported that theolume rendering technique provided a better specificity99%) than maximum intensity projection (87%). Perfor-ance of CTA in detecting significant stenoses is good withigh sensitivity (88-96%), high specificity (83-99%),28-30 andlose correlation with angiography for grading stenoses.30
he detection of accessory arteries is much better than withoppler US (average 90%). CT also shows the exact nature of
tenoses, eg, ostial, truncal or pseudotruncal31 and the degreef calcification of lesions before endovascular treatment.With multislice CT, which allows between 4 and 16 slices
er rotation, the axial resolution is improved, approaching-mm slice thickness (Fig. 2), and the amount of iodinatedontrast agent can be reduced. Because of a better spatialesolution, the separation of calcification and true lumen isore accurate,32 and distal lesions, as fibromuscular dyspla-
ia, are better delineated. Preliminary results of this tech-ique are extremely encouraging, but comparative studiesith angiography are still not available.
igure 2 Typical fibromuscular dysplasia of 1 of the 2 right renalrteries imaged with a 16-rings contrast-enhanced spiral CT angiog-
caphy on a coronal maximum intensity projection.
RARA has now moved from flow-enhanced (time-of-flight or
hase-contrast) sequences to T1-weighted contrast-enhancedcquisitions.33 Its performance is excellent, with a sensitivitynd specificity for diagnosis of significant stenosis between8% and 100% and between 71% and 99%, respectively.34-42
his technique shows the entire course of renal arteries up tohe renal sinus in most cases and the complete abdominalorta, including its bifurcation (Fig. 3). Most accessory arter-es are therefore shown. The evaluation of the degree of ste-osis with this method has the same interobserver variabilitys conventional angiography.43 Technical improvements al-ow shorter acquisition times and/or higher spatial resolu-ion.44,45
omparison of Techniquesomparison of performance of these noninvasive tests is dif-cult. A recent meta-analysis46 tried to compare the validityf CTA, MRA, and US for diagnosis of RAS in patients sus-ected of having RVH. Receiver-operating characteristicurves found that CTA and gadolinium (Gd)-enhanced 3-di-ensional (3D) MRA performed significantly better than the
ther diagnostic tests and seemed to be preferred in patientseferred for evaluation of RVH. However, because few studiesf these tests have been published, further research is recom-ended.
natomical andunctional Consequences of RASetection of RAS requires evaluation of the severity of nar-
owing and its consequences on renal flow, on renal artery,n renal parenchyma and on renal function, to improve thenterobserver variability and to define predictive factors ofmprovement after revascularization.
ascular Anatomyhen the stenosis is severe, a poststenotic dilation occurs as“jet-lesion.” This dilation can be used as a criterion of sig-ificant artery stenosis. This morphological change can bessessed with CTA and MRA but not with US. However, this
igure 3 3D Gd-enhanced MRA of the abdominal aorta with coronalaximum intensity projections showing bilateral atheroscleroticostostial stenoses (arrows) of the 2 right renal arteries and the leftenal artery.
riterion is difficult to quantify; no significant threshold has

bn
RWpticsro
bs8twertp
RRpc(dsr(esspspfiobfla
rwBfl1r
Iprcqsp
pa
RTs
CampTi
Flacrab
6 N. Grenier et al
een defined, even if a 20% dilation is widely used; it hasever been evaluated to our knowledge.
enal Anatomyhen the renal blood flow is significantly decreased, renal
arenchyma shrinks. Several parameters have been proposedo evaluate this effect. Renal length can be measured with anymaging technique. To be significant, a length difference of 1m should be considered, attesting of a hemodynamicallyignificant stenosis.47 If the renal length is less than 8 cm,evascularization is contraindicated because less likely to bef benefit.Measurement of cortical thickness and cortical area has
een proposed by Mounier-Vehier and coworkers,48 whohowed that thresholds of 8 mm for cortical thickness and of00 mm2 for cortical area allowed the differentiation of con-rol kidneys from poststenotic kidneys, whereas renal lengthas still within normal range, suggesting that cortical param-
ters are more sensitive for early diagnosis of atheroscleroticenal disease than kidney size (Fig. 4). Cortical atrophy seemso be a useful marker for guidance in revascularization, but itsrognosis value has still to be evaluated.
enal Hemodynamicsenal Arterial Flow Velocities Below the Stenosis. With 3Dhase-contrast MRI, signal intensity within the artery be-omes sensitive to flow velocity. The flow profile alterationas with Doppler techniques) is responsible for a severeephasing of MR signal with these sequences. It has beenhown, in vitro, that the degree of spin dephasing was di-ectly correlated with the trans-stenotic pressure gradient49
Fig. 4). A normal velocity-time curve is characterized by anarly systolic peak (ESP), a subsequent incision, and a lowerecond mid-systolic peak. Schoenberg and coworkers50,51
howed in animals and patients that either a normal curve orartial loss of the ESP were consistent with low-grade steno-is; complete loss of the ESP and decrease of the midsystoliceak indicated moderate stenosis (50%); flattened flow pro-le with no systolic velocity components was representativef high-grade stenosis.52 Using this classification, the com-ined approach of 3D Gd-enhanced MRA and phase contrastow sequence revealed the best interobserver variability andlmost perfect intermodality agreement with DSA.
This method also allows the measurement of the renal flowate below the stenosis (as the product of the mean velocityithin the artery and the cross sectional area of renal artery).inkert and coworkers53 reported a renal flow index (renalow (mL/min) divided by renal volume [cm3]) less than.5 mL/min/cm3 as predictive of successful outcome ofevascularization.
ntrarenal Hemodynamics. Distal intrarenal Doppler sam-ling for calculation of the resistive index (RI, defined as theatio: systolic velocity � diastolic velocity/systolic velocity)an provide information about the intensity of renal conse-uences of RAS. Radermacher and coworkers54 demon-trated that an increased RI � 0.8 was associated with a poor
rognosis in patients with RAS shown by an absence of im- srovement of hypertension, renal function or kidney survivalfter revascularization.
enal Functional Parametershe impact of RAS on glomerular filtration and renal perfu-ion has been studied with MRI.
aptopril-Enhanced Filtration Studies. Gd chelates behaves glomerular tracers in the same manner as iodine contrastedia. After the intravenous infusion of a bolus of Gd, it isossible to follow its intrarenal transit during breath holding.his transit begins with a vasculo-interstitial phase produc-
ng a cortical, then a medullary, enhancement of signal inten-
igure 4 Phase-contrast acquisition on renal arteries in a patient witheft renal artery stenosis. (A) Example of MRA showing left renalrtery stenosis with a small kidney. (B) The flow velocity-timeurves, obtained on each renal artery, show a normal curve on theight with early systolic peak, and an altered flow within left renalrtery without early systolic peak. (Courtesy of Dr. Stephan Schoen-erg, Muenchen, Germany.)
ity (T1-shortening effect), a tubular phase characterized by a

dtaiscslw
Rtvwaspcf
icos
Ratwiit1i
1(cabb
OvcRrrco
STTtaa
gRnplipreiarrctmrpp
IRrnsprdfmtpo
MoTdmlpmebeCbuuimrcpl
Update of renal imaging 7
rop of signal intensity (T2-shortening effect) within the ex-ernal medulla that extends centripetally toward the papilla,nd finally a ductal phase characterized by a late low-signalntensity within the internal medulla and the renal collectingystem (Fig. 5A). In RVH, as with scintigraphy, the normalontrast kinetics are altered by captopril on the side of thetenosis, thus inducing a delay or disappearance of the tubu-ar and ductal phases or a late T2 effect extending across thehole kidney (Fig. 5B).55
enal Perfusion. The degree of perfusion depends on bothhe arterial flow rate and local factors, such as regional bloodolume and vasoreactivity. Theory of perfusion calculation asell as imaging methods depends on the type of contrast
gent used. Absolute quantification of parenchymal perfu-ion can be assessed with diffusible (as Gd-chelates)56 orurely intravascular contrast agents (as iron oxide parti-les).57 However, nondiffusible tracers are still not permittedor clinical use.
The most widely used perfusion model, with Gd chelates,s derived from Peters’s model. Introducing the arterialhanges of R1 (�R1art), calculation of renal perfusion per unitf volume can be extracted from the mathematical expres-ion:
RBF ⁄ vol � max sloperenal ⁄ max �R1art
enal perfusion can alternatively be measured using pulsedrterial spin labeling (or spin-tagging) using endogenous wa-er as a diffusible tracer.58 With this technique, a perfusion-eighted image can be generated by the subtraction of an
mage in which inflowing spins have been labeled from anmage in which spin labeling has not been performed. Quan-itative perfusion maps can then be calculated (in mL/min/00 g of tissue) when T1 of the tissue and efficiency of label-
ng are known.A 50% decrease of cortical perfusion (from 400 mL/min/
00g to 200 mL/min/100g) has been observed after a tight80%) stenosis; however, atherosclerotic nephropathy, be-ause of its vascular components, also can be responsible fordecrease of perfusion to 180 mL/min/100 g.57 Distinctionetween these 2 types of cortical perfusion changes have noteen demonstrated.
ther Functional Parameters. MR imaging is able to pro-ide other new functional parameters as a diffusion coeffi-ients or a BOLD (Blood Oxygen Level Dependent) effect. InAS, their results are preliminary and their significance andole in strategy still under debate. They showed a decrease ofenal diffusion coefficients in patients with RAS59 and a de-reased intrarenal oxygenation during acute experimentalcclusion of the renal artery in pigs.60
trategyhe best strategy to explore RVD remains a matter of debate.he choice of the best noninvasive test at present depends on
he experience of each group in every technique and thevailability of these techniques knowing that US is cheaper
nd more available than CT or MR but requires training. Inood hands, it provides both criteria of significant (�60%)AS, based on proximal hemodynamic features, and prog-ostic information about possibility of improvement of hy-ertension, renal function, or kidney survival after revascu-
arization. If an accurate US examination is not available, or ift is inconclusive, MRA or CTA should be performed. CTA isreferred because of its greater availability, its greater spatialesolution with multi-slice systems, and its lower cost. How-ver, MRA should be the preferred choice if the patient hasmpaired renal function or intolerance to iodinated contrastgents. However, “downstream damage,” so-called atheroscle-otic nephropathy, remains difficult to characterize whereas itepresents the essential prognostic factor. The contribution ofaptopril-sensitized tests in this field is decreasing becausehe indications of reperfusion versus medical treatment areore specifically based on clinical criteria than on relation to
enin-related pathophysiology. For that purpose, scintigra-hy remains the gold standard, but MRI has the capacity torovide similar information.55
maging of Nephropathiesadiological techniques play a minor role in imaging of pa-enchymal nephropathies in native or in transplanted kid-eys. However, acute and chronic nephropathies are respon-ible for morphological and functional changes of renalarenchyma. From a morphological point of view, only mac-oscopic changes, such as kidney size and corticomedullaryifferentiation, actually are used on a daily basis. From aunctional point of view, scintigraphic techniques remain theajor sources of renal performance assessment. Today, or in
he near future, MRI may have the potential to provide im-ortant morphological and functional features for diagnosisr prognosis.
orphological Biomarkersf Kidney Functionhere is a growing interest in validating accurate and repro-ucible methods for the calculation of renal volume which,ay be an index of functional renal parenchyma.61 Fol-
ow-up of chronic nephropathies would be simplified foratients by such measurements. Today, the most widely usedarker is the renal length measured with sonography. How-
ver, its correlation with renal size is far from perfect.62 Theest method would be a volumetric technique, applied to thentire parenchyma, excluding the sinus, or to the cortex.oulam and coworkers63 reported an excellent correlationetween MRI measurement of total renal parenchymal vol-me, done slice-by-slice, and autopsy volume and weight,sing coronal multiphasic contrast-enhanced 3D sequences
n pigs. In our institution, we developed an automatic seg-entation technique of the renal cortex, which is directly
elated to filtration capabilities of the kidney, applied to aontrast-enhanced 3D data-set, obtained during the vascularhase. This technique demonstrated its feasibility (unpub-
ished data) but still requires validation (Fig. 6).
In inherited polycystic diseases, the measurement of renal
8 N. Grenier et al
Figure 5 Dynamic Gd-enhanced MRI of the kidneys before (A) and after (B) the administration of captopril in a patient withstenosis of the left renal artery (from top-to-bottom then left-to-right). (A) Before captopril, the tubular phase with low signalintensity within medulla (arrows) and excretion of contrast medium within renal collecting system (double arrows) aresymmetrical. (B) After captopril, the right kidney shows a normal tubular phase (arrow) and normal excretion (doublearrow), whereas the tubular phase is delayed on the left but then enhances with time, extending within the cortex andproviding a complete low signal intensity of the left kidney; this effect is related to a severe retention of the contrast agentwithin the entire left kidney induced by captopril. (C) Positive captopril MAG3-Tc99 scintigraphy obtained in the samepatient: the baseline study shows symmetrical elimination of the tracer (right of the image). After captopril (left of the image),there is an accumulation of the tracer within the left kidney whereas it remains unchanged in the right. (Reproduced from
Grenier et al,55 with permission from the American Journal of Roentgenology.)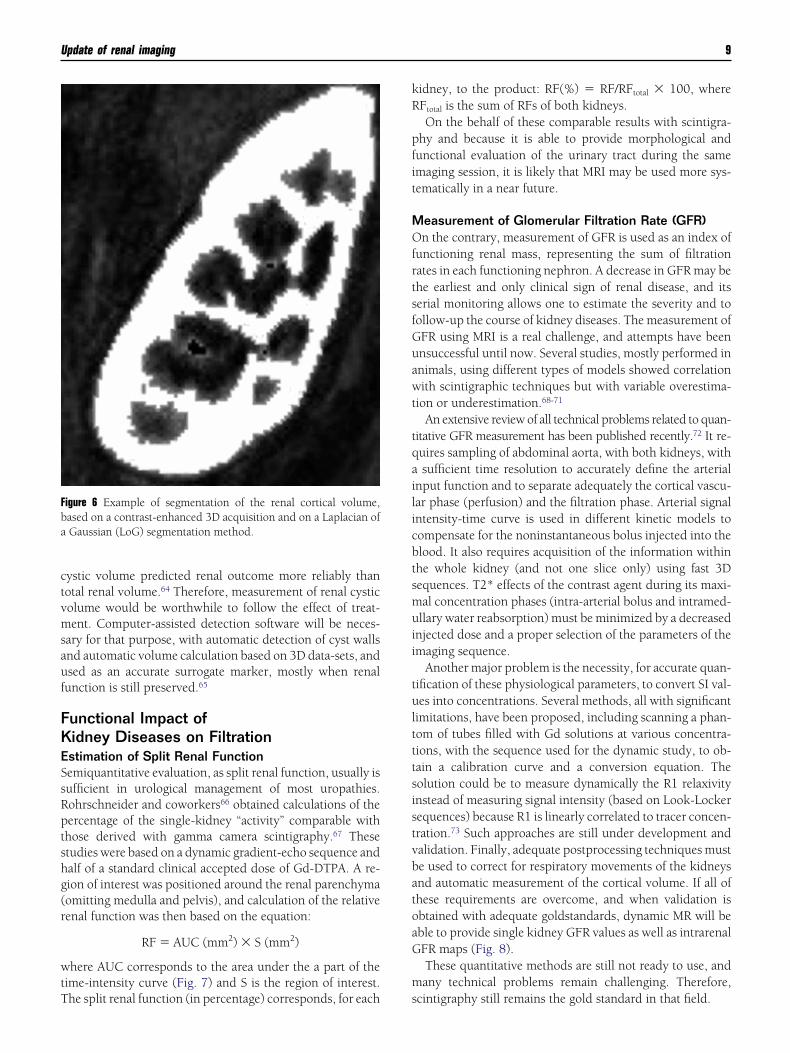
ctvmsauf
FKESsRptshg(r
wtT
kR
pfit
MOfrtsfGuawt
tqailicbtsmuii
tultttsistvbatoaG
m
Fba
Update of renal imaging 9
ystic volume predicted renal outcome more reliably thanotal renal volume.64 Therefore, measurement of renal cysticolume would be worthwhile to follow the effect of treat-ent. Computer-assisted detection software will be neces-
ary for that purpose, with automatic detection of cyst wallsnd automatic volume calculation based on 3D data-sets, andsed as an accurate surrogate marker, mostly when renalunction is still preserved.65
unctional Impact ofidney Diseases on Filtrationstimation of Split Renal Functionemiquantitative evaluation, as split renal function, usually isufficient in urological management of most uropathies.ohrschneider and coworkers66 obtained calculations of theercentage of the single-kidney “activity” comparable withhose derived with gamma camera scintigraphy.67 Thesetudies were based on a dynamic gradient-echo sequence andalf of a standard clinical accepted dose of Gd-DTPA. A re-ion of interest was positioned around the renal parenchymaomitting medulla and pelvis), and calculation of the relativeenal function was then based on the equation:
RF � AUC (mm2) � S (mm2)
here AUC corresponds to the area under the a part of theime-intensity curve (Fig. 7) and S is the region of interest.
igure 6 Example of segmentation of the renal cortical volume,ased on a contrast-enhanced 3D acquisition and on a Laplacian ofGaussian (LoG) segmentation method.
he split renal function (in percentage) corresponds, for each s
idney, to the product: RF(%) � RF/RFtotal � 100, whereFtotal is the sum of RFs of both kidneys.On the behalf of these comparable results with scintigra-
hy and because it is able to provide morphological andunctional evaluation of the urinary tract during the samemaging session, it is likely that MRI may be used more sys-ematically in a near future.
easurement of Glomerular Filtration Rate (GFR)n the contrary, measurement of GFR is used as an index of
unctioning renal mass, representing the sum of filtrationates in each functioning nephron. A decrease in GFR may behe earliest and only clinical sign of renal disease, and itserial monitoring allows one to estimate the severity and toollow-up the course of kidney diseases. The measurement ofFR using MRI is a real challenge, and attempts have beennsuccessful until now. Several studies, mostly performed innimals, using different types of models showed correlationith scintigraphic techniques but with variable overestima-
ion or underestimation.68-71
An extensive review of all technical problems related to quan-itative GFR measurement has been published recently.72 It re-uires sampling of abdominal aorta, with both kidneys, withsufficient time resolution to accurately define the arterial
nput function and to separate adequately the cortical vascu-ar phase (perfusion) and the filtration phase. Arterial signalntensity-time curve is used in different kinetic models toompensate for the noninstantaneous bolus injected into thelood. It also requires acquisition of the information withinhe whole kidney (and not one slice only) using fast 3Dequences. T2* effects of the contrast agent during its maxi-al concentration phases (intra-arterial bolus and intramed-llary water reabsorption) must be minimized by a decreased
njected dose and a proper selection of the parameters of themaging sequence.
Another major problem is the necessity, for accurate quan-ification of these physiological parameters, to convert SI val-es into concentrations. Several methods, all with significant
imitations, have been proposed, including scanning a phan-om of tubes filled with Gd solutions at various concentra-ions, with the sequence used for the dynamic study, to ob-ain a calibration curve and a conversion equation. Theolution could be to measure dynamically the R1 relaxivitynstead of measuring signal intensity (based on Look-Lockerequences) because R1 is linearly correlated to tracer concen-ration.73 Such approaches are still under development andalidation. Finally, adequate postprocessing techniques muste used to correct for respiratory movements of the kidneysnd automatic measurement of the cortical volume. If all ofhese requirements are overcome, and when validation isbtained with adequate goldstandards, dynamic MR will beble to provide single kidney GFR values as well as intrarenalFR maps (Fig. 8).These quantitative methods are still not ready to use, andany technical problems remain challenging. Therefore,
cintigraphy still remains the gold standard in that field.

10 N. Grenier et al
Figure 7 Measurement of split renal function in a patient with left urinary obstruction. (A) Anatomic image showingdilation of the left pyelocaliceal system. (B) Signal intensity-time curves obtained from regions-of-interest drawn on theentire renal parenchyma (excluding pyelocaliceal system) on each side, showing 3 phases: a first abrupt ascendingsegment followed by a first peak, corresponding to the “vascular-to-glomerular first-pass” or cortical vascular phase; asecond slowly ascending segment, ended by a second peak, corresponding to the glomerulo-tubular phase; and aslowly descending segment, corresponding to the predominant excretory function and so-called “excretory phase.”
Area under the curves have been drawn to calculate split renal function.
MRtwTitcch(pi
PSfsfflb
MOaoff
nm
dTtRmkmps
mtw
FTl
Ftwq
Update of renal imaging 11
easurement of Extraction Fraction (EF)ecently, a quantitative method of in vivo measurement of
he single kidney EF was proposed by Dumoulin and co-orkers74 and implemented by Niendorf and coworkers.75
his method is based on the measurement of T1 within flow-ng arterial and venous blood during slow Gd-infusion. Oncehe EF is calculated for each kidney, the GFR also can bealculated by measuring RBF of each renal artery using theine-phase-contrast method. Preliminary results on animalsave shown concordant results with the reference methodinulin clearance). If this quantitative method could be trans-osed to humans with reproducible results, the applications
n nephrology would be numerous.
rognostic Factors of Kidney Impairmenteveral physiopathological factors, considered as significantor prognosis, could be approached in the near future usingpecific MR techniques and specific contrast agents. Theseactors are medullary hypoxia, glomerular or interstitial in-ammation, degree of tubule dysfunction, factors of cell via-ility, and the development of fibrosis.
edullary Hypoxiauter medulla is particularly sensitive to hypoxia because the
ctive reabsorption process within the thick ascending loopf Henle requires high level of oxygen consumption.76 There-ore, a decrease of medullary blood flow, as in acute renal
igure 8 GFR map of a kidney transplant obtained after dynamic1-weighted Gd-enhanced sequence and application of the Rut-
and-Patlak plot on a voxel-by-voxel basis.
ailure, or an increase in tubular reabsorption, as in diabetic w
ephropathy (at the stage of hyperfiltration), may induceedullary hypoxia and secondary ischemia.The blood oxygen level-dependent (ie, BOLD) technique
oes not measure directly pO2 but allows intrarenal R2* (1/2*) measurements, which are closely related to concentra-
ion in deoxyhemoglobin (Fig. 9).77,78 Therefore, absolute2* values cannot be used in practice. If the disease is asym-etric, as in renal artery stenosis, static comparison of both
idneys may identify hypoxia on one side. In renal parenchy-al diseases, only dynamic changes after physiological orharmacological manipulation can identify the kidney re-ponse.
Interestingly, diabetic subjects are unable to increase theedullary oxygenation during water diuresis. In a compara-
ive study with a matched control group, diabetic patientsithout microalbuminuria, hypertension, or renal insuffi-
igure 9 Principle of blood oxygen level-dependent acquisition inhe kidney. The R2* is greater when the tissue pO2 is low and lowerhen it is high (A). A T2*-weighted multi-echo gradient echo se-uence allows to calculate a R2* map showing a higher R2* value
ithin medulla (arrows) (B).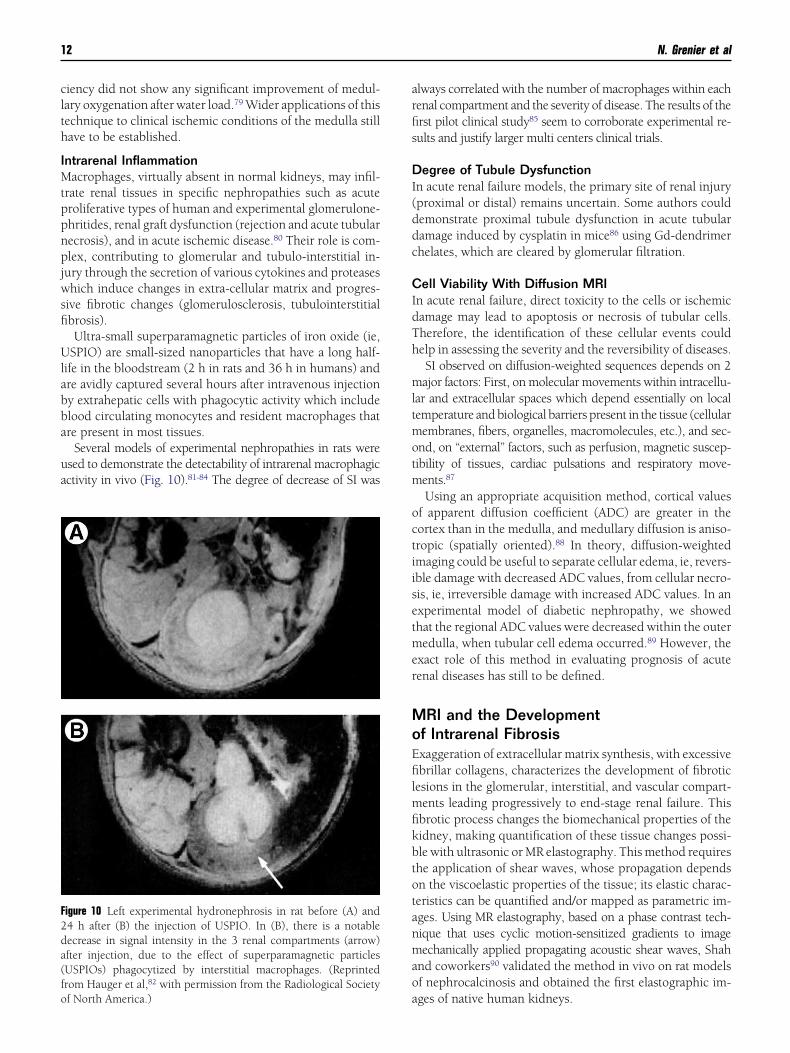
clth
IMtppnpjwsfi
Ulabba
ua
arfis
DI(ddc
CIdTh
mltmotm
octiisetmer
MoEfilmfikbtotanmao
F2da(fo
12 N. Grenier et al
iency did not show any significant improvement of medul-ary oxygenation after water load.79 Wider applications of thisechnique to clinical ischemic conditions of the medulla stillave to be established.
ntrarenal Inflammationacrophages, virtually absent in normal kidneys, may infil-
rate renal tissues in specific nephropathies such as acuteroliferative types of human and experimental glomerulone-hritides, renal graft dysfunction (rejection and acute tubularecrosis), and in acute ischemic disease.80 Their role is com-lex, contributing to glomerular and tubulo-interstitial in-
ury through the secretion of various cytokines and proteaseshich induce changes in extra-cellular matrix and progres-
ive fibrotic changes (glomerulosclerosis, tubulointerstitialbrosis).Ultra-small superparamagnetic particles of iron oxide (ie,
SPIO) are small-sized nanoparticles that have a long half-ife in the bloodstream (2 h in rats and 36 h in humans) andre avidly captured several hours after intravenous injectiony extrahepatic cells with phagocytic activity which includelood circulating monocytes and resident macrophages thatre present in most tissues.
Several models of experimental nephropathies in rats weresed to demonstrate the detectability of intrarenal macrophagicctivity in vivo (Fig. 10).81-84 The degree of decrease of SI was
igure 10 Left experimental hydronephrosis in rat before (A) and4 h after (B) the injection of USPIO. In (B), there is a notableecrease in signal intensity in the 3 renal compartments (arrow)fter injection, due to the effect of superparamagnetic particlesUSPIOs) phagocytized by interstitial macrophages. (Reprintedrom Hauger et al,82 with permission from the Radiological Society
af North America.)
lways correlated with the number of macrophages within eachenal compartment and the severity of disease. The results of therst pilot clinical study85 seem to corroborate experimental re-ults and justify larger multi centers clinical trials.
egree of Tubule Dysfunctionn acute renal failure models, the primary site of renal injuryproximal or distal) remains uncertain. Some authors couldemonstrate proximal tubule dysfunction in acute tubularamage induced by cysplatin in mice86 using Gd-dendrimerhelates, which are cleared by glomerular filtration.
ell Viability With Diffusion MRIn acute renal failure, direct toxicity to the cells or ischemicamage may lead to apoptosis or necrosis of tubular cells.herefore, the identification of these cellular events couldelp in assessing the severity and the reversibility of diseases.SI observed on diffusion-weighted sequences depends on 2ajor factors: First, on molecular movements within intracellu-
ar and extracellular spaces which depend essentially on localemperature and biological barriers present in the tissue (cellularembranes, fibers, organelles, macromolecules, etc.), and sec-
nd, on “external” factors, such as perfusion, magnetic suscep-ibility of tissues, cardiac pulsations and respiratory move-ents.87
Using an appropriate acquisition method, cortical valuesf apparent diffusion coefficient (ADC) are greater in theortex than in the medulla, and medullary diffusion is aniso-ropic (spatially oriented).88 In theory, diffusion-weightedmaging could be useful to separate cellular edema, ie, revers-ble damage with decreased ADC values, from cellular necro-is, ie, irreversible damage with increased ADC values. In anxperimental model of diabetic nephropathy, we showedhat the regional ADC values were decreased within the outeredulla, when tubular cell edema occurred.89 However, the
xact role of this method in evaluating prognosis of acuteenal diseases has still to be defined.
RI and the Developmentf Intrarenal Fibrosisxaggeration of extracellular matrix synthesis, with excessivebrillar collagens, characterizes the development of fibrotic
esions in the glomerular, interstitial, and vascular compart-ents leading progressively to end-stage renal failure. Thisbrotic process changes the biomechanical properties of theidney, making quantification of these tissue changes possi-le with ultrasonic or MR elastography. This method requireshe application of shear waves, whose propagation dependsn the viscoelastic properties of the tissue; its elastic charac-eristics can be quantified and/or mapped as parametric im-ges. Using MR elastography, based on a phase contrast tech-ique that uses cyclic motion-sensitized gradients to imageechanically applied propagating acoustic shear waves, Shah
nd coworkers90 validated the method in vivo on rat modelsf nephrocalcinosis and obtained the first elastographic im-
ges of native human kidneys.
CRebrcrpvsnowv
AWBJf
R
1
1
1
1
1
1
1
1
1
1
2
2
2
2
2
2
2
2
2
2
3
3
3
3
3
3
3
3
Update of renal imaging 13
ell Labeling for Follow-up of Cell Therapyecovery of renal function after acute nephrotoxic or isch-mic insult is dependent on the replacement of necrotic tu-ular cells with functional tubular epithelium. This cellularegeneration originates from resident cells or from extrarenalells. Recently, the possibility of differentiation of bone-mar-ow derived stem cells into mesangial cells91 and of hemato-oietic stem cells into tubular cells92 was demonstrated inivo, bringing great therapeutic promise for the future. Usingmall particles of iron oxide (ie, SPIO) preparations to mag-etically label the cells, we have demonstrated the feasibilityf grafting and subsequent visualization of progenitorsithin the kidney using either the intraarterial93 or the intra-enous route94 for grafting.
cknowledgmentse thank C. Bos, J. Bulte, C. Combe, Y. Delmas, C. Deminière,
. Denis de Senneville, P. Desbarat, J. Frøkier, I. Gordon, R.ones, CTW. Moonen, M. Pedersen, M. Ries, and J. Ripocheor their fruitful collaboration.
eferences1. Safian RD, Textor SC: Renal artery stenosis. N Engl J Med 344:431-442,
20012. Maxwell MH, Bleifer KH, Franklin SS, et al: Cooperative study of reno-
vascular hypertension. Demographic analysis of the study. J Am MedAssoc 220:1195-1204, 1972
3. Beregi JP, Mauroy B, Willoteaux S, et al: Anatomic variation in theorigin of the main renal arteries: Spiral CTA evaluation. Eur Radiol9:1330-1334, 1999
4. Kohler TR, Zierler RE, Martin RL, et al: Noninvasive diagnosis of renalartery stenosis by ultrasonic duplex scanning. J Vasc Surg 4:450-456,1986
5. Taylor DC, Kettler MD, Moneta GL, et al: Duplex ultrasound scanningin the diagnosis of renal artery stenosis: A prospective evaluation. J VascSurg 7:363-369, 1988
6. Hélénon O, El Rody F, Correas JM, et al: Color Doppler US of renovas-cular disease in native kidneys. RadioGraphics 15:833-854, 1995
7. Strandness DE: Duplex imaging for the detection of renal artery steno-sis. Am J Kidney Dis 24:674-678, 1994
8. Claudon M, Plouin PF, Baxter G, et al: Renal arteries in patients at riskof renal artery stenosis : multicenter evaluation of the echo enhancerSH508A at color and spectral Doppler US. Radiology 214:739-746,2000
9. Hua HT, Hood DB, Jensen CC, et al: The use of color flow duplexscanning to detect significant renal artery stenosis. Ann Vasc Surg 14:118-124, 2000
0. Motew SJ, Cherr GS, Craven TE, et al. Renal duplex sonography: Mainrenal artery versus hilar analysis. J Vasc Surg 32:462-469; 469-471,2000
1. De Cobelli F, Venturini M, Vanzulli A, et al: Renal arterial stenosis:prospective comparison of color Doppler US and breath-hold, three-dimensional, dynamic, gadolinium-enhanced MR angiography. Radi-ology 214:373-380, 2000
2. de Haan MW, Kroon AA, Flobbe K, et al: Renovascular disease inpatients with hypertension: Detection with duplex ultrasound. J HumHypertens 16:501-507, 2002
3. Napoli V, Pinto S, Bargellini I, et al: Duplex ultrasonographic study ofthe renal arteries before and after renal artery stenting. Eur Radiol12:796-803, 2002
4. Conkbayir I, Yucesoy C, Edguer T, et al: Doppler sonography in renalartery stenosis. An evaluation of intrarenal and extrarenal imaging pa-rameters. Clin Imaging 27:256-260, 2003
5. Nchimi A, Biquet JF, Brisbois D, et al: Duplex ultrasound as first-line
screening test for patients suspected of renal artery stenosis:Prospective evaluation in high-risk group. Eur Radiol 13:1413-1419,2003
6. Stavros AT, Parker SH, Yakes WF, et al: Segmental stenosis of the renalartery: Pattern recognition of tardus and parvus abnormalities withduplex sonography. Radiology 184:487-492, 1992
7. Schwerk WB, Restrepo IK, Stellwaag M, et al: Renal artery stenosis:Grading with image-directed Doppler US evaluation of renal resistiveindex. Radiology 190:785-790, 1994
8. Kliewer MA, Tupler RH, Carroll BA, et al: Renal artery stenosis: Analysisof Doppler waveform parameters and tardus-parvus pattern. Radiology189:779-787, 1993
9. Lafortune M, Patriquin HB, Demeule E, et al: Renal arterial stenosis:Slowed systole in the downstream circulation—experimental study indogs. Radiology 184:475-478, 1992
0. Baxter GM, Aitchison F, Sheppard D, et al: Colour Doppler ultrasoundin renal artery stenosis: Intrarenal waveform analysis. Br J Radiol 69:810-815, 1996
1. Oliva VL, Soulez G, Lesage D, et al: Detection of renal artery stenosiswith Doppler sonography before and after administration of captopril:Value of early systolic rise. AJR Am J Roentgenol 170:169-175, 1998
2. Kliewer MA, Tupler RH, Hertzberg BS, et al: Doppler evaluation ofrenal artery stenosis: Interobserver agreement in the interpretation ofwaveform morphology. AJR Am J Roentgenol 162:1371-1376, 1994
3. Gottlieb RH, Snitzer EL, Hartley DF, et al: Interobserver and intraob-server variation in determining intrarenal parameters by Dopplersonography. AJR Am J Roentgenol 168:627-631, 1997
4. Bude RO, Rubin JM, Platt JF, et al: Pulsus tardus: Its cause and potentiallimitations in detection of arterial stenosis. Radiology 190:779-784,1994
5. René PC, Oliva VL, Bui BT, et al: Renal artery stenosis: Evaluation ofDoppler US after inhibition of angiotensin-converting enzyme withcaptopril. Radiology 196:675-679, 1995
6. Rubin GD, Dake MD, Napel S, et al: Spiral CT of renal artery stenosis:Comparison of three-dimensional rendering techniques. Radiology190:181-189, 1994
7. Johnson PT, Halpern EJ, Kuszyk BS, et al: Renal artery stenosis: CTangiography—comparison of real-time volume-rendering and maxi-mum intensity projection algorithms. Radiology 211:337-343, 1999
8. Kaatee R, Beek FJA, de Lange EE, et al: Renal artery stenosis: Detectionand quantification with spiral CT angiography versus optimized digitalsubtraction angiography. Radiology 205:121-127, 1997
9. Wittenberg G, Kenn W, Tschammler A, et al: Spiral CT angiography ofrenal arteries: Comparison with angiography. Eur Radiol 9:546-551,1999
0. Van Hoe L, Vandermeulen D, Gryspeerdt S, et al: Assessment of accu-racy of renal artery stenosis grading in helical CT angiography usingmaximum intensity projections. Eur Radiol 6:658-664, 1996
1. Kaatee R, Beek FJA, Verschuyl EJ, et al: Renal artery stenosis: Detectionand quantification with spiral CT angiography versus optimized digitalsubtraction angiography. Radiology 199:637-640, 1996
2. Fleischmann D. Multiple detector-row CT angiography of the renal andmesenteric vessels. Eur J Radiol 45:S79-S87, 2003 (suppl 1)
3. Prince MR, Narasimhan DL, Stanley JC, et al: Breath-hold Gadolinium-enhanced MR angiography of the abdominal aorta and its majorbranches. Radiology 197:785-792, 1995
4. Rieumont MJ, Kaufman JA, Geller SC, et al: Evaluation of renal arterystenosis with dynamic gadolinium-enhanced MR angiography. AJRAm J Roentgenol 169:39-44, 1997
5. Hany TF, Debatin JF, Leung DA, et al: Evaluation of the aortoiliac andrenal arteries: Comparison of breath-hold, contrast-enhanced, three-dimensional MR angiography with conventional catheter angiography.Radiology 204:357-362, 1997
6. De Cobelli F, Vanzulli A, Sironi S, et al: Renal artery stenosis : evaluationwith breath-hold, three-dimensional, dynamic, gadolinium-enhanced ver-sus three-dimensional, phase-contrast MR angiography. Radiology 205:689-695, 1997
7. Tello R, Thomson KR, Witte D, et al: Standard dose Gd-DTPA dynamic
MR of renal arteries. J Magn Reson Imaging 8:421-426, 1998
3
3
4
4
4
4
4
4
4
4
4
4
5
5
5
5
5
5
5
5
5
5
6
6
6
6
6
6
6
6
6
6
7
7
7
7
7
7
7
7
7
7
8
14 N. Grenier et al
8. Bakker J, Beek FJA, Beutler JJ, et al: Renal artery stenosis and accessoryrenal arteries : accuracy of detection and visualization with Gadolinium-enhanced breath-hold MR angiography. Radiology 207:497-504, 1998
9. Thornton J, O’Callaghan J, Walshe J, et al: Comparison of digital sub-traction angiography with gadolinium-enhanced magnetic resonanceangiography in the diagnosis of renal artery stenosis. Eur Radiol 9:930-934, 1999
0. Völk M, Strotzer M, Lenhart M, et al: Time-resolved contrast-enhancedMR angiography of renal artery stenosis: diagnostic accuracy and inter-observer variability, AJR Am J Roentgenol 174:1583-1588, 2000
1. Fain SB, King BF, Breen JF, et al:. High-spatial resolution contrastenhanced MR angiography of the renal arteries: A prospective compar-ison with digital subtraction angiography, Radiology 218:481-490,2001
2. Wilman AH, Riederer SJ, King BF, et al: Fluoroscopically triggeredcontrast-enhanced three-dimensional MR angiography with ellipticalcentric view order: Application to the renal arteries. Radiology 205:137-146, 1997
3. Gilfeather M, Yoon HC, Siegelman ES, et al: Renal artery stenosis:Evaluation with conventional angiography versus Gadolinium-en-hanced MR angiography. Radiology 210:367-372, 1999
4. Masunaga H, Takehara Y, Isoda H, et al: Assessment of gadolinium-enhanced time-resolved three-dimensional MR angiography for evalu-ating renal artery stenosis. AJR Am J Roentgenol 176:1213-1219, 2001
5. Breath-hold contrast-enhanced three-dimensional MR angiography ofthe abdomen: time-resolved imaging versus single-phase imaging, Ra-diology 214:149-156, 2000
6. Vasbinder GB, Nelemans PJ, Kessels AG, et al: Diagnostic tests for renalartery stenosis in patients suspected of having renovascular hyperten-sion: A meta-analysis. Ann Intern Med 18; 135:401-411, 2001
7. Zhang HL, Schoenberg SO, Resnick LM, et al: Diagnosis of renal arterystenosis: combining gadolinimum-enhanced three-dimensional mag-netic resonance angiography with functional magnetic resonance pulsesequences. Am J Hypertens 16:1079-1082, 2003
8. Mounier-Vehier C, Lions C, Devos P, et al: Cortical thickness: An earlymorphological marker of atherosclerotic renal disease. Kidney Int 61:591-598, 2002
9. Mustert BR, Williams DM, Prince MR: In vitro model of arterial steno-sis: Correlation of MR signal dephasing and trans-stenotic pressuregradients. Magn Reson Imaging 16:301-310, 1998
0. Schoenberg SO, Knopp MV, Bock M, et al: Combined morphologic andfunctional assessment of renal artery stenosis using gadolinium en-hanced magnetic resonance imaging. Nephrol Dial Transplant 13:2738-2742, 1998
1. Schoenberg SO, Bock M, Kallinowski F, et al: Correlation of hemody-namic impact and morphologic degree of renal artery stenosis in acanine model. J Am Soc Nephrol 11:2190-8, 2000
2. Schoenberg SO, Knopp MV, Londy F, et al. Morphologic and func-tional magnetic resonance imaging of renal artery stenosis: a mul-tireader tricenter study. J Am Soc Nephrol 13:158-169, 2002
3. Binkert CA, Debatin JF, Schneider E, et al. Can MR measurement ofrenal artery flow and renal volume predict the outcome of percutane-ous transluminal renal angioplasty? Cardiovasc Intervent Radiol 24:233-239, 2001
4. Radermacher J, Chavan A, Bleck J, et al: Use of Doppler ultrasonogra-phy to predict the outcome of therapy for renal-artery stenosis. N EnglJ Med 344:410-417, 2001
5. Grenier N, Trillaud H, Combe C, et al: Diagnosis of renovascular hy-pertension with captopril-sensitized dynamic MR of the kidney: Fea-sability and comparison with scintigraphy. AJR Am J Roentgenol 166:835-843, 1996
6. Vallee JP, Lazeyras F, Khan HG, et al: Absolute renal blood flow quan-tification by dynamic MRI and Gd-DTPA. Eur Radiol 10:1245-1252,2000
7. Schoenberg SO, Aumann S, Just A, et al: Quantification of renal perfu-sion abnormalities using an intravascular contrast agent (part 2): Re-sults in animals and humans with renal artery stenosis. Magn ResonMed 49:288-98, 2003
8. Calamante F, Thomas DL, Pell GS, et al: Measuring cerebral blood flow
using magnetic resonance imaging techniques. J Cereb Blood FlowMetab 19:701-735, 1999
9. Namimoto T, Yamashita Y, Mitsuzaki K, et al: Measurement of theapparent diffusion coefficient in diffuse renal disease by diffusion-weighted echo-planar MR imaging. J Magn Reson Imaging 9:832-837,1999
0. Juillard L, Lerman LO, Kruger DG, et al: Blood oxygen level-dependentmeasurement of acute intra-renal ischemia. Kidney Int 65:944-950,2004
1. Saxena AB, Busque S, Arjane P, et al: Preoperative renal volumes as apredictor of graft function in living donor transplantation. Am J KidneyDis 44:877-85, 2004
2. Bakker J, Olree M, Kaatee R, et al: Renal volume measurements: Accu-racy and repeatability of US compared with that of MR imaging. Radi-ology 211:623-628, 1999
3. Coulam CH, Bouley DM, Sommer FG: Measurement of renal volumeswith contrast-enhanced MRI. J Magn Reson Imaging 15:174-179, 2002
4. King BF, Reed JE, Bergstralh EJ, et al: Quantification and longitudinaltrends of kidney, renal cyst, and renal parenchyma volumes in autoso-mal dominant polycystic kidney disease. J Am Soc Nephrol 11:1505-1511, 2000
5. Chapman AB, Guay-Woodford LM, Grantham JJ, et al: Renal structurein early autosomal-dominant polycystic kidney disease (ADPKD): TheConsortium for Radiologic Imaging Studies of Polycystic Kidney Dis-ease (CRISP) cohort. Kidney Int 64:1035-1045, 2003
6. Rohrschneider WK, Haufe S, Wiesel M, et al: Functional and morpho-logic evaluation of congenital urinary tract dilatation by using com-bined static-dynamic MR urography: Findings in kidneys with a singlecollecting system. Radiology 224:683-694, 2002
7. Rohrschneider WK, Haufe S, Clorius JH, et al: MR to assess renalfunction in children. Eur Radiol 13:1033-1045, 2003
8. Baumann D, Rudin M: Quantitative assessment of rat kidney functionby measuring the clearance of the contrast agent Gd(DOTA) usingdynamic MRI. Magn Reson Imaging 18:587-595, 2000
9. Laurent D, Poirier K, Wasvary J, et al: Effect of essential hypertensionon kidney function as measured in rat by dynamic MRI. Magn ResonMed 47:127-134, 2002
0. Hackstein N, Heckrodt J, Rau WS: Measurement of single-kidney glo-merular filtration rate using a contrast-enhanced dynamic gradient-echo sequence and the Rutland-Patlak plot technique. J Magn ResonImaging 18:714-725, 2003
1. Annet L, Hermoye L, Peeters F, et al: Glomerular filtration rate: assess-ment with dynamic contrast-enhanced MRI and a cortical-compart-ment model in the rabbit kidney. J Magn Reson Imaging 20:843-849,2004
2. Huang AJ, Lee VS, Rusinek H: MR imaging of renal function. RadiolClin North Am 41:1001-1017, 2003
3. Pedersen M, Dissing T, Deding D, et al. MR renography based oncontrast-enhanced T1-mapping. Presented at the International Societyfor Magnetic Resonance in Medicine, Miami, Fl, May 7-13, 2005
4. Dumoulin CL, Buonocore MH, Opsahl LR, et al: Noninvasive measure-ment of renal hemodynamic functions using gadolinium enhancedmagnetic resonance imaging. Magn Reson Med 32:370-378, 1994
5. Niendorf ER, Grist TM, Lee FT Jr, et al: Rapid in vivo measurement ofsingle-kidney extraction fraction and glomerular filtration rate with MRimaging. Radiology 206:791-798, 1998
6. Brezis M, Rosen S: Hypoxia of the renal medulla–its implications fordisease. N Engl J Med 332:647-655, 1995
7. Prasad PV, Chen Q, Goldfarb JW, et al: Breath-hold R2* mapping witha multiple gradient-recalled echo sequence: Application to the evalua-tion of intrarenal oxygenation. J Magn Reson Imaging 7:1163-1165,1997
8. Prasad PV, Edelman RR, Epstein FH: Noninvasive evaluation of intra-renal oxygenation with BOLD MRI. Circulation 94:3271-3275, 1996
9. Economides PA, Caselli A, Zuo CS, et al: Kidney oxygenation duringwater diuresis and endothelial function in patients with type 2 diabetesand subjects at risk to develop diabetes. Metabolism 53:222-227, 2004
0. Erwig LP, Kluth DC, Rees AJ: Macrophages in renal inflammation. Curr
Opin Nephrol Hypertens 10:341-347, 2001
8
8
8
8
8
8
8
8
8
9
9
9
9
9
Update of renal imaging 15
1. Hauger O, Delalande C, Trillaud H, et al: MR imaging of intrarenalmacrophage infiltration in an experimental model of nephrotic syn-drome. Magn Reson Med 41:156-162, 1999
2. Hauger O, Delalande C, Deminiere C, et al: Nephrotoxic nephritis andobstructive nephropathy: Evaluation with MR imaging enhanced withultrasmall superparamagnetic iron oxide-preliminary findings in a ratmodel. Radiology 217:819-826, 2000
3. Ye Q, Yang D, Williams M, et al: In vivo detection of acute rat renalallograft rejection by MRI with USPIO particles. Kidney Int 61:1124-1135, 2002
4. Jo SK, Hu X, Kobayashi H, et al: Detection of inflammation followingrenal ischemia by magnetic resonance imaging. Kidney Int 64:43-51,2003
5. Hauger O, Grenier N, Deminière C, et al. Late Sinerem-enhanced MRimaging of renal diseases: A pilot study. Radiology 233(P):512, 2004
6. Kobayashi H, Kawamoto S, Jo SK, et al: Renal tubular damage detectedby dynamic micro-MRI with a dendrimer-based magnetic resonancecontrast agent. Kidney Int 61:1980-1985, 2002
7. Murtz P, Flacke S, Traber F, et al: Abdomen: Diffusion-weighted MRimaging with pulse-triggered single-shot sequences. Radiology 224:
2582–2564, 20028. Ries M, Jones RA, Basseau F, et al: Diffusion tensor MRI of the humankidney. J Magn Reson Imaging 14:42-49, 2001
9. Ries M, Basseau F, Tyndal B, et al: Renal diffusion and BOLD MRI inexperimental diabetic nephropathy. Blood oxygen level-dependent. JMagn Reson Imaging 17:104-113, 2003
0. Shah NS, Kruse SA, Lager DJ, et al: Evaluation of renal parenchymaldisease in a rat model with magnetic resonance elastography. MagnReson Med 52:56-64, 2004
1. Imasawa T, Utsunomiya Y, Kawamura T, et al: The potential of bonemarrow-derived cells to differentiate to glomerular mesangial cells.J Am Soc Nephrol 12:1401-1409, 2001
2. Lin F, Cordes K, Li L, et al: Hematopoietic stem cells contribute to theregeneration of renal tubules after renal ischemia-reperfusion injury inmice. J Am Soc Nephrol 14:1188-1199, 2003
3. Bos C, Delmas Y, Desmouliere A, et al: In vivo MR imaging of intravas-cularly injected magnetically labeled mesenchymal stem cells in ratkidney and liver. Radiology 233:781-789, 2004
4. Hauger O, Frost EE, Deminière C, et al. MR evaluation of the glomer-ular homing of magnetically labeled mesenchymal stem cells in a rat
model of nephropathy. Radiology (in press)