Unusual Option Market Activity and the Terrorist...
36
Unusual Option Market Activity and the Terrorist Attacks of September 11, 2001 Allen M. Poteshman * Department of Finance College of Business University of Illinois at Urbana-Champaign 340 Wohlers Hall 1206 South Sixth Street Champaign, IL 61820 (217) 265-0565 [email protected] First Draft: March 2002 This Draft: March 10, 2004 * I thank Joe Levin, Eileen Smith, and Dick Thaler for assistance with the data used in this paper. Jeff Brown, Murillo Campello, George Constantinides, Timothy Johnson, Josef Lakonishok, Stewart Mayhew, George Pennacchi, Michael Weisbach, Justin Wolfers, and seminar participants at the University of Illinois provided a number of very helpful suggestions. Funding from Illinois CIBER and the George J. Heideman Summer Faculty Research Award is gratefully acknowledged. This material is based upon work supported by the Department of Education under Award No. P220A020011. Any opinions, findings, and conclusions or recommendations expressed in this publication are those of the author and do not necessarily reflect the views of the Department of Education. I bear full responsibility for any remaining errors.
Transcript of Unusual Option Market Activity and the Terrorist...
Unusual Option Market Activity and the Terrorist Attacks of September 11, 2001
Allen M. Poteshman*
Department of Finance
College of Business University of Illinois at Urbana-Champaign
340 Wohlers Hall 1206 South Sixth Street Champaign, IL 61820
(217) 265-0565 [email protected]
First Draft: March 2002 This Draft: March 10, 2004
* I thank Joe Levin, Eileen Smith, and Dick Thaler for assistance with the data used in this paper. Jeff Brown, Murillo Campello, George Constantinides, Timothy Johnson, Josef Lakonishok, Stewart Mayhew, George Pennacchi, Michael Weisbach, Justin Wolfers, and seminar participants at the University of Illinois provided a number of very helpful suggestions. Funding from Illinois CIBER and the George J. Heideman Summer Faculty Research Award is gratefully acknowledged. This material is based upon work supported by the Department of Education under Award No. P220A020011. Any opinions, findings, and conclusions or recommendations expressed in this publication are those of the author and do not necessarily reflect the views of the Department of Education. I bear full responsibility for any remaining errors.

Unusual Option Market Activity and the Terrorist Attacks of September 11, 2001
ABSTRACT
After the terrorist attacks of September 11, 2001 there was a great deal of speculation that the
terrorists or their associates had traded in the option market on advanced knowledge of the
impending events. It is nearly impossible, however, to assess the option market trading leading
up to this or any other event in the absence of systematic information about the characteristics of
option market activity. This paper provides this information by computing the distributions of
option market volume statistics both unconditionally and when conditioning on the overall level
of option activity, the return and trading volume on the underlying stocks, and the return on the
overall market. When the option market activity in the days leading up to the terrorist attacks is
compared to the benchmark distributions, volume ratio statistics are seen to be at typical levels.
An indicator of long put volume, however, appears to be unusually high which is consistent with
informed investors having traded in the option market in advance of the attacks.
I. Introduction
In the aftermath of the terrorist attacks on the World Trade Center and the Pentagon on
September 11, there was widespread speculation that the terrorists or their associates had used
advanced knowledge of the attacks to profit in the financial markets.1 Much of the attention
focused on the trading in the days leading up to September 11 in options written on American
Airlines (AMR) and United Airlines (UAL), the two companies whose planes were hijacked and
crashed by the terrorists. Since the value of a put (call) option is decreasing (increasing) in the
price of the underlying stock, the put-call volume ratio is a common measure of the extent to
which positions established by option market trading will profit from the underlying stock price
falling rather than rising. It is commonly believed that a typical put-call ratio is in the
neighborhood of one,2 and according to the Options Clearing Corporation (OCC) website
(http://www.theocc.com) the September 10 put-call ratio for AMR options was 6.09, and the
September 6 put-call ratio for UAL options was 25.4.
Many observers maintained that the AMR and UAL option activity leading up to
September 11 constitutes strong evidence that there had been trading on advanced knowledge of
the attacks. For example, on September 19 the CBS Evening News reported that the September
10 AMR put trading exceeded the call trading to such an extent that their sources had “never
seen that kind of imbalance before” while the September 6 put and call trading on UAL was
“extremely imbalanced.” The report closed by saying that “Now US investigators want to know
whether Osama bin Laden was the ultimate inside trader; profiting from a tragedy he’s suspected
of masterminding to finance his operations.” (Attkisson, 2001) University of Chicago finance
professor George Constantinides said that the option market trading was “so striking that it’s
1 All dates in this paper that do not include a year occur in 2001. 2 It will be seen below that, in fact, the put-call ratio is usually less than one.
1

hard to attribute it to chance. So something is definitely going on.” (Roeder, 2001) Other well-
known academic experts such as Columbia University law professor John Coffee and Duke
University law professor James Cox likewise suspected that some investors traded in the option
market on foreknowledge of the attacks. (Mathewson and Nol, 2001) In addition, sophisticated
option market participants like Jon Najarian, founder of option specialist Mercury Trading, also
concluded from the trading that somebody knew ahead of time that the attacks would occur.
(Atkinson and Fluendy, 2001)
Despite the views expressed by the popular media, leading academics, and option market
professionals, there is reason to question the decisiveness of the evidence that terrorists traded in
the option market ahead of the September 11 attacks. One event that casts doubt on the evidence
is the crash of an American Airlines plane in New York City on November 12. According to the
OCC website, three trading days before on November 7, the put-call ratio for options on AMR
stock was 7.74. Based on the statements made about the links between option market activity
and terrorism shortly after September 11, it would have been tempting to infer from this put-call
ratio that terrorism probably was the cause of the November 12 crash. Subsequently, however,
terrorism was all but ruled out. While it might be the case that an abnormally large AMR put-
call ratio was observed by chance on November 7, this event certainly raises the question of
whether put-call ratios as large as 7.74 are, in fact, unusual. Beyond the November 12 plane
crash, an article published in Barron’s on October 8 (Arvedlund, 2001) offers several additional
grounds for being skeptical about the claims that it is likely that terrorists or their associates
traded AMR and UAL options ahead of the September 11 attacks. For starters, the article notes
that the heaviest trading in the AMR options was not in the cheapest, shortest-dated puts which
would have provided the largest profits to someone who knew of the coming attacks.
2
Furthermore, an analyst had issued a “sell” recommendation on AMR during the previous week,
which may have lead investors to buy AMR puts. Similarly, the stock price of UAL had recently
declined enough to concern technical traders who may have increased their put buying, and UAL
options are heavily traded by institutions hedging their stock positions. Finally, traders making
markets in the options did not raise the ask price at the time the orders arrived as they would
have if they believed the orders were based on adverse non-public information – the market
makers did not appear to find the trading to be out of the ordinary at the time that it occurred.
It is clear both that there is a good deal of prima facie evidence that the terrorists or their
associates traded in the option market ahead of the September 11 attacks but at the same time
that there are a number of reasons to suspect its probative value. Consideration of the option
market activity leading up to September 11 suggests that, in general, it is difficult to make
reasonable judgments about whether unusual option trading has occurred in the absence of
detailed knowledge about the distribution of option market activity. The goals of this paper are
twofold. The first is to compute the historical distribution of several option market volume
statistics both unconditionally and when conditioning on the overall level of option activity, the
return and trading volume on the underlying stocks, and the return on the overall market. These
distributions can be used as benchmarks to determine whether the option market trading
associated with any event of interest is unusual. The second goal of the paper is to use these
distributions to assess the extent to which the option market trading leading up to September 11
was out of the ordinary.
The paper’s first set of results characterizes the unconditional and conditional historical
distribution of option market activity. I begin by computing quantiles of the daily values of three
option market volume statistics: two volume ratio measures and a measure of abnormal long put
3

volume. The quantiles are computed over the January 2, 1990 through September 4, 2001 period
for options listed at the Chicago Board Options Exchange (CBOE) on the 1000 largest market
capitalization firms, for options on firms in the Standard and Poor’s airline index, and for options
on the Standard and Poor’s 500 stock market index (SPX). The quantiles of the maximum daily
value of the option volume statistics over four trade date windows are also reported, because it
appears from the case of the September 11 attacks that inferences are sometimes made based
upon the largest daily value of an option market volume statistic that occurs over a window of
several trade dates leading up to an event. The unconditional distributions can be used to assess
option market trading leading up to the public release of important information while controlling
for baseline levels of option market activity (i.e., speculating, hedging, etc.) that is unrelated to
varying conditions in the option or underlying stock markets.
In order to capture the impact of potentially significant conditioning information, quantile
regression is used to regress option volume statistics on independent variables that might have an
important impact on their distributions. The independent variables used are: the volume of
options traded on the underlying stock, the current and past returns on the underlying stock, the
current and past volume on the underlying stock, and the current and past return on the stock
market as a whole. The resulting conditional distributions can be employed to evaluate option
market trading leading up to the public release of important information while controlling for
baseline levels of option market activity (i.e., speculating, hedging, etc.) that vary with changing
conditions in the option or underlying stock markets.
The characterization of the unconditional and conditional distribution of option market
activity should be of interest to several audiences. Option market participants and corporate
executives clearly will have use for tools that help them better to assess when there is unusual
4
activity in the options that they trade or which are written on the firms they manage. Exchange
officials, regulators, and policy makers can also use this information in the design and
enforcement of insider trading rules. DeMarzo, Fishman, and Hagerty (1998) argue that an
optimal insider trading enforcement policy should balance the benefits of having market makers
face a reduced adverse selection problem against the costs of enforcement. It may be possible to
use the distributions provided in this paper to lower the costs of enforcement with the implication
that relatively more monitoring effort should be devoted to the option market. Finally, investors,
stock analysts, journalists, and the public at large can use the distributions to assess whether
there was unusual option market trading leading up to any event of interest.
The paper’s second set of results uses the historical distribution of option market activity
to assess the option market trading in the days leading up to September 11. I will refer to the
four trade dates beginning September 5 and ending September 10 as the target period. I
investigate this period for two reasons. First, these are the days that most commentators seemed
to be focused upon. Second, Osama bin Laden claimed that he learned on September 5 that the
attacks would occur on September 11.3 One of my option volume statistics, PutCall, is similar to
the standard put-call ratio. The maximum daily value that it attained for AMR or UAL during
the target period was 105.42.4 This value is at the 0.97 quantile of the historical daily
distribution of the PutCall statistic computed from the option activity on the 1000 largest market
capitalization firms that trade at the CBOE. Consequently, against this benchmark it appears that
during the target period there is evidence of abnormally large option market bets that the airline
stock prices were going to fall.
3 Bin Laden said that he learned the timing of the attacks in Afghanistan on September 6. (Bumiller and Miller, 2001) Part of September 6 in Afghanistan includes a period when the U.S. option markets were open on September 5. 4 Below I will detail the differences between my PutCall statistic and the put-call ratio reported by the OCC.
5

One reason to suspect inferences from this comparison, however, is that the PutCall ratio
adds together long and short put volume in the numerator and long and short call volume in the
denominator. As a result, it does not divide volume which establishes option market positions
that will be profitable if the underlying stock price falls by volume that establishes option market
positions which will be profitable if the underlying stock price increases. To address this
problem, I define another ratio, ShortLong, which properly aggregates together option market
volume that is decreasing in the stock price and also properly aggregates together option market
volume that is increasing in the stock price. The ShortLong statistic has a maximum daily value
for AMR or UAL during the target period which is at only the 0.80 quantile of its daily
distribution. Hence, on this measure the option market trading during the target period does not
look very unusual. Another important issue is that market observers seemed to be choosing for
scrutiny the most extreme daily option volume during the target period. Insofar as this is the
case, the most extreme daily value of the ShortLong statistic during the target period should be
judged against the historical distribution of the daily maximum value of ShortLong over four
trade date windows. Under this comparison the ShortLong statistic during the target period is at
the 0.49 quantile of its distribution. When viewed in this way, the option market activity during
the target period could hardly have been more ordinary.
Since the most straightforward way for terrorists or their associates to have profited from
foreknowledge of the attacks would have been for them simply to take long positions in puts on
stocks like AMR or UAL, I also investigate a daily measure of abnormal long put volume,
AbnLongPut. The maximum value of this measure for AMR or UAL during the target period is
at the 0.99 quantile of its daily distribution and the 0.96 quantile of the distribution of its greatest
daily values over four trade date windows. Consequently, it appears that long put volume was
6

elevated during the target period. Since long put volume is a cleaner indicator of option market
volume which establishes option positions which will be profitable if the underlying stock price
declines than the volume ratios, I conclude that option market activity does provide evidence that
is consistent with the terrorists or their associates having traded ahead of the September 11
attacks. Conditioning on the variables discussed above (i.e., total option volume, return on the
underlying stock, volume on the underlying stock, and return on the market) does not change the
conclusions drawn from either the option volume ratio indicators or the put volume indicator.5
The terrorists or their associates might have tried to profit in the option market from the
decline in the prices of stocks on airlines other than AMR or UAL or from an overall market
decline in the wake of the September 11 attacks. In order to assess this possibility, I compare
trading during the target period in options on stocks in the Standard and Poor’s airline index and
on the SPX index with their historical distributions. This comparison does not yield evidence of
trading ahead of the attacks in the option market. It should be borne in mind, however, that even
if there had been informed trading ahead of the attacks in options on other airline stocks or the
SPX index, it would be considerably more difficult to detect because of the substantially larger
baseline of option market activity in the aggregate airline stocks and the SPX index.
The analysis presented in this paper is most closely related to a strand of literature that
investigates the linkage between option market volume and subsequent price movements of the
underlying stock. In a recent contribution, Easley, O’Hara, and Srinivas (1998) argue that there
is a small amount of information in positive and negative option volume for future stock price
changes.6 On the other hand, using a different methodology, Chan, Chung, and Fong (2002)
5 Likewise, delta-adjusting the option volume used in the option market volume statistics does not change the conclusions. 6 Positive option volume is purchases of calls or sales of puts by non-market makers. Negative option volume is sales of calls or purchases of puts by non-market makers.
7

conclude that signed option volume does not contain information for subsequent stock price
changes. Pan and Poteshman (2003) employ cleaner measures of positive and negative volume
and provide evidence that there is substantial information in option volume for future stock
prices. Cao, Chen, and Griffin (2003) show that in the period leading up to takeover
announcements option volume contains information about next day stock price movements.
They hypothesize that prior to “extreme information events” the option market is the primary
venue for informed trading. This hypothesis is consistent with the terrorists or their associates
having traded in the option market ahead of the September 11 attacks.
The remainder of the paper is organized as follows. The second section describes the
data. Section III defines the option market volume statistics used in the paper. The fourth
section computes the distributions of these statistics both unconditionally and when conditioning
on the overall level of option activity, the return and trading volume on the underlying stocks,
and the return on the overall market. Section V uses these distributions to assess the extent to
which the option market trading leading up to September 11 was out of the ordinary. The sixth
section concludes.
II. Data
The main data for this paper were obtained from the CBOE. The data consist of a daily
record from January 2, 1990 through September 20, 2001 of long and short open interest for non-
market makers on all options listed at the CBOE.7 The long (short) open interest for a particular
option contract on a particular trade date is the number of long (short) contracts that non-market
maker investors have outstanding at the end of that trade date. When a CBOE listed option is 7 The Options Clearing Corporation (OCC) recognizes three origin codes for option trades, “C” (Public Customers), “F” (Firm Proprietary Accounts of OCC members), and “M” (Market Makers). The data used in this paper corresponds to the aggregate long and short open interest for the OCC “C” and “F” origin codes.
8
also listed at another exchange, the data covers non-market maker open interest for all exchanges
at which the option trades. Options which are not listed at the CBOE on a given trade date,
however, do not appear in the data on that trade date. Long (short) net trading volume is then
computed for each option on each trade date by subtracting the long (short) open interest on that
trade date from the long (short) open interest on the previous trade date. Consequently, the data
analyzed in this paper corresponds to the daily net trading volume of all non-market makers in all
markets at which CBOE listed options trade.8
This paper investigates data on all options on individual stocks and on the SPX index.
The CBOE data contains the ticker symbol for the stock or index that underlies each option.
This ticker symbol is used to extract information on the underlying stock or index for each option
from the Center for Research in Securities Prices (CRSP) files. For the options on individual
stocks, when a given option observation on a particular trade date cannot be matched with a
CRSP permno, it is dropped from the analysis. For each option on each trade date, the
information extracted from CRSP on the underlying stock or index is the closing price, the daily
return for the current and past 62 trade dates, the daily trading volume for the current and past
147 trade dates, and the dividends paid over the remaining life of the option. Daily returns for
the CRSP value-weighted index are also obtained from CRSP. Daily one month LIBOR rates
are obtained from Datastream.
8 This method for computing net trading volume implicitly treats option exercises as sales and assignments of exercises as purchases. Unreported results indicate that the findings below are practically the same if exercises are factored out when calculating net trading volume. Since exercising and selling an option both involve getting out of the option position, this paper chooses to treat them both in the same way.
9
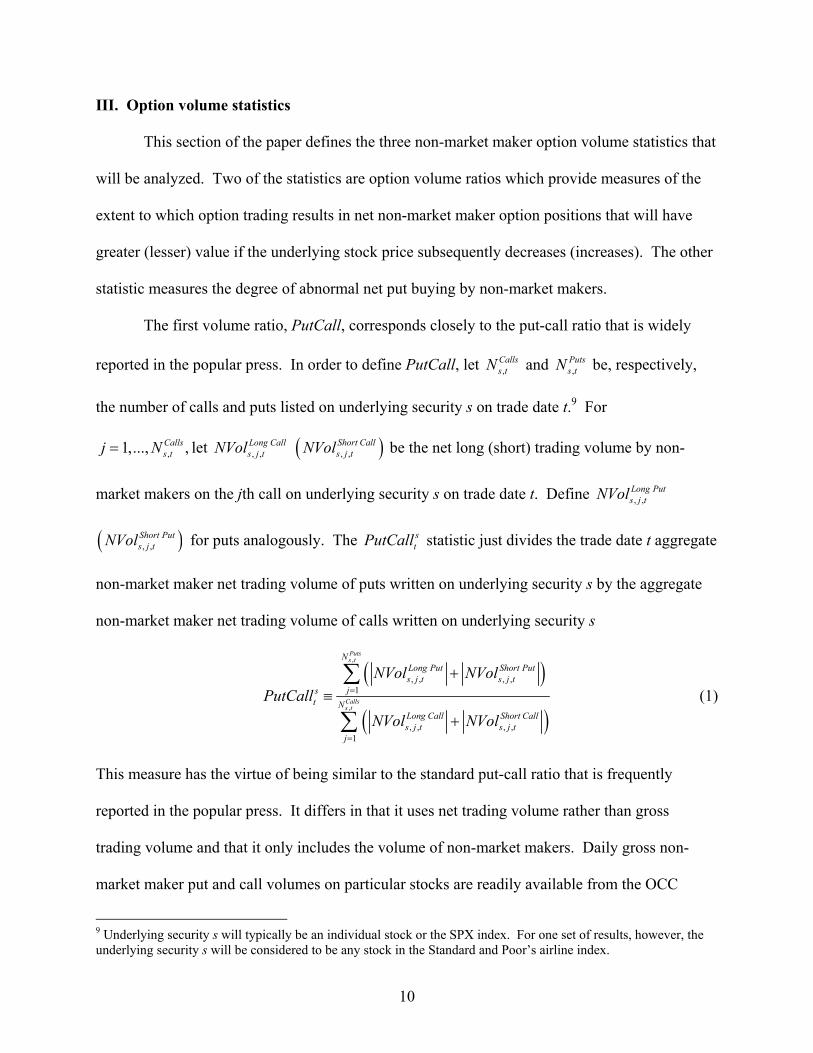
III. Option volume statistics
This section of the paper defines the three non-market maker option volume statistics that
will be analyzed. Two of the statistics are option volume ratios which provide measures of the
extent to which option trading results in net non-market maker option positions that will have
greater (lesser) value if the underlying stock price subsequently decreases (increases). The other
statistic measures the degree of abnormal net put buying by non-market makers.
The first volume ratio, PutCall, corresponds closely to the put-call ratio that is widely
reported in the popular press. In order to define PutCall, let ,Callss tN and ,
Putss tN be, respectively,
the number of calls and puts listed on underlying security s on trade date t.9 For
let ,1,..., ,Callss tj N= , ,
Long Calls j tNVol ( ), ,
Short Calls j tNVol be the net long (short) trading volume by non-
market makers on the jth call on underlying security s on trade date t. Define , ,Long Puts j tNVol
( ), ,Short Puts j tNVol for puts analogously. The s
tallPutC statistic just divides the trade date t aggregate
non-market maker net trading volume of puts written on underlying security s by the aggregate
non-market maker net trading volume of calls written on underlying security s
( )
( )
,
,
, , , ,1
, , , ,1
Putss t
Callss t
NLong Put Short Puts j t s j t
jst N
Long Call Short Calls j t s j t
j
NVol NVolPutCall
NVol NVol
=
=
+≡
+
∑
∑ (1)
This measure has the virtue of being similar to the standard put-call ratio that is frequently
reported in the popular press. It differs in that it uses net trading volume rather than gross
trading volume and that it only includes the volume of non-market makers. Daily gross non-
market maker put and call volumes on particular stocks are readily available from the OCC
9 Underlying security s will typically be an individual stock or the SPX index. For one set of results, however, the underlying security s will be considered to be any stock in the Standard and Poor’s airline index.
10

website. Dividing the daily gross non-market maker put volume by the daily gross non-market
maker call volume produces a number very close to the PutCall statistic, and it is reasonable to
judge this number against the PutCall distributions that are reported below.10
A drawback of the PutCall measure (and of the widely reported put-call volume ratio) is
that it does not distinguish between long and short volume. This is a problem, because long put
positions increase in value when the underlying security price falls while short put positions
decrease in value when the underlying security price falls. It can be seen, however, from the
numerator of equation (1) that the PutCall measure treats the purchase and the sale of put
positions in the same way. The treatment of the call volume in the denominators suffers from the
same difficulty.
I define a second volume ratio, ShortLong, which avoids this problem. ShortLong is a
ratio whose numerator adds net trading volume which corresponds to option positions that
increase in value when the underlying security price falls (i.e., the selling of calls and the buying
of puts) and subtracts net trading volume which corresponds to option positions that decrease in
value when the underlying security price falls (i.e., the buying of calls and the selling of puts):
( ) ( )
( ) ( )
, ,
, ,
, , , , , , , ,1 1
, , , , , , , ,1 1
Calls Putss t s t
Calls Ps t s t
N NShort Call Long Call Long Put Short Puts j t s j t s j t s j t
j jst N N
Short Call Long Call Long Put Short Puts j t s j t s j t s j t
j j
NVol NVol NVol NVolShortLong
NVol NVol NVol NVol
= =
= =
− + −≡
+ + +
∑ ∑
∑uts
∑ (2)
The denominator normalizes the variable by adding together the absolute values of all of the
option trading volume. This statistic ranges from 1− to +1, with a value of − indicating that
all option volume corresponds to option positions that will increase in value if the underlying
1
10 For example, for UAL over the period November 6, 2000 through September 4, 2001, the 5th, 50th, and 95th quantiles of the PutCall distribution are, respectively, 0.02, 0.52, and 15.4. The 5th, 50th, and 95th quantiles for the gross non-market maker put divided by gross non-market maker call volume distribution (computed from the OCC website data) are, respectively, 0.03, 0.52, and 15.6.
11

security price rises and a value of +1 indicating that all option volume corresponds to option
positions that will increase in value if the underlying security price declines.
Since the most straightforward way for an investor to benefit in the option market from
private information about impending bad news would be for him simply to buy puts, I will also
analyze a statistic that directly measure abnormal net long put volume. In particular, the
AbnLongPut statistic will measure non-market maker abnormal net long put volume on trade
date t for a particular underlying security s. It is defined as the absolute net long put volume on
trade date t for security s minus the daily average of this quantity over a six month historical
period from 147 to 22 trade dates before t normalized by the standard deviation of the absolute
net long put volume during the historical period11
( ) ( )
( )
, ,
,
147
, , , ,1 22 1
, ,1
1126
.
, 22,...,147
Puts Putss t s t i
Putss t i
N NLong Put Long Puts j t s j t i
j i jst N
Long Puts j t i
j
NVol NVolAbnLongPut
std NVol i
−
−
−= = =
−=
−≡
=
∑ ∑ ∑
∑ (3)
Finally, the maximum daily value attained by the option volume measures over some
window of trade dates from to will also be analyzed. Statistics which measure these
quantities are defined as follows
t t w+
{ },, Max , 0,...,s Daily Max s
t t w t iOptVolStat OptVolStat i w+ +≡ = (4)
where OptVolStat is any of the options volume statistics. For example,
{ },, Max , 0,...,s Daily Max s
t t w t iPutCall PutCall i w+ +≡ =
(5)
is the maximum daily value obtained by the PutCall statistic for underlying security s over trade
dates t through t w .+
11 The notation { }, ,...,istd x i a b= refers to the sample standard deviation of the set with elements ,..., .a bx x
12

Before presenting the distributions of the option market volume statistics in the next
section of the paper, it is worth commenting on their use in detecting option market trading based
upon private information. Since the statistics are built from all option market activity, they
contain trading that is motivated by a number of factors such as uninformed speculation (i.e.,
noise trading), hedging, trading on public information, and trading on private information.
Consequently, when a statistic obtains a value that is extreme relative to its historical
distribution, one can infer that their was an unusual amount of activity related to one or more of
the option trading motivations. Although the statistics do not distinguish between trading
motivations, if an extreme value is observed just before an important piece of news becomes
public, then it is reasonable to infer that there was option market trading based upon private
information rather than a shock to the trading from one of the other motivations. Indeed, the fact
that the statistic has obtained an extreme value indicates that a shock to trading from another
motivation would have to be unusually large to account for the observed option market trading.
Of course, it is possible that the typical option trading from the other motivations varies
systematically with changes in the state of the option or underlying security market. This is the
reason that conditional as well as unconditional distributions for the statistics will be computed
in the next section.12
12 It should be noted that if investors trade on private information in the market for the underlying security and hedge their trading in the option market, there may be a bias against detecting private information trading in the option market. For example, suppose there are two investors with private positive information about a stock. The first investor exploits it by buying the stock and hedges his position by selling a call while the second investor exploits it simply by buying a call. The option market activities of these two investors will tend to cancel one another out in the computation of the volume ratios even though both are trading on positive private information.
13
IV. The distribution of option market volume statistics
This section of the paper computes the distributions of the option market volume
statistics defined above both unconditionally and when conditioning on a number of variables
which may be associated with systematic changes in the distributions. These distributions can be
used to assess option market activity around any event of interest. In the next section of the
paper, they are used to evaluate the option market trading in the days leading up to the
September 11 attacks.
Table 1 reports the minimum, maximum, and quantiles of the option market volume
statistics computed on a daily basis over the January 2, 1990 through September 4, 2001 period.
For the AbnLongPut statistic, values are included in the distributions for all trade dates t that
have option data on the underlying stock for at least 100 of the trade dates between t and
147−
22.t −
Panel A of Table 1 reports the distributions obtained from all options that trade at the
CBOE which have underlying stocks in the top 1000 CRSP market capitalizations on the first
trading day of each calendar year.13 The median value of the PutCall distribution is only 0.32
which suggests that ceteris paribus a belief that one is the typical value for this statistic might
actually cause observers to underestimate the extent to which large values of this statistic are
unusual. It is also interesting to note that the statistic is highly variable. At the 0.25 quantile the
statistic is 0.05 (which is close to its minimum value of zero) while the 0.95 quantile is 15.45.
The distribution of the ShortLong statistic is roughly similar once it is taken into account that it
ranges from minus one to plus one. It will be seen below, however, that the ShortLong statistic
13 Market capitalization is defined as the price per share times the number of shares outstanding. Distributions obtained from all CBOE options or all CBOE options with underlying stocks that are among the largest 500 market capitalizations on CRSP on the first trading day of each calendar year are similar to those presented in Panel A of Table 1.
14

can lead to different inferences about option market trading. The AbnLongPut statistic measures
the number of standard deviations that net long put volume for a given underlying stock on a
given trade date varies from the average for the underlying stock. The median value is close to
zero, and the distribution around the median is roughly symmetric. Panels B and C of Table 1
report the distributions of the statistics when the underlying security on each trade date is the 18
stocks in the Standard and Poor’s airline index as of September 2001 or the SPX index.
The distributions in Table 1 can be used to compare the option market activity on a trade
date against its daily distribution. Based on the news reports in the weeks after September 11, it
appears that sometimes the most extreme daily value of an option market volume statistic over
some period of trade dates is used to judge option market activity. For this reason, I report in
Table 2 the distribution of the daily maximum of the option market volume statistics over
disjoint four trade date intervals. I choose four trade date intervals, because they will be useful
in evaluating the option market activity in the days leading up to September 11. As expected, all
of the distributions are shifted upward in Table 2 relative to the distributions in Table 1. For
example, the median value of the PutCall statistic increases from 0.32 to 1.61. It will not be
surprising if different inferences are made about whether unusual option market activity has
occurred around some event depending upon which of the distributions is used as a benchmark.
It seems plausible a priori that the distribution of the option market volume ratios will be
influenced by a number of factors. One factor that probably is important is the total number of
option contracts traded on an underlying asset on a given trade date. To see why, consider the
case of the PutCall statistic. When the total number of option contracts transacted on a trade
date is very small there is a relatively high probability that all of the contracts that traded were
either puts or calls. When only puts trade the value of the statistic is infinity and when only call
15
trades the value of the statistic is zero. Consequently, one would expect that the lower (upper)
quantiles of the PutCall statistic will have lesser (greater) values when the total number of option
contracts traded is smaller.
The distributions of the option volume statistics may well also change as a function of the
return on the underlying stock. For example, momentum or contrarian investors may place
option market bets on future movements in the underlying stock price in response to past returns.
Another possibility is that investors place bets directly in the underlying stock market based upon
past returns and hedge their bets in the option market. The option market volume associated
with the hedging would impact the option volume statistics and, hence, would potentially impact
their distributions. The trading volume of the underlying stock might be important as well
insofar as it indicates the extent to which there is information being released or attention being
paid to a firm. Finally, the return on the overall market might matter, because it contains
information about macroeconomic factors or overall investor sentiment.
I will use quantile regression to estimate the quantiles of the option market volume
statistics conditional on total option volume, the return on the underlying asset, the abnormal
trading volume of the underlying asset, and the return on the overall stock market. Classical
linear regression is used to estimate conditional mean functions. Median regression is a similar
statistical technique that is used to estimate conditional median functions. Quantile regression is
a generalization of median regression which can be used to estimate conditional quantile
functions. Details on quantile regression can be found in Koenker and Basset (1978), Koenker
and Hallock (2001), and Koenker (2002).
The regression model that will be estimated is
16

0 1 2 3 4 5
6 7 8 9
10
s s s s st t t t t
s st t t
st t
OptVolStat OptVol RDay RWeek RMonth AbnVolDay
AbnVolWeek AbnVolMonth RVWDay RVWWeek
RVWMonth
β β β β β β
β β β β
β ε
= + + + + +
+ + + +
+ +
st
t (6)
where stOptVolStat is either a standardized version of the PutCall statistic or the AbnLongPut
statistic. The PutCall variable cannot be used because it ranges up to infinity. The standardized
version of PutCall, which will be called PutCallStand, is defined as the net put volume divided
by the net put plus net call volume. PutCallStand, ranges from zero to one. The regressions will
only be performed for cases where the underlying securities are individual stocks. The first
independent variable, ,stVolOpt is the total net option volume on underlying stock s on trade date
t (that is, it is the sum of the absolute values of the net long and short, put and call trading.) The
next three independent variables, ,stRDay ,s
tRWeek and ,stRMonth are, respectively, the return
on underlying stock s on trade date t, the average daily return on stock s over trade dates 5t −
through t and the average daily return on stock s over trade dates t1,− 21− through The
next three variables,
6.t −
,stAbnVolDay ,s
teekAbnVolW and ,stAbnVolMonth are, respectively, the
abnormal trading volume on stock s on trade date t and the average daily abnormal trading
volumes on trade dates t through 5− 1t − and trade dates 21t − through Here abnormal
trading volume is obtained by subtracting from the trading volume on trade date t or the daily
average trading volume on trade dates
6.t −
5t − through t 1− or trade dates 21t − through t 6− the
daily average trading volume for stock s over trade dates t 147− through and then
dividing by the standard deviation of the daily trading volume for stock s over trade dates
22t −
147t −
through t 22.− ,tRVWDay ,tRVWWeek and tRVW
t
Month
21
are, respectively, the CRSP value
weighted market return on trade date t and the daily average CRSP value weighted market return
on trade dates through t and trade dates 5t − 1− − through t 6.−
17

Table 3 report the results of performing quantile regression over the period January 2,
1990 through September 4, 2001 when the universe of underlying stocks is the 1000 largest
CRSP market capitalization firms at the beginning of each calendar year. The t-Statistics for the
coefficient estimates reported in parentheses are computed from standard errors that assume non-
iid regression residuals.14 The coefficient estimates in Panel A of Table 3 can be used to assess
the option trading around any event of interest as follows. First, collect the values of the
independent variables for the underlying stock and trade date of interest. Next, sum the products
of these values and the coefficient estimates from model (6) to compute the conditional quantiles
of the option volume statistics. Finally, calculate the value of the statistics for the underlying
stock and trade date of interest, and compare it to the computed quantiles. In the final step, use
data for the put and call activity by non-market makers. For PutCallStand, this data is readily
available at the OCC website.15 Exchange officials, regulators, and prosecutors should have no
problem acquiring the necessary data for the AbnLongPut statistic as well.16
V. Option market trading in the days leading up to September 11
This section of the paper investigates whether there was unusual option market activity in
the days leading up to September 11 that is consistent with the terrorists or their associates
trading ahead of the attacks. The target period that I examine for unusual option market activity
is the four trade dates leading up to September 11 (i.e., September 5, 6, 7, and 10.) As explained
14 With non-iid regression residuals the limiting covariance matrix for the coefficient estimates takes the form of a “Huber sandwich.” This sandwich is estimated using the sparsity estimation method described in Koenker (2002). 15 The data at the OCC website is for gross rather than net trading. However, as was discussed in Footnote 10, this difference should not have a significant impact on the comparison. 16 Conditional quantiles were also computed for ShortLong, for delta-adjusted version of the statistics, and for the cases where the option volume statistics correspond to the daily maximum over four trade date intervals. It turns out that in the analysis performed in the next section of the paper there was no difference in the inferences obtained from the unconditional and conditional distributions. Consequently, the results from these other conditional quantile estimations are not reported here.
18
above, I consider this target period, because it contains the trade dates most market observers
seemed to be focusing upon, and because Osama bin Laden appears to have learned on
September 5 that the attacks would occur on September 11.
Table 4 contains the values of the option market volume statistics for AMR, UAL, the
airline index stocks, and the SPX index on the trade dates surrounding September 11. Consistent
with the reports in the popular press, during the target period the option market volume ratios
had their greatest values for AMR on September 10 and for UAL on September 6. The PutCall
statistic was 7.07 September 10 for AMR and 105.42 on September 6 for UAL. Upon casual
consideration, it is easy to believe that these numbers – especially the one on UAL – indicate that
there were an unusual level of option market positions established during the target period which
would profit from a drop in the price of AMR or UAL. Since the option volume statistics on the
airline index stocks and the SPX index are less variable than those on the individual stocks, it
also appears from Panels C and D of Table 4 that the option market volume ratios may have been
elevated for the airline index stocks and the SPX index on September 5 when they had
PutCall values of 7.31 and 3.96, respectively.17
Table 5 evaluates the maximum daily value obtained by each of the option market
volume statistics for the various groups of underlying securities during the target period. In
particular, it reports the quantiles of these maximum daily values computed from the
unconditional distributions for the statistics constructed either from the daily values of the
statistics or from the maximum daily values over disjoint four trade date intervals. These
unconditional distributions are just the ones reported in Tables 1 and 2.18 Panel A of Table 5
17 When AMR and UAL are removed from the airline index, the September 5 PutCall value drops from 7.31 to 5.04. 18 Recall that the distributions are constructed over the January 2, 1990 through September 4, 2001 period, and the universe of underlying stocks considered in the distributions are the 1000 largest market capitalization firms in the
19
reports the quantiles for AMR and UAL. When the benchmark distributions are built from the
daily values of the statistics, the maximum value of PutCall during the target period is seen to be
at the 0.97 quantile. Consequently, if this comparison is the appropriate way to decide whether
option market trading was unusual in the days leading up to September 11, then there is evidence
that is significant at conventional levels that an unusual quantity of option market positions that
would profit from a decrease in the price of AMR or UAL were established during the target
period.
This comparison, however, is not appropriate for two reasons. First, as was discussed
above, the PutCall statistic does not correctly aggregate option market positions that will
increase (or decrease) in value when the underlying stock price declines. ShortLong, on the
other hand, does aggregate these volumes correctly, and Table 5 shows that its maximum daily
value for AMR or UAL during the target period was at the 0.80 quantile of its daily distribution.
Hence, when an option market ratio that correctly aggregates volume is considered, the trading
during the target period does not look very unusual. The second problem with the comparison in
the previous paragraph is that it judges the maximum value of a statistic over a four trade date
period against its daily distribution. Clearly, the maximum daily value of a statistic over the four
trade date target period should be assessed against the historical distribution of the maximum
value of the statistic over four trade date intervals. This comparison is also reported in Table 5,
and the quantile of the maximum observed ShortLong statistic over the four trade date windows
drops from 0.80 to 0.49. Hence, the option market volume ratios (at least for AMR and UAL
options) do not provide any evidence that the trading leading up to September 11 was unusual.
CRSP database on the first trade date of each calendar year. At the beginning of 2001, AMR and UAL were, respectively, the 426th and 863rd largest market capitalization firms on CRSP.
20

In fact, the 0.49 quantile of the ShortLong statistic suggests that the trading was not in any way
out of the ordinary.19
Simply buying puts on AMR or UAL would have been the most straightforward way for
terrorists or their associates to have profited in the option market. The values of the volume ratio
statistics, on the other hand, are impacted not only by long put volume but also by short put
volume and long and short call volume. The AbnLongPut statistic measures only (abnormal)
non-market maker net long put trading. Table 5 reports that the maximum daily value that it
attains for either AMR or UAL during the target period was 3.83 which indicates that during one
of the four trade dates of the target period the net long put trading was 3.83 standard deviations
greater than average. The 3.83 value of the statistic is at the 0.99 quantile of its daily distribution
and the 0.96 quantile of the distribution of daily maximum over four trade date windows. Hence,
on this measure it does appear that significant abnormal option market positions were established
that would profit from the decline of one of the airlines stocks most directly impacted by the
attacks. Recall that the historical distributions of AbnLongPut, from which the quantiles were
computed, control for option trading that is not motivated by private information.
Since AbnLongPut is a more direct measure than the option volume ratios of the option
market positions that would most likely be established to profit from a decline in the price of the
airlines stocks, I conclude that the unconditional evidence supports the proposition that there was
unusual trading in the option markets leading up to September 11 which is consistent with the
terrorists or their associates having traded on advance knowledge of the impending attacks.
19 Given that airplanes from two airlines were crashed, in the case of the September 11 attacks it would also be of interest to compare the maximum daily value of the statistics for either AMR or UAL over the four trade date target period to the historical distribution of the daily maximum of the statistics for pairs of underlying stocks over four trade date windows. Since there is no reason to believe that events will tend to naturally involve two underlying stocks (and even in the case of September 11 one could reasonably include firms headquartered at the World Trade Center, insurance companies with exposure from the attacks, etc.), I did not in the previous section develop the tools to make this comparison.
21

Given the opposite conclusion that is drawn from the ShortLong statistic, a more general lesson
appears to be that option market volume ratios may not be reliable indicators of the presence of
unusual trading in the option markets.
In unreported results, the quantiles of the AMR and UAL statistics during the target
period were also computed relative to historical distributions built only from AMR option
trading, UAL option trading, and option trading on 38 stocks that the Securities and Exchange
Commission identified for special scrutiny after September 11. The main conclusions are not
altered by using these alternative distributions as the benchmarks. Delta-adjusting the option
volume used in the statistics also has very little influence on the conclusions.
Terrorist or their associates may have believed either that all airline stocks or the stock
market as a whole would suffer declines after the attacks and might have tried to profit by
trading options either on the stocks of airlines other than AMR and UAL or on the market as a
whole. Panels B and C of Table 5 report the quantiles of option trading on, respectively, the
Standard and Poor’s airline index and the SPX index during the target period. The ShortLong
statistic is at the 0.55 and 0.38 quantiles and the AbnLongPut statistic is at the 0.88 and 0.82
quantiles of their historical distributions of daily maximum over four trade date windows.
Consequently, there is no clear evidence of unusual option trading on airline stocks as a whole or
on the SPX index. In unreported results, a similar conclusion is reached if the analysis is
repeated after removing AMR and UAL from the airline index or if it is repeated on the S&P 100
(OEX) or NASDAQ 100 (NDX) index.
It should be kept in mind, however, that there is much more option activity on the stocks
in the airline index or on the market indices than on AMR or UAL. In particular, AMR and
UAL are only two of eighteen companies in the airline index, and during the month leading up to
22
September 11 the option volume on SPX options was more than 100 times greater than that on
either AMR or UAL options. Consequently, it would be much more difficult to detect an option
market bet of a fixed size among all of the stocks in the airline index or in the SPX market. It
seems that the appropriate conclusion to draw is that while it is unlikely that the terrorists or their
associates placed very large option market bets among airline stocks or the SPX index leading up
to September 11, not much should be inferred about whether they used these options to place
small or moderate sized bets.
Table 4 also includes the values of the option market volume statistics for each of the
four trade dates after the exchange re-opened following September 11. For AMR, the option
market volume statistics do not appear to be out of the ordinary. For UAL, on the other hand,
AbnLongPut had a value of 3.79 on September 20 (four trade dates after re-opening.) Although
this number would be large when judged against the historical distributions, the September 11
attacks were such a unique event – especially for AMR and UAL – that it seems inappropriate to
draw any conclusions about the few days after the market re-opened, even if the conditional
distributions are used as benchmarks.
I now turn to an analysis of the option trading on AMR and UAL during the target period
which conditions on the state of the option and stock market at this time. I do this by summing
the products of quantile regression coefficient estimates from equation (6) by the values of the
independent variables for AMR and UAL during the target period to produce conditional
estimates for ShortLong and AbnLongPut. These conditional quantile estimates are reported in
Table 6.20
20 Table 3 does not contain the coefficient estimates for ShortLong. The quantile regression, however, was performed for ShortLong and the resulting coefficient estimates are used to construct the conditional ShortLong quantiles reported in Table 6.
23
The largest value of the ShortLong statistic during the target period was 0.89 which
occurred for AMR on September 10. This value of ShortLong is at the 0.80 quantile of the
unconditional daily distribution. Panel A of Table 6 indicates that on September 10 the 0.50
quantile of the conditional daily distribution on ShortLong for AMR was –0.034 and the 0.90
quantile of this distribution was 0.954. Consequently, it appears that in this case there is little
difference between the conditional and the unconditional quantile. The largest daily value of the
AbnLongPut variable during the target period, 3.83, also occurred for AMR on September 10.
This value of AbnLongPut was seen to be at the 0.99 quantile of the unconditional distribution.
Panel B of Table 6 indicates that on September 10 the 0.95 quantile of the conditional daily
distribution on AbnLongPut for AMR was 1.285 and the 0.99 quantile of this distribution was
4.265. Once again, it seems that there is not much difference between the unconditional and the
conditional quantile. Unreported analysis show that the conditional and unconditional results are
also very similar for the statistics that measure maximum daily values over four trade date
windows. Hence, it does appear that the AbnLongPut ratio for AMR and UAL was unusually
high during the target period even after accounting for variation in its distribution associated with
the independent variables in the quantile regression model.21 This finding is consistent with the
widespread speculation shortly after September 11 that the terrorists or their associates traded
ahead in the option market based upon foreknowledge of the impending attacks.
21 It is, of course, possible that some important explanatory variables have been omitted from the quantile regression model. However, since the intuitively important variables contained in the model had little impact on the distributions of the statistics, it seems reasonable to believe that inclusion of other explanatory variables would probably not alter the main conclusion.
24

VI. Conclusion
Options traders, corporate managers, security analysts, exchange officials, regulators,
prosecutors, policy makers, and – at times – the public at large have an interest in knowing
whether unusual option trading has occurred around certain events. A prime example of such an
event is the September 11 terrorist attacks, and there was indeed a great deal of speculation about
whether option market activity indicated that the terrorists or their associates had traded in the
days leading up to September 11 on advanced knowledge of the impending attacks. This
speculation, however, took place in the absence of an understanding of the relevant
characteristics of option market trading.
This paper begins by developing systematic information about the distribution of option
market activity. It constructs benchmark distributions for option market volume statistics which
measure in different ways the extent to which non-market maker volume establishes option
market positions which will be profitable if the underlying stock price rises or falls in value. The
distributions of these statistics are calculated both unconditionally and when conditioning on the
overall level of option activity on the underlying stock, the return and trading volume on the
underlying stock, and the return on the overall market. These distributions are then used to judge
whether the option market trading in AMR, UAL, the Standard and Poor’s airline index, and the
S&P 500 market index in the days leading up to September 11 was, in fact, unusual.
The option market volume ratios considered do not provide evidence of unusual option
market trading in the days leading up to September 11. The volume ratios, however, are
constructed out of long and short put volume and long and short call volume, while simply
buying puts would have been the most straightforward way for someone to have traded in the
option market on foreknowledge of the attacks. A measure of abnormal long put volume was
25

also examined and seen to be at abnormally high levels in the days leading up to the attacks.
Consequently, the paper concludes that there is evidence of unusual option market activity in the
days leading up to September 11 which is consistent with investors trading on advanced
knowledge of the attacks.
26
References
Arvedlund, Erin E. 2001. Follow the money: Terrorist conspirators could have profited more
from fall of entire market than single stocks. Barron’s, October 8. Atkinson, Dan and Simon Fluendy. 2001. Terrorist backers “bet on stock market plunge to
bring financial system to its knees”. Mail on Sunday, September 23. Attkisson, Sharyl. 2001. Evidence of possible manipulation of the US stock market just before
the attacks. CBS Evening News (6:30 PM ET), September 19. Bumiller, Elisabeth and Judith Miller. 2001. Bin Laden, on tape, boasts of trade center attacks;
U.S. says it proves his guilt. New York Times, December 14. Cao, Charles, Zhiwu Chen, and John M. Griffin. 2003. Informational content of option volume
prior to takeovers. Journal of Business, forthcoming. Chan, Kalok Y., Peter Chung, and Wai-Ming Fong. 2002. The informational role of stock and
option volume. The Review of Financial Studies 15:1049-1075. DeMarzo, Peter, Michael Fishman, and Kathleen Hagerty, 1998. The optimal enforcement of
insider trading regulations. Journal of Political Economy 106:602-632. Easley, David, Maureen O’Hara, and P.S. Srinivas. 1998. Option volume and stock prices:
Evidence on where informed traders trade. Journal of Finance 53:431-465. Koenker, Roger. 2002. Quantile Regression. Unpublished manuscript, University of Illinois at
Urbana-Champaign. Koenker, Roger, and Gilbert Bassett. 1978. Regression quantiles. Econometrica 46:33-50. Koenker, Roger, and Kevin F. Hallock. 2001. Quantile regression. Journal of Economic
Perspectives 15:143-156. Mathewson, Judy and Michael Nol. 2001. U.S., Germany, Japan investigate unusual trading
before attack. Bloomberg News Service, September 18. Pan, Jun, and Allen M. Poteshman. 2003. The information in option volume for stock prices.
Unpublished working paper. Massachusetts Institute of Technology and University of Illinois at Urbana-Champaign.
Roeder, David. 2001. Terrorist trailed at CBOE. Chicago Sun-Times, September 20.
27
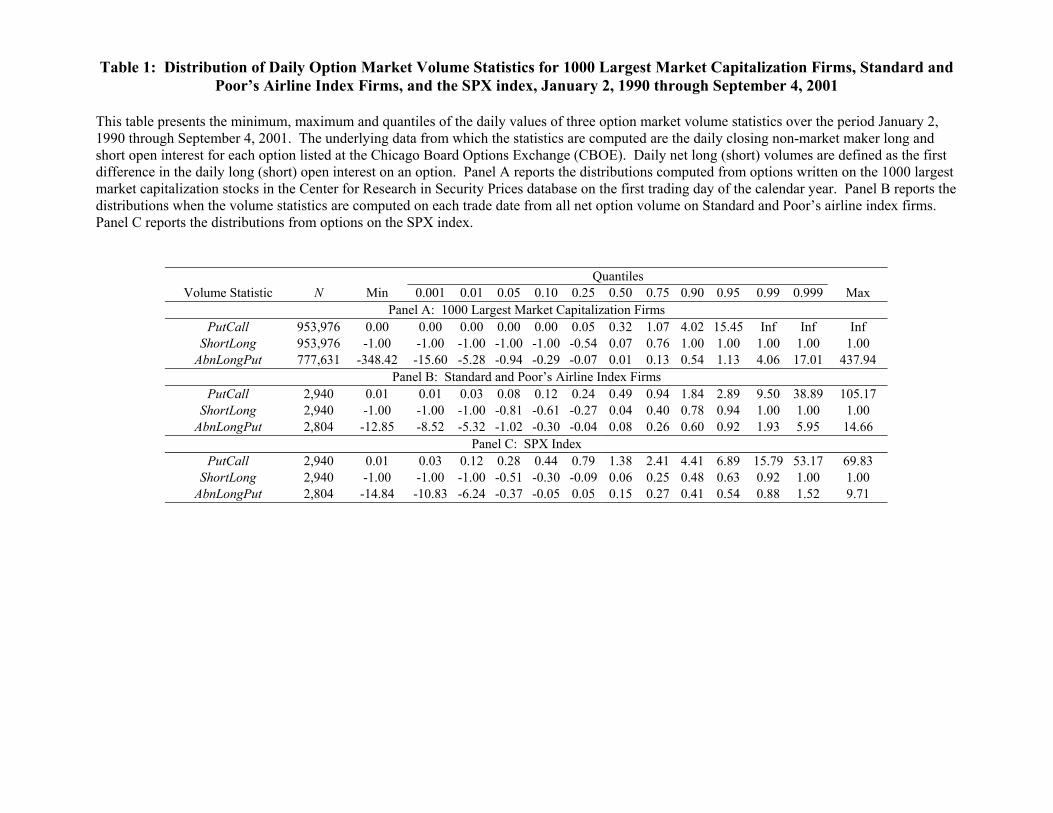
Table 1: Distribution of Daily Option Market Volume Statistics for 1000 Largest Market Capitalization Firms, Standard and Poor’s Airline Index Firms, and the SPX index, January 2, 1990 through September 4, 2001
This table presents the minimum, maximum and quantiles of the daily values of three option market volume statistics over the period January 2, 1990 through September 4, 2001. The underlying data from which the statistics are computed are the daily closing non-market maker long and short open interest for each option listed at the Chicago Board Options Exchange (CBOE). Daily net long (short) volumes are defined as the first difference in the daily long (short) open interest on an option. Panel A reports the distributions computed from options written on the 1000 largest market capitalization stocks in the Center for Research in Security Prices database on the first trading day of the calendar year. Panel B reports the distributions when the volume statistics are computed on each trade date from all net option volume on Standard and Poor’s airline index firms. Panel C reports the distributions from options on the SPX index.
Quantiles Volume Statistic N Min 0.001 0.01 0.05 0.10 0.25 0.50 0.75 0.90 0.95 0.99 0.999 Max
Panel A: 1000 Largest Market Capitalization Firms PutCall 953,976 0.00 0.00 0.00 0.00 0.00 0.05 0.32 1.07 4.02 15.45 Inf Inf Inf
ShortLong 953,976 -1.00
-1.00 -1.00 -1.00 -1.00 -0.54 0.07 0.76 1.00 1.00 1.00 1.00 1.00AbnLongPut 777,631 -348.42 -15.60 -5.28 -0.94 -0.29 -0.07 0.01 0.13 0.54 1.13 4.06 17.01 437.94
Panel B: Standard and Poor’s Airline Index Firms PutCall 2,940 0.01 0.01 0.03 0.08 0.12 0.24 0.49 0.94 1.84 2.89 9.50 38.89 105.17
ShortLong 2,940
-1.00 -1.00 -1.00 -0.81 -0.61 -0.27 0.04 0.40 0.78 0.94 1.00 1.00 1.00 AbnLongPut 2,804 -12.85 -8.52 -5.32 -1.02 -0.30 -0.04 0.08 0.26 0.60 0.92 1.93 5.95 14.66
Panel C: SPX Index PutCall 2,940 0.01 0.03 0.12 0.28 0.44 0.79 1.38 2.41 4.41 6.89 15.79 53.17 69.83
ShortLong 2,940
-1.00 -1.00 -1.00 -0.51 -0.30 -0.09 0.06 0.25 0.48 0.63 0.92 1.00 1.00AbnLongPut 2,804 -14.84 -10.83 -6.24 -0.37 -0.05 0.05 0.15 0.27 0.41 0.54 0.88 1.52 9.71

Table 2: Distribution of Daily Maximum of Option Market Volume Statistics over Four Trade Date Intervals for 1000 Largest Market Capitalization Firms, Standard and Poor’s Airline Index Firms, and the SPX index, January 2, 1990 through
September 4, 2001
This table presents the minimum, maximum and quantiles of the daily maximum over four trade date intervals of three option market volume statistics over the period January 2, 1990 through September 4, 2001. The underlying data from which the statistics are computed are the daily closing non-market maker long and short open interest for each option listed at the Chicago Board Options Exchange (CBOE). Daily net long (short) volumes are defined as the first difference in the daily long (short) open interest on an option. Panel A reports the distributions computed from options written on the 1000 largest market capitalization stocks in the Center for Research in Security Prices database on the first trading day of the calendar year. Panel B reports the distributions when the volume statistics are computed on each trade date from all net option volume on Standard and Poor’s airline index firms. Panel C reports the distributions from options on the SPX index.
QuantilesVolume Statistic N Min 0.001 0.01 0.05 0.10 0.25 0.50 0.75 0.90 0.95 0.99 0.999 Max
Panel A: 1000 Largest Market Capitalization Firms PutCallDaily Max 238,018 0.00 0.00 0.00 0.09 0.24 0.64 1.61 5.44 Inf Inf Inf Inf Inf
ShortLongDaily Max 238,018 -1.00
-1.00 -0.67 -0.16 0.06 0.47 0.91 1.00 1.00 1.00 1.00 1.00 1.00AbnLongPutDaily Max 194,730 -11.10 -0.37 -0.14 -0.06 -0.02 0.04 0.20 0.69 1.80 3.15 9.41 33.55 437.94
Panel B: Standard and Poor’s Airline Index Firms PutCallDaily Max 736 0.14 0.15 0.26 0.41 0.53 0.76 1.29 2.31 4.58 7.48 17.43 91.29 105.17
ShortLongDaily Max 736
-0.50 -0.49 -0.30 -0.07 0.05 0.25 0.52 0.87 1.00 1.00 1.00 1.00 1.00 AbnLongPutDaily Max 675 -1.72 -1.65 -1.21 -0.89 -0.76 -0.55 -0.29 0.26 1.05 1.74 5.92 22.87 23.87
Panel C: SPX Index PutCallDaily Max 736 0.57 0.58 0.84 1.14 1.37 1.96 3.25 5.57 9.00 13.35 30.78 66.75 69.83
ShortLongDaily Max 736
-0.19 -0.18 -0.06 0.02 0.08 0.18 0.32 0.54 0.76 0.89 1.00 1.00 1.00AbnLongPutDaily Max 701 -0.04 -0.04 0.02 0.10 0.13 0.21 0.31 0.47 0.67 0.85 1.34 9.15 9.71

Table 3: Quantile Regression of Option market Volume Statistics on Options Volume, Underlying Returns, Underlying Abnormal Trading Volumes, and Market Returns
This table reports the results of performing quantile regression of two option market volume statistics on a number of explanatory variables. The data consists of options on the 1000 largest market capitalization firms over the period from January 2, 1990 through September 4, 2001. The option volume data were obtained directly from the Chicago Board Options Exchange and all other data come from the Center for Research in Security Prices. The regression specification is
0 1 2 3 4 5 6 7
8 9 10
s s s s s s s st t t t t t t t
st t t t
OptVolStat OptVol RDay RWeek RMonth AbnVolDay AbnVolWeek AbnVolMonth
RVWDay RVWWeek RVWMonth
β β β β β β β β
β β β ε
= + + + + + + +
+ + + +
where s
tOptVolStat is the option volume statistic indicated in Panels A and B, either stPutCallStand or .s
tAbnLongPut stOptVol is the total
net options volume on underlying stock s on trade date t. The next three variables, ,stRDay ,s
tRWeek and ,stRMonth
1, are, respectively, the return
on underlying stock s on trade date t, the average daily return on stock s over trade dates − through t5t − and the average daily return on stock s over trade dates 21t − through 6.t − The next three variables, ,s
tAbnVolDay ,stAbnVolWeek and ,s
t
5tAbnVolMonth are, respectively, the
abnormal trading volume on stock s on trade date t and the average daily abnormal trading volumes on trade dates − through 1t − and trade dates 21t − through 6.t − ,tRVWDay ,tRVWWeek and tRVWMonth are, respectively, the CRSP value weighted market return on trade date t and the daily average CRSP value weighted market return on trade dates 5t − through 1t − and trade dates 21t − through 6.t − The t-Statistics reported in parentheses are computed assuming non-iid error terms using the sparsity estimation methods described in Koenker (2002).
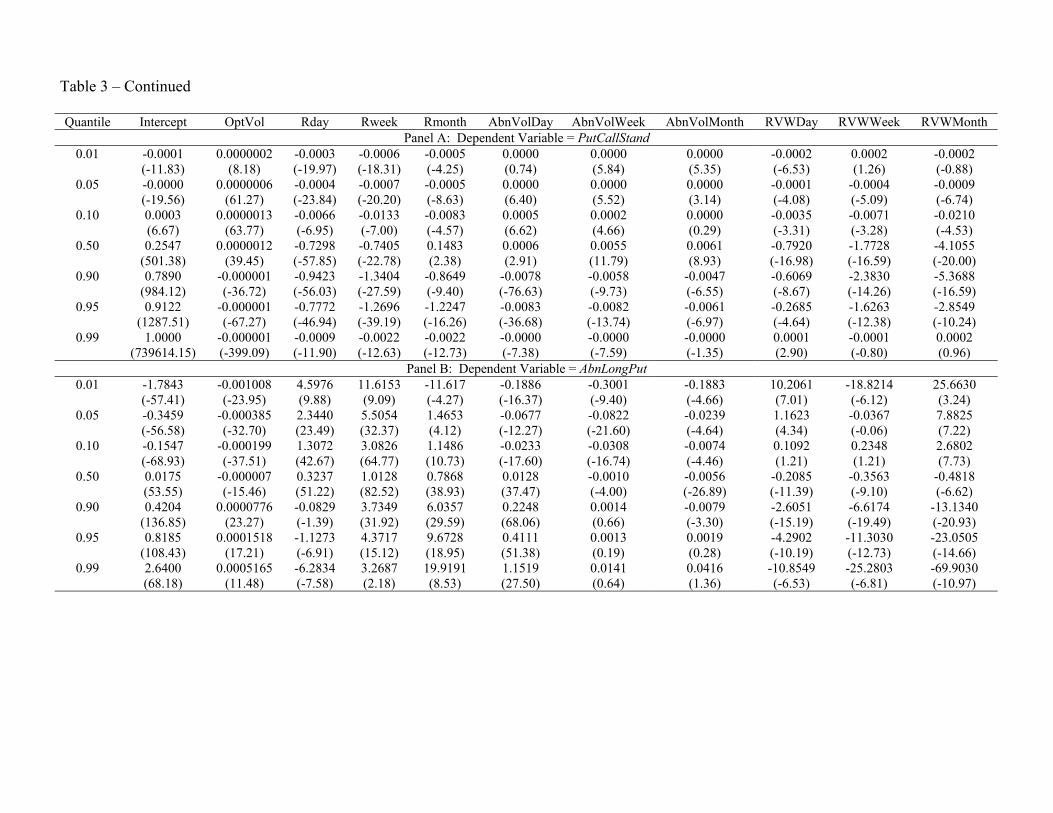
Table 3 – Continued
Quantile Intercept OptVol Rday Rweek Rmonth AbnVolDay AbnVolWeek AbnVolMonth RVWDay RVWWeek RVWMonthPanel A: Dependent Variable = PutCallStand
0.01 -0.0001 0.0000002 -0.0003 -0.0006 -0.0005 0.0000 0.0000 0.0000 -0.0002 0.0002 -0.0002(-11.83) (8.18) (-19.97) (-18.31) (-4.25) (0.74) (5.84) (5.35) (-6.53) (1.26) (-0.88)
0.05 -0.0000 0.0000006 -0.0004 -0.0007 -0.0005 0.0000 0.0000 0.0000 -0.0001 -0.0004 -0.0009(-19.56) (61.27) (-23.84) (-20.20) (-8.63) (6.40) (5.52) (3.14) (-4.08) (-5.09) (-6.74)
0.10 0.0003 0.0000013 -0.0066 -0.0133 -0.0083 0.0005 0.0002 0.0000 -0.0035 -0.0071 -0.0210(6.67) (63.77) (-6.95) (-7.00) (-4.57) (6.62) (4.66) (0.29) (-3.31) (-3.28) (-4.53)
0.50 0.2547 0.0000012 -0.7298 -0.7405 0.1483
0.0006 0.0055 0.0061 -0.7920 -1.7728 -4.1055(501.38) (39.45) (-57.85) (-22.78) (2.38) (2.91) (11.79) (8.93) (-16.98) (-16.59) (-20.00)
0.90 0.7890 -0.000001 -0.9423 -1.3404 -0.8649 -0.0078 -0.0058 -0.0047 -0.6069 -2.3830 -5.3688(984.12) (-36.72) (-56.03) (-27.59) (-9.40) (-76.63) (-9.73) (-6.55) (-8.67) (-14.26) (-16.59)
0.95 0.9122 -0.000001 -0.7772 -1.2696 -1.2247 -0.0083 -0.0082 -0.0061 -0.2685 -1.6263 -2.8549(1287.51) (-67.27) (-46.94) (-39.19) (-16.26) (-36.68) (-13.74) (-6.97) (-4.64) (-12.38) (-10.24)
0.99 1.0000 -0.000001
-0.0009 -0.0022 -0.0022 -0.0000 -0.0000 -0.0000 0.0001 -0.0001 0.0002(739614.15) (-399.09) (-11.90) (-12.63) (-12.73) (-7.38) (-7.59) (-1.35) (2.90) (-0.80) (0.96)
Panel B: Dependent Variable = AbnLongPut 0.01 -1.7843 -0.001008 4.5976 11.6153 -11.617 -0.1886 -0.3001 -0.1883 10.2061 -18.8214 25.6630
(-57.41) (-23.95) (9.88) (9.09) (-4.27) (-16.37) (-9.40) (-4.66) (7.01) (-6.12) (3.24)0.05 -0.3459 -0.000385 2.3440 5.5054 1.4653
-0.0677 -0.0822 -0.0239 1.1623 -0.0367 7.8825
(-56.58) (-32.70) (23.49) (32.37) (4.12) (-12.27) (-21.60) (-4.64) (4.34) (-0.06) (7.22)0.10 -0.1547 -0.000199 1.3072 3.0826 1.1486 -0.0233 -0.0308 -0.0074 0.1092 0.2348 2.6802
(-68.93) (-37.51) (42.67) (64.77) (10.73) (-17.60) (-16.74) (-4.46) (1.21) (1.21) (7.73)0.50 0.0175 -0.000007 0.3237 1.0128 0.7868 0.0128 -0.0010 -0.0056 -0.2085 -0.3563 -0.4818
(53.55) (-15.46) (51.22) (82.52) (38.93) (37.47) (-4.00) (-26.89) (-11.39) (-9.10) (-6.62)0.90 0.4204 0.0000776 -0.0829 3.7349 6.0357 0.2248 0.0014 -0.0079 -2.6051 -6.6174 -13.1340
(136.85) (23.27) (-1.39) (31.92) (29.59) (68.06) (0.66) (-3.30) (-15.19) (-19.49) (-20.93)0.95 0.8185 0.0001518 -1.1273 4.3717 9.6728 0.4111 0.0013 0.0019 -4.2902 -11.3030 -23.0505
(108.43) (17.21) (-6.91) (15.12) (18.95) (51.38) (0.19) (0.28) (-10.19) (-12.73) (-14.66)0.99 2.6400 0.0005165 -6.2834 3.2687
19.9191
1.1519 0.0141 0.0416 -10.8549 -25.2803 -69.9030
(68.18) (11.48) (-7.58) (2.18) (8.53) (27.50) (0.64) (1.36) (-6.53) (-6.81) (-10.97)

Table 4: AMR, UAL, Standard and Poor’s Airline Index, and SPX Option Market Volume Statistics on the Trading Days Surrounding September 11
This table reports the values of three option market volume statistics on AMR, UAL, the Standard and Poor’s airline index firm, and the SPX index over the four trade dates leading up to and following September 11, 2001. The underlying data from which the statistics are computed are the daily closing non-market maker long and short open interest for each option. Daily net long (short) volumes are defined as the first difference in the daily long (short) open interest on an option.
Prior to September 11 Post September 11 Volume Statistic 9/5/2001 9/6/2001 9/7/2001 9/10/2001 9/17/2001 9/18/2001 9/19/2001 9/20/2001
Panel A: AMR PutCall 0.75 0.68 0.73 7.07 0.45 1.28 0.99 1.67
ShortLong 0.16 -0.32 0.86 0.89 -0.91 -0.27 -0.37 0.34 AbnLongPut -0.02 0.08 0.65 3.83 -1.11 -1.49 1.83 -0.96
Panel B: UAL PutCall 7.40 105.42 15.21 1.66 0.44 0.55 0.66 5.59
ShortLong -0.87 0.87 0.24 -0.14 -0.18 0.02 -0.07 0.16 AbnLongPut -0.12 1.45 1.23 0.15 0.78 0.63 -0.21 3.79
Panel C: Standard and Poor’s Airline Index Firms PutCall 7.31 1.90 1.67 1.77 0.21 0.17 0.86 3.17
ShortLong -0.02 0.37 0.59 0.47 -0.65 -0.33 -0.08 -0.14 AbnLongPut -0.13 0.63 0.66 0.85 0.54 -0.66 1.03 2.76
Panel D: SPX Index PutCall 3.96 0.69 1.25 0.21 0.44 0.25 0.83 0.23
ShortLong 0.26 0.02 -0.13 -0.16 -0.05 -0.05 -0.18 -0.02 AbnLongPut -0.07 0.25 0.54 -0.09 -0.26 0.04 0.38 0.10
Table 5: Quantiles of Maximum Observed Values of Option Market Volume Statistics, September 5 through September 10
This table reports the quantiles of the maximum daily value of three option market volume statistics obtained over the four trade dates leading up to September 11, 2001. The underlying data from which the statistics are computed are the daily closing non-market maker long and short open interest for each option. Daily net long (short) volumes are defined as the first difference in the daily long (short) open interest on an option. Quantiles of the maximum observed value are reported for both the daily distributions of the statistics and the distribution of the maximum value of the statistics over disjoint four trade date intervals. The distributions were computed over the January 2, 1990 through September 4, 2001 time period.
Max Quantile of Quantile of Max. over Volume Statistic Observed Daily Distribution Four Trade Date Distribution
Panel A: AMR/UAL PutCall 105.42 0.97 0.89
ShortLong 0.89 0.80 0.49 AbnLongPut 3.83 0.99 0.96
Panel B: Standard and Poor’s Airline Index Firms PutCall 7.31 0.99 0.95
ShortLong 0.59 0.84 0.55 AbnLongPut 0.85 0.94 0.88
Panel C: SPX Index PutCall 3.96 0.88 0.62
ShortLong 0.26 0.76 0.38 AbnLongPut 0.54 0.95 0.82
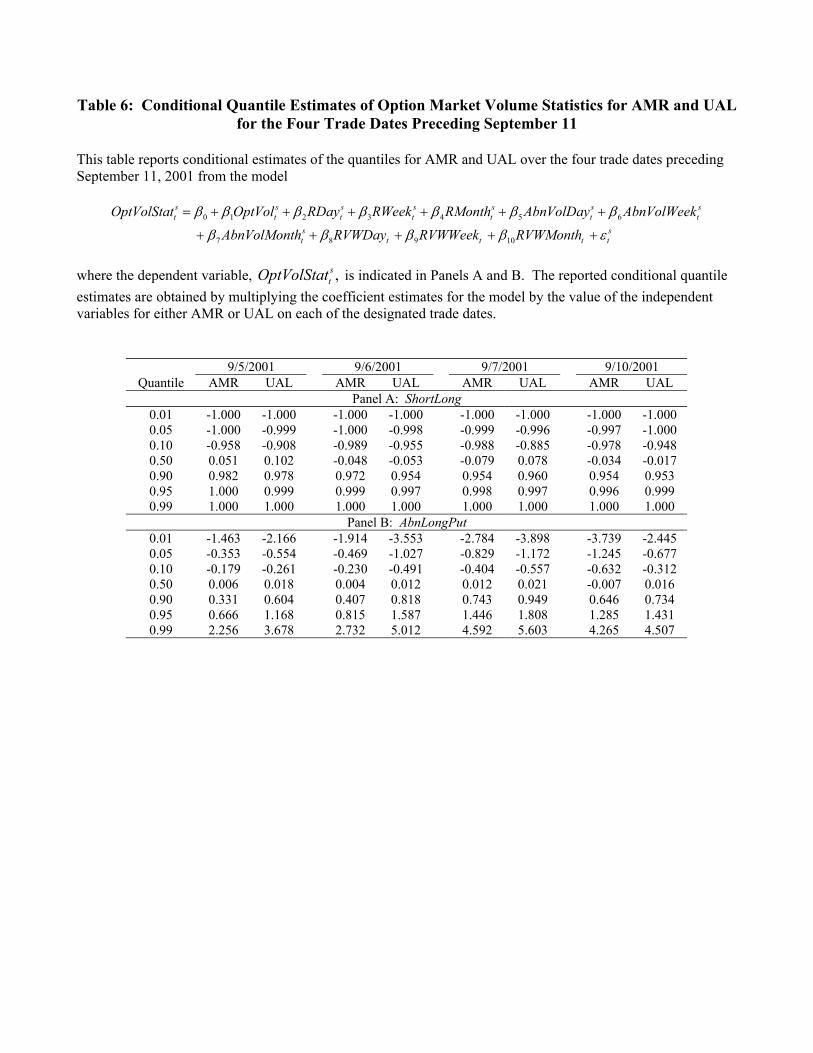
Table 6: Conditional Quantile Estimates of Option Market Volume Statistics for AMR and UAL for the Four Trade Dates Preceding September 11
This table reports conditional estimates of the quantiles for AMR and UAL over the four trade dates preceding September 11, 2001 from the model
0 1 2 3 4 5 6
7 8 9 10
s s s s s st t t t t t
s st t t t t
OptVolStat OptVol RDay RWeek RMonth AbnVolDay stAbnVolWeek
AbnVolMonth RVWDay RVWWeek RVWMonth
β β β β β β β
β β β β ε
= + + + + + +
+ + + + +
where the dependent variable, ,s
tOptVolStat is indicated in Panels A and B. The reported conditional quantile estimates are obtained by multiplying the coefficient estimates for the model by the value of the independent variables for either AMR or UAL on each of the designated trade dates.
9/5/2001 9/6/2001 9/7/2001 9/10/2001 Quantile AMR UAL AMR UAL AMR UAL AMR UAL
Panel A: ShortLong 0.01 -1.000 -1.000 -1.000 -1.000 -1.000 -1.000 -1.000 -1.000 0.05 -1.000 -0.999 -1.000 -0.998 -0.999 -0.996 -0.997 -1.000 0.10 -0.958 -0.908 -0.989 -0.955 -0.988 -0.885 -0.978 -0.948 0.50 0.051 0.102 -0.048 -0.053 -0.079 0.078 -0.034 -0.017 0.90 0.982 0.978 0.972 0.954 0.954 0.960 0.954 0.953 0.95 1.000 0.999 0.999 0.997 0.998 0.997 0.996 0.999 0.99 1.000 1.000 1.000 1.000 1.000 1.000 1.000 1.000
Panel B: AbnLongPut 0.01 -1.463 -2.166 -1.914 -3.553 -2.784 -3.898 -3.739 -2.445 0.05 -0.353 -0.554 -0.469 -1.027 -0.829 -1.172 -1.245 -0.677 0.10 -0.179 -0.261 -0.230 -0.491 -0.404 -0.557 -0.632 -0.312 0.50 0.006 0.018 0.004 0.012 0.012 0.021 -0.007 0.016 0.90 0.331 0.604 0.407 0.818 0.743 0.949 0.646 0.734 0.95 0.666 1.168 0.815 1.587 1.446 1.808 1.285 1.431 0.99 2.256 3.678 2.732 5.012 4.592 5.603 4.265 4.507