Unsupervised Deep Embedding for Clustering …proceedings.mlr.press/v48/xieb16.pdfUnsupervised Deep...
10
Unsupervised Deep Embedding for Clustering Analysis Junyuan Xie JXIE@CS. WASHINGTON. EDU University of Washington Ross Girshick RBG@FB. COM Facebook AI Research (FAIR) Ali Farhadi ALI @CS. WASHINGTON. EDU University of Washington Abstract Clustering is central to many data-driven appli- cation domains and has been studied extensively in terms of distance functions and grouping al- gorithms. Relatively little work has focused on learning representations for clustering. In this paper, we propose Deep Embedded Clustering (DEC), a method that simultaneously learns fea- ture representations and cluster assignments us- ing deep neural networks. DEC learns a map- ping from the data space to a lower-dimensional feature space in which it iteratively optimizes a clustering objective. Our experimental evalua- tions on image and text corpora show significant improvement over state-of-the-art methods. 1. Introduction Clustering, an essential data analysis and visualization tool, has been studied extensively in unsupervised machine learning from different perspectives: What defines a clus- ter? What is the right distance metric? How to efficiently group instances into clusters? How to validate clusters? And so on. Numerous different distance functions and em- bedding methods have been explored in the literature. Rel- atively little work has focused on the unsupervised learning of the feature space in which to perform clustering. A notion of distance or dissimilarity is central to data clus- tering algorithms. Distance, in turn, relies on represent- ing the data in a feature space. The k-means cluster- ing algorithm (MacQueen et al., 1967), for example, uses the Euclidean distance between points in a given feature space, which for images might be raw pixels or gradient- Proceedings of the 33 rd International Conference on Machine Learning, New York, NY, USA, 2016. JMLR: W&CP volume 48. Copyright 2016 by the author(s). orientation histograms. The choice of feature space is cus- tomarily left as an application-specific detail for the end- user to determine. Yet it is clear that the choice of feature space is crucial; for all but the simplest image datasets, clustering with Euclidean distance on raw pixels is com- pletely ineffective. In this paper, we revisit cluster analysis and ask: Can we use a data driven approach to solve for the feature space and cluster memberships jointly? We take inspiration from recent work on deep learning for computer vision (Krizhevsky et al., 2012; Girshick et al., 2014; Zeiler & Fergus, 2014; Long et al., 2014), where clear gains on benchmark tasks have resulted from learn- ing better features. These improvements, however, were obtained with supervised learning, whereas our goal is un- supervised data clustering. To this end, we define a pa- rameterized non-linear mapping from the data space X to a lower-dimensional feature space Z , where we optimize a clustering objective. Unlike previous work, which oper- ates on the data space or a shallow linear embedded space, we use stochastic gradient descent (SGD) via backpropaga- tion on a clustering objective to learn the mapping, which is parameterized by a deep neural network. We refer to this clustering algorithm as Deep Embedded Clustering, or DEC. Optimizing DEC is challenging. We want to simultane- ously solve for cluster assignment and the underlying fea- ture representation. However, unlike in supervised learn- ing, we cannot train our deep network with labeled data. Instead we propose to iteratively refine clusters with an auxiliary target distribution derived from the current soft cluster assignment. This process gradually improves the clustering as well as the feature representation. Our experiments show significant improvements over state- of-the-art clustering methods in terms of both accuracy and running time on image and textual datasets. We evaluate DEC on MNIST (LeCun et al., 1998), STL (Coates et al.,
Transcript of Unsupervised Deep Embedding for Clustering …proceedings.mlr.press/v48/xieb16.pdfUnsupervised Deep...
Unsupervised Deep Embedding for Clustering Analysis
Junyuan Xie [email protected]
University of Washington
Ross Girshick [email protected]
Facebook AI Research (FAIR)
Ali Farhadi [email protected]
University of Washington
AbstractClustering is central to many data-driven appli-cation domains and has been studied extensivelyin terms of distance functions and grouping al-gorithms. Relatively little work has focused onlearning representations for clustering. In thispaper, we propose Deep Embedded Clustering(DEC), a method that simultaneously learns fea-ture representations and cluster assignments us-ing deep neural networks. DEC learns a map-ping from the data space to a lower-dimensionalfeature space in which it iteratively optimizes aclustering objective. Our experimental evalua-tions on image and text corpora show significantimprovement over state-of-the-art methods.
1. IntroductionClustering, an essential data analysis and visualizationtool, has been studied extensively in unsupervised machinelearning from different perspectives: What defines a clus-ter? What is the right distance metric? How to efficientlygroup instances into clusters? How to validate clusters?And so on. Numerous different distance functions and em-bedding methods have been explored in the literature. Rel-atively little work has focused on the unsupervised learningof the feature space in which to perform clustering.
A notion of distance or dissimilarity is central to data clus-tering algorithms. Distance, in turn, relies on represent-ing the data in a feature space. The k-means cluster-ing algorithm (MacQueen et al., 1967), for example, usesthe Euclidean distance between points in a given featurespace, which for images might be raw pixels or gradient-
Proceedings of the 33 rd International Conference on MachineLearning, New York, NY, USA, 2016. JMLR: W&CP volume48. Copyright 2016 by the author(s).
orientation histograms. The choice of feature space is cus-tomarily left as an application-specific detail for the end-user to determine. Yet it is clear that the choice of featurespace is crucial; for all but the simplest image datasets,clustering with Euclidean distance on raw pixels is com-pletely ineffective. In this paper, we revisit cluster analysisand ask: Can we use a data driven approach to solve forthe feature space and cluster memberships jointly?
We take inspiration from recent work on deep learning forcomputer vision (Krizhevsky et al., 2012; Girshick et al.,2014; Zeiler & Fergus, 2014; Long et al., 2014), whereclear gains on benchmark tasks have resulted from learn-ing better features. These improvements, however, wereobtained with supervised learning, whereas our goal is un-supervised data clustering. To this end, we define a pa-rameterized non-linear mapping from the data space X toa lower-dimensional feature space Z, where we optimizea clustering objective. Unlike previous work, which oper-ates on the data space or a shallow linear embedded space,we use stochastic gradient descent (SGD) via backpropaga-tion on a clustering objective to learn the mapping, whichis parameterized by a deep neural network. We refer tothis clustering algorithm as Deep Embedded Clustering, orDEC.
Optimizing DEC is challenging. We want to simultane-ously solve for cluster assignment and the underlying fea-ture representation. However, unlike in supervised learn-ing, we cannot train our deep network with labeled data.Instead we propose to iteratively refine clusters with anauxiliary target distribution derived from the current softcluster assignment. This process gradually improves theclustering as well as the feature representation.
Our experiments show significant improvements over state-of-the-art clustering methods in terms of both accuracy andrunning time on image and textual datasets. We evaluateDEC on MNIST (LeCun et al., 1998), STL (Coates et al.,
Unsupervised Deep Embedding for Clustering Analysis
2011), and REUTERS (Lewis et al., 2004), comparing itwith standard and state-of-the-art clustering methods (Nieet al., 2011; Yang et al., 2010). In addition, our experimentsshow that DEC is significantly less sensitive to the choiceof hyperparameters compared to state-of-the-art methods.This robustness is an important property of our clusteringalgorithm since, when applied to real data, supervision isnot available for hyperparameter cross-validation.
Our contributions are: (a) joint optimization of deep em-bedding and clustering; (b) a novel iterative refinementvia soft assignment; and (c) state-of-the-art clustering re-sults in terms of clustering accuracy and speed. Our Caffe-based (Jia et al., 2014) implementation of DEC is availableat https://github.com/piiswrong/dec.
2. Related workClustering has been extensively studied in machine learn-ing in terms of feature selection (Boutsidis et al., 2009; Liu& Yu, 2005; Alelyani et al., 2013), distance functions (Xinget al., 2002; Xiang et al., 2008), grouping methods (Mac-Queen et al., 1967; Von Luxburg, 2007; Li et al., 2004),and cluster validation (Halkidi et al., 2001). Space doesnot allow for a comprehensive literature study and we referreaders to (Aggarwal & Reddy, 2013) for a survey.
One branch of popular methods for clustering is k-means (MacQueen et al., 1967) and Gaussian MixtureModels (GMM) (Bishop, 2006). These methods are fastand applicable to a wide range of problems. However, theirdistance metrics are limited to the original data space andthey tend to be ineffective when input dimensionality ishigh (Steinbach et al., 2004).
Several variants of k-means have been proposed to addressissues with higher-dimensional input spaces. De la Torre &Kanade (2006); Ye et al. (2008) perform joint dimension-ality reduction and clustering by first clustering the datawith k-means and then projecting the data into a lower di-mensions where the inter-cluster variance is maximized.This process is repeated in EM-style iterations until conver-gence. However, this framework is limited to linear embed-ding; our method employs deep neural networks to performnon-linear embedding that is necessary for more complexdata.
Spectral clustering and its variants have gained popular-ity recently (Von Luxburg, 2007). They allow more flex-ible distance metrics and generally perform better than k-means. Combining spectral clustering and embedding hasbeen explored in Yang et al. (2010); Nie et al. (2011). Tianet al. (2014) proposes an algorithm based on spectral clus-tering, but replaces eigenvalue decomposition with deepautoencoder, which improves performance but further in-creases memory consumption.
Most spectral clustering algorithms need to compute thefull graph Laplacian matrix and therefore have quadraticor super quadratic complexities in the number of datapoints. This means they need specialized machines withlarge memory for any dataset larger than a few tens ofthousands of points. In order to scale spectral clusteringto large datasets, approximate algorithms were invented totrade off performance for speed (Yan et al., 2009). Ourmethod, however, is linear in the number of data points andscales gracefully to large datasets.
Minimizing the Kullback-Leibler (KL) divergence be-tween a data distribution and an embedded distribution hasbeen used for data visualization and dimensionality reduc-tion (van der Maaten & Hinton, 2008). T-SNE, for instance,is a non-parametric algorithm in this school and a paramet-ric variant of t-SNE (van der Maaten, 2009) uses deep neu-ral network to parametrize the embedding. The complexityof t-SNE is O(n2), where n is the number of data points,but it can be approximated in O(n log n) (van Der Maaten,2014).
We take inspiration from parametric t-SNE. Instead of min-imizing KL divergence to produce an embedding that isfaithful to distances in the original data space, we definea centroid-based probability distribution and minimize itsKL divergence to an auxiliary target distribution to simul-taneously improve clustering assignment and feature repre-sentation. A centroid-based method also has the benefit ofreducing complexity to O(nk), where k is the number ofcentroids.
3. Deep embedded clusteringConsider the problem of clustering a set of n points {xi ∈X}ni=1 into k clusters, each represented by a centroidµj , j = 1, . . . , k. Instead of clustering directly in the dataspace X , we propose to first transform the data with a non-linear mapping fθ : X → Z, where θ are learnable pa-rameters and Z is the latent feature space. The dimen-sionality of Z is typically much smaller than X in orderto avoid the “curse of dimensionality” (Bellman, 1961). Toparametrize fθ, deep neural networks (DNNs) are a natu-ral choice due to their theoretical function approximationproperties (Hornik, 1991) and their demonstrated featurelearning capabilities (Bengio et al., 2013).
The proposed algorithm (DEC) clusters data by simultane-ously learning a set of k cluster centers {µj ∈ Z}kj=1 in thefeature space Z and the parameters θ of the DNN that mapsdata points into Z. DEC has two phases: (1) parameter ini-tialization with a deep autoencoder (Vincent et al., 2010)and (2) parameter optimization (i.e., clustering), where weiterate between computing an auxiliary target distributionand minimizing the Kullback–Leibler (KL) divergence to
Unsupervised Deep Embedding for Clustering Analysis
it. We start by describing phase (2) parameter optimiza-tion/clustering, given an initial estimate of θ and {µj}kj=1.
3.1. Clustering with KL divergence
Given an initial estimate of the non-linear mapping fθ andthe initial cluster centroids {µj}kj=1, we propose to im-prove the clustering using an unsupervised algorithm thatalternates between two steps. In the first step, we com-pute a soft assignment between the embedded points andthe cluster centroids. In the second step, we update thedeep mapping fθ and refine the cluster centroids by learn-ing from current high confidence assignments using an aux-iliary target distribution. This process is repeated until aconvergence criterion is met.
3.1.1. SOFT ASSIGNMENT
Following van der Maaten & Hinton (2008) we use the Stu-dent’s t-distribution as a kernel to measure the similaritybetween embedded point zi and centroid µj :
qij =(1 + ‖zi − µj‖2/α)−
α+12∑
j′(1 + ‖zi − µj′‖2/α)−α+12
, (1)
where zi = fθ(xi) ∈ Z corresponds to xi ∈ X after em-bedding, α are the degrees of freedom of the Student’s t-distribution and qij can be interpreted as the probabilityof assigning sample i to cluster j (i.e., a soft assignment).Since we cannot cross-validate α on a validation set in theunsupervised setting, and learning it is superfluous (van derMaaten, 2009), we let α = 1 for all experiments.
3.1.2. KL DIVERGENCE MINIMIZATION
We propose to iteratively refine the clusters by learningfrom their high confidence assignments with the help ofan auxiliary target distribution. Specifically, our model istrained by matching the soft assignment to the target distri-bution. To this end, we define our objective as a KL diver-gence loss between the soft assignments qi and the auxil-iary distribution pi as follows:
L = KL(P‖Q) =∑i
∑j
pij logpijqij. (2)
The choice of target distributions P is crucial for DEC’sperformance. A naive approach would be setting each pi toa delta distribution (to the nearest centroid) for data pointsabove a confidence threshold and ignore the rest. How-ever, because qi are soft assignments, it is more naturaland flexible to use softer probabilistic targets. Specifically,we would like our target distribution to have the followingproperties: (1) strengthen predictions (i.e., improve clus-ter purity), (2) put more emphasis on data points assignedwith high confidence, and (3) normalize loss contribution
of each centroid to prevent large clusters from distortingthe hidden feature space.
In our experiments, we compute pi by first raising qi tothe second power and then normalizing by frequency percluster:
pij =q2ij/fj∑j′ q
2ij′/fj′
, (3)
where fj =∑i qij are soft cluster frequencies. Please
refer to section 5.1 for discussions on empirical propertiesof L and P .
Our training strategy can be seen as a form of self-training (Nigam & Ghani, 2000). As in self-training, wetake an initial classifier and an unlabeled dataset, then la-bel the dataset with the classifier in order to train on itsown high confidence predictions. Indeed, in experimentswe observe that DEC improves upon the initial estimatein each iteration by learning from high confidence predic-tions, which in turn helps to improve low confidence ones.
3.1.3. OPTIMIZATION
We jointly optimize the cluster centers {µj} and DNN pa-rameters θ using Stochastic Gradient Descent (SGD) withmomentum. The gradients of L with respect to feature-space embedding of each data point zi and each clustercentroid µj are computed as:
∂L
∂zi=
α+ 1
α
∑j
(1 +‖zi − µj‖2
α)−1 (4)
×(pij − qij)(zi − µj),∂L
∂µj= −α+ 1
α
∑i
(1 +‖zi − µj‖2
α)−1 (5)
×(pij − qij)(zi − µj).
The gradients ∂L/∂zi are then passed down to the DNNand used in standard backpropagation to compute theDNN’s parameter gradient ∂L/∂θ. For the purpose of dis-covering cluster assignments, we stop our procedure whenless than tol% of points change cluster assignment betweentwo consecutive iterations.
3.2. Parameter initialization
Thus far we have discussed how DEC proceeds given ini-tial estimates of the DNN parameters θ and the cluster cen-troids {µj}. Now we discuss how the parameters and cen-troids are initialized.
We initialize DEC with a stacked autoencoder (SAE) be-cause recent research has shown that they consistently pro-duce semantically meaningful and well-separated represen-tations on real-world datasets (Vincent et al., 2010; Hin-ton & Salakhutdinov, 2006; Le, 2013). Thus the unsuper-
Unsupervised Deep Embedding for Clustering Analysis
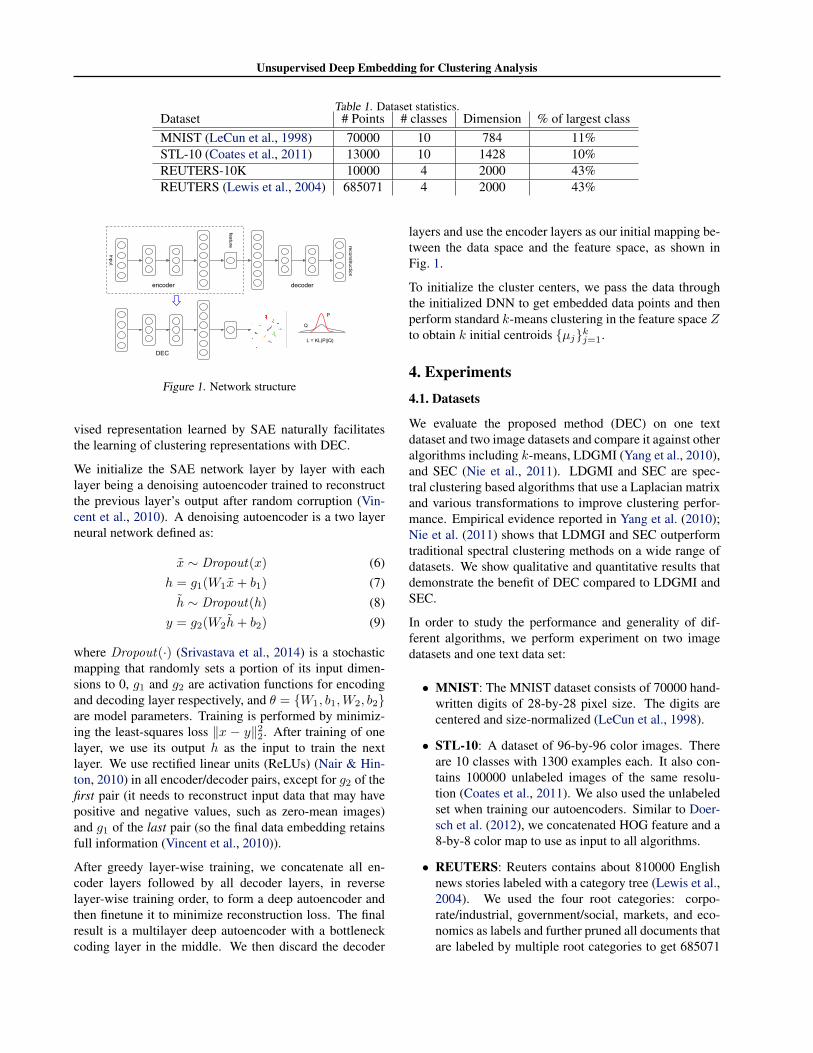
Table 1. Dataset statistics.Dataset # Points # classes Dimension % of largest classMNIST (LeCun et al., 1998) 70000 10 784 11%STL-10 (Coates et al., 2011) 13000 10 1428 10%REUTERS-10K 10000 4 2000 43%REUTERS (Lewis et al., 2004) 685071 4 2000 43%
P
Q
L = KL(P||Q)
encoder decoder
DEC
input
reconstruction
feature
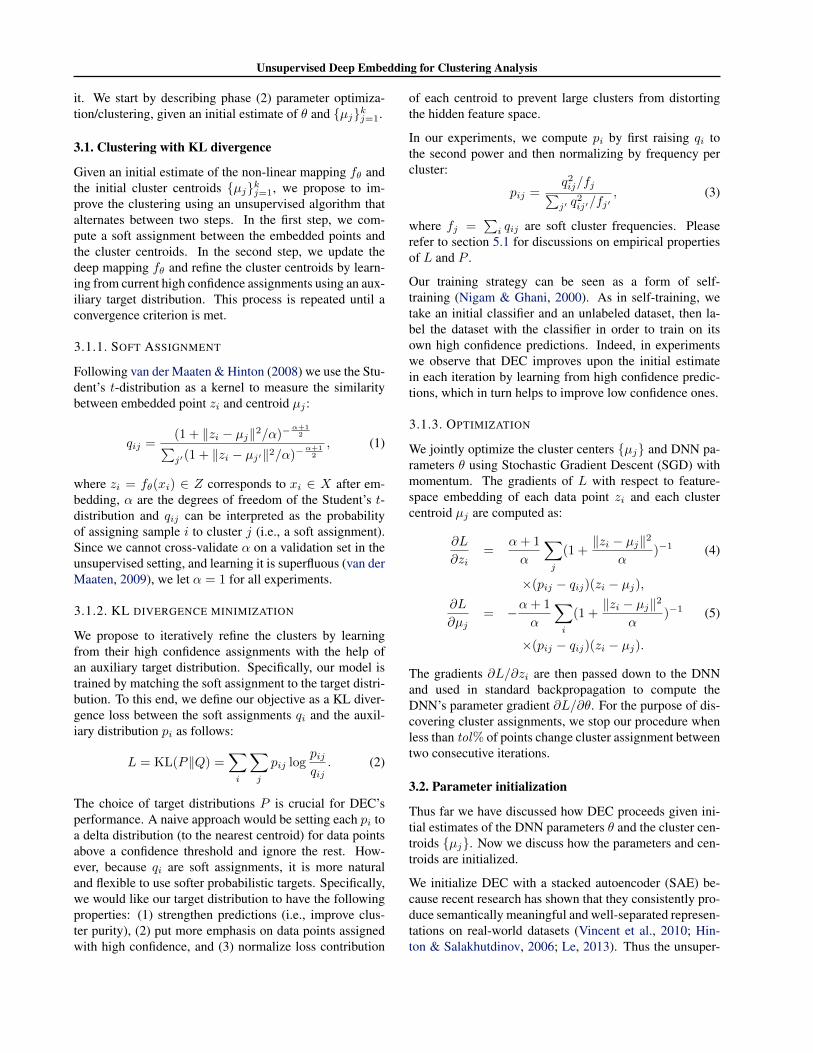
Figure 1. Network structure
vised representation learned by SAE naturally facilitatesthe learning of clustering representations with DEC.
We initialize the SAE network layer by layer with eachlayer being a denoising autoencoder trained to reconstructthe previous layer’s output after random corruption (Vin-cent et al., 2010). A denoising autoencoder is a two layerneural network defined as:
x ∼ Dropout(x) (6)h = g1(W1x+ b1) (7)h ∼ Dropout(h) (8)
y = g2(W2h+ b2) (9)
where Dropout(·) (Srivastava et al., 2014) is a stochasticmapping that randomly sets a portion of its input dimen-sions to 0, g1 and g2 are activation functions for encodingand decoding layer respectively, and θ = {W1, b1,W2, b2}are model parameters. Training is performed by minimiz-ing the least-squares loss ‖x − y‖22. After training of onelayer, we use its output h as the input to train the nextlayer. We use rectified linear units (ReLUs) (Nair & Hin-ton, 2010) in all encoder/decoder pairs, except for g2 of thefirst pair (it needs to reconstruct input data that may havepositive and negative values, such as zero-mean images)and g1 of the last pair (so the final data embedding retainsfull information (Vincent et al., 2010)).
After greedy layer-wise training, we concatenate all en-coder layers followed by all decoder layers, in reverselayer-wise training order, to form a deep autoencoder andthen finetune it to minimize reconstruction loss. The finalresult is a multilayer deep autoencoder with a bottleneckcoding layer in the middle. We then discard the decoder
layers and use the encoder layers as our initial mapping be-tween the data space and the feature space, as shown inFig. 1.
To initialize the cluster centers, we pass the data throughthe initialized DNN to get embedded data points and thenperform standard k-means clustering in the feature space Zto obtain k initial centroids {µj}kj=1.
4. Experiments4.1. Datasets
We evaluate the proposed method (DEC) on one textdataset and two image datasets and compare it against otheralgorithms including k-means, LDGMI (Yang et al., 2010),and SEC (Nie et al., 2011). LDGMI and SEC are spec-tral clustering based algorithms that use a Laplacian matrixand various transformations to improve clustering perfor-mance. Empirical evidence reported in Yang et al. (2010);Nie et al. (2011) shows that LDMGI and SEC outperformtraditional spectral clustering methods on a wide range ofdatasets. We show qualitative and quantitative results thatdemonstrate the benefit of DEC compared to LDGMI andSEC.
In order to study the performance and generality of dif-ferent algorithms, we perform experiment on two imagedatasets and one text data set:
• MNIST: The MNIST dataset consists of 70000 hand-written digits of 28-by-28 pixel size. The digits arecentered and size-normalized (LeCun et al., 1998).
• STL-10: A dataset of 96-by-96 color images. Thereare 10 classes with 1300 examples each. It also con-tains 100000 unlabeled images of the same resolu-tion (Coates et al., 2011). We also used the unlabeledset when training our autoencoders. Similar to Doer-sch et al. (2012), we concatenated HOG feature and a8-by-8 color map to use as input to all algorithms.
• REUTERS: Reuters contains about 810000 Englishnews stories labeled with a category tree (Lewis et al.,2004). We used the four root categories: corpo-rate/industrial, government/social, markets, and eco-nomics as labels and further pruned all documents thatare labeled by multiple root categories to get 685071
Unsupervised Deep Embedding for Clustering Analysis
2 4 6 80.5
0.55
0.6
0.65
0.7
0.75
0.8
0.85
0.9
Acc
urac
y
Parameter IndexMNIST
DEC DEC w/o backprop Kmeans LDGMI SEC
2 4 6 8
0.2
0.25
0.3
0.35
0.4
Acc
urac
yParameter Index
STL
2 4 6 80.35
0.4
0.45
0.5
0.55
0.6
0.65
0.7
0.75
Acc
urac
y
Parameter IndexREUTERS−10K
2 4 6 80.5
0.55
0.6
0.65
0.7
0.75
0.8
0.85
Acc
urac
y
Parameter IndexREUTERS
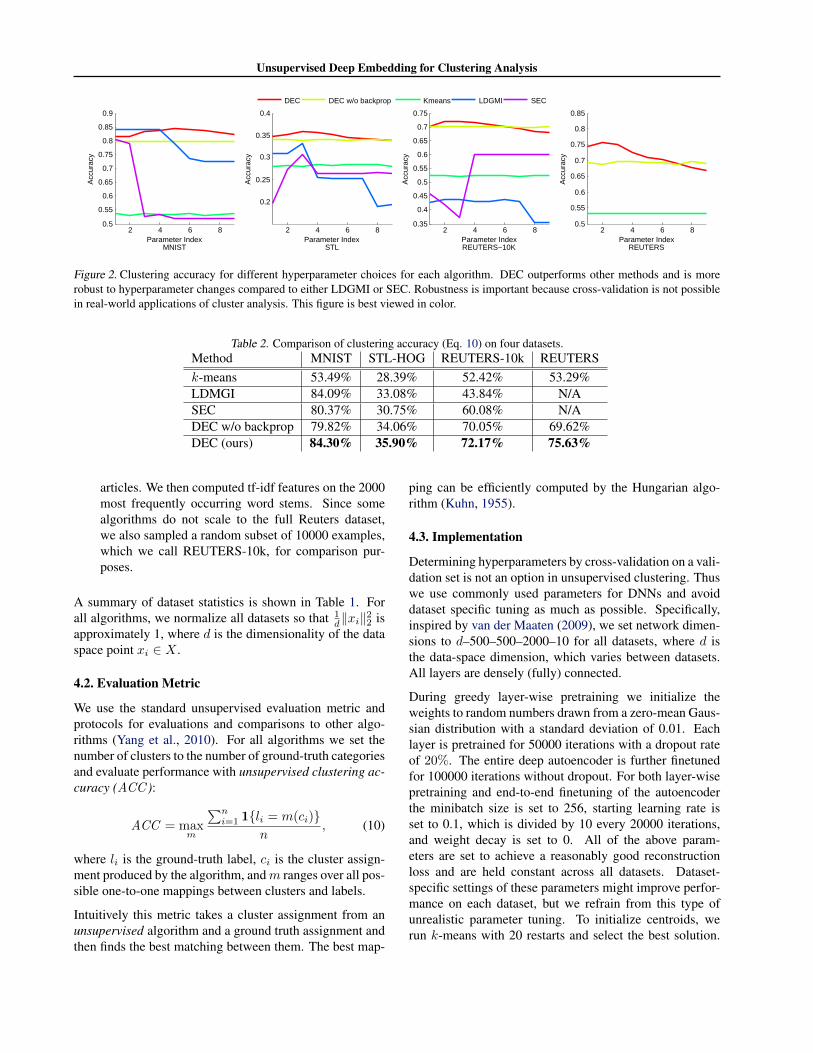
Figure 2. Clustering accuracy for different hyperparameter choices for each algorithm. DEC outperforms other methods and is morerobust to hyperparameter changes compared to either LDGMI or SEC. Robustness is important because cross-validation is not possiblein real-world applications of cluster analysis. This figure is best viewed in color.
Table 2. Comparison of clustering accuracy (Eq. 10) on four datasets.Method MNIST STL-HOG REUTERS-10k REUTERSk-means 53.49% 28.39% 52.42% 53.29%LDMGI 84.09% 33.08% 43.84% N/ASEC 80.37% 30.75% 60.08% N/ADEC w/o backprop 79.82% 34.06% 70.05% 69.62%DEC (ours) 84.30% 35.90% 72.17% 75.63%
articles. We then computed tf-idf features on the 2000most frequently occurring word stems. Since somealgorithms do not scale to the full Reuters dataset,we also sampled a random subset of 10000 examples,which we call REUTERS-10k, for comparison pur-poses.
A summary of dataset statistics is shown in Table 1. Forall algorithms, we normalize all datasets so that 1
d‖xi‖22 is
approximately 1, where d is the dimensionality of the dataspace point xi ∈ X .
4.2. Evaluation Metric
We use the standard unsupervised evaluation metric andprotocols for evaluations and comparisons to other algo-rithms (Yang et al., 2010). For all algorithms we set thenumber of clusters to the number of ground-truth categoriesand evaluate performance with unsupervised clustering ac-curacy (ACC ):
ACC = maxm
∑ni=1 1{li = m(ci)}
n, (10)
where li is the ground-truth label, ci is the cluster assign-ment produced by the algorithm, andm ranges over all pos-sible one-to-one mappings between clusters and labels.
Intuitively this metric takes a cluster assignment from anunsupervised algorithm and a ground truth assignment andthen finds the best matching between them. The best map-
ping can be efficiently computed by the Hungarian algo-rithm (Kuhn, 1955).
4.3. Implementation
Determining hyperparameters by cross-validation on a vali-dation set is not an option in unsupervised clustering. Thuswe use commonly used parameters for DNNs and avoiddataset specific tuning as much as possible. Specifically,inspired by van der Maaten (2009), we set network dimen-sions to d–500–500–2000–10 for all datasets, where d isthe data-space dimension, which varies between datasets.All layers are densely (fully) connected.
During greedy layer-wise pretraining we initialize theweights to random numbers drawn from a zero-mean Gaus-sian distribution with a standard deviation of 0.01. Eachlayer is pretrained for 50000 iterations with a dropout rateof 20%. The entire deep autoencoder is further finetunedfor 100000 iterations without dropout. For both layer-wisepretraining and end-to-end finetuning of the autoencoderthe minibatch size is set to 256, starting learning rate isset to 0.1, which is divided by 10 every 20000 iterations,and weight decay is set to 0. All of the above param-eters are set to achieve a reasonably good reconstructionloss and are held constant across all datasets. Dataset-specific settings of these parameters might improve perfor-mance on each dataset, but we refrain from this type ofunrealistic parameter tuning. To initialize centroids, werun k-means with 20 restarts and select the best solution.
Unsupervised Deep Embedding for Clustering Analysis
(a) MNIST (b) STL-10
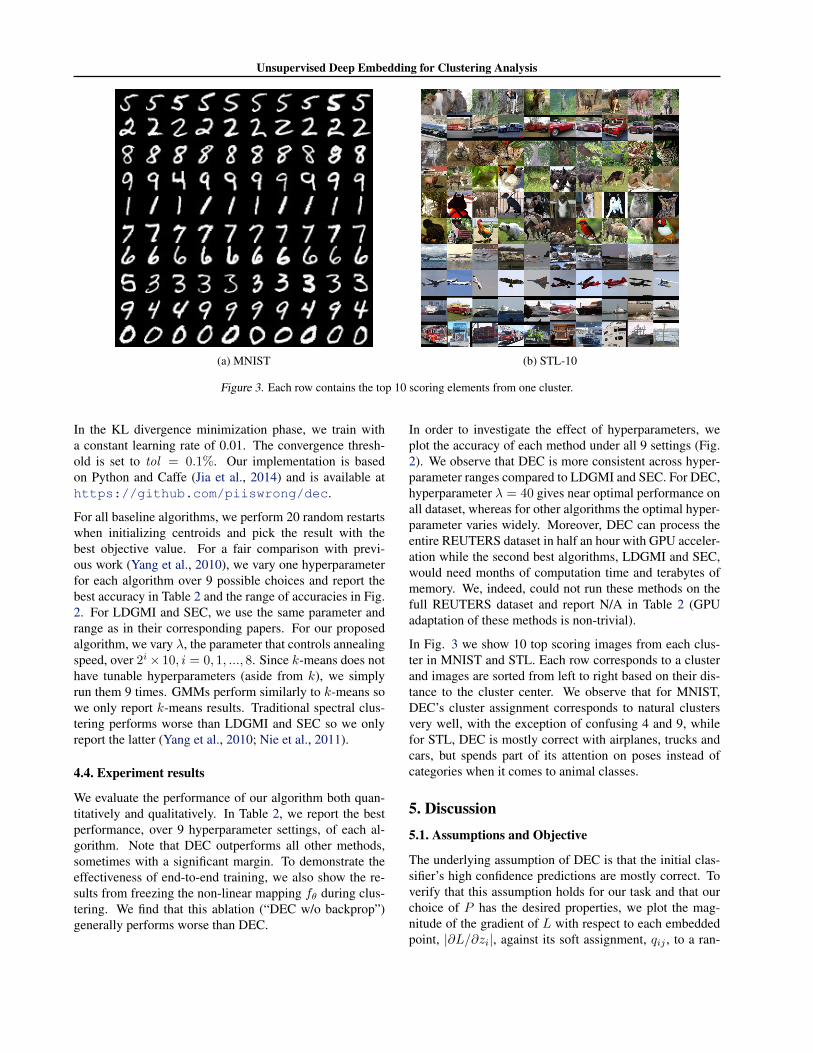
Figure 3. Each row contains the top 10 scoring elements from one cluster.
In the KL divergence minimization phase, we train witha constant learning rate of 0.01. The convergence thresh-old is set to tol = 0.1%. Our implementation is basedon Python and Caffe (Jia et al., 2014) and is available athttps://github.com/piiswrong/dec.
For all baseline algorithms, we perform 20 random restartswhen initializing centroids and pick the result with thebest objective value. For a fair comparison with previ-ous work (Yang et al., 2010), we vary one hyperparameterfor each algorithm over 9 possible choices and report thebest accuracy in Table 2 and the range of accuracies in Fig.2. For LDGMI and SEC, we use the same parameter andrange as in their corresponding papers. For our proposedalgorithm, we vary λ, the parameter that controls annealingspeed, over 2i× 10, i = 0, 1, ..., 8. Since k-means does nothave tunable hyperparameters (aside from k), we simplyrun them 9 times. GMMs perform similarly to k-means sowe only report k-means results. Traditional spectral clus-tering performs worse than LDGMI and SEC so we onlyreport the latter (Yang et al., 2010; Nie et al., 2011).
4.4. Experiment results
We evaluate the performance of our algorithm both quan-titatively and qualitatively. In Table 2, we report the bestperformance, over 9 hyperparameter settings, of each al-gorithm. Note that DEC outperforms all other methods,sometimes with a significant margin. To demonstrate theeffectiveness of end-to-end training, we also show the re-sults from freezing the non-linear mapping fθ during clus-tering. We find that this ablation (“DEC w/o backprop”)generally performs worse than DEC.
In order to investigate the effect of hyperparameters, weplot the accuracy of each method under all 9 settings (Fig.2). We observe that DEC is more consistent across hyper-parameter ranges compared to LDGMI and SEC. For DEC,hyperparameter λ = 40 gives near optimal performance onall dataset, whereas for other algorithms the optimal hyper-parameter varies widely. Moreover, DEC can process theentire REUTERS dataset in half an hour with GPU acceler-ation while the second best algorithms, LDGMI and SEC,would need months of computation time and terabytes ofmemory. We, indeed, could not run these methods on thefull REUTERS dataset and report N/A in Table 2 (GPUadaptation of these methods is non-trivial).
In Fig. 3 we show 10 top scoring images from each clus-ter in MNIST and STL. Each row corresponds to a clusterand images are sorted from left to right based on their dis-tance to the cluster center. We observe that for MNIST,DEC’s cluster assignment corresponds to natural clustersvery well, with the exception of confusing 4 and 9, whilefor STL, DEC is mostly correct with airplanes, trucks andcars, but spends part of its attention on poses instead ofcategories when it comes to animal classes.
5. Discussion5.1. Assumptions and Objective
The underlying assumption of DEC is that the initial clas-sifier’s high confidence predictions are mostly correct. Toverify that this assumption holds for our task and that ourchoice of P has the desired properties, we plot the mag-nitude of the gradient of L with respect to each embeddedpoint, |∂L/∂zi|, against its soft assignment, qij , to a ran-
Unsupervised Deep Embedding for Clustering Analysis
(a) Epoch 0 (b) Epoch 3 (c) Epoch 6
(d) Epoch 9 (e) Epoch 12
0 10 20 30
0.79
0.8
0.81
0.82
0.83
0.84
Accuracy
Epochs
k-means initialization
(f) Accuracy vs. epochs
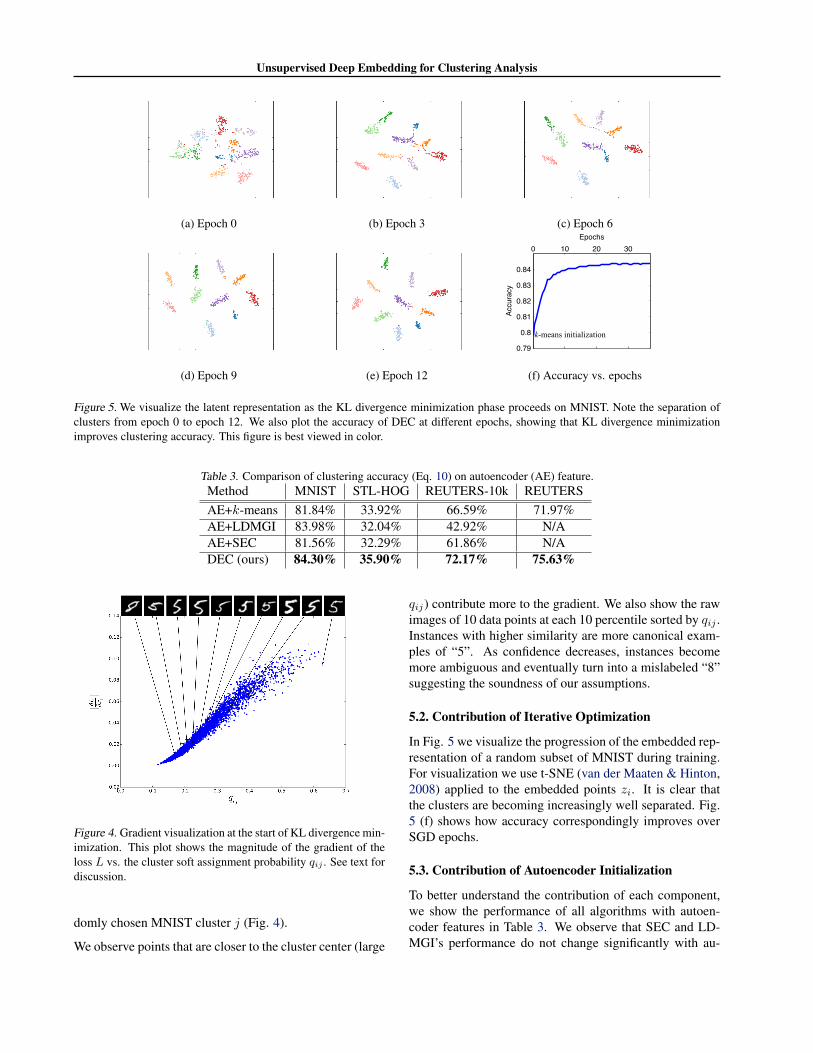
Figure 5. We visualize the latent representation as the KL divergence minimization phase proceeds on MNIST. Note the separation ofclusters from epoch 0 to epoch 12. We also plot the accuracy of DEC at different epochs, showing that KL divergence minimizationimproves clustering accuracy. This figure is best viewed in color.
Table 3. Comparison of clustering accuracy (Eq. 10) on autoencoder (AE) feature.Method MNIST STL-HOG REUTERS-10k REUTERSAE+k-means 81.84% 33.92% 66.59% 71.97%AE+LDMGI 83.98% 32.04% 42.92% N/AAE+SEC 81.56% 32.29% 61.86% N/ADEC (ours) 84.30% 35.90% 72.17% 75.63%
Figure 4. Gradient visualization at the start of KL divergence min-imization. This plot shows the magnitude of the gradient of theloss L vs. the cluster soft assignment probability qij . See text fordiscussion.
domly chosen MNIST cluster j (Fig. 4).
We observe points that are closer to the cluster center (large
qij) contribute more to the gradient. We also show the rawimages of 10 data points at each 10 percentile sorted by qij .Instances with higher similarity are more canonical exam-ples of “5”. As confidence decreases, instances becomemore ambiguous and eventually turn into a mislabeled “8”suggesting the soundness of our assumptions.
5.2. Contribution of Iterative Optimization
In Fig. 5 we visualize the progression of the embedded rep-resentation of a random subset of MNIST during training.For visualization we use t-SNE (van der Maaten & Hinton,2008) applied to the embedded points zi. It is clear thatthe clusters are becoming increasingly well separated. Fig.5 (f) shows how accuracy correspondingly improves overSGD epochs.
5.3. Contribution of Autoencoder Initialization
To better understand the contribution of each component,we show the performance of all algorithms with autoen-coder features in Table 3. We observe that SEC and LD-MGI’s performance do not change significantly with au-
Unsupervised Deep Embedding for Clustering Analysis
Table 4. Clustering accuracy (Eq. 10) on imbalanced subsample of MNIST.XXXXXXXXXXMethod
rmin 0.1 0.3 0.5 0.7 0.9
k-means 47.14% 49.93% 53.65% 54.16% 54.39%AE+k-means 66.82% 74.91% 77.93% 80.04% 81.31%DEC 70.10% 80.92% 82.68% 84.69% 85.41%
toencoder feature, while k-means improved but is still be-low DEC. This demonstrates the power of deep embeddingand the benefit of fine-tuning with the proposed KL diver-gence objective.
5.4. Performance on Imbalanced Data
In order to study the effect of imbalanced data, we samplesubsets of MNIST with various retention rates. For mini-mum retention rate rmin, data points of class 0 will be keptwith probability rmin and class 9 with probability 1, withthe other classes linearly in between. As a result the largestcluster will be 1/rmin times as large as the smallest one.From Table 4 we can see that DEC is fairly robust againstcluster size variation. We also observe that KL divergenceminimization (DEC) consistently improves clustering ac-curacy after autoencoder and k-means initialization (shownas AE+k-means).
5.5. Number of Clusters
0
0.2
0.4
0.6
0.8
1
3 5 7 9 11 13 15 17 19Number of Clusters
NMI
Generalizability
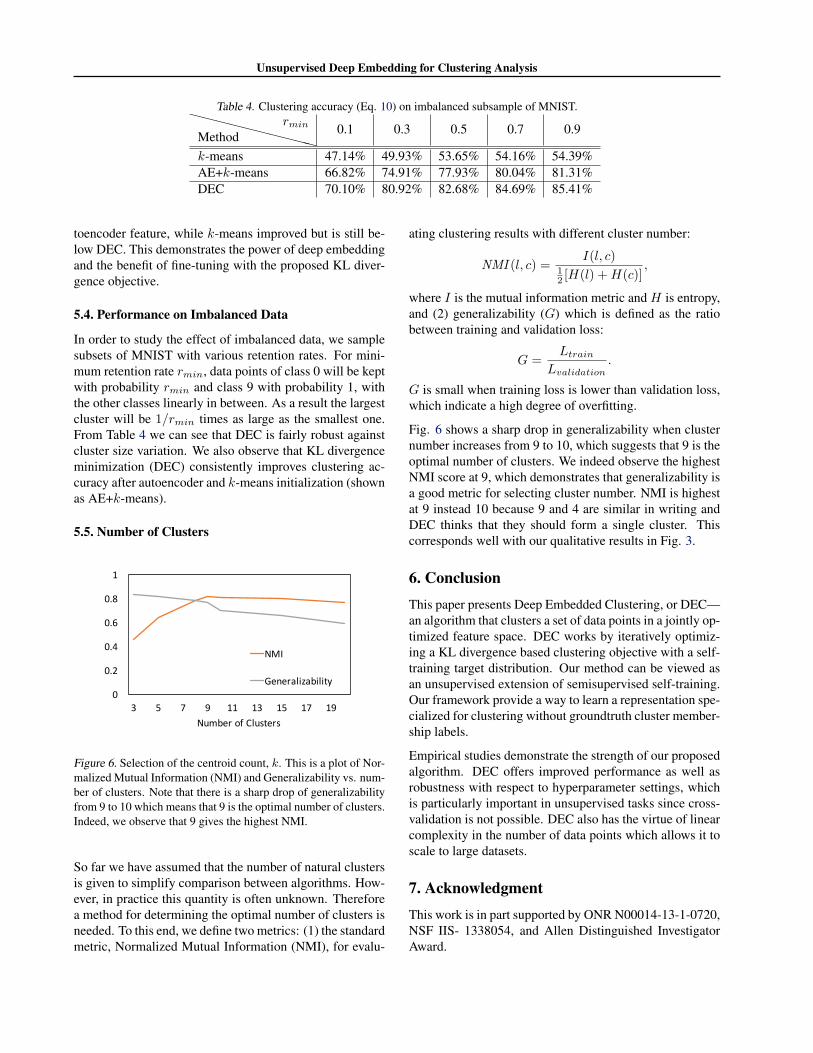
Figure 6. Selection of the centroid count, k. This is a plot of Nor-malized Mutual Information (NMI) and Generalizability vs. num-ber of clusters. Note that there is a sharp drop of generalizabilityfrom 9 to 10 which means that 9 is the optimal number of clusters.Indeed, we observe that 9 gives the highest NMI.
So far we have assumed that the number of natural clustersis given to simplify comparison between algorithms. How-ever, in practice this quantity is often unknown. Thereforea method for determining the optimal number of clusters isneeded. To this end, we define two metrics: (1) the standardmetric, Normalized Mutual Information (NMI), for evalu-
ating clustering results with different cluster number:
NMI (l, c) =I(l, c)
12 [H(l) +H(c)]
,
where I is the mutual information metric and H is entropy,and (2) generalizability (G) which is defined as the ratiobetween training and validation loss:
G =Ltrain
Lvalidation.
G is small when training loss is lower than validation loss,which indicate a high degree of overfitting.
Fig. 6 shows a sharp drop in generalizability when clusternumber increases from 9 to 10, which suggests that 9 is theoptimal number of clusters. We indeed observe the highestNMI score at 9, which demonstrates that generalizability isa good metric for selecting cluster number. NMI is highestat 9 instead 10 because 9 and 4 are similar in writing andDEC thinks that they should form a single cluster. Thiscorresponds well with our qualitative results in Fig. 3.
6. ConclusionThis paper presents Deep Embedded Clustering, or DEC—an algorithm that clusters a set of data points in a jointly op-timized feature space. DEC works by iteratively optimiz-ing a KL divergence based clustering objective with a self-training target distribution. Our method can be viewed asan unsupervised extension of semisupervised self-training.Our framework provide a way to learn a representation spe-cialized for clustering without groundtruth cluster member-ship labels.
Empirical studies demonstrate the strength of our proposedalgorithm. DEC offers improved performance as well asrobustness with respect to hyperparameter settings, whichis particularly important in unsupervised tasks since cross-validation is not possible. DEC also has the virtue of linearcomplexity in the number of data points which allows it toscale to large datasets.
7. AcknowledgmentThis work is in part supported by ONR N00014-13-1-0720,NSF IIS- 1338054, and Allen Distinguished InvestigatorAward.
Unsupervised Deep Embedding for Clustering Analysis
ReferencesAggarwal, Charu C and Reddy, Chandan K. Data cluster-
ing: algorithms and applications. CRC Press, 2013.
Alelyani, Salem, Tang, Jiliang, and Liu, Huan. Featureselection for clustering: A review. Data Clustering: Al-gorithms and Applications, 2013.
Bellman, R. Adaptive Control Processes: A Guided Tour.Princeton University Press, Princeton, New Jersey, 1961.
Bengio, Yoshua, Courville, Aaron, and Vincent, Pascal.Representation learning: A review and new perspectives.2013.
Bishop, Christopher M. Pattern recognition and machinelearning. springer New York, 2006.
Boutsidis, Christos, Drineas, Petros, and Mahoney,Michael W. Unsupervised feature selection for the k-means clustering problem. In NIPS, 2009.
Coates, Adam, Ng, Andrew Y, and Lee, Honglak. Ananalysis of single-layer networks in unsupervised featurelearning. In International Conference on Artificial Intel-ligence and Statistics, pp. 215–223, 2011.
De la Torre, Fernando and Kanade, Takeo. Discriminativecluster analysis. In ICML, 2006.
Doersch, Carl, Singh, Saurabh, Gupta, Abhinav, Sivic,Josef, and Efros, Alexei. What makes paris look likeparis? ACM Transactions on Graphics, 2012.
Girshick, Ross, Donahue, Jeff, Darrell, Trevor, and Malik,Jitendra. Rich feature hierarchies for accurate object de-tection and semantic segmentation. In CVPR, 2014.
Halkidi, Maria, Batistakis, Yannis, and Vazirgiannis,Michalis. On clustering validation techniques. Journalof Intelligent Information Systems, 2001.
Hinton, Geoffrey E and Salakhutdinov, Ruslan R. Reduc-ing the dimensionality of data with neural networks. Sci-ence, 313(5786):504–507, 2006.
Hornik, Kurt. Approximation capabilities of multilayerfeedforward networks. Neural networks, 4(2):251–257,1991.
Jia, Yangqing, Shelhamer, Evan, Donahue, Jeff, Karayev,Sergey, Long, Jonathan, Girshick, Ross, Guadarrama,Sergio, and Darrell, Trevor. Caffe: Convolutional ar-chitecture for fast feature embedding. arXiv preprintarXiv:1408.5093, 2014.
Krizhevsky, Alex, Sutskever, Ilya, and Hinton, Geoffrey E.Imagenet classification with deep convolutional neuralnetworks. In NIPS, 2012.
Kuhn, Harold W. The hungarian method for the assignmentproblem. Naval research logistics quarterly, 2(1-2):83–97, 1955.
Le, Quoc V. Building high-level features using large scaleunsupervised learning. In Acoustics, Speech and SignalProcessing (ICASSP), 2013 IEEE International Confer-ence on, pp. 8595–8598. IEEE, 2013.
LeCun, Yann, Bottou, Leon, Bengio, Yoshua, and Haffner,Patrick. Gradient-based learning applied to documentrecognition. Proceedings of the IEEE, 86(11):2278–2324, 1998.
Lewis, David D, Yang, Yiming, Rose, Tony G, and Li, Fan.Rcv1: A new benchmark collection for text categoriza-tion research. JMLR, 2004.
Li, Tao, Ma, Sheng, and Ogihara, Mitsunori. Entropy-based criterion in categorical clustering. In ICML, 2004.
Liu, Huan and Yu, Lei. Toward integrating feature selectionalgorithms for classification and clustering. IEEE Trans-actions on Knowledge and Data Engineering, 2005.
Long, Jonathan, Shelhamer, Evan, and Darrell, Trevor.Fully convolutional networks for semantic segmentation.arXiv preprint arXiv:1411.4038, 2014.
MacQueen, James et al. Some methods for classificationand analysis of multivariate observations. In Proceed-ings of the fifth Berkeley symposium on mathematicalstatistics and probability, pp. 281–297, 1967.
Nair, Vinod and Hinton, Geoffrey E. Rectified linear unitsimprove restricted boltzmann machines. In ICML, 2010.
Nie, Feiping, Zeng, Zinan, Tsang, Ivor W, Xu, Dong,and Zhang, Changshui. Spectral embedded clustering:A framework for in-sample and out-of-sample spectralclustering. IEEE Transactions on Neural Networks,2011.
Nigam, Kamal and Ghani, Rayid. Analyzing the effective-ness and applicability of co-training. In Proc. of the ninthinternational conference on Information and knowledgemanagement, 2000.
Srivastava, Nitish, Hinton, Geoffrey, Krizhevsky, Alex,Sutskever, Ilya, and Salakhutdinov, Ruslan. Dropout: Asimple way to prevent neural networks from overfitting.JMLR, 2014.
Steinbach, Michael, Ertoz, Levent, and Kumar, Vipin. Thechallenges of clustering high dimensional data. In NewDirections in Statistical Physics, pp. 273–309. Springer,2004.

Unsupervised Deep Embedding for Clustering Analysis
Tian, Fei, Gao, Bin, Cui, Qing, Chen, Enhong, and Liu,Tie-Yan. Learning deep representations for graph clus-tering. In AAAI Conference on Artificial Intelligence,2014.
van der Maaten, Laurens. Learning a parametric embed-ding by preserving local structure. In International Con-ference on Artificial Intelligence and Statistics, 2009.
van Der Maaten, Laurens. Accelerating t-SNE using tree-based algorithms. JMLR, 2014.
van der Maaten, Laurens and Hinton, Geoffrey. Visualizingdata using t-SNE. JMLR, 2008.
Vincent, Pascal, Larochelle, Hugo, Lajoie, Isabelle, Ben-gio, Yoshua, and Manzagol, Pierre-Antoine. Stacked de-noising autoencoders: Learning useful representations ina deep network with a local denoising criterion. JMLR,2010.
Von Luxburg, Ulrike. A tutorial on spectral clustering.Statistics and computing, 2007.
Xiang, Shiming, Nie, Feiping, and Zhang, Changshui.Learning a mahalanobis distance metric for data cluster-ing and classification. Pattern Recognition, 2008.
Xing, Eric P, Jordan, Michael I, Russell, Stuart, and Ng,Andrew Y. Distance metric learning with application toclustering with side-information. In NIPS, 2002.
Yan, Donghui, Huang, Ling, and Jordan, Michael I. Fastapproximate spectral clustering. In ACM SIGKDD,2009.
Yang, Yi, Xu, Dong, Nie, Feiping, Yan, Shuicheng, andZhuang, Yueting. Image clustering using local discrim-inant models and global integration. IEEE Transactionson Image Processing, 2010.
Ye, Jieping, Zhao, Zheng, and Wu, Mingrui. Discrimina-tive k-means for clustering. In NIPS, 2008.
Zeiler, Matthew D and Fergus, Rob. Visualizing and un-derstanding convolutional networks. In ECCV. 2014.


![Structural Deep Clustering Network · 2020-02-13 · embedding clustering [4] adds a reconstruction loss to the objective of DEC as a constraint to help autoencoder learn a better](https://static.fdocuments.in/doc/165x107/5ea64aac5ea36010523a237d/structural-deep-clustering-network-2020-02-13-embedding-clustering-4-adds-a.jpg)