
Unsteady Analysis of Inlet-Compressor Acoustic ... · Unsteady Analysis of Inlet-Compressor...
22
NASA/TMm2000-210247 Unsteady Analysis of Inlet-Compressor Acoustic Interactions Using Coupled 3-D and 1-D CFD Codes A. Suresh Dynacs Engineering Company, Inc., Brook Park, Ohio G.L. Cole Glenn Research Center, Cleveland, Ohio National Aeronautics and Space Administration Glenn Research Center September 2000 https://ntrs.nasa.gov/search.jsp?R=20000120395 2018-08-20T23:59:59+00:00Z
-
Upload
truongkhanh -
Category
Documents
-
view
230 -
download
0
Transcript of Unsteady Analysis of Inlet-Compressor Acoustic ... · Unsteady Analysis of Inlet-Compressor...

NASA/TMm2000-210247
Unsteady Analysis of Inlet-Compressor
Acoustic Interactions Using Coupled3-D and 1-D CFD Codes
A. Suresh
Dynacs Engineering Company, Inc., Brook Park, Ohio
G.L. Cole
Glenn Research Center, Cleveland, Ohio
National Aeronautics and
Space Administration
Glenn Research Center
September 2000
https://ntrs.nasa.gov/search.jsp?R=20000120395 2018-08-20T23:59:59+00:00Z

Acknowledgments
The authors would like to thank M.W. Davis and A.K. Owen for their help in getting started with DYNTECC and
S. Townsend for alerting us to the use of pipes for coupled simulations. Thanks are also due to GE Aircraft
Engines for making available the T58 flow path and characteristic map, and to M. Sajben for several
interesting discussions. Funding for this work was provided by the NASA High Performanceand Communications Program (HPCCP).
Trade names or manufacturers' names are used in this report for
identification only. This usage does not constitute an officialendorsement, either expressed or implied, by the National
Aeronautics and Space Administration.
NASA Center for Aerospace Information7121 Standard Drive
Hanover, MD 21076
Price Code: A03
Available from
National Technical Information Service
5285 Port Royal Road
Springfield, VA 22100Price Code: A03

UNSTEADY ANALYSIS OF INLET-COMPRESSOR ACOUSTIC
INTERACTIONS USING COUPLED 3-D AND 1-D CFD CODES
A. Suresh
Dynacs Engineering Company, Inc.,National Aeronautics and Space Administration
Glenn Research Center
Cleveland, Ohio 44135
G.L. Cole
National Aeronautics and Space AdministrationGlenn Research Center
Cleveland, Ohio 44135
SUMMARY
It is well known that the dynamic response of a mixed compression supersonic inlet is very sensitive to the
boundary condition imposed at the subsonic exit (engine face) of the inlet. In previous work, a 3-Dcomputational fluid dynamics (CFD) inlet code (NPARC) was coupled at the engine face to a 3-D
turbomachinery code (ADPAC) simulating an isolated rotor and the coupled simulation used to study the
unsteady response of the inlet. The main problem with this approach is that the high fidelity turbomachinery
simulation becomes prohibitively expensive as more stages are included in the simulation. In this paper, an
alternative approach is explored, wherein the inlet code is coupled to a lesser fidelity 1-D transient
compressor code (DYNTECC) which simulates the whole compressor. The specific application chosen forthis evaluation is the collapsing bump experiment performed at the University of Cincinnati, wherein
reflections of a large-amplitude acoustic pulse from a compressor were measured. The metrics for
comparison are the pulse strength (time integral of the pulse amplitude) and wave form (shape). When the
compressor is modeled by stage characteristics the computed strength is about 10 percent greater than thatfor the experiment, but the wave shapes are in poor agreement. An alternate approach that uses a fixed rise
in duct total pressure and temperature (so-called "lossy" duct) to simulate a compressor gives good pulse
shapes but the strength is about 30 percent low.
INTRODUCTION
CFD simulations are seeing an increasing role in predicting the unsteady response of mixed compression
inlets to atmospheric and engine disturbances. The ability to predict the unsteady response is particularly
important for evaluating the inlet unstart tolerance. A major uncertainty in these simulations is the boundarycondition used at the exit of the inlet that tries to mimic the presence of the engine. Previously, a code
coupling approach was used to shed some light on conditions at the inlet-engine interface.1 In that study, a
3-D unsteady inlet code was coupled at the engine face with a 3-D turbomachinery code simulating anisolated rotor. While the initial portion of a reflected pulse obtained from the analysis compared well with
experimental data, it appears that simulation of additional (if not all) stages is required to best match the
pulse strength and shape measured in the experiment. However, extension of the turbomachinerysimulation to include additional stages, including rotor-stator interactions, would be computationally
prohibitive without considerable additional (parallel) computer resources.
In this work, we describe another approach to the problem. Several 1-D codes are now available that
simulate the steady and transient flow through a complete compressor. These codes typically solve the I-D
steady and unsteady Euler equations with the effect of the blades being modeled by appropriate sourceterms in the momentum and energy equations. In this work, one such code (DYNTECC) is coupled
dynamically to an unsteady inlet code and the coupled codes are used to study inlet-compressor interactions.
NASA/TM--2000-210247 1
Thepotentialadvantageofsuchanapproachisthattheentirecompressorcanbeincluded in the analysis forlittle more than the cost of a stand-alone inlet simulation.
This approach also has several limitations, the most obvious one being that I-D codes cannot be used to
analyze disturbances that are not predominantly 1-D in nature, such as a convective (tangential) velocity
perturbation, which are sometimes important. However, even for axial disturbances, since inlet-engineinteractions involve the reflection of acoustic waves from turbomachinery, it is not clear whether such I-Dcodes will give meaningful results. On the one hand, since there is no blade surface, it is obvious that
reflections from individual blades will not be captured. On the other hand, since the overall temperature
and pressure rises are captured, these along with the area variation might give the correct reflected response
far from the turbonmchinery itself. More importantly, even if the reflected pulse is not completely accurate,the hope is that the coupled-component simulation might provide a better assessment of inlet unstarttolerance than the imposition of simple boundary conditions at the inlet exit.
The objectives of this work were threefold: 1) to evaluate the source term approach for representing the
compressor stages, 2) to extend the analysis from the previous work ! to include the complete compressor,
and 3) to investigate I-D to 3-D coupling which is required for the zooming capability of the Numerical
Propulsion System Simulation (NPSS) project at the NASA Glenn Research Center. This report describesthe experiment chosen for simulation and evaluation of the approach, the codes used to simulate the inlet
and compressor components, and the code-coupling procedure. Results from several coupled-simulation
cases are then discussed and compared to each other and to experimental results, followed by someconcluding remarks.
DESCRIPTION OF EXPERIMENT
The collapsing-bump inlet-compressor experiment conducted at the University of Cincinnati" was chosen as
the simulation application. The experimental setup is shown schematically in Fig. 1. It consists of a
constant area annular inlet duct mated with a General Electric T58 engine modified for cold operation (i.e.,
the turbine was driven by an external air supply). The inlet duct is about 71 inches long and has a screened
bellmouth at the upstream end. A small section of the constant area duct has a flexible bump on the hubsurface that collapses rapidly (in about 1 msec) to produce two well-defined expansion waves or acoustic
pulses, one traveling upstream and the other downstream. The length of duct upstream of the bump waschosen so that reflections of the upstream traveling pulse arrive at the measurement stations after the time
interval of interest. The corresponding axial area distribution is shown in Fig. 2, where the normalizingfactors Rc and Ac are 5.083 in. and 81.17 sq. in., respectively. The compressor is quite short and is seen torepresent a fairly abrupt reduction in area.
In our computations, the long inlet duct with the bump was solved using NPARC, a general purpose CFDcode capable of handling moving grids. The engine's compressor was modeled using DYNTECC, a I-Dtransient compressor code.
INLET SIMULATION USING NPARC
The simulation of the collapsing bump using NPARC version 3.13 is very similar to that described in Ref. 1.
Since viscous effects were not found to be significant, the flow was simulated as an inviscid 3-D flow. At
the downstream end, where it is coupled with DYNTECC, the grid was modified so as to remove a
converging section so that the flow remains one dimensional. This was done primarily to be consistent with
the i-D flow assumed in DYNTECC and also to eliminate a potential source of reflections. Although theflow is axisymmetric, it is solved here as a 3-D flow to permit investigation of 3-D to I-D interfacecoupling.
The grid for the inlet simulation consists of 338 by 33 by 13 points in the axial, radial, and circumferential
directions, respectively. The default ADI algorithm in NPARC is used to obtain the reference steady state
NASA/TM--2000-210247 2

solution.SincetheMachnumberis quitelow,thesecondorderdissipationis setto zeroin thesecomputations.FortheunsteadycomputationsaNewtoniterativemethodisusedtoiteratethesteadystatealgorithmwhichallowsfortheuseoflargertimesteps.
TURBOMACHINERY SIMULATION USING DYNTECC
GENERAL DESCRIPTION OF DYNTECC
DYNTECC 4'5 is a I-D stage-by-stage compression system model developed at AEDC. It solves the I-D
steady/unsteady Euler equations, with source terms used to compute the effect of the blades. It has the
capability to analyze post-stall behavior as well as predict the onset of system instability for any generic
compression system as well as model the performance of the compressor under surge and rotating stallmodes. In addition to the flow path geometry, a set of individual stage (rotor/stator pair) characteristics of
the compression system is required as input. The magnitude of the source terms are calculated from these
characteristic maps.
In addition to the input file, which contains user inputs that control various aspects of the simulation, two
other files are required. The first is the .geom file that contains the flow path of the compressor. The T58
compressor has 10 stages and an IGV and OGV, as shown in Fig. 1. Typically, each stage is represented bya control volume. For each control volume, the axial location, hub and tip radii at the beginning and end of
the control volume are required. This was obtained by digitizing the flow path geometry of the T58 engine.
Since DYNTECC does not have a nonreflecting boundary condition, a long uniform duct was added to the
downstream end of the T58 compressor (Fig. 2) so that reflections from the constant-pressure exit boundary
condition would not be present in the space-time interval of interest. A total of 40 grid points were used inthe DYNTECC simulation, eleven of which were used in the compressor region.
GENERATION OF DYNTECC STAGE CHARACTERISTIC MAPS
A file (.fit file) that contains parametric fits that represent characteristic maps of each stage of the
compressor is read by DYNTECC prior to execution. The usual way of obtaining the maps is to use detailed
geometry information to run a streamline curvature code at several operating points and extract the mapsfrom its output. Since this was not available for the T58 engine, the maps were approximated in the
following manner.
The starting point for the maps is the characteristic map for the whole compressor that was obtained from
the engine manufacturer. This was digitized to provide the corrected mass flow and total pressure ratio (thetwo dependent variables) for three different speeds and three different efficiencies (the independentvariables). From this raw data, the generation of the stage-by-stage maps can be done in several different
ways. We experimented with two of them as described below.
In the first method, the total pressure ratio pr, the corrected mass flow, and the efficiency 11are assumed to
be the same for all stages. Hence, for a given speed and efficiency, a total pressure ratio across an individual
stage is calculated by taking the nth root of the total pressure ratio across the whole machine, where n is the
number of stages. This is used along with the efficiency to calculate a total temperature ratio Tr across an
individual stage from
Tr = [(prlY'i)/7-1)/q] + 1
where y = 1.4, is the ratio of specific heats. In this way, for a given speed and efficiency, the mass flow,total pressure ratio, and total temperature ratio across each stage are obtained.
NAS A/TM--2000-210247 3

In the second method, the assumption is that the early stages of the compressor are more highly loaded than
the latter stages. Let us denote the total pressure rise in the first five stages of the compressor to be prh, the
total pressure rise in the last five stages of the compressor to be prl, and the total pressure ratio across thewhole compressor to be prc. Then we have
(prh) 5 (prl) 5 = prc
A nominal value is arbitrarily assumed for prl, such as 1.0003, and the above equation solved for prh. Once
the total pressure ratio across each stage is obtained, the total temperature ratio is obtained in the same wayas in the first method. Note that if prh = prl, the second method reduces to the first method.
Once the mass flow, total pressure ratio, and total temperature ratio across each stage are obtained for each
value of speed and efficiency by either of these methods, the DYNTECC preprocessor program
STAGCHAR was used to generate an input file to PACFIT, the program that generates the characteristic fitfile for DYNTECC. PACFIT is an interactive GUI based program that allows the user to check for
characteristics that intersect. Unrealistic values of prl in the second method led to intersections of
characteristic maps and were corrected. The stage characteristics give rise to the force and heat addition
source terms that are used in the Euler momentum and energy equations, respectively.
COMPRESSOR SIMULATION USING LOSSY DUCTS
An even simpler simulation of the flow through a compressor can be obtained using the so-called "lossy'"
duct option within DYNTECC. In this option, the total temperature and pressure rise through each controlvolume can be input as parameters. By a proper selection of these parameters, it is possible to match the
steady state flow field of a compressor.
For transient simulations, the source terms that would have produced the total pressure and temperature rise
in steady flow are now added instantaneously to the momentum and energy equations. Dynamically, thisoption can be viewed as a compressor stage where the total temperature ratio and total pressure ratio remain
constants, independent of mass flow and speed.
MODIFICATIONS TO DYNTECC
Relatively minor modifications to DYNTECC were required to be able to perform coupled simulations. Themain modification consisted of implementing a data exchange procedure with NPARC that is described in
the next section. In addition, the inflow boundary condition in DYNTECC is disabled during coupledsimulation.
The coupled simulation is first run as a steady simulation so that the two codes settle down to a steady-statecondition. Once this is achieved, the unsteady simulation, initiated by the bump collapse is carried out.
Since it is difficult to lump these two steps into one (for example, the algorithm used on the NPARC side is
different for the two steps), a restart option for the coupled simulation is necessary. NPARC already has a
restart option. A restart option for DYNTECC was implemented by reading and writing the common blocks.
COUPLING PROCEDURE
GENERAL ISSUES
The basic method used to couple NPARC to DYNTECC is similar to the method used to couple two blocks
of a multi-block code.l In this method, the conserved variables in the image cells of code A are obtained
from interior cells of code B and vice-versa. The only new twist here is that the data transfer is 3-D to I-Dand I-D to 3-D.
NASA/TM--2000-210247 4

A mass-weightedaverageovertheinteriorplaneinNPARCisusedtocalculatevaluesof the density, axialmomentum and total energy required for the image cells of DYNTECC. Similarly, the same values from
the interior cell of DYNTECC are applied as constant values over the image cells of NPARC, with the other
two components of the conserved variables (those corresponding to the radial and circumferential
components) being set to zero. Obviously, this method assumes that the flow is predominantly I-D at the
coupled plane. Since the units of variables are different in the two codes, some conversion factors were
required to convert the data exchanged from one code to the other.
We remark that another method that has been used to couple codes is the so called boundary condition
approach, where the boundary conditions of code A are satisfied by data from code B and vice versa. While
this approach has its merits for steady flow tsuch as a faster convergence to steady state) it is not clear
whether time accuracy will be maintained. Also+ the boundary condition approach is not viable for caseswhere the flow at the interface can become supersonic.
DATA TRANSFER
For unsteady (time accurate) coupled simulations, data between NPARC and DYNTECC needs to be
exchanged at the end of each time step. Since the codes are run separately and have widely different
execution times per time step, synchronization of the two codes becomes an issue. In Ref. 1, the
synchronization was handled by a script in the software used to couple the codes. Here, the synchronizationis effected through file transfer and the Unix notion of a pipe. When a pipe is setup between two programs,
the output of the first program forms the input to the second. Both pipes are initialized in both codes before
the first time step. At the end of a time step, NPARC writes its averaged conserved variables into a pipe
from which DYNTECC reads the data, and similarly DYNTECC writes to another pipe from which
NPARC reads. Thus DYNTECC cannot proceed to time step n+ 1 unless NPARC has completed time step nand vice-versa. This method of data exchange works well in practice with little or no overhead (i.e., the time
to exchange data was small compared to the program execution time per time step). The disadvantage of a
pipe transfer is that there is a size limit to the data that can be transferred. In this case, the data is simply
three real numbers so that this was not a problem.
VALIDATION
Two upstream perturbation cases were run to validate the method for coupling NPARC to DYNTECC. In
both case, the collapsing bump was used to generate the perturbation. For the first validation caseDYNTECC _ a, u_ed to simulate a continuation of the NPARC constant-area annular inlet. The duct Mach
number _a, O. 17. The coupled simulation results are shown in Fig. 3. The static pressure time histories at
NPARC _tat_t,n 4 and the first DYNTECC grid point (J=l) are seen to be essentially identical, except for
high frcqucn¢> o_¢illations observed in the NPARC data (beyond 9.5 msec). The oscillations are believedto be duc tt, tran,_cr_c waves set up by the bump collapse. These oscillations were also observed in the raw
experimental data. The experimental data were filtered to remove frequencies above 2000 Hz due to engine
noise and Ilk' tran,_erse oscillations. All subsequent NPARC results have been filtered using the sameprocedure a, the experimental data. Since the oscillations don't appear in the DYNTECC data, it would
seem that the appnmeh used to average the NPARC data from 3-D to 1-D effectively filtered them.
For purpo,c, ot comparison, a pulse strength Str is defined by the following equation
t2 t2
Str = _(dp/ p)dt =J'[(/_(t)-p)/p]dttl tl
where/3(t) and p are the instantaneous and initial values of the pressure at the particular axial location and
the time limits of integration tl and t2 are chosen to capture the (major) part of the pulse that is negative
(e.g., values of tl and t2 are about 7.5 msec and 8.7 msec for sta4). The pulse strength Str has units of
msec. The pulse strengths at stations sta4 and J=l are -2.39E-2 and -2.41E-2, respectively. The pulse atDYNTECC station J=7 (approximately the mid-compressor axial location) appears to be somewhat
NASA/TM--2000-210247 5

attenuated.However,Stris -2.35E-2,onlyabout2 percentlowerthanthepulsestrengthontheNPARCside.Thisdissipationis thoughtto bedueto theDYNTECCalgorithmandit is feltthatthepulseisaccuratelypropagatedacrosstheNPARC/DYNTECCcoupledinterface.
ForthesecondvalidationcaseDYNTECCwasusedtomodeltheT58convergingflowpathbutwithoutanycompressorterms(i.e.,therewasnototalpressureandtemperatureriseacrossthecompressorregion).In thiscasetheductMachnumberwasloweredto0.04topreventtheductfrombecomingchokedin theconverging(T58flowpath)section.Thecompressorexittoinletarearatiois0.243.TheincidentpulsestrengthisslightlygreaterforthiscasethaninFig.3becauseofthedifferentambientconditions.ThefiDareofmeritforthisvalidationcaseis thestrengthofthepulsereflectedfromtheconvergingarearelativetotheincidentpulsestrength.Staticpressuretimehistoriesforthreesensorlocationsin theinletduct(NPARC)areshowninFig.4. TheincidentandreflectedpulsestrengthsweredeterminedfromthetimehistoryatNPARCsta3.The incident pulse occurs over the time range of about 7.4 to 8.6 msec, and its strength is-3.13E-2. The reflected pulse occurs over the time range of about 8.9 to 11.6 msec, and its strength is
-2.15E-2. The ratio of reflected strength to incident strength is 0.687. Sajben 7 analyzed the reflection of
acoustic pulses from compressor blades, and recently extended the analysis to include effects of change in
area (unpublished to datel. For an (abrupt) area change of 0.243 and an entrance Mach number of 0.04
Sajben's analysis predicts the ratio of reflected to incident pulse strengths to be 0.663, 3.5 percent less thanthe NPARC-DYNTECC result. We feel that the excellent agreement of the NPARC-DYNTECC result with
Sajben's analysis further ensures that the NPARC-DYNTECC coupling method is valid.
DISCUSSION OF RESULTS
NPARC-DYNTECC ANALYSIS
Baseline case:
Coupled NPARC-DYNTECC simulations of the collapsing bump experiment were carried out for several
different cases. In each case, the DYNTECC part of the simulation was changed to investigate a variety ofconditions while the NPARC domain remained the same. The baseline case consisted of the T58 flow path
and compressor stage maps with equal total pressure ratios across each stage (method 1 above). The total
pressure and temperature ratios across the entire compressor were 2.40 and 1.39, respectively, and
corresponded to the experimental test case with a duct Mach number of 0.17. This case will be referred to
as the T58 flow path--linear loading case. Static pressure time histories in the inlet and engine are shown inFig. 5.
The NPARC responses at stal and sta4 correspond to locations where experimental data were measured.
The DYNTECC responses labeled as DTJ3, 7 and 14 correspond to grid locations J=3, 7 and 14 and are
roughly at the entrance, midpoint and exit of the compressor. Fig. 5 shows the pulse amplitude beingattenuated as it travels through the compressor. However, the values of Str at stations DTJ3 and DTJ7 are
actually slightly greater than the incident pulse strength. While this cannot happen for isentropic ducts, such
amplifications cannot be ruled out in the presence of source terms. A possible explanation is that reflections
from successive source terms, as well as the converging flow path, may overlap the transmitted waves.Thus the pulse observed in the compressor could actually be a combination of transmitted and reflected
waves. Unfortunately, experimental data do not exist to validate the static pressures computed within the
compressor.
Comparison of other NPARC-DYNTECC results to baseline case:
Three other cases were run for comparison to the baseline case. The idea was to study the effects of the area
variation and the source terms separately. In all cases the duct Mach number was 0.17 and the total pressure
and temperature ratios across the compressor region were the same as for the baseline case. The particularsfor each case are as follows:
NASA/TM--2000-210247 6

1) Mostofthetotal pressure rise through the engine is borne by the first five stages with the last
five stages being essentially unloaded. This corresponds to the second method of generating
characteristic maps described in DYNTECC stage characteristic maps section above and is
referred to as the T58 flow patty--front end loading case. Here the distribution of the total
pressure rise through the engine is different as compared to the baseline case while the areadistribution remains the same.
21 A constant area flow path, equal to the inlet annular area, was used with the baseline (linear)
compressor pressure ratio terms. This case is referred to as the Constant area--qinear loadingcase.
3) The DYNTECC lossy duct option was used to implement the same total pressure and
temperature rise across the compressor as for the baseline case. The T58 flow path area was
used. This case is referred to as the T58 flow patb---lossy duct case.
These three cases are compared to the baseline case in Figs. 6 and 7. Fig. 6 shows a comparison of the
reflected wave shapes, calculated at NPARC sta4, that occurred for the various cases. The reflected wave
shape is obtained by translating the incident wave at stal to sta4 and then subtracting the translated wavefrom the combined incident/reflected wave to obtain the "net" wave. A procedure for doing this is
described in more detail in Ref. 2. As can be seen the reflected wave shapes are pretty much the same for all
cases except the lossy duct case.
The amplitude of the reflected wave is quite a bit larger for the front end loaded case as compared to thebaseline. Unfortunately, this implies that the transient dynamics is quite sensitive to how the various stages
are loaded, information that is usually difficult to obtain for a compressor. The pulse amplitude of the
constant area case is only slightly smaller than the baseline case, despite the large area change in the latter,and this leads us to conclude that the stage characteristic source terms dominate the dynamic response.
The most striking difference in Fig.6 is between the lossy duct case and the baseline, where the reflected
pulse amplitude is considerably smaller for the Iossy duct. These two cases give steady state solutions thatare almost identical but give dynamic solutions that are very different. This difference is not surprising since
the source terms are implemented in completely different ways. It is also interesting that the shape of the
reflected pulse is very similar to the second validation case of Fig. 4, where no source terms are present.From this we conclude that the source terms implemented in the lossy duct fashion have little effect on the
dynamic response while source terms implemented via characteristic maps have a huge effect on the
dynamic response.
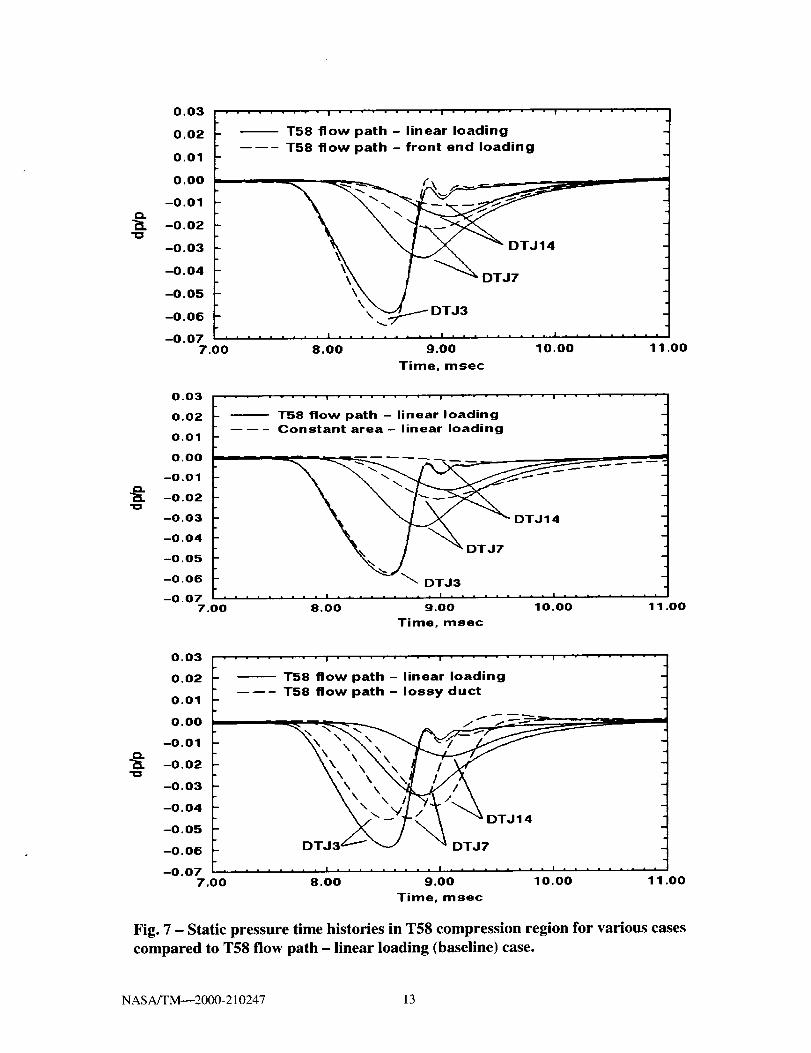
Fig. 7 shows a comparison of static pressures in the compressor for each case with the baseline case. The
T58 flow path---linear loading and constant area---linear loading cases are similar to the baseline but show
somewhat greater attenuation as the pulse travels through the compressor. This would seem to imply thatthe area variation does not have a major effect when the compressor stage characteristic terms are present.
(The reflected wave shapes in Fig. 6 also appear to support this conclusion.) The Iossy duct case shows the
pulse amplitude staying almost constant in strength as it travels through the compressor.
Simulation Times:
All computations were performed on an SGI RIO000 multi-processor non-dedicated machine. The wall
clock times for a complete run for the various simulations are as follows:
Simulation
Stand Alone NPARCStand Alone DYNTECC
Coupled NPARC (seriai)-DYNTECC
Coupled NPARC (parallel) -DYNTECC
Execution Time (sec)33251.4
11.63
35560.88298.6
NASA/TM--2000-210247 7
Ascanbeseen,theNPARCcomputationdominates.Thus,executiontimesareconsiderablyreducedbyparallelexecutionof NPARC.Theelapsedtimesof theserialandparallelruns(withthreeblocks)are10and2.5hr,respectively.Thiscompareswitheightdaysand12hr for serialandparallelexecutionofNPARC-ADPAC,withtheparallelcomputationrunover21blocks.Thedifferencebetweentheexecutiontimeof thecoupledsimulationandthestand-aloneNPARCsimulationwouldbe thecommunicationoverheadif theserunswerecarriedoutonadedicatedmachine.Asit is, it couldwellbeduetodifferentloadfactorsduringthetworuns.
NPARC-DYNTECC ANALYSIS COMPARED TO EXPERIMENT
Selected NPARC-DYNTECC results are compared to the experimental results to give an indication of how
well the DYNTECC code simulates the response of a multistage compressor to acoustic pulses. Fig. 8
shows time histories at two inlet duct locations (stal and sta4) for the baseline case compared to the
experiment. The incident pulses, for the time range of about 6.0 to 7.2 msec, are in very good agreement.
At station 4, the simulation time history indicates a larger reflection than the experiment although the
agreement in the overall shape is not too bad. Fig. 9 shows a comparison of the T58 flow path---tossy duct
case with the experiment. Again, the agreement for the incident pulses is very good. The agreement at
station 4 is remarkably good both in shape and amplitude. Of all the analysis test cases this one appears tobest replicate the experimental results.
From a controls perspective, the most important metrics for comparison are the shape and strength of the
reflected wave. Fig. 10 shows the reflected wave determined at station 4 from various analyses compared tothe experimental data. The strength ratio, defined as Str of the reflected pulse divided by Str of the incident
pulse, is shown in parentheses for each case. The strength ratio for the NPARC-DYNTECC baseline case is
11 percent greater than that for the experimental result. The T58 flow patD-qossy duct case mimics theexperiment shape the best but its strength ratio is 30 percent lower than the experiment's.
From all these runs it appears that the shape of the reflected pulse is most affected by the flow path
geometry. The result obtained from the previous NPARC-ADPAC (much more computationally expensive)
simulation I predicts the initial part of the response quite well, but its overall shape and strength are not as
good as the lossy duct case. This is consistent with the fact that ADPAC simulated just the first stage rotor
of the T58 compressor and had no knowledge of the complete flow path (contraction) of the compressor.
Although not shown in Fig. 10, a LAPIN 1-D simulation 1'7 of the experiment with the Paynter boundary
condition 7 gives results that are very similar in shape to the NPARC-ADPAC case but had a larger strength
ratio of 0.466. This simpler boundary condition approach has the advantage of much greater computationalefficiency although it may not accurately represent the response of multiple blade rows, particularly in terms
of reflected pulse shape. All of the simulation results are an improvement over the traditional exit boundary
conditions such as constant pressure, velocity, or Mach number that would have strength ratios of-1, 1, and0.934. respectively.
CONCLUDING REMARKS
The 3-D NPARC and 1-D DYNTECC CFD codes were successfully coupled to simulate the inlet and
turbomachinery components, respectively, of the collapsing-bump compressor-interaction experiment
conducted at the University of Cincinnati. Data were exchanged between codes by means of Unix pipesthat added little overhead to the overall computation. The approach used to create I-D variables from 3-D
variables and vice versa was demonstrated to work very well, but is probably limited to cases where
conditions at the coupled interface are predominately 1-D.
The main conclusion obtained from this work is that inlet-compressor interactions are not well captured by
transient compressor codes that solve the l-D Euler equations with source terms based on stage-by-stagecharacteristics. Although the strength of the reflected wave obtained by the analysis compared well with the
experiment, the wave shape was not too good. Another (lossy duct) approach, wherein the flow path
NASAfI'M--2000-210247 8
geometryis modeledalongwithsourcetermsrepresentingtheinitial steady-statetotalpressure and
temperature rise, gives results that compare well with experiment, especially in the shape of the reflectedwave. With this approach, the reflected wave shapes obtained seem most sensitive to the flow path
geometry while the reflected strengths seem most sensitive to the total pressure and temperature ratios. Itappears that, at least for the compressor being simulated (T58), the flow path geometry plays an important
role in determining the shape of the reflected wave. It may be that an additional (force) source term thataccounts for reflection from the blade surface can be implemented in the momentum equation to produce
more accurate results. In any case, all of the simulation methods discussed in the report are an improvement
over exit boundary conditions, such as constant pressure, velocity, or Mach number, traditionally used to
represent the compressor face boundary condition in CFD simulations of isolated inlet.
As mentioned in the introduction, the main advantage of using a I-D code to simulate the compressor is that
the entire compressor can be included in the simulation for little more than the cost of a stand alone inlet
simulation. In addition, with parallel execution of the inlet code, turnaround times of a few hours are
possible with this approach.
REFERENCES
1. Suresh, A., Townsend, S.E., Cole, G.L., Slater, J.W., and Chima, R., "Analysis of Inlet-Compressor
Acoustic Interactions using Coupled CFD Codes," AIAA paper 98-0749; also NASA TM--1998-208839.
2. Freund, D., and Sajben, M., "Reflection of Large Amplitude Pulses from an Axial Flow Compressor,"
AIAA paper 98-0749, Jul. (1997).3. Chung, J., Slater, J., Suresh, A., and Townsend, S., "NPARC v3.1 User's Guide: A Companion to the
NPARC v3.0 User's Guide," NASA TM--1999-209058, March, 1999.
4. Hale, A.A., and Davis, M.W., Jr., "Dynamic Turbine Engine Compressor Code DYNTECC--Theory
and Capabilities," AIAA paper 92-3190, July (1992).5. Owen, K.A., and Davis, M.W., Jr., "Modeling the Dynamic behavior of an Axial-Centrifugal
Compression System," AIAA paper 94-2802, June (1994).
6. Sajben, Miklos, "Acoustic, Vorticity, and Entropy Waves Created by Acoustic Pulses Incident on a
Moving Blade Row," paper IS-7085, September, 1999.
7. Paynter, G.C., Clark, L.T., and Cole, G.C., "Modeling the Response from a Cascadeto an Upstream
Acoustic Disturbance," AIAA paper 98-0953, Jan. (1998).
NASA/TM--2000-210247 9

fk_xiblebumpcen_erof fl_ _ugeno_r_X
?- 203 -_- 17B _Pe3
"
i
Fig. 1 - Schematic of U. Cincinnati inlet-engine acoustic pulse experiment and
pressure sensor locations (dimensions in centimeters).
0.80I I I I
0.70
O.SO
0.50
0.40
0.30
0.20
0.100.0
Collpasin g bum p
cpoa?:ress°r'
• • • , I • • i • I • i • • m • • , i I I I I I
5.0 10.0 15.0 20.0 25.0
Axial distance from cowl lip, X/Rc
Fig. 2 - Area distribution of inlet duct and T58 compressor flow path (collapsing
bump inflated).
NASA/TM--2000-210247 10

0,01 -" ........ I ......... I ......... I ......... I ......... ,4
0.00 I_,.
-0.01
_. -0.02 NPARC sta4
•I= DYNT ECC J = 1
-0.03 DYNTECC J=7
-0.04
-0.05 ......... ' ......... ' ......... ' ......... ' .........7.0 8.0 9.0 10.0 11.0 12.0
Time, msec
Fig. 3 - Static pressure time histories for constant area coupled-code validation case.
\ "_ I I
_ I tI
),1 ,
t',. /
"O
0.01
0.00
-0.01
-0.02
-0,03
-0.04
-0.05
.........'.........'.........'.........'.........'.........'.......I"....._;C', " / _V '
_ I ', I. ! NPARC ,tal
/ ,, :,, f
,.;;/',./
,.,..,. Jl . ........ I... ...... I....... ii I ......... I.. ....... I • • .... ...I ...... ..,
6.0 7.0 8.0 9.0 10.0 11.0 12.0 13.0
Time, msec
Fig. 4 - Static pressure time histories for T58 compressor flow path coupled-codevalidation case.
NASA/TM--2000-210247 11

0.01
0,00
-0.01
-0.02
-0.03
-0.04
-0.05
-0.06
-0.07
......... ! ......... I ......... I ......... ! ......... I .........
_ m_' ...,._ - -
\ / \ ', \\ / _\ \ _ / \ DTJ14
DTJ7
sta
I NPARC (sta) \
........................... l ......... l ......... I .........
5.00 6.00 7,00 8.00 9.00 10.00 1 .00
Time, msec
Fig. 5 - Static pressure time histories for T58 compressor flow path with uniform
total-pressure (linear loading) across stages (baseline case).
a.
m
rv-
caz
8
0.01
0.00
--O.01
--0.02
......... l ......... i ......... i .........
-- T58 flow path - linear loading
Constant area - linear loading
----- T58 flow path - Iossy ductT58 flow path - front end loading
t
I
--0.03 ................... ' ......... = .........2.00 3.00 4.00 5.00 6.00
Time, msec
Fig. 6 - Comparison of "net" reflected pulse measured at inlet station 4 for coupled
NPARC-DYNTECC solutions to various flow path and compressor loading cases.
NASA/TM--2000-210247 12
[2.
"O
0.03
0.02
0.01
0.00
-0.01
-0.02
-0.03
-0.04
-0.05
-0.06
-0.077.00
......... I ......... I ......... ! ......... J
T58 flow path linear loading
T58 flow path front end loading
\\"_ i- DTJ3
• . • = • = • . . I ......... I ......... | .........
8.00 9.00 10.00 11.00
Time, msec
0.03
0.02
0.01
0.00
-0.01
-0.02
-0.03
-0.04
-0.05
--0. O6
--0.077.00
......... ! ......... ! ......... I ......
T58 flow path - linear loadingConstant area - linear loading
\ ! -oTJ,_ DTJ3
• . . ...... I ......... I . , ....... I .........
8.00 9.00 10.00 11.00
Time, msec
0.03
0.02
0.01
0.00
-0.01
"_. -0.02
-0.03
-0.04
-0.05
......... ! ......... I ......... I .........
T58 flow path - linear loading
T58 flow path - Iossy duct
-0.06
-0.07 ......... ' ....7.00 8.00
..... I • • • • , .... I .........
9.00 10.00 11.00
Time, msec
Fig. 7 - Static pressure time histories in T58 compression region for various cases
compared to T58 flow path - linear loading (baseline) case.
NASA/TM--2000-210247 13

0.02 ......... , ......... , ......... , ......... , ......... , .........
Q.
0.01
0.00
-0.01
-0.02
-0.03
-0,04
NPARC-DYNTECC, T58 flow path - linear Ioadin_
Experiment
/\
tIt
stal
sta4
-0.055.00 6.00 7.00 8.00 9.00 10.00 11.00
Time, msec
Fig. 8 - Static pressure time histories in inlet region for T58 flow path - linear
loading (baseline) case compared to U. Cincinnati experimental data.
NASA/TM--2000-210247 14

0.02
0.01
• • • , • .... i • ,, • • • , ,, I • • • • "" ° " • I " ." " ' .... t ' " " " " "" " " I .... " " " " "t
1NPARC-DYNTECC, T58 flow path - Iossy duc
Experiment
0.00 \
0.
"0
-0.01
-0,02
-0.03
-0.04
-0.050.00
oral J\
sta4llll,...,l, .....,,,|,,,,...=.l,''''''i'l'''''''''l=''''''="
1.00 2.00 3.00 4.00 5.00 6.00
Time, msec
Fig. 9 - Static pressure time histories in inlet region for T58 flow path - lossy duct
case compared to U. Cincinnati experimental data.
NASA/TM--2000-210247 15

0.03 ......... , ......... , ......... , ......... , .........
"0
t-O
0.02
0.01
0.00
-0.01
-0.02
NPARC-DYNTECC, T58 flow path - linear loading (0
.... NPARC-ADPAC, 1st stage rotor (0.327)
---'- Experiment (0.777)
NPARC-DYNTECC, T58 flow path - Iossy duct (0.54;
-0.032.00 3.00 4.00 5,00 6.00 7.00
Time, msec
360)
Fig. 10 - "Net" reflected pulse measured at inlet station 4 for coupled NPARC-
DYNTECC solutions compared to U. Cincinnati experimental data and coupled
NPARC-ADPAC solution. Values in parentheses are ratio of reflected pulse
amplitude (time integral of dp/p) to incident pulse amplitude.
NASA/TM--2000-210247 16


REPORT DOCUMENTATION PAGE FormApprovedOMB No, 0704-0188
Public reporting burden for this collection of information is estimated to average I hour per response, including the time for reviewing instructions, searching existing data sources,
gathering and maintaining the data needed, and completing and reviewing lhe collection of information. Send comments regarding this burden estimate or any other aspect of this
collection of information, including suggestions for reducing this burden, to Washington Headquarters Services, Directorate for Information Operations and Reports. 1215 Jefferson
Davis Highway, Suite 1204, Arlington, VA 22202-4302, and to the Office of Management and Budget, Paperwork Reduction Project (0704-0188), Washington, DC 20503.
1. AGENCY USE ONLY (Leave blank) 2. REPORT DATE 3. REPORT TYPE AND DATES COVERED
September 2000 Technical Memorandum
4. TITLE AND SUBTITLE 5. FUNDING NUMBERS
Unsteady Analysis of Inlet-Compressor Acoustic Interactions Using
Coupled 3-D and I-D CFD Codes
6. AUTHOR(S)
A. Suresh and G.L. Cole
7. PERFORMING ORGANIZATION NAME(S) AND ADDRESS(ES)
National Aeronautics and Space Administration
John H. Glenn Research Center at Lewis Field
Cleveland, Ohio 44135 - 3191
9. SPONSORING/MONITORING AGENCY NAME(S) AND ADDRESS(ES)
National Aeronautics and Space Administration
Washington, DC 20546-0001
WU-509-10-11-00
8. PERFORMING ORGANIZATION
REPORT NUMBER
E-12367
10. SPONSORING/MONITORING
AGENCY REPORT NUMBER
NASA TM--2000-210247
11. SUPPLEMENTARY NOTES
A. Suresh, Dynacs Engineering Company, Inc., 2001 Aerospace Parkway, Brook Park, Ohio 44142 (work funded under
NASA Contract NAS3-98008): and G.L. Cole, NASA Glenn Research Center. Responsible person, G.L. Cole, organi-
zation code 5880, (216) 433-3655.
12a. DISTRIBUTION/AVAILABILITY STATEMENT
Unclassified - Unlimited
Subject Categories: 07 and 02 Distribution: Nonstandard
This publication is available from the NASA Center for AeroSpace Information, (301 ) 621-0390.
12b. DISTRIBUTION CODE
13. ABSTRACT (Maximum 200 words)
It is well known that the dynamic response of a mixed compression supersonic inlet is very sensitive to the boundary
condition imposed at the subsonic exit (engine face) of the inlet. In previous work, a 3-D computational fluid dynamics
(CFDI inlet code (NPARC) was coupled at the engine face to a 3-D turbomachinery code (ADPAC) simulating an isolated
rotor and the coupled simulation used to study the unsteady response of the inlet. The main problem with this approach is
that the high fidelity turbomachinery simulation becomes prohibitively expensive as more stages are included in the
simulation. In this paper, an alternative approach is explored, wherein the inlet code is coupled to a lesser fidelity I-D
transient compressor code (DYNTECC) which simulates the whole compressor. The specific application chosen for this
evaluation is the collapsing bump experiment performed at the University of Cincinnati, wherein reflections of a large-
amplitude acoustic pulse from a compressor were measured. The metrics for comparison are the pulse strength (time
integral of the pulse amplitude) and wave form (shape). When the compressor is modeled by stage characteristics the
computed strength is about 10% greater than that for the experiment, but the wave shapes are in poor agreement. An
alternate approach that uses a fixed rise in duct total pressure and temperature (so-called "lossy" duct) to simulate a
compressor gives good pulse shapes but the strength is about 30 percent low.
14. SUBJECT TERMS
Inlet compressor: Unstart: Code coupling
17. SECURITY CLASSIFICATION
OF REPORT
Unclassified
NSN 7540-01-280-5500
18. SECURITY CLASSIFICATION
OF THIS PAGE
Unclassified
19. SECURITY CLASSIFICATIONOF ABSTRACT
Unclassified
15. NUMBER OF PAGES
2216. PRICE CODE
AO_20. LIMITATION OF ABSTRACT
Standard Form 298 (Rev. 2-89)
Prescribed by ANSI Std. Z39-18
298-102