Unknown Identification of Active Ingredients in Sunscreen using In-frared ATR, DRIFT, and ¹H NMR...
12
Unknown Identification of Active Ingredients in Sunscreen using Infrared ATR, DRIFT, and ¹H NMR Spectroscopy Foreman, Hannah; Thompson, Evan; Wilson, Kyle Marshall University, 1 John Marshall Drive, Huntington, WV 25755 ABSTRACT: Infrared and ¹H NMR spectroscopy are commonly used to identify unknown chemical compounds. This study examines the applications of these instrumental techniques to analyze active ingredients in Coppertone Ultra Guard SPF 50. Within infrared spectroscopy, the specific modifications of ATR-IR and DRIFT were employed. ATR-IR and DRIFT were effective in identifying the functional groups and their chemical bonds. However, DRIFT was only able to be used to analyze the solid active ingredients. Another limitation was the similarities in functional groups that each active ingredient possessed. The specific carbon-hydrogen framework for each compound was able to be determined by ¹H NMR. Therefore, the combined use of all three spectroscopic methods provided the most conclusive results. INTRODUCTION. Sunscreens are used in order to protect the skin from the harmful mutagenic effects of UVA and UVB radiation. Active ingredients that protect the skin, typically work in one of two ways: 1) by reflecting the UV rays or 2) by absorbing the radiation and converting it to heat.¹’² The basis of this study was to analyze organic compounds that absorb UV radiation. The following common active ingredients that are found in sunscreen were used in this study: avobenzone (1-(4-tert- Butylphenyl)-3-(4-methoxyphenyl)- 1, 3-propanedione), octocrylene (2-ethylhexyl 2-cyano-3, 3- diphenylacrylate), oxybenzone (2- Hydroxy-4-methoxybenzophenone), octyl methoxycinnamte (2- Ethylhexyl 4-methoxycinnamate), and octyl salicylate (2-Ethylhexyl salicylate). Active ingredients are substances contained in a pharmaceutical drug that are biologically active. 3 The active ingredients found in sunscreen consist mainly of aromatic molecules conjugated with carbonyl groups. This structure allows the molecules to absorb high-energy ultraviolet rays, such as UVA or UVB and release the energy as lower-energy rays. Breaking down UVA and UVB provides the basis for protecting the skin. Some active ingredients will breakdown when exposed to UV light and therefore, are not able to retain the UV light; this is known to happen with the ingredient Avobenzone. 4
-
Upload
evanthompson -
Category
Documents
-
view
86 -
download
3
description
Infrared and ¹H NMR spectroscopy are commonly used to identify unknown chemical compounds. This study examines the applications of these instrumental techniques to analyze active ingredients in Coppertone Ultra Guard SPF 50. Within infrared spectroscopy, the specific modifications of ATR-IR and DRIFT were employed. ATR-IR and DRIFT were effective in identifying the functional groups and their chemical bonds. However, DRIFT was only able to be used to analyze the solid active ingredients. Another limitation was the similarities in functional groups that each active ingredient possessed. The specific carbon-hydrogen framework for each compound was able to be determined by ¹H NMR. Therefore, the combined use of all three spectroscopic methods provided the most conclusive results.
Transcript of Unknown Identification of Active Ingredients in Sunscreen using In-frared ATR, DRIFT, and ¹H NMR...
Unknown Identification of Active Ingredients in Sunscreen using In-frared ATR, DRIFT, and ¹H NMR Spectroscopy
Foreman, Hannah; Thompson, Evan; Wilson, Kyle
Marshall University, 1 John Marshall Drive, Huntington, WV 25755
ABSTRACT: Infrared and ¹H NMR spectroscopy are commonly used to identify unknown chemical com-pounds. This study examines the applications of these instrumental techniques to analyze active ingredients in Coppertone Ultra Guard SPF 50. Within infrared spectroscopy, the specific modifications of ATR-IR and DRIFT were employed. ATR-IR and DRIFT were effective in identifying the functional groups and their chemical bonds. However, DRIFT was only able to be used to analyze the solid active ingredients. Another limitation was the similarities in functional groups that each active ingredient possessed. The specific carbon-
hydrogen framework for each compound was able to be determined by ¹H NMR. Therefore, the combined use of all three spectroscopic methods provided the most conclusive results.
INTRODUCTION. Sunscreens are used in order to protect the skin from the harmful mutagenic ef-fects of UVA and UVB radiation. Active ingredi-ents that protect the skin, typically work in one of two ways: 1) by reflecting the UV rays or 2) by ab-sorbing the radiation and converting it to heat.¹’² The basis of this study was to analyze organic compounds that absorb UV radiation. The follow-ing common active ingredients that are found in sunscreen were used in this study: avobenzone (1-(4-tert-Butylphenyl)-3-(4-methoxyphenyl)-1, 3-propanedione), octocrylene (2-ethylhexyl 2-cyano-3, 3-diphenylacrylate), oxybenzone (2-Hydroxy-4-methoxybenzophenone), octyl methoxycinnamte (2-Ethylhexyl 4-methoxycinnamate), and octyl sal-icylate (2-Ethylhexyl salicylate). Active ingredi-ents are substances contained in a pharmaceutical drug that are biologically active.3 The active ingre-dients found in sunscreen consist mainly of aro-matic molecules conjugated with carbonyl groups. This structure allows the molecules to absorb high-energy ultraviolet rays, such as UVA or UVB and release the energy as lower-energy rays. Breaking down UVA and UVB provides the basis for pro-tecting the skin. Some active ingredients will breakdown when exposed to UV light and there-fore, are not able to retain the UV light; this is known to happen with the ingredient Avobenzone.4
Usually, the active ingredients that are easily bro-ken down are paired with chemical stabilizers that slowdown the degrading processes. Octocrylene is known to be a chemical stabilizer as well as an ac-tive ingredient.⁴ The first objective of this study was to determine the molecular structure of the
five active ingredients using the following instru-mentation: Nicolet 380 FT-IR, Nicolet iS50 FT-IR, and a Varian Unity+ 500 MHz NMR. The Nicolet 380 FT-IR and iS50 FT-IR were utilized to iden-tify the functional groups that consist within the active ingredients. The identification was based on major absorption bands that were produced in the spectrum. The two Infrared spectroscopies (IR) were compared by analyzing the spectra produced. IR spectroscopy is limited in determining molecu-lar structures; it is utilized best for identifying functional groups within a molecular structure. To retrieve the most information about the active in-gredients it is best to couple IR spectroscopy with NMR spectroscopy. The Varian Unity+ 500 MHz NMR was used for determining the chemical struc-ture of the five active ingredients. NMR spec-troscopy was also used to confirm the chemical makeup of the active ingredients. The second ob-jective of this study was to compare and identify the active ingredients in sunscreen. IR spec-troscopy, as mentioned previously, was used to de-termine the chemical makeup of the sunscreen. The sunscreen that was used in this study was Coppertone Ultra Guard® SPF 50 with 3% avobenzone, 13% homosalate, 5% octisalate, 4% oxybenzone, and 7% octocrylene By comparing the sunscreen IR spectra with the active ingredient spectra the active ingredient was identified in the sunscreen.
MATERIALS & INSTRUMENTS. The sunscreen used was Coppertone Ultra Guard® SPF 50 re-ported 3% avobenzone, 13% homosalate, 5% octi-
salate, 4% oxybenzone, and 7% octocrylene (see Figure 1 for graphic of the sunscreen).
All organic active ingredients were purchased from Sigma Aldrich. IR spectroscopy used in this study included ATR-IR and DRIFT-IR attachments that were used to make modifications to the instrument. Figure 2 shows a general concept map of the IR spectrometer. ATR-IR (attenuated total re-flectance infrared spectroscopy) was used for the analysis of functional groups that are present in each active ingredient contained in the sunscreen. The ATR-IR has an external reflection crystal used to hold the sample. Ranges 500 cm⁻¹ to 4000 cm⁻1
was used for analysis of characteristic vibrational frequencies. 64 scans were taken of each sample in a resolution of 2 cm⁻¹.² Figure 3 shows a concept map of the ATR-IR. DRIFT-IR (diffuse re-flectance Fourier transform) was also used to ana-lyze the functional groups that are present in each active ingredient. Sunscreen analysis was not per-formed using DRIFT-IR, as the sunscreen poten-tially could rub off while inside the instrument causing inaccurate results. The gold plated disc is used to hold the sample. The 500 – 4000 cm⁻¹range was used for the ATR-IR analysis of characteristic vibrational frequencies with 64 scans taken in a resolution of 2 cm−1.
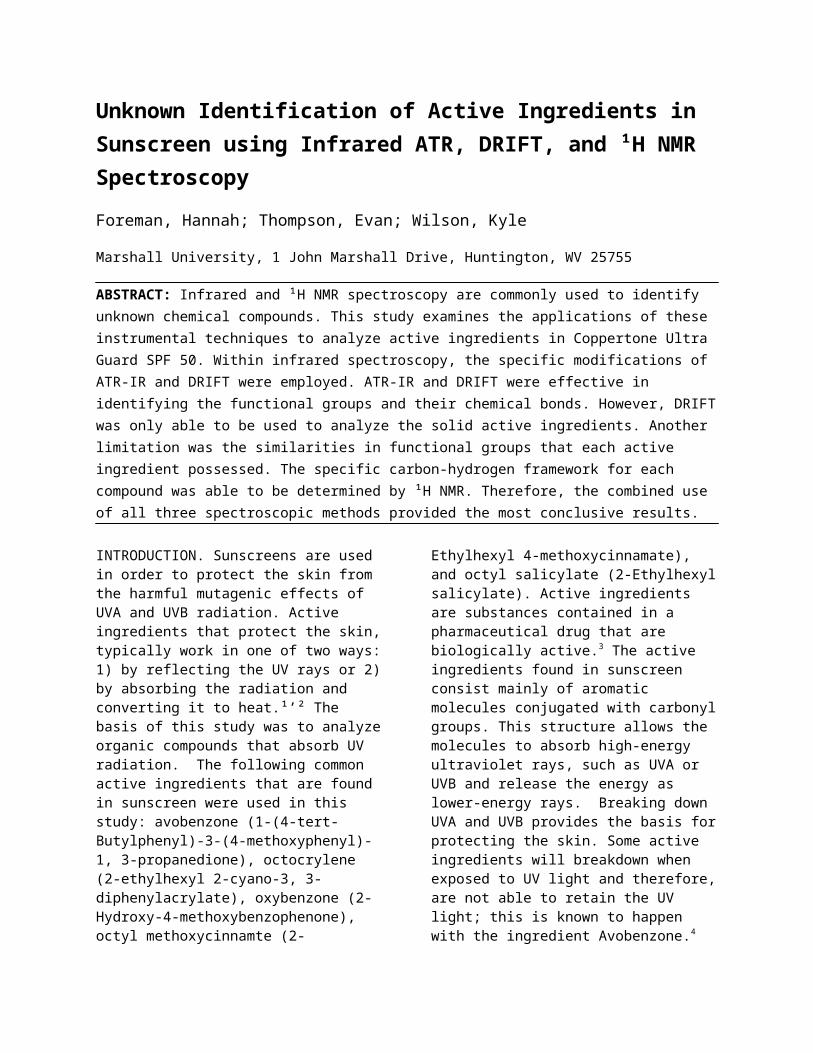
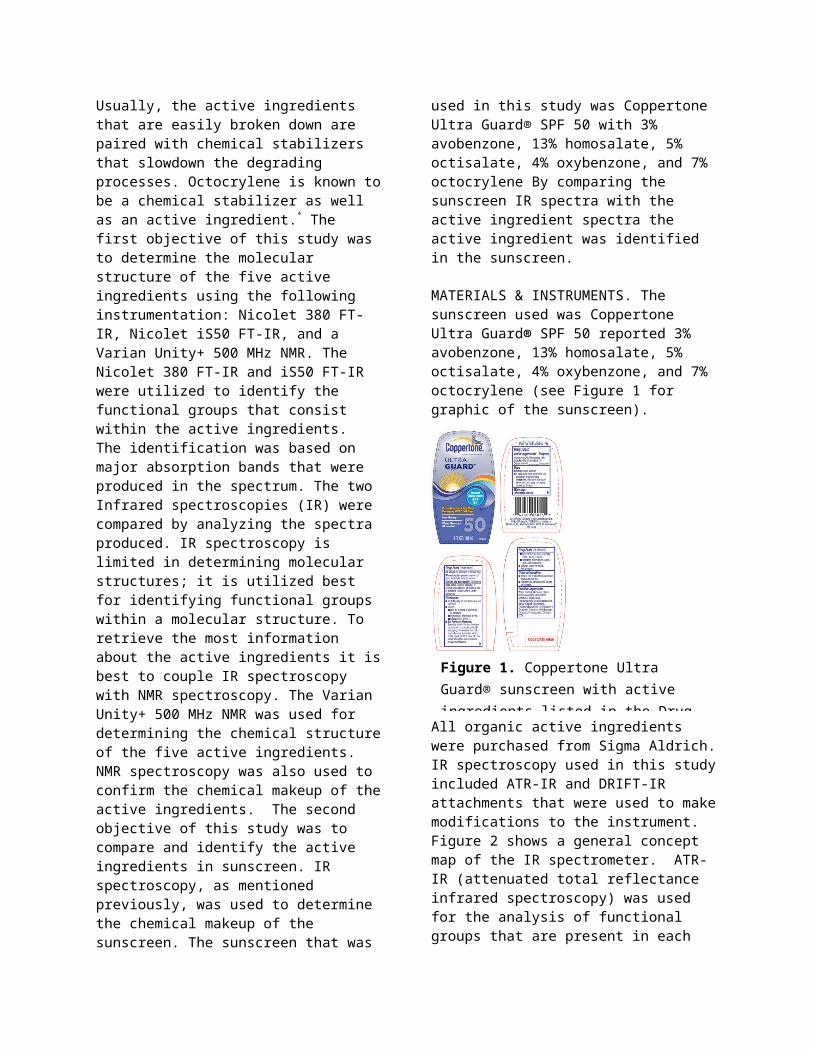
Figure 4 shows a concept map of the DRIFT-IR. NMR (nuclear magnetic resonance) spectroscopy was used for determining the molecular conforma-tion of the carbon-hydrogen framework and deter-mining the purity of the active ingredients. Figure 5 shows a concept map of the NMR.
Figure 1. Coppertone Ultra Guard® sunscreen with active ingredients listed in the Drug Facts
Figure 2. Infrared Spectrometer experimental setup. Light enters from laser on the left through beam splitter, passing through sample to detector.
Figure 3. ATR-IR experimental setup. Light enters from interferometer on the left and passes through the sample on the crystal to the detector on the right.

EXPERIMENTAL. To begin analysis of all or-ganic active ingredients, a background spectrum was obtained. All five were analyzed first using a Nicolet 380 Fourier Transform ATR-IR by placing a very small amount of each on the germanium crystal of the instrument. The experimental setup used was 64 scans and a resolution of 2 cm−1 .Coppertone Ultra Guard sunscreen SPF 50 was also analyzed using ATR-IR so that the spectrum could be compared with that of the active ingredi-ents. Only the solid samples, avobenzone and oxy-benzone, could be analyzed using a Nicolet iS50 Fourier Transform DRIFT-IR due to a specifica-tion of the instrument. After a background spec-trum was taken, a small amount of oxybenzone and avobenzone were placed on the gold plated
disc. The experimental setup used was also 64 scans with a resolution of 2 cm−1 . All five active ingredients were analyzed using a Varian Unity 500+ MHz proton NMR as a complementary in-strument. The samples were prepared by transfer-ring 50 μl or 50 μg of the active ingredient and adding enough chloroform-d to obtain a height of 5 cm in the NMR tube. Once each sample had com-pletely dissolved, the NMR tubes were inserted one-at-a-time into the NMR for analysis.
RESULTS & DISCUSSION. The two different In-frared techniques, ATR and DRIFT, were first used to identify the functional groups and bond stretches found in each active ingredient. The five organic active ingredients that were analyzed on the Nicolet 380 ATR-IR were octyl salicylate (fig-ure 1), octocrylene (figure 2), oxybenzone (figure 3), avobenzone (figure 4), and 2-ethylhexyl -4-methoxycinnamate (figure 5). The peaks were ana-lyzed and labelled accordingly for each spectrum.
Figure 1. ATR-IR spectrum of octyl salicylate recorded on a Nicolet 380 ATR-IR. Each peak is labelled accordingly to the functional groups and bonds found in the active ingredient.
Figure 2. ATR-IR spectrum of octocrylene recorded on a Nicolet 380 ATR-IR. Each peak is labelled accordingly to the functional groups and bonds found in the active ingredient.
Figure 4. DRIFT-IR experimental setup. Light enters from interferometer from the left, passes through sample in gold plated disc to the detec-tor on the right.
Figure 5. NMR experimental setup. Sample is irradiated with periodic pulse of radio fre-quency. The energy detected through sample to magnetic field.
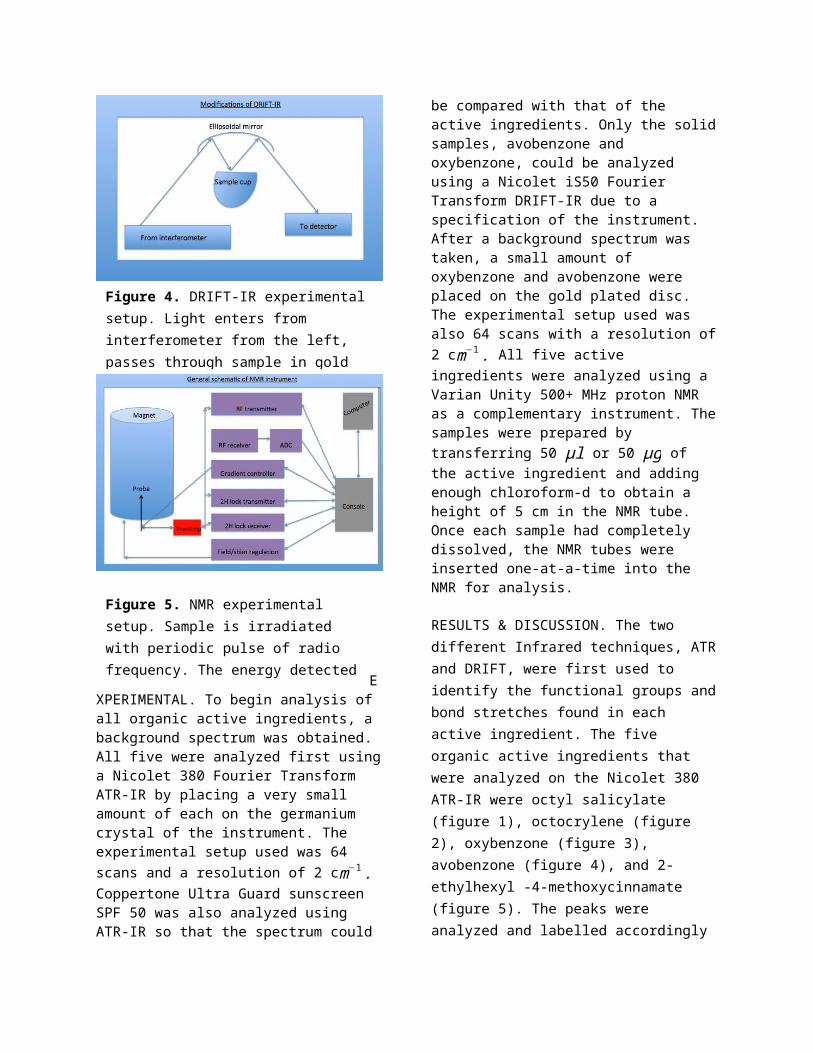
Figure 3. ATR-IR spectrum of oxybenzone recorded on a Nicolet 380 ATR-IR. Each peak is labelled accordingly to the functional groups and bonds found in the active ingredient.
Figure 4. ATR-IR spectrum of 2-ethylhexyl-4-methoxycinnamate recorded on a Nicolet 380 ATR-IR. Each peak is labelled accordingly to the functional groups and bonds found in the active in-gredient.
Figure 5. ATR-IR spectrum of 2-ethylhexyl-4-methoxycinnamate recorded on a Nicolet 380 ATR-IR. Each peak is labelled accordingly to the functional groups and bonds found in the active in-gredient.
The main bands and groups found in all of the active ingredients are a benzene ring with aromatic carbon-carbon double bonds, carbon-oxygen bonds, and carbon-oxygen double bonds. Octocry-
lene has a unique carbon-nitrogen triple bond while octyl salicylate and oxybenzone both should have exhibited alcohol peaks. The oxybenzone ac-tive ingredient standard however did not exhibit the characteristic large and broad peak of the alco-hol group at around 3000 cm¯¹, and even the alco-hol peak for octyl salicylate was very weak. One possibility for this lack of the oxygen-hydrogen bond stretch might be because of background wa-ter in the air. A background spectrum was first run on the ATR-IR in order to eliminate any peaks that might appear from background particles in the air. It could be possible that the air in this laboratory was very humid and background oxygen-hydrogen stretches were eliminated from the samples when they should have been present. When looking at the background obtained on the ATR-IR (figure 6), it was found that there is a very large peak in the oxygen-hydrogen bond region. This peak could very well been caused by water in the air and since it is so significant it may be the cause of the small oxygen-hydrogen peak in the octyl salicylate spec-trum and lack of peak in the oxybenzone spectrum.
Figure 6. Background ATR-IR spectrum obtained on a Nicolet 380 ATR-IR.
Coppertone Ultra Guard Sunscreen SPF 50 was also analyzed to using ATR-IR to see if the active ingredients could be identified from the sunscreen spectrum (figure 7). Coppertone Sunscreen has many more components than just the active ingre-dients being studied which made the identification of peaks problematic and the spectrum observed was not very clear for any one active ingredient. From the spectrum, it can be determined that there is an oxygen-hydrogen stretch represented by the peak at 3300 cmˉ¹ and a carbon-oxygen double

bond by the peak at 1650 cmˉ¹, however not much more information can be gathered. Another issue with trying to determine the active ingredients from the sunscreen alone is that the bands ob-served many not have been from the active ingre-dients at all, but from other components in the sun-screen. The oxygen-hydrogen stretch could have just come from water and not an active ingredient, likewise the carbon-oxygen double bond stretch observed may have come from one of the inactive ingredients as well.
Figure 7. ATR-IR spectrum of Coppertone Ultra Guard sunscreen SPF 50 analyzed by a Nicolet 380 AT-IR. Prominent peak at 3300 indicates the pres-ence of water and the 1650 peak suggests the pres-ence of possible aldehydes, ketones, carboxylic acids, or esters in the sunscreen. The active ingre-dients are 3% avobenzone, 13% homosalate, 5% octyl salicylate, 7% octocrylene, and 4% oxyben-zone.
DRIFT spectra were taken using Nicolet iS50 FTIR with Smart Diffuse Reflectance Accessory. This particular instrument can only analyze dry samples, because in order to get diffuse reflectance the beam must be able to penetrate into the sample and interact with molecules inside of the sample matrix. With wet samples, there is a higher risk of specular reflectance where the beam just bounces off of the surface of the sample which interferes and gives poor readings for the DRIFT spectrum. Therefore, only two of the active ingredients could be analyzed on this instrument as they came in a solid powder form and not a liquid form. The two active ingredients that were analyzed using this in-
strument was oxybenzone (figure 8) and avoben-zone (figure 9).
Figure 8. DRIFT spectrum of oxybenzone ana-lyzed by a Nicolet iS50 FTIR with Smart Diffuse Accessory. Each peak is labeled accordingly to the functional groups and bond stretches found in the active ingredient.
Figure 9. DRIFT spectrum of avobenzone ana-lyzed by a Nicolet iS50 FTIR with Smart Diffuse Accessory. Each peak is labeled accordingly to the functional groups and bond stretches found in the active ingredient.
The band stretches in DRIFT are not as distinct and clear as those obtained with the ATR-IR. This is to be expected because peaks in DRIFT are known to be broader. One issue experienced how-ever with this instrument was the presence of an oxygen-hydrogen bond in the spectrum of avoben-zone. Avobenzone does not have any hydroxy groups and should not have such a distinct and broad band in this area. This peak may also have been caused by issues with particles in the air not being eliminated in initial background spectrum. It is possible that this background spectrum did not detect the hydrogen-oxygen stretch of water in the air, however when the sample was being analyzed

the background humidity of the air was detected and added to the spectrum. Looking at the back-ground DRIFT spectrum (figure 10), is clear that there was no peak detected in the oxygen-hydro-gen bond stretching region and thus this peak was not eliminated from the two samples as back-ground.
Figure 10. Background DRIFT spectrum analyzed by a Nicolet iS50 FTIR with Smart Diffuse Acces-sory.
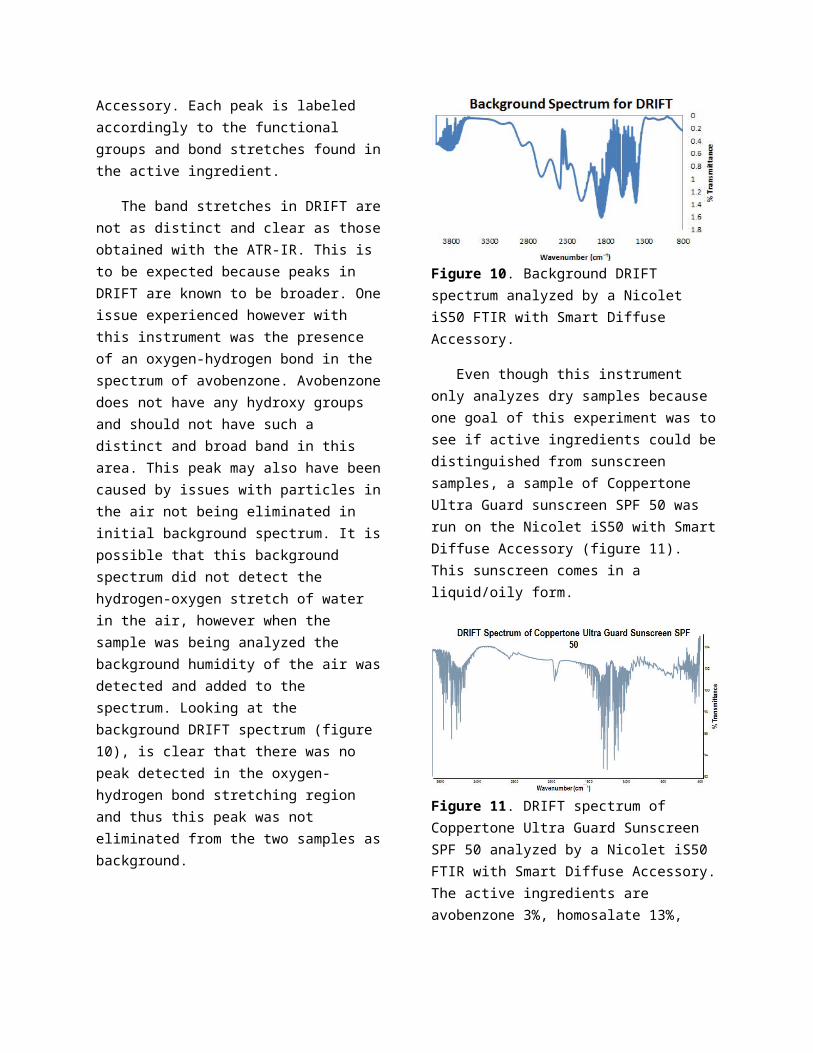
Even though this instrument only analyzes dry samples because one goal of this experiment was to see if active ingredients could be distinguished from sunscreen samples, a sample of Coppertone Ultra Guard sunscreen SPF 50 was run on the Nicolet iS50 with Smart Diffuse Accessory (figure 11). This sunscreen comes in a liquid/oily form.
Figure 11. DRIFT spectrum of Coppertone Ultra Guard Sunscreen SPF 50 analyzed by a Nicolet iS50 FTIR with Smart Diffuse Accessory. The ac-tive ingredients are avobenzone 3%, homosalate 13%, octyl salicylate 5%, octocrylene 7%, and oxybenzone 4%.
From the recorded spectrum, it is clear that there are not any peaks that can be used to adequately identify any bond stretches of components of the sunscreen. This poor quality spectrum may have been because the sunscreen was not in a solid dry powder form. In order for diffuse reflectance to work the beam from the source must be able to penetrate the sample and interact with the inner matrix of the compound. Because the sunscreen was not a solid, it is very likely that the beam just reflected off of the surface creating specular re-flectance which would have thrown off the detec-tor trying to detect diffuse reflectance.
The third form of analysis used was ¹H NMR in order to determine how the hydrogen bonds were arranged around the molecule. The five organic ac-tive ingredients that were analyzed on the Varian Unity+ 500 MHz NMR were octyl salicylate (fig-ure 12), octocrylene (figure 13), oxybenzone (fig-ure 14), avobenzone (figure 15), and 2-ethylhexyl -4-methoxycinnamate (figure 16). The peaks were analyzed and labelled accordingly for each spec-trum.
Figure 12. ¹H Nuclear Magnetic Resonance (NMR) spectrum of unknown active ingredient octyl salicylate taken on a Varian Unity+ 500 MHz NMR. Peaks are labeled to show where matches in the chemical structure. All samples were dissolved in chloroform-d in NMR tubes.

Figure 13. ¹H Nuclear Magnetic Resonance (NMR) spectrum of unknown active ingredient oc-tocrylene taken on a Varian Unity+ 500 MHz NMR. Peaks are labeled to show where matches in the chemical structure. All samples were dissolved in chloroform-d in NMR tubes.
Figure 14. ¹H Nuclear Magnetic Resonance (NMR) spectrum of unknown active ingredient oxybenzone taken on a Varian Unity+ 500 MHz NMR. Peaks are labeled to show where matches in the chemical structure. All samples were dissolved in chloroform-d in NMR tubes.
Figure 15. ¹H Nuclear Magnetic Resonance (NMR) spectrum of unknown active ingredient avobenzone taken on a Varian Unity+ 500 MHz
NMR. Peaks are labeled to show where matches in the chemical structure. All samples were dissolved in chloroform-d in NMR tubes.
Figure 16. ¹H Nuclear Magnetic Resonance (NMR) spectrum of unknown active ingredient 2-ethylhexyl-4-methoxycinnamate taken on a Varian Unity+ 500 MHz NMR. Peaks are labeled to show where matches in the chemical structure. All sam-ples were dissolved in chloroform-d in NMR tubes.
The ¹H NMR spectrum obtained with the Varian Unity+ 500 MHz NMR were as expected. All of the hydrogens were identified for each of the com-pounds and the spectra of the active ingredients matched that of spectra found on the Spectral
Database for Organic Compounds (SDBS).⁵ The Coppertone Ultra Guard sunscreen SPF 50 was not run on the NMR, because NMR is only able to identify one unknown or known compound at a time. Using this instrument on a sunscreen sample would have produced a spectrum with too many peaks to be identified.
CONCLUSION. From the initial analysis of active ingredients and sunscreen using Infrared spec-troscopy it was clear that although infrared spec-troscopy is extremely useful in the identification of functional groups and bands in the active ingredi-ents, it was not a good method of analysis of the sunscreen. Using infrared spectroscopy, an un-known ingredient could be fairly accurately identi-fied, however in the analysis of unknown active in-gredients of sunscreen the identification of such compounds is still difficult. The active ingredients
in sunscreens share many of the same functional groups and band stretches, so determining an un-known active ingredient from an infrared spectrum using the list of possible active ingredients ap-proved by the FDA may prove to be a bit difficult. One other problem experienced with infrared spec-troscopy was the issue with the background scan removing or not removing peaks that then inter-fered with the obtained spectra of the active ingre-dients. There were also some issues with using in-frared spectroscopy on an actual sunscreen sample to determine the active ingredients that it contains. Sunscreen cannot be identified using DRIFT be-cause this can only analyze solid samples, and when using ATR-IR the interference from inactive ingredients prevented the identification of the ac-tive ingredients based on the spectrum obtained. In future experimentation, a way to create a less hu-mid lab environment would help with the oxygen-hydrogen peak issues or if possible a tighter seal on the instruments to prevent background air inter-ference may be preferable. Another option for fu-ture experimentation might be to try and dry out the sunscreen samples so that any peaks created by oil and water are removed and so that the samples could be run on DRIFT. Separating out the compo-nents of the sunscreen could also be another option so that each ingredient can be scanned indepen-dently which would prove for easier analysis.
¹H NMR was an effective technique for identifying hydrogens in the known samples and would thus be effective in determining unknown active ingre-dients. One concern with this however is that since each ingredient has many different groups it can be difficult to identify individual peaks that may over-lap. Increased number of scans on the instrument will help with this problem and running a DEPT spectrum would help to identify the amount of hy-drogens in each group. ¹H NMR is not an effective way of analyzing sunscreen samples and could only be used if the sunscreen was separated into its different compounds. In the end however, the cou-pled used of infrared spectroscopy and ¹H NMR is a very effective way to analyze known samples and to identify unknown active ingredients. In-frared spectroscopy is very effective in identifying
functional groups and bond stretches, while ¹H NMR is very effective in the identification of the types of hydrogens in an active ingredient. These two instrumental analysis methods are comple-mentary of each other and would help to make an accurate identification of an unknown active ingre-dient.
Acknowledgements
All preparation and data collection was performed by students of Marshall University’s CHM 411 class with assistance from Rosalynn Quinoñes, Ph.D.
References
(1) Fairhurst, D.; Gillies, R.; Kollias, N.; Mitch-nick, M. A.; Pinnell, S. R., Dermatol Surg. 2000, 26, 309-314.
(2) Müller, R. H.; Wissing, S. A. Int. J. Cosmetic Sci. 2001, 23, 233-243.
(3) Lee, D; Marks, J. M. MedicineNet. Drug Inter-actions: Know the Ingredients, Consult Your Physician. 2009.
(4) Beasley, D. G.; Meyer, T. A. Am. J. Clin. Der-matol. 2010, 11, 413-421.
(5)National Institute of Advanced Industrial Sci-ence and Technology. Spectral Database for Or-ganic Compounds SDBS. http://sdbs.db.aist.go.jp/sdbs/cgi-bin/cre_index.cgi (accessed Apr 24, 2014)