University Research Alliances, Absorptive Capacity,...
29
Discussion Paper No. 14-094 University Research Alliances, Absorptive Capacity, and the Contribution of Startups to Employment Growth Andrew A. Toole, Dirk Czarnitzki, and Christian Rammer
Transcript of University Research Alliances, Absorptive Capacity,...

Dis cus si on Paper No. 14-094
University Research Alliances, Absorptive Capacity, and the Contribution
of Startups to Employment Growth
Andrew A. Toole, Dirk Czarnitzki, and Christian Rammer

Dis cus si on Paper No. 14-094
University Research Alliances, Absorptive Capacity, and the Contribution
of Startups to Employment Growth
Andrew A. Toole, Dirk Czarnitzki, and Christian Rammer
Download this ZEW Discussion Paper from our ftp server:
http://ftp.zew.de/pub/zew-docs/dp/dp14094.pdf
Die Dis cus si on Pape rs die nen einer mög lichst schnel len Ver brei tung von neue ren For schungs arbei ten des ZEW. Die Bei trä ge lie gen in allei ni ger Ver ant wor tung
der Auto ren und stel len nicht not wen di ger wei se die Mei nung des ZEW dar.
Dis cus si on Papers are inten ded to make results of ZEW research prompt ly avai la ble to other eco no mists in order to encou ra ge dis cus si on and sug gesti ons for revi si ons. The aut hors are sole ly
respon si ble for the con tents which do not neces sa ri ly repre sent the opi ni on of the ZEW.

University Research Alliances, Absorptive Capacity, and
the Contribution of Startups to Employment Growth1,2
Andrew A. Toole a,d, Dirk Czarnitzki b,c,d, and Christian Rammer d
a USDA, Economic Research Service, Washington DC, United States b KU Leuven, Dept. of Managerial Economics, Strategy and Innovation, Leuven, Belgium
c Center for R&D Monitoring (ECOOM) at KU Leuven, Belgium d Centre for European Economic Research (ZEW), Mannheim, Germany
Abstract This paper examines how university research alliances and other cooperative links with universities contribute to startup employment growth. We argue that “scientific absorptive capacity” at the startup is critical for reaping the benefits from university research alliances, but not necessarily for other university connections. We also estimate the aggregate employment contribution from startup firms and attribute those employment gains to university research alliances and other university connections. We find significant contributions to employment growth from university research alliances and other university connections, but scientific absorptive capacity is critical for university research alliances. Only 7% of the startup population maintained a university research alliance, but among these firms, 3.4% of their total jobs created were attributable to their alliances. These results suggest university connections are quite important for job growth and university research alliances contributed substantially to job creation for those firms that had such alliances.
Keywords: Academic Entrepreneurship, Startups, Firm performance, Technology Transfer, University Spinoff Policy, Human Capital
JEL-Classification: L25, L26, J24
Andrew A. Toole U.S. Dept. of Agriculture Economic Research Service 1400 Independence Ave., SW Mail Stop 1800 Washington, DC 20250-1800 USA E-Mail: [email protected]
Dirk Czarnitzki KU Leuven Dept. of Managerial Economics, Strategy and Innovation Naamsestraat 69 3000 Leuven, Belgium E-Mail: [email protected]
Christian Rammer Centre for European Economic Research (ZEW) Dept. of Industrial Economics and International Management L 7, 1 68161 Mannheim, Germany E-Mail: [email protected]
1 We are grateful to Jürgen Egeln, Sandra Gottschalk and Alfred Spielkamp for providing access to the survey data, and to Sandra Gottschalk and Jürgen Moka for extracting information from the Creditreform database. We also thank one anonymous referee and Al Link for helpful comments. 2 The views expressed in this article are the author’s and do not necessarily represent the views of the U.S. Department of Agriculture or the Economic Research Service.

1
1 Introduction
An emerging body of research focuses on the role of startup companies in job creation. One
finding from this work identifies startups as a major source of new jobs. For instance,
Haltiwanger (2012) found that new firms accounted for 18 percent of gross job creation in the
U.S. between 1980 and 2009. Neumark, Zhang, and Wall concluded that “new firms
contribute more to job creation than do new branches of existing firms, with the former
contribution sometimes as much as twice as large.” (2006, 90). A second finding from this
work identifies startups as more volatile than mature firms. Haltiwanger, Jarmin, and
Miranda (2013) call this an “up-or-out” dynamic. Young firms that survive often grow
rapidly, but many startups exit and this leads to higher rates of job destruction. The new
insight from this work is the “up” dynamic. It moves the literature beyond the question of
survival toward a focus on how startups create jobs post-entry.
In this paper, we examine how research alliances and other cooperative links with universities
contribute to startup employment growth.3 It is well known from prior work that new and
young companies face serious challenges when trying to access the resources needed to build
strong capabilities for growth, especially in knowledge-intensive industries (Baum, Calabrese,
and Silverman 2000). Relationships with established and reputable organizations such as
research universities can provide market credibility or access to valuable intangible and
tangible assets such as knowledge, skilled personnel, and specialized equipment (Teece 1986;
Stuart 2000). Although a growing literature exists on small and medium-sized enterprises, we
did not find any studies that examined how university research alliances or other university
linkages contribute to employment growth for startup companies outside of the biotechnology
sector (Link and Wessner 2012).
Our research makes three main contributions. First, it not only examines the direct effects of
university research alliances and other linkages on startup performance, but goes further to
argue that the scientific absorptive capacity of the startup is critical for harnessing the benefits
from university research alliances. Second, the up-or-out dynamic suggests only the most
3 Throughout the paper we will use “university” as shorthand for all public research organizations (PROs) in the not-for-profit sector.
2
robust firms survive. To account for potential upward bias from survivorship, we use a
Heckman selection model with data for the selection equation drawn from a separate
comprehensive source that documents the annual population of startup companies. Third, the
employment analysis is based on a representative sample of all startups in knowledge-
intensive industries in Germany. The survey design allows us to estimate the aggregate
employment contribution from startup firms and attribute any employment gains to university
research alliances and other university connections.
The rest of the paper is organized as follows. In Section 2 we briefly summarize prior work
and state our hypotheses. Section 3 describes the empirical model and the data. Section 4
presents the empirical results, and section 5 concludes with some reflections on the main
findings and policy implications.
2 Literature and Hypotheses
Exploring the sources of job creation in the US and Europe, an emerging literature
emphasizes the central role of firm age as opposed to firm size (Haltiwanger, Jarmin, Miranda
2013; Anyadike-Danes et al. 2013; Czarnitzki and Delanote 2012; Neumark, Zhang, and Wall
2006). Conditional on survival, a main finding is that startup companies contribute a
disproportionate share to total job creation. When startups survive for some defined period of
time, they can also be called “young firms.” As described in section 3, all of the startups
analyzed in this paper are young firms that had survived one to six years at the time of
analysis. For Haltiwanger, Jarmin, and Miranda (2013) young firms are particularly
important. They found that companies between one and five years old made the largest
contributions to employment growth. In a follow-on study, Hathaway (2013) offered further
insights into the sector composition of these findings. He found that young firms in high
technology sectors were responsible for creating most of the job growth in the U.S. Industries
with large shares of technology-oriented workers, which closely match the knowledge-
intensive sectors we analyze below for Germany, created jobs at twice the average rate
compared to the overall private sector. These studies suggest that surviving startups (i.e.
young firms) in knowledge-intensive industries are an important source of economy-wide
employment growth.
But how do young firms in knowledge-intensive industries create jobs? The conventional
framework models growth as a function of the characteristics of the founding team, resource

3
endowments of the new venture at the time of entering the market, and aspects of its external
environment (see Storey 1994). In a recent review of the literature, McKelvie and Wiklund
(2010) found that relatively few studies went beyond this framework to address how firms
grow. They argued that research should incorporate the modes of growth: organic (i.e.
through internal resources), acquisition, and hybrid. The hybrid mode involves “contractual
relationships that bind external actors to the firm at the same time as the firm maintains a
certain amount of ownership and control over how any assets are used” (McKelvie and
Wiklund 2010, 274).4 Our analysis follows their recommendation and focuses on
employment growth due to a particular form of hybrid growth, that is, university research
alliances. These alliances are contractual relationships between young enterprises and
universities formed in the first years after market entry.5 They involved pooled and
coordinated research and development (R&D) activities using joint R&D projects.
University research alliances are likely to be valuable to young firms in knowledge-intensive
industries and may help explain how these companies achieve superior employment growth.
Unlike traditional industries, knowledge-intensive industries such as biopharmaceuticals and
telecommunications are highly competitive, technologically dynamic, and driven by
innovation. Teece (1986; 1992) argued convincingly that highly competitive environments
that are driven by innovation are well suited for various forms of cooperation. His framework
suggests young firms in technologically dynamic environments are likely to form
relationships with the owners of complementary assets as long as transaction costs and the
risk of appropriation are sufficiently low. Using a sample of relatively young technology-
based firms in Italy, Columbo, Grilli, Piva (2006) found support for the idea that
complementary assets are a motivation for alliance formation. Okamuro, Kato, Honjo (2011)
argued that the background of the founding team determines the type of partner. Using a
4 Hybrid growth is a broad category that encompasses a variety of inter-organizational arrangements including inter-firm strategic alliances, franchising, technology licensing, and so forth. See Hagedoorn, Link, and Vonortas (2000) for a summary of prior literature as well as the various theoretical perspectives on research partnership motivations. 5 In the literature, joint R&D projects are sometimes referred to as partnerships, collaborations, or cooperation agreements. As long as these alternatives meet the definition of the hybrid mode given in the text, they are conceptually equivalent.

4
sample of Japanese startups, their results show a positive association between the presence of
an academic founder and having a university research alliance.6
To stimulate employment growth, university research alliances need to increase the workforce
at the startup. This can happen by boosting labor demand through greater innovation and
sales or by freeing up resources by increasing labor productivity or lowering search and hiring
costs. In the framework of Teece (1992), these effects would flow from access to
complementary assets through interactive research alliances. For instance, engagement in the
research process with a university offers exposure to new knowledge that can facilitate the
development of new products and services. Joint R&D projects may allow access to
specialized equipment that would otherwise be cost prohibitive. These projects also bring the
company founders and research personnel into direct working relationships with the skilled
university personnel and graduate students.
For startups or young firms, the empirical literature offers few results on these potential
impacts, but some findings exist in the literature on biotechnology firms.7 For a sample of
startups, Baum, Calabrese, and Silverman (2000) found that university alliances were
associated with increased revenue and patenting while alliances with research institutes
increased employees and R&D expenses. Haeussler, Patzelt, and Zahra (2012) found that the
number of university research alliances is positively related to new product development
using a sample of relatively young firms from the United Kingdom and Germany. Zucker,
Darby, and Armstrong (2002) used co-authorship on publications between academic and
industry scientists to proxy for collaboration through joint R&D projects. Their results
showed that various measures of success such as patents, products on the market, and
products in development significantly increased with the degree of collaboration with
university scientists. They also found that the level of employment at the firms increased with
the number of collaborations. Based on this literature we postulate:
6 A much broader literature exists on the motivations for forming university research alliances and other university links; however, young firms are rarely discussed (see, for instance, Fontana, Geuna, and Matt 2006; Belderbos, Carree, and Lokshin 2004; Veugelers and Cassiman 2005). 7 There are many more studies in the literature that generally find positive effects of university research alliances on innovation, sales, and labor productivity if one does not restrict attention to startups or young firms. For this literature, refer to the following papers and the references therein: Falk (2013), Robin and Schubert (2013), Aschhoff and Schmidt (2008), and Arvanitis, Sydow, and Woerter (2008).

5
H1: Startups grow faster in terms of employment when they engage in university
research alliances, ceteris paribus.
Beyond cooperative research alliances, startups and young firms can establish a wide range of
other types of connections to universities such as performing contract research for the
university, contracting research out to the university, sending employees for training, or
maintaining informal contacts such as attending seminars (Meyer-Krahmer and Schmoch
1998; Schartinger, Rammer, and Fischer 2002).8 These other types of connections may also
allow young firms to increase innovation, sales, labor productivity, or lower search and hiring
costs. In this sense, research alliances and other university connections could be substitutes.
In Teece’s (1986) framework, hybrid modes such as research alliances will be preferred when
R&D projects require transaction-specific investments by each party. Detailed project-level
data would be required to examine these alternatives in any detail. Cassiman, Di Guardo, and
Valentini (2010) analyzed project-level data from a large microelectronics firm and concluded
that alliances will be used for more basic research projects while contracting is preferred for
strategically important projects where only specific components are contracted out to the
university (also see Hall, Link and Scott 2003). With this background, we postulate:
H2: Startups grow faster in terms of employment when they engage in other types of
university connections (such as contract research, contracting-out to the university,
personnel exchange and other more informal means of information exchange) in
addition to collaborative research alliances, ceteris paribus.
Employment growth at startups may also depend on interactions between elements of the
conventional growth framework such as the characteristics of the founding team and the mode
of growth. In particular, the human capital of the founders may moderate the employment
impacts from university research alliances. Because startups are typically small companies,
the human capital of the founders constitutes an important part of the startup’s absorptive
8 Locating in a university science park may help faciliate access to unversity infrastructure, faculty and students (see Link and Scott 2007).

6
capacity. As argued by Cohen and Levinthal (1990), absorptive capacity is the ability to
recognize, assimilate and exploit external information. It depends not only on the knowledge
and experience of the individuals in an organization, but especially on those individuals who
play “boundary-spanning” communication roles at the firm. In our context, we postulate that
the presence of a research-experienced academic founder at the startup provides the necessary
“scientific absorptive capacity” for getting the most out of university research alliances. In
the literature, Zucker, Darby, and Brewer (1998) emphasized that absorptive capacity is
embodied in people based on the observation that intellectual human capital is often tacit
knowledge held by the academic inventor that is difficult to codify and communicate except
through person-to-person interaction in the laboratory. More recently, Haeussler, Patzelt, and
Zahra (2012) argued that the specialization of a biotech firm’s internal technological
capabilities mediates potential alliance benefits and risks.9 Based on this and other literature,
we postulate:
H3: The employment growth effects of university research alliances are greater when
the startup has high scientific absorptive capacity, ceteris paribus.
3 Empirical Model and Data
Model
To investigate our hypotheses about the employment effects of university research alliances
and scientific absorptive capacity, we must account for the up-or-out dynamic of startup
companies. To do this, we use Heckman selection models to control for potential survivor
bias in the population of new ventures over time.10 The outcome equation models
employment growth as a function of the conventional characteristics (founding team, resource
9 A number of studies in the literature examine the moderating and mediating effects of absorptive capacity, but most do not focus on startups or young firms. For this literature, refer to the following papers and the references therein: Subramanian, Lim, and Soh (2013), Lin et al. (2012), Flatten, Greve, and Brettel (2011), and Baba, Schichijo, and Sedita (2009). 10 See e.g. Heckman (1976; 1979), or Verbeek (2012, 248-252) for details on the Heckman selection model.

7
endowments, and external environment), but adds three dichotomous explanatory variables
representing university research alliances, other connections to universities, and the presence
of a research-experienced academic founder. Using the presence of a research-experienced
academic founder to proxy for startup scientific absorptive capacity is consistent with the idea
that communicating and understanding research results often requires tacit knowledge based
on experience. To test hypotheses #1 and #2, the outcome equation in the Heckman model
has the following form:
Emp_Growthi = 0 + 1 U_Res_Alliancei + 2 Other_U_Connecti + 3 Res_AFi +
4 Control_Variablesi + 5 i + i
where the subscript i represents surviving startups and “Control Variables” is shorthand for
all other covariates in the regression specification. Employment growth (Emp_Growth) is
measured in terms of the annualized logarithmic change in the number of employees between
the first year of commercial operation of a new venture (s), and the end of 2001. We are
primarily interested in the signs and significance of and . Hypotheses #1 and #2 predict
these coefficients will be positive and significant. While not our main focus, we also expect
to be positive and significant. Prior research shows that the presence of a research-
experienced academic founder is associated with better startup performance.11 λi denotes the
selection term also known as Heckman’s lambda or Inverse Mills Ratio. A significant
coefficient on the inverse mills ratio indicates adjusting for survivor bias is important. is
the error term denoting all unobserved shocks to growth.
To examine our hypothesis about the moderating role of absorptive capacity, we use
interaction terms between the presence of a research-experienced academic founder (called
Res_AF) and variables indicating whether the startup had a university research alliance
(U_Res_Alliance) or other university connections (Other_U_Connect). The outcome
equation in the Heckman model has the following form:
Emp_Growthi = 0 + 1 Res_AFi + 2 Res_AFi · U_Res_Alliancei +
11 Toole and Czarnitzki (2007, 2009) found that firms with an academic entrepreneur perform better in terms of proof of concept research, patenting, and the receipt of follow-on venture capital investment. Czarnitzki, Rammer, and Toole (2014) found that startups with an academic entrepreneur showed a performance premium over industry startup companies in terms of employment growth.

8
3 No_Res_AFi · U_Res_Alliancei + 4 Res_AFi · Other_U_Connecti +
5 No_Res_AFi · Other_U_Connecti + 6 Control_Variablesi + 7 i + i
As above, the subscript i represents surviving startups and “Control Variables” is shorthand
for all other covariates in the regression specification. We are primarily interested in the signs
and significance of and . If scientific absorptive capacity is important for realizing
employment benefits from university strategic alliances, then should be positive and
significant. Also, the combination of scientific absorptive capacity with university research
alliances, ( ), should be significantly larger than (cf. H3). The variable
Other_U_Connecti captures all other forms of university connections used by the startup such
as contract research, training, and informal relationships. Therefore and are expected to
be positive. We do not have any prior beliefs that scientific absorptive capacity is an
important moderator of non-scientific university connections (i.e. no hypothesis about the
differences in magnitude between and ).
Sample and Survey Method
Our empirical analysis is based on a survey of German firms that were founded in the five
years 1996 to 2000 in “knowledge intensive industries”, i.e. in high-tech manufacturing and
those service sectors where new technologies and human capital are important for
competitiveness (see Appendix 1 for a definition of the sectors used). The new ventures were
surveyed through standardized telephone interviews, using stratified random sampling
combined with quota sampling. For each stratum in the gross sample, new ventures were
ordered randomly and interviews were conducted until a target figure of successful interviews
in each stratum was reached. We used sector groups (high-tech manufacturing, technology-
oriented services, knowledge-intensive consulting), year of foundation (1996-2000), and
region as stratification criteria and applied a disproportional weighting scheme that
oversampled high-tech manufacturing and regions with research universities. This was done
to increase the likelihood of sampling young firms with university alliances or other
university connections and was accounted for in the sampling weights used to make the
population estimates. Interviews were conducted with a person who was part of the founding
team. The interviews took place from late October to early December 2001. The new

9
ventures were between one year (for start-ups founded at the end of 2000) and almost 6 years
(for start-ups founded at the beginning of 1996) old at the time of the interviews.
The sample was drawn from the Mannheim Foundation Panel (MFP) of the Centre for
European Economic Research (ZEW). This data set contains almost all firms founded in
Germany since 1989 and rests on information from Germany’s largest credit rating agency,
Creditreform. In principle, only firms meeting a minimum threshold of economic activity
enter the database. Creditreform transmits information twice a year on newly founded firms
to ZEW where it is transformed into a panel data structure (see Almus, Engel, and Prantl
2000).
The total number of new ventures surveyed is 20,241. In order to realize this number of
interviews, a total of 57,022 firms had to be contacted. Those firms that were contacted but
with whom no interview could be performed fell into two groups: (1) firms that refused to
participate in the survey or could not be contacted during the interview period because the
interviewee was not available (n=25,359) and (2) firms for which the existing contact details
turned out to be incorrect and no better contact information was available (n=11,422). The
response rate of surveyed firms to the total number of successfully contacted firms at the time
of survey was 44.2%.
For those new ventures that could not be successfully contacted due to incorrect contact
details (e.g. invalid phone number), we analyzed whether the firms exited the market prior to
the time of interviews. We used information contained in the MFP on bankruptcy,
insolvency, deregistration from company registers, voluntary closures and other rating-related
information for this purpose. About ninety-seven percent (11,100 out of the 11,422 not
successfully contacted) were identified as non-surviving firms. This means that about 19.5%
of all contacted new ventures ceased business operations soon after starting. Given the high
rate of startup failure, we control for survivor bias using a Heckman selection model.
Among the 20,241 surveyed firms, it turned out that 19.4% were founded prior to 1996. In
most of these cases, the MFP database showed a change in legal form of the company. A
further 3.0% of the surveyed firms were subsidiaries of other companies and did not qualify
as independent new ventures. After omitting these firms, we also filtered out extreme
observations by trimming the top and bottom of the employment distribution growth at the
99.5 and 0.5 percentiles, respectively. The net sample we use for further analysis consists of

10
14,844 new ventures. These represent about 5% of the total estimated number of new ventures
in Germany within the 5 year period and in the sectors covered by the survey.
Data and variables in the Selection (Survival) Model
The selection model for the Heckman procedure uses data from the MFP to model the
probability of survival for new ventures in knowledge intensive industries. The endogenous
variable in the survival model is a dummy variable that takes the value of one if the startup
was active in 2001 and zero if the startup was identified as not economically active at the end
of 2001. The covariates in the selection equation collected from the MFP include the
following: founding year dummy variables, industry dummy variables, regional dummy
variables, a dummy variable indicating whether the startup’s equity is held (in part) by
another firm, the formal educational attainment of the founders, a dummy variable indicating
whether real estate property is owned by firm founders, and a dummy variable indicating
whether the real estate is business property (see Appendix 3).
Variables in Growth Model
The endogenous variable, employment growth, is measured by the annualized logarithmic
change in the number of employees in the first year of firm activity to the end of 2001. The
explanatory variables fall into three categories. The first category includes characteristics of
the founding team. Our indicator of scientific absorptive capacity for the new ventures is
based on whether the founding team contains a university researcher. The following founding
team covariates are used:
Res_AF A dummy variable that is equal to one if the startup had at least one
research-experienced academic founder. This individual had been
employed as a scientist at a university prior to founding the firm.
% Academic Degree This variable captures the general human capital of the founding
team. It is measured as the percentage of founding team members
with an academic degree. Academic degree refers to any tertiary
education level.
Team Size The number of people on the founding team.

11
The second category includes characteristics of the new venture at the time of founding. The
following covariates are used:
Firm Patent A dummy variable indicating the new venture had at least one
patent.
Firm R&D (cont) A dummy variable indicating that the new venture conducts in-
house research and development (R&D) activities on a continuous
basis. The survey used the same definition and phrasing as the
Community Innovation Surveys of Eurostat.
Firm R&D (occ) A dummy variable indicating that the new venture conducts in-
house research and development (R&D) activities on an occasional
basis. The survey used the same definition and phrasing as the
Community Innovation Surveys of Eurostat.
Employees at founding The number of employees at the new venture in the first year of
economic activity. The number of employees is measured in full
time equivalents and includes the founders themselves (as long as
they actively contribute labor), salaried employees, trainees, student
apprentices and freelancers.
Credit rating The credit rating of the new venture was obtained from
Creditreform. This covariate controls for access to external
financial capital. Creditreform uses a scale from 100 to 600 with
100 representing the best and 600 representing the worst rating.
We adjust the scale to be between 1 and 6.
Limited liability Comp A dummy variable indicating that the new venture was founded
under a legal form that limits the founders liability. For instance,
one legal form limits the founders’ liability to the amount of equity
invested at the start of the business. However, it requires a higher
minimum equity for starting the business and may complicate
access to external capital.
The third category includes characteristics related to the new venture’s external environment
which includes any connections to universities. The covariates in this category include:

12
U_Res_Alliance A dummy variable indicating that the new venture maintained a
joint research alliance with a university in the post-foundation
period.
Other_U_Connect A dummy variable indicating that the new venture maintained other
connections to a university in the post-foundation period besides
joint research. These other connections include contracting in,
contracting out, employee training, and regular informal contacts.
Industry A set of eight dummy variables controlling for the industry in
which the new venture is active. The list of industries appears in
Appendix 1.
Cohort This is a set of year dummy variables that indicate the year the new
venture was founded. It controls for annual cohort effects for new
ventures founded in different years, 1996-2000, which may result
from a variety of conditions such as differences in business climate.
4 Empirical Results
Table 1 presents the descriptive statistics for the sample of new ventures in Germany’s
knowledge intensive industries. The top panel reports the variables for startups without
university research alliances and the bottom panel reports this information for startups with
university research alliances. Firms with alliances are a relatively small proportion of total
new ventures in knowledge intensive industries, representing only 7.4% of the surviving firms
in 2001. About 32% of the startups with alliances have high scientific absorptive capacity as
indicated by the presence of a research-experienced academic founder(s) on the founding
team. The percentage of founding team members with academic degrees is also larger for
these startups, about 78% versus 47% on average.
Among the company characteristics, startups with university research alliances have more
full-time employees at founding, conduct R&D more often, and maintain extensive
connections to universities. Startups with alliances show higher average values across all the
innovation indicators such as patents, R&D conducted continuously, and R&D conducted
occasionally. For instance, about 62% of these companies invest continuously in R&D
compared to 15% for non-alliance startups. Regarding access to external financial capital,
however, both types of startups have similar average credit ratings. The largest difference

13
occurs among other connections to universities. Nearly 96% of the startups that have research
alliances also have contracting, training, or informal relationships versus 24% for non-
research alliance startups.
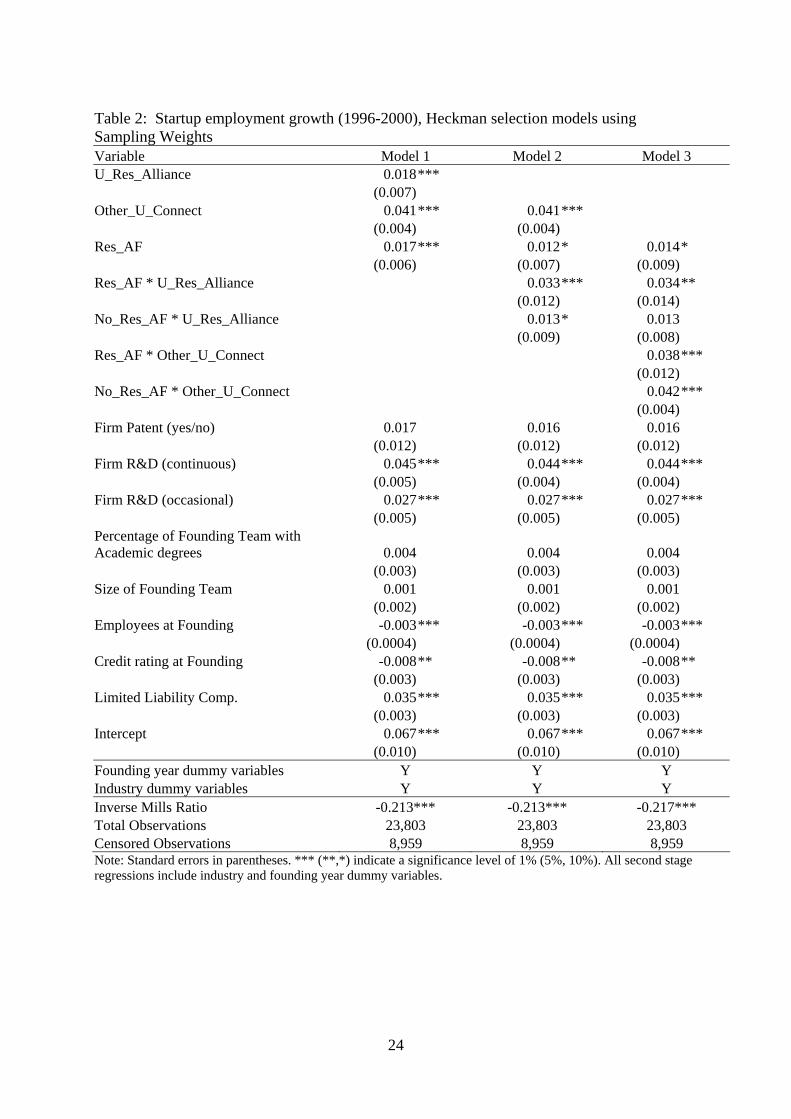
Table 2 shows the multivariate regression results using Heckman selection models to adjust
for survival bias and sampling weights to reflect the population of German startup companies
in knowledge-intensive industries as defined in Appendix 1. The Heckman procedure shows
that correcting for startup survival is important. The Inverse Mills Ratio given at the bottom
of the table is statistically significant at the 1% level. Model 1 gives baseline results that
exclude any interaction effects between university research alliances and scientific absorptive
capacity. The coefficient for university research alliances is positively and significantly
related to startup employment growth. It indicates that startups with university research
alliances grew 1.8 percentage points faster in term of employment than startups without such
alliances. Note that 1.8 percentage points amount to an acceleration of growth of about 20%,
as the average growth of firms without an university research alliance amounts to 9.1
percentage points [= (9.1+1.8)/9.1 120%]. The estimate for other university connections
such as contracting, training and informal relationships is also significant and increases
average employment growth by 4.1 percentage points. A startup’s scientific absorptive
capacity, as indicated by the presence of a research-experienced academic founder (Res_AF),
is positive and statistically significant at the 1% level. These findings are consistent with
results found in prior studies and support hypothesis #1 and #2.
Models 2 and 3 in Table 2 introduce interaction effects to examine how a startup’s scientific
absorptive capacity moderates its employment benefits. Both models examine the moderating
effect of scientific absorptive capacity by estimating separate slope coefficients for startups
with research-experienced academic founders and those without such individuals. In Model
2, both slope coefficients on the interaction variables are positive and significant. This
indicates that both types of startups experienced employment growth from university research
alliances. However, the combination of scientific absorptive capacity with university research
alliances, ( ), is significantly larger than (2(1) = 6.56 with p-value < 0.01). This
shows that startups with scientific absorptive capacity (i.e. with a research AF) experienced
significantly higher employment growth from university research alliances. The size of this
difference suggests scientific absorptive capacity allowed a marginal employment boost of 3.2
percentage points, on average. Note that 3.2 percentage points amount to an employment
growth acceleration of about 35% relative to the average growth rate of firms without the
14
scientific absorptive capacity. These results are consistent with hypothesis #3 and suggest that
research-based human capital is vital for getting the more out of university research alliances.
Model 3 adds separate interaction coefficients for other university connections. In this model,
scientific absorptive capacity is allowed to moderate every type of startup connection to
universities. The interaction effect between scientific absorptive capacity and university
research alliances is very similar to Model 2 in both magnitude and significance. For startups
without scientific absorptive capacity, the results from Model 2 showed a marginally
significant effect of research alliances on employment growth; however, this effect disappears
in Model 3. In this more general model, university research alliances only stimulate
employment growth for the startup if one of the founders had prior research experience at a
university. This suggests that university research alliances are quite specialized. Turning to
other university connections such as contract work, training, and informal relationships, both
interaction terms are positive and significant. Scientific absorptive capacity does not provide
any employment growth advantage to startups with these other connections. The marginal
effects on employment growth of 3.8 and 4.2 percentage points, respectively, are not
economically or statistically different. This result suggests that other university contacts may
be a useful alternative to research alliances when in-house scientific capabilities are low, at
least for employment growth.
For the other explanatory variables, the results are quite stable across the models in Table 2
and are largely consistent with expectations. New ventures that perform R&D, those with
better credit ratings, and those organized as limited liability companies show higher
employment growth. The general human capital of the founding team, measured as the
percentage of the founders with an academic degree, is also associated with higher
employment growth. The patent dummy variables and the size of the founding team have no
significant effects on employment growth. The initial size of the new venture is negatively
related to employment growth.
Aggregate Employment Estimates
With a representative sample from the population of Germany startup companies in
knowledge intensive industries, the survey data can be used to estimate the total net jobs

15
created by these companies.12 Even more, we can use our empirical model to estimate the
fraction of total net jobs created by startup companies attributable to connections to
universities and specifically to university research alliances. The attribution of total jobs to
these sources is obtained as the difference between actual startup jobs created and predicted
startup jobs created. The prediction is based on a counterfactual that assumes no partial effect
for the variables of interest. So, for instance, the counterfactual for university connections
(research alliances and other types) assumes the coefficients for these two covariates are zero
and calculates the predicted net jobs created.
For the period from 1996 through 2001, German National Account statistics show total
employment in the knowledge intensive sectors covered by our survey increased by 701,000
jobs. Based on the survey responses and sampling weights, 453,422 of these jobs were
created by 171,833 companies founded between 1996 and 2000 that survived until the end of
2001 (see Table 3). This is about 65% of total net jobs in the sectors covered. Among all
startups of this cohort, the survey data show that 51,908 companies had some kind of
university connection(s) in the post-foundation period and created 223,969 jobs. Using the
Heckman regression model results, we estimate that university connections (research alliances
and all others) accounted for 9.2% (or 20,535) of these jobs. Turning to university research
alliance relationships, the survey data show a total of 11,896 startups in the population had
such relationships and created a total of 72,857 jobs. The model results indicate that 3.4% (or
2,453) jobs can be attributed to university research alliances.
5 Conclusion
By all appearances a fundamental reorientation is taking place among researchers and
policymakers from firm size to firm age as the critical characteristic associated with
employment growth. As discussed in Section 2, mounting evidence points to young
companies, particularly in high-technology industries, as a primary source driving the overall
rate of economy-wide employment growth. The important and challenging question is: how
12 Net jobs created by startups measures the difference between total jobs created through expansions minus total jobs destroyed through startup failures or contractions, 1996-2001. We do not count full-time employees at founding as part of jobs created. This allows us to measure job creation by young firms as analyzed in Haltiwanger, Jarmin, and Miranda (2013).

16
do young companies in knowledge-intensive industries create jobs? This paper explored this
question by analyzing the contribution from university research alliances, which is a
particular form of hybrid organizational growth, along with other connections that startups
can make with universities such as contract research, training, and informal contacts.
To stimulate employment growth these university connections would need to expand the
workforce at the startup by increasing labor demand though greater innovation and sales or by
freeing up resources by increasing labor productivity or lowering recruitment costs. For
university research alliances, we postulated that employment growth is moderated by the
ability of the startup to access, assimilate, and exploit knowledge exchanged through
collaborative R&D projects. That is, the “scientific absorptive capacity” at the startup is a
critical for reaping the benefits of university research alliances, but not necessarily for other
university connections.
These basic insights were largely confirmed by the empirical results. University research
alliances added 3.4 percentage points to startup employment growth, but only for those young
firms that had scientific absorptive capacity, which we measured using the employment
background of the startup’s founding team. Specifically, this higher growth rate was
associated with startups that had a former academic researcher(s) as part of the founding team
and no statistically significant effect was found for other startups. This result highlights the
specialized character of university research alliances. Perhaps not surprisingly, it suggests
that these alliances are not appropriate for all startups in knowledge-intensive industries, but
they may be appropriate for a larger number of startups as only 31% of the startups in our
sample with an academic founder also had a university research alliance. Research alliances
constitute a relevant way of transferring research at universities into economic wealth. When
evaluating transfer activities of universities, this channel is often ignored and less valued
compared to the creation of spinoff companies, patenting or research alliances with
established companies.
Other university connections (contacting, training, and informal contacts) contributed
significantly employment growth among German startups in knowledge-intensive industries.
Those startups with scientific absorptive capacity had 3.8 percentage points higher
employment growth while those without such capacity had 4.2 percentage points higher
growth. As the difference between these estimates is not economically or statistically
significant, scientific absorptive capacity did not provide any advantage for harnessing the
employment effects from other university connections. Without the requirement for scientific

17
absorptive capacity, other university connections may be a feasible strategy for a larger group
of startups. Only about 30% of the sample startups maintained these other university
connections in Germany’s knowledge-intensive industries.
Another unique contribution of our analysis was the attribution of aggregate sector-level
employment impacts to university research alliances and other university connections.
Consistent with the emerging literature, the startups we analyzed contributed about 65% of
the total net jobs to Germany’s knowledge-intensive sectors in 1996-2001. In this population
of startups, 30% had university connections of any kind (research alliances and other) and
theses firms added 223,969 jobs. Of these, 20,535 jobs (or 9.4%) were due to any kind of
university connections. Only 7% of the startup population maintained a university research
alliance, but among these firms, 3.4% of their total jobs created were attributable to their
alliances. These results suggest university connections are quite important for job growth and
university research alliances contributed substantially to job creation for those firms that had
such alliances.
For policymakers, our research suggests opportunities exist to stimulate employment by
supporting startup survival and growth through university research alliances and other
university connections, particularly in knowledge-intensive industries. One might consider
university research alliances with young enterprises as a viable mode of technology transfer.
This would extend spinoff policies to the post-foundation period. So, for instance, young
firms are likely to benefit from greater access to university facilities such as labs. Policies
that incentivize the formation of university research alliances on the university-side might
also be valuable as traditional norms and reward structures do not support such activities.
While our research addresses the important and challenging question of how young
companies in high-technology industries grow, it is just a beginning. Access to longitudinal
data would help to hold unobservable influences constant and push the findings toward a
causal interpretation. Along these lines, highly detailed startup and project-level data would
permit one to explore the deeper mechanisms underlying our employment growth findings.
For instance, such data might identify labor productivity as the main link between university
research alliances and employment growth. In future research it will also be important to
implement more sophisticated models that test for and address other potential sources of
endogeneity. For instance, assuming suitable instruments are available, it would be
informative to model the choice of university connections in addition to our correction for

18
survivor bias. Based on the up-or-out dynamic, we believe survivor bias is the most serious
form of estimation bias, but future research could explore such issues.

19
References
Almus, M., D. Engel, and S. Prantl. 2000. “The Mannheim Foundation Panels of the Centre for European Economic Research (ZEW),” ZEW Documentation Nr. 00-02, Mannheim: Centre for European Economic Research..
Anyadike-Danes, M., C-M. Bjuggren, S. Gottschalk, W. Holzl, D. Johansson, M. Maliranta, and A. Myrann. 2013. “Accounting for Job Growth: Disentangling Size and Age Effects in an International Cohort Comparison,” ERC Research Paper, no. 2., May.
Arvanitis, S., N. Sydow, and M. Woerter. 2008. “Is There Any Impact of University-Industry Knowledge Transfer on Innovation and Productivity? An Empirical Analysis Based on Swiss Firm Data,” Review of Industrial Organization 32: 77-94.
Aschhoff, B., and T. Schmidt. 2008. “Empirical Evidence on the Success of R&D Cooperation –Happy Together?,” Review of Industrial Organization 33: 41-62.
Baba Y., N. Schichijo, and S.R. Sedita. 2009. “How Do Collaborations with Universities Affect Firms’ Innovative Performance? The Role of ‘Pasteur Scientists’ in the Advanced Materials Field,” Research Policy 38: 756-764.
Baum, J.A.C., T. Calabrese, and B.S. Silverman. 2000. “Don’t Go It Alone: Alliance Network Composition and Startups’ Performance in Canadian Biotechnology,” Strategic Management Journal 21: 267-294.
Belderbos, R., M. Carree, and B. Lokshin. 2004. “Cooperative R&D and Firm Performance,” Research Policy, 33: 1477-1492.
Cassiman, B., M.C. Di Guardo, and G. Valentini. 2010. “Organizing Links with Science: Cooperate or Contract?,” Research Policy 39: 882-892.
Cohen, W.M. and D.A. Levinthal. 1990. “Absorptive Capacity: A New Perspective on Learning and Innovation,” Administrative Science Quarterly 35: 128-152.
Colombo, M.G., L. Grilli, and E. Piva. 2006. “In Search of Complementary Assets: The Determinants of Alliance Formation of High-tech Start-ups,” Research Policy 35: 1166-1199.
Czarnitzki, D. and J. Delanote. 2012. “Young Innovative Companies: The New High-growth Firms?,” Industrial and Corporate Change, 22 (5): 1315-1340.
Czarnitzki, D., C. Rammer, and A.A. Toole. 2014. “University Spinoffs and the “Performance Premium”, Small Business Economics, 43: 309-326.
Egeln, J., S. Gottschalk, C. Rammer, and A. Spielkamp. 2003. “Public Research Spin-offs in Germany,” ZEW Documentation 03-04, Mannheim: Centre for European Economic Research.
Falk, M. 2013. “Corporate Patents and Knowledge Sourcing from Universities,” Empirica 41 (1): 83-100.
Flatten, T.C., G.I. Greve, and M. Brettel. 2011. “Absorptive Capacity and Firm Performance in SMEs: The Mediating Influence of Strategic Alliances,” European Management Journal, 8: 137-152.
Fontana, R., A. Geuna, and M. Matt. 2006. “Factors Affecting University-industry R&D Projects: The importance of searching, screening, and signaling,” Research Policy 35: 309-323.
20
Haeussler, C., H. Patzelt, and S.A. Zahra. 2012. “Strategic Alliances and Product Development in High Technology New Firms: The Moderating Effect of Technological Capabilities,” Journal of Business Venturing 27: 217-233.
Hagedoorn, J., A.N. Link, and N.S. Vonortas. 2000. “Research Partnerships,” Research Policy 29: 567-586.
Hall, B.H., A.N. Link, and J.T. Scott. 2003. “Universities as Research Partners,” The Review of Economics and Statistics 85 (2): 485-491.
Haltiwanger, J. 2012. “Job Creation and Firm Dynamics in the United States,” in Innovation Policy and the Economy, J. Lerner and S. Stern (eds.), Chicago: University of Chicago Press.
Haltiwanger, J., R.S. Jarmin, and J. Miranda. 2013. “Who Creates Jobs? Small versus Large versus Young,” The Review of Economics and Statistics 95 (2): 347-361.
Hathaway, I. 2013. “Tech Starts: High-technology Business Formation and Job Creation in the United States,” Kauffman Foundation Research Series: Firm Formation and Economic Growth, Kansas City: Ewing Marion Kauffman Foundation.
Heckman, J.J. 1976. “The Common Structure of Statistical Models of Truncation, Sample Selection, and Limited Dependent Variables and a Simple Estimator for such Models,” Annals of Economic and Social Measurement 5: 475-492.
Heckman, J.J. 1979. “Sample Selection Bias as a Specification Error,” Econometrica 47: 3-161.
Lin, C., Y-J. Wu, C. Chang, W. Wang, and C-Y Lee. 2012. “The Alliance Innovation Performance of R&D Alliances – The Absorptive Capacity Perspective,” Technovation 32: 282-292.
Link, A.N. and J.T. Scott. 2007. “The Economics of University Research Parks,” Oxford Review of Economic Policy 23 (4): 661-674.
Link, A. and C.W. Wessner. 2012. “Universities as Research Partners: Entrepreneurial Explorations and Exploitations,” in The Handbook of Research on Innovation and Entrepreneurship, D.B. Audretsch, O. Flack, and S. Heblich (eds.), Edward Elgar Press.
McKelvie, A. and J. Wiklund. 2010. “Advancing Firm Growth Research: A Focus on Growth Mode Instead of Growth Rate,” Entrepreneurship Theory & Practice 34 (2): 261-288.
Meyer-Krahmer, F., and U. Schmoch. 1998. “Science-based Technologies: University-industry Interactions in Four Fields,” Research Policy 27: 835-851.
Neumark, D., J. Zhang, and B. Wall. 2006. “Where the Jobs Are: Business Dynamics and Employment Growth,” Academy of Management Perspectives 20 (4): 79-94.
Okamuro, H., M. Kato, and Y. Honjo. 2011. “Determinants of R&D Cooperation in Japanese Start-ups,” Research Policy 40: 728-738.
Robin, S., and T. Schubert. 2013. “Cooperation with Public Research Institutions and Success in Innovation: Evidence from France and Germany,” Research Policy 42: 149-166.
Schartinger, D., C. Rammer, M.M. Fischer, and J. Frohlich. 2002. “Knowledge Interactions between Universities and Industry in Austria: Sectoral Patterns and Determinants,” Research Policy 31: 303-328.

21
Soh, P-H, and A.M. Subramanian. 2013. “When Do Firms Benefit from University-industry R&D Collaborations? The Implications of Firm R&D Focus on Scientific Research and Technological Recombination,” Journal of Business Venturing Forthcoming.
Storey, D.J. 1994. Understanding the Small Business Sector, London: Thomson Learning
Stuart, T. 2000. “Interorganizational Alliances and the Performance of Firms: A Study of Growth and Innovation Rates in a High-technology Industry,” Strategic Management Journal 21: 791-811.
Subramanian A.M., K. Lim, P-H Soh. 2013. “When Birds of a Feather Don’t Flock Together: Different Scientists and the Roles They Play in Biotech R&D Alliances,” Research Policy 42: 595-612.
Teece, D.J. 1986. “Profiting from Technological Innovation: Implications for Integration, Collaboration, Licensing and Public Policy,” Research Policy 15: 285-305.
Teece, D.J. 1992. “Competition, Cooperation, and Innovation: Organizational Arrangements for Regimes of Rapid Technological Progress,” Journal of Economic Behavior and Organization 18: 1-25.
Toole, A.A., and D. Czarnitzki. 2007. “Biomedical Academic Entrepreneurship Through the SBIR program,” Journal of Economic Behavior and Organization 63 (4), 716–738.
Toole, A.A., and D. Czarnitzki. 2009. “Exploring the Relationship between Scientist Human Capital and Firm Performance: The Case of Biomedical Academic Entrepreneurs in the SBIR Program,” Management Science 55 (1), 101–114.
Verbeek, M. 2012. A guide to modern econometrics, 4th ed., Chichester: Wiley & Sons.
Veugelers, R., and B. Cassiman. 2005. “R&D Cooperation between Firms and Universities: Some Empirical Evidence from Belgian Manufacturing,” International Journal of Industrial Organization 23: 355-379.
Zucker, L.G., M.R. Darby, and M.B. Brewer. 1998. “Intellectual Human Capital and the Birth of U.S. Biotechnology Enterprises,” The American Economic Review 88: 290-306.
Zucker, L.G., M.R. Darby, and J.S. Armstrong. 2002. “Commercializing Knowledge: University Science, Knowledge Capture, and Firm Performance in Biotechnology,” Management Science. 48 (1): 138–153.

22
Appendix 1: Definition of Technology Sectors
High-tech manufacturing: This sector comprises manufacturing activities characterized by high R&D inputs and includes the following NACE rev. 1.1 codes: 24, 29, 30, 31, 32, 33, 34, 35 (chemicals and pharmaceuticals, machinery and equipment, computer and office machinery, electrical equipment, electronics, medical and measurement instruments, automotive and other vehicles).
Technology-oriented services: This sector covers services that are heavily relying on the use of new technology, particularly information and communication technology, and includes the NACE rev. 1.1 codes: 64.3, 72, 73, 74.2, 74.3, 92.11 (telecommunication, computer services and software, R&D services, engineering, testing, film making).
Knowledge-intensive consulting: This sector represents services that are largely based on high qualified labor while relying less on new technology and includes NACE rev. 1.1 codes: 74.1, 74.4, 74.85.1, 74.85.2, 74.87.2, 74.87.4, (business consulting, advertising, design activities, etc.)

23
Appendix 2: Tables
Table 1: Startup descriptive statistics by University Research Alliance Startups without a University Research Alliance = 13,744 Mean Std. Dev. Min MaxEmployment growth (average annual) 0.091 0.162 -0.448 0.805Founding team characteristics Research-experienced Founder(s) 0.058 0.234 0 1 Percent founding team members with academic degrees 0.467 0.466 0 1 Size of founding team 1.594 1.044 1 15New venture characteristics Employees at founding (FTE) 3.415 4.552 0.5 50 Patent 0.015 0.121 0 1 R&D (continuous) 0.149 0.356 0 1 R&D (occasional) 0.101 0.301 0 1 Credit rating at founding 2.670 0.461 1.46 6 Limited liability company 0.370 0.483 0 1External environment characteristics Other University connections 0.244 0.429 0 1
Startups with a University Research Alliance = 1,100 Mean Std. Dev. Min MaxEmployment growth (average annual) 0.167 0.183 -0.448 0.805Founding team characteristics Research-experienced Founder(s) 0.321 0.467 0 1 Percentage of founding team with academic degrees 0.776 0.367 0 1 Size of founding team 2.188 1.488 1 15New venture characteristics Employees at founding (FTE) 5.405 6.117 0.5 50 Patent 0.119 0.324 0 1 R&D (continuous) 0.618 0.486 0 1 R&D (occasional) 0.174 0.379 0 1 Credit rating at founding 2.682 0.430 1.97 6 Limited liability company 0.684 0.465 0 1External environment characteristics Other University connections 0.955 0.206 0 1
Note: Eight industry dummy variables and five founding year cohort dummy variables are not reported.
24
Table 2: Startup employment growth (1996-2000), Heckman selection models using Sampling Weights Variable Model 1 Model 2 Model 3 U_Res_Alliance 0.018*** (0.007) Other_U_Connect 0.041*** 0.041 *** (0.004) (0.004) Res_AF 0.017*** 0.012 * 0.014* (0.006) (0.007) (0.009) Res_AF * U_Res_Alliance 0.033 *** 0.034** (0.012) (0.014) No_Res_AF * U_Res_Alliance 0.013 * 0.013 (0.009) (0.008) Res_AF * Other_U_Connect 0.038*** (0.012) No_Res_AF * Other_U_Connect 0.042*** (0.004) Firm Patent (yes/no) 0.017 0.016 0.016 (0.012) (0.012) (0.012) Firm R&D (continuous) 0.045*** 0.044 *** 0.044*** (0.005) (0.004) (0.004) Firm R&D (occasional) 0.027*** 0.027 *** 0.027*** (0.005) (0.005) (0.005) Percentage of Founding Team with Academic degrees 0.004 0.004 0.004 (0.003) (0.003) (0.003) Size of Founding Team 0.001 0.001 0.001 (0.002) (0.002) (0.002) Employees at Founding -0.003*** -0.003 *** -0.003*** (0.0004) (0.0004) (0.0004) Credit rating at Founding -0.008** -0.008 ** -0.008** (0.003) (0.003) (0.003) Limited Liability Comp. 0.035*** 0.035 *** 0.035*** (0.003) (0.003) (0.003) Intercept 0.067*** 0.067 *** 0.067*** (0.010) (0.010) (0.010) Founding year dummy variables Y Y Y Industry dummy variables Y Y Y Inverse Mills Ratio -0.213*** -0.213*** -0.217*** Total Observations 23,803 23,803 23,803 Censored Observations 8,959 8,959 8,959 Note: Standard errors in parentheses. *** (**,*) indicate a significance level of 1% (5%, 10%). All second stage regressions include industry and founding year dummy variables.

25
Table 3: Job Creation of Startups by type of university link (startups in knowledge intensive industries in Germany founded 1996 to 2000 that survived until the end of 2001) No. of startups
1996-2000 surviving through 2001
No. jobs created 1996-2001
All startups 171,833 453,422 Startups with any type of university connection 51,908 223,969
- of which: jobs attributable to any connection 20,535 Startups with University Research Alliances (URAs) 11,896 72,857
- of which: jobs attributable to URAs 2,453 Note: All data from survey except the attribution of jobs created, which is based on the empirical model.

26
Appendix 3: The survival equation controlling for selection
As described in section 3 of the main text, all regressions results were obtained using sample
selection models. In order to model the survival of the firms (as only surviving firms could be
included in the surveys) we rely on available data for firms that exited before the survey.
Although somewhat limited, we can use information from the Mannheim Foundation Panel
(MFP) to model the probability of survival for the new ventures. In particular, we use the
founding year, industry, firm location, equity ownership by other firms, real estate property of
firm founders, and the level of formal educational attainment among the founders.
The industry dummies and foundation cohort dummies are analogous to those included in the
growth equation. In addition, we use 13 regional dummies to model survival. The regional
dummies are omitted from the growth equations as they always turned out to be insignificant.
In the survival equation, they are jointly significant at the 5% level (the 2 test value amounts
to 126.64). In the growth equation, we do not include the education-related variables that
appear in the selection equation as we have the survey reported data on the education of the
academic entrepreneurs and the share of founders with academic degrees. Also, we do not use
the real estate variables in the growth equation, but instead include the firm’s credit rating,
which is a more general financial performance variable. Part of this decision was based on
data limitations. For the non-surviving firms the rating had too many missing values as it was
possibly never constructed for firms that exited soon after foundation.
Table 4: Estimates of the survival equation (first stage of the selection model); N = 23,803 Variable Coeff. Std. err.
Equity ownership by at least one firm 0.194*** 0.036 Dummy whether founders or firm own real estate 0.283*** 0.028 dummy indicating whether real estate is business property 0.448*** 0.137 Dummy indicating that real estate information was ‘missing’ -0.010 0.063 Education of founders at least one founder with doctoral degree 0.028 0.041 at least one founder with engineering master degree 0.231*** 0.028 at least one founder with business/econ degree 0.129*** 0.036 at least one founder with other university degree 0.080** 0.041 at least one founder is master craftsman 0.184*** 0.046 at least one founder has no higher education degree 0.043 0.058 Dummy indicating that education variables were ‘missing’ -.166*** 0.020 Intercept 1.536*** 0.065
Industry dummies Included. Foundation cohort dummies Included. Regional dummies Included.
*** (**,*) indicate a significance level of 1% (5%, 10%).