SHS Absorptive Capacity Study
57
Interim Report: Senior High School Absorptive Capacity Study Findings of the Division Level Analysis November 2012 Basic Education Program Education Improvement Sector Developme nt Program ADB TA:-7955 (PHI) EDUCATION IMPROVEMENT SECTOR DEVELOPMENT PROGRAM
-
Upload
duj-ralara -
Category
Documents
-
view
228 -
download
0
Transcript of SHS Absorptive Capacity Study
7/27/2019 SHS Absorptive Capacity Study
http://slidepdf.com/reader/full/shs-absorptive-capacity-study 1/57
Interim Report: Senior HighSchool Absorptive Capacity
Study
Findings of the Division Level Analysis
November 2012
Basic Education Program
Education Improvement Sector Development Program
ADB TA:-7955 (PHI) EDUCATION IMPROVEMENT SECTOR
DEVELOPMENT PROGRAM
7/27/2019 SHS Absorptive Capacity Study
http://slidepdf.com/reader/full/shs-absorptive-capacity-study 2/57
Photo courtesy of the Government of the Philippines, Department of Education, Audio Visual
Division
7/27/2019 SHS Absorptive Capacity Study
http://slidepdf.com/reader/full/shs-absorptive-capacity-study 3/57
0
FOREWORD
The President’s Social Contract with the Filipino People commits the Government to makingeducation the central strategy for investing in the Filipino people, reducing poverty and building
national competitiveness. The Government’s overarching strategic framework for the Philippines’
basic education sector – the BESRA – supports universal access to, and successful completion of,
basic education, including the extension of basic education from Grades 1 to 10 to encompass
kindergarten and two years of senior high school, Grades 11 and 12.
The Asian Development Bank (ADB) has a long long-standing engagement in Philippines’
secondary education sector and has supported several of the Government’s pioneering programs.
To continue in this tradition, the ADB is preparing the Education Improvement Sector
Development Program (EISDP) to support the Philippines K-12 Reform agenda. This supportincludes providing a Program Preparatory Technical Assistance (PPTA) to the Department of
Education to facilitate formulation of a comprehensive plan for introducing a senior high school
program nationwide by 2016.
At the request of the Department of Education’s (DepED) Executive Committee for the K-12
Reform, the PPTA undertook a preliminary assessment of the absorptive capacity of public and
private providers to accommodate the projected demand for senior high school. EISDP PPTA Team
Member, Dr. Rosario Manasan undertook the analysis of classroom and teacher requirements at the
central, regional, and division levels using data from the DepED’s Basic Education Information
System (BEIS) and prepared this report. Dr. Michael Alba complemented this work with an analysisof current supply of classrooms, teachers, and seats in 7,270 public Junior Secondary Schools using
data from BEIS from 2010. They were assisted by Dr. Honesto Nuqui who analyzed teacher,
laboratory and classroom requirements needed to implement the senior high school Core
Curriculum.1
Any questions regarding this report should be communicated to Dr. Manasan.
As of this writing, work continues on revising the K-12 curriculum to reflect four learning
areas: languages, arts and humanities, science and mathematics, and technology and livelihood
education. Ultimately, the decisions regarding the curriculum will determine how many classrooms,
teachers by specialization, laboratories, workshops, and senior high schools will be needed. Once
the curriculum is finalized, the figures presented in this report will be updated.
The views and opinion expressed in this report are those of the author and do not reflect
those of the Asian Development Bank or the Department of Education.
1 The Senior High School Program includes a Core Curriculum common to all students and specialized curricula
in five Career Pathways. At the time of writing the curricula for the specialized Career Pathways were notfinalized.
7/27/2019 SHS Absorptive Capacity Study
http://slidepdf.com/reader/full/shs-absorptive-capacity-study 4/57
Page 1
Table of Contents
Foreword ................................................................................................................................................. 0
1. Introduction .................................................................................................................................... 2
2. Enrolment Projections .................................................................................................................... 4
3. Estimation of Classroom Requirements.......................................................................................... 6
3.1 Classroom Requirement for Grades 11-12 in Public Senior High Schools (2017 through 2020) 6
3.2 Classroom Requirements for Grades 11-12 in Private Senior High Schools ............................... 8
4. Estimation of Teacher Requirements ........................................................................................... 12
4.1 Teacher Requirements for Grades 11-12 in Public Senior High Schools (2017 through 2020) . 12
4.2 Teacher Requirement for Grades 11-12 in Private Senior High Schools (2017 through 2020) . 14
4.3 Available Teachers for the SHS Program Currently Teaching in HEIs ........................................ 16
5. Absorptive Capacity for On-The-Job Training ............................................................................... 17
Annexes ................................................................................................................................................. 19
7/27/2019 SHS Absorptive Capacity Study
http://slidepdf.com/reader/full/shs-absorptive-capacity-study 5/57
Page 2
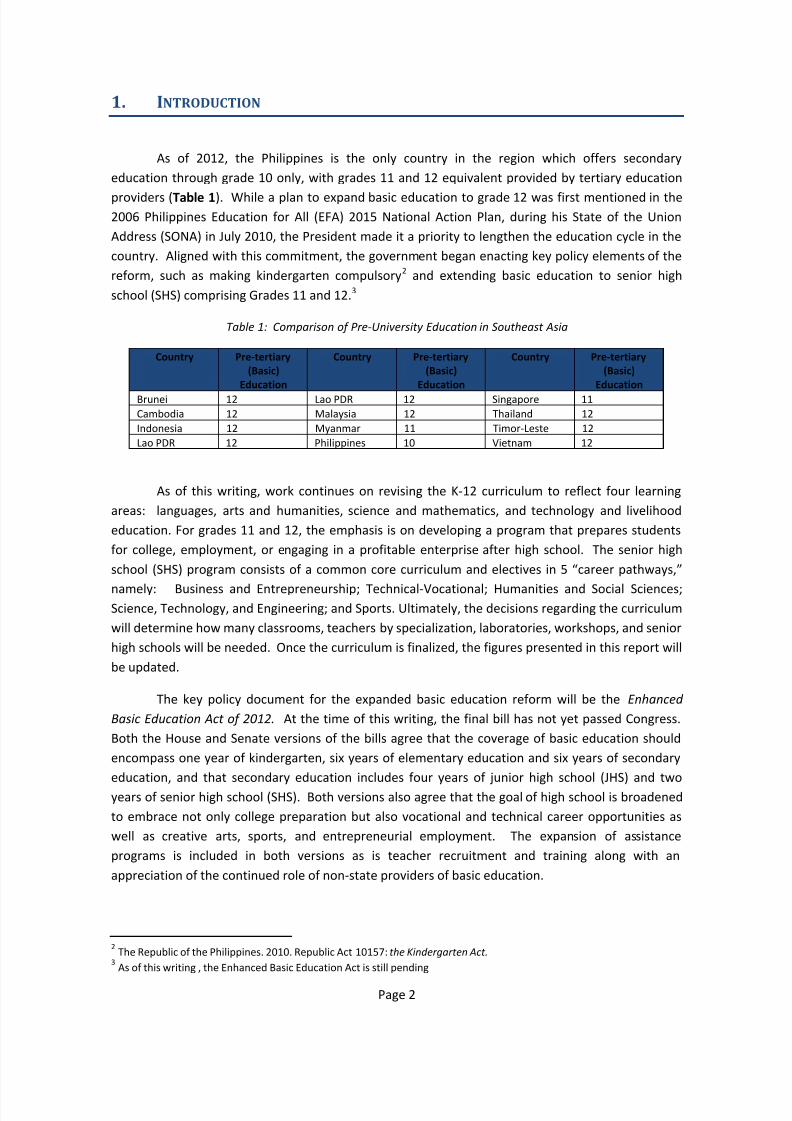
1. INTRODUCTION
As of 2012, the Philippines is the only country in the region which offers secondary
education through grade 10 only, with grades 11 and 12 equivalent provided by tertiary education
providers (Table 1). While a plan to expand basic education to grade 12 was first mentioned in the
2006 Philippines Education for All (EFA) 2015 National Action Plan, during his State of the Union
Address (SONA) in July 2010, the President made it a priority to lengthen the education cycle in the
country. Aligned with this commitment, the government began enacting key policy elements of the
reform, such as making kindergarten compulsory2
and extending basic education to senior high
school (SHS) comprising Grades 11 and 12.3
Table 1: Comparison of Pre-University Education in Southeast Asia
Country Pre-tertiary
(Basic)Education
Country Pre-tertiary
(Basic)Education
Country Pre-tertiary
(Basic)Education
Brunei 12 Lao PDR 12 Singapore 11
Cambodia 12 Malaysia 12 Thailand 12
Indonesia 12 Myanmar 11 Timor-Leste 12
Lao PDR 12 Philippines 10 Vietnam 12
As of this writing, work continues on revising the K-12 curriculum to reflect four learning
areas: languages, arts and humanities, science and mathematics, and technology and livelihood
education. For grades 11 and 12, the emphasis is on developing a program that prepares students
for college, employment, or engaging in a profitable enterprise after high school. The senior high
school (SHS) program consists of a common core curriculum and electives in 5 “career pathways,”
namely: Business and Entrepreneurship; Technical-Vocational; Humanities and Social Sciences;
Science, Technology, and Engineering; and Sports. Ultimately, the decisions regarding the curriculum
will determine how many classrooms, teachers by specialization, laboratories, workshops, and senior
high schools will be needed. Once the curriculum is finalized, the figures presented in this report will
be updated.
The key policy document for the expanded basic education reform will be the Enhanced
Basic Education Act of 2012. At the time of this writing, the final bill has not yet passed Congress.
Both the House and Senate versions of the bills agree that the coverage of basic education should
encompass one year of kindergarten, six years of elementary education and six years of secondary
education, and that secondary education includes four years of junior high school (JHS) and two
years of senior high school (SHS). Both versions also agree that the goal of high school is broadened
to embrace not only college preparation but also vocational and technical career opportunities as
well as creative arts, sports, and entrepreneurial employment. The expansion of assistance
programs is included in both versions as is teacher recruitment and training along with an
appreciation of the continued role of non-state providers of basic education.
2 The Republic of the Philippines. 2010. Republic Act 10157: the Kindergarten Act.
3 As of this writing , the Enhanced Basic Education Act is still pending
7/27/2019 SHS Absorptive Capacity Study
http://slidepdf.com/reader/full/shs-absorptive-capacity-study 6/57
Page 3
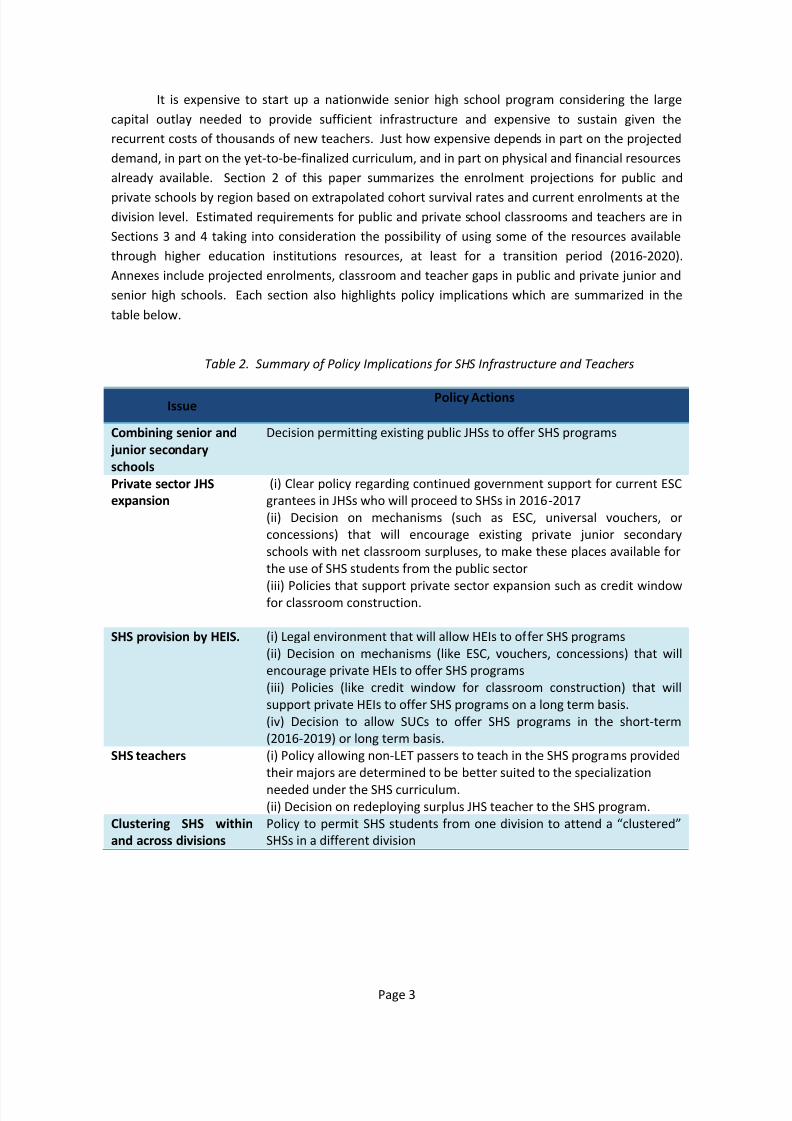
It is expensive to start up a nationwide senior high school program considering the large
capital outlay needed to provide sufficient infrastructure and expensive to sustain given the
recurrent costs of thousands of new teachers. Just how expensive depends in part on the projected
demand, in part on the yet-to-be-finalized curriculum, and in part on physical and financial resources
already available. Section 2 of this paper summarizes the enrolment projections for public and
private schools by region based on extrapolated cohort survival rates and current enrolments at the
division level. Estimated requirements for public and private school classrooms and teachers are in
Sections 3 and 4 taking into consideration the possibility of using some of the resources available
through higher education institutions resources, at least for a transition period (2016-2020).
Annexes include projected enrolments, classroom and teacher gaps in public and private junior and
senior high schools. Each section also highlights policy implications which are summarized in the
table below.
Table 2. Summary of Policy Implications for SHS Infrastructure and Teachers
IssuePolicy Actions
Combining senior and
junior secondary
schools
Decision permitting existing public JHSs to offer SHS programs
Private sector JHS
expansion
(i) Clear policy regarding continued government support for current ESC
grantees in JHSs who will proceed to SHSs in 2016-2017
(ii) Decision on mechanisms (such as ESC, universal vouchers, or
concessions) that will encourage existing private junior secondary
schools with net classroom surpluses, to make these places available for
the use of SHS students from the public sector
(iii) Policies that support private sector expansion such as credit window
for classroom construction.
SHS provision by HEIS. (i) Legal environment that will allow HEIs to offer SHS programs
(ii) Decision on mechanisms (like ESC, vouchers, concessions) that will
encourage private HEIs to offer SHS programs
(iii) Policies (like credit window for classroom construction) that will
support private HEIs to offer SHS programs on a long term basis.
(iv) Decision to allow SUCs to offer SHS programs in the short-term
(2016-2019) or long term basis.
SHS teachers (i) Policy allowing non-LET passers to teach in the SHS programs providedtheir majors are determined to be better suited to the specialization
needed under the SHS curriculum.
(ii) Decision on redeploying surplus JHS teacher to the SHS program.
Clustering SHS within
and across divisions
Policy to permit SHS students from one division to attend a “clustered”
SHSs in a different division
7/27/2019 SHS Absorptive Capacity Study
http://slidepdf.com/reader/full/shs-absorptive-capacity-study 7/57
Page 4
2. ENROLMENT PROJECTIONS
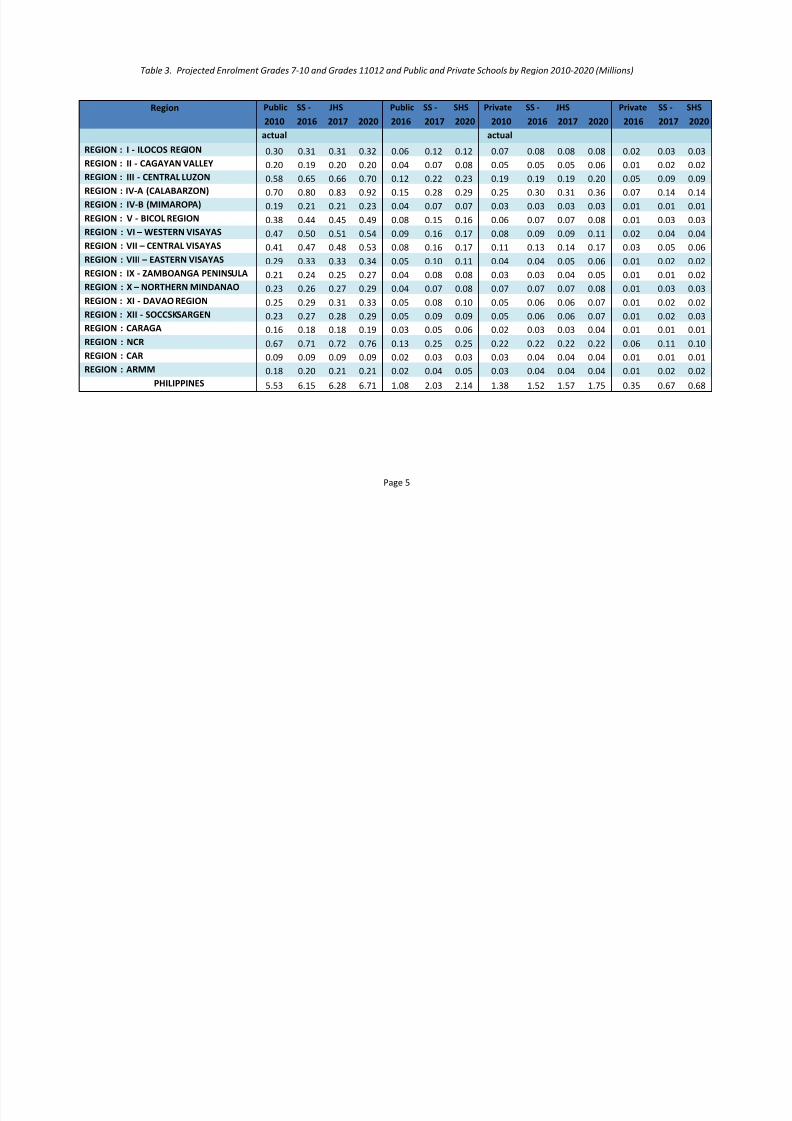
Projected enrolment: The projections assume that students in private JHSs will attend
private SHSs and students in public JHSs will attend public schools unless there are grants that
permit them to change to private providers. Enrolment in Grade 11 is projected to be 1.1 millionstudents in public SHSs and 0.4 million students in private SHSs in 2016. Enrolment in senior high
school (SHS), which is comprised of Grades 11 and 12, is expected to increase to 2.0 million students
in public schools and 0.7 million students in private schools in 2017 (Table 3). Similarly, enrolment in
Grades 7-10 in public schools is projected to grow by 2.0% yearly from 5.5 million students in 2010
to 6.3 million students in 2017 and 6.7 million students in 2020. For private schools, enrolment
Grades 7-10 is projected to increase by 2.4% yearly from 1.4 million students in 2010 to 1.6 million
students in 2017 and 1.8 million students in 2020.
Method: Projections for division level enrolment by grade and year for Grades 1-6
(elementary) and Grades 7-10 (JHS) for the period 2012-2020 are calculated using cohort survivalrates. Derived from actual enrolments for each division during 2005-2011 period, these rates are
then applied to actual school cohorts enrolled in each division in the 2005-2011 timeframe. For
Grades 11 and 12 (SHS), division level cohort survival rates are estimated by extrapolating cohort
survival rates for each division for Grades 9 and 10 and applying them to the relevant division-level
school cohorts. In other words, the projected Grade 11 enrolment in 2020 is based on the cohort
that entered the school system as Grade 1 in 2010.
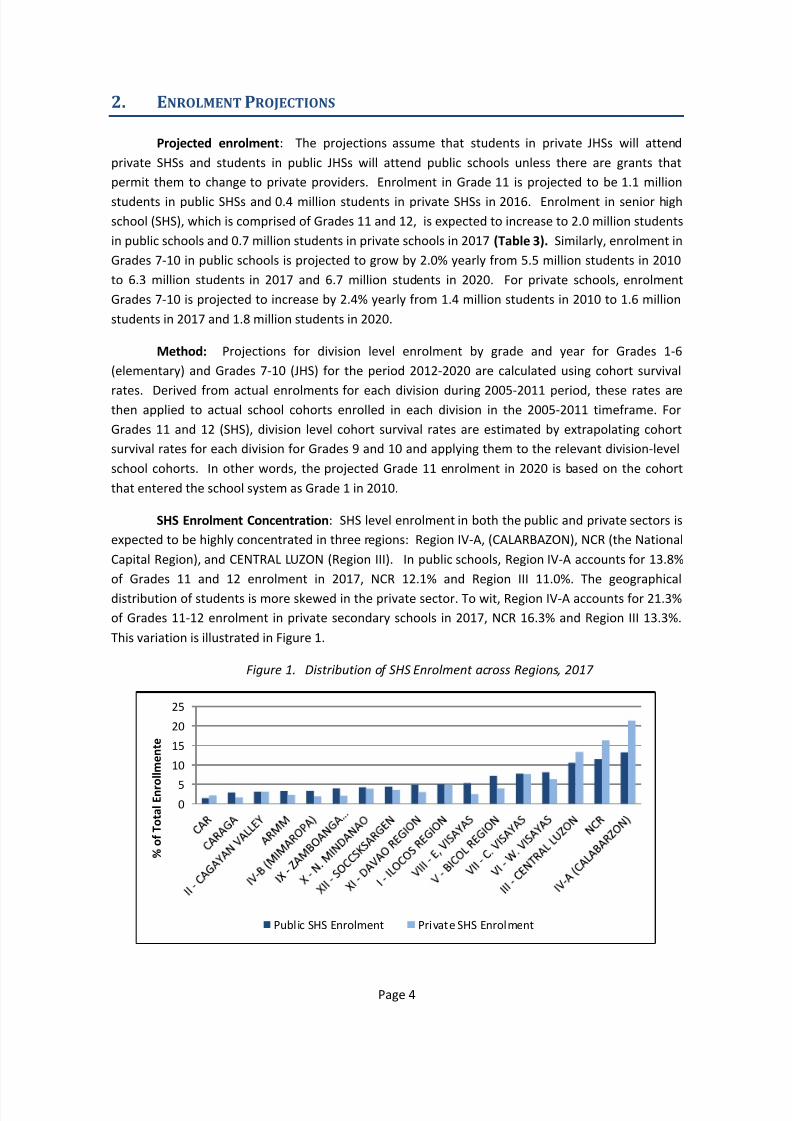
SHS Enrolment Concentration: SHS level enrolment in both the public and private sectors is
expected to be highly concentrated in three regions: Region IV-A, (CALARBAZON), NCR (the National
Capital Region), and CENTRAL LUZON (Region III). In public schools, Region IV-A accounts for 13.8%of Grades 11 and 12 enrolment in 2017, NCR 12.1% and Region III 11.0%. The geographical
distribution of students is more skewed in the private sector. To wit, Region IV-A accounts for 21.3%
of Grades 11-12 enrolment in private secondary schools in 2017, NCR 16.3% and Region III 13.3%.
This variation is illustrated in Figure 1.
Figure 1. Distribution of SHS Enrolment across Regions, 2017
0
5
10
15
20
25
%
o f T o t a l E n r o l l m e n
t e
Public SHS Enrolment Private SHS Enrolment
7/27/2019 SHS Absorptive Capacity Study
http://slidepdf.com/reader/full/shs-absorptive-capacity-study 8/57
Page 5
Table 3. Projected Enrolment Grades 7-10 and Grades 11012 and Public and Private Schools by Region 2010-2020 (Millions)
Region Public SS - JHS Public SS - SHS Private SS - JHS Private SS - SHS
2010 2016 2017 2020 2016 2017 2020 2010 2016 2017 2020 2016 2017 2020
actual actual
REGION : I - ILOCOS REGION 0.30 0.31 0.31 0.32 0.06 0.12 0.12 0.07 0.08 0.08 0.08 0.02 0.03 0.03
REGION : II - CAGAYAN VALLEY 0.20 0.19 0.20 0.20 0.04 0.07 0.08 0.05 0.05 0.05 0.06 0.01 0.02 0.02
REGION : III - CENTRAL LUZON 0.58 0.65 0.66 0.70 0.12 0.22 0.23 0.19 0.19 0.19 0.20 0.05 0.09 0.09
REGION : IV-A (CALABARZON) 0.70 0.80 0.83 0.92 0.15 0.28 0.29 0.25 0.30 0.31 0.36 0.07 0.14 0.14
REGION : IV-B (MIMAROPA) 0.19 0.21 0.21 0.23 0.04 0.07 0.07 0.03 0.03 0.03 0.03 0.01 0.01 0.01
REGION : V - BICOL REGION 0.38 0.44 0.45 0.49 0.08 0.15 0.16 0.06 0.07 0.07 0.08 0.01 0.03 0.03
REGION : VI – WESTERN VISAYAS 0.47 0.50 0.51 0.54 0.09 0.16 0.17 0.08 0.09 0.09 0.11 0.02 0.04 0.04
REGION : VII – CENTRAL VISAYAS 0.41 0.47 0.48 0.53 0.08 0.16 0.17 0.11 0.13 0.14 0.17 0.03 0.05 0.06
REGION : VIII – EASTERN VISAYAS 0.29 0.33 0.33 0.34 0.05 0.10 0.11 0.04 0.04 0.05 0.06 0.01 0.02 0.02
REGION : IX - ZAMBOANGA PENINSULA 0.21 0.24 0.25 0.27 0.04 0.08 0.08 0.03 0.03 0.04 0.05 0.01 0.01 0.02
REGION : X – NORTHERN MINDANAO 0.23 0.26 0.27 0.29 0.04 0.07 0.08 0.07 0.07 0.07 0.08 0.01 0.03 0.03
REGION : XI - DAVAO REGION 0.25 0.29 0.31 0.33 0.05 0.08 0.10 0.05 0.06 0.06 0.07 0.01 0.02 0.02
REGION : XII - SOCCSKSARGEN 0.23 0.27 0.28 0.29 0.05 0.09 0.09 0.05 0.06 0.06 0.07 0.01 0.02 0.03
REGION : CARAGA 0.16 0.18 0.18 0.19 0.03 0.05 0.06 0.02 0.03 0.03 0.04 0.01 0.01 0.01
REGION : NCR 0.67 0.71 0.72 0.76 0.13 0.25 0.25 0.22 0.22 0.22 0.22 0.06 0.11 0.10
REGION : CAR 0.09 0.09 0.09 0.09 0.02 0.03 0.03 0.03 0.04 0.04 0.04 0.01 0.01 0.01
REGION : ARMM0.18 0.20 0.21 0.21 0.02 0.04 0.05 0.03 0.04 0.04 0.04 0.01 0.02 0.02
PHILIPPINES 5.53 6.15 6.28 6.71 1.08 2.03 2.14 1.38 1.52 1.57 1.75 0.35 0.67 0.68
7/27/2019 SHS Absorptive Capacity Study
http://slidepdf.com/reader/full/shs-absorptive-capacity-study 9/57
Page 6
3. ESTIMATION OF CLASSROOM REQUIREMENTS
3.1 Classroom Requirement for Grades 11-12 in Public Senior High Schools
(2017 through 2020)
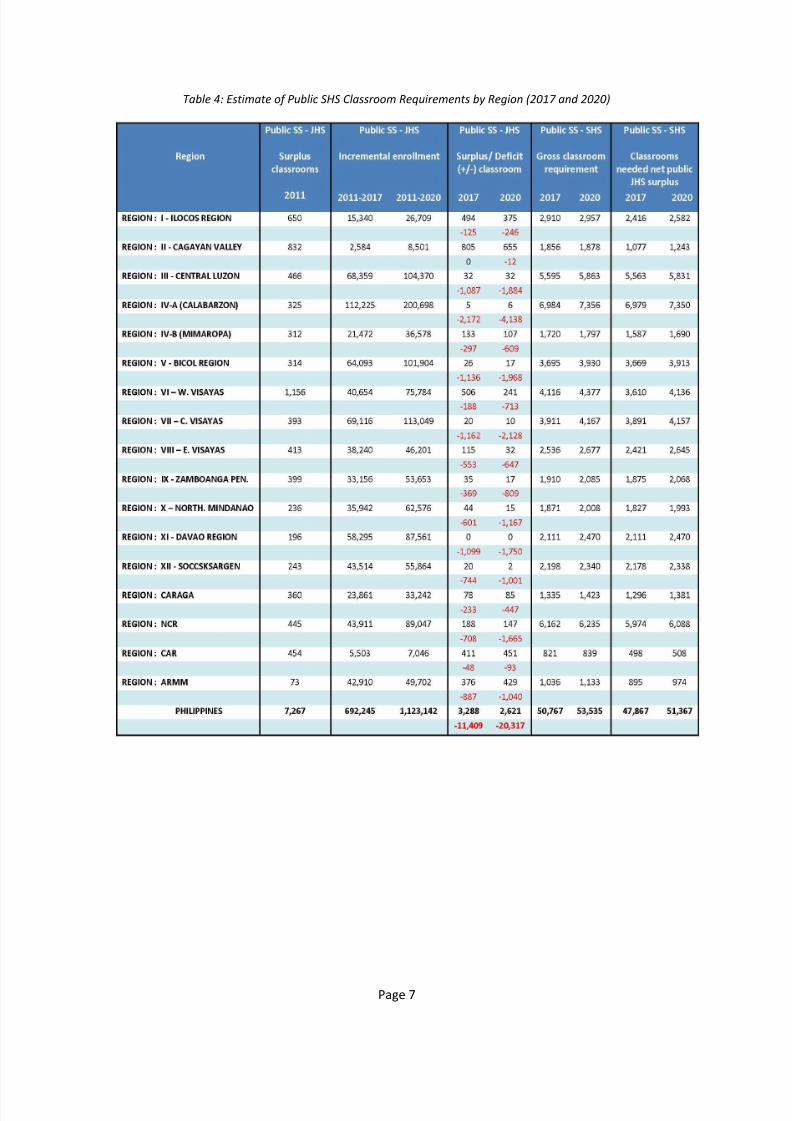
Classroom needs: The minimum standard for SHS classrooms is 40 students per room. If
the number of Grade 10 graduates in public JHS who will proceed to public SHSs is divided by 40, the
estimated figure for classrooms would be around 49,000 by 2017 and around 51,000 by 2020 ( Table
4). The final figure will depend on how many public SHS students can be accommodated in private
SHS programs, how many schools will operate double shifts, and the actual demand for SHS by
pathway. An additional, 11,409 classrooms will be needed to accommodate incremental increases in
enrolment anticipated in Grades 7-10 between 2011 and 2017.
Surplus classrooms: Despite widespread shortages in classrooms in public JHSs at present,
some schools have more classrooms than they need to meet the requirements of their current
enrolment. The total number of excess classrooms in public JHSs as of the end of SY 2011-2012 is
estimated at 7,267.4
Moreover, 63 divisions are projected to have a total of 3,288 surplus
classrooms in their JHS programs by 2017.5
This number is based on estimates of the difference
between the actual number of excess classrooms in public JHSs as of the end of SY 2011-2012 and
the number of classrooms that that are needed to provide places for the incremental enrolment in
Grades 7-10 between 2011 and 2017.
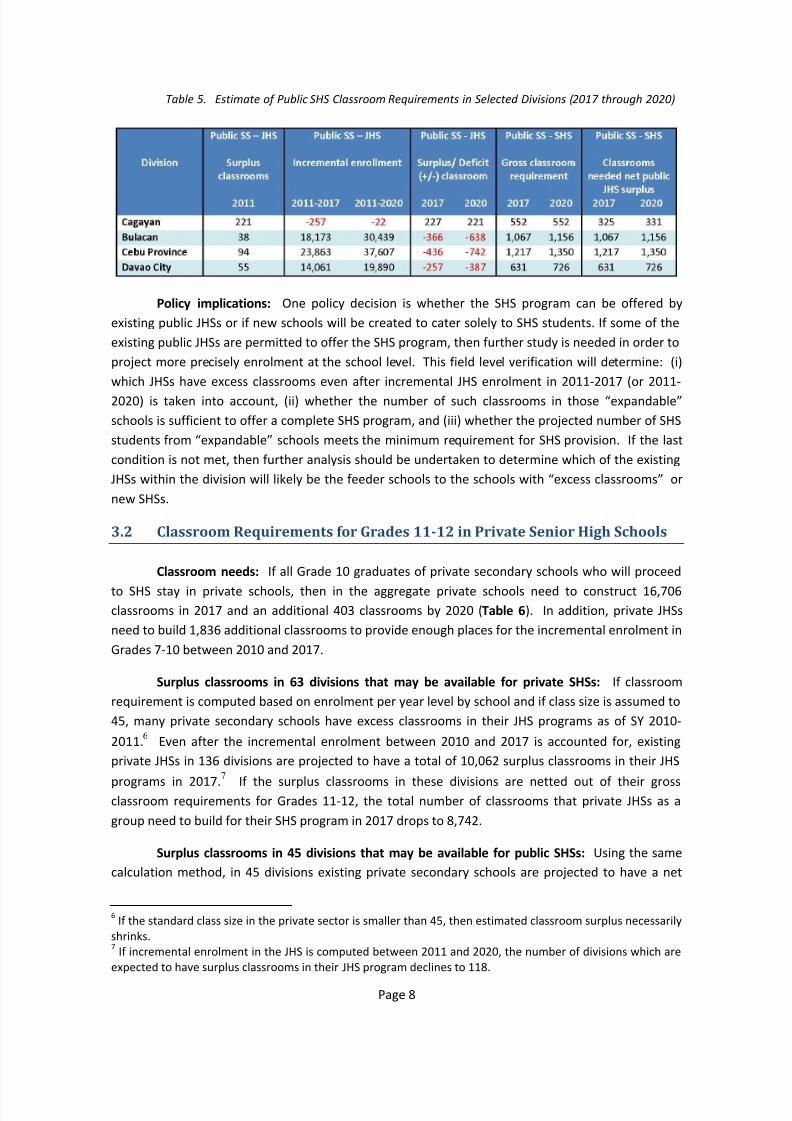
Divisions with surpluses: If the surplus classrooms at the JHS level in the 63 divisions with
excess classrooms are deducted from their gross classroom requirements for Grades 11-12, then the
total number of classrooms needed in public schools by 2017 drops to 47,867. The divisions which
are projected to have surplus classrooms in their public JHSs by 2017 are divisions like Cagayan
Province which have large classroom surpluses as of the end of SY 2011-2012 and where incremental
enrolment in the JHS in 2011-2017 is either negative or, if positive, not large enough to eliminate the
initial classroom surplus (Table 5). This calculation assumes that enough classrooms will be built to
address the current shortages in JHS, and that the number of excess classrooms in the junior high
schools with excess classrooms is large enough to offer a complete SHS program.
4Based on school level data from the BEIS, it is estimated that the classroom shortage in public secondary
schools is equal to 33,321 in SY 2011-2012. The number of surplus/ deficit classrooms in SY 2011-2012 is
estimated based on enrolment per year level by school assuming a standard class size of 45.5If incremental enrolment in the JHS is computed between 2011 and 2020, the number of divisions which are
expected to have surplus classrooms in their JHS program declines to 43.
7/27/2019 SHS Absorptive Capacity Study
http://slidepdf.com/reader/full/shs-absorptive-capacity-study 10/57
Page 7
Table 4: Estimate of Public SHS Classroom Requirements by Region (2017 and 2020)
7/27/2019 SHS Absorptive Capacity Study
http://slidepdf.com/reader/full/shs-absorptive-capacity-study 11/57
Page 8
Table 5. Estimate of Public SHS Classroom Requirements in Selected Divisions (2017 through 2020)
Policy implications: One policy decision is whether the SHS program can be offered by
existing public JHSs or if new schools will be created to cater solely to SHS students. If some of the
existing public JHSs are permitted to offer the SHS program, then further study is needed in order to
project more precisely enrolment at the school level. This field level verification will determine: (i)
which JHSs have excess classrooms even after incremental JHS enrolment in 2011-2017 (or 2011-
2020) is taken into account, (ii) whether the number of such classrooms in those “expandable”
schools is sufficient to offer a complete SHS program, and (iii) whether the projected number of SHS
students from “expandable” schools meets the minimum requirement for SHS provision. If the last
condition is not met, then further analysis should be undertaken to determine which of the existing
JHSs within the division will likely be the feeder schools to the schools with “excess classrooms” or
new SHSs.
3.2 Classroom Requirements for Grades 11-12 in Private Senior High Schools
Classroom needs: If all Grade 10 graduates of private secondary schools who will proceed
to SHS stay in private schools, then in the aggregate private schools need to construct 16,706
classrooms in 2017 and an additional 403 classrooms by 2020 (Table 6). In addition, private JHSs
need to build 1,836 additional classrooms to provide enough places for the incremental enrolment in
Grades 7-10 between 2010 and 2017.
Surplus classrooms in 63 divisions that may be available for private SHSs: If classroom
requirement is computed based on enrolment per year level by school and if class size is assumed to
45, many private secondary schools have excess classrooms in their JHS programs as of SY 2010-
2011.6
Even after the incremental enrolment between 2010 and 2017 is accounted for, existing
private JHSs in 136 divisions are projected to have a total of 10,062 surplus classrooms in their JHS
programs in 2017.7
If the surplus classrooms in these divisions are netted out of their gross
classroom requirements for Grades 11-12, the total number of classrooms that private JHSs as a
group need to build for their SHS program in 2017 drops to 8,742.
Surplus classrooms in 45 divisions that may be available for public SHSs: Using the same
calculation method, in 45 divisions existing private secondary schools are projected to have a net
6If the standard class size in the private sector is smaller than 45, then estimated classroom surplus necessarily
shrinks.7If incremental enrolment in the JHS is computed between 2011 and 2020, the number of divisions which are
expected to have surplus classrooms in their JHS program declines to 118.
7/27/2019 SHS Absorptive Capacity Study
http://slidepdf.com/reader/full/shs-absorptive-capacity-study 12/57
Page 9
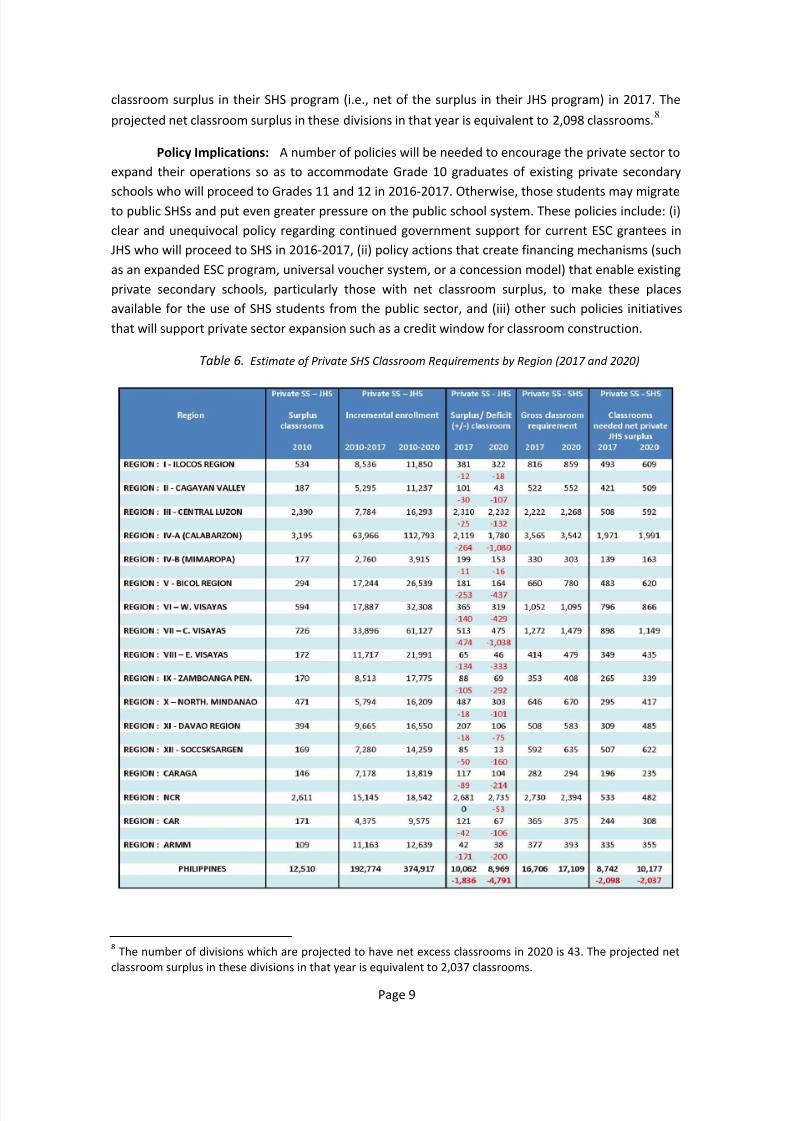
classroom surplus in their SHS program (i.e., net of the surplus in their JHS program) in 2017. The
projected net classroom surplus in these divisions in that year is equivalent to 2,098 classrooms.8
Policy Implications: A number of policies will be needed to encourage the private sector to
expand their operations so as to accommodate Grade 10 graduates of existing private secondary
schools who will proceed to Grades 11 and 12 in 2016-2017. Otherwise, those students may migrate
to public SHSs and put even greater pressure on the public school system. These policies include: (i)
clear and unequivocal policy regarding continued government support for current ESC grantees in
JHS who will proceed to SHS in 2016-2017, (ii) policy actions that create financing mechanisms (such
as an expanded ESC program, universal voucher system, or a concession model) that enable existing
private secondary schools, particularly those with net classroom surplus, to make these places
available for the use of SHS students from the public sector, and (iii) other such policies initiatives
that will support private sector expansion such as a credit window for classroom construction.
Table 6. Estimate of Private SHS Classroom Requirements by Region (2017 and 2020)
8The number of divisions which are projected to have net excess classrooms in 2020 is 43. The projected net
classroom surplus in these divisions in that year is equivalent to 2,037 classrooms.
7/27/2019 SHS Absorptive Capacity Study
http://slidepdf.com/reader/full/shs-absorptive-capacity-study 13/57
Page 10
Classrooms in HEIs: With the introduction of the additional two years of high school in
2016, higher education institutions (HEIs) will have no freshmen students in 2016, no freshmen and
sophomore students in 2017, no sophomore and junior students in 2018 and no junior and senior
students in 2019. Because of these missing cohorts, HEIs will have empty places that can be made
available for the SHS students in the interim at the very least.
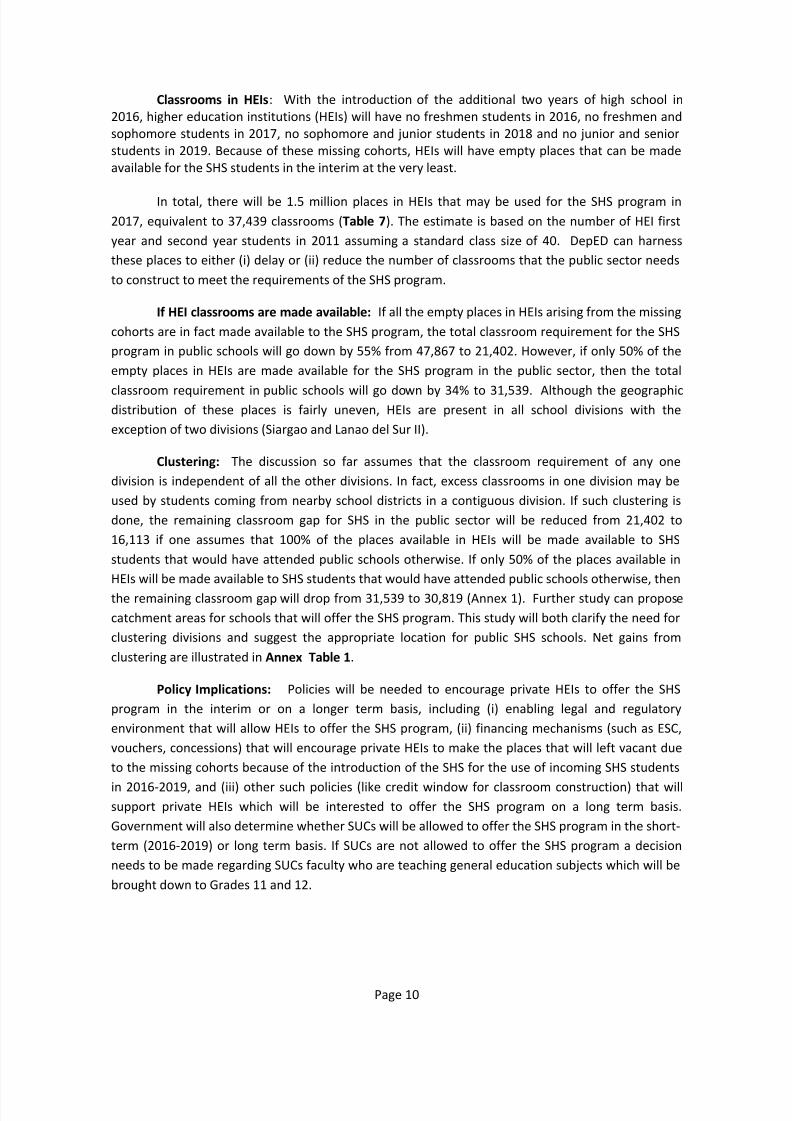
In total, there will be 1.5 million places in HEIs that may be used for the SHS program in
2017, equivalent to 37,439 classrooms (Table 7). The estimate is based on the number of HEI first
year and second year students in 2011 assuming a standard class size of 40. DepED can harness
these places to either (i) delay or (ii) reduce the number of classrooms that the public sector needs
to construct to meet the requirements of the SHS program.
If HEI classrooms are made available: If all the empty places in HEIs arising from the missing
cohorts are in fact made available to the SHS program, the total classroom requirement for the SHS
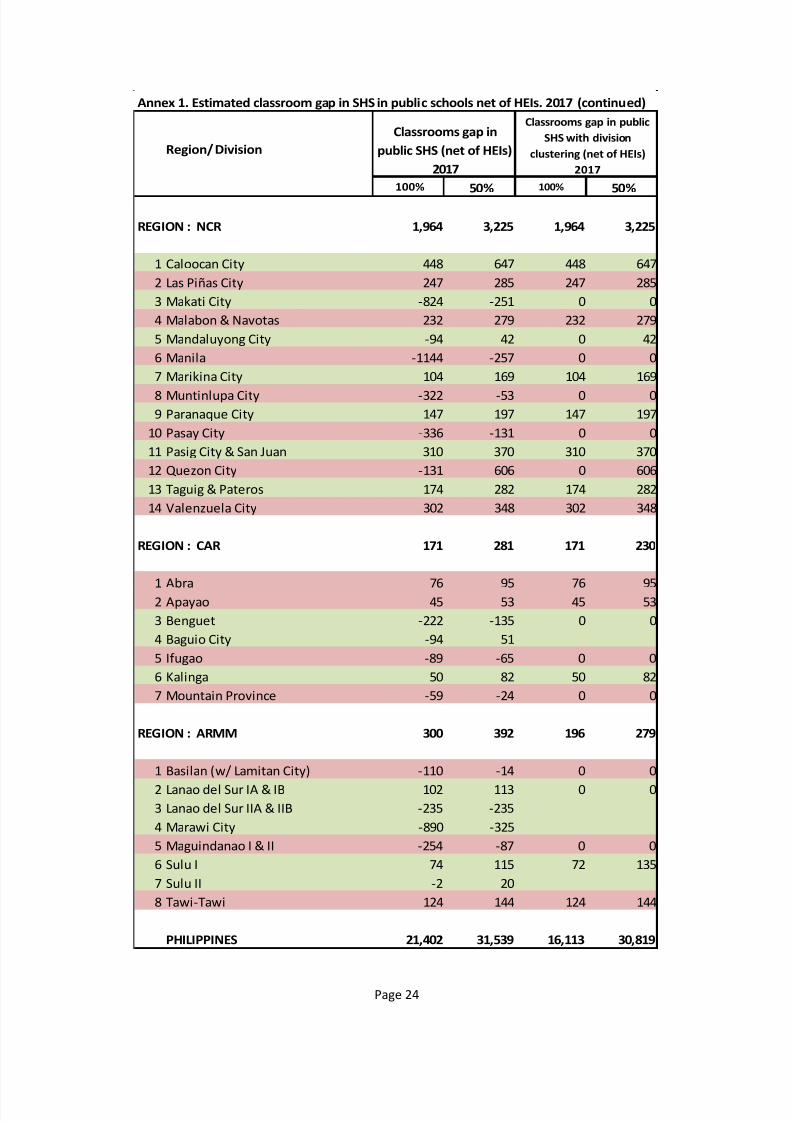
program in public schools will go down by 55% from 47,867 to 21,402. However, if only 50% of the
empty places in HEIs are made available for the SHS program in the public sector, then the totalclassroom requirement in public schools will go down by 34% to 31,539. Although the geographic
distribution of these places is fairly uneven, HEIs are present in all school divisions with the
exception of two divisions (Siargao and Lanao del Sur II).
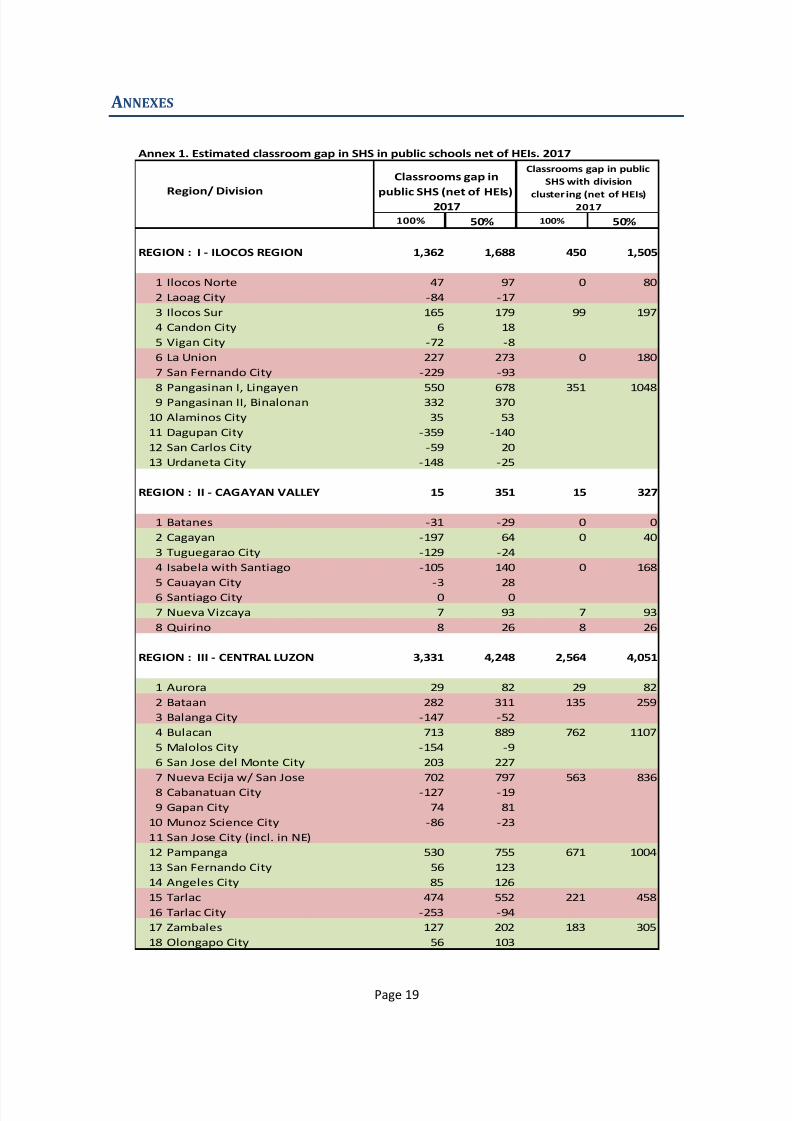
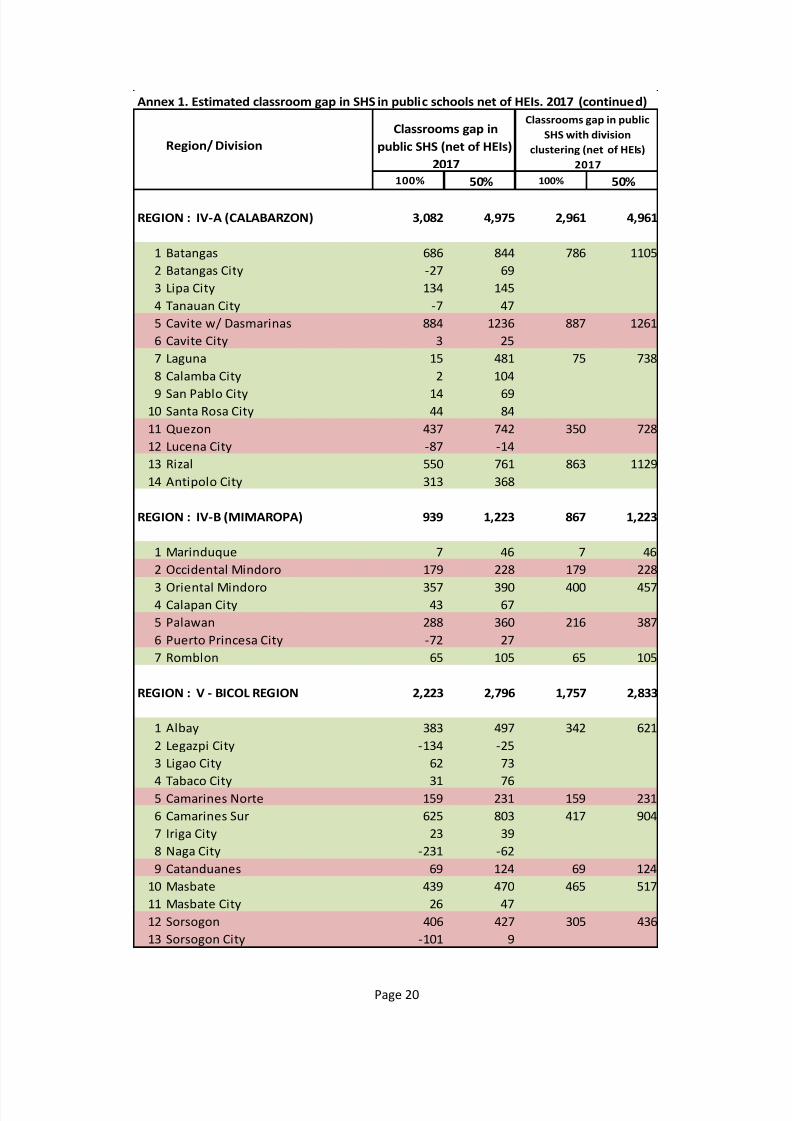
Clustering: The discussion so far assumes that the classroom requirement of any one
division is independent of all the other divisions. In fact, excess classrooms in one division may be
used by students coming from nearby school districts in a contiguous division. If such clustering is
done, the remaining classroom gap for SHS in the public sector will be reduced from 21,402 to
16,113 if one assumes that 100% of the places available in HEIs will be made available to SHS
students that would have attended public schools otherwise. If only 50% of the places available inHEIs will be made available to SHS students that would have attended public schools otherwise, then
the remaining classroom gap will drop from 31,539 to 30,819 (Annex 1). Further study can propose
catchment areas for schools that will offer the SHS program. This study will both clarify the need for
clustering divisions and suggest the appropriate location for public SHS schools. Net gains from
clustering are illustrated in Annex Table 1.
Policy Implications: Policies will be needed to encourage private HEIs to offer the SHS
program in the interim or on a longer term basis, including (i) enabling legal and regulatory
environment that will allow HEIs to offer the SHS program, (ii) financing mechanisms (such as ESC,
vouchers, concessions) that will encourage private HEIs to make the places that will left vacant dueto the missing cohorts because of the introduction of the SHS for the use of incoming SHS students
in 2016-2019, and (iii) other such policies (like credit window for classroom construction) that will
support private HEIs which will be interested to offer the SHS program on a long term basis.
Government will also determine whether SUCs will be allowed to offer the SHS program in the short-
term (2016-2019) or long term basis. If SUCs are not allowed to offer the SHS program a decision
needs to be made regarding SUCs faculty who are teaching general education subjects which will be
brought down to Grades 11 and 12.
7/27/2019 SHS Absorptive Capacity Study
http://slidepdf.com/reader/full/shs-absorptive-capacity-study 14/57
Page 11
Table 7. Estimates of classrooms available for Grades 11 and 12 in HEIs by Region (2017)
7/27/2019 SHS Absorptive Capacity Study
http://slidepdf.com/reader/full/shs-absorptive-capacity-study 15/57
Page 12
4. ESTIMATION OF TEACHER REQUIREMENTS
4.1 Teacher Requirements for Grades 11-12 in Public Senior High Schools
(2017 through 2020)
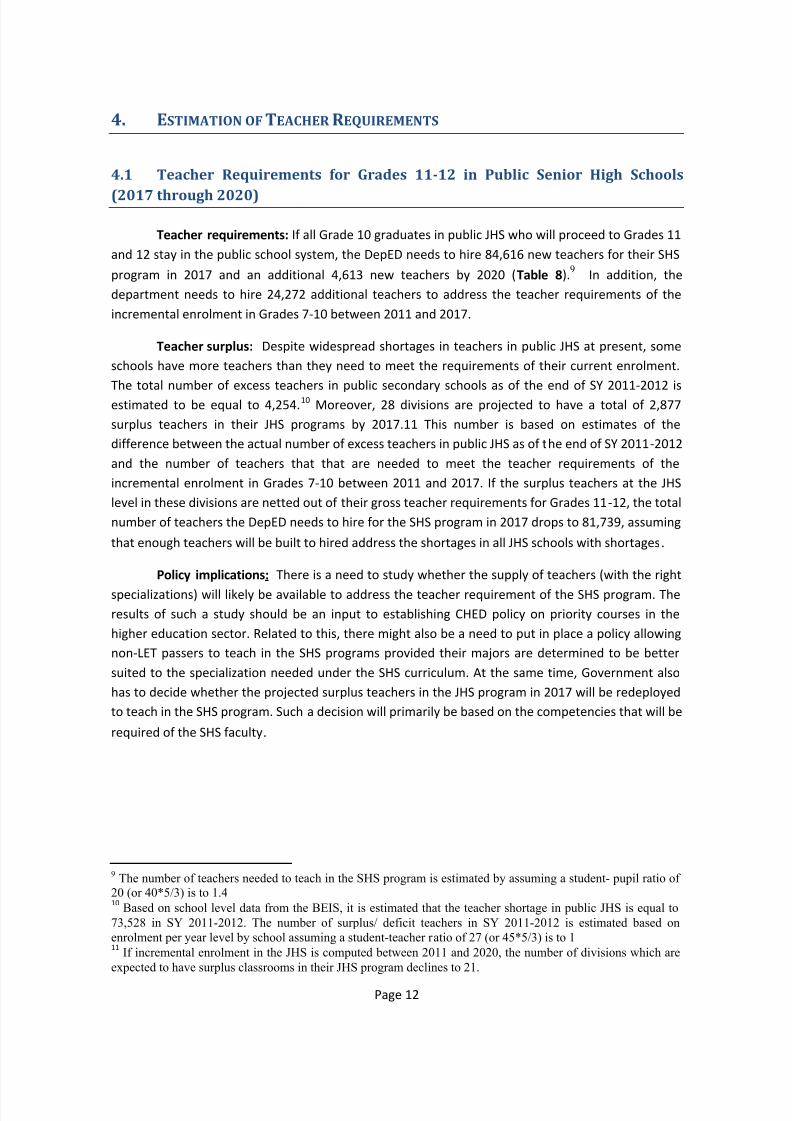
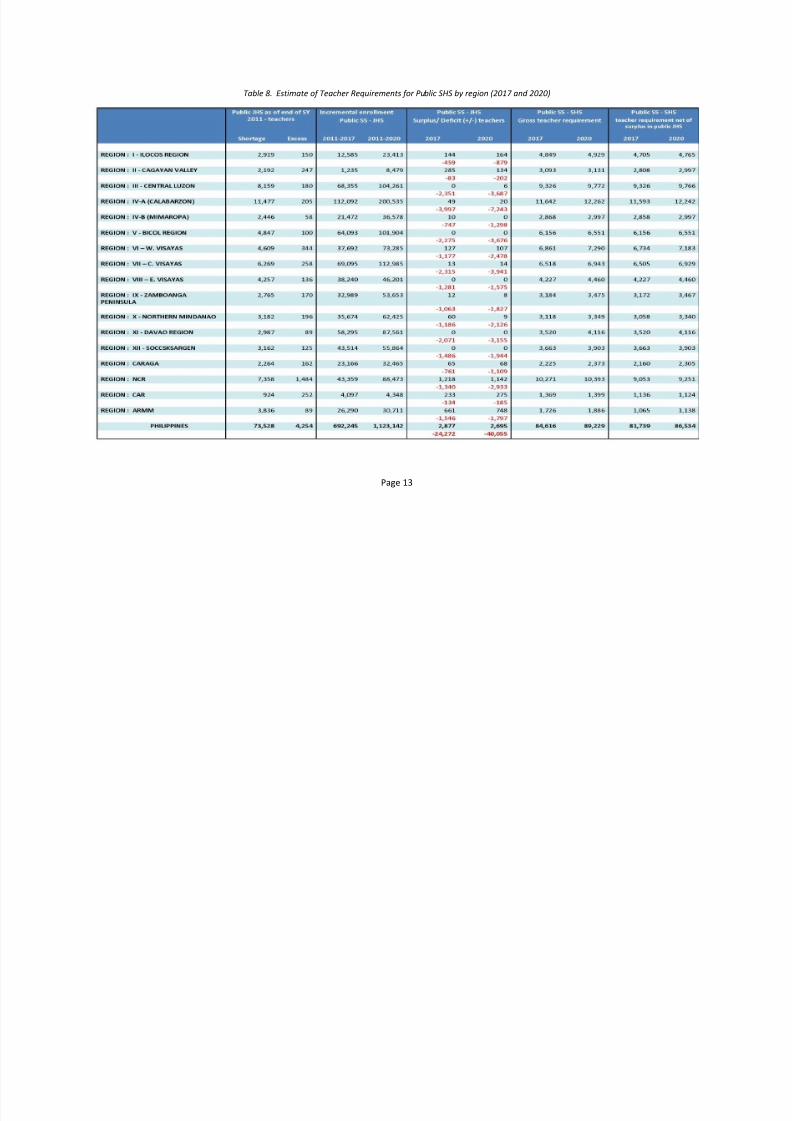
Teacher requirements: If all Grade 10 graduates in public JHS who will proceed to Grades 11
and 12 stay in the public school system, the DepED needs to hire 84,616 new teachers for their SHS
program in 2017 and an additional 4,613 new teachers by 2020 (Table 8).9
In addition, the
department needs to hire 24,272 additional teachers to address the teacher requirements of the
incremental enrolment in Grades 7-10 between 2011 and 2017.
Teacher surplus: Despite widespread shortages in teachers in public JHS at present, some
schools have more teachers than they need to meet the requirements of their current enrolment.
The total number of excess teachers in public secondary schools as of the end of SY 2011-2012 is
estimated to be equal to 4,254.10
Moreover, 28 divisions are projected to have a total of 2,877
surplus teachers in their JHS programs by 2017.11 This number is based on estimates of the
difference between the actual number of excess teachers in public JHS as of the end of SY 2011-2012
and the number of teachers that that are needed to meet the teacher requirements of the
incremental enrolment in Grades 7-10 between 2011 and 2017. If the surplus teachers at the JHS
level in these divisions are netted out of their gross teacher requirements for Grades 11-12, the total
number of teachers the DepED needs to hire for the SHS program in 2017 drops to 81,739, assuming
that enough teachers will be built to hired address the shortages in all JHS schools with shortages.
Policy implications: There is a need to study whether the supply of teachers (with the right
specializations) will likely be available to address the teacher requirement of the SHS program. The
results of such a study should be an input to establishing CHED policy on priority courses in the
higher education sector. Related to this, there might also be a need to put in place a policy allowing
non-LET passers to teach in the SHS programs provided their majors are determined to be better
suited to the specialization needed under the SHS curriculum. At the same time, Government also
has to decide whether the projected surplus teachers in the JHS program in 2017 will be redeployed
to teach in the SHS program. Such a decision will primarily be based on the competencies that will be
required of the SHS faculty.
9The number of teachers needed to teach in the SHS program is estimated by assuming a student- pupil ratio of
20 (or 40*5/3) is to 1.410
Based on school level data from the BEIS, it is estimated that the teacher shortage in public JHS is equal to
73,528 in SY 2011-2012. The number of surplus/ deficit teachers in SY 2011-2012 is estimated based on
enrolment per year level by school assuming a student-teacher ratio of 27 (or 45*5/3) is to 1 11 If incremental enrolment in the JHS is computed between 2011 and 2020, the number of divisions which are
expected to have surplus classrooms in their JHS program declines to 21.
7/27/2019 SHS Absorptive Capacity Study
http://slidepdf.com/reader/full/shs-absorptive-capacity-study 16/57
Page 13
Table 8. Estimate of Teacher Requirements for Public SHS by region (2017 and 2020)
7/27/2019 SHS Absorptive Capacity Study
http://slidepdf.com/reader/full/shs-absorptive-capacity-study 17/57
Page 14
4.2 Teacher Requirement for Grades 11-12 in Private Senior High Schools
(2017 through 2020)
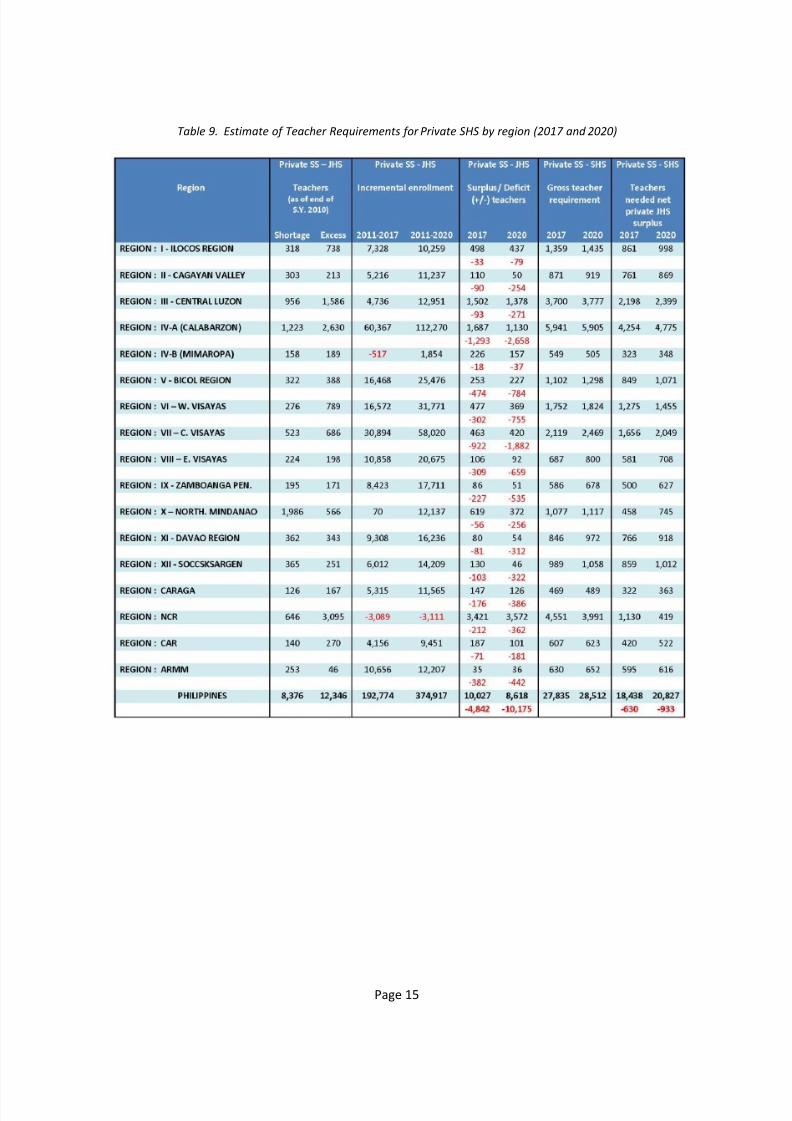
Teacher need: If all Grade 10 graduates of private secondary schools who will proceed to
Grades 11 and 12 stay in private schools, private schools in the aggregate need to hire 27,835 new
teachers for their SHS program in 2017 and an additional 677 new teachers by 2020 ( Table 9). In
addition, private JHS need to hire 4,842 additional teachers to address the teacher requirements of
the incremental enrolment in Grades 7-10 between 2010 and 2017.
Surplus teachers: In the private sector, many secondary schools are found to have excess
teachers in their JHS program in SY 2010-2011 if teacher requirement is computed based on
enrolment per year level by school and if the student-teacher ratio is assumed to be equal to 27 or
45*5/3) is to 1.12
Even after the incremental enrolment between 2010 and 2017 is accounted for,
existing private secondary schools in 132 divisions are projected to have a total of 10,027 surplus
teachers in their JHS programs in 2017.13
If the surplus teachers in these divisions are netted out of
their gross teacher requirements for Grades 11-12, the total number of teachers that private
secondary schools as a group need to hire for their SHS program in 2017 drops to 18,438. On the
other hand, existing private secondary schools in 27 divisions are projected to have a net teacher
surplus in their SHS program (i.e., net of surplus in the JHS program) in 2017. The projected net
teacher surplus in these divisions in that year is equivalent to 630 classrooms.14
Implications. The large number of additional teachers that will be needed to teach in the
SHS program in the private sector further reinforces the need for a study on teacher supply. Once
minimum standards for SHS teachers by specialization have been determined (based on the curricula
for the five career pathways) a study can assess whether there is sufficient supply of qualified
candidates. Based on the results of that study, a strategy can be formulated for stimulating the
interest of potential SHS teachers.
12If the standard pupil-teacher ratio in the private sector is smaller than 27:1, then estimated teacher surplus
necessarily shrinks.13
If incremental enrolment in the JHS is computed between 2011 and 2020, the number of divisions which are
expected to have surplus teachers in their JHS program declines to 110. 14The number of divisions which are projected to have net excess teachers in 2020 is 29. The projected net
teacher surplus in these divisions in that year is equivalent to 933 teachers.
7/27/2019 SHS Absorptive Capacity Study
http://slidepdf.com/reader/full/shs-absorptive-capacity-study 18/57
Page 15
Table 9. Estimate of Teacher Requirements for Private SHS by region (2017 and 2020)
7/27/2019 SHS Absorptive Capacity Study
http://slidepdf.com/reader/full/shs-absorptive-capacity-study 19/57
Page 16
4.3 Available Teachers for the SHS Program Currently Teaching in HEIs
HEI faculty available. As indicated earlier, there will be empty places in HEIs following the
introduction of the additional two years of high school in 2016. Consequently, HEI faculty who would
have handled the classes of the missing cohorts will conceivably be available to teach in the SHS
program either in the interim (i.e., 2016-2019) or in the long term (post 2019).
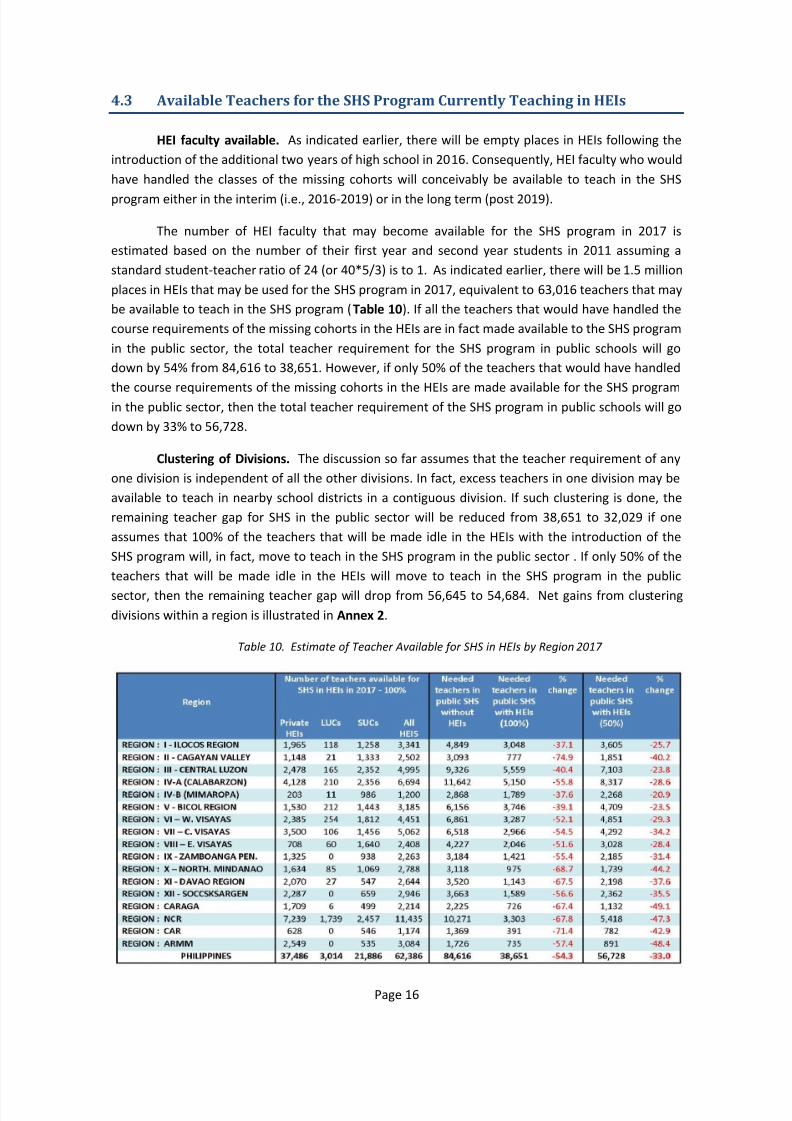
The number of HEI faculty that may become available for the SHS program in 2017 is
estimated based on the number of their first year and second year students in 2011 assuming a
standard student-teacher ratio of 24 (or 40*5/3) is to 1. As indicated earlier, there will be 1.5 million
places in HEIs that may be used for the SHS program in 2017, equivalent to 63,016 teachers that may
be available to teach in the SHS program (Table 10). If all the teachers that would have handled the
course requirements of the missing cohorts in the HEIs are in fact made available to the SHS program
in the public sector, the total teacher requirement for the SHS program in public schools will go
down by 54% from 84,616 to 38,651. However, if only 50% of the teachers that would have handled
the course requirements of the missing cohorts in the HEIs are made available for the SHS program
in the public sector, then the total teacher requirement of the SHS program in public schools will go
down by 33% to 56,728.
Clustering of Divisions. The discussion so far assumes that the teacher requirement of any
one division is independent of all the other divisions. In fact, excess teachers in one division may be
available to teach in nearby school districts in a contiguous division. If such clustering is done, the
remaining teacher gap for SHS in the public sector will be reduced from 38,651 to 32,029 if one
assumes that 100% of the teachers that will be made idle in the HEIs with the introduction of the
SHS program will, in fact, move to teach in the SHS program in the public sector . If only 50% of the
teachers that will be made idle in the HEIs will move to teach in the SHS program in the public
sector, then the remaining teacher gap will drop from 56,645 to 54,684. Net gains from clustering
divisions within a region is illustrated in Annex 2.
Table 10. Estimate of Teacher Available for SHS in HEIs by Region 2017
7/27/2019 SHS Absorptive Capacity Study
http://slidepdf.com/reader/full/shs-absorptive-capacity-study 20/57
Page 17
5. ABSORPTIVE C APACITY FOR ON-THE-JOB TRAINING
Applying learning: The capacity to apply classroom learning to real life situations is one of
soft skills SHS students are expected to learn. Other skills include, inter alia, using information from
a variety of sources to solve problems, working in teams towards a common objective, and the
ability to communicated verbally, in written form and via new media. In addition to integrating soft
skills into teaching methods used in subjects across the curricula, the SHS program’s Core Curriculum
includes one semester of on-the-job training. The final semester of Grade 12 is left open to provide
space for students seeking opportunities to “earn while they learn,” or benefit from hands on
training provided by employers.
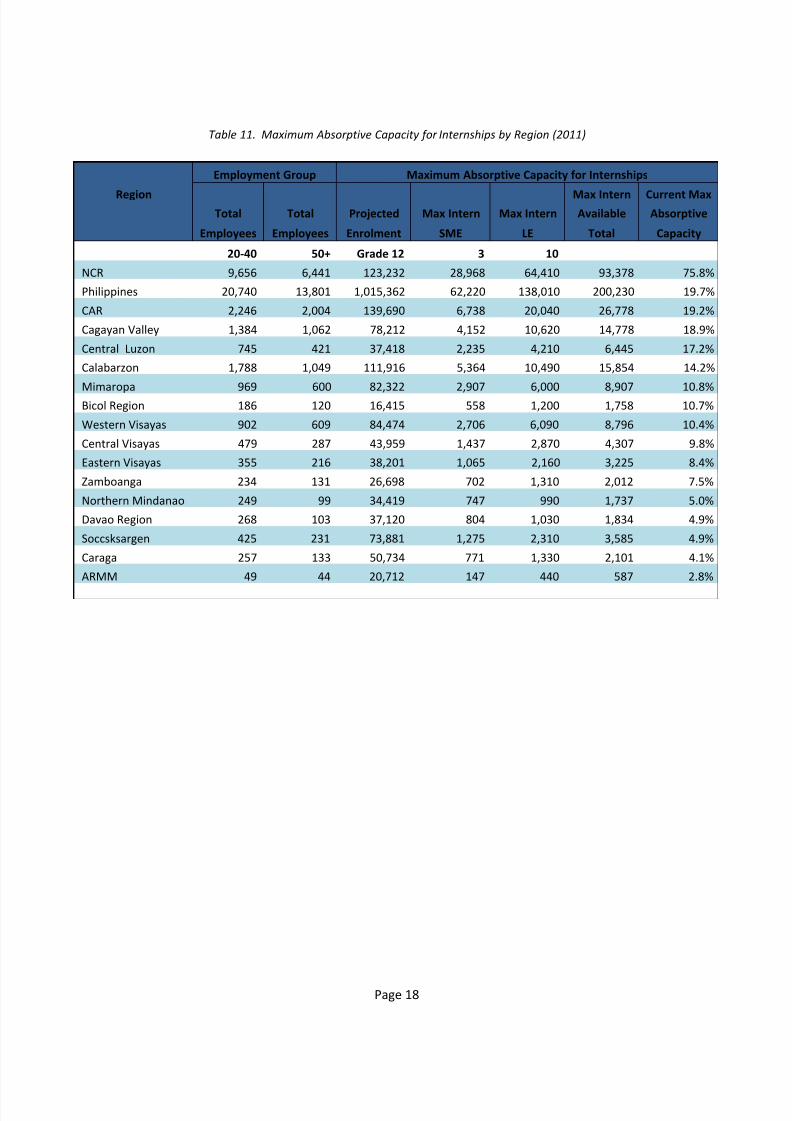
Minimum size of enterprises for OJT: In order to determine where sufficient opportunity for
OJT exists, a list was obtained from the National Statistics Office of enterprises by region as of 2011.
The list was reviewed to ascertain a rough estimate of the capacity of private enterprise to absorb
trainees or interns. It was assumed that enterprises employing at least 20 employees would have
the capacity to absorb 3 interns or trainees and provide a structured learning experience. Similarly,
firms with 50 or more employees were assumed to have the capacity to absorb 10 interns or
trainees at a time.
Limited Capacity and Uneven Distribution: The review found about 21,000 firms
nationwide that employ between 20 to 49 employees and around 14,000 firms that employ 50 or
more. Some of these enterprises, such as gambling establishments or bars, would not be
appropriate placements for SHS interns. A generous estimate of the total absorptive capacity of
enterprises is about 200,000 SHS interns while the demand for placements would be about
1,000,000, or around 20%. Furthermore, distribution of business is highly skewed with about 76% of
firms located in NCR. Table 11 summarizes maximum absorptive capacity for OJT and internships in
both small-medium sized and large enterprises.
7/27/2019 SHS Absorptive Capacity Study
http://slidepdf.com/reader/full/shs-absorptive-capacity-study 21/57
7/27/2019 SHS Absorptive Capacity Study
http://slidepdf.com/reader/full/shs-absorptive-capacity-study 22/57
Page 19
ANNEXES
Region/ Division
100% 50% 100% 50%
REGION : I - ILOCOS REGION 1,362 1,688 450 1,505
1 Ilocos Norte 47 97 0 80
2 Laoag City -84 -17
3 Ilocos Sur 165 179 99 197
4 Candon City 6 18
5 Vigan City -72 -8
6 La Union 227 273 0 180
7 San Fernando City -229 -938 Pangasinan I, Lingayen 550 678 351 1048
9 Pangasinan II, Binalonan 332 370
10 Alaminos City 35 53
11 Dagupan City -359 -140
12 San Carlos City -59 20
13 Urdaneta City -148 -25
REGION : II - CAGAYAN VALLEY 15 351 15 327
1 Batanes -31 -29 0 0
2 Cagayan -197 64 0 40
3 Tuguegarao City -129 -24
4 Isabela with Santiago -105 140 0 168
5 Cauayan City -3 28
6 Santiago City 0 0
7 Nueva Vizcaya 7 93 7 93
8 Quirino 8 26 8 26
REGION : III - CENTRAL LUZON 3,331 4,248 2,564 4,051
1 Aurora 29 82 29 82
2 Bataan 282 311 135 259
3 Balanga City -147 -52
4 Bulacan 713 889 762 1107
5 Malolos City -154 -96 San Jose del Monte City 203 227
7 Nueva Ecija w/ San Jose 702 797 563 836
8 Cabanatuan City -127 -19
9 Gapan City 74 81
10 Munoz Science City -86 -23
11 San Jose City (incl. in NE)
12 Pampanga 530 755 671 1004
13 San Fernando City 56 123
14 Angeles City 85 126
15 Tarlac 474 552 221 458
16 Tarlac City -253 -94
17 Zambales 127 202 183 305
18 Olongapo City 56 103
Annex 1. Estimated classroom gap in SHS in public schools net of HEIs. 2017
Classrooms gap in
public SHS (net of HEIs)
2017
Classrooms gap in public
SHS with division
clustering (net of HEIs)
2017
7/27/2019 SHS Absorptive Capacity Study
http://slidepdf.com/reader/full/shs-absorptive-capacity-study 23/57
Page 20
Region/ Division
100%
50%100%
50%
REGION : IV-A (CALABARZON) 3,082 4,975 2,961 4,961
1 Batangas 686 844 786 1105
2 Batangas City -27 69
3 Lipa City 134 145
4 Tanauan City -7 47
5 Cavite w/ Dasmarinas 884 1236 887 1261
6 Cavite City 3 25
7 Laguna 15 481 75 738
8 Calamba City 2 1049 San Pablo City 14 69
10 Santa Rosa City 44 84
11 Quezon 437 742 350 728
12 Lucena City -87 -14
13 Rizal 550 761 863 1129
14 Antipolo City 313 368
REGION : IV-B (MIMAROPA) 939 1,223 867 1,223
1 Marinduque 7 46 7 46
2 Occidental Mindoro 179 228 179 228
3 Oriental Mindoro 357 390 400 457
4 Calapan City 43 67
5 Palawan 288 360 216 387
6 Puerto Princesa City -72 27
7 Romblon 65 105 65 105
REGION : V - BICOL REGION 2,223 2,796 1,757 2,833
1 Albay 383 497 342 621
2 Legazpi City -134 -25
3 Ligao City 62 73
4 Tabaco City 31 76
5 Camarines Norte 159 231 159 231
6 Camarines Sur 625 803 417 904
7 Iriga City 23 39
8 Naga City -231 -62
9 Catanduanes 69 124 69 124
10 Masbate 439 470 465 517
11 Masbate City 26 47
12 Sorsogon 406 427 305 436
13 Sorsogon City -101 9
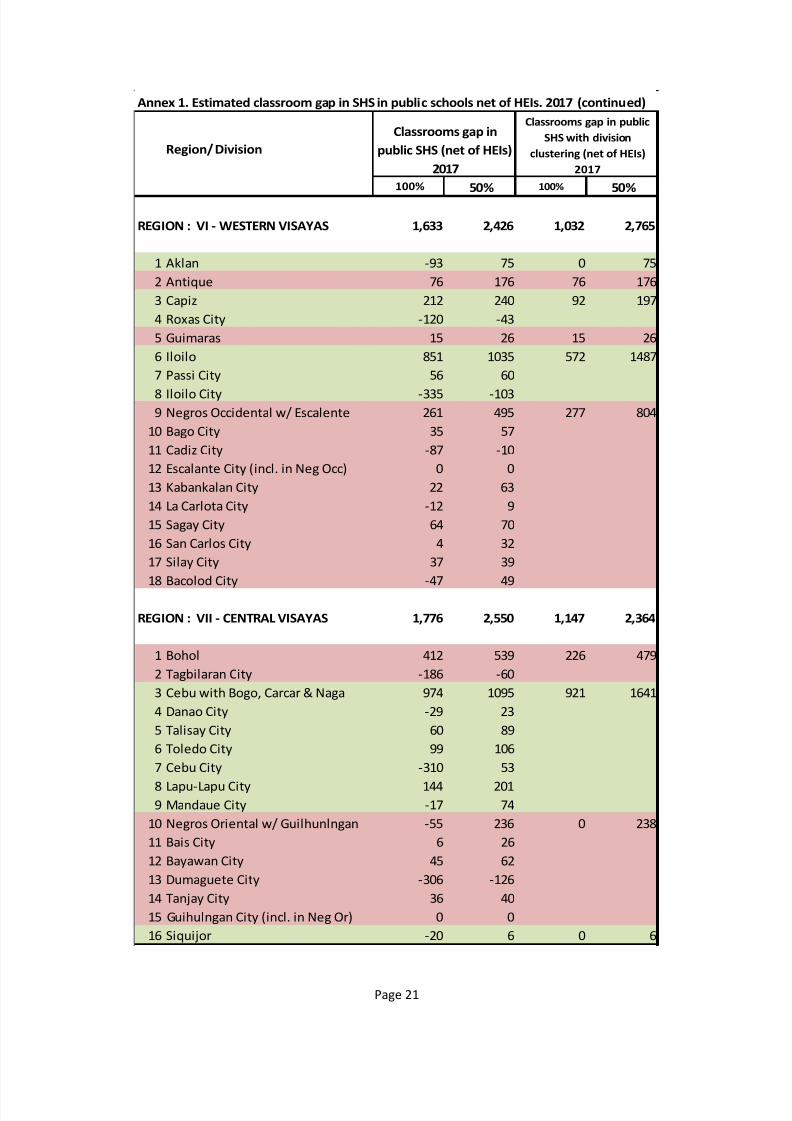
Annex 1. Estimated classroom gap in SHS in public schools net of HEIs. 2017 (continued)
Classrooms gap in
public SHS (net of HEIs)
2017
Classrooms gap in public
SHS with division
clustering (net of HEIs)
2017
7/27/2019 SHS Absorptive Capacity Study
http://slidepdf.com/reader/full/shs-absorptive-capacity-study 24/57
Page 21
Region/ Division
100% 50% 100% 50%
REGION : VI - WESTERN VISAYAS 1,633 2,426 1,032 2,765
1 Aklan -93 75 0 75
2 Antique 76 176 76 176
3 Capiz 212 240 92 197
4 Roxas City -120 -43
5 Guimaras 15 26 15 26
6 Iloilo 851 1035 572 1487
7 Passi City 56 608 Iloilo City -335 -103
9 Negros Occidental w/ Escalente 261 495 277 804
10 Bago City 35 57
11 Cadiz City -87 -10
12 Escalante City (incl. in Neg Occ) 0 0
13 Kabankalan City 22 63
14 La Carlota City -12 9
15 Sagay City 64 70
16 San Carlos City 4 32
17 Silay City 37 3918 Bacolod City -47 49
REGION : VII - CENTRAL VISAYAS 1,776 2,550 1,147 2,364
1 Bohol 412 539 226 479
2 Tagbilaran City -186 -60
3 Cebu with Bogo, Carcar & Naga 974 1095 921 1641
4 Danao City -29 23
5 Talisay City 60 89
6 Toledo City 99 1067 Cebu City -310 53
8 Lapu-Lapu City 144 201
9 Mandaue City -17 74
10 Negros Oriental w/ Guilhunlngan -55 236 0 238
11 Bais City 6 26
12 Bayawan City 45 62
13 Dumaguete City -306 -126
14 Tanjay City 36 40
15 Guihulngan City (incl. in Neg Or) 0 0
16 Siquijor -20 6 0 6
Annex 1. Estimated classroom gap in SHS in public schools net of HEIs. 2017 (continued)
Classrooms gap in
public SHS (net of HEIs)
2017
Classrooms gap in public
SHS with division
clustering (net of HEIs)
2017
7/27/2019 SHS Absorptive Capacity Study
http://slidepdf.com/reader/full/shs-absorptive-capacity-study 25/57
Page 22
Region/ Division
100% 50% 100% 50%
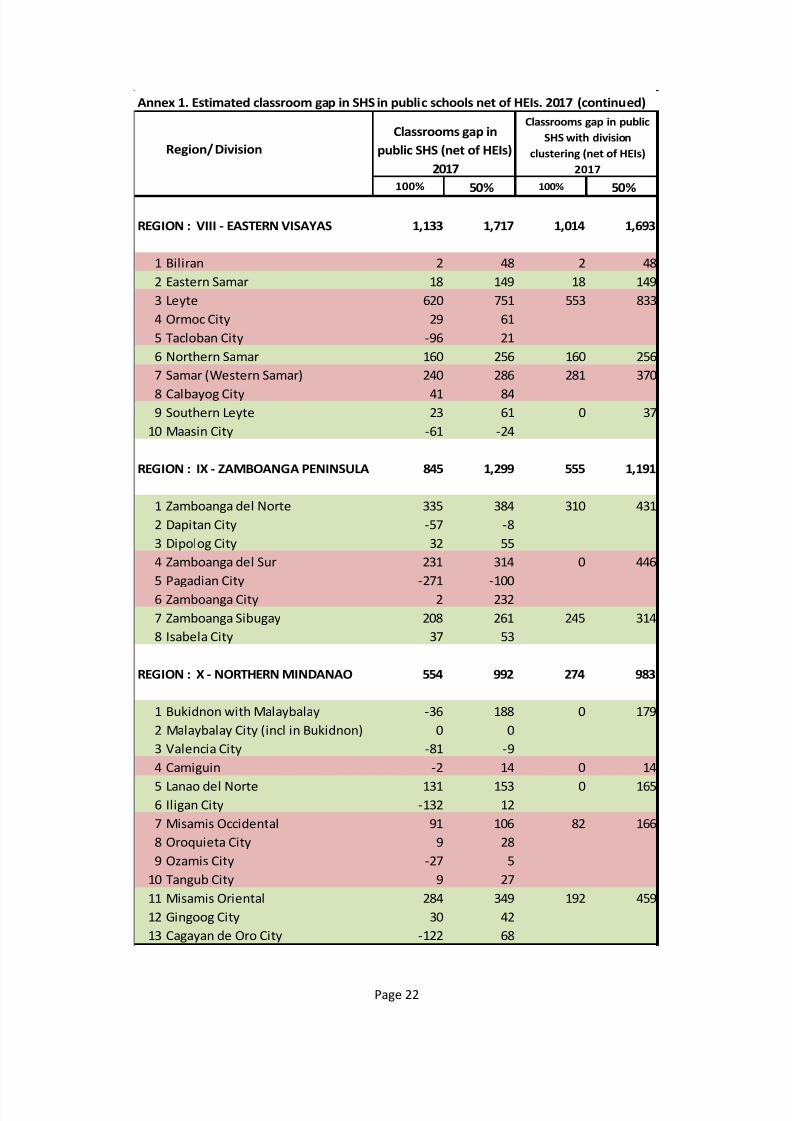
REGION : VIII - EASTERN VISAYAS 1,133 1,717 1,014 1,693
1 Biliran 2 48 2 48
2 Eastern Samar 18 149 18 149
3 Leyte 620 751 553 833
4 Ormoc City 29 61
5 Tacloban City -96 21
6 Northern Samar 160 256 160 256
7 Samar (Western Samar) 240 286 281 3708 Calbayog City 41 84
9 Southern Leyte 23 61 0 37
10 Maasin City -61 -24
REGION : IX - ZAMBOANGA PENINSULA 845 1,299 555 1,191
1 Zamboanga del Norte 335 384 310 431
2 Dapitan City -57 -8
3 Dipolog City 32 55
4 Zamboanga del Sur 231 314 0 4465 Pagadian City -271 -100
6 Zamboanga City 2 232
7 Zamboanga Sibugay 208 261 245 314
8 Isabela City 37 53
REGION : X - NORTHERN MINDANAO 554 992 274 983
1 Bukidnon with Malaybalay -36 188 0 179
2 Malaybalay City (incl in Bukidnon) 0 0
3 Valencia City -81 -94 Camiguin -2 14 0 14
5 Lanao del Norte 131 153 0 165
6 Iligan City -132 12
7 Misamis Occidental 91 106 82 166
8 Oroquieta City 9 28
9 Ozamis City -27 5
10 Tangub City 9 27
11 Misamis Oriental 284 349 192 459
12 Gingoog City 30 42
13 Cagayan de Oro City -122 68
Annex 1. Estimated classroom gap in SHS in public schools net of HEIs. 2017 (continued)
Classrooms gap in
public SHS (net of HEIs)
2017
Classrooms gap in public
SHS with division
clustering (net of HEIs)
2017
7/27/2019 SHS Absorptive Capacity Study
http://slidepdf.com/reader/full/shs-absorptive-capacity-study 26/57
Page 23
Region/ Division
100% 50% 100% 50%
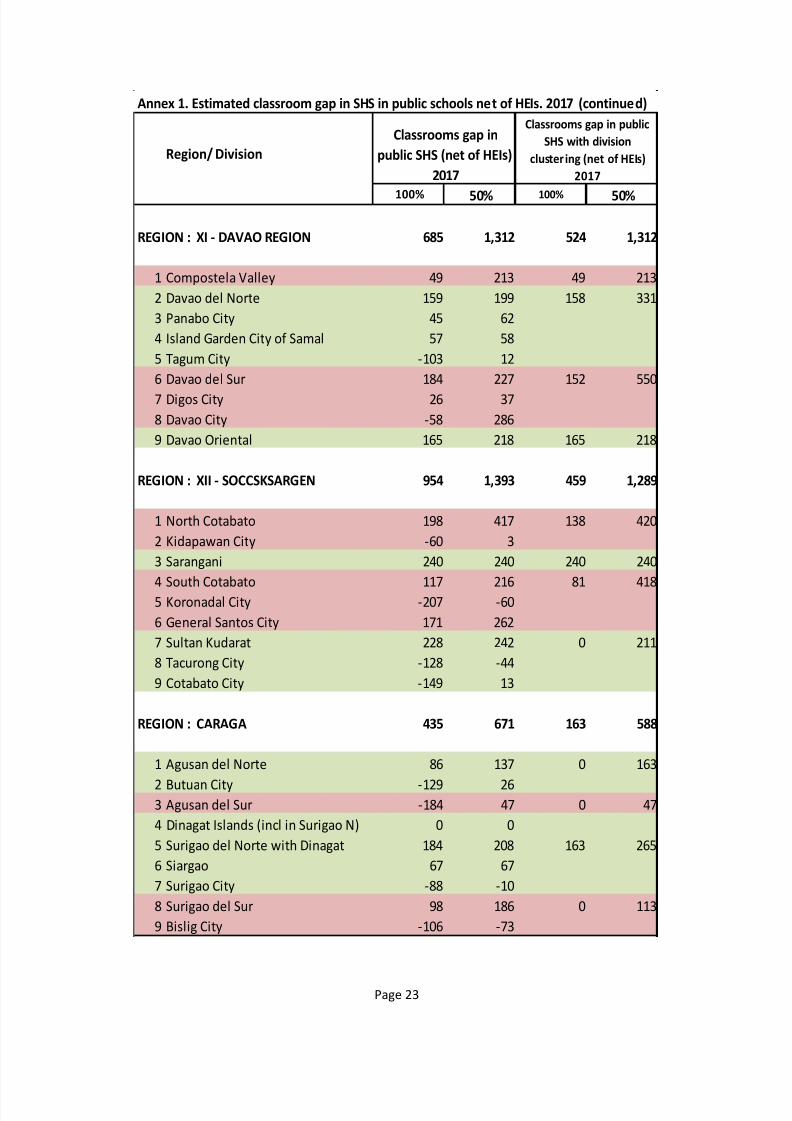
REGION : XI - DAVAO REGION 685 1,312 524 1,312
1 Compostela Valley 49 213 49 213
2 Davao del Norte 159 199 158 331
3 Panabo City 45 62
4 Island Garden City of Samal 57 58
5 Tagum City -103 12
6 Davao del Sur 184 227 152 5507 Digos City 26 37
8 Davao City -58 286
9 Davao Oriental 165 218 165 218
REGION : XII - SOCCSKSARGEN 954 1,393 459 1,289
1 North Cotabato 198 417 138 420
2 Kidapawan City -60 3
3 Sarangani 240 240 240 2404 South Cotabato 117 216 81 418
5 Koronadal City -207 -60
6 General Santos City 171 262
7 Sultan Kudarat 228 242 0 211
8 Tacurong City -128 -44
9 Cotabato City -149 13
REGION : CARAGA 435 671 163 588
1 Agusan del Norte 86 137 0 163
2 Butuan City -129 26
3 Agusan del Sur -184 47 0 47
4 Dinagat Islands (incl in Surigao N) 0 0
5 Surigao del Norte with Dinagat 184 208 163 265
6 Siargao 67 67
7 Surigao City -88 -10
8 Surigao del Sur 98 186 0 113
9 Bislig City -106 -73
Annex 1. Estimated classroom gap in SHS in public schools net of HEIs. 2017 (continued)
Classrooms gap in
public SHS (net of HEIs)
2017
Classrooms gap in public
SHS with division
clustering (net of HEIs)
2017
7/27/2019 SHS Absorptive Capacity Study
http://slidepdf.com/reader/full/shs-absorptive-capacity-study 27/57
Page 24
Region/ Division
100% 50% 100% 50%
REGION : NCR 1,964 3,225 1,964 3,225
1 Caloocan City 448 647 448 647
2 Las Piñas City 247 285 247 285
3 Makati City -824 -251 0 0
4 Malabon & Navotas 232 279 232 279
5 Mandaluyong City -94 42 0 42
6 Manila -1144 -257 0 0
7 Marikina City 104 169 104 1698 Muntinlupa City -322 -53 0 0
9 Paranaque City 147 197 147 197
10 Pasay City -336 -131 0 0
11 Pasig City & San Juan 310 370 310 370
12 Quezon City -131 606 0 606
13 Taguig & Pateros 174 282 174 282
14 Valenzuela City 302 348 302 348
REGION : CAR 171 281 171 230
1 Abra 76 95 76 95
2 Apayao 45 53 45 53
3 Benguet -222 -135 0 0
4 Baguio City -94 51
5 Ifugao -89 -65 0 0
6 Kalinga 50 82 50 82
7 Mountain Province -59 -24 0 0
REGION : ARMM 300 392 196 279
1 Basilan (w/ Lamitan City) -110 -14 0 0
2 Lanao del Sur IA & IB 102 113 0 0
3 Lanao del Sur IIA & IIB -235 -235
4 Marawi City -890 -325
5 Maguindanao I & II -254 -87 0 0
6 Sulu I 74 115 72 135
7 Sulu II -2 20
8 Tawi-Tawi 124 144 124 144
PHILIPPINES 21,402 31,539 16,113 30,819
Annex 1. Estimated classroom gap in SHS in public schools net of HEIs. 2017 (continued)
Classrooms gap in
public SHS (net of HEIs)
2017
Classrooms gap in public
SHS with division
clustering (net of HEIs)
2017
7/27/2019 SHS Absorptive Capacity Study
http://slidepdf.com/reader/full/shs-absorptive-capacity-study 28/57
Page 25
Region/ Division
100% 50% 100% 50%
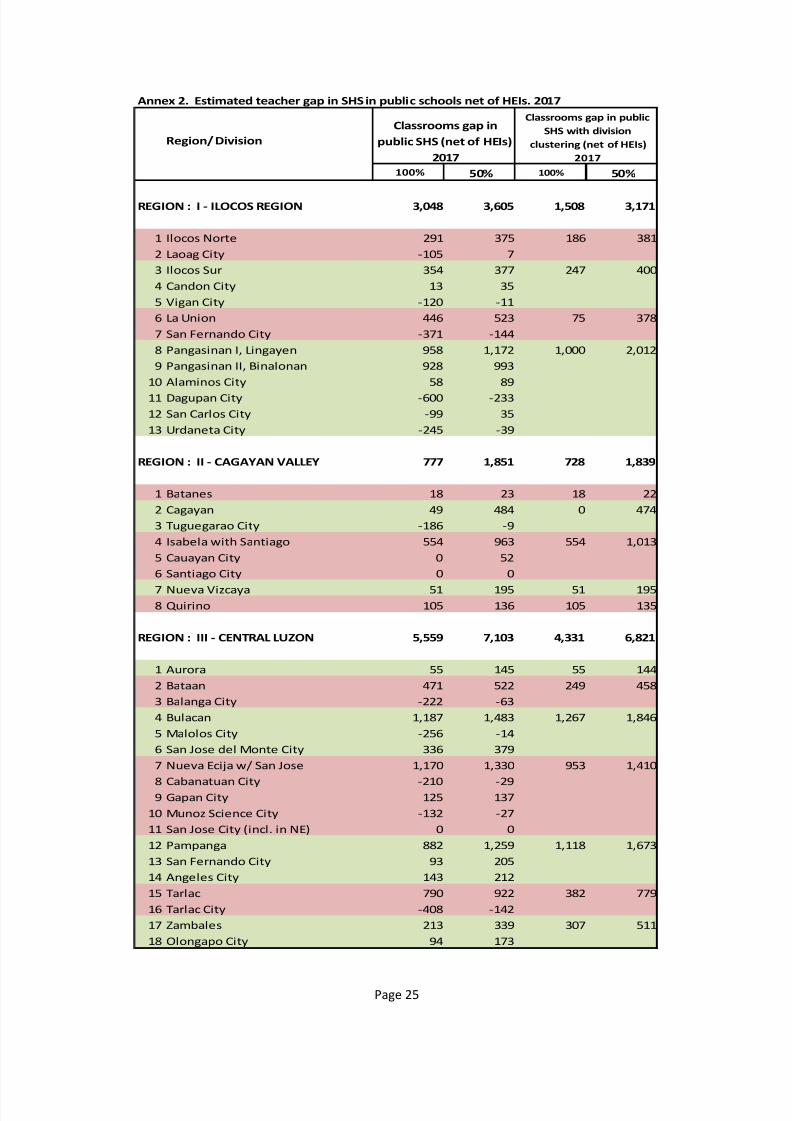
REGION : I - ILOCOS REGION 3,048 3,605 1,508 3,171
1 Ilocos Norte 291 375 186 381
2 Laoag City -105 7
3 Ilocos Sur 354 377 247 400
4 Candon City 13 35
5 Vigan City -120 -11
6 La Union 446 523 75 378
7 San Fernando City -371 -144
8 Pangasinan I, Lingayen 958 1,172 1,000 2,012
9 Pangasinan II, Binalonan 928 993
10 Alaminos City 58 89
11 Dagupan City -600 -233
12 San Carlos City -99 35
13 Urdaneta City -245 -39
REGION : II - CAGAYAN VALLEY 777 1,851 728 1,839
1 Batanes 18 23 18 22
2 Cagayan 49 484 0 474
3 Tuguegarao City -186 -9
4 Isabela with Santiago 554 963 554 1,013
5 Cauayan City 0 52
6 Santiago City 0 0
7 Nueva Vizcaya 51 195 51 195
8 Quirino 105 136 105 135
REGION : III - CENTRAL LUZON 5,559 7,103 4,331 6,821
1 Aurora 55 145 55 144
2 Bataan 471 522 249 458
3 Balanga City -222 -63
4 Bulacan 1,187 1,483 1,267 1,846
5 Malolos City -256 -14
6 San Jose del Monte City 336 3797 Nueva Ecija w/ San Jose 1,170 1,330 953 1,410
8 Cabanatuan City -210 -29
9 Gapan City 125 137
10 Munoz Science City -132 -27
11 San Jose City (incl. in NE) 0 0
12 Pampanga 882 1,259 1,118 1,673
13 San Fernando City 93 205
14 Angeles City 143 212
15 Tarlac 790 922 382 779
16 Tarlac City -408 -142
17 Zambales 213 339 307 511
18 Olongapo City 94 173
Annex 2. Estimated teacher gap in SHS in public schools net of HEIs. 2017
Classrooms gap in
public SHS (net of HEIs)
2017
Classrooms gap in public
SHS with division
clustering (net of HEIs)
2017
7/27/2019 SHS Absorptive Capacity Study
http://slidepdf.com/reader/full/shs-absorptive-capacity-study 29/57
7/27/2019 SHS Absorptive Capacity Study
http://slidepdf.com/reader/full/shs-absorptive-capacity-study 30/57
Page 27
Region/ Division
100% 50% 100% 50%
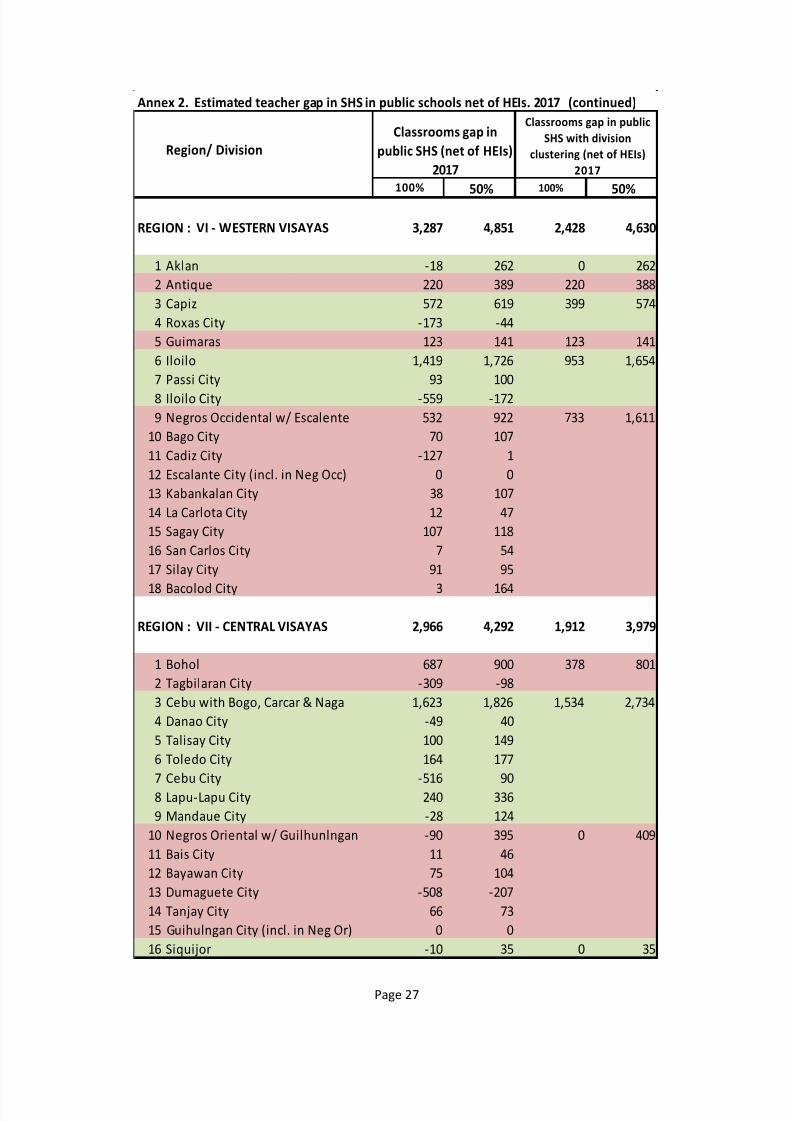
REGION : VI - WESTERN VISAYAS 3,287 4,851 2,428 4,630
1 Aklan -18 262 0 262
2 Antique 220 389 220 388
3 Capiz 572 619 399 574
4 Roxas City -173 -44
5 Guimaras 123 141 123 141
6 Iloilo 1,419 1,726 953 1,654
7 Passi City 93 100
8 Iloilo City -559 -172
9 Negros Occidental w/ Escalente 532 922 733 1,611
10 Bago City 70 107
11 Cadiz City -127 1
12 Escalante City (incl. in Neg Occ) 0 0
13 Kabankalan City 38 107
14 La Carlota City 12 47
15 Sagay City 107 118
16 San Carlos City 7 54
17 Silay City 91 95
18 Bacolod City 3 164
REGION : VII - CENTRAL VISAYAS 2,966 4,292 1,912 3,979
1 Bohol 687 900 378 801
2 Tagbilaran City -309 -98
3 Cebu with Bogo, Carcar & Naga 1,623 1,826 1,534 2,734
4 Danao City -49 40
5 Talisay City 100 149
6 Toledo City 164 177
7 Cebu City -516 90
8 Lapu-Lapu City 240 336
9 Mandaue City -28 124
10 Negros Oriental w/ Guilhunlngan -90 395 0 409
11 Bais City 11 46
12 Bayawan City 75 104
13 Dumaguete City -508 -207
14 Tanjay City 66 73
15 Guihulngan City (incl. in Neg Or) 0 0
16 Siquijor -10 35 0 35
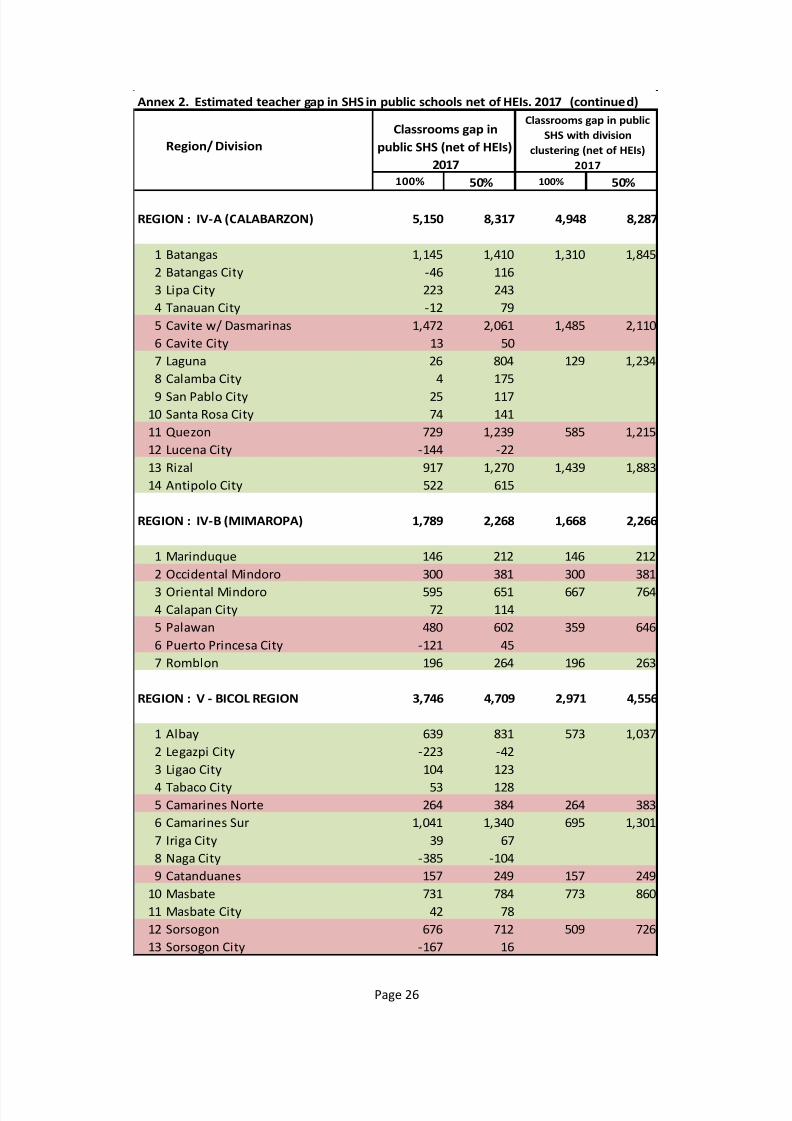
Annex 2. Estimated teacher gap in SHS in public schools net of HEIs. 2017 (continued)
Classrooms gap in
public SHS (net of HEIs)
2017
Classrooms gap in public
SHS with division
clustering (net of HEIs)
2017
7/27/2019 SHS Absorptive Capacity Study
http://slidepdf.com/reader/full/shs-absorptive-capacity-study 31/57
Page 28
Region/ Division
100% 50% 100% 50%
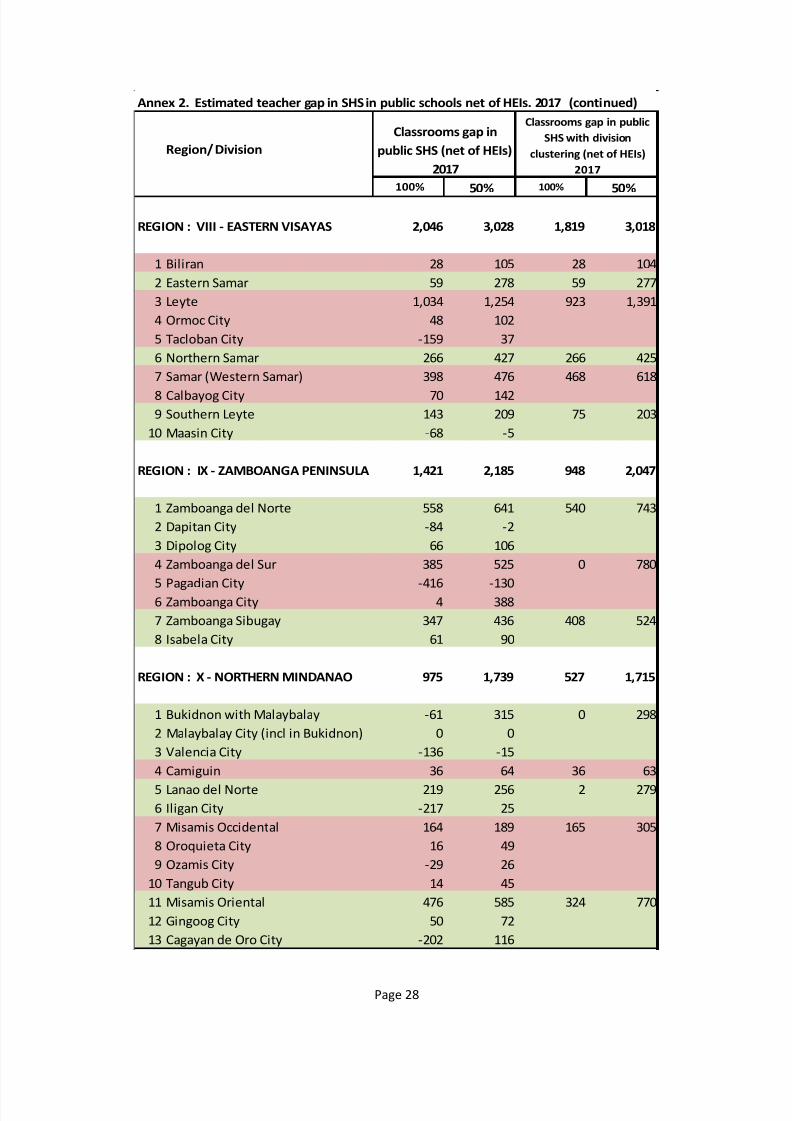
REGION : VIII - EASTERN VISAYAS 2,046 3,028 1,819 3,018
1 Biliran 28 105 28 104
2 Eastern Samar 59 278 59 277
3 Leyte 1,034 1,254 923 1,391
4 Ormoc City 48 102
5 Tacloban City -159 37
6 Northern Samar 266 427 266 425
7 Samar (Western Samar) 398 476 468 6188 Calbayog City 70 142
9 Southern Leyte 143 209 75 203
10 Maasin City -68 -5
REGION : IX - ZAMBOANGA PENINSULA 1,421 2,185 948 2,047
1 Zamboanga del Norte 558 641 540 743
2 Dapitan City -84 -2
3 Dipolog City 66 106
4 Zamboanga del Sur 385 525 0 7805 Pagadian City -416 -130
6 Zamboanga City 4 388
7 Zamboanga Sibugay 347 436 408 524
8 Isabela City 61 90
REGION : X - NORTHERN MINDANAO 975 1,739 527 1,715
1 Bukidnon with Malaybalay -61 315 0 298
2 Malaybalay City (incl in Bukidnon) 0 0
3 Valencia City -136 -154 Camiguin 36 64 36 63
5 Lanao del Norte 219 256 2 279
6 Iligan City -217 25
7 Misamis Occidental 164 189 165 305
8 Oroquieta City 16 49
9 Ozamis City -29 26
10 Tangub City 14 45
11 Misamis Oriental 476 585 324 770
12 Gingoog City 50 72
13 Cagayan de Oro City -202 116
Annex 2. Estimated teacher gap in SHS in public schools net of HEIs. 2017 (continued)
Classrooms gap in
public SHS (net of HEIs)
2017
Classrooms gap in public
SHS with division
clustering (net of HEIs)
2017
7/27/2019 SHS Absorptive Capacity Study
http://slidepdf.com/reader/full/shs-absorptive-capacity-study 32/57
Page 29
Region/ Division
100% 50% 100% 50%
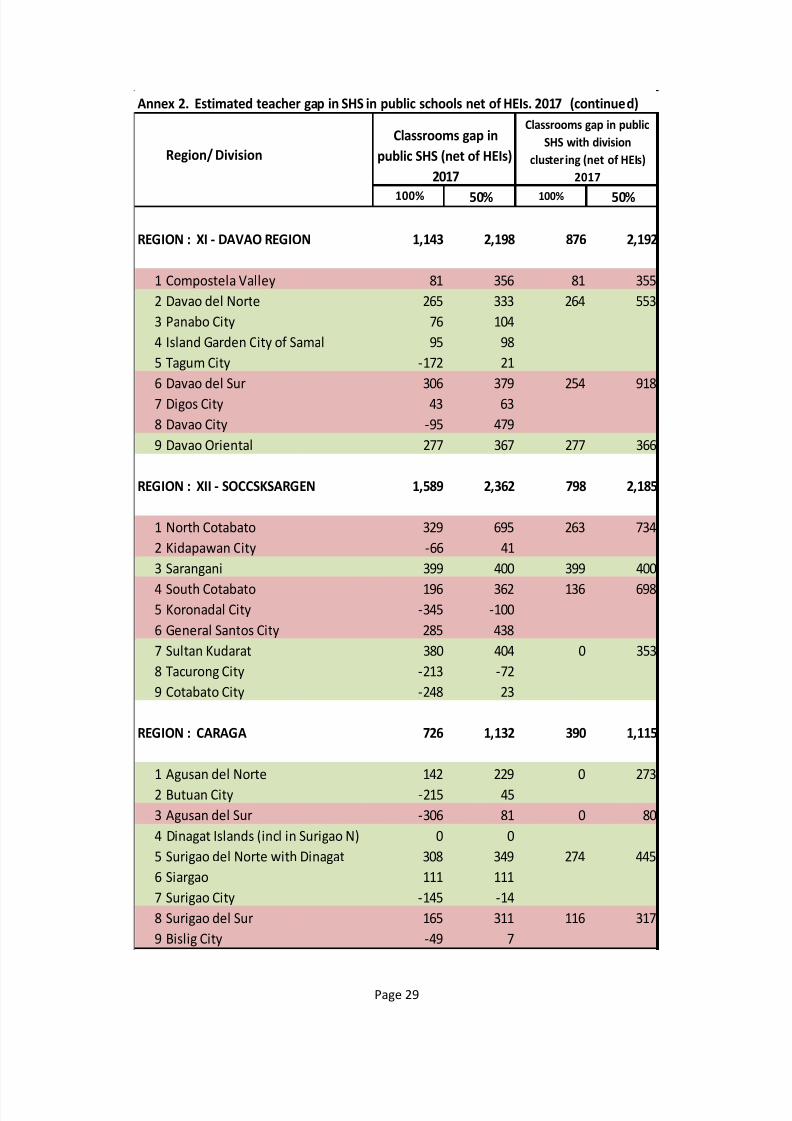
REGION : XI - DAVAO REGION 1,143 2,198 876 2,192
1 Compostela Valley 81 356 81 355
2 Davao del Norte 265 333 264 553
3 Panabo City 76 104
4 Island Garden City of Samal 95 98
5 Tagum City -172 21
6 Davao del Sur 306 379 254 918
7 Digos City 43 63
8 Davao City -95 479
9 Davao Oriental 277 367 277 366
REGION : XII - SOCCSKSARGEN 1,589 2,362 798 2,185
1 North Cotabato 329 695 263 734
2 Kidapawan City -66 41
3 Sarangani 399 400 399 400
4 South Cotabato 196 362 136 698
5 Koronadal City -345 -100
6 General Santos City 285 438
7 Sultan Kudarat 380 404 0 353
8 Tacurong City -213 -72
9 Cotabato City -248 23
REGION : CARAGA 726 1,132 390 1,115
1 Agusan del Norte 142 229 0 273
2 Butuan City -215 45
3 Agusan del Sur -306 81 0 80
4 Dinagat Islands (incl in Surigao N) 0 0
5 Surigao del Norte with Dinagat 308 349 274 445
6 Siargao 111 111
7 Surigao City -145 -14
8 Surigao del Sur 165 311 116 317
9 Bislig City -49 7
Annex 2. Estimated teacher gap in SHS in public schools net of HEIs. 2017 (continued)
Classrooms gap in
public SHS (net of HEIs)
2017
Classrooms gap in public
SHS with division
clustering (net of HEIs)
2017
7/27/2019 SHS Absorptive Capacity Study
http://slidepdf.com/reader/full/shs-absorptive-capacity-study 33/57
Page 30
Region/ Division
100% 50% 100% 50%
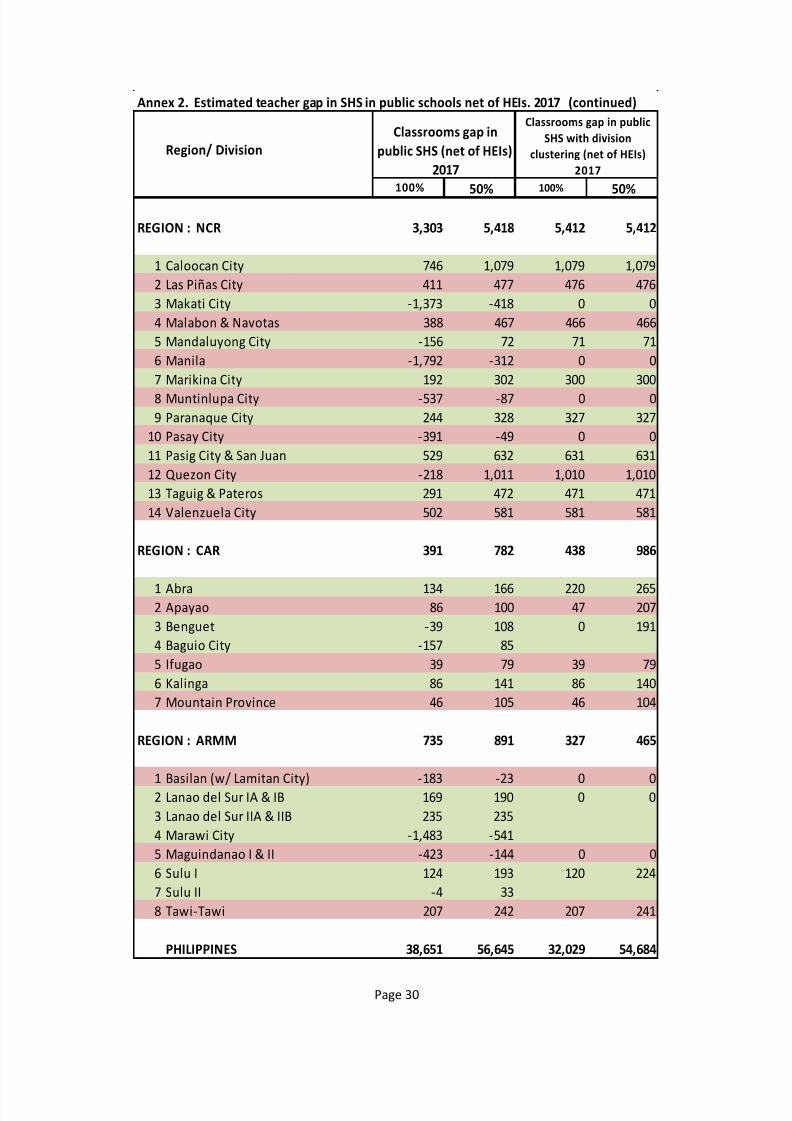
REGION : NCR 3,303 5,418 5,412 5,412
1 Caloocan City 746 1,079 1,079 1,079
2 Las Piñas City 411 477 476 476
3 Makati City -1,373 -418 0 0
4 Malabon & Navotas 388 467 466 466
5 Mandaluyong City -156 72 71 71
6 Manila -1,792 -312 0 0
7 Marikina City 192 302 300 300
8 Muntinlupa City -537 -87 0 0
9 Paranaque City 244 328 327 327
10 Pasay City -391 -49 0 0
11 Pasig City & San Juan 529 632 631 631
12 Quezon City -218 1,011 1,010 1,010
13 Taguig & Pateros 291 472 471 471
14 Valenzuela City 502 581 581 581
REGION : CAR 391 782 438 986
1 Abra 134 166 220 265
2 Apayao 86 100 47 207
3 Benguet -39 108 0 191
4 Baguio City -157 85
5 Ifugao 39 79 39 79
6 Kalinga 86 141 86 140
7 Mountain Province 46 105 46 104
REGION : ARMM 735 891 327 465
1 Basilan (w/ Lamitan City) -183 -23 0 0
2 Lanao del Sur IA & IB 169 190 0 0
3 Lanao del Sur IIA & IIB 235 235
4 Marawi City -1,483 -541
5 Maguindanao I & II -423 -144 0 0
6 Sulu I 124 193 120 224
7 Sulu II -4 33
8 Tawi-Tawi 207 242 207 241
PHILIPPINES 38,651 56,645 32,029 54,684
Annex 2. Estimated teacher gap in SHS in public schools net of HEIs. 2017 (continued)
Classrooms gap in
public SHS (net of HEIs)
2017
Classrooms gap in public
SHS with division
clustering (net of HEIs)
2017
7/27/2019 SHS Absorptive Capacity Study
http://slidepdf.com/reader/full/shs-absorptive-capacity-study 34/57
Page 31
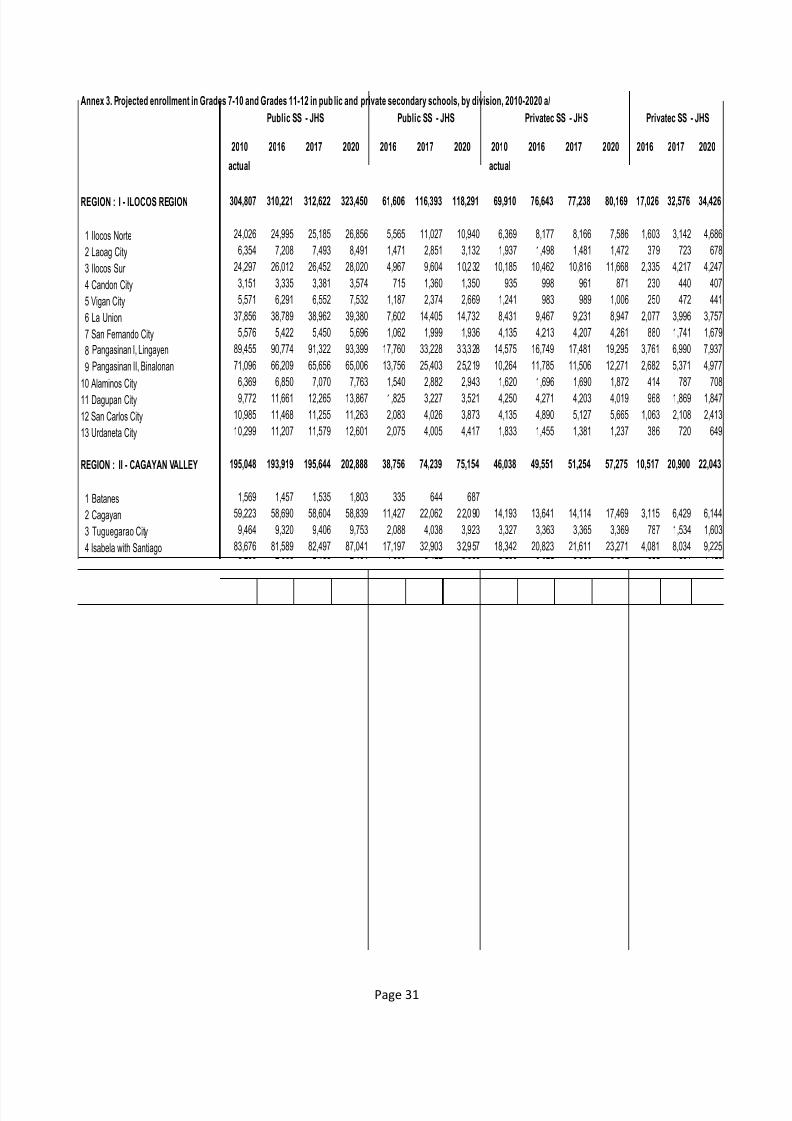
Annex 3. Projected enrollment in Grades 7-10 and Grades 11-12 in pub lic and private secondary schools, by division, 2010-2020 a/
2010 2016 2017 2020 2016 2017 2020 2010 2016 2017 2020 2016 2017 2020
actual actual
REGION : I - ILOCOS REGION 304,807 310,221 312,622 323,450 61,606 116,393 118,291 69,910 76,643 77,238 80,169 17,026 32,576 34,426
1 Ilocos Norte 24,026 24,995 25,185 26,856 5,565 11,027 10,940 6,369 8,177 8,166 7,586 1,603 3,142 4,686
2 Laoag City 6,354 7,208 7,493 8,491 1,471 2,851 3,132 1,937 1,498 1,481 1,472 379 723 678
3 Ilocos Sur 24,297 26,012 26,452 28,020 4,967 9,604 10,232 10,185 10,462 10,816 11,668 2,335 4,217 4,247
4 Candon City 3,151 3,335 3,381 3,574 715 1,360 1,350 935 998 961 871 230 440 407
5 Vigan City 5,571 6,291 6,552 7,532 1,187 2,374 2,669 1,241 983 989 1,006 250 472 441
6 La Union 37,856 38,789 38,962 39,380 7,602 14,405 14,732 8,431 9,467 9,231 8,947 2,077 3,996 3,757
7 San Fernando City 5,576 5,422 5,450 5,696 1,062 1,999 1,936 4,135 4,213 4,207 4,261 880 1,741 1,679
8 Pangasinan I, Lingayen 89,455 90,774 91,322 93,399 17,760 33,228 33,328 14,575 16,749 17,481 19,295 3,761 6,990 7,937
9 Pangasinan II, Binalonan 71,096 66,209 65,656 65,006 13,756 25,403 25,219 10,264 11,785 11,506 12,271 2,682 5,371 4,977
10 Alaminos City 6,369 6,850 7,070 7,763 1,540 2,882 2,943 1,620 1,696 1,690 1,872 414 787 708
11 Dagupan City 9,772 11,661 12,265 13,867 1,825 3,227 3,521 4,250 4,271 4,203 4,019 968 1,869 1,847
12 San Carlos City 10,985 11,468 11,255 11,263 2,083 4,026 3,873 4,135 4,890 5,127 5,665 1,063 2,108 2,413
13 Urdaneta City 10,299 11,207 11,579 12,601 2,075 4,005 4,417 1,833 1,455 1,381 1,237 386 720 649
REGION : II - CAGAYAN VALLEY 195,048 193,919 195,644 202,888 38,756 74,239 75,154 46,038 49,551 51,254 57,275 10,517 20,900 22,043
1 Batanes 1,569 1,457 1,535 1,803 335 644 687
2 Cagayan 59,223 58,690 58,604 58,839 11,427 22,062 22,090 14,193 13,641 14,114 17,469 3,115 6,429 6,144
3 Tuguegarao City 9,464 9,320 9,406 9,753 2,088 4,038 3,923 3,327 3,363 3,365 3,369 787 1,534 1,603
4 Isabela with Santiago 83,676 81,589 82,497 87,041 17,197 32,903 32,957 18,342 20,823 21,611 23,271 4,081 8,034 9,225
5 Cauayan City 6,799 7,066 7,122 7,194 1,280 2,477 2,662 2,538 3,075 3,256 3,647 655 1,291 1,4526 Santiago City
7 Nueva Vizcaya 22,799 24,392 24,962 26,539 4,298 8,138 8,736 6,401 6,999 7,125 7,483 1,490 2,887 2,827
8 Quirino 11,518 11,405 11,518 11,719 2,130 3,978 4,099 1,237 1,650 1,783 2,037 389 726 792
REGION : III - CENTRAL LUZON 583,896 650,350 659,606 695,512 118,689 223,831 234,541 185,649 189,569 190,385 198,600 45,073 88,787 90,649
1 Aurora 12,267 15,493 14,650 14,238 2,669 5,620 5,171 3,423 3,345 3,352 3,375 726 1,417 1,426
2 Bataan 37,322 38,642 39,206 41,365 7,337 13,729 13,796 8,285 9,976 10,300 10,618 2,128 3,961 4,546
3 Balanga City 6,504 6,404 6,850 8,436 1,249 2,315 2,407 1,889 1,805 1,773 1,651 417 787 829
4 Bulacan 117,816 133,192 136,787 149,053 23,070 42,669 46,244 47,730 49,073 49,048 49,518 11,966 23,546 23,703
5 Malolos City 11,726 14,112 14,461 15,579 2,790 5,483 5,870 5,505 5,255 5,152 5,408 1,473 2,665 2,204
6 San Jose del Monte City 26,107 31,262 32,019 34,199 5,366 10,110 11,072 12,709 12,533 12,258 12,513 2,941 6,552 6,532
7 Nueva Ecija w/ San Jose 95,319 103,264 104,640 109,244 18,821 35,771 37,323 20,098 20,113 20,177 21,212 4 ,437 8 ,439 8 ,620
8 Cabanatuan City 8,990 10,951 11,151 11,853 1,900 3,653 3,973 4,500 4,377 4,364 4,355 974 1,944 2,006
9 Gapan City 8,307 8,523 8,485 8,238 1,887 3,570 3,547 853 705 710 706 168 286 286
10 Munoz Science City 5,606 5,424 5,482 5,756 978 1,886 1,974 437 617 608 634 104 193 233
11 Pampanga 98,140 106,730 106,734 108,436 20,712 39,232 39,791 26,445 27,480 27,446 28,589 6 ,289 12,069 11,908
12 San Fernando City 16,827 20,754 21,795 24,987 4,019 7,591 8,475 4,436 4,392 4,513 4,877 1,067 2,073 2,156
13 Angeles City 19,399 22,678 23,022 24,324 3,631 6,734 7,078 10,796 10,373 10,027 9,923 2,452 4,848 4,680
14 Tarlac 63,742 69,770 70,710 74,756 13,362 25,272 26,335 18,779 18,674 19,092 19,283 5 ,075 10,662 12,244
15 Tarlac City 9,825 10,035 9,945 9,608 1,655 2,998 3,218 5,027 4,992 5,047 5,514 1,214 2,473 2,336
16 Zambales 29,671 35,576 36,085 37,989 5,977 11,161 12,026 9,874 11,825 12,665 17,158 2,585 4,914 5,193
17 Olongapo City 16,328 17,541 17,585 17,453 3,265 6,038 6,243 4,863 4,033 3,854 3,265 1,058 1,958 1,748
Public SS - JHS Public SS - JHS Privatec SS - JHS Privatec SS - JHS
7/27/2019 SHS Absorptive Capacity Study
http://slidepdf.com/reader/full/shs-absorptive-capacity-study 35/57
Page 32
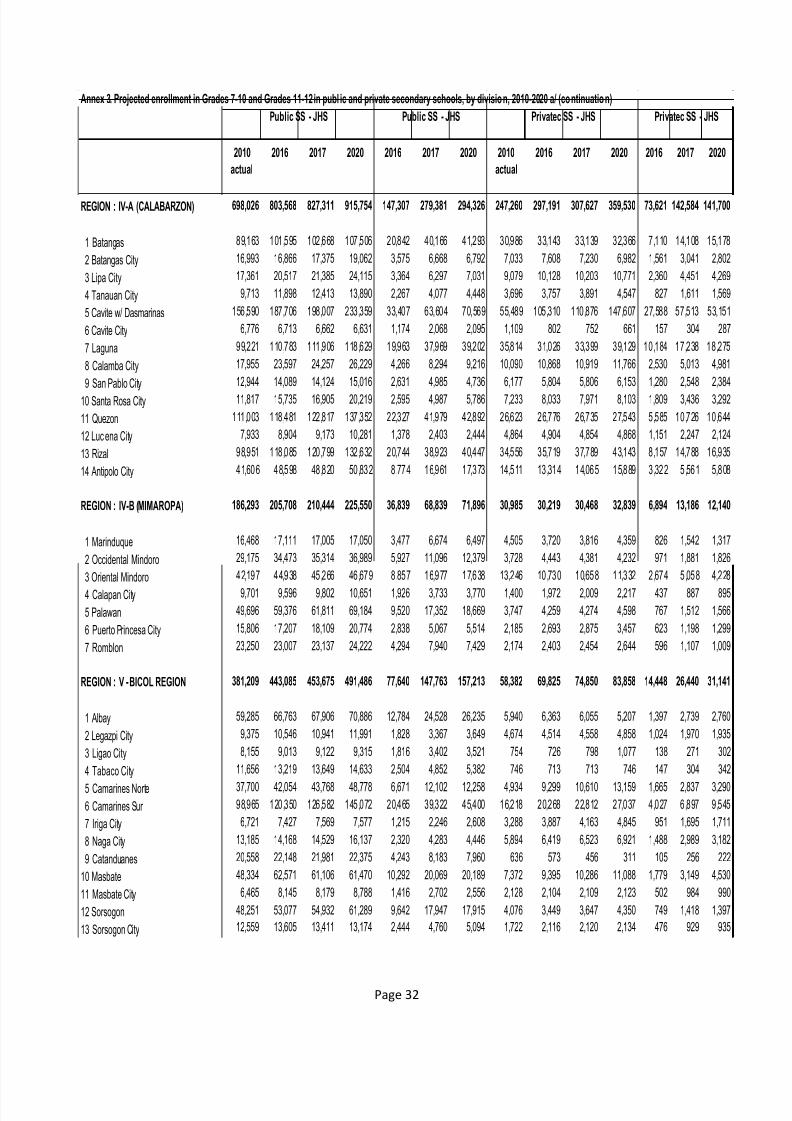
Annex 3. Projected enrollment in Grades 7-10 and Grades 11-12 in publ ic and private secondary schools, by division, 2010-2020 a/ (continuation)
2010 2016 2017 2020 2016 2017 2020 2010 2016 2017 2020 2016 2017 2020
actual actual
REGION : IV-A (CALABARZON) 698,026 803,568 827,311 915,754 147,307 279,381 294,326 247,260 297,191 307,627 359,530 73,621 142,584 141,700
1 Batangas 89,163 101,595 102,668 107,506 20,842 40,166 41,293 30,986 33,143 33,139 32,366 7,110 14,108 15,178
2 Batangas City 16,993 16,866 17,375 19,062 3,575 6,668 6,792 7,033 7,608 7,230 6,982 1,561 3,041 2,802
3 Lipa City 17,361 20,517 21,385 24,115 3,364 6,297 7,031 9,079 10,128 10,203 10,771 2,360 4,451 4,269
4 Tanauan City 9,713 11,898 12,413 13,890 2,267 4,077 4,448 3,696 3,757 3,891 4,547 827 1,611 1,569
5 Cavite w/ Dasmarinas 156,590 187,706 198,007 233,359 33,407 63,604 70,569 55,489 105,310 110,876 147,607 27,588 57,513 53,151
6 Cavite City 6,776 6,713 6,662 6,631 1,174 2,068 2,095 1,109 802 752 661 157 304 287
7 Laguna 99,221 110,783 111,906 118,629 19,963 37,969 39,202 35,814 31,026 33,399 39,129 10,184 17,238 18,275
8 Calamba City 17,955 23,597 24,257 26,229 4,266 8,294 9,216 10,090 10,868 10,919 11,766 2,530 5,013 4,981
9 San Pablo City 12,944 14,089 14,124 15,016 2,631 4,985 4,736 6,177 5,804 5,806 6,153 1,280 2,548 2,384
10 Santa Rosa City 11,817 15,735 16,905 20,219 2,595 4,987 5,786 7,233 8,033 7,971 8,103 1,809 3,436 3,292
11 Quezon 111,003 118,481 122,817 137,352 22,327 41,979 42,892 26,623 26,776 26,735 27,543 5,585 10,726 10,644
12 Luc ena City 7,933 8,904 9,173 10,281 1,378 2,403 2,444 4,864 4,904 4,854 4,868 1,151 2,247 2,124
13 Rizal 98,951 118,085 120,799 132,632 20,744 38,923 40,447 34,556 35,719 37,789 43,143 8,157 14,788 16,935
14 Antipolo City 41,606 48,598 48,820 50,832 8,774 16,961 17,373 14,511 13,314 14,065 15,889 3,322 5,561 5,808
REGION : IV-B (MIMAROPA) 186,293 205,708 210,444 225,550 36,839 68,839 71,896 30,985 30,219 30,468 32,839 6,894 13,186 12,140
1 Marinduque 16,468 17,111 17,005 17,050 3,477 6,674 6,497 4,505 3,720 3,816 4,359 826 1,542 1,317
2 Occidental Mindoro 29,175 34,473 35,314 36,989 5,927 11,096 12,379 3,728 4,443 4,381 4,232 971 1,881 1,8263 Oriental Mindoro 42,197 44,938 45,266 46,679 8,857 16,977 17,638 13,246 10,730 10,658 11,332 2,674 5,058 4,228
4 Calapan City 9,701 9,596 9,802 10,651 1,926 3,733 3,770 1,400 1,972 2,009 2,217 437 887 895
5 Palawan 49,696 59,376 61,811 69,184 9,520 17,352 18,669 3,747 4,259 4,274 4,598 767 1,512 1,566
6 Puerto Princesa City 15,806 17,207 18,109 20,774 2,838 5,067 5,514 2,185 2,693 2,875 3,457 623 1,198 1,299
7 Romblon 23,250 23,007 23,137 24,222 4,294 7,940 7,429 2,174 2,403 2,454 2,644 596 1,107 1,009
REGION : V - BICOL REGION 381,209 443,085 453,675 491,486 77,640 147,763 157,213 58,382 69,825 74,850 83,858 14,448 26,440 31,141
1 Albay 59,285 66,763 67,906 70,886 12,784 24,528 26,235 5,940 6,363 6,055 5,207 1,397 2,739 2,760
2 Legazpi City 9,375 10,546 10,941 11,991 1,828 3,367 3,649 4,674 4,514 4,558 4,858 1,024 1,970 1,935
3 Ligao City 8,155 9,013 9,122 9,315 1,816 3,402 3,521 754 726 798 1,077 138 271 3024 Tabaco City 11,656 13,219 13,649 14,633 2,504 4,852 5,382 746 713 713 746 147 304 342
5 Camarines Norte 37,700 42,054 43,768 48,778 6,671 12,102 12,258 4,934 9,299 10,610 13,159 1,665 2,837 3,290
6 Camarines Sur 98,965 120,350 126,582 145,072 20,465 39,322 45,400 16,218 20,268 22,812 27,037 4,027 6,897 9,545
7 Iriga City 6,721 7,427 7,569 7,577 1,215 2,246 2,608 3,288 3,887 4,163 4,845 951 1,695 1,711
8 Naga City 13,185 14,168 14,529 16,137 2,320 4,283 4,446 5,894 6,419 6,523 6,921 1,488 2,989 3,182
9 Catanduanes 20,558 22,148 21,981 22,375 4,243 8,183 7,960 636 573 456 311 105 256 222
10 Masbate 48,334 62,571 61,106 61,470 10,292 20,069 20,189 7,372 9,395 10,286 11,088 1,779 3,149 4,530
11 Masbate City 6,465 8,145 8,179 8,788 1,416 2,702 2,556 2,128 2,104 2,109 2,123 502 984 990
12 Sorsogon 48,251 53,077 54,932 61,289 9,642 17,947 17,915 4,076 3,449 3,647 4,350 749 1,418 1,397
13 Sorsogon City 12,559 13,605 13,411 13,174 2,444 4,760 5,094 1,722 2,116 2,120 2,134 476 929 935
Public SS - JHS Public SS - JHS Privatec SS - JHS Privatec SS - JHS
7/27/2019 SHS Absorptive Capacity Study
http://slidepdf.com/reader/full/shs-absorptive-capacity-study 36/57
Page 33
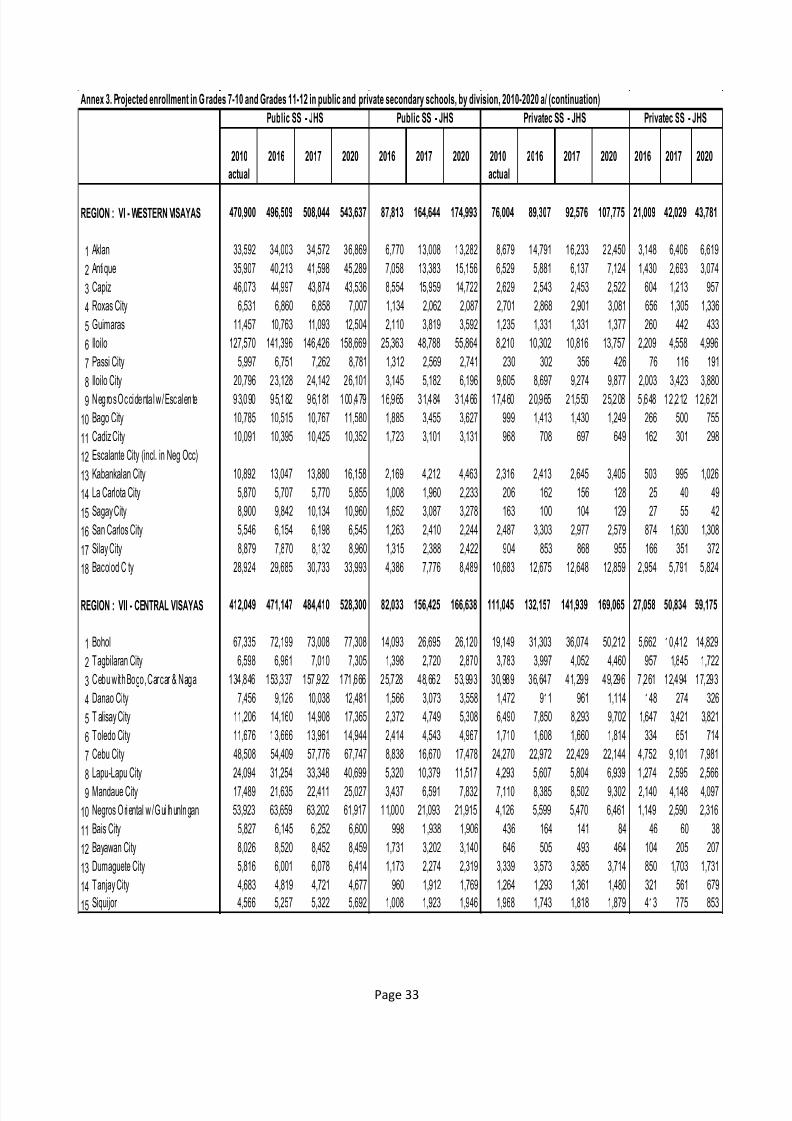
Annex 3. Projected enrollment in G rades 7-10 and Grades 11-12 in public and private secondary schools, by division, 2010-2020 a/ (continuation)
2010 2016 2017 2020 2016 2017 2020 2010 2016 2017 2020 2016 2017 2020
actual actual
REGION : VI - WESTERN VISAYAS 470,900 496,509 508,044 543,637 87,813 164,644 174,993 76,004 89,307 92,576 107,775 21,009 42,029 43,781
1 Aklan 33,592 34,003 34,572 36,869 6,770 13,008 13,282 8,679 14,791 16,233 22,450 3,148 6,406 6,619
2 Antique 35,907 40,213 41,598 45,289 7,058 13,383 15,156 6,529 5,881 6,137 7,124 1,430 2,693 3,074
3 Capiz 46,073 44,997 43,874 43,536 8,554 15,959 14,722 2,629 2,543 2,453 2,522 604 1,213 957
4 Roxas City 6,531 6,860 6,858 7,007 1,134 2,062 2,087 2,701 2,868 2,901 3,081 656 1,305 1,336
5 Guimaras 11,457 10,763 11,093 12,504 2,110 3,819 3,592 1,235 1,331 1,331 1,377 260 442 433
6 Iloilo 127,570 141,396 146,426 158,669 25,363 48,788 55,864 8,210 10,302 10,816 13,757 2,209 4,558 4,996
7 Passi City 5,997 6,751 7,262 8,781 1,312 2,569 2,741 230 302 356 426 76 116 191
8 Iloilo City 20,796 23,128 24,142 26,101 3,145 5,182 6,196 9,605 8,697 9,274 9,877 2,003 3,423 3,880
9 Negros Occidenta l w/ Escalen te 93,090 95,182 96,181 100,479 16,965 31,484 31,466 17,460 20,965 21,550 25,208 5 ,648 12 ,212 12,621
10 Bago City 10,785 10,515 10,767 11,580 1,885 3,455 3,627 999 1,413 1,430 1,249 266 500 755
11 Cadiz City 10,091 10,395 10,425 10,352 1,723 3,101 3,131 968 708 697 649 162 301 298
12 Escalante City (incl. in Neg Occ)
13 Kabankalan City 10,892 13,047 13,880 16,158 2,169 4,212 4,463 2,316 2,413 2,645 3,405 503 995 1,026
14 La Carlota City 5,870 5,707 5,770 5,855 1,008 1,960 2,233 206 162 156 128 25 40 49
15 Sagay City 8,900 9,842 10,134 10,960 1,652 3,087 3,278 163 100 104 129 27 55 42
16 San Carlos City 5,546 6,154 6,198 6,545 1,263 2,410 2,244 2,487 3,303 2,977 2,579 874 1,630 1,308
17 Silay City 8,879 7,870 8,132 8,960 1,315 2,388 2,422 904 853 868 955 166 351 372
18 Bacolod City 28,924 29,685 30,733 33,993 4,386 7,776 8,489 10,683 12,675 12,648 12,859 2,954 5,791 5,824
REGION : VII - CENTRAL VISAYAS 412,049 471,147 484,410 528,300 82,033 156,425 166,638 111,045 132,157 141,939 169,065 27,058 50,834 59,175
1 Bohol 67,335 72,199 73,008 77,308 14,093 26,695 26,120 19,149 31,303 36,074 50,212 5,662 10,412 14,829
2 Tagbilaran City 6,598 6,961 7,010 7,305 1,398 2,720 2,870 3,783 3,997 4,052 4,460 957 1,845 1,722
3 Cebu with Bogo, Carcar & Naga 134,846 153,337 157,922 171,666 25,728 48,662 53,993 30,989 36,647 41,299 49,296 7,261 12,494 17,293
4 Danao City 7,456 9,126 10,038 12,481 1,566 3,073 3,558 1,472 911 961 1,114 148 274 326
5 T alisay City 11,206 14,160 14,908 17,365 2,372 4,749 5,308 6,490 7,850 8,293 9,702 1,647 3,421 3,821
6 Toledo City 11,676 13,666 13,961 14,944 2,414 4,543 4,967 1,710 1,608 1,660 1,814 334 651 714
7 Cebu City 48,508 54,409 57,776 67,747 8,838 16,670 17,478 24,270 22,972 22,429 22,144 4,752 9,101 7,981
8 Lapu-Lapu City 24,094 31,254 33,348 40,699 5,320 10,379 11,517 4,293 5,607 5,804 6,939 1,274 2,595 2,566
9 Mandaue City 17,489 21,635 22,411 25,027 3,437 6,591 7,832 7,110 8,385 8,502 9,302 2,140 4,148 4,097
10 Negros Ori ental w / Gui lh unln gan 53,923 63,659 63,202 61,917 1 1,00 0 21,093 21,915 4,126 5,599 5,470 6,461 1,149 2,590 2,316
11 Bais City 5,827 6,145 6 ,252 6,600 998 1 ,938 1,906 436 164 141 84 46 60 38
12 Bayawan City 8,026 8,520 8,452 8,459 1,731 3,202 3,140 646 505 493 464 104 205 207
13 Dumaguete City 5,816 6,001 6,078 6,414 1,173 2,274 2,319 3,339 3,573 3,585 3,714 850 1,703 1,731
14 Tanjay City 4,683 4,819 4,721 4,677 960 1,912 1,769 1,264 1,293 1,361 1,480 321 561 679
15 Siquijor 4,566 5,257 5,322 5,692 1,008 1,923 1,946 1,968 1,743 1,818 1,879 413 775 853
Public SS - JHS Public SS - JHS Privatec SS - JHS Privatec SS - JHS
7/27/2019 SHS Absorptive Capacity Study
http://slidepdf.com/reader/full/shs-absorptive-capacity-study 37/57
Page 34
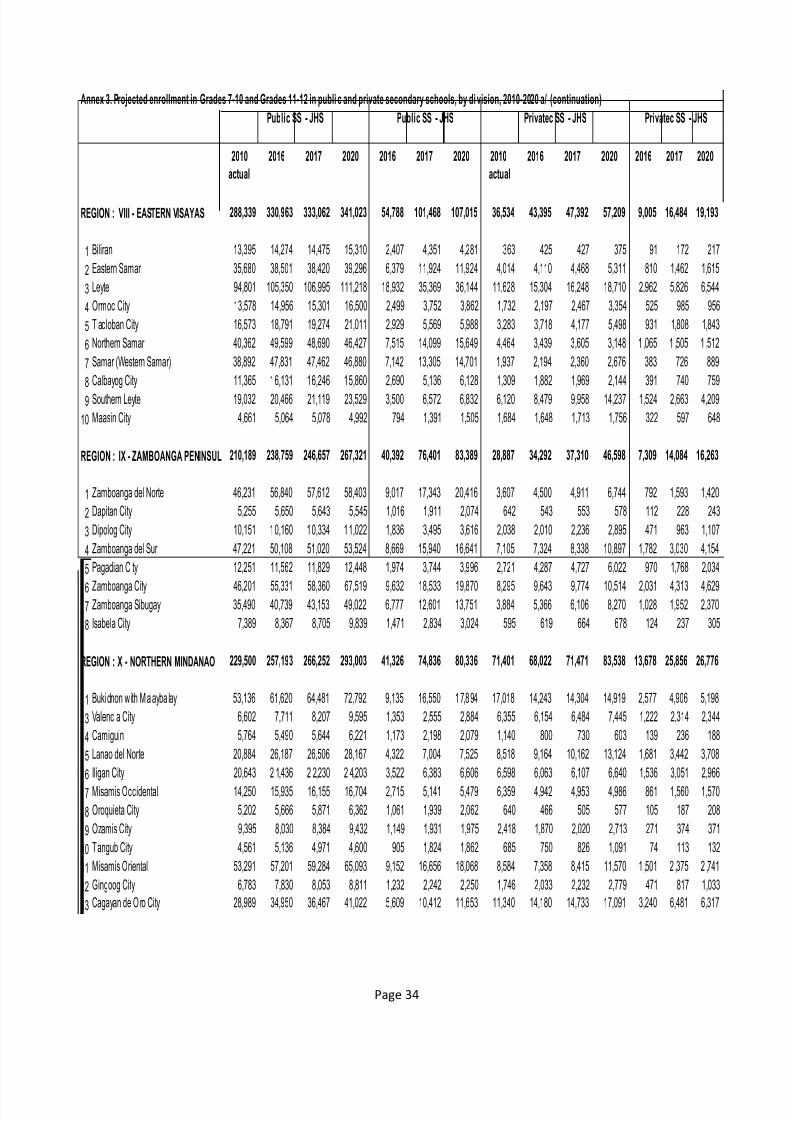
Annex 3. Projected enrollment in Grades 7-10 and Grades 11-12 in publi c and private secondary schools, by di vision, 2010-2020 a/ (continuation)
2010 2016 2017 2020 2016 2017 2020 2010 2016 2017 2020 2016 2017 2020
actual actual
REGION : VIII - EASTERN VISAYAS 288,339 330,963 333,062 341,023 54,788 101,468 107,015 36,534 43,395 47,392 57,209 9,005 16,484 19,193
1 Biliran 13,395 14,274 14,475 15,310 2,407 4,351 4,281 363 425 427 375 91 172 217
2 Eastern Samar 35,680 38,501 38,420 39,296 6,379 11,924 11,924 4,014 4,110 4,468 5,311 810 1,462 1,615
3 Leyte 94,801 105,350 106,995 111,218 18,932 35,369 36,144 11,628 15,304 16,248 18,710 2,962 5,826 6,544
4 Ormoc City 13,578 14,956 15,301 16,500 2,499 3,752 3,862 1,732 2,197 2,467 3,354 525 985 956
5 T acloban City 16,573 18,791 19,274 21,011 2,929 5,569 5,988 3,283 3,718 4,177 5,498 931 1,808 1,843
6 Northern Samar 40,362 49,599 48,690 46,427 7,515 14,099 15,649 4,464 3,439 3,605 3,148 1 ,065 1 ,505 1 ,512
7 Samar (Western Samar) 38,892 47,831 47,462 46,880 7,142 13,305 14,701 1,937 2,194 2,360 2,676 383 726 889
8 Calbayog City 11,365 16,131 16,246 15,860 2,690 5,136 6,128 1,309 1,882 1,969 2,144 391 740 759
9 Southern Leyte 19,032 20,466 21,119 23,529 3,500 6,572 6,832 6,120 8,479 9,958 14,237 1,524 2,663 4,209
10 Maasin City 4,661 5,064 5,078 4,992 794 1,391 1,505 1,684 1,648 1,713 1,756 322 597 648
REGION : IX - ZAMBOANGA PENINSUL 210,189 238,759 246,657 267,321 40,392 76,401 83,389 28,887 34,292 37,310 46,598 7,309 14,084 16,263
1 Zamboanga del Norte 46,231 56,840 57,612 58,403 9,017 17,343 20,416 3,607 4,500 4,911 6,744 792 1,593 1,420
2 Dapitan City 5,255 5,650 5,643 5,545 1,016 1,911 2,074 642 543 553 578 112 228 243
3 Dipolog City 10,151 10,160 10,334 11,022 1,836 3,495 3,616 2,038 2,010 2,236 2,895 471 963 1,107
4 Zamboanga del Sur 47,221 50,108 51,020 53,524 8,669 15,940 16,641 7,105 7,324 8,338 10,897 1,782 3,030 4,154
5 Pagadian City 12,251 11,562 11,829 12,448 1,974 3,744 3,996 2,721 4,287 4,727 6,022 970 1,768 2,034
6 Zamboanga City 46,201 55,331 58,360 67,519 9,632 18,533 19,870 8,295 9,643 9,774 10,514 2,031 4,313 4,629
7 Zamboanga Sibugay 35,490 40,739 43,153 49,022 6,777 12,601 13,751 3,884 5,366 6,106 8,270 1,028 1,952 2,370
8 Isabela City 7,389 8,367 8,705 9,839 1,471 2,834 3,024 595 619 664 678 124 237 305
REGION : X - NORTHERN MINDANAO 229,500 257,193 266,252 293,003 41,326 74,836 80,336 71,401 68,022 71,471 83,538 13,678 25,856 26,776
1 Buki dnon w ith Malayba lay 53,136 61,620 64,481 72,792 9,135 16,550 1 7,8 94 17,018 14,243 14,304 14,919 2,577 4,906 5,198
3 Valencia City 6,602 7,711 8,207 9,595 1,353 2,555 2,884 6,355 6,154 6,484 7,445 1,222 2,314 2,344
4 Camiguin 5,764 5,490 5,644 6,221 1,173 2,198 2,079 1,140 800 730 603 139 236 188
5 Lanao del Norte 20,884 26,187 26,506 28,167 4,322 7,004 7,525 8,518 9,164 10,162 13,124 1,681 3,442 3,708
6 Iligan City 20,643 2 1,436 2 2,230 2 4,203 3,522 6,383 6,606 6,598 6,063 6,107 6,640 1,536 3,051 2,966
7 Misamis Occidental 14,250 15,935 16,155 16,704 2,715 5,141 5,479 6,359 4,942 4,953 4,986 861 1,560 1,570
8 Oroquieta City 5,202 5,666 5,871 6,362 1,061 1,939 2,062 640 466 505 577 105 187 208
9 Ozamis City 9,395 8,030 8,384 9,432 1,149 1,931 1,975 2,418 1,870 2,020 2,713 271 374 371
10 Tangub City 4,561 5,136 4,971 4,600 905 1,824 1,862 685 750 826 1,091 74 113 132
11 Misamis Oriental 53,291 57,201 59,284 65,093 9,152 16,656 18,068 8,584 7,358 8,415 11,570 1 ,501 2 ,375 2 ,741
12 Gingoog City 6,783 7,830 8,053 8,811 1,232 2,242 2,250 1,746 2,033 2,232 2,779 471 817 1,033
13 Cagayan de O ro City 28,989 34,950 36,467 41,022 5,609 10,412 11,653 11,340 14,180 14,733 17,091 3,240 6,481 6,317
Public SS - JHS Public SS - JHS Privatec SS - JHS Privatec SS - JHS
7/27/2019 SHS Absorptive Capacity Study
http://slidepdf.com/reader/full/shs-absorptive-capacity-study 38/57
Page 35
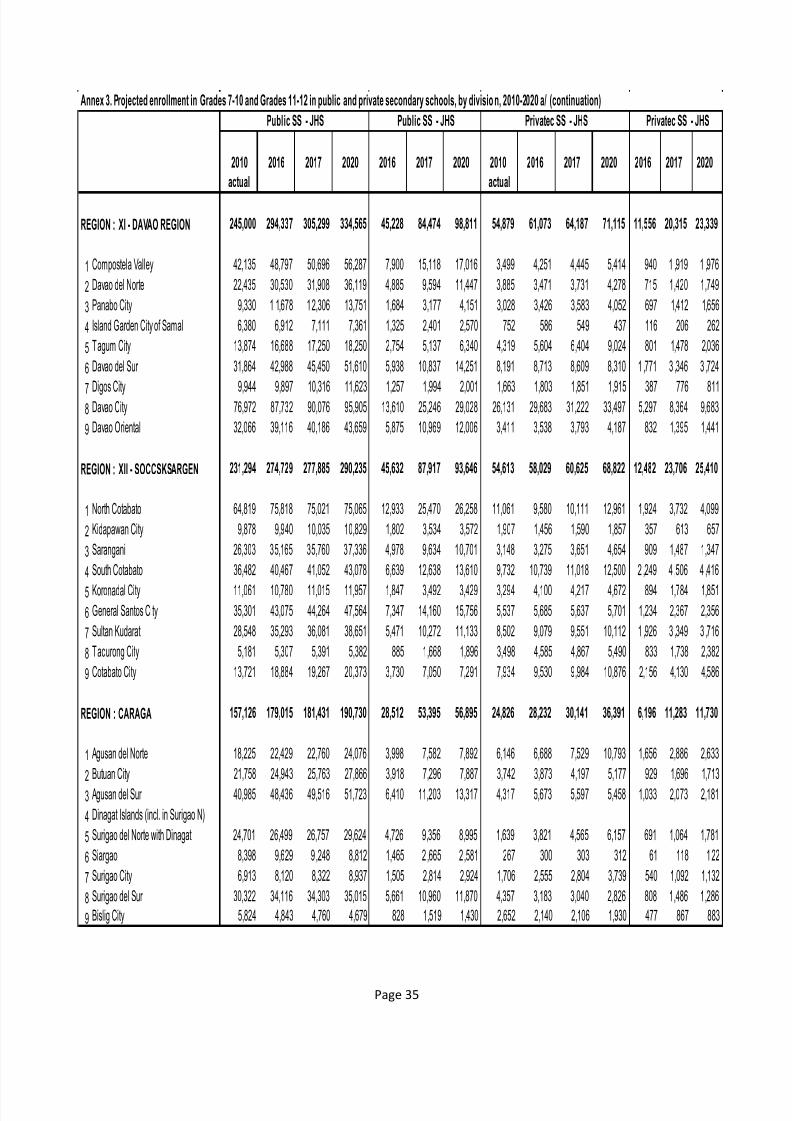
Annex 3. Projected enrollment in Grades 7-10 and Grades 11-12 in public and private secondary schools, by divisio n, 2010-2020 a/ (continuation)
2010 2016 2017 2020 2016 2017 2020 2010 2016 2017 2020 2016 2017 2020
actual actual
REGION : XI - DAVAO REGION 245,000 294,337 305,299 334,565 45,228 84,474 98,811 54,879 61,073 64,187 71,115 11,556 20,315 23,339
1 Compostela Valley 42,135 48,797 50,696 56,287 7,900 15,118 17,016 3,499 4,251 4,445 5,414 940 1 ,919 1 ,976
2 Davao del Norte 22,435 30,530 31,908 36,119 4,885 9,594 11,447 3,885 3,471 3,731 4,278 715 1,420 1,749
3 Panabo City 9,330 1 1,678 12,306 13,751 1,684 3,177 4,151 3,028 3,426 3,583 4,052 697 1,412 1,656
4 Island Garden City of Samal 6,380 6,912 7,111 7,361 1,325 2,401 2,570 752 586 549 437 116 206 262
5 Tagum City 13,874 16,688 17,250 18,250 2,754 5,137 6,340 4,319 5,604 6,404 9,024 801 1,478 2,036
6Davao del Sur 31,864 42,988 45,450 51,610 5,938 10,837 14,251 8,191 8,713 8,609 8,310 1 ,771 3 ,346 3 ,724
7 Digos City 9,944 9,897 10,316 11,623 1,257 1,994 2,001 1,663 1,803 1,851 1,915 387 776 811
8 Davao City 76,972 87,732 90,076 95,905 13,610 25,246 29,028 26,131 29,683 31,222 33,497 5,297 8,364 9,683
9 Davao Oriental 32,066 39,116 40,186 43,659 5,875 10,969 12,006 3,411 3,538 3,793 4,187 832 1,395 1,441
REGION : XII - SOCCSKSARGEN 231,294 274,729 277,885 290,235 45,632 87,917 93,646 54,613 58,029 60,625 68,822 12,482 23,706 25,410
1 North Cotabato 64,819 75,818 75,021 75,065 12,933 25,470 26,258 11,061 9,580 10,111 12,961 1,924 3,732 4,099
2 Kidapawan City 9,878 9,940 10,035 10,829 1,802 3,534 3,572 1,907 1,456 1,590 1,857 357 613 657
3 Sarangani 26,303 35,165 35,760 37,336 4,978 9,634 10,701 3,148 3,275 3,651 4,654 909 1,487 1,347
4 South Cotabato 36,482 40,467 41,052 43,078 6,639 12,638 13,610 9,732 10,739 11,018 12,500 2 ,249 4 ,506 4 ,416
5 Koronadal City 11,061 10,780 11,015 11,957 1,847 3,492 3,429 3,294 4,100 4,217 4,672 894 1,784 1,851
6 General Santos City 35,301 43,075 44,264 47,564 7,347 14,160 15,756 5,537 5,685 5,637 5,701 1,234 2,367 2,356
7 Sultan Kudarat 28,548 35,293 36,081 38,651 5,471 10,272 11,133 8,502 9,079 9,551 10,112 1 ,926 3 ,349 3 ,716
8 Tacurong City 5,181 5,307 5,391 5,382 885 1,668 1,896 3,498 4,585 4,867 5,490 833 1,738 2,382
9 Cotabato City 13,721 18,884 19,267 20,373 3,730 7,050 7,291 7,934 9,530 9,984 10,876 2,156 4,130 4,586
REGION : CARAGA 157,126 179,015 181,431 190,730 28,512 53,395 56,895 24,826 28,232 30,141 36,391 6,196 11,283 11,730
1 Agusan del Norte 18,225 22,429 22,760 24,076 3,998 7,582 7,892 6,146 6,688 7,529 10,793 1,656 2,886 2,6332 Butuan City 21,758 24,943 25,763 27,866 3,918 7,296 7,887 3,742 3,873 4,197 5,177 929 1,696 1,713
3 Agusan del Sur 40,985 48,436 49,516 51,723 6,410 11,203 13,317 4,317 5,673 5,597 5,458 1,033 2,073 2,181
4 Dinagat Islands (incl. in Surigao N)
5 Surigao del Norte with Dinagat 24,701 26,499 26,757 29,624 4,726 9,356 8,995 1,639 3,821 4,565 6,157 691 1,064 1,781
6 Siargao 8,398 9,629 9 ,248 8,812 1,465 2 ,665 2 ,581 267 300 303 312 61 118 1 22
7 Surigao City 6,913 8,120 8,322 8,937 1,505 2,814 2,924 1,706 2,555 2,804 3,739 540 1,092 1,132
8 Surigao del Sur 30,322 34,116 34,303 35,015 5,661 10,960 11,870 4,357 3,183 3,040 2,826 808 1,486 1,286
9 Bislig City 5,824 4,843 4,760 4,679 828 1,519 1,430 2,652 2,140 2,106 1,930 477 867 883
Public SS - JHS Public SS - JHS Privatec SS - JHS Privatec SS - JHS
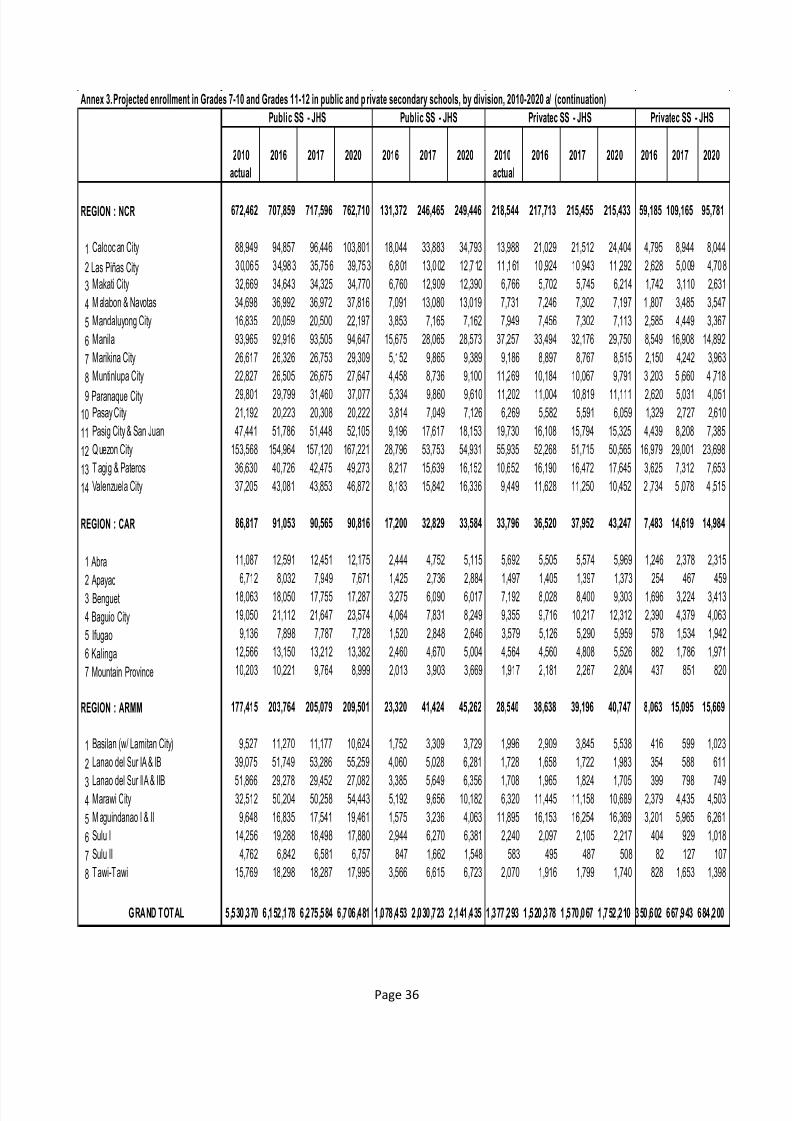
7/27/2019 SHS Absorptive Capacity Study
http://slidepdf.com/reader/full/shs-absorptive-capacity-study 39/57
Page 36
Annex 3. Projected enrollment in Grades 7-10 and Grades 11-12 in public and p rivate secondary schools, by division, 2010-2020 a/ (continuation)
2010 2016 2017 2020 2016 2017 2020 2010 2016 2017 2020 2016 2017 2020
actual actual
REGION : NCR 672,462 707,859 717,596 762,710 131,372 246,465 249,446 218,544 217,713 215,455 215,433 59,185 109,165 95,781
1 Calooc an City 88,949 94,857 96,446 103,801 18,044 33,883 34,793 13,988 21,029 21,512 24,404 4,795 8,944 8,044
2 Las Piñas City 3 0,06 5 3 4,98 3 35,75 6 39,75 3 6,8 01 13,0 02 12 ,7 12 11 ,1 61 10 ,924 10 ,943 11 ,292 2 ,628 5,0 09 4,70 8
3 Makati City 32,669 34,643 34,325 34,770 6,760 12,909 12,390 6,766 5,702 5,745 6,214 1,742 3,110 2,631
4 M alabon & Navotas 34,698 36,992 36,972 37,816 7,091 13,080 13,019 7,731 7,246 7,302 7,197 1 ,807 3,485 3,547
5 Mandaluyong City 16,835 20,059 20,500 22,197 3,853 7,165 7,162 7,949 7,456 7,302 7,113 2,585 4,449 3,367
6 Manila 93,965 92,916 93,505 94,647 15,675 28,065 28,573 37,257 33,494 32,176 29,750 8,549 16,908 14,892
7 Marikina City 26,617 26,326 26,753 29,309 5,152 9,865 9,389 9,186 8,897 8,767 8,515 2,150 4,242 3,963
8 Muntinlupa City 22,827 26,505 26,675 27,647 4,458 8,736 9,100 11,269 10,184 10,067 9,791 3 ,203 5 ,660 4 ,7189 Paranaque City 29,801 29,799 31,460 37,077 5,334 9,860 9,610 11,202 11,004 10,819 11,111 2,620 5,031 4,051
10 Pasay City 21,192 20,223 20,308 20,222 3,814 7,049 7,126 6,269 5,582 5,591 6,059 1,329 2,727 2,610
11 Pasig City & San Juan 47,441 51,786 51,448 52,105 9,196 17,617 18,153 19,730 16,108 15,794 15,325 4,439 8,208 7,385
12 Q uezon City 153,568 154,964 157,120 167,221 28,796 53,753 54,931 55,935 52,268 51,715 50,565 16,979 29,001 23,698
13 T agig & Pateros 36,630 40,726 42,475 49,273 8,217 15,639 16,152 10,652 16,190 16,472 17,645 3,625 7,312 7,653
14 Valenzuela City 37,205 43,081 43,853 46,872 8,183 15,842 16,336 9,449 11,628 11,250 10,452 2 ,734 5 ,078 4 ,515
REGION : CAR 86,817 91,053 90,565 90,816 17,200 32,829 33,584 33,796 36,520 37,952 43,247 7,483 14,619 14,984
1 Abra 11,087 12,591 12,451 12,175 2,444 4,752 5,115 5,692 5,505 5,574 5,969 1,246 2,378 2,3152 Apayao 6,712 8,032 7,949 7,671 1,425 2,736 2,884 1,497 1,405 1,397 1,373 254 467 459
3 Benguet 18,063 18,050 17,755 17,287 3,275 6,090 6,017 7,192 8,028 8,400 9,303 1,696 3,224 3,413
4 Baguio City 19,050 21,112 21,647 23,574 4,064 7,831 8,249 9,355 9,716 10,217 12,312 2,390 4,379 4,063
5 Ifugao 9,136 7,898 7,787 7,728 1,520 2,848 2,646 3,579 5,126 5,290 5,959 578 1,534 1,942
6 Kalinga 12,566 13,150 13,212 13,382 2,460 4,670 5,004 4,564 4,560 4,808 5,526 882 1,786 1,971
7 Mountain Province 10,203 10,221 9,764 8,999 2,013 3,903 3,669 1,917 2,181 2,267 2,804 437 851 820
REGION : ARMM 177,415 203,764 205,079 209,501 23,320 41,424 45,262 28,540 38,638 39,196 40,747 8,063 15,095 15,669
1Basilan (w/ Lamitan City) 9,527 11,270 11,177 10,624 1,752 3,309 3,729 1,996 2,909 3,845 5,538 416 599 1,023
2 Lanao del Sur IA & IB 39,075 51,749 53,286 55,259 4,060 5,028 6,281 1,728 1,658 1,722 1,983 354 588 611
3 Lanao del Sur IIA & IIB 51,866 29,278 29,452 27,082 3,385 5,649 6,356 1,708 1,965 1,824 1,705 399 798 749
4 Marawi City 32,512 50,204 50,258 54,443 5,192 9,656 10,182 6,320 11,445 11,158 10,689 2,379 4,435 4,503
5 M aguindanao I & II 9,648 16,835 17,541 19,461 1,575 3,236 4,063 11,895 16,153 16,254 16,369 3,201 5,965 6,261
6 Sulu I 14,256 19,288 18,498 17,880 2,944 6,270 6,381 2,240 2,097 2,105 2,217 404 929 1,018
7 Sulu II 4,762 6,842 6,581 6,757 847 1,662 1,548 583 495 487 508 82 127 107
8 Tawi-Tawi 15,769 18,298 18,287 17,995 3,566 6,615 6,723 2,070 1,916 1,799 1,740 828 1,653 1,398
GRAND TOTAL 5,530,370 6,152,178 6,275,584 6,706,481 1,078,453 2,030,723 2,141,435 1,377,293 1,520,378 1,570,067 1,752,210 350,602 667,943 684,200
Public SS - JHS Public SS - JHS Privatec SS - JHS Privatec SS - JHS
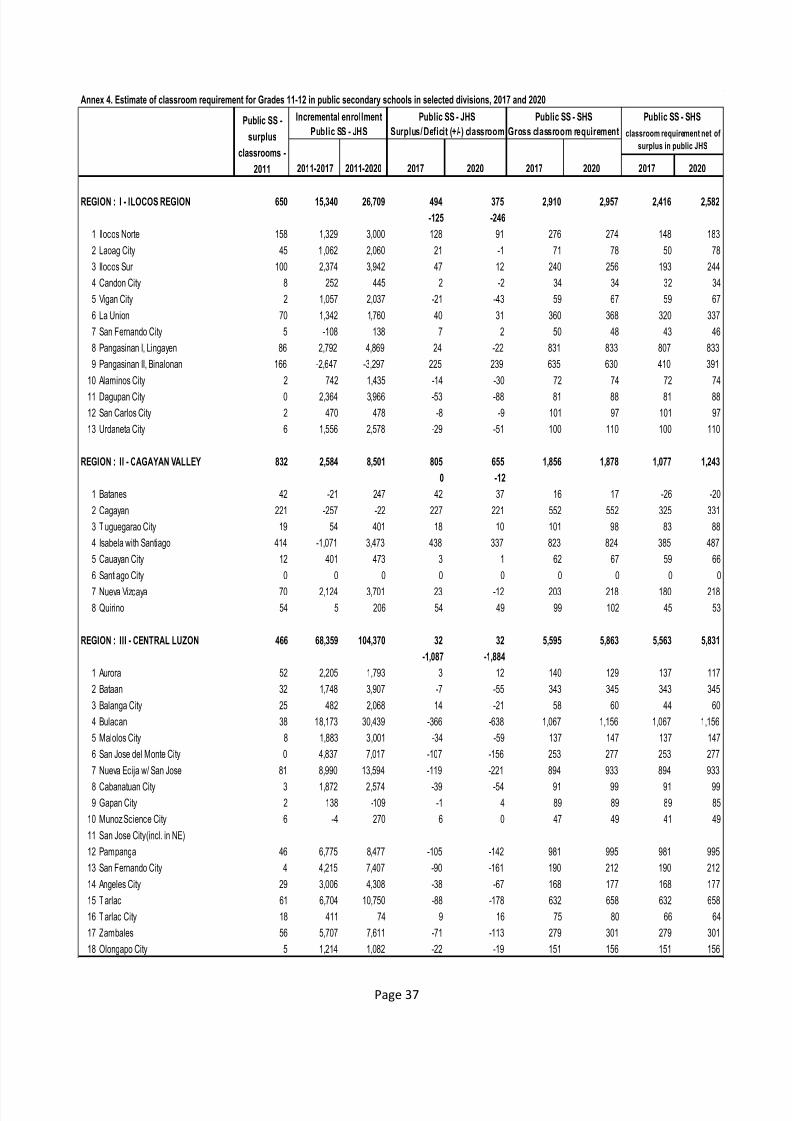
7/27/2019 SHS Absorptive Capacity Study
http://slidepdf.com/reader/full/shs-absorptive-capacity-study 40/57
Page 37
Annex 4. Estimate of classroom requirement for Grades 11-12 in public secondary schools in selected divisions, 2017 and 2020
2011-2017 2011-2020 2017 2020 2017 2020 2017 2020
REGION : I - ILOCOS REGION 650 15,340 26,709 494 375 2,910 2,957 2,416 2,582
-125 -246
1 Ilocos Norte 158 1,329 3,000 128 91 276 274 148 183
2 Laoag City 45 1 ,062 2,060 21 -1 71 78 50 78
3 Ilocos Sur 100 2,374 3,942 47 12 240 256 193 244
4 Candon City 8 252 445 2 -2 34 34 32 34
5 Vigan City 2 1,057 2,037 -21 -43 59 67 59 67
6 La Union 70 1,342 1,760 40 31 360 368 320 337
7 San Fernando City 5 -108 138 7 2 50 48 43 46
8 Pangasinan I, Lingayen 86 2,792 4,869 24 -22 831 833 807 833
9 Pangasinan II, Binalonan 166 -2,647 -3,297 225 239 635 630 410 391
10 Alaminos City 2 742 1,435 -14 -30 72 74 72 74
11 Dagupan City 0 2,364 3,966 -53 -88 81 88 81 88
12 San Carlos City 2 470 478 -8 -9 101 97 101 97
13 Urdaneta City 6 1,556 2,578 -29 -51 100 110 100 110
REGION : II - CAGAYAN VALLEY 832 2,584 8,501 805 655 1,856 1,878 1,077 1,243
0 -12
1 Batanes 42 -21 247 42 37 16 17 -26 -20
2 Cagayan 221 -257 -22 227 221 552 552 325 331
3 Tuguegarao City 19 54 401 18 10 101 98 83 88
4 Isabela with Santiago 414 -1,071 3,473 438 337 823 824 385 487
5 Cauayan City 12 401 473 3 1 62 67 59 666 Santiago City 0 0 0 0 0 0 0 0 0
7 Nueva Vizcaya 70 2,124 3,701 23 -12 203 218 180 218
8 Quirino 54 5 206 54 49 99 102 45 53
REGION : III - CENTRAL LUZON 466 68,359 104,370 32 32 5,595 5,863 5,563 5,831
-1,087 -1,884
1 Aurora 52 2,205 1,793 3 12 140 129 137 117
2 Bataan 32 1,748 3,907 -7 -55 343 345 343 345
3 Balanga City 25 482 2,068 14 -21 58 60 44 60
4 Bulacan 38 18,173 30,439 -366 -638 1,067 1,156 1,067 1,156
5 Malolos City 8 1,883 3,001 -34 -59 137 147 137 147
6 San Jose del Monte City 0 4,837 7,017 -107 -156 253 277 253 277
7 Nueva Ecija w/ San Jose 81 8,990 13,594 -119 -221 894 933 894 933
8 Cabanatuan City 3 1,872 2,574 -39 -54 91 99 91 99
9 Gapan City 2 138 -109 -1 4 89 89 89 85
10 Munoz Science City 6 -4 270 6 0 47 49 41 49
11 San Jose City (incl. in NE)
12 Pampanga 46 6,775 8,477 -105 -142 981 995 981 995
13 San Fernando City 4 4,215 7,407 -90 -161 190 212 190 212
14 Angeles City 29 3,006 4,308 -38 -67 168 177 168 177
15 Tarlac 61 6,704 10,750 -88 -178 632 658 632 658
16 Tarlac City 18 411 74 9 16 75 80 66 64
17 Zambales 56 5,707 7,611 -71 -113 279 301 279 301
18 Olongapo City 5 1,214 1,082 -22 -19 151 156 151 156
Public SS -
surplus
classrooms -
2011
Incremental enrollment Public SS - JHS Public SS - SHS Public SS - SHS
Public SS - JHS Surplus/ Deficit (+/-) classroom Gross classroom requirement classroom requirement net of
surplus in public JHS
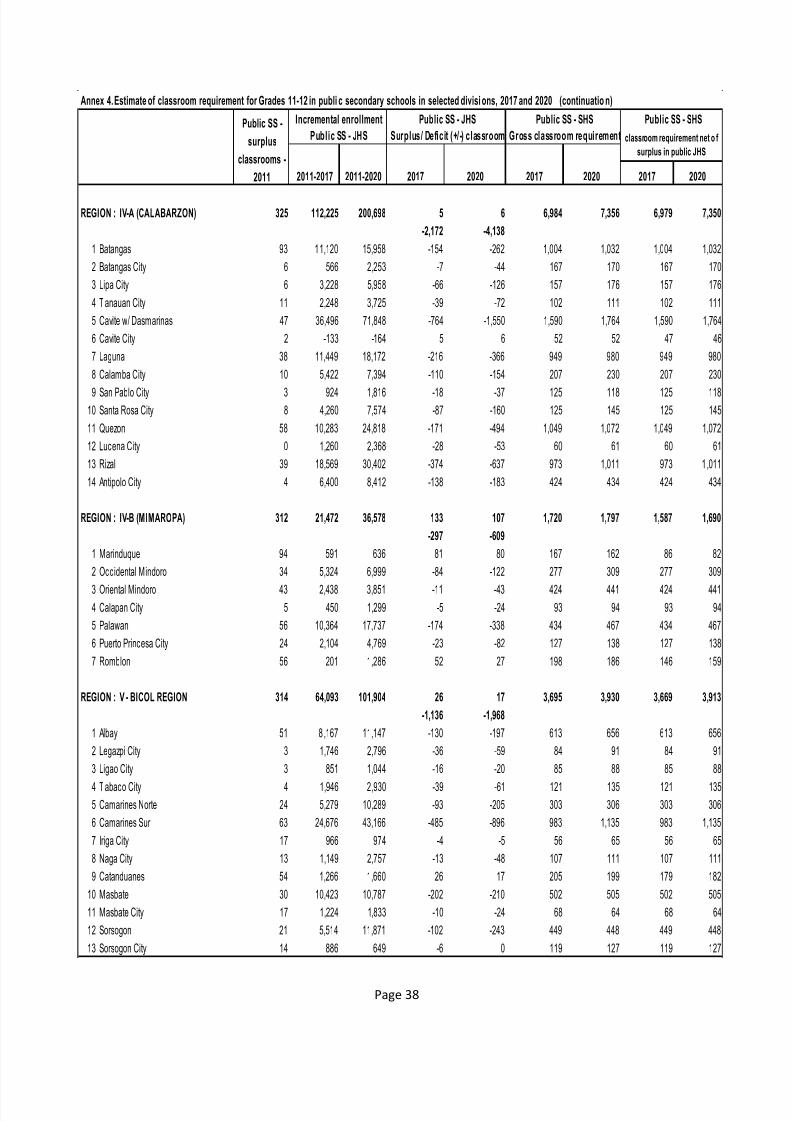
7/27/2019 SHS Absorptive Capacity Study
http://slidepdf.com/reader/full/shs-absorptive-capacity-study 41/57
Page 38
Annex 4. Estimate of classroom requirement for Grades 11-12 in publi c secondary schools in selected divisi ons, 2017 and 2020 (continuatio n)
2011-2017 2011-2020 2017 2020 2017 2020 2017 2020
REGION : IV-A (CALABARZON) 325 112,225 200,698 5 6 6,984 7,356 6,979 7,350
-2,172 -4,138
1 Batangas 93 11,120 15,958 -154 -262 1,004 1,032 1,004 1,032
2 Batangas City 6 566 2,253 -7 -44 167 170 167 170
3 Lipa City 6 3,228 5,958 -66 -126 157 176 157 176
4 Tanauan City 11 2,248 3,725 -39 -72 102 111 102 111
5 Cavite w/ Dasmarinas 47 36,496 71,848 -764 -1,550 1,590 1,764 1,590 1,764
6 Cavite City 2 -133 -164 5 6 52 52 47 46
7 Laguna 38 11,449 18,172 -216 -366 949 980 949 980
8 Calamba City 10 5,422 7,394 -110 -154 207 230 207 2309 San Pablo City 3 924 1,816 -18 -37 125 118 125 118
10 Santa Rosa City 8 4,260 7,574 -87 -160 125 145 125 145
11 Quezon 58 10,283 24,818 -171 -494 1,049 1,072 1,049 1,072
12 Lucena City 0 1,260 2,368 -28 -53 60 61 60 61
13 Rizal 39 18,569 30,402 -374 -637 973 1,011 973 1 ,011
14 Antipolo City 4 6,400 8,412 -138 -183 424 434 424 434
REGION : IV-B (MIMAROPA) 312 21,472 36,578 133 107 1,720 1,797 1,587 1,690
-297 -609
1 Marinduque 94 591 636 81 80 167 162 86 82
2 Occidental Mindoro 34 5,324 6,999 -84 -122 277 309 277 309
3 Oriental Mindoro 43 2,438 3,851 -11 -43 424 441 424 441
4 Calapan City 5 450 1,299 -5 -24 93 94 93 94
5 Palawan 56 10,364 17,737 -174 -338 434 467 434 467
6 Puerto Princesa City 24 2,104 4,769 -23 -82 127 138 127 138
7 Romblon 56 201 1,286 52 27 198 186 146 159
REGION : V - BICOL REGION 314 64,093 101,904 26 17 3,695 3,930 3,669 3,913
-1,136 -1,968
1 Albay 51 8 ,167 11,147 -130 -197 613 656 613 656
2 Legazpi City 3 1,746 2,796 -36 -59 84 91 84 913 Ligao City 3 851 1,044 -16 -20 85 88 85 88
4 Tabaco City 4 1,946 2,930 -39 -61 121 135 121 135
5 Camarines Norte 24 5,279 10,289 -93 -205 303 306 303 306
6 Camarines Sur 63 24,676 43,166 -485 -896 983 1,135 983 1,135
7 Iriga City 17 966 974 -4 -5 56 65 56 65
8 Naga City 13 1,149 2,757 -13 -48 107 111 107 111
9 Catanduanes 54 1,266 1,660 26 17 205 199 179 182
10 Masbate 30 10,423 10,787 -202 -210 502 505 502 505
11 Masbate City 17 1,224 1,833 -10 -24 68 64 68 64
12 Sorsogon 21 5,514 11,871 -102 -243 449 448 449 448
13 Sorsogon City 14 886 649 -6 0 119 127 119 127
Public SS -
surplus
classrooms -
2011
Incremental enrollment Public SS - JHS Public SS - SHS Public SS - SHS
Public SS - JHS Surplus/ Deficit (+/-) classroom Gross classroom requirement classroom requirement net o f
surplus in public JHS
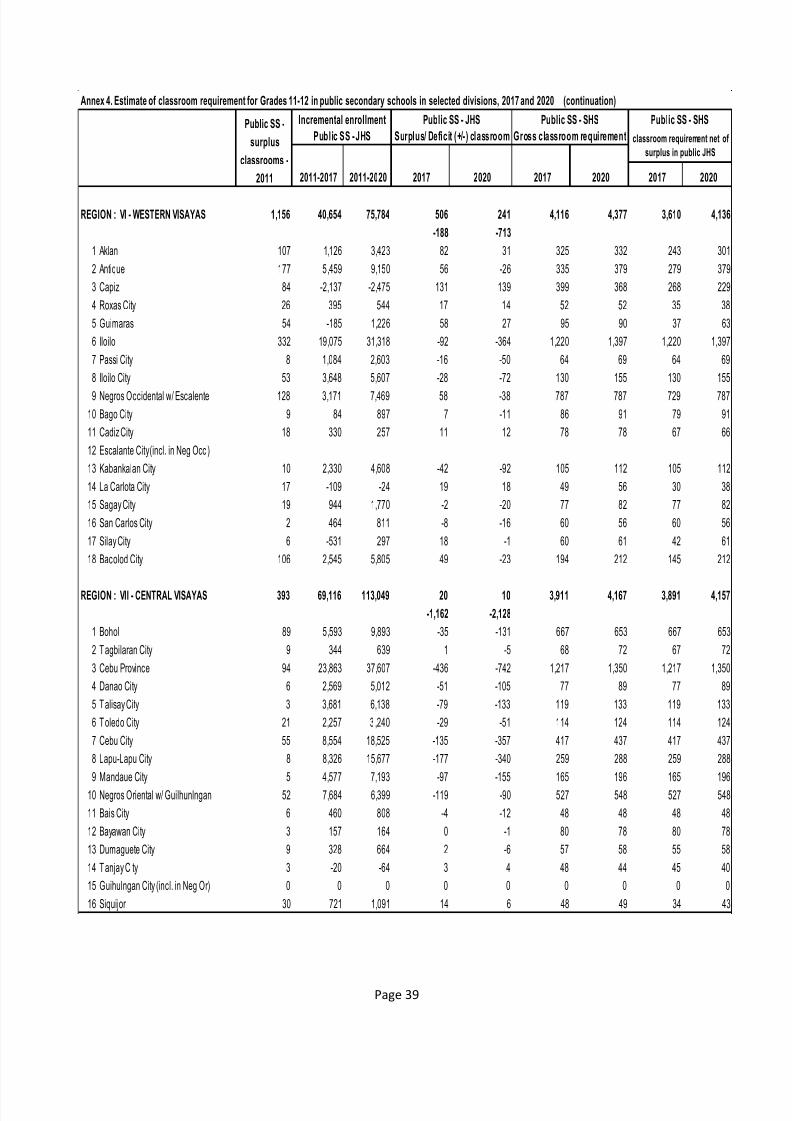
7/27/2019 SHS Absorptive Capacity Study
http://slidepdf.com/reader/full/shs-absorptive-capacity-study 42/57
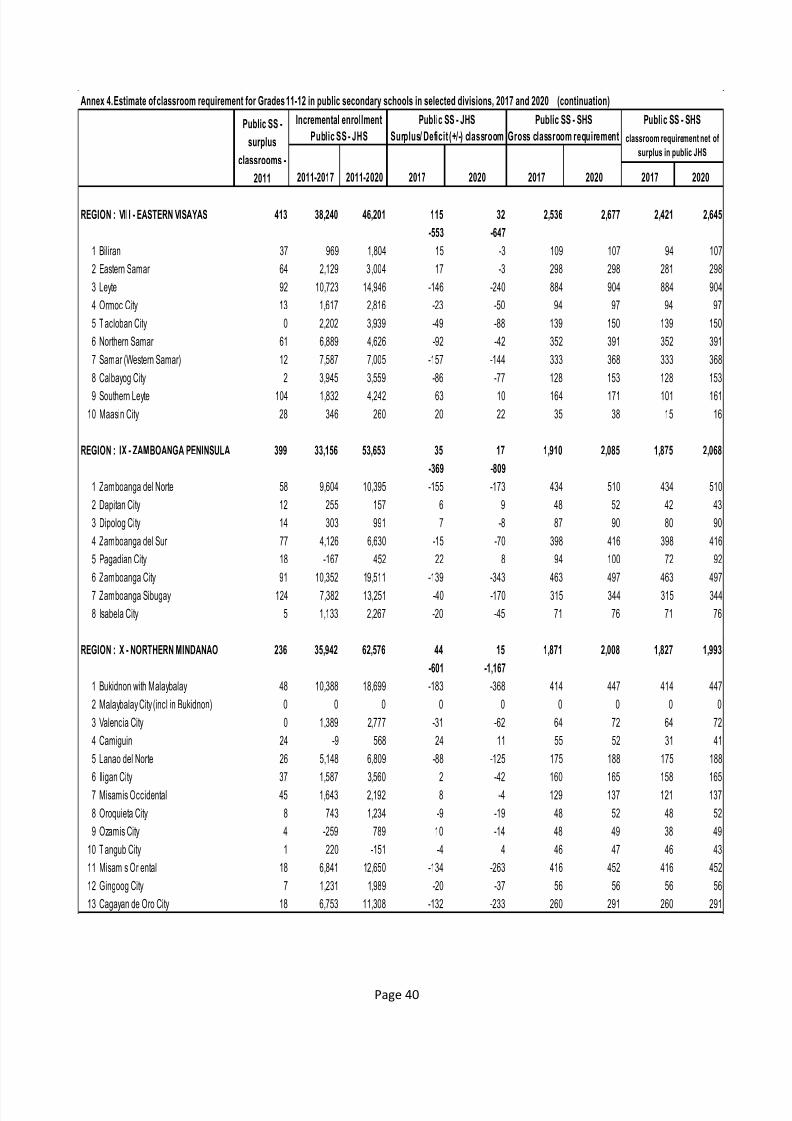
7/27/2019 SHS Absorptive Capacity Study
http://slidepdf.com/reader/full/shs-absorptive-capacity-study 43/57
Page 40
Annex 4. Estimate of classroom requirement for Grades 11-12 in public secondary schools in selected divisions, 2017 and 2020 (continuation)
2011-2017 2011-2020 2017 2020 2017 2020 2017 2020
REGION : VIII - EASTERN VISAYAS 413 38,240 46,201 115 32 2,536 2,677 2,421 2,645
-553 -647
1 Biliran 37 969 1,804 15 -3 109 107 94 107
2 Eastern Samar 64 2,129 3,004 17 -3 298 298 281 298
3 Leyte 92 10,723 14,946 -146 -240 884 904 884 904
4 Ormoc City 13 1,617 2,816 -23 -50 94 97 94 97
5 Tacloban City 0 2,202 3,939 -49 -88 139 150 139 150
6 Northern Samar 61 6,889 4,626 -92 -42 352 391 352 391
7 Samar (Western Samar) 12 7,587 7,005 -157 -144 333 368 333 368
8 Calbayog City 2 3,945 3,559 -86 -77 128 153 128 153
9 Southern Leyte 104 1,832 4,242 63 10 164 171 101 161
10 Maasin City 28 346 260 20 22 35 38 15 16
REGION : IX - ZAMBOANGA PENINSULA 399 33,156 53,653 35 17 1,910 2,085 1,875 2,068
-369 -809
1 Zamboanga del Norte 58 9,604 10,395 -155 -173 434 510 434 510
2 Dapitan City 12 255 157 6 9 48 52 42 43
3 Dipolog City 14 303 991 7 -8 87 90 80 90
4 Zamboanga del Sur 77 4,126 6,630 -15 -70 398 416 398 416
5 Pagadian City 18 -167 452 22 8 94 100 72 926 Zamboanga City 91 10,352 19,511 -139 -343 463 497 463 497
7 Zamboanga Sibugay 124 7,382 13,251 -40 -170 315 344 315 344
8 Isabela City 5 1,133 2,267 -20 -45 71 76 71 76
REGION : X - NORTHERN MINDANAO 236 35,942 62,576 44 15 1,871 2,008 1,827 1,993
-601 -1,167
1 Bukidnon with Malaybalay 48 10,388 18,699 -183 -368 414 447 414 447
2 Malaybalay City (incl in Bukidnon) 0 0 0 0 0 0 0 0 0
3 Valencia City 0 1,389 2,777 -31 -62 64 72 64 72
4 Camiguin 24 -9 568 24 11 55 52 31 41
5 Lanao del Norte 26 5,148 6,809 -88 -125 175 188 175 188
6 Iligan City 37 1,587 3,560 2 -42 160 165 158 165
7 Misamis Occidental 45 1,643 2,192 8 -4 129 137 121 137
8 Oroquieta City 8 743 1,234 -9 -19 48 52 48 52
9 Ozamis City 4 -259 789 10 -14 48 49 38 49
10 Tangub City 1 220 -151 -4 4 46 47 46 43
11 Misamis Oriental 18 6,841 12,650 -134 -263 416 452 416 452
12 Gingoog City 7 1,231 1,989 -20 -37 56 56 56 56
13 Cagayan de Oro City 18 6,753 11,308 -132 -233 260 291 260 291
Public SS -
surplus
classrooms -
2011
Incremental enrollment Public SS - JHS Public SS - SHS Public SS - SHS
Public SS - JHS Surplus/ Deficit (+/-) classroom Gross classroom requirement classroom requirement net of
surplus in public JHS
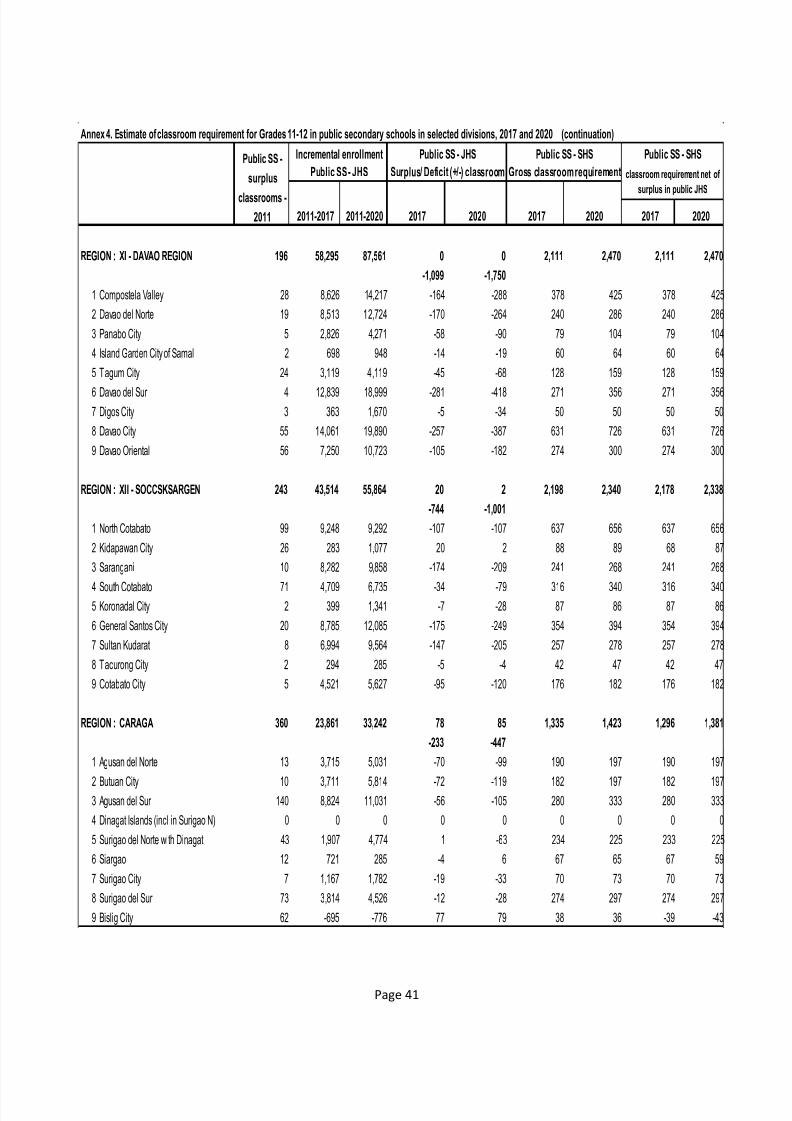
7/27/2019 SHS Absorptive Capacity Study
http://slidepdf.com/reader/full/shs-absorptive-capacity-study 44/57
Page 41
Annex 4. Estimate of classroom requirement for Grades 11-12 in public secondary schools in selected divisions, 2017 and 2020 (continuation)
2011-2017 2011-2020 2017 2020 2017 2020 2017 2020
REGION : XI - DAVAO REGION 196 58,295 87,561 0 0 2,111 2,470 2,111 2,470
-1,099 -1,750
1 Compostela Valley 28 8,626 14,217 -164 -288 378 425 378 425
2 Davao del Norte 19 8,513 12,724 -170 -264 240 286 240 286
3 Panabo City 5 2,826 4,271 -58 -90 79 104 79 104
4 Island Garden City of Samal 2 698 948 -14 -19 60 64 60 64
5 Tagum City 24 3,119 4,119 -45 -68 128 159 128 1596 Davao del Sur 4 12,839 18,999 -281 -418 271 356 271 356
7 Digos City 3 363 1,670 -5 -34 50 50 50 50
8 Davao City 55 14,061 19,890 -257 -387 631 726 631 726
9 Davao Oriental 56 7,250 10,723 -105 -182 274 300 274 300
REGION : XII - SOCCSKSARGEN 243 43,514 55,864 20 2 2,198 2,340 2,178 2,338
-744 -1,001
1 North Cotabato 99 9,248 9,292 -107 -107 637 656 637 656
2 Kidapawan City 26 283 1,077 20 2 88 89 68 87
3 Sarangani 10 8,282 9,858 -174 -209 241 268 241 268
4 South Cotabato 71 4,709 6,735 -34 -79 316 340 316 340
5 Koronadal City 2 399 1,341 -7 -28 87 86 87 86
6 General Santos City 20 8,785 12,085 -175 -249 354 394 354 394
7 Sultan Kudarat 8 6,994 9,564 -147 -205 257 278 257 278
8 Tacurong City 2 294 285 -5 -4 42 47 42 47
9 Cotabato City 5 4,521 5,627 -95 -120 176 182 176 182
REGION : CARAGA 360 23,861 33,242 78 85 1,335 1,423 1,296 1,381
-233 -447
1 Agusan del Norte 13 3,715 5,031 -70 -99 190 197 190 197
2 Butuan City 10 3,711 5,814 -72 -119 182 197 182 197
3 Agusan del Sur 140 8,824 11,031 -56 -105 280 333 280 333
4 Dinagat Islands (incl in Surigao N) 0 0 0 0 0 0 0 0 0
5 Surigao del Norte with Dinagat 43 1,907 4,774 1 -63 234 225 233 225
6 Siargao 12 721 285 -4 6 67 65 67 59
7 Surigao City 7 1,167 1,782 -19 -33 70 73 70 73
8 Surigao del Sur 73 3,814 4,526 -12 -28 274 297 274 297
9 Bislig City 62 -695 -776 77 79 38 36 -39 -43
Public SS -
surplus
classrooms -
2011
Incremental enrollment Public SS - JHS Public SS - SHS Public SS - SHS
Public SS - JHS Surplus/ Deficit (+/-) classroom Gross classroom requirement classroom requirement net of
surplus in public JHS
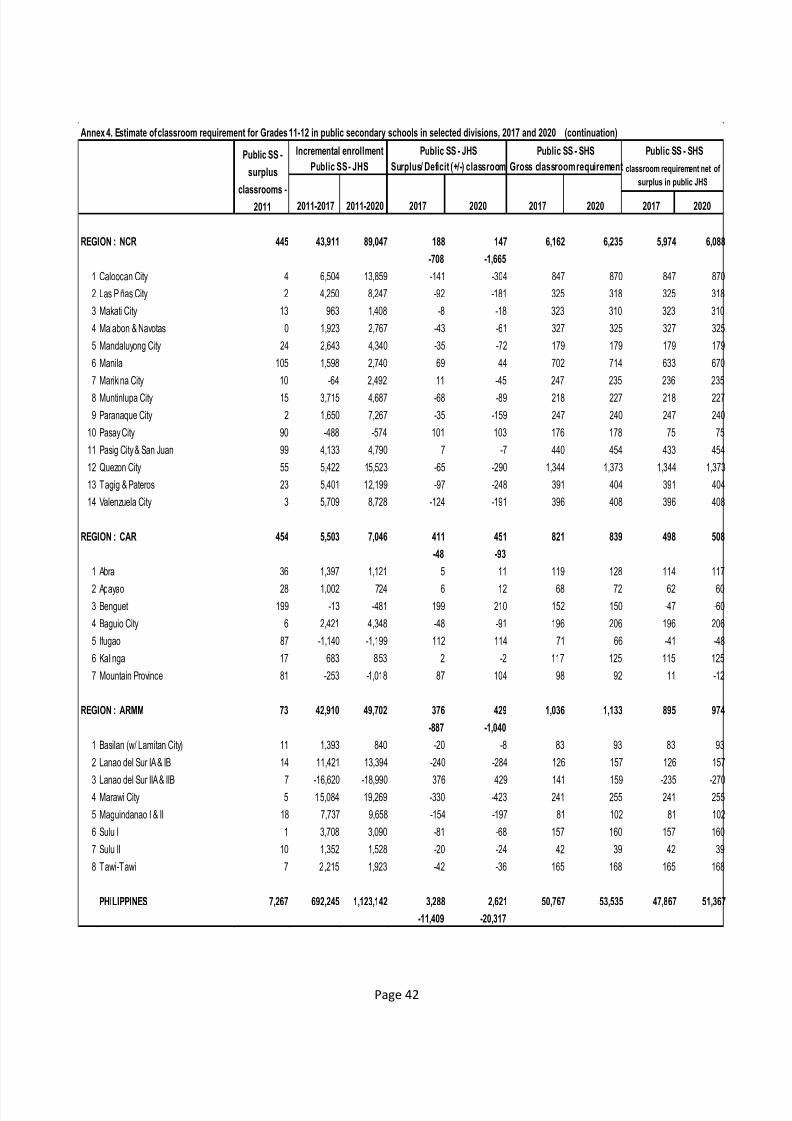
7/27/2019 SHS Absorptive Capacity Study
http://slidepdf.com/reader/full/shs-absorptive-capacity-study 45/57
Page 42
Annex 4. Estimate of classroom requirement for Grades 11-12 in public secondary schools in selected divisions, 2017 and 2020 (continuation)
2011-2017 2011-2020 2017 2020 2017 2020 2017 2020
REGION : NCR 445 43,911 89,047 188 147 6,162 6,235 5,974 6,088
-708 -1,665
1 Caloocan City 4 6,504 13,859 -141 -304 847 870 847 870
2 Las Piñas City 2 4,250 8,247 -92 -181 325 318 325 318
3 Makati City 13 963 1,408 -8 -18 323 310 323 310
4 Malabon & Navotas 0 1,923 2,767 -43 -61 327 325 327 325
5 Mandaluyong City 24 2,643 4,340 -35 -72 179 179 179 179
6 Manila 105 1,598 2,740 69 44 702 714 633 670
7 Marikina City 10 -64 2,492 11 -45 247 235 236 235
8 Muntinlupa City 15 3,715 4,687 -68 -89 218 227 218 227
9 Paranaque City 2 1,650 7,267 -35 -159 247 240 247 240
10 Pasay City 90 -488 -574 101 103 176 178 75 75
11 Pasig City & San Juan 99 4,133 4,790 7 -7 440 454 433 454
12 Quezon City 55 5,422 15,523 -65 -290 1,344 1,373 1,344 1,373
13 Tagig & Pateros 23 5,401 12,199 -97 -248 391 404 391 404
14 Valenzuela City 3 5,709 8,728 -124 -191 396 408 396 408
REGION : CAR 454 5,503 7,046 411 451 821 839 498 508
-48 -93
1 Abra 36 1,397 1,121 5 11 119 128 114 117
2 Apayao 28 1,002 724 6 12 68 72 62 60
3 Benguet 199 -13 -481 199 210 152 150 -47 -60
4 Baguio City 6 2,421 4,348 -48 -91 196 206 196 206
5 Ifugao 87 -1,140 -1,199 112 114 71 66 -41 -48
6 Kalinga 17 683 853 2 -2 117 125 115 125
7 Mountain Province 81 -253 -1,018 87 104 98 92 11 -12
REGION : ARMM 73 42,910 49,702 376 429 1,036 1,133 895 974
-887 -1,040
1 Basilan (w/ Lamitan City) 11 1,393 840 -20 -8 83 93 83 93
2 Lanao del Sur IA & IB 14 11,421 13,394 -240 -284 126 157 126 157
3 Lanao del Sur IIA & IIB 7 -16,620 -18,990 376 429 141 159 -235 -270
4 Marawi City 5 15,084 19,269 -330 -423 241 255 241 255
5 Maguindanao I & II 18 7,737 9,658 -154 -197 81 102 81 102
6 Sulu I 1 3,708 3,090 -81 -68 157 160 157 160
7 Sulu II 10 1,352 1,528 -20 -24 42 39 42 39
8 Tawi-Tawi 7 2,215 1,923 -42 -36 165 168 165 168
PHILIPPINES 7,267 692,245 1,123,142 3,288 2,621 50,767 53,535 47,867 51,367
-11,409 -20,317
Public SS -
surplus
classrooms -
2011
Incremental enrollment Public SS - JHS Public SS - SHS Public SS - SHS
Public SS - JHS Surplus/ Deficit (+/-) classroom Gross classroom requirement classroom requirement net of
surplus in public JHS
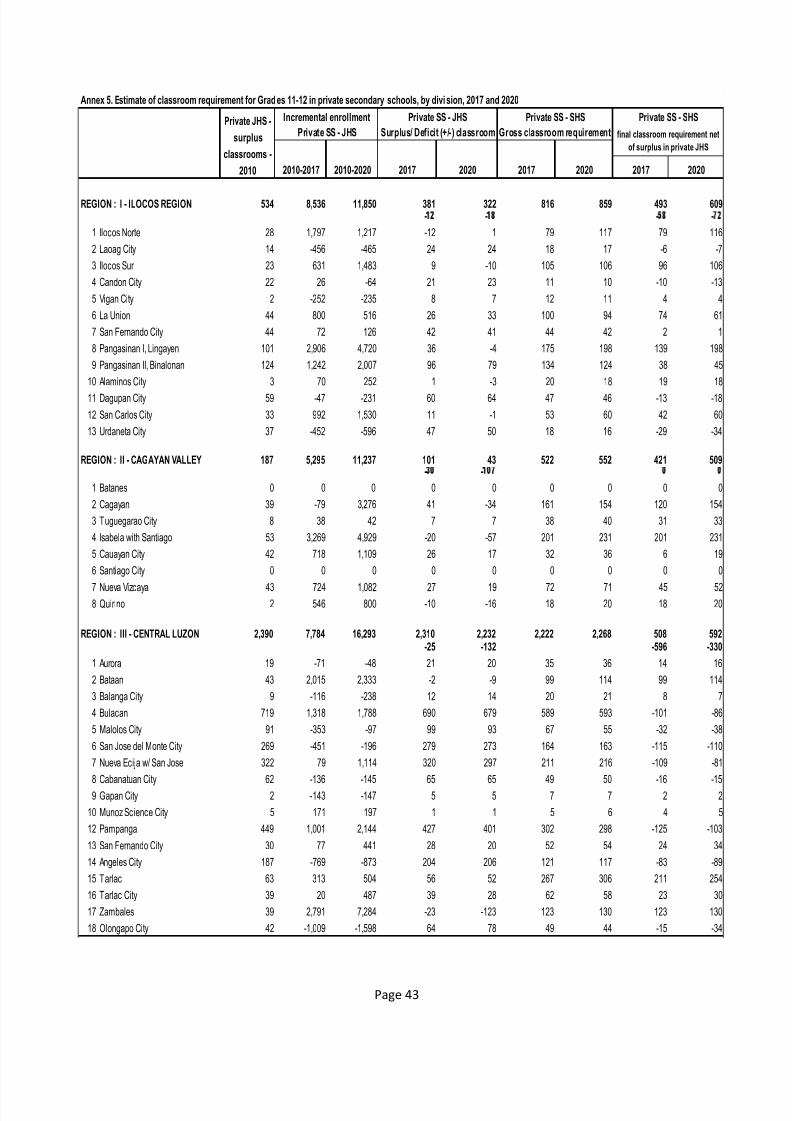
7/27/2019 SHS Absorptive Capacity Study
http://slidepdf.com/reader/full/shs-absorptive-capacity-study 46/57
Page 43
Annex 5. Estimate of classroom requirement for Grades 11-12 in private secondary schools, by divi sion, 2017 and 2020
2010-2017 2010-2020 2017 2020 2017 2020 2017 2020
REGION : I - ILOCOS REGION 534 8,536 11,850 381 322 816 859 493 609- - - -
1 Ilocos Norte 28 1,797 1,217 -12 1 79 117 79 116
2 Laoag City 14 -456 -465 24 24 18 17 -6 -7
3 Ilocos Sur 23 631 1,483 9 -10 105 106 96 106
4 Candon City 22 26 -64 21 23 11 10 -10 -13
5 Vigan City 2 -252 -235 8 7 12 11 4 4
6 La Union 44 800 516 26 33 100 94 74 61
7 San Fernando City 44 72 126 42 41 44 42 2 1
8 Pangasinan I, Lingayen 101 2,906 4,720 36 -4 175 198 139 198
9 Pangasinan II, Binalonan 124 1,242 2,007 96 79 134 124 38 45
10 Alaminos City 3 70 252 1 -3 20 18 19 18
11 Dagupan City 59 -47 -231 60 64 47 46 -13 -18
12 San Carlos City 33 992 1,530 11 -1 53 60 42 60
13 Urdaneta City 37 -452 -596 47 50 18 16 -29 -34
REGION : II - CAGAYAN VALLEY 187 5,295 11,237 101 43 522 552 421 509- -
1 Batanes 0 0 0 0 0 0 0 0 0
2 Cagayan 39 -79 3,276 41 -34 161 154 120 154
3 Tuguegarao City 8 38 42 7 7 38 40 31 33
4 Isabela with Santiago 53 3,269 4,929 -20 -57 201 231 201 231
5 Cauayan City 42 718 1,109 26 17 32 36 6 19
6 Santiago City 0 0 0 0 0 0 0 0 0
7 Nueva Vizcaya 43 724 1,082 27 19 72 71 45 52
8 Quirino 2 546 800 -10 -16 18 20 18 20
REGION : III - CENTRAL LUZON 2,390 7,784 16,293 2,310 2,232 2,222 2,268 508 592-25 -132 -596 -330
1 Aurora 19 -71 -48 21 20 35 36 14 16
2 Bataan 43 2,015 2,333 -2 -9 99 114 99 114
3 Balanga City 9 -116 -238 12 14 20 21 8 7
4 Bulacan 719 1,318 1,788 690 679 589 593 -101 -86
5 Malolos City 91 -353 -97 99 93 67 55 -32 -38
6 San Jose del Monte City 269 -451 -196 279 273 164 163 -115 -110
7 Nueva Ecija w/ San Jose 322 79 1,114 320 297 211 216 -109 -81
8 Cabanatuan City 62 -136 -145 65 65 49 50 -16 -15
9 Gapan City 2 -143 -147 5 5 7 7 2 2
10 Munoz Science City 5 171 197 1 1 5 6 4 5
12 Pampanga 449 1,001 2,144 427 401 302 298 -125 -103
13 San Fernando City 30 77 441 28 20 52 54 24 34
14 Angeles City 187 -769 -873 204 206 121 117 -83 -89
15 Tarlac 63 313 504 56 52 267 306 211 254
16 Tarlac City 39 20 487 39 28 62 58 23 30
17 Zambales 39 2,791 7,284 -23 -123 123 130 123 130
18 Olongapo City 42 -1,009 -1,598 64 78 49 44 -15 -34
Private JHS -
surplus
classrooms -
2010
Incremental enrollment Private SS - JHS Private SS - SHS Private SS - SHS
Private SS - JHS Surplus/ Deficit (+/-) classroom Gross classroom requirement final classroom requirement net
of surplus in private JHS
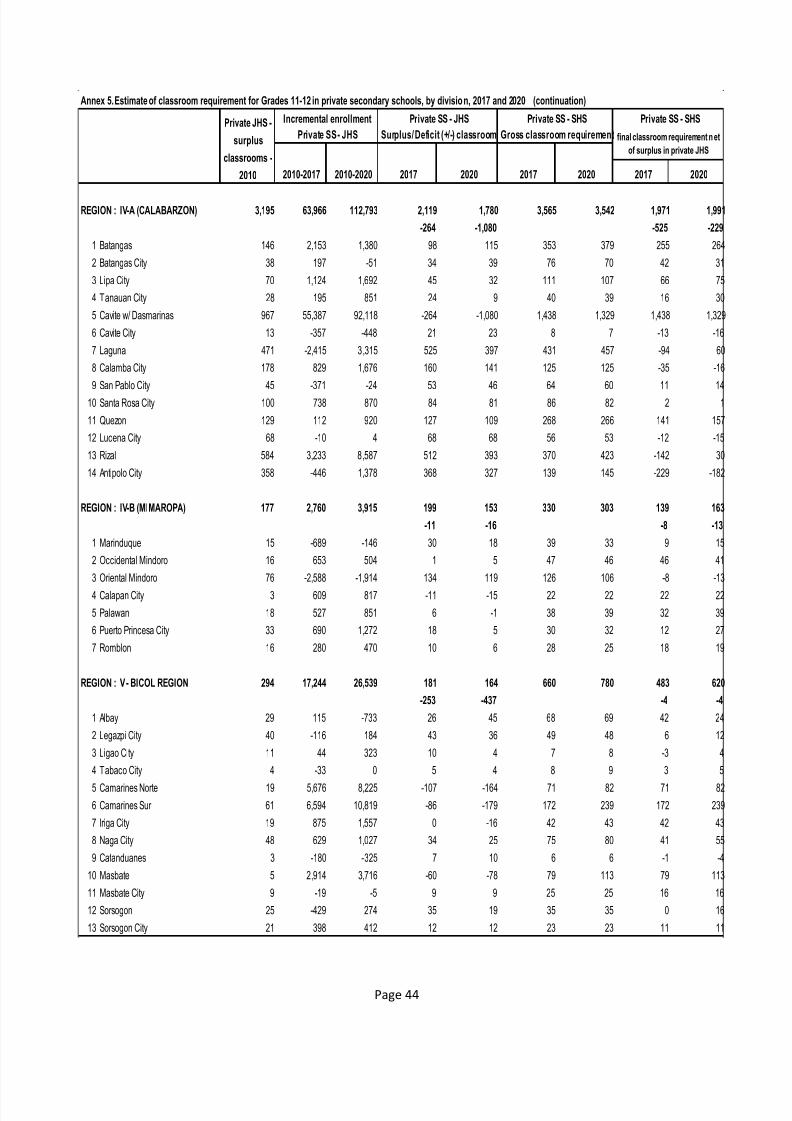
7/27/2019 SHS Absorptive Capacity Study
http://slidepdf.com/reader/full/shs-absorptive-capacity-study 47/57
Page 44
Annex 5. Estimate of classroom requirement for Grades 11-12 in private secondary schools, by division, 2017 and 2020 (continuation)
2010-2017 2010-2020 2017 2020 2017 2020 2017 2020
REGION : IV-A (CALABARZON) 3,195 63,966 112,793 2,119 1,780 3,565 3,542 1,971 1,991
-264 -1,080 -525 -229
1 Batangas 146 2,153 1,380 98 115 353 379 255 264
2 Batangas City 38 197 -51 34 39 76 70 42 31
3 Lipa City 70 1,124 1,692 45 32 111 107 66 75
4 Tanauan City 28 195 851 24 9 40 39 16 30
5 Cavite w/ Dasmarinas 967 55,387 92,118 -264 -1,080 1,438 1,329 1,438 1,329
6 Cavite City 13 -357 -448 21 23 8 7 -13 -16
7 Laguna 471 -2,415 3,315 525 397 431 457 -94 60
8 Calamba City 178 829 1,676 160 141 125 125 -35 -16
9 San Pablo City 45 -371 -24 53 46 64 60 11 14
10 Santa Rosa City 100 738 870 84 81 86 82 2 1
11 Quezon 129 112 920 127 109 268 266 141 157
12 Lucena City 68 -10 4 68 68 56 53 -12 -15
13 Rizal 584 3,233 8,587 512 393 370 423 -142 30
14 Antipolo City 358 -446 1,378 368 327 139 145 -229 -182
REGION : IV-B (MIMAROPA) 177 2,760 3,915 199 153 330 303 139 163
-11 -16 -8 -13
1 Marinduque 15 -689 -146 30 18 39 33 9 15
2 Occidental Mindoro 16 653 504 1 5 47 46 46 413 Oriental Mindoro 76 -2,588 -1,914 134 119 126 106 -8 -13
4 Calapan City 3 609 817 -11 -15 22 22 22 22
5 Palawan 18 527 851 6 -1 38 39 32 39
6 Puerto Princesa City 33 690 1,272 18 5 30 32 12 27
7 Romblon 16 280 470 10 6 28 25 18 19
REGION : V - BICOL REGION 294 17,244 26,539 181 164 660 780 483 620
-253 -437 -4 -4
1 Albay 29 115 -733 26 45 68 69 42 24
2 Legazpi City 40 -116 184 43 36 49 48 6 12
3 Ligao City 11 44 323 10 4 7 8 -3 44 Tabaco City 4 -33 0 5 4 8 9 3 5
5 Camarines Norte 19 5,676 8,225 -107 -164 71 82 71 82
6 Camarines Sur 61 6,594 10,819 -86 -179 172 239 172 239
7 Iriga City 19 875 1,557 0 -16 42 43 42 43
8 Naga City 48 629 1,027 34 25 75 80 41 55
9 Catanduanes 3 -180 -325 7 10 6 6 -1 -4
10 Masbate 5 2,914 3,716 -60 -78 79 113 79 113
11 Masbate City 9 -19 -5 9 9 25 25 16 16
12 Sorsogon 25 -429 274 35 19 35 35 0 16
13 Sorsogon City 21 398 412 12 12 23 23 11 11
Private JHS -
surplus
classrooms -
2010
Incremental enrollment Private SS - JHS Private SS - SHS Private SS - SHS
Private SS - JHS Surplus/ Deficit (+/-) classroom Gross classroom requirement final classroom requirement net
of surplus in private JHS
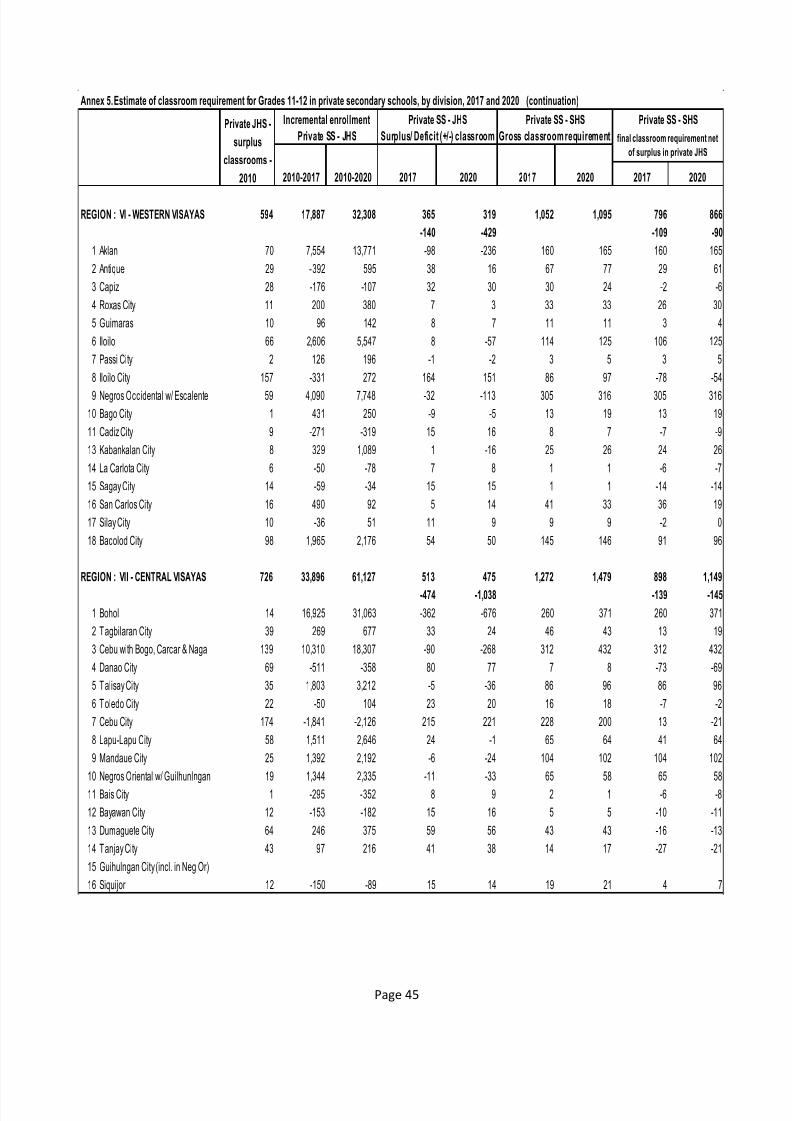
7/27/2019 SHS Absorptive Capacity Study
http://slidepdf.com/reader/full/shs-absorptive-capacity-study 48/57
Page 45
Annex 5. Estimate of classroom requirement for Grades 11-12 in private secondary schools, by division, 2017 and 2020 (continuation)
2010-2017 2010-2020 2017 2020 2017 2020 2017 2020
REGION : VI - WESTERN VISAYAS 594 17,887 32,308 365 319 1,052 1,095 796 866
-140 -429 -109 -90
1 Aklan 70 7,554 13,771 -98 -236 160 165 160 165
2 Antique 29 -392 595 38 16 67 77 29 61
3 Capiz 28 -176 -107 32 30 30 24 -2 -6
4 Roxas City 11 200 380 7 3 33 33 26 30
5 Guimaras 10 96 142 8 7 11 11 3 4
6 Iloilo 66 2,606 5,547 8 -57 114 125 106 125
7 Passi City 2 126 196 -1 -2 3 5 3 5
8 Iloilo City 157 -331 272 164 151 86 97 -78 -549 Negros Occidental w/ Escalente 59 4,090 7,748 -32 -113 305 316 305 316
10 Bago City 1 431 250 -9 -5 13 19 13 19
11 Cadiz City 9 -271 -319 15 16 8 7 -7 -9
13 Kabankalan City 8 329 1,089 1 -16 25 26 24 26
14 La Carlota City 6 -50 -78 7 8 1 1 -6 -7
15 Sagay City 14 -59 -34 15 15 1 1 -14 -14
16 San Carlos City 16 490 92 5 14 41 33 36 19
17 Silay City 10 -36 51 11 9 9 9 -2 0
18 Bacolod City 98 1,965 2,176 54 50 145 146 91 96
REGION : VII - CENTRAL VISAYAS 726 33,896 61,127 513 475 1,272 1,479 898 1,149
-474 -1,038 -139 -145
1 Bohol 14 16,925 31,063 -362 -676 260 371 260 371
2 Tagbilaran City 39 269 677 33 24 46 43 13 19
3 Cebu with Bogo, Carcar & Naga 139 10,310 18,307 -90 -268 312 432 312 432
4 Danao City 69 -511 -358 80 77 7 8 -73 -69
5 Talisay City 35 1,803 3,212 -5 -36 86 96 86 96
6 Toledo City 22 -50 104 23 20 16 18 -7 -2
7 Cebu City 174 -1,841 -2,126 215 221 228 200 13 -21
8 Lapu-Lapu City 58 1,511 2,646 24 -1 65 64 41 64
9 Mandaue City 25 1,392 2,192 -6 -24 104 102 104 102
10 Negros Oriental w/ Guilhunlngan 19 1,344 2,335 -11 -33 65 58 65 58
11 Bais City 1 -295 -352 8 9 2 1 -6 -8
12 Bayawan City 12 -153 -182 15 16 5 5 -10 -11
13 Dumaguete City 64 246 375 59 56 43 43 -16 -13
14 Tanjay City 43 97 216 41 38 14 17 -27 -21
15 Guihulngan City (incl. in Neg Or)
16 Siquijor 12 -150 -89 15 14 19 21 4 7
Private JHS -
surplus
classrooms -
2010
Incremental enrollment Private SS - JHS Private SS - SHS Private SS - SHS
Private SS - JHS Surplus/ Deficit (+/-) classroom Gross classroom requirement final classroom requirement net
of surplus in private JHS
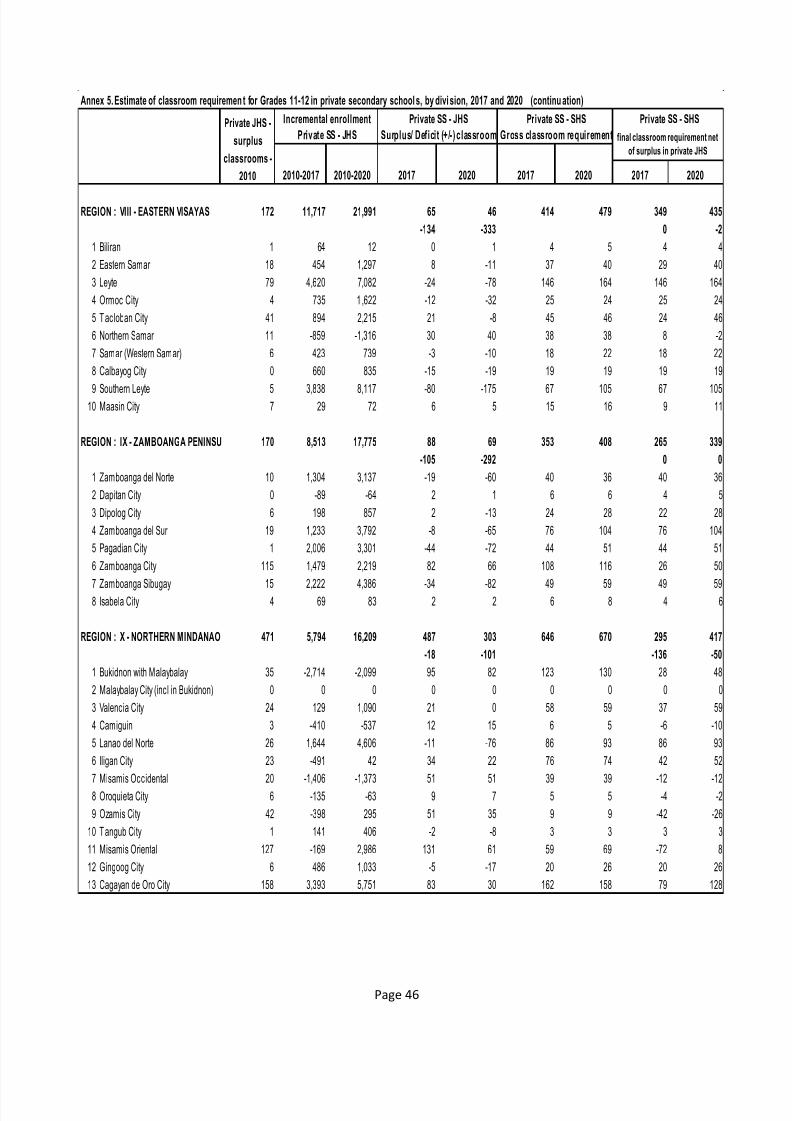
7/27/2019 SHS Absorptive Capacity Study
http://slidepdf.com/reader/full/shs-absorptive-capacity-study 49/57
Page 46
Annex 5. Estimate of classroom requiremen t for Grades 11-12 in private secondary school s, by divi sion, 2017 and 2020 (continu ation)
2010-2017 2010-2020 2017 2020 2017 2020 2017 2020
REGION : VIII - EASTERN VISAYAS 172 11,717 21,991 65 46 414 479 349 435
-134 -333 0 -2
1 Biliran 1 64 12 0 1 4 5 4 4
2 Eastern Samar 18 454 1,297 8 -11 37 40 29 40
3 Leyte 79 4,620 7,082 -24 -78 146 164 146 164
4 Ormoc City 4 735 1 ,622 -12 -32 25 24 25 24
5 Tacloban City 41 894 2,215 21 -8 45 46 24 46
6 Northern Samar 11 -859 -1,316 30 40 38 38 8 -2
7 Samar (Western Samar) 6 423 739 -3 -10 18 22 18 22
8 Calbayog City 0 660 835 -15 -19 19 19 19 199 Southern Leyte 5 3,838 8,117 -80 -175 67 105 67 105
10 Maasin City 7 29 72 6 5 15 16 9 11
REGION : IX - ZAMBOANGA PENINSU 170 8,513 17,775 88 69 353 408 265 339
-105 -292 0 0
1 Zamboanga del Norte 10 1,304 3,137 -19 -60 40 36 40 36
2 Dapitan City 0 -89 -64 2 1 6 6 4 5
3 Dipolog City 6 198 857 2 -13 24 28 22 28
4 Zamboanga del Sur 19 1,233 3,792 -8 -65 76 104 76 104
5 Pagadian City 1 2,006 3,301 -44 -72 44 51 44 51
6 Zamboanga City 115 1,479 2,219 82 66 108 116 26 507 Zamboanga Sibugay 15 2,222 4,386 -34 -82 49 59 49 59
8 Isabela City 4 69 83 2 2 6 8 4 6
REGION : X - NORTHERN MINDANAO 471 5,794 16,209 487 303 646 670 295 417
-18 -101 -136 -50
1 Bukidnon with Malaybalay 35 -2,714 -2,099 95 82 123 130 28 48
2 Malaybalay City (incl in Bukidnon) 0 0 0 0 0 0 0 0 0
3 Valencia City 24 129 1,090 21 0 58 59 37 59
4 Camiguin 3 -410 -537 12 15 6 5 -6 -10
5 Lanao del Norte 26 1,644 4,606 -11 -76 86 93 86 93
6 Iligan City 23 -491 42 34 22 76 74 42 52
7 Misamis Occidental 20 -1,406 -1,373 51 51 39 39 -12 -12
8 Oroquieta City 6 -135 -63 9 7 5 5 -4 -2
9 Ozamis City 42 -398 295 51 35 9 9 -42 -26
10 Tangub City 1 141 406 -2 -8 3 3 3 3
11 Misamis Oriental 127 -169 2,986 131 61 59 69 -72 8
12 Gingoog City 6 486 1,033 -5 -17 20 26 20 26
13 Cagayan de Oro City 158 3,393 5,751 83 30 162 158 79 128
Private JHS -
surplus
classrooms -
2010
Incremental enrollment Private SS - JHS Private SS - SHS Private SS - SHS
Private SS - JHS Surplus/ Deficit (+/-) classroom Gross classroom requirement final classroom requirement net
of surplus in private JHS
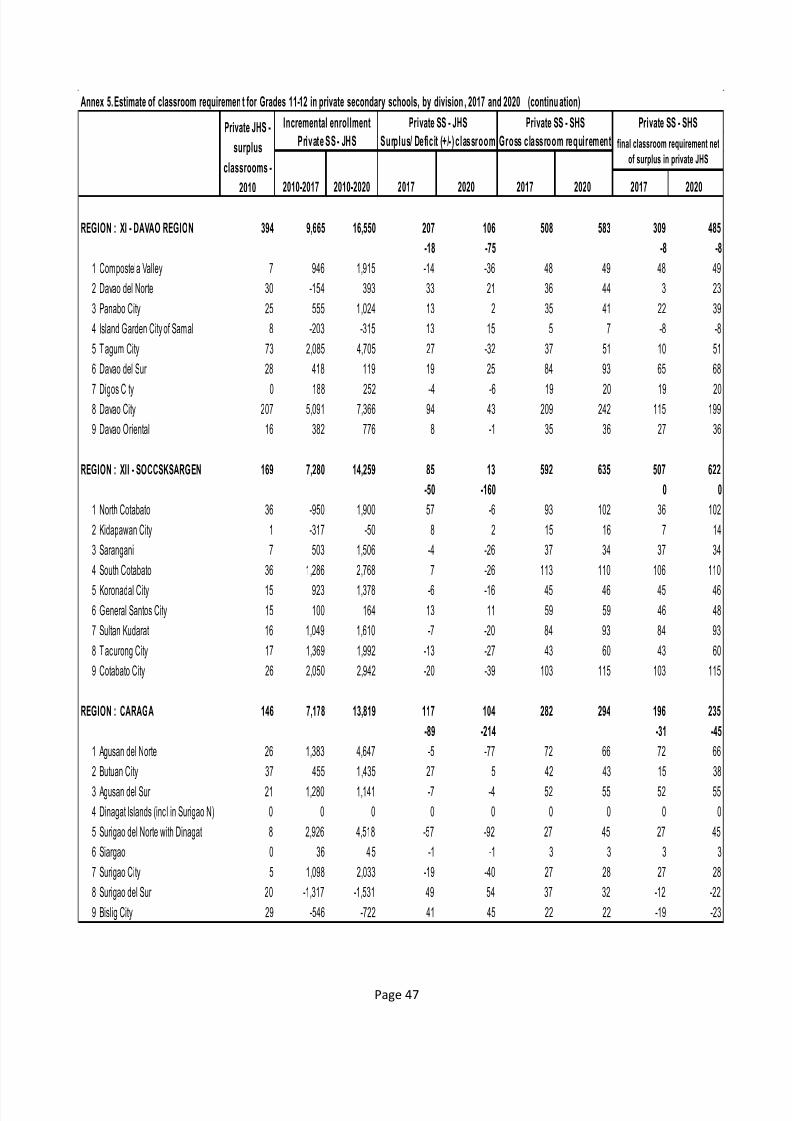
7/27/2019 SHS Absorptive Capacity Study
http://slidepdf.com/reader/full/shs-absorptive-capacity-study 50/57
Page 47
Annex 5. Estimate of classroom requiremen t for Grades 11-12 in private secondary schools, by division , 2017 and 2020 (continu ation)
2010-2017 2010-2020 2017 2020 2017 2020 2017 2020
REGION : XI - DAVAO REGION 394 9,665 16,550 207 106 508 583 309 485
-18 -75 -8 -8
1 Compostela Valley 7 946 1,915 -14 -36 48 49 48 49
2 Davao del Norte 30 -154 393 33 21 36 44 3 23
3 Panabo City 25 555 1,024 13 2 35 41 22 39
4 Island Garden City of Samal 8 -203 -315 13 15 5 7 -8 -8
5 Tagum City 73 2,085 4,705 27 -32 37 51 10 51
6 Davao del Sur 28 418 119 19 25 84 93 65 687 Digos City 0 188 252 -4 -6 19 20 19 20
8 Davao City 207 5,091 7,366 94 43 209 242 115 199
9 Davao Oriental 16 382 776 8 -1 35 36 27 36
REGION : XII - SOCCSKSARGEN 169 7,280 14,259 85 13 592 635 507 622
-50 -160 0 0
1 North Cotabato 36 -950 1,900 57 -6 93 102 36 102
2 Kidapawan City 1 -317 -50 8 2 15 16 7 14
3 Sarangani 7 503 1,506 -4 -26 37 34 37 34
4 South Cotabato 36 1,286 2,768 7 -26 113 110 106 110
5 Koronadal City 15 923 1,378 -6 -16 45 46 45 46
6 General Santos City 15 100 164 13 11 59 59 46 48
7 Sultan Kudarat 16 1,049 1,610 -7 -20 84 93 84 93
8 Tacurong City 17 1,369 1,992 -13 -27 43 60 43 60
9 Cotabato City 26 2,050 2,942 -20 -39 103 115 103 115
REGION : CARAGA 146 7,178 13,819 117 104 282 294 196 235
-89 -214 -31 -45
1 Agusan del Norte 26 1,383 4,647 -5 -77 72 66 72 662 Butuan City 37 455 1,435 27 5 42 43 15 38
3 Agusan del Sur 21 1,280 1,141 -7 -4 52 55 52 55
4 Dinagat Islands (incl in Surigao N) 0 0 0 0 0 0 0 0 0
5 Surigao del Norte with Dinagat 8 2,926 4,518 -57 -92 27 45 27 45
6 Siargao 0 36 4 5 -1 -1 3 3 3 3
7 Surigao City 5 1,098 2,033 -19 -40 27 28 27 28
8 Surigao del Sur 20 -1,317 -1,531 49 54 37 32 -12 -22
9 Bislig City 29 -546 -722 41 45 22 22 -19 -23
Private JHS -
surplus
classrooms -
2010
Incremental enrollment Private SS - JHS Private SS - SHS Private SS - SHS
Private SS - JHS Surplus/ Deficit (+/-) classroom Gross classroom requirement final classroom requirement net
of surplus in private JHS
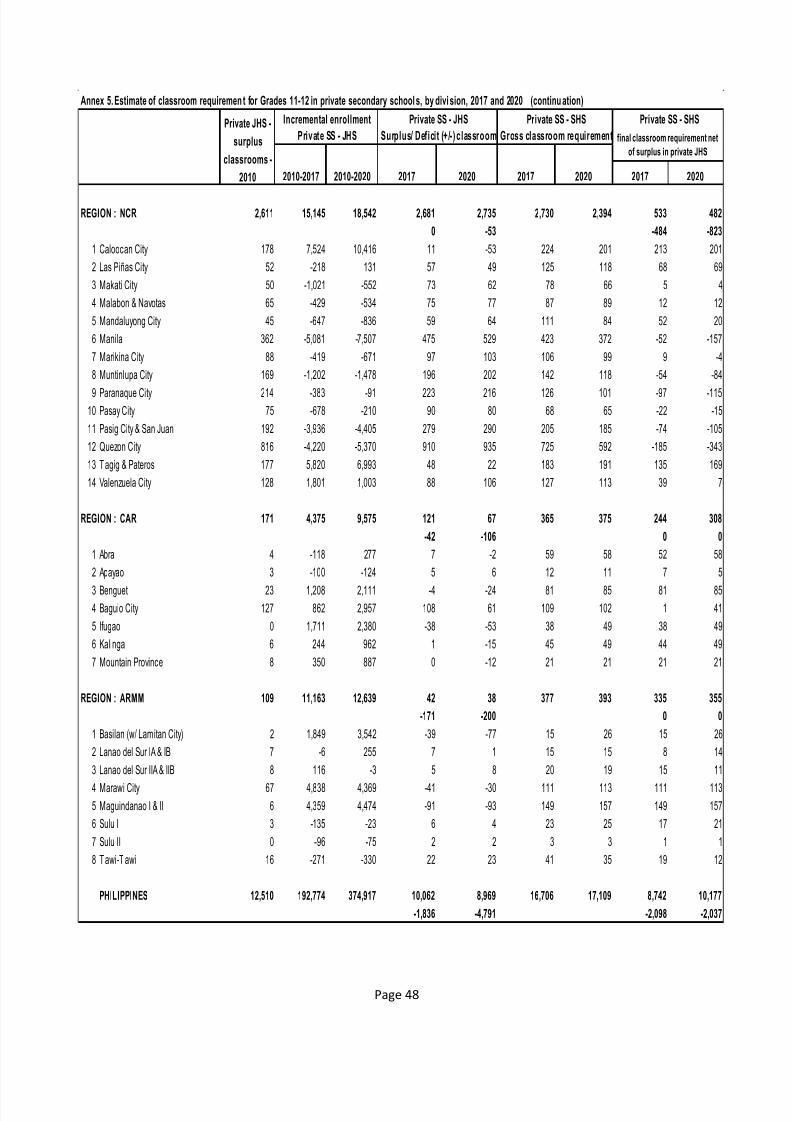
7/27/2019 SHS Absorptive Capacity Study
http://slidepdf.com/reader/full/shs-absorptive-capacity-study 51/57
Page 48
Annex 5. Estimate of classroom requiremen t for Grades 11-12 in private secondary school s, by divi sion, 2017 and 2020 (continu ation)
2010-2017 2010-2020 2017 2020 2017 2020 2017 2020
REGION : NCR 2,611 15,145 18,542 2,681 2,735 2,730 2,394 533 482
0 -53 -484 -823
1 Caloocan City 178 7,524 10,416 11 -53 224 201 213 201
2 Las Piñas City 52 -218 131 57 49 125 118 68 69
3 Makati City 50 -1,021 -552 73 62 78 66 5 4
4 Malabon & Navotas 65 -429 -534 75 77 87 89 12 12
5 Mandaluyong City 45 -647 -836 59 64 111 84 52 20
6 Manila 362 -5,081 -7,507 475 529 423 372 -52 -157
7 Marikina City 88 -419 -671 97 103 106 99 9 -4
8 Muntinlupa City 169 -1,202 -1,478 196 202 142 118 -54 -849 Paranaque City 214 -383 -91 223 216 126 101 -97 -115
10 Pasay City 75 -678 -210 90 80 68 65 -22 -15
11 Pasig City & San Juan 192 -3,936 -4,405 279 290 205 185 -74 -105
12 Quezon City 816 -4,220 -5,370 910 935 725 592 -185 -343
13 Tagig & Pateros 177 5,820 6,993 48 22 183 191 135 169
14 Valenzuela City 128 1,801 1,003 88 106 127 113 39 7
REGION : CAR 171 4,375 9,575 121 67 365 375 244 308
-42 -106 0 0
1 Abra 4 -118 277 7 -2 59 58 52 58
2 Apayao 3 -100 -124 5 6 12 11 7 5
3 Benguet 23 1,208 2,111 -4 -24 81 85 81 85
4 Baguio City 127 862 2,957 108 61 109 102 1 41
5 Ifugao 0 1,711 2,380 -38 -53 38 49 38 49
6 Kalinga 6 244 962 1 -15 45 49 44 49
7 Mountain Province 8 350 887 0 -12 21 21 21 21
REGION : ARMM 109 11,163 12,639 42 38 377 393 335 355
-171 -200 0 0
1 Basilan (w/ Lamitan City) 2 1,849 3,542 -39 -77 15 26 15 26
2 Lanao del Sur IA & IB 7 -6 255 7 1 15 15 8 143 Lanao del Sur IIA & IIB 8 116 -3 5 8 20 19 15 11
4 Marawi City 67 4,838 4,369 -41 -30 111 113 111 113
5 Maguindanao I & II 6 4,359 4,474 -91 -93 149 157 149 157
6 Sulu I 3 -135 -23 6 4 23 25 17 21
7 Sulu II 0 -96 -75 2 2 3 3 1 1
8 Tawi-T awi 16 -271 -330 22 23 41 35 19 12
PHILIPPINES 12,510 192,774 374,917 10,062 8,969 16,706 17,109 8,742 10,177
-1,836 -4,791 -2,098 -2,037
Private JHS -
surplus
classrooms -
2010
Incremental enrollment Private SS - JHS Private SS - SHS Private SS - SHS
Private SS - JHS Surplus/ Deficit (+/-) classroom Gross classroom requirement final classroom requirement net
of surplus in private JHS
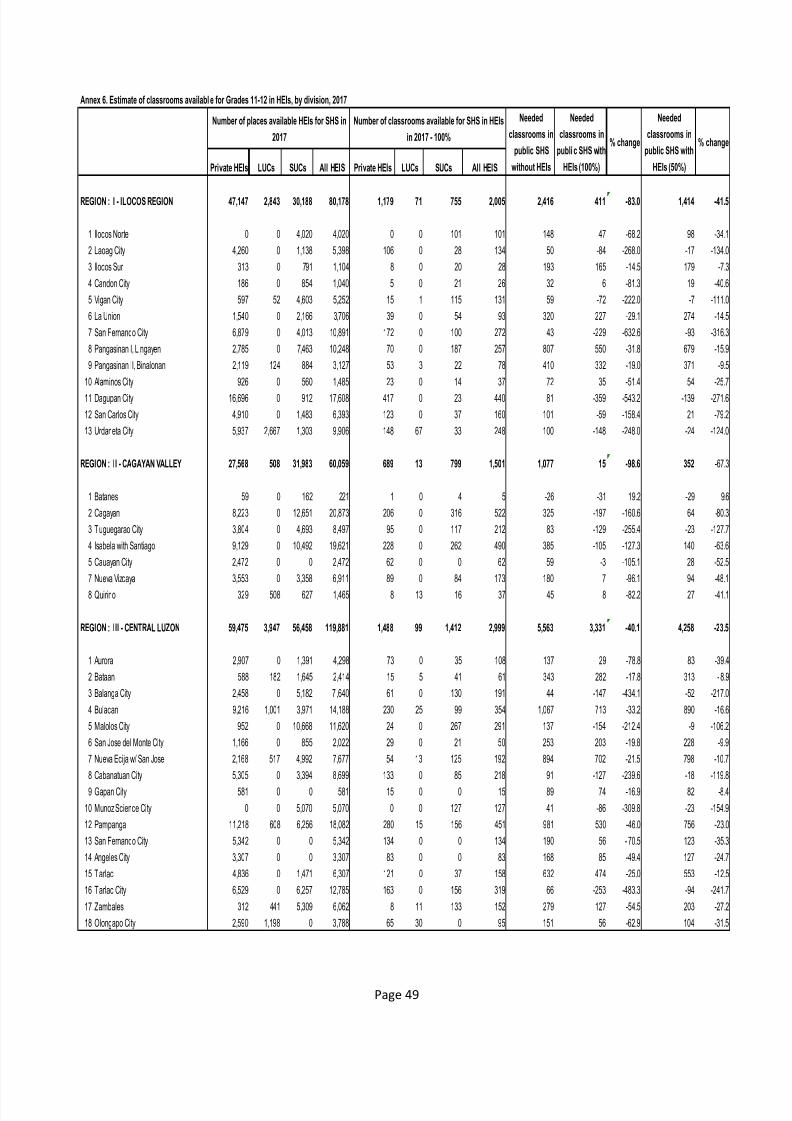
7/27/2019 SHS Absorptive Capacity Study
http://slidepdf.com/reader/full/shs-absorptive-capacity-study 52/57
Page 49
Annex 6. Estimate of classrooms availabl e for Grades 11-12 in HEIs, by division, 2017
Private HEIs LUCs SUCs All HEIS Private HEIs LUCs SUCs All HEIS
REGION : I - ILOCOS REGION 47,147 2,843 30,188 80,178 1,179 71 755 2,005 2,416 411 -83.0 1,414 -41.5
1 Ilocos Norte 0 0 4,020 4,020 0 0 101 101 148 47 -68.2 98 -34.1
2 Laoag City 4,260 0 1,138 5,398 106 0 28 134 50 -84 -268.0 -17 -134.0
3 Ilocos Sur 313 0 791 1,104 8 0 20 28 193 165 -14.5 179 -7.3
4 Candon City 186 0 854 1,040 5 0 21 26 32 6 -81.3 19 -40.6
5 Vigan City 597 52 4,603 5,252 15 1 115 131 59 -72 -222.0 -7 -111.0
6 La Union 1,540 0 2,166 3,706 39 0 54 93 320 227 -29.1 274 -14.5
7 San Fernando City 6,879 0 4,013 10,891 172 0 100 272 43 -229 -632.6 -93 -316.3
8 Pangasinan I, Lingayen 2,785 0 7,463 10,248 70 0 187 257 807 550 -31.8 679 -15.9
9 Pangasinan II, Binalonan 2,119 124 884 3,127 53 3 22 78 410 332 -19.0 371 -9.5
10 Alaminos City 926 0 560 1,485 23 0 14 37 72 35 -51.4 54 -25.7
11 Dagupan City 16,696 0 912 17,608 417 0 23 440 81 -359 -543.2 -139 -271.6
12 San Carlos City 4,910 0 1,483 6,393 123 0 37 160 101 -59 -158.4 21 -79.2
13 Urdaneta City 5,937 2,667 1,303 9,906 148 67 33 248 100 -148 -248.0 -24 -124.0
REGION : II - CAGAYAN VALLEY 27,568 508 31,983 60,059 689 13 799 1,501 1,077 15 -98.6 352 -67.3
1 Batanes 59 0 162 221 1 0 4 5 -26 -31 19.2 -29 9.6
2 Cagayan 8,223 0 12,651 20,873 206 0 316 522 325 -197 -160.6 64 -80.3
3 Tuguegarao City 3,804 0 4,693 8,497 95 0 117 212 83 -129 -255.4 -23 -127.7
4 Isabela with Santiago 9,129 0 10,492 19,621 228 0 262 490 385 -105 -127.3 140 -63.6
5 Cauayan City 2,472 0 0 2,472 62 0 0 62 59 -3 -105.1 28 -52.57 Nueva Vizcaya 3,553 0 3,358 6,911 89 0 84 173 180 7 -96.1 94 -48.1
8 Quirino 329 508 627 1,465 8 13 16 37 45 8 -82.2 27 -41.1
REGION : III - CENTRAL LUZON 59,475 3,947 56,458 119,881 1,488 99 1,412 2,999 5,563 3,331 -40.1 4,258 -23.5
1 Aurora 2,907 0 1,391 4,298 73 0 35 108 137 29 -78.8 83 -39.4
2 Bataan 588 182 1,645 2,414 15 5 41 61 343 282 -17.8 313 -8.9
3 Balanga City 2,458 0 5,182 7 ,640 61 0 130 191 44 -147 -434.1 -52 -217.0
4 Bulacan 9,216 1,001 3,971 14,188 230 25 99 354 1,067 713 -33.2 890 -16.6
5 Malolos City 952 0 10,668 11,620 24 0 267 291 137 -154 -212.4 -9 -106.2
6 San Jose del Monte City 1,166 0 855 2,022 29 0 21 50 253 203 -19.8 228 -9.9
7 Nueva Ecija w/ San Jose 2,168 517 4,992 7,677 54 13 125 192 894 702 -21.5 798 -10.7
8 Cabanatuan City 5,305 0 3,394 8,699 133 0 85 218 91 -127 -239.6 -18 -119.8
9 Gapan City 581 0 0 581 15 0 0 15 89 74 -16.9 82 -8.4
10 Munoz Science City 0 0 5,070 5,070 0 0 127 127 41 -86 -309.8 -23 -154.9
12 Pampanga 11,218 608 6,256 18,082 280 15 156 451 981 530 -46.0 756 -23.0
13 San Fernando City 5,342 0 0 5,342 134 0 0 134 190 56 -70.5 123 -35.3
14 Angeles City 3,307 0 0 3,307 83 0 0 83 168 85 -49.4 127 -24.7
15 Tarlac 4,836 0 1,471 6,307 121 0 37 158 632 474 -25.0 553 -12.5
16 Tarlac City 6,529 0 6,257 12,785 163 0 156 319 66 -253 -483.3 -94 -241.7
17 Zambales 312 441 5,309 6,062 8 11 133 152 279 127 -54.5 203 -27.2
18 Olongapo City 2,590 1,198 0 3,788 65 30 0 95 151 56 -62.9 104 -31.5
% change
Number of places available HEIs for SHS in
2017
Number of classrooms available for SHS in HEIs
in 2017 - 100%
Needed
classrooms in
public SHS
without HEIs
Needed
classrooms in
publi c SHS with
HEIs (100%)
% change
Needed
classrooms in
public SHS with
HEIs (50%)
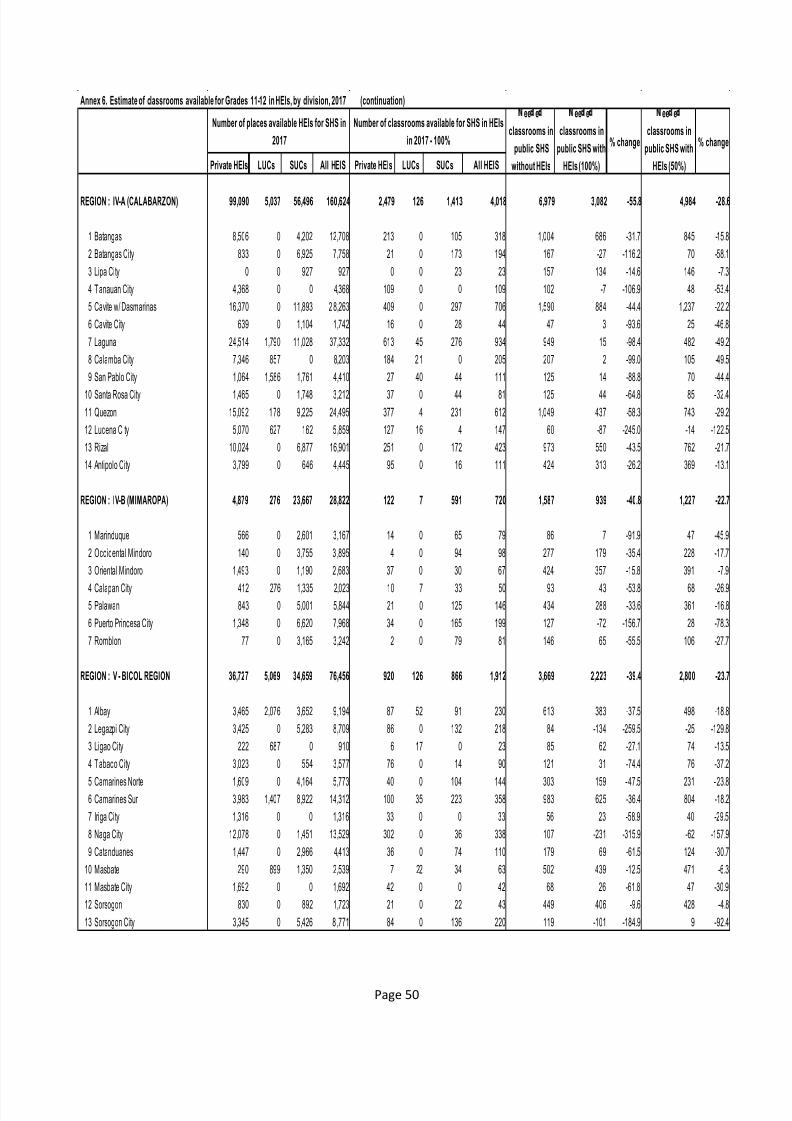
7/27/2019 SHS Absorptive Capacity Study
http://slidepdf.com/reader/full/shs-absorptive-capacity-study 53/57
Page 50
Annex 6. Estimate of classrooms available for Grades 11-12 in HEIs, by division, 2017 (continuation)
Private HEIs LUCs SUCs All HEIS Private HEIs LUCs SUCs All HEIS
REGION : IV-A (CALABARZON) 99,090 5,037 56,496 160,624 2,479 126 1,413 4,018 6,979 3,082 -55.8 4,984 -28.6
1 Batangas 8,506 0 4,202 12,708 213 0 105 318 1,004 686 -31.7 845 -15.8
2 Batangas City 833 0 6,925 7,758 21 0 173 194 167 -27 -116.2 70 -58.1
3 Lipa City 0 0 927 927 0 0 23 23 157 134 -14.6 146 -7.3
4 Tanauan City 4,368 0 0 4,368 109 0 0 109 102 -7 -106.9 48 -53.4
5 Cavite w/ Dasmarinas 16,370 0 11,893 2 8,263 409 0 297 706 1,590 884 -44.4 1,237 -22.2
6 Cavite City 639 0 1,104 1,742 16 0 28 44 47 3 -93.6 25 -46.8
7 Laguna 24,514 1,790 11,028 37,332 613 45 276 934 949 15 -98.4 482 -49.2
8 Calamba City 7,346 857 0 8,203 184 21 0 205 207 2 -99.0 105 -49.5
9 San Pablo City 1,064 1,586 1,761 4,410 27 40 44 111 125 14 -88.8 70 -44.410 Santa Rosa City 1,465 0 1,748 3,212 37 0 44 81 125 44 -64.8 85 -32.4
11 Quezon 15,092 178 9,225 24,495 377 4 231 612 1,049 437 -58.3 743 -29.2
12 Lucena City 5,070 627 162 5,859 127 16 4 147 60 -87 -245.0 -14 -122.5
13 Rizal 10,024 0 6,877 16,901 251 0 172 423 973 550 -43.5 762 -21.7
14 Antipolo City 3,799 0 646 4,445 95 0 16 111 424 313 -26.2 369 -13.1
REGION : IV-B (MIMAROPA) 4,879 276 23,667 28,822 122 7 591 720 1,587 939 -40.8 1,227 -22.7
1 Marinduque 566 0 2,601 3,167 14 0 65 79 86 7 -91.9 47 -45.9
2 Occidental Mindoro 140 0 3,755 3 ,895 4 0 94 98 277 179 -35.4 228 -17.7
3 Oriental Mindoro 1,493 0 1,190 2,683 37 0 30 67 424 357 -15.8 391 -7.9
4 Calapan City 412 276 1,335 2,023 10 7 33 50 93 43 -53.8 68 -26.9
5 Palawan 843 0 5,001 5,844 21 0 125 146 434 288 -33.6 361 -16.8
6 Puerto Princesa City 1,348 0 6,620 7,968 34 0 165 199 127 -72 -156.7 28 -78.3
7 Romblon 77 0 3,165 3,242 2 0 79 81 146 65 -55.5 106 -27.7
REGION : V - BICOL REGION 36,727 5,069 34,659 76,456 920 126 866 1,912 3,669 2,223 -39.4 2,800 -23.7
1 Albay 3,465 2,076 3,652 9,194 87 52 91 230 613 383 -37.5 498 -18.8
2 Legazpi City 3,425 0 5,283 8,709 86 0 132 218 84 -134 -259.5 -25 -129.8
3 Ligao City 222 687 0 910 6 17 0 23 85 62 -27.1 74 -13.54 Tabaco City 3,023 0 554 3,577 76 0 14 90 121 31 -74.4 76 -37.2
5 Camarines Norte 1,609 0 4,164 5,773 40 0 104 144 303 159 -47.5 231 -23.8
6 Camarines Sur 3,983 1,407 8,922 14,312 100 35 223 358 983 625 -36.4 804 -18.2
7 Iriga City 1,316 0 0 1,316 33 0 0 33 56 23 -58.9 40 -29.5
8 Naga City 12,078 0 1,451 13,529 302 0 36 338 107 -231 -315.9 -62 -157.9
9 Catanduanes 1,447 0 2,966 4,413 36 0 74 110 179 69 -61.5 124 -30.7
10 Masbate 290 899 1,350 2,539 7 22 34 63 502 439 -12.5 471 -6.3
11 Masbate City 1,692 0 0 1,692 42 0 0 42 68 26 -61.8 47 -30.9
12 Sorsogon 830 0 892 1,723 21 0 22 43 449 406 -9.6 428 -4.8
13 Sorsogon City 3,345 0 5,426 8 ,771 84 0 136 220 119 -101 -184.9 9 -92.4
Number of places available HEIs for SHS in
2017
Number of classrooms available for SHS in HEIs
in 2017 - 100%
ee e
classrooms in
public SHS
without HEIs
ee e
classrooms in
public SHS with
HEIs (100%)
% change
ee e
classrooms in
public SHS with
HEIs (50%)
% change
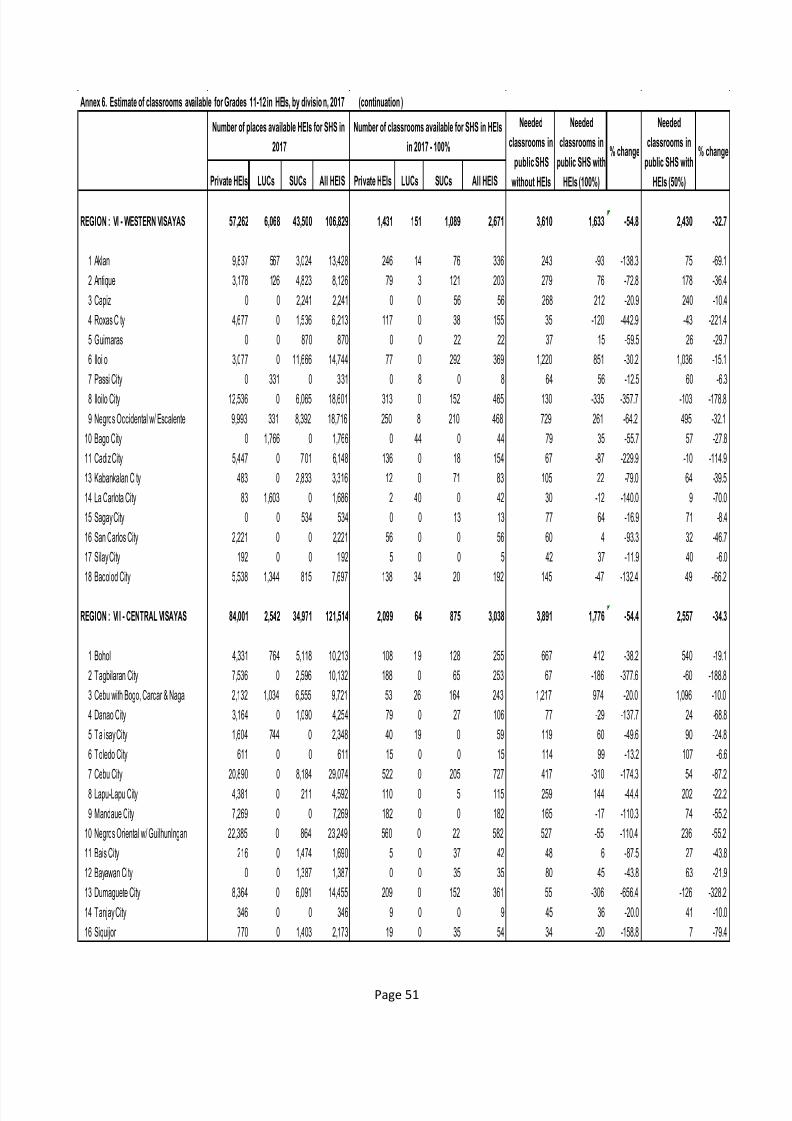
7/27/2019 SHS Absorptive Capacity Study
http://slidepdf.com/reader/full/shs-absorptive-capacity-study 54/57
Page 51
Annex 6. Estimate of classrooms available for Grades 11-12 in HEIs, by divisio n, 2017 (continuation )
Private HEIs LUCs SUCs All HEIS Private HEIs LUCs SUCs All HEIS
REGION : VI - WESTERN VISAYAS 57,262 6,068 43,500 106,829 1,431 151 1,089 2,671 3,610 1,633 -54.8 2,430 -32.7
1 Aklan 9,837 567 3,024 13,428 246 14 76 336 243 -93 -138.3 75 -69.1
2 Antique 3,178 126 4,823 8,126 79 3 121 203 279 76 -72.8 178 -36.4
3 Capiz 0 0 2,241 2,241 0 0 56 56 268 212 -20.9 240 -10.4
4 Roxas City 4,677 0 1,536 6,213 117 0 38 155 35 -120 -442.9 -43 -221.4
5 Guimaras 0 0 870 870 0 0 22 22 37 15 -59.5 26 -29.7
6 Iloilo 3,077 0 11,666 14,744 77 0 292 369 1,220 851 -30.2 1,036 -15.1
7 Passi City 0 331 0 331 0 8 0 8 64 56 -12.5 60 -6.3
8 Iloilo City 12,536 0 6,065 18,601 313 0 152 465 130 -335 -357.7 -103 -178.8
9 Negros Occidental w/ Escalente 9,993 331 8,392 18,716 250 8 210 468 729 261 -64.2 495 -32.1
10 Bago City 0 1,766 0 1,766 0 44 0 44 79 35 -55.7 57 -27.8
11 Cadiz City 5,447 0 701 6,148 136 0 18 154 67 -87 -229.9 -10 -114.9
13 Kabankalan City 483 0 2,833 3,316 12 0 71 83 105 22 -79.0 64 -39.5
14 La Carlota City 83 1,603 0 1,686 2 40 0 42 30 -12 -140.0 9 -70.0
15 Sagay City 0 0 534 534 0 0 13 13 77 64 -16.9 71 -8.4
16 San Carlos City 2,221 0 0 2,221 56 0 0 56 60 4 -93.3 32 -46.7
17 Silay City 192 0 0 192 5 0 0 5 42 37 -11.9 40 -6.018 Bacolod City 5,538 1,344 815 7,697 138 34 20 192 145 -47 -132.4 49 -66.2
REGION : VII - CENTRAL VISAYAS 84,001 2,542 34,971 121,514 2,099 64 875 3,038 3,891 1,776 -54.4 2,557 -34.3
1 Bohol 4,331 764 5,118 10,213 108 19 128 255 667 412 -38.2 540 -19.1
2 Tagbilaran City 7,536 0 2,596 10,132 188 0 65 253 67 -186 -377.6 -60 -188.8
3 Cebu with Bogo, Carcar & Naga 2,132 1,034 6,555 9,721 53 26 164 243 1,217 974 -20.0 1,096 -10.0
4 Danao City 3,164 0 1,090 4,254 79 0 27 106 77 -29 -137.7 24 -68.8
5 Talisay City 1,604 744 0 2,348 40 19 0 59 119 60 -49.6 90 -24.8
6 Toledo City 611 0 0 611 15 0 0 15 114 99 -13.2 107 -6.6
7 Cebu City 20,890 0 8,184 29,074 522 0 205 727 417 -310 -174.3 54 -87.2
8 Lapu-Lapu City 4,381 0 211 4,592 110 0 5 115 259 144 -44.4 202 -22.2
9 Mandaue City 7,269 0 0 7,269 182 0 0 182 165 -17 -110.3 74 -55.2
10 Negros Oriental w/ Guilhunlngan 22,385 0 864 23,249 560 0 22 582 527 -55 -110.4 236 -55.2
11 Bais City 216 0 1,474 1,690 5 0 37 42 48 6 -87.5 27 -43.8
12 Bayawan City 0 0 1,387 1,387 0 0 35 35 80 45 -43.8 63 -21.9
13 Dumaguete City 8,364 0 6,091 14,455 209 0 152 361 55 -306 -656.4 -126 -328.2
14 Tanjay City 346 0 0 346 9 0 0 9 45 36 -20.0 41 -10.0
16 Siquijor 770 0 1,403 2,173 19 0 35 54 34 -20 -158.8 7 -79.4
% change
Number of places available HEIs for SHS in
2017
Number of classrooms available for SHS in HEIs
in 2017 - 100%
Needed
classrooms in
public SHS
without HEIs
Needed
classrooms in
public SHS with
HEIs (100%)
% change
Needed
classrooms in
public SHS with
HEIs (50%)
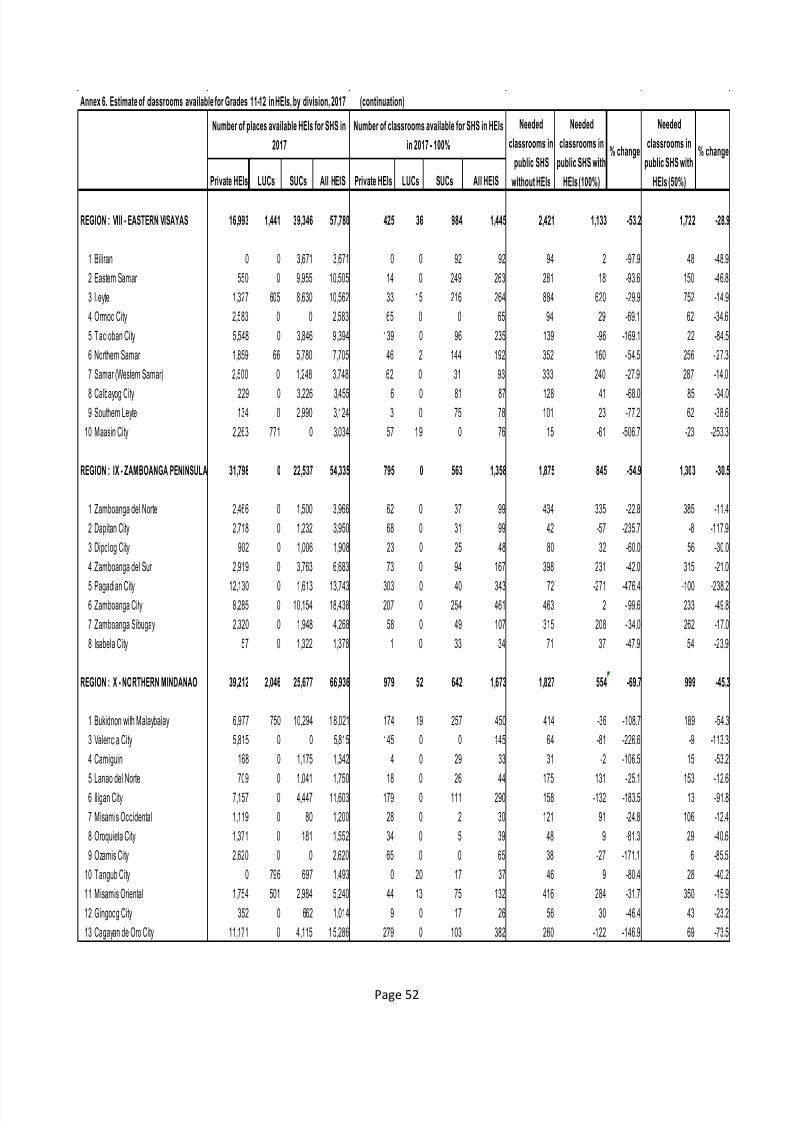
7/27/2019 SHS Absorptive Capacity Study
http://slidepdf.com/reader/full/shs-absorptive-capacity-study 55/57
Page 52
Annex 6. Estimate of classrooms available for Grades 11-12 in HEIs, by division, 2017 (continuation)
Private HEIs LUCs SUCs All HEIS Private HEIs LUCs SUCs All HEIS
REGION : VIII - EASTERN VISAYAS 16,993 1,441 39,346 57,780 425 36 984 1,445 2,421 1,133 -53.2 1,722 -28.9
1 Biliran 0 0 3,671 3,671 0 0 92 92 94 2 -97.9 48 -48.9
2 Eastern Samar 550 0 9,955 10,505 14 0 249 263 281 18 -93.6 150 -46.8
3 Leyte 1,327 605 8,630 10,562 33 15 216 264 884 620 -29.9 752 -14.9
4 Ormoc City 2,583 0 0 2,583 65 0 0 65 94 29 -69.1 62 -34.6
5 Tacloban City 5,548 0 3,846 9,394 139 0 96 235 139 -96 -169.1 22 -84.5
6 Northern Samar 1,859 66 5,780 7,705 46 2 144 192 352 160 -54.5 256 -27.3
7 Samar (Western Samar) 2,500 0 1,248 3,748 62 0 31 93 333 240 -27.9 287 -14.08 Calbayog City 229 0 3,226 3,455 6 0 81 87 128 41 -68.0 85 -34.0
9 Southern Leyte 134 0 2,990 3,124 3 0 75 78 101 23 -77.2 62 -38.6
10 Maasin City 2,263 771 0 3,034 57 19 0 76 15 -61 -506.7 -23 -253.3
REGION : IX - ZAMBOANGA PENINSULA 31,798 0 22,537 54,335 795 0 563 1,358 1,875 845 -54.9 1,303 -30.5
1 Zamboanga del Norte 2,466 0 1,500 3,966 62 0 37 99 434 335 -22.8 385 -11.4
2 Dapitan City 2,718 0 1,232 3,950 68 0 31 99 42 -57 -235.7 -8 -117.9
3 Dipolog City 902 0 1,006 1,908 23 0 25 48 80 32 -60.0 56 -30.0
4 Zamboanga del Sur 2,919 0 3,763 6,683 73 0 94 167 398 231 -42.0 315 -21.0
5 Pagadian City 12,130 0 1,613 13,743 303 0 40 343 72 -271 -476.4 -100 -238.2
6 Zamboanga City 8,285 0 10,154 18,438 207 0 254 461 463 2 - 99.6 233 -49.8
7 Zamboanga Sibugay 2,320 0 1,948 4,268 58 0 49 107 315 208 - 34.0 262 -17.0
8 Isabela City 57 0 1,322 1,378 1 0 33 34 71 37 -47.9 54 -23.9
REGION : X - NORTHERN MINDANAO 39,212 2,046 25,677 66,936 979 52 642 1,673 1,827 554 -69.7 999 -45.3
1 Bukidnon with Malaybalay 6,977 750 10,294 1 8,021 174 19 257 450 414 -36 -108.7 189 -54.3
3 Valencia City 5,815 0 0 5,815 145 0 0 145 64 -81 -226.6 -9 -113.3
4 Camiguin 168 0 1,175 1,342 4 0 29 33 31 -2 -106.5 15 -53.2
5 Lanao del Norte 709 0 1,041 1,750 18 0 26 44 175 131 -25.1 153 -12.6
6 Iligan City 7,157 0 4,447 11,603 179 0 111 290 158 -132 -183.5 13 -91.8
7 Misamis Occidental 1,119 0 80 1,200 28 0 2 30 121 91 -24.8 106 -12.4
8 Oroquieta City 1,371 0 181 1,552 34 0 5 39 48 9 -81.3 29 -40.6
9 Ozamis City 2,620 0 0 2,620 65 0 0 65 38 -27 -171.1 6 -85.5
10 Tangub City 0 796 697 1,493 0 20 17 37 46 9 -80.4 28 -40.2
11 Misamis Oriental 1,754 501 2,984 5,240 44 13 75 132 416 284 -31.7 350 -15.9
12 Gingoog City 352 0 662 1,014 9 0 17 26 56 30 -46.4 43 -23.2
13 Cagayan de Oro City 11,171 0 4,115 1 5,286 279 0 103 382 260 -122 -146.9 69 -73.5
Number of places available HEIs for SHS in
2017
Number of classrooms available for SHS in HEIs
in 2017 - 100%
Needed
classrooms in
public SHS
without HEIs
Needed
classrooms in
public SHS with
HEIs (100%)
% change
Needed
classrooms in
public SHS with
HEIs (50%)
% change
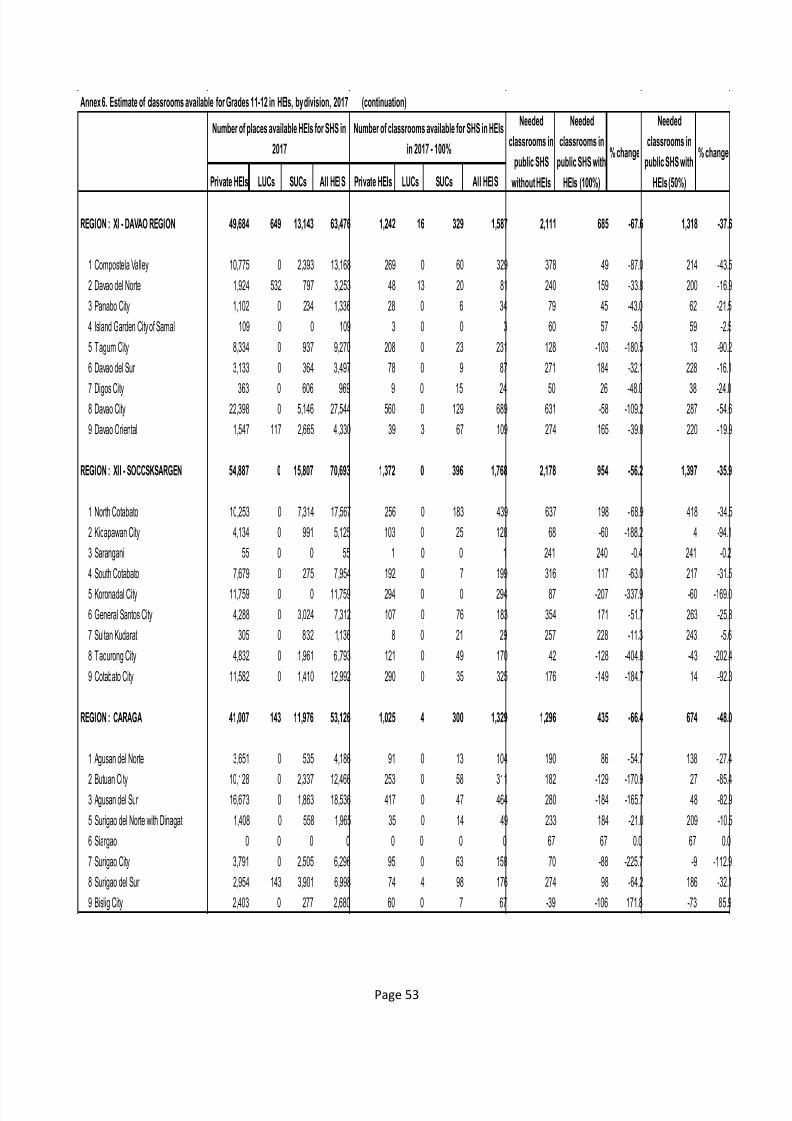
7/27/2019 SHS Absorptive Capacity Study
http://slidepdf.com/reader/full/shs-absorptive-capacity-study 56/57
Page 53
Annex 6. Estimate of classrooms available for Grades 11-12 in HEIs, by division, 2017 (continuation)
Private HEIs LUCs SUCs All HEIS Private HEIs LUCs SUCs All HEIS
REGION : XI - DAVAO REGION 49,684 649 13,143 63,476 1,242 16 329 1,587 2,111 685 -67.6 1,318 -37.6
1 Compostela Valley 10,775 0 2,393 13,168 269 0 60 329 378 49 -87.0 214 -43.5
2 Davao del Norte 1,924 532 797 3,253 48 13 20 81 240 159 -33.8 200 -16.9
3 Panabo City 1,102 0 234 1,336 28 0 6 34 79 45 -43.0 62 -21.5
4 Island Garden City of Samal 109 0 0 109 3 0 0 3 60 57 -5.0 59 -2.5
5 Tagum City 8,334 0 937 9,270 208 0 23 231 128 -103 -180.5 13 -90.2
6 Davao del Sur 3,133 0 364 3,497 78 0 9 87 271 184 -32.1 228 -16.1
7 Digos City 363 0 606 969 9 0 15 24 50 26 -48.0 38 -24.0
8 Davao City 22,398 0 5,146 27,544 560 0 129 689 631 -58 -109.2 287 -54.6
9 Davao Oriental 1,547 117 2,665 4 ,330 39 3 67 109 274 165 -39.8 220 -19.9
REGION : XII - SOCCSKSARGEN 54,887 0 15,807 70,693 1,372 0 396 1,768 2,178 954 -56.2 1,397 -35.9
1 North Cotabato 10,253 0 7,314 17,567 256 0 183 439 637 198 -68.9 418 -34.5
2 Kidapawan City 4,134 0 991 5,125 103 0 25 128 68 -60 -188.2 4 -94.1
3 Sarangani 55 0 0 55 1 0 0 1 241 240 -0.4 241 -0.2
4 South Cotabato 7,679 0 275 7,954 192 0 7 199 316 117 -63.0 217 -31.5
5 Koronadal City 11,759 0 0 11,759 294 0 0 294 87 -207 -337.9 -60 -169.0
6 General Santos City 4,288 0 3,024 7,312 107 0 76 183 354 171 -51.7 263 -25.8
7 Sultan Kudarat 305 0 832 1,136 8 0 21 29 257 228 -11.3 243 -5.6
8 Tacurong City 4,832 0 1,961 6,793 121 0 49 170 42 -128 -404.8 -43 -202.4
9 Cotabato City 11,582 0 1,410 12,992 290 0 35 325 176 -149 -184.7 14 -92.3
REGION : CARAGA 41,007 143 11,976 53,126 1,025 4 300 1,329 1,296 435 -66.4 674 -48.0
1 Agusan del Norte 3,651 0 535 4,186 91 0 13 104 190 86 -54.7 138 -27.4
2 Butuan City 10,128 0 2,337 12,466 253 0 58 311 182 -129 -170.9 27 -85.4
3 Agusan del Sur 16,673 0 1,863 18,536 417 0 47 464 280 -184 -165.7 48 -82.9
5 Surigao del Norte with Dinagat 1,408 0 558 1,965 35 0 14 49 233 184 -21.0 209 -10.5
6 Siargao 0 0 0 0 0 0 0 0 67 67 0.0 67 0.0
7 Surigao City 3,791 0 2,505 6,296 95 0 63 158 70 -88 -225.7 -9 -112.9
8 Surigao del Sur 2,954 143 3,901 6,998 74 4 98 176 274 98 -64.2 186 -32.1
9 Bislig City 2,403 0 277 2,680 60 0 7 67 -39 -106 171.8 -73 85.9
% change
Number of places available HEIs for SHS in
2017
Number of classrooms available for SHS in HEIs
in 2017 - 100%
Needed
classrooms in
public SHS
without HEIs
Needed
classrooms in
public SHS with
HEIs (100%)
% change
Needed
classrooms in
public SHS with
HEIs (50%)
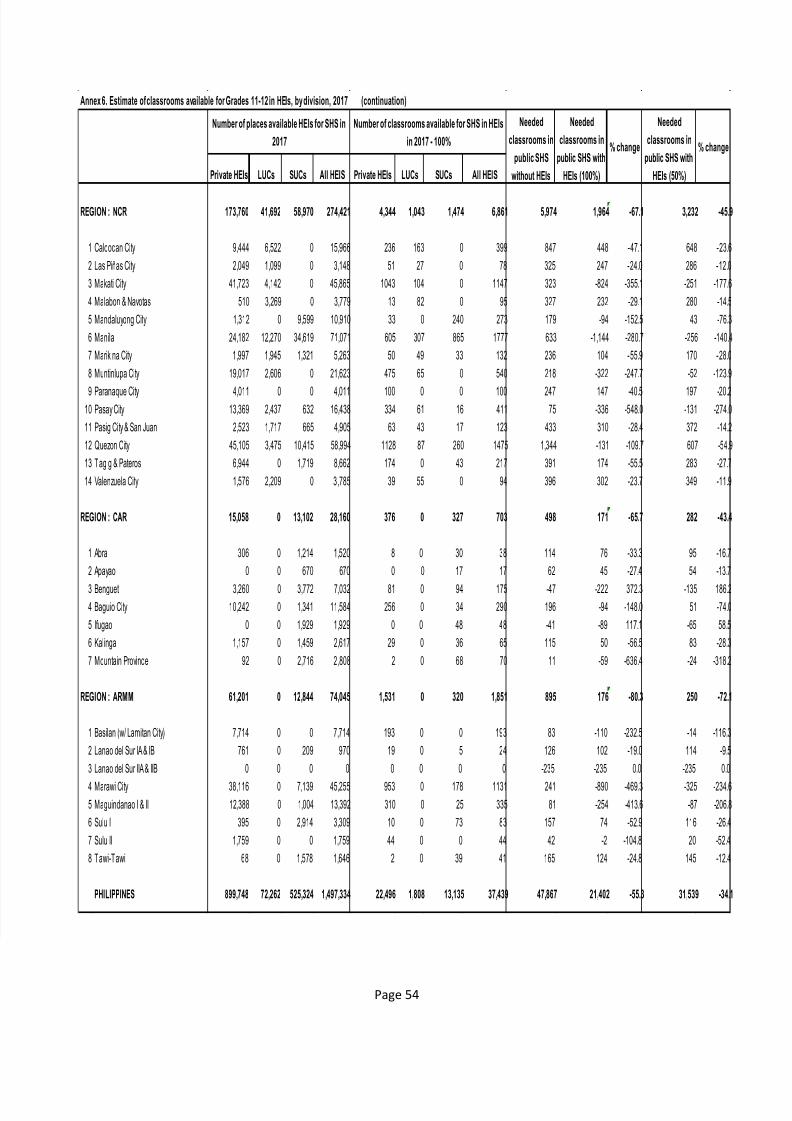
7/27/2019 SHS Absorptive Capacity Study
http://slidepdf.com/reader/full/shs-absorptive-capacity-study 57/57
Annex 6. Estimate of classrooms available for Grades 11-12 in HEIs, by division, 2017 (continuation)
Private HEIs LUCs SUCs All HEIS Private HEIs LUCs SUCs All HEIS
REGION : NCR 173,760 41,692 58,970 274,421 4,344 1,043 1,474 6,861 5,974 1,964 -67.1 3,232 -45.9
1 Caloocan City 9,444 6,522 0 15,966 236 163 0 399 847 448 -47.1 648 -23.6
2 Las Piñas City 2,049 1,099 0 3,148 51 27 0 78 325 247 -24.0 286 -12.0
3 Makati City 41,723 4,142 0 45,865 1043 104 0 1147 323 -824 -355.1 -251 -177.6
4 Malabon & Navotas 510 3,269 0 3,779 13 82 0 95 327 232 -29.1 280 -14.5
5 Mandaluyong City 1,312 0 9,599 10,910 33 0 240 273 179 -94 -152.5 43 -76.3
6 Manila 24,182 12,270 34,619 71,071 605 307 865 1777 633 -1,144 -280.7 -256 -140.4
7 Marikina City 1,997 1,945 1,321 5,263 50 49 33 132 236 104 -55.9 170 -28.0
8 Muntinlupa City 19,017 2,606 0 21,623 475 65 0 540 218 -322 -247.7 -52 -123.99 Paranaque City 4,011 0 0 4,011 100 0 0 100 247 147 -40.5 197 -20.2
10 Pasay City 13,369 2,437 632 16,438 334 61 16 411 75 -336 -548.0 -131 -274.0
11 Pasig City & San Juan 2,523 1,717 665 4,905 63 43 17 123 433 310 -28.4 372 -14.2
12 Quezon City 45,105 3,475 10,415 58,994 1128 87 260 1475 1,344 -131 -109.7 607 -54.9
13 Tagig & Pateros 6,944 0 1,719 8,662 174 0 43 217 391 174 -55.5 283 -27.7
14 Valenzuela City 1,576 2,209 0 3 ,785 39 55 0 94 396 302 -23.7 349 -11.9
REGION : CAR 15,058 0 13,102 28,160 376 0 327 703 498 171 -65.7 282 -43.4
1 Abra 306 0 1,214 1,520 8 0 30 38 114 76 -33.3 95 -16.7
2 Apayao 0 0 670 670 0 0 17 17 62 45 -27.4 54 -13.7
3 Benguet 3,260 0 3,772 7,032 81 0 94 175 -47 -222 372.3 -135 186.2
4 Baguio City 10,242 0 1,341 11,584 256 0 34 290 196 -94 -148.0 51 -74.0
5 Ifugao 0 0 1,929 1,929 0 0 48 48 -41 -89 117.1 -65 58.5
6 Kalinga 1,157 0 1,459 2,617 29 0 36 65 115 50 -56.5 83 -28.3
7 Mountain Province 92 0 2,716 2 ,808 2 0 68 70 11 -59 -636.4 -24 -318.2
REGION : ARMM 61,201 0 12,844 74,045 1,531 0 320 1,851 895 176 -80.3 250 -72.1
1 Basilan (w/ Lamitan City) 7,714 0 0 7,714 193 0 0 193 83 -110 -232.5 -14 -116.3
2 Lanao del Sur IA & IB 761 0 209 970 19 0 5 24 126 102 -19.0 114 -9.53 Lanao del Sur IIA & IIB 0 0 0 0 0 0 0 0 -235 -235 0.0 -235 0.0
4 Marawi City 38,116 0 7,139 45,255 953 0 178 1131 241 -890 -469.3 -325 -234.6
5 Maguindanao I & II 12,388 0 1,004 13,392 310 0 25 335 81 -254 -413.6 -87 -206.8
6 Sulu I 395 0 2,914 3,309 10 0 73 83 157 74 -52.9 116 -26.4
7 Sulu II 1,759 0 0 1,759 44 0 0 44 42 -2 -104.8 20 -52.4
8 Tawi-Tawi 68 0 1,578 1,646 2 0 39 41 165 124 -24.8 145 -12.4
Number of places available HEIs for SHS in
2017
Number of classrooms available for SHS in HEIs
in 2017 - 100%
Needed
classrooms in
public SHS
without HEIs
Needed
classrooms in
public SHS with
HEIs (100%)
% change
Needed
classrooms in
public SHS with
HEIs (50%)
% change