UNIVERSITY OF WISCONSIN SYSTEM SOLID WASTE RESEARCH … · gypsum wallboard in concrete. Scrap...
62
Recycling Opportunity for Gypsum Wallboard in Concrete 2008 Yoon-moon Chun, Tarun R. Naik, and Rudolph N. Kraus Center for By-Products Utilization University of Wisconsin-Milwaukee UNIVERSITY OF WISCONSIN SYSTEM SOLID WASTE RESEARCH PROGRAM
Transcript of UNIVERSITY OF WISCONSIN SYSTEM SOLID WASTE RESEARCH … · gypsum wallboard in concrete. Scrap...
Recycling Opportunity for Gypsum Wallboard in Concrete
2008
Yoon-moon Chun Tarun R Naik and Rudolph N Kraus
Center for By-Products Utilization University of Wisconsin-Milwaukee
UNIVERSITY OF WISCONSIN SYSTEM
SOLID WASTE RESEARCH PROGRAM
Center for By-Products Utilization
RECYCLING OPPORTUNITY FOR GYPSUM WALLBOARD IN CONCRETE
By Yoon-moon Chun Tarun R Naik and Rudolph N Kraus
Report No CBU-2008-01 REP-635 February 2008
Final report submitted to the University of Wisconsin System - Solid Waste Research Program
Department of Civil Engineering and Mechanics College of Engineering and Applied Science THE UNIVERSITY OF WISCONSIN-MILWAUKEE
i
ABSTRACT
This research was conducted to establish mixture proportions for concrete containing
powdered gypsum wallboard and to study the technical economical and performance benefits
of using gypsum wallboard in concrete
Gypsum wallboards (drywall) were obtained from two sources from demolition of existing
drywall and from new construction Concrete mixture proportions and production technologies
were optimized under controlled laboratory conditions
This project showed that up to 60 of cement in a concrete mixture could be successfully
replaced with a blend of powdered gypsum wallboard and Class C fly ash Use of sodium
sulfate (1 of cement + gypsum wallboard + fly ash by mass) as an activator was necessary in
improving the 1-day and 3-day strength of concrete containing gypsum wallboard and Class C
fly ash Compared with reference concrete mixtures (without gypsum wallboard and Class C fly
ash) concrete mixtures made by replacing 30 to 60 of cement (with gypsum wallboard and
Class C fly ash) showed nearly equivalent 7-day compressive strength and equivalent 28-day
compressive strength
A concrete mixture made using 40 cement 10 powdered gypsum wallboard and 50
Class C fly ash showed negligible length-change after expansion due to immersion in lime-
saturated water for one month followed by shrinkage due to drying for approximately four
months at 50 relatively humidity Such concrete mixtures could be used to minimize drying
shrinkage cracking of concrete leading to a much increased durability and performance of
concrete structures
ii
A mortar mixture made using 40 cement 10 powdered gypsum wallboard and 50
Class C fly ash showed much higher resistance to sulfate attack compared with reference mortar
(with 100 cement)
Assuming 80000 tons of gypsum wallboards can be recycled in concrete in Wisconsin with
a potential total value of $24 million in avoided disposal costs of gypsum wallboard $30
million in savings resulting from cement replacement plus $10 million in CO2 credits total
direct economic benefit to Wisconsin that could be generated by wallboard recycling might be
valued at about $42 million each year
iii
TABLE OF CONTENTS
ABSTRACTS i
LIST OF FIGURES v
LIST OF TABLES vii
ACKNOWLEDGMENTS x
CHAPTER 1 INTRODUCTION 1
11 Objectives 1
12 Project Description 1
CHAPTER 2 LITERATURE REVIEW 3
21 Introduction 3
22 Existing Uses for Waste Gypsum Wallboard 4
23 Gypsum in Concrete 6
CHAPTER 3 RESEARCH DESIGN AND TASKS 9
31 Research Design 9
32 Research Tasks 10
CHAPTER 4 MATERIALS 12
41 Portland Cement 12
42 Fly Ash 13
43 Fine Aggregate (Sand) 14
44 Coarse Aggregate 14
45 Water-Reducing Admixture (WRA) 15
46 Gypsum Wallboard 16
CHAPTER 5 SPECIMEN PREPARATION AND TEST METHODS 19
51 Mixing and Specimen Preparation 19
iv
52 Test Methods 20
CHAPTER 6 PRELIMINARY MIXTURES 23
61 Group 1 Preliminary Mixtures 23
62 Group 2 Preliminary Mixtures 26
63 Group 3 Preliminary Mixtures 28
CHAPTER 7 FINAL MIXTURES 32
71 Mixture Proportions 32
72 Time of Initial Setting 33
73 Compressive Strength 34
74 Length Change 37
75 Sulfate Resistance 39
76 Summary 42
CHAPTER 8 ECONOMIC IMPACT ANALYSIS OF FULL-SCALE IMPLEMENTATION 45
CHAPTER 9 CONCLUSIONS 47
CHAPTER 10 REFERENCES 48
v
LIST OF FIGURES
Fig 4-1 Close-Up View of Old Gypsum Wallboard Containing Glass Fibers 17
Fig 4-2 Cut-Pieces of Old Gypsum Wallboard 17
Fig 4-3 Ball-Mill for Pulverizing Cut-Pieces of Gypsum Wallboard 17
Fig 4-4 Old Gypsum Wallboard After Milling and Sieving 17
Fig 4-5 Pieces of ldquoNewrdquo Gypsum Wallboard 17
Fig 4-6 Glass Fibers in New Gypsum Wallboard 17
Fig 4-7 New Gypsum Wallboard After Milling and Sieving 18
Fig 5-1 Consolidation of Concrete Cylinders on a Vibrating Table 20
Fig 5-2 Length-Change Molds with Plastic Liners and Studs 20
Fig 5-3 Finishing the Surface of Length-Change Beams 20
Fig 5-4 Sieving Fresh Concrete to Obtain Mortar for Casting Time of Setting Specimens 20
Fig 5-5 Testing of Cylinder for Compressive Strength 21
Fig 5-6 Testing of Beam for Length Change 21
Fig 5-7 Air Storage of Length-Change Beams After 28 Days of Moist Curing In Saturated Limewater 22
Fig 5-8 Saturated Limewater Containers for Curing Mortar Cubes and Bars 22
Fig 5-9 Saturated Limewater Containing Mortar Cubes and Bars 22
Fig 5-10 Testing of Mortar Cube for Compressive Strength 22
Fig 5-11 Measurement of Mortar Bar 22
Fig 6-1 Efflorescence Appearing on Cylinder of Mixture CFOS-2 Left from Compression Test 25
Fig 6-2 Efflorescence Appearing on Air-Dried Cylinders of CFOS-3 25
Fig 6-3 Efflorescence on a Cylinder of Mixture CFNB-2 Left from Seven-day Compression Test 28
vi
Fig 6-4 Efflorescence on a Cylinder of Mixture CFNB-3 Left from One-day Compression Test 28
Fig 7-1 Compressive Strength of Final Concrete Mixtures Group 1 35
Fig 7-2 Compressive Strength of Final Concrete Mixtures Group 2 35
Fig 7-3 Cracked Cylinders of Concrete Mixtures CFNS-5 and CFNS-6 36
Fig 7-4 Length-Change Specimen of Concrete Mixture CFNS-5 Showing a Crack 38
Fig 7-5 Length Change of Final Concrete Mixtures Group 1 38
Fig 7-6 Length Change of Final Concrete Mixtures Group 2 39
Fig 7-7 Compressive Strength of Mortar Cubes 41
Fig 7-8 Length Change of Mortar Bars in 5 Sodium Sulfate Solution 42
vii
LIST OF TABLES
Table 3-1 Optimum Proportions for Blends of Cementitious Materials Developed in the
Previous Research 9
Table 3-2 Equivalent Proportions for Blends of Cement Class C Fly Ash and Powdered Wallboard 10
Table 4-1 Chemical Composition of Portland Cement 12
Table 4-2 Physical Properties of Portland Cement 13
Table 4-3 Chemical Composition of Fly Ash 13
Table 4-4 Physical Properties of Fly Ash 14
Table 4-5 Properties of Fine Aggregate (Sand) 14
Table 4-6 Gradation of Fine Aggregate (Sand) 14
Table 4-7 Physical Properties of Coarse Aggregate 15
Table 4-8 Gradation of Coarse Aggregate 15
Table 4-9 Properties and Manufacturerrsquos Recommended Dosage Rate of Water-Reducing Admixture 16
Table 4-10 Ingredients of Water-Reducing Admixture 16
Table 5-1 Tests Conducted on Preliminary Concrete Mixtures in Task 2 for Optimization of Mixture Proportions 20
Table 5-2 Tests Conducted on Final Concrete Mixtures and Mortar Mixtures in Task 3 21
Table 6-1 Proportions of Powder Materials Used for Group 1 Preliminary Concrete Mixtures 23
Table 6-2 Mixture Proportions and Fresh Concrete Properties of Group 1 Preliminary Mixtures (SI [Metric] Units) 23
Table 6-3 Mixture Proportions and Fresh Concrete Properties of Group 1 Preliminary Mixtures (Inch-Pound Units) 24
Table 6-4 Compressive Strength of Group 1 Preliminary Concrete Mixtures (MPa) 24
Table 6-5 Compressive Strength of Group 1 Preliminary Concrete Mixtures (psi) 24
Table 6-6 Proportions Powder Materials Used for Group 2 Preliminary Concrete Mixtures 26
viii
Table 6-7 Mixture Proportions and Fresh Concrete Properties of Group 2 Preliminary Mixtures (SI [Metric] Units) 26
Table 6-8 Mixture Proportions and Fresh Concrete Properties of Group 2 Preliminary Mixtures (Inch-Pound Units) 27
Table 6-9 Compressive Strength of Group 2 Preliminary Concrete Mixtures (MPa) 27
Table 6-10 Compressive Strength of Group 2 Preliminary Concrete Mixtures (psi) 28
Table 6-11 Proportions of Powder Materials Used for Group 3 Preliminary Concrete Mixtures29
Table 6-12 Mixture Proportions and Fresh Properties of Group 3 Preliminary Concrete Mixtures (SI [Metric] Units) 29
Table 6-13 Mixture Proportions and Fresh Properties of Group 3 Preliminary Concrete Mixtures (Inch-Pound Units) 30
Table 6-14 Compressive Strength of Group 3 Preliminary Concrete Mixtures (MPa) 31
Table 6-15 Compressive Strength of Group 3 Preliminary Concrete Mixtures (psi) 31
Table 7-1 Proportions of Powder Materials Used for Final Concrete Mixtures 32
Table 7-2 Mixture Proportions and Fresh Concrete Properties of Final Mixtures (SI [Metric] Units) 33
Table 7-3 Mixture Proportions and Fresh Concrete Properties of Final Mixtures (Inch-Pound Units) 33
Table 7-4 Time of Initial Setting of Final Concrete Mixtures 34
Table 7-5 Compressive Strength of Final Concrete Mixtures (MPa) 34
Table 7-6 Compressive Strength of Final Concrete Mixtures (psi) 34
Table 7-7 Length Change of Final Concrete Mixtures () 37
Table 7-8 Mixture Proportions and Flow of Mortar Mixtures 40
Table 7-9 Compressive Strength of Mortar (MPa) 40
Table 7-10 Compressive Strength of Mortar (psi) 40
Table 7-11 Length Change of Mortar Bars () 41
Table 7-12 Proportions of Powder Materials and Properties of Final Concrete Mixtures 43
ix
Table 7-13 Proportions of Powder Materials and Length Change in Sulfate Solution of Mortar Mixtures 43
Table 7-14 Summary of Proportions and Properties of Selected Final Concrete Mixtures and Mortar Mixtures 44
x
ACKNOWLEDGMENTS
The authors express their deep gratitude to the University of Wisconsin System ndash Solid
Waste Research Program (UWS-SWRP) for providing funding for this project The authors are
also grateful for the active interest in this recycling project and timely input and support
provided by Eileen Norby of UWS-SWRP and Karen Kollmann of WPS Dedication and
interest of Jenna Kunde of WasteCap Wisconsin in recycling wallboards helped in successfully
completing this project We are thankful for the portland cement supplied by Lafarge North
America the fly ash supplied by Wisconsin Public Service Corporation and the gypsum
wallboards provided by the Physical Plant of University of Wisconsin-Milwaukee (UWM)
Thanks are extended to the staff of the UWM Center for By-Products Utilization for their
contributions to materials preparation and data collection
The UWM Center for By-Products Utilization was established in 1988 with a generous grant
from the Dairyland Power Cooperative La Crosse Wisc Madison Gas and Electric Company
Madison Wisc National Minerals Corporation St Paul Minn Northern States Power
Company Eau Claire Wisc We Energies Milwaukee Wisc Wisconsin Power and Light
Company Madison Wisc and Wisconsin Public Service Corporation Green Bay Wisc Their
financial support and additional grants and support from Manitowoc Public Utilities Manitowoc
Wisc is gratefully acknowledged
1
CHAPTER 1 INTRODUCTION
11 Objectives
The objective of this research was to establish the technical and economical benefits of using
gypsum wallboard in concrete Scrap gypsum wallboard represents 20 (by mass) of the waste
from new construction and remodeling of homes and offices in Wisconsin Recent research
projects conducted at the UW-Milwaukee Center for By-Products Utilization (UWM-CBU)
showed that a cementitious material containing gypsum can be successfully used to make
concrete more durable [Wu and Naik 2002 2003] Built upon the experience and results gained
from previous projects this proposed research was designed to prove the hypothesis that gypsum
wallboard could be a source of a beneficial ingredient for making concrete and also possibly for
making other cement-based construction materials (such as bricks blocks paving stone precast
concrete products and architectural panels flowable slurry and other similar materials for
concrete construction)
12 Project Description
Construction and demolition waste accounts for nearly 13 of the waste deposited in
municipal solid waste landfills in Wisconsin and about 15 of the construction and demolition
waste is gypsum wallboard Clearly there is a need to find beneficial uses for this relatively
large amount of ldquowasterdquo Gypsum is a compound of calcium and sulfate Traditionally it is
accepted that an inclusion of a large amount of sulfate in concrete would cause expansion and
cracking of concrete [Kumar and Monteiro 1993 Neville 1995] But recently UWM-CBU
established a technology of using a gypsum-containing cementitious material (from coal-burning
power plants) to successfully replace a significant amount of cement in concrete while
2
improving the properties of concrete such as compressive strength and resistance to freezing-
and-thawing saltchloride penetration alkali-silica reaction and sulfate-attack [Wu and Naik
2002 2003] In this project a mixture of powdered gypsum wallboard Class C fly ash and
cement was used as a cementitious material and the mixture proportions were optimized through
production and testing of concrete
The recently developed technology of using a gypsum-containing cementitious material in
concrete was utilized as a steppingstone for the development of a technology for using gypsum
wallboard from construction and demolition debris Previous research projects conducted at
UWM-CBU showed that spray-dryer ash (a cementitious material from coal-combustion) can
replace a significant amount of portland cement while improving concrete properties such as
compressive strength and the resistance to such destructive mechanisms as freezing-and-
thawing saltchloride penetration alkali-silica reaction and even expansive sulfate-attack This
was a novel discovery because such ash contains relatively large amounts of sulfite (SO3) and
sulfate (SO4) which had been considered to be harmful if present in large quantities in concrete
Spray-dryer ash is a type of coal fly ash intermixed with reaction products of sprayed
limestone powder (CaCO3) and sulfuric oxides from coal combustion [ICF Northwest 1987] It
is composed of up to about 75 coal fly ash calcium sulfite hemi-hydrate (CaSO3middotfrac12H2O)
calcium sulfate di-hydrate (CaSO4middot2H2O gypsum) and other inorganic compounds On the
other hand when gypsum and Class C fly ash are mixed at an approximate ratio of 12 the
mixture is similar to the spray-dryer ash in oxide composition (eg CaO and SO3) In view of
the successful use of spray-dryer ash for improving concrete properties [Wu and Naik 2002
2003] the research team expected that a mixture of powdered gypsum wallboard and Class C fly
ash would also bring about similar improvements in concrete properties
3
CHAPTER 2 LITERATURE REVIEW
21 Introduction
One of the most common materials used in the construction of homes apartments and office
buildings in the US is gypsum wallboard Gypsum wallboard is primarily used as a surface
layer on the interior of walls partitions and ceilings in many buildings to provide a surface that
can be either painted or wall-papered and for fire resistance and sound reduction In some cases
it may also be used in exterior sheathing applications or in concrete formwork Gypsum
wallboard is also commonly referred to as drywall since the need for plaster is eliminated
[Merritt and Ricketts 2001] Over 30 billion square feet or 28 billion square meters of gypsum
wallboard is manufactured each year in the US [Wolkowski 2003] The primary material used
for making wallboard is either natural gypsum which is mined or synthetic gypsum which is
produced from the flue gas desulfurization process at coal-burning power plants The gypsum is
mixed into a paste using admixtures both solid and liquid spread between two layers of paper
and then cut into specific lengths [Lafarge Group]
The use of the gypsum wallboard in buildings generates a significant amount of waste from
new construction as well as from construction repairs remodeling and demolition Gypsum
wallboard is estimated to be 20 of the waste from new and residential construction [WI-DNR
2005] It is estimated that one pound of wallboard waste is generated for each square foot of
construction area or 5 kgm2 This would generate approximately one ton of waste wallboard in
construction of a typical home Disposal costs from a typical home in Wisconsin would cost the
homeowner or builder over $700 in disposal costs for construction wastes Therefore assuming
that the 20 of the waste is from wallboard this translates to disposal cost of about $140 for one
4
ton of waste wallboard resulting from construction of a typical home In Dane County alone the
cost for disposal of waste wallboard in 1992 was estimated to be $150000 to $215000
[Wolkowski 2003]
There have been challenges associated with the disposal of waste gypsum wallboard in
landfills Gypsum wallboard is an uncompressible material and the tipping fees associated with
wallboard disposal fluctuate Also there have been reports of hydrogen sulfide gas and metal
sulfide issues at landfills [Drywallrecyclingorg Krocak et al 2000] Hydrogen sulfide can form
in landfills under certain anaerobic moisture and temperature conditions Sulfur reducing
bacteria break down the gypsum in the wallboard that generates hydrogen sulfide gas Citizen
lawsuits and health issues have resulted from these emissions [EPA 2004] Therefore there is a
need to develop environmentally friendly and safe alternative recycling uses for waste gypsum
wallboard that will keep this material out of landfills
22 Existing Uses for Waste Gypsum Wallboard
Use of waste gypsum wallboard has been extensively studied as an agricultural fertilizer and
soil amendment Plants require both calcium and sulfur elements contained in gypsum for
proper growth [Wolkowski 2003] Natural gypsum has been used for over 200 years as a
fertilizer in agriculture [Krocak et al 2000] Since the wallboard is primarily gypsum use of it
as a fertilizer and soil amendment is a logical conclusion for application
The Wisconsin Department of Natural Resources (WI-DNR) has established guidelines for
using waste gypsum wallboard as a fertilizer and soil amendment [WI-DNR 2005] These
guidelines outline the proper handling and application of waste wallboard for use as a substitute
for agricultural lime In order to use the waste gypsum wallboard for this application the
wallboard must not be treated (no paint joint compound screws or other contaminants) Type
5
ldquoXrdquo wallboard (which contains approximately one percent of fiberglass by weight) is allowed for
this use Demolition debris is typically not allowed for this use Prior to application the
wallboard is crushed to a maximum size of 127 mm (frac12-inch) with most passing a 150-microm (No
100) sieve The amount of this recycled gypsum to be applied to the soil is determined by
establishing the existing soil chemistry specifically the need for sulfur content and the specific
crop needs for sulfur
Wolkowski [2003] also studied the difference between agricultural gypsum and crushed
wallboard used as fertilizer on growth of potatoes and corn There were no significant
differences between use of the agricultural gypsum and the ground wallboard on crop
performance Wolkowski also evaluated the use of gypsum wallboard as a fertilizer for alfalfa
[Wolkowski 1998] There were no specific harmful effects noted but several concerns were
raised when using wallboards at high application rates These concerns were due to possible
plant deficiencies in magnesium and reduced pH in soil
McCall [1993] also described the results of a project that used waste wallboard as a source of
agricultural gypsum This project was to develop a commercial process to grind and sieve the
waste wallboard to remove the paper and then use the fines as the final product In this test 60
tons of waste wallboard was used The company participating in the trial Royster-Clark
indicated an interest in continuing the technology and developing a business plan Krocak et al
[2000] described other uses for gypsum wallboard in applications such as in animal bedding or
composting The wallboard was used to absorb moisture in animal bedding applications and to
adjust the carbonnitrogen ratio and to increase porosity of the compost when used in
composting Reindl [2002] conducted an extensive study on existing uses of gypsum wallboard
6
Applications described include agricultural gypsum plaster absorbents adhesives cement
production composting remanufacture into wallboard and numerous other uses
Most of these applications have been developed and attempts have been made to implement
the technology on a larger scale However the problem of disposal for waste gypsum wallboard
remains Therefore the use of waste gypsum wallboard in an application such as the one studied
in this project in ready-mixed concrete is needed because ready-mixed concrete plants and
locations which can use waste gypsum wallboard are ubiquitous
23 Gypsum in Concrete
Gypsum (calcium sulfate di-hydrate CaSO42H2O) is an essential ingredient used in the
manufacture of portland cement as a set regulator [Wu and Naik 2001 2002 2003] Cement
clinkers are interground with about 5 gypsum Without gypsum portland cement (specifically
tricalcium aluminate (3CaOAl2O3 or C3A) in the cement) will react too rapidly with water
making the cement harden too fast and becoming useless [Kumar and Monteiro 1993] Thus a
small amount of gypsum is an integral part of portland cement as a set regulator Powdered
gypsum wallboard can perform this same function in portland cement On the other hand use of
a relatively large amount of gypsum can cause false set (stiffness) of fresh concrete mixture due
to the rapid formation of large crystals of gypsum [Kumar and Monteiro 1993 Mindness et al
2002] The false set when recognized as such can be easily disrupted by further mixing
Gypsum itself is non-hydraulic which means that gypsum by itself is not stable in water and can
be washed away Portland cement is hydraulic and portland cement sets and hardens in water
and is stable in water
It was reported that gypsum improved the reactivity of fly ash and the strength of fly ash
concrete [Naik and Ramme ndash unpublished research results from 1983 Aimin and Sarkar 1991
7
Ma et al 1995 Wu and Naik 2002 2003] It was also reported that use of gypsum (above and
beyond the amount inherent in portland cement) significantly improved sulfate resistance of
concrete made with Class C fly ash [Prusinski and Carrasquillo 1995] It was explained that the
gypsum supplied more than enough sulfate to react with all the C3A and other reactive
aluminates in concrete at early ages so that such aluminates would not be available to render
concrete susceptible to sulfate attack later It has also been reported that sodium sulfate
(Na2SO4) was effective in improving sulfate resistance and early-age strength of concrete
containing Class C fly ash [Freeman and Carrasquillo 1995] Wu and Naik [2002 2003]
reported that blended cements consisting of portland cement Class C fly ash and spray-dryer
ash outperformed plain portland cement in terms of the resistance of concrete to saltchloride
penetration sulfate attack and alkali-silica reaction A chemical activator was used to increase
the early-age reactivity of blended cements [Wu and Naik 2003]
Gypsum is one of the major materials present in spray-dryer ash Use of sulfate-bearing
materials such as gypsum can increase the formation of needlelike crystals of ettringite (calcium
sulfoaluminate hydrate) at early ages and can contribute to strength of concrete If on the other
hand the alumina-to-sulfate ratio increases later due to depletion of sulfates ettringite may
become unstable and decompose to monosulfate hydrate [Kumar and Monteiro 1993] In the
presence of calcium hydroxide when sulfate ions get into concrete later monosulfate hydrate is
converted back to ettringite Since this is an expansive reaction it can damage hardened (rigid)
concrete Now it is known and established [Wu and Naik 2002 2003] that the use of gypsum
can stabilize ettringite and that the replacement of cement by fly ash reduces the amounts of
aluminate and free calcium hydroxide in concrete This means that the quantities of susceptible
components (monosulfate hydrate and calcium hydroxide) in concrete could be minimized
8
through optimum use of gypsum and fly ash A chemical activator is helpful in boosting the
early-age strength of concrete containing these materials [Wu and Naik 2003]
Potentially there is another benefit of using gypsum in concrete When calcium hydroxide is
absent calcium sulfoaluminate cement is non-expansive and results in high early strength of
concrete [Pera and Ambroise 2004] Calcium sulfoaluminate cement has been used at the
UWM-CBU for a recent investigation for reduction of shrinkage of concrete and for high early
strength [Naik et al 2007]
9
CHAPTER 3 RESEARCH DESIGN AND TASKS
31 Research Design
It was planned that the proportions of cement powdered wallboard Class C fly ash would be
optimized based on a judicious selection of the proportions from past research results published
by UWM-CBU with proven laboratory performance [Wu and Naik 2002 2003] The optimum
proportions for blends of cementitious materials developed in the previous research on spray-
dryer ash are as shown below in Table 3-1
Table 3-1 Optimum Proportions for Blends of Cementitious Materials Developed in the Previous Research
Designation of blends of cementitious materials
Type I cement (mass )
Class C fly ash (mass )
Spray-dryer ash (mass )
Specialty activator
(mass ) Control (Type I) 100 0 0 0
BC40 60 20 20 2 BC60 40 30 30 2 BC80 20 20 60 4
Percent of total cementitious materials By considering that spray-dryer ash is ldquosimilarrdquo to a mixture consisting of 1 part of gypsum
and 2 parts of Class C fly ash the previously established optimum proportions approximately
translate into the proportions shown below in Table 3-2 These proportions are informative and
provided a conceptual basis for this new research using powdered-wallboard From these
proportions it was expected that gypsum wallboard could make up about 10 to 20 of the
cementitious materials for this first bench-scale proof for this wallboard project
10
Table 3-2 Equivalent Proportions for Blends of Cement Class C Fly Ash and Powdered Wallboard
Designation of blends of cementitious materials
Type I cement (mass )
Class C fly ash (mass )
Powdered gypsum
wallboard (mass )
Specialty activator
(mass )
Control (Type I) 100 0 0 0 BC40eq 60 33 7 2 BC60eq 40 50 10 2 BC80eq 20 60 20 4
Percent of total cementitious materials
32 Research Tasks
This research progressed through the following tasks
Task 1 Characterization of materials (portland cement gypsum wallboard Class C fly ash
aggregates and other concrete-making materials)
Task 2 Optimization of the proportions of portland cement powdered wallboard and Class
C fly ash through production of a series concrete mixtures and testing
Task 3 Production of concrete mixtures using optimum proportions of cementitious
materials for evaluation of slump retention initial setting strength and length change due to
shrinkage Mortar mixtures were made for evaluation of sulfate resistance in accordance with
ASTM
Previous research activities at UWM-CBU show that gypsum-containing coal ash could be
used for minimizing shrinkage-cracking that naturally occurs in concrete Therefore the length
change was included to evaluate the autogenous- and drying-shrinkage compensating potential
of this new cementitious material containing powdered gypsum wallboard It was known that
the use of a relatively large amount of gypsum can cause expansion in concrete at very early
11
ages but the concrete can safely accommodate such expansion at early ages If the net length
change due to early expansion and later drying shrinkage of concrete is negligible then such a
characteristic can help to minimize the overall cracking leading to enhanced durability of such
concretes
12
CHAPTER 4 MATERIALS
41 Portland Cement
ASTM Type I portland cement obtained from Lafarge North America was used in this
research The chemical composition and physical properties of the cement used are presented in
Table 4-1 and Table 4-2 respectively along with the requirements of ASTM Standard
Specification for Portland Cement [ASTM C 150] These data were provided by the cement
producer The cement met the standard chemical and physical requirements of ASTM C 150
Table 4-1 Chemical Composition of Portland Cement Item ( by mass) Cement
results Standard requirements of ASTM C
150 for Type I cement Silicon dioxide SiO2 202 hellip
Aluminum oxide Al2O3 45 hellip Ferric oxide Fe2O3 26 hellip Calcium oxide CaO 642 hellip
Magnesium oxide MgO 25 60 maximum Sulfur trioxide SO3 24 30 maximum when C3A le 8
35 maximum when C3A gt 8 Loss on ignition 14 30 maximum
Insoluble residue 04 075 maximum Free lime 15 hellip
Tricalcium silicate C3S 67 hellip Tricalcium aluminate C3A 8 hellip
Total alkali as sodium oxide 053 hellip
13
Table 4-2 Physical Properties of Portland Cement ASTM Property Cement
results Standard requirements of
ASTM C 150 for Type I cementC 185 Air content of mortar (volume ) 6 12 maximum C 204 Fineness (specific surface) by Blaine air-
permeability apparatus (m2kg) 364 280 minimum
C 151 Autoclave expansion () 007 080 maximum C 109 Compressive strength of Cement Mortars (psi)
1 day 2080 hellip 3 days 3590 1740 minimum 7 days 4400 2760 minimum 28 days 5620 hellip
C 191 Initial time of setting by Vicat needle (minutes) 105 Between 45 to 375 C 188 Density (gcm3) 315 hellip
42 Fly Ash
For this research ASTM Class C fly ash was obtained from Wisconsin Public Service
Corporationrsquos Weston Power Plant near Wausau Wisconsin The chemical composition and
physical properties of the fly ash are shown in Table 4-3 and Table 4-4 respectively along with
the requirements of ASTM Specification for Coal Fly Ash and Raw or Calcined Natural
Pozzolan for Use in Concrete [ASTM C 618] These data were provided by the fly ash producer
The fly ash met the requirements of ASTM C 618
Table 4-3 Chemical Composition of Fly Ash Item ( by mass) Fly ash results
Requirements of ASTM C
618 for Class C fly ash Silicon dioxide SiO2 409 hellip
Aluminum oxide Al2O3 188 hellip Ferric oxide Fe2O3 65 hellip
SiO2 + Al2O3 + Fe2O3 662 50 minimum Calcium oxide CaO 213 hellip
Magnesium oxide MgO 45 hellip Sulfur trioxide SO3 12 50 maximum
Sodium oxide Na2O 14 hellip Potassium oxide K2O 08 hellip
14
Table 4-4 Physical Properties of Fly Ash Property Fly ash
results Requirements of ASTM C 618
for Class C fly ash Strength activity index ( of Control)
7 days 28 days
107
Not available
75 minimum at either 7 or 28
days Water requirement ( of Control) 94 105 maximum
Autoclave expansion () 004 Between -080 and +080 Density (gcm3) 266 hellip
43 Fine Aggregate (Sand)
Natural sand was used as fine aggregate in this project The properties of fine aggregate are
shown in Table 4-5 Sieve analysis results are presented in Table 4-6 along with the grading
requirements of ASTM Standard Specification for Concrete Aggregates [ASTM C 33] The
sand met the requirements of ASTM C 33
Table 4-5 Properties of Fine Aggregate (Sand) ASTM Property Test result C 128 Bulk specific gravity on oven-dry basis 262
Bulk specific gravity on SSD basis 266 Apparent specific gravity 272 SSD Absorption () 137
C 29 Bulk density (kgm3) 1790 Bulk density (lbft3) 112 Void content () 33
Saturated surface-dry
Table 4-6 Gradation of Fine Aggregate (Sand) Amounts finer than each sieve ( by mass) Fineness
modulus 38-in 95 mm
No 4 475 mm
No 8 236 mm
No 16 118 mm
No 30 600 microm
No 50 300 microm
No 100 150 microm
Sand results 27 100 99 87 71 50 18 4 Requirements of ASTM
C 33 23 - 31 100 95 - 100 80 - 100 50 - 85 25 - 60 5 - 30 0 - 10
44 Coarse Aggregate
The coarse aggregate used in this research was crushed quartzite stone The physical
properties and the gradation of the coarse aggregate are shown in Table 4-7 and Table 4-8
15
respectively along with the requirements of ASTM C 33 The coarse aggregate met the
requirements of ASTM C 33 The coarse aggregate had a nominal maximum size of 34 inch
and met the grading requirements for AASHTO No 67
Table 4-7 Physical Properties of Coarse Aggregate ASTM Item Coarse
aggregate results
Requirements of ASTM C 33
C 117 Materials finer than 75microm by washing () 05 10 maximum C 127 Bulk specific gravity on oven-dry basis 265 hellip
Bulk specific gravity on SSD basis 266 hellip Apparent specific gravity 268 hellip SSD Absorption () 042 hellip
C 29 Bulk density (kgm3) 1550 hellip Bulk density (lbft3) 97 hellip Void content () 42 hellip
Saturated surface-dry
Table 4-8 Gradation of Coarse Aggregate Amounts finer than each sieve ( by mass) 250 mm
1-in 190 mm
34-in 125 mm
12-in 95 mm 38-in
475 mm No 4
236 mm No 8
Coarse aggregate results 100 95 55 31 3 2 Requirements of ASTM C 33 for Size No
67 100 90 - 100 hellip 20 - 55 0 - 10 0 - 5
45 Water-Reducing Admixture (WRA)
Water-reducing admixture (WRA) was used in several concrete mixtures The WRA was an
aqueous solution of modified lignosulfonates The WRA was a Type A admixture per ASTM
Standard Specification for Chemical Admixtures for Concrete [ASTM C 494] Table 4-9
presents the properties and manufacturerrsquos recommended dosage rate of the WRA Table 4-10
shows the ingredients of the WRA
16
Table 4-9 Properties and Manufacturerrsquos Recommended Dosage Rate of Water-Reducing Admixture
Chemical family name
Specific gravity
Water content ()
pH Dosage rate (mL100 kg of cementitious
materials)
Dosage rate (fl oz100 lb of cementitious
materials) Aqueous solution of
lignosulfonate amine and compound carbohydrates
11 - 12 ~ 50 65 - 75 190 - 375 3 - 6
Table 4-10 Ingredients of Water-Reducing Admixture Ingredient Chemical Abstracts Service
(CAS) Registry Number Maximum percent
Sodium o-phenylphenol 000132-27-4 lt 1 Triethanolamine 000102-71-6 1-10
Triethanolamine acetate 014806-72-5 1-10
46 Gypsum Wallboard
Gypsum wallboard was obtained from two locations on the campus of University of
Wisconsin-Milwaukee (Fig 4-1 to 4-7) One source was pieces of drywall from demolition of
existing walls and was designated as ldquoOldrdquo The label on the Old drywall showed that it was
ldquoType SCXrdquo drywall The other source was cuttings of drywall from new construction and was
designated as ldquoNewrdquo It was ldquoType Xrdquo drywall Both the Old and New gypsum wallboards
contained glass fibers Type X New gypsum wallboard appeared to contain more glass fibers
than Type SCX Old gypsum wallboard Paper covering of gypsum wallboard was removed as
much as possible and gypsum wallboard was ground into powder using a laboratory mechanical
ball-mill at UWM-CBU
17
Fig 4-1 Close-Up View of Old Gypsum
Wallboard Containing Glass Fibers
Fig 4-2 Cut-Pieces of Old Gypsum Wallboard
Fig 4-3 Ball-Mill for Pulverizing Cut-Pieces of
Gypsum Wallboard
Fig 4-4 Old Gypsum Wallboard After Milling
and Sieving
Fig 4-5 Pieces of ldquoNewrdquo Gypsum Wallboard
Fig 4-6 Glass Fibers in New Gypsum Wallboard
18
Fig 4-7 New Gypsum Wallboard After Milling
and Sieving
19
CHAPTER 5 SPECIMEN PREPARATION AND TEST
METHODS
51 Mixing and Specimen Preparation
Test specimens of concrete were prepared and cured in accordance with the ASTM Standard
Practice for Making and Curing Concrete Test Specimens in the Laboratory [ASTM C 192]
The concrete mixer used in this project was an electric-power driven revolving drum tilting
mixer
The cast specimens were removed from their molds 24 plusmn 4 hours after casting The
specimens were then moist cured in a moist room at a temperature of 23 plusmn 2degC (73 plusmn 35degF) and
a relative humidity of not less than 95 except for length-change specimens which were stored
in saturated limewater until the age of 28 days and then stored in air at a temperature of 23 plusmn 2degC
(73 plusmn 35degF) and a relative humidity of 50 plusmn 4
Mortar cubes and bars for sulfate resistance test were cured in 23degC (instead of in 35degC water
specified in ASTM C 1012 due to difficulty in sealing fresh specimens) until the cubes reached a
compressive strength of 20 MPa (2900 psi) The specimens were cured in a moist-enclosure
until the age of 24 hours and then in saturated limewater
Photographs for making test specimens are shown below Fig 5-1 to 5-4
20
Fig 5-1 Consolidation of Concrete Cylinders
on a Vibrating Table
Fig 5-2 Length-Change Molds with Plastic
Liners and Studs
Fig 5-3 Finishing the Surface of Length-
Change Beams
Fig 5-4 Sieving Fresh Concrete to Obtain
Mortar for Casting Time of Setting Specimens
52 Test Methods
The tests conducted on preliminary concrete mixtures are summarized below in Table 5-1
The tests conducted on final concrete mixtures and mortar mixtures are summarized in Table
5-2
Table 5-1 Tests Conducted on Preliminary Concrete Mixtures in Task 2 for Optimization of Mixture Proportions
Test ASTM 0-day 1-day 7-day 28-day Slump C 143 x Density C 138 x
Air content by the pressure method
C 231 x
Compressive strength C 39 x x x
21
Table 5-2 Tests Conducted on Final Concrete Mixtures and Mortar Mixtures in Task 3 Test ASTM 0-day 1-day 3-day 7-day 28-day 91-day
Slump and slump retention C 143 x Density C 138 x
Air content by the pressure method
C 231 x
Compressive strength C 39 x x x x x Time of initial setting C 403 x
Length change C 157 Start Sulfate resistancedagger C 1012
Slump was measured again 30 minutes after completion of concrete mixing dagger Test started when accompanying cubes reached compressive strength of 20 MPa (2900 psi) Compressive strength of concrete was determined by testing three 100-mm diameter times 200-
mm length (4 times 8 in) cylinders at each test age for each mixture Length change specimens
consisted of three 75 times 75 times 285 mm (3 times 3 times 1125 in) beams for each concrete mixture For
each mortar mixture six mortar prisms were cast for measuring length change in 5 sodium
sulfate solution to evaluate their sulfate resistance Some prisms broke in the process of
separating from molds and could not be tested
Photographs of testing are shown below Fig 5-5 to 5-11
Fig 5-5 Testing of Cylinder for Compressive
Strength
Fig 5-6 Testing of Beam for Length Change
22
Fig 5-7 Air Storage of Length-Change Beams
After 28 Days of Moist Curing In Saturated Limewater
Fig 5-8 Saturated Limewater Containers for
Curing Mortar Cubes and Bars
Fig 5-9 Saturated Limewater Containing
Mortar Cubes and Bars
Fig 5-10 Testing of Mortar Cube for
Compressive Strength
Fig 5-11 Measurement of Mortar Bar
23
CHAPTER 6 PRELIMINARY MIXTURES
A series of preliminary concrete mixtures were produced in order to establish mixture
proportions for final concrete mixtures
61 Group 1 Preliminary Mixtures
Group 1 preliminary concrete mixtures were made using ldquoOldrdquo gypsum wallboard The
mixture proportions of Group 1 concrete mixtures are shown in Table 6-1 (powder materials)
Table 6-2 (SI units) and Table 6-3 (inch-pound units) Mixtures CFOS-1 CFOS-2 and CFOS-3
were made with old gypsum wallboard using the proportions developed in Table 3-2 which was
based on previous UWM-CBU research projects Sodium sulfate was used as an activator
Table 6-1 Proportions of Powder Materials Used for Group 1 Preliminary Concrete Mixtures Mixture Designation C-1 CFO
S-1 CFOS-2
CFOS-3
CFO-1
CFO-2
CF-1 CO-1
Laboratory mixture designation Ref-1 Old-2 Old-3 Old-4 Old-5 Old-6 Old-7 Old-8Cement (mass of Cm) 100 60 40 20 60 40 67 93 Fly Ash (mass of Cm) 0 33 50 60 33 50 33 0
Old Gypsum Wallboard (mass of Cm) 0 7 10 20 7 10 0 7 Sodium Sulfate (mass of Cm) 0 2 2 4 0 0 0 0
Cm Cementitious materials (Cement + Fly Ash + Gypsum Wallboard)
Table 6-2 Mixture Proportions and Fresh Concrete Properties of Group 1 Preliminary Mixtures (SI [Metric] Units)
Mixture Designation C-1 CFOS-1
CFOS-2
CFOS-3
CFO-1
CFO-2
CF-1 CO-1
Cement (kgm3) 358 214 143 71 215 143 246 334 Class C Fly Ash Weston (kgm3) 0 118 179 213 119 179 121 0
Powdered Gypsum Wallboard Old (kgm3) 0 25 36 71 25 36 0 25 Water (kgm3) 171 161 162 155 163 159 151 164
Sand SSD (kgm3) 849 848 843 834 850 847 872 847 Crushed Stone 19-mm max SSD (kgm3) 1020 1020 1010 1010 1020 1020 1050 1020
Sodium Sulfate Na2SO4 (kgm3) 0 72 71 142 0 0 0 0 Water-Cementitious Ratio WCm 048 045 045 044 045 044 041 046
Slump (mm) 65 30 40 40 55 65 65 25 Air Content () 13 18 18 21 19 22 14 20
Air Temperature (degC) 23 23 23 24 23 23 23 23 Concrete Temperature (degC) 21 22 22 21 22 22 22 21
Density (kgm3) 2400 2390 2380 2370 2390 2380 2440 2390SSD Saturated surface-dry
24
Table 6-3 Mixture Proportions and Fresh Concrete Properties of Group 1 Preliminary Mixtures (Inch-Pound Units)
Mixture Designation C-1 CFOS-1
CFOS-2
CFOS-3
CFO-1
CFO-2
CF-1 CO-1
Cement (lbyd3) 603 361 240 120 362 241 414 562 Class C Fly Ash Weston (lbyd3) 0 199 301 358 200 302 204 0
Powdered Gypsum Wallboard Old (lbyd3) 0 42 60 120 42 60 0 42 Water (lbyd3) 288 270 273 261 274 268 255 276
Sand SSD (lbyd3) 1430 1430 1420 1400 1430 1430 1470 1430Crushed Stone 34 in max SSD (lbyd3) 1720 1720 1710 1700 1720 1710 1760 1710
Sodium Sulfate Na2SO4 (lbyd3) 0 12 12 24 0 0 0 0 Water-Cementitious Ratio WCm 048 045 045 044 045 044 041 046
Slump (in) 2 12 1 14 1 12 1 12 2 14 2 12 2 12 1 Air Content () 13 18 18 21 19 22 14 20
Air Temperature (degF) 74 74 74 75 73 73 73 73 Concrete Temperature (degF) 70 71 71 70 72 72 71 70
Density (lbft3) 150 149 149 148 149 149 152 149 SSD Saturated surface-dry Test results for compressive strength of Group 1 concrete mixtures are shown in Table 6-4
(in MPa) and Table 6-5 (in psi) Mixtures CFOS-1 and CFOS-2 were strong enough to be
demolded at one day and showed quite high compressive strength values of 347 MPa (5040 psi)
and 330 MPa (4790 psi) at seven days Mixture CFOS-3 was also strong enough to be
demolded at one day
Table 6-4 Compressive Strength of Group 1 Preliminary Concrete Mixtures (MPa) Age (days) C-1 CFO
S-1 CFOS-2
CFOS-3
CFO-1
CFO-2
CF-1 CO-1
1 106 59 39 23 28 07dagger 60 88 7 308 347 330 hellip 291 245 330 26528 396 456 429 hellip 428 379 480 429
dagger Result from testing only one cylinder all other results are from testing three cylinders each Cylinders had cracked on their own
Table 6-5 Compressive Strength of Group 1 Preliminary Concrete Mixtures (psi) Age (days) C-1 CFO
S-1 CFOS-2
CFOS-3
CFO-1
CFO-2
CF-1 CO-1
1 1540 850 560 340 400 100dagger 870 12707 4470 5040 4790 hellip 4220 3550 4780 385028 5740 6620 6220 hellip 6210 5490 6960 6220
dagger Result from testing only one cylinder all other results are from testing three cylinders each Cylinders had cracked on their own
25
Fig 6-1 is a photograph of a cylinder of Mixture CFOS-2 It was noted that white material
was appearing on a CFOS-2 cylinder obtained after compression test
Fig 6-2 shows a photograph of cylinders from Mixture CFOS-3 Mixture CFOS-3
developed a significant amount of efflorescence and cylinders cracked by themselves before
reaching the age of seven days
Mixtures CFO-1 and CFO-2 were made using the same proportions of cement fly ash and
old gypsum wallboard as Mixtures CFOS-1 and CFOS-2 but without using sodium sulfate
Mixtures CFO-1 and CFO-2 were weaker than Mixtures CFOS-1 and CFOS-2 especially at the
age of one day Mixture CFO-2 was so soft that two out of three cylinders broke during
demolding at the age of one day
Mixture CF-1 was made using only cement and fly ash Mixture CO-1 was made using only
cement and old gypsum wallboard Compared with Mixture C-1 Mixture CO-1 showed a lower
strength at 1 and 7 days and a higher strength at 28 days
Fig 6-1 Efflorescence Appearing on Cylinder
of Mixture CFOS-2 Left from Compression Test
Fig 6-2 Efflorescence Appearing on Air-Dried
Cylinders of CFOS-3
26
62 Group 2 Preliminary Mixtures
Group 2 preliminary concrete mixtures were made using ldquoNewrdquo gypsum wallboard Sodium
bicarbonate was used in the majority of the Group 2 mixtures for evaluation as an activator
Table 6-6 Table 6-7 and Table 6-8 show mixture proportions of Group 2 concrete mixtures
Proportions of Mixtures C-1 and CF-1 of Group 1 are shown as well for easier comparison
Unlike sodium sulfate use of sodium bicarbonate increased water demand of fresh concrete
resulting in high water-cementitious ratios for the desired workability
Table 6-6 Proportions Powder Materials Used for Group 2 Preliminary Concrete Mixtures Mixture Designation C-1 CF-1 CN-1 CFN-
1 CB-1 CFB-
1 CNB-
1 CFNB-1
CFNB-2
CFNB-3
Laboratory mixture designation Ref-1 Old-7 New-1
New-2
Ref-2 FA-1 New-3
New-4
New-5
New-6
Cement (mass of Cm) 100 67 93 60 100 67 93 60 40 53 Fly Ash (mass of Cm) 0 33 0 33 0 33 0 33 50 33
New Gypsum Wallboard (mass of Cm)
0 0 7 7 0 0 7 7 10 14
Sodium Bicarbonate (mass of Cm) 0 0 0 0 2 2 2 2 2 2 Cm Cementitious materials (Cement + Fly Ash + Gypsum Wallboard)
Table 6-7 Mixture Proportions and Fresh Concrete Properties of Group 2 Preliminary Mixtures (SI [Metric] Units)
Mixture Designation C-1 CF-1 CN-1 CFN-1
CB-1 CFB-1
CNB-1
CFNB-1
CFNB-2
CFNB-3
Cement (kgm3) 358 246 331 215 354 241 318 210 140 186 Class C Fly Ash Weston (kgm3) 0 121 0 119 0 119 0 116 175 115
Powdered Gypsum Wallboard New (kgm3)
0 0 25 25 0 0 24 25 35 49
Water (kgm3) 171 151 181 153 189 164 199 176 166 171 Sand SSD (kgm3) 849 872 840 850 841 857 809 830 827 825
Crushed Stone 19-mm max SSD (kgm3)
1020 1050 1010 1020 1010 1030 971 999 994 994
Sodium Bicarbonate NaHCO3 (kgm3) 0 0 0 0 71 72 68 70 70 70 Water-Cementitious Ratio WCm 048 041 051 043 053 045 058 050 047 049
Slump (mm) 65 65 45 50 70 55 95 65 65 65 Air Content () 13 14 18 19 14 12 21 18 23 22
Air Temperature (degC) 23 23 22 22 23 23 23 23 23 23 Concrete Temperature (degC) 21 22 21 20 23 23 23 22 22 23
Density (kgm3) 2400 2440 2390 2380 2400 2420 2330 2360 2340 2350SSD Saturated surface-dry
27
Table 6-8 Mixture Proportions and Fresh Concrete Properties of Group 2 Preliminary Mixtures (Inch-Pound Units)
Mixture Designation C-1 CF-1 CN-1 CFN-1
CB-1 CFB-1
CNB-1
CFNB-1
CFNB-2
CFNB-3
Cement (lbyd3) 603 414 557 362 596 407 536 354 236 313 Class C Fly Ash Weston (lbyd3) 0 204 0 200 0 201 0 195 295 194
Powdered Gypsum Wallboard New (lbyd3)
0 0 42 42 0 0 40 41 59 82
Water (lbyd3) 288 255 305 258 318 276 336 296 279 289 Sand SSD (lbyd3) 1430 1470 1410 1430 1420 1440 1360 1400 1390 1390
Crushed Stone 34 in max SSD (lbyd3)
1720 1760 1700 1720 1700 1730 1640 1680 1670 1670
Sodium Bicarbonate NaHCO3 (lbyd3) 0 0 0 0 12 12 12 12 12 12 Water-Cementitious Ratio WCm 048 041 051 043 053 045 058 050 047 049
Slump (in) 2 12 2 12 1 34 2 2 34 2 14 3 34 2 12 2 12 2 12Air Content () 13 14 18 19 14 12 21 18 23 22
Air Temperature (degF) 74 73 72 72 73 74 73 74 73 73 Concrete Temperature (degF) 70 71 69 68 74 73 73 71 72 74
Density (lbft3) 150 152 149 149 150 151 145 147 146 146 SSD Saturated surface-dry Table 6-9 and Table 6-10 show test results for compressive strength of Group 2 concrete
mixtures When sodium bicarbonate was used in concrete containing new gypsum wallboard
the 1-day compressive strength of concrete improved but the 28-day compressive strength was
reduced When sodium bicarbonate was used in concrete made with cement (without fly ash or
gypsum) and in concrete made with cement and fly ash (without gypsum) the compressive
strength of concrete was reduced at all test ages of 1 7 and 28 days Unlike Mixture CFOS-3
from Group 1 the test cylinders did not develop any cracking
Table 6-9 Compressive Strength of Group 2 Preliminary Concrete Mixtures (MPa) Age (days) C-1 CF-1 CN-1 CFN-
1 CB-1 CFB-
1 CNB-
1 CFNB-1
CFNB-2
CFNB-3
1 106 60 74 32 90 57 76 57 36 48 7 308 330 236 323 228 202 231 283 265 21528 396 480 347 407 294 299 327 354 400 315
28
Table 6-10 Compressive Strength of Group 2 Preliminary Concrete Mixtures (psi) Age (days) C-1 CF-1 CN-1 CFN-
1 CB-1 CFB-
1 CNB-
1 CFNB-1
CFNB-2
CFNB-3
1 1540 870 1080 470 1310 820 1100 830 520 690 7 4470 4780 3430 4690 3310 2930 3350 4110 3850 312028 5740 6960 5030 5900 4270 4330 4740 5130 5800 4570
Fig 6-3 and Fig 6-4 show cylinders of some of the Group 2 concrete mixtures
Efflorescence on the surface of concrete was noted
Fig 6-3 Efflorescence on a Cylinder of Mixture CFNB-2 Left from Seven-day Compression Test
Fig 6-4 Efflorescence on a Cylinder of Mixture CFNB-3 Left from One-day Compression Test
63 Group 3 Preliminary Mixtures
Group 3 preliminary concrete mixtures were made with ldquoNewrdquo gypsum wallboard and using
half as much sodium sulfate as the original planned see Table 3-2 Mixture CFNS-6 was made
with only one-quarter of the sodium sulfate planned see Table 3-2
Table 6-11 to Table 6-13 show mixture proportions of Group 3 concrete mixtures Mixture
CFNS-1-1 and CFNS-1-2 were twin mixtures made using identical proportions They used the
same proportions of cement fly ash and gypsum wallboard as Mixture CFOS-2 of Group 1
except the source of gypsum wallboard and the amount of sodium sulfate
29
Mixtures CFNS-2-1 and CFNS-2-2 were also twin mixtures made using the same proportions
of cement fly ash and gypsum wallboard as Mixture CFOS-3 of Group 1 except the source of
gypsum wallboard and the amount of sodium sulfate
Efflorescence was observed on leftover concrete from Mixtures CFNS-1-1 CFNS-1-2
CFNS-2-1 CFNS-2-2 and CFNS-6
Table 6-11 Proportions of Powder Materials Used for Group 3 Preliminary Concrete Mixtures Mixture Designation C-3 CFNS-
1-1 CFNS-
1-2 CFNS-
2-1 CFNS-
2-2 CFNS-
6 Laboratory mixture designation Ref-4 New-
10 New-
11 New-
12 New-
13 New-
17 Cement (mass of Cm) 100 40 40 20 20 20 Fly Ash (mass of Cm) 0 50 50 60 60 60
New Gypsum Wallboard (mass of Cm) 0 10 10 20 20 20 Sodium Sulfate (mass of Cm) 0 1 1 2 2 1
Cm Cementitious materials (Cement + Fly Ash + Gypsum Wallboard)
Table 6-12 Mixture Proportions and Fresh Properties of Group 3 Preliminary Concrete Mixtures (SI [Metric] Units)
Mixture Designation C-3 CFNS-1-1
CFNS-1-2
CFNS-2-1
CFNS-2-2
CFNS-6
Cement (kgm3) 360 146 147 72 73 73 Class C Fly Ash Weston (kgm3) 0 182 184 217 220 218
Powdered Gypsum Wallboard New (kgm3) 0 36 37 72 73 73 Water (kgm3) 163 164 160 165 145 155
Sand SSD (kgm3) 853 854 861 848 862 855 Crushed Stone 19-mm max SSD (kgm3) 1030 1040 1050 1030 1050 1030
Sodium Sulfate Na2SO4 (kgm3) 0 36 37 72 73 36 Water-Cementitious Ratio WCm 045 045 044 046 039 043
Slump (mm) 50 50 55 40 45 25 Air Content () 18 hellip hellip hellip hellip hellip
Air Temperature (degC) 23 23 24 23 23 24 Concrete Temperature (degC) 22 hellip hellip hellip hellip hellip
Density (kgm3) 2400 2420 2440 2410 2430 2410 SSD Saturated surface-dry
30
Table 6-13 Mixture Proportions and Fresh Properties of Group 3 Preliminary Concrete Mixtures (Inch-Pound Units)
Mixture Designation C-3 CFNS-1-1
CFNS-1-2
CFNS-2-1
CFNS-2-2
CFNS-6
Cement (lbyd3) 606 245 247 122 124 122 Class C Fly Ash Weston (lbyd3) 0 307 309 365 371 367
Powdered Gypsum Wallboard New (lbyd3) 0 61 62 122 124 122 Water (lbyd3) 274 276 269 278 244 261
Sand SSD (lbyd3) 1440 1440 1450 1430 1450 1440 Crushed Stone 34 in max SSD (lbyd3) 1730 1750 1760 1730 1760 1740
Sodium Sulfate Na2SO4 (lbyd3) 0 6 6 12 12 6 Water-Cementitious Ratio WCm 045 045 044 046 039 043
Slump (in) 2 2 2 14 1 12 1 34 1 Air Content () 18 hellip hellip hellip hellip hellip
Air Temperature (degF) 74 74 76 74 73 76 Concrete Temperature (degF) 72 hellip hellip hellip hellip hellip
Density (lbft3) 150 151 152 150 151 150 SSD Saturated surface-dry Table 6-14 and Table 6-15 show the test results for compressive strength of Group 3 concrete
mixtures The strength of Mixtures CFNS-1-1 and CFNS-1-2 were not significantly lower than
that of Mixture CFOS-2 Also the strength of Mixtures CFNS-2-1 and CFNS-2-2 were not
significantly lower than that of Mixture CFOS-3 The strength of Mixtures CFNS-1-1 CFNS-1-
2 CFNS-2-1 and CFNS-2-2 were quite acceptable
Upon careful inspection it was noted that cylinders of Mixture CFNS-6 cracked by
themselves before reaching the age of seven days Cylinders of Mixtures CFNS-2-1 and CFNS-
2-2 must have cracked as well
31
Table 6-14 Compressive Strength of Group 3 Preliminary Concrete Mixtures (MPa) Age (days) C-3 CFNS-
1-1 CFNS-
1-2 CFNS-
2-1 CFNS-
2-2 CFNS-
6 1 117 23Dagger 22 19 19 12Dagger 7 303 247dagger 258dagger 96dagger 85dagger hellip 28 359 hellip hellip hellip hellip hellip
Dagger Average from testing two cylinders dagger Result from testing one cylinder The rest are averages from three tests Cylinders had cracked on their own
Table 6-15 Compressive Strength of Group 3 Preliminary Concrete Mixtures (psi) Age (days) C-3 CFNS-
1-1 CFNS-
1-2 CFNS-
2-1 CFNS-
2-2 CFNS-
6 1 1690 330Dagger 320 270 270 180Dagger 7 4390 3580dagger 3740dagger 1390dagger 1240dagger hellip 28 5210 hellip hellip hellip hellip hellip
Dagger Average from testing two cylinders dagger Result from testing one cylinder The rest are averages from three tests Cylinders had cracked on their own Based on the results of preliminary mixing and testing of concrete it was decided to make
final mixture CFNS-4 using the mixture proportions of Mixtures CFNS-1-1 and CFNS-1-2
Final mixture CFNS-5 was made using the mixture proportions of Mixtures CFNS-2-1 and
CFNS-2-2
32
CHAPTER 7 FINAL MIXTURES
In total eight final concrete mixtures were made to evaluate the slump retention time of
initial setting compressive strength and length change of concrete In addition mortar bars
were made for evaluation of sulfate resistance
71 Mixture Proportions
Table 7-1 presents the proportions of powder materials used for final concrete mixtures The
mixtures were made in two groups Group 1 Mixtures C-2 CN-2 CFN-2 and CFN-3 were
made using up to 20 fly ash and 20 powdered wallboard with water-reducing admixture and
without sodium sulfate Group 2 Mixtures Ref-5 CFNS-3 CFNS-4 and CFNS-5 were made
using up to 60 fly ash 20 powdered wallboard 2 sodium sulfate and without water-
reducing admixture Sodium sulfate was added as powder to a concrete mixture
Table 7-1 Proportions of Powder Materials Used for Final Concrete Mixtures Mixture Designation C-2 CN-2 CFN-
2 CFN-
3 C-4 CFN
S-3 CFNS-4
CFNS-5
Laboratory mixture designation Ref-3 New-7
New-8
New-9
Ref-5 New-14
New-15
New-16
Cement (mass of Cm) 100 90 70 60 100 60 40 20 Fly Ash (mass of Cm) 0 0 20 20 0 33 50 60
New Gypsum Wallboard (mass of Cm) 0 10 10 20 0 7 10 20 Sodium Sulfate (mass of Cm) 0 0 0 0 0 1 1 2
Cm Cementitious materials (Cement + Fly Ash + Gypsum Wallboard) The mixture proportions and fresh properties of the main concrete mixtures are presented in
Table 7-2 (in SI units) and Table 7-3 (in inch-pound units) To evaluate retention of slump
slump was measured twice (1) immediately after mixing was done and (2) 30 minutes later In
general the concrete mixtures retained their workability
33
Table 7-2 Mixture Proportions and Fresh Concrete Properties of Final Mixtures (SI [Metric] Units) Mixture Designation C-2 CN-2 CFN-
2 CFN-
3 C-4 CFN
S-3 CFNS-4
CFNS-5
Cement (kgm3) 362 316 249 212 365 217 144 71 Class C Fly Ash Weston (kgm3) 0 0 71 71 0 119 180 213
Powdered Gypsum Wallboard New (kgm3) 0 35 35 71 0 25 36 71 Water (kgm3) 164 164 170 153 163 154 153 157
Sand SSD (kgm3) 856 830 840 835 861 854 852 839 Crushed Stone 19-mm max SSD (kgm3) 1030 999 1010 1010 1030 1030 1020 1010
Sodium Sulfate Na2SO4 (kgm3) 0 0 0 0 0 36 36 71 Water-Reducing Admixture (Lm3) 0 103 104 104 0 0 0 0 Water-Cementitious Ratio WCm 045 047 048 043 045 043 042 044
Slump (mm) 55 50 40 30 30 40 45 25 Slump 30 minutes later (mm) 30 40 25 20 40 30 15 15
Air Content () 18 37 26 32 14 22 15 17 Air Temperature (degC) 23 24 23 24 23 23 23 24
Concrete Temperature (degC) 23 23 23 25 24 24 25 25 Density (kgm3) 2410 2340 2380 2350 2420 2400 2390 2370
SSD Saturated surface-dry
Table 7-3 Mixture Proportions and Fresh Concrete Properties of Final Mixtures (Inch-Pound Units)
Mixture Designation C-2 CN-2 CFN-2
CFN-3
C-4 CFNS-3
CFNS-4
CFNS-5
Cement (lbyd3) 610 532 419 357 614 366 243 120 Class C Fly Ash Weston (lbyd3) 0 0 120 119 0 201 303 359
Powdered Gypsum Wallboard New (lbyd3) 0 59 59 119 0 43 61 120 Water (lbyd3) 276 276 287 257 274 259 257 264
Sand SSD (lbyd3) 1440 1400 1410 1410 1450 1440 1430 1410Crushed Stone 34 in max SSD (lbyd3) 1730 1680 1700 1690 1740 1730 1720 1700
Sodium Sulfate Na2SO4 (lbyd3) 0 0 0 0 0 6 6 12 Water-Reducing Admixture (fl ozyd3) 0 265 269 268 0 0 0 0
Water-Cementitious Ratio WCm 045 047 048 043 045 043 042 044Slump (in) 2 14 2 1 12 1 14 1 14 1 12 1 34 1
Slump 30 minutes later (in) 1 14 1 12 1 34 1 12 1 14 12 12 Air Content () 18 37 26 32 14 22 15 17
Air Temperature (degF) 73 75 74 75 74 74 74 75 Concrete Temperature (degF) 73 74 74 77 75 76 77 77
Density (lbft3) 150 146 148 146 151 150 149 148 SSD Saturated surface-dry
72 Time of Initial Setting
Table 7-4 presents test results of the time of initial setting final concrete mixtures It took
about twice as long for the mixtures containing fly ash and powdered gypsum wallboard to reach
34
initial setting as their reference concrete mixtures It is well known that concrete mixtures
containing large amount of fly ash may show delayed setting
Table 7-4 Time of Initial Setting of Final Concrete Mixtures Mixture Designation C-2 CN-2 CFN-
2 CFN-
3 C-4 CFN
S-3 CFNS-4
CFNS-5
Time of Initial Setting (hours) 48 72 114 120 47 98 118 105
73 Compressive Strength
Compressive strength test results for final concrete mixtures are shown in Table 7-5 (in
MPa) Table 7-6 (in psi) Fig 7-1 and Fig 7-2
Table 7-5 Compressive Strength of Final Concrete Mixtures (MPa) Age (days) C-2 CN-2 CFN-
2 CFN-
3 C-4 CFN
S-3 CFNS-4
CFNS-5
1 168 111 42 39 159 58 38 24 3 301 197 174 132 302 237 178 79 7 354 232 265 154 347 301 297 12528 448 285 414 211 408 415 420 hellip 91 508 419 501 289 515 443 497 hellip
Cylinders had already cracked on their own before testing started
Table 7-6 Compressive Strength of Final Concrete Mixtures (psi) Age (days) C-2 CN-2 CFN-
2 CFN-
3 C-4 CFN
S-3 CFNS-4
CFNS-5
1 2430 1610 610 560 2310 840 550 350 3 4360 2860 2520 1910 4380 3440 2580 11407 5140 3370 3850 2240 5040 4370 4310 1810
28 6500 4140 6000 3060 5920 6020 6090 hellip 91 7370 6070 7270 4190 7470 6430 7210 hellip
Cylinders had already cracked on their own before testing started
35
0
10
20
30
40
50
60
1 10 100
Age (days)
Com
pres
sive
Str
engt
h (M
Pa)
0
1000
2000
3000
4000
5000
6000
7000
8000
(psi
)
Ref-3New-7New-8New-9
Fig 7-1 Compressive Strength of Final Concrete Mixtures Group 1
The mixtures CN-2 CFN-2 and CFN-3 showed lower compressive strength than C-2
Mixture CFN-2 showed structural-grade strength of 265 MPa (3850 psi) at seven days and a
relatively high compressive strength of 41 MPa (6000 psi) at 28 days Mixture CN-2 showed
structural-grade strength of 285 MPa (4140 psi) at 28 days
0
10
20
30
40
50
60
1 10 100
Age (days)
Com
pres
sive
Str
engt
h (M
Pa)
0
1000
2000
3000
4000
5000
6000
7000
8000
(psi
)
Ref-5New-14New-15New-16
Fig 7-2 Compressive Strength of Final Concrete Mixtures Group 2
36
As early as at seven days the mixtures CFNS-3 and CFNS-4 showed structural-grade
strength of 301 MPa (4370 psi) and 297 MPa (4310 psi) This is noteworthy considering the
fact that Mixtures CFNS-3 and CFNS-4 were made by replacing 40 and 60 of cement with
blends of fly ash and powdered gypsum wallboard At the age of 28 days the mixtures CFNS-3
and CFNS-4 reached compressive strength of 415 MPa (6020 psi) and 420 MPa (6090 psi) and
became as strong as Mixture Ref-5
The cylinders made from Mixture CFNS-5 cracked on their own before reaching the age of
seven days (Fig 7-3) This was attributed to an excessive expansive reaction resulting from use
of the particular proportions of cement fly ash powdered gypsum wallboard and sodium sulfate
in Mixture CFNS-5 Mixture CFNS-6 was made using half as much sodium sulfate (1 of
cementitious materials) as CFNS-5 nonetheless cylinders made from Mixture CFNS-6 cracked
before reaching the age of seven days
Fig 7-3 Cracked Cylinders of Concrete Mixtures CFNS-5 and CFNS-6
37
74 Length Change
Test results for length change of final concrete mixtures are shown in Table 7-7 Fig 7-5
and Fig 7-6
Table 7-7 Length Change of Final Concrete Mixtures () Age (days) C-2 CN-2 CFN-2 CFN-3 C-4 CFNS-
3 CFNS-
4 CFNS-
5 1 0 0 0 0 0 0 0 0 3 -0001 0010 0015 0018 0000 0006 0041 0359 7 -0003 0013 0031 0036 0004 0005 0039 1708
28 0004 0026 0033 0116 0002 0010 0043 hellip 32 -0010 0009 0012 0098 -0007 -0007 0030 hellip 35 -0015 0003 0009 0089 -0013 -0013 0025 hellip 42 -0022 -0003 -0002 0077 -0018 -0020 0020 hellip 56 -0028 -0020 -0004 0057 -0024 -0028 0014 hellip 84 -0033 -0027 -0010 0037 -0031 -0035 0011 hellip 140 -0036 -0035 -0017 0027 -0035 -0035 0006 hellip
Specimens had cracked on their own All of the concrete mixtures made with powdered gypsum wallboard showed higher
expansion than their reference concrete mixtures during immersion in saturated limewater
Mixture CFN-3 containing 20 fly ash and 20 powdered gypsum wallboard showed a large
expansion (0120) Specimens made from Mixture CFNS-5 containing 60 fly ash and 20
powdered gypsum wallboard showed excessive expansion and they cracked before reaching the
age of seven days (Fig 7-4)
38
Fig 7-4 Length-Change Specimen of Concrete
Mixture CFNS-5 Showing a Crack
-004
-002
000
002
004
006
008
010
012
0 30 60 90 120 150
Age (days)
Leng
th C
hang
e (
)
Ref-3New-7New-8New-9
Fig 7-5 Length Change of Final Concrete Mixtures Group 1
During drying Mixture CN-2 and CFN-3 made by using high proportions of powdered
gypsum wallboard to fly ash shrunk by greater extents than Mixture C-2 At the age of 140
days the net shrinkage of Mixture CN-2 was 0035 which was approximately the same as that
of C-2 0036 Mixture CFN-3 showed a net expansion of 0027 at 140 day Mixture CFN-2
shrunk by approximately the same amount as Mixture C-2 resulting in a net shrinkage of
0017 at 140 days
39
-004
-002
000
002
004
006
008
010
012
0 30 60 90 120 150
Age (days)
Leng
th C
hang
e (
)
Ref-5New-14New-15New-16
Fig 7-6 Length Change of Final Concrete Mixtures Group 2
The length change of Mixture CFNS-3 (made with 60 cement 33 fly ash and 7
powdered gypsum wallboard) was approximately the same as that of Mixture Ref-5 Mixture
CFNS-4 (made with 40 cement 50 fly ash and 10 powdered gypsum wallboard) showed a
relatively large expansion (0043) during immersion in saturated limewater and shrunk during
drying as much as it had expanded resulting in very small net expansion of 0006 at the age of
140 days This concrete mixture could be used to minimize drying shrinkage cracking of
concrete Mixture CFNS-4 could be used to minimize drying shrinkage cracking of concrete
75 Sulfate Resistance
Mortar cubes and bars were made using the same proportions of cement fly ash and gypsum
wallboard as the final concrete mixtures Ref-5 CFNS-3 and CFNS-4 No mortar mixture was
made using the powder-materials proportions of concrete mixture CFNS-5 because it was
anticipated that such mortar would crack
Table 7-8 shows the proportions of the mortar mixtures produced
40
Table 7-8 Mixture Proportions and Flow of Mortar Mixtures Mixture Designation C-c C-b CFNS-1c CFNS-1b CFNS-2c CFNS-2b
Laboratory mixture designation C-2 cube C-2 bar N-3 cube N-3 bar N-4 cube N-4 barCement (mass of Cm) 100 100 60 60 40 40 Fly Ash (mass of Cm) 0 0 33 33 50 50
New Gypsum Wallboard (mass of Cm) 0 0 7 7 10 10 Sodium Sulfate (mass of Cm) 0 0 1 1 1 1
Cement (g) 500 740 300 444 200 296 Class C Fly Ash Weston (g) 0 0 165 2442 250 370
Powdered Gypsum Wallboard New (g) 0 0 35 518 50 74 Sodium Sulfate Na2SO4 (g) 0 0 5 74 5 76
Water (g) 242 359 216 3204 200 2967 Water-Cementitious Ratio WCm 0484 0485 0432 0433 0400 0401
Graded Standard Sand (g) 1375 2035 1375 2035 1375 2035 Flow (mm) 190 hellip 185 hellip 191 hellip
Cm Cementitious materials (Cement + Fly Ash + Gypsum Wallboard) Table 7-9 and Table 7-10 show test results for the compressive strength of mortar mixtures
It took approximately 15 days for Mixture C-c to attain a compressive strength of 20 MPa
(2900 psi) For Mixture N-3 it took 47 days and for Mixture N-4 7 days
Table 7-9 Compressive Strength of Mortar (MPa) Age (days) C-c CFNS-1c CFNS-2c
1 148 45 11 4 314 174 111 5 hellip 212 hellip
5125 hellip hellip 167 7 hellip hellip 197 24 hellip hellip 250 28 396 316
Note These results are averages obtained from testing two cubes for each mixture at each test age
Table 7-10 Compressive Strength of Mortar (psi) Age (days) C-c CFNS-1c CFNS-2c
1 2140 650 160 4 4550 2530 1610 5 hellip 3070 hellip
5125 hellip hellip 2420 7 hellip hellip 2850 24 hellip hellip 3630 28 5750 4580 hellip
Note These results are averages obtained from testing two cubes at each test age for each mixture
41
0
5
10
15
20
25
30
35
40
45
0 5 10 15 20 25 30Age (days)
Com
pres
sive
Str
engt
h (p
si)
0
1000
2000
3000
4000
5000
6000
(MP
a)
C-2N-3N-4
Fig 7-7 Compressive Strength of Mortar Cubes
Once the mixture attained the specified compressive strength of 20 MPa (2900 psi) the
mortar bars were immersed in a 5 sodium sulfate solution and length change of the bars were
measured after specified periods to assess sulfate resistance of mortar mixtures Table 7-11 and
Fig 7-8 show test results for length change of mortar bars A larger expansion implies a lower
resistance of mortar mixture to sulfate attack and a smaller expansion implies a higher resistance
to sulfate attack
Table 7-11 Length Change of Mortar Bars () Age after immersion in 5 sodium sulfate
solution (days) C-b CFNS-1b CFNS-2b
0 0 0 0 7 0007 0016 0006 14 0013 0024 0009 21 0016 0028 0009 28 0020 0033 0009 42 0027 0044 0011 56 0034 0063 0010
Number of specimens tested C-b five N-1-b six and N-2-b three
42
000
001
002
003
004
005
006
007
0 7 14 21 28 35 42 49 56 63
Days after immersion in Na2SO4 solution
Len
gth
Cha
nge
()
C-bCFNS-1bCFNS-2b
Fig 7-8 Length Change of Mortar Bars in 5 Sodium Sulfate Solution
After 56 days of immersion in sodium sulfate solution Mixture C-b (Control) showed an
expansion of approximately 0034 Mixture N-3 (made with 33 fly ash and 7 powdered
gypsum wallboard and 1 sodium sulfate) shows an expansion of 0063 which was
approximately 19 times that of Mixture C-b Mixture N-4 (made with 50 fly ash 10
powdered gypsum wallboard and 1 sodium sulfate) showed an expansion of 0010 which is
significantly lower than that of Mixture C-b (Control) This means that Mixture N-4 possesses
significantly higher resistance to sulfate attack than Mixture C-b Importantly the expansion of
mortar bars made from Mixture N-4 stabilized after 14 days of immersion in sodium sulfate
solution
76 Summary
Table 7-12 shows a summary of proportions of powder materials and properties of final
concrete mixtures Table 7-13 shows a summary of proportions and length change in sulfate
solution of mortar mixtures
43
Table 7-12 Proportions of Powder Materials and Properties of Final Concrete Mixtures Mixture Designation C-2 CN-2 CFN-2 CFN-3 C-4 CFNS-
3 CFNS-
4 CFNS-
5 Cement (mass of Cm) 100 90 70 60 100 60 40 20 Fly Ash (mass of Cm) 0 0 20 20 0 33 50 60
New Gypsum Wallboard (mass of Cm) 0 10 10 20 0 7 10 20 Sodium Sulfate (mass of Cm) 0 0 0 0 0 1 1 2
Time of Initial Setting (hours) 48 72 114 120 47 98 118 105 Compressive Strength (MPa)
1-day 168 111 42 39 159 58 38 24 3-day 301 197 174 132 302 237 178 79 7-day 354 232 265 154 347 301 297 125
28-day 448 285 414 211 408 415 420 hellip 91-day 508 419 501 289 515 443 497 hellip
Compressive Strength (psi) 1-day 2430 1610 610 560 2310 840 550 350 3-day 4360 2860 2520 1910 4380 3440 2580 1140 7-day 5140 3370 3850 2240 5040 4370 4310 1810
28-day 6500 4140 6000 3060 5920 6020 6090 hellip 91-day 7370 6070 7270 4190 7470 6430 7210 hellip
Length Change () 1-day 0 0 0 0 0 0 0 0 7-day -0003 0013 0031 0036 0004 0005 0039 1708
28-day 0004 0026 0033 0116 0002 0010 0043 hellip 140-day -0036 -0035 -0017 0027 -0035 -0035 0006 hellip
Cm Cementitious materials (Cement + Fly Ash + Gypsum Wallboard) Specimens had cracked on their own
Table 7-13 Proportions of Powder Materials and Length Change in Sulfate Solution of Mortar Mixtures
Mixture Designation C-b CFNS-1b
CFNS-2b
Laboratory mixture designation Cement (mass of Cm) 100 60 40 Fly Ash (mass of Cm) 0 33 50
New Gypsum Wallboard (mass of Cm) 0 7 10 Sodium Sulfate (mass of Cm) 0 1 1
Length Change in 5 Sodium Sulfate Solution () 0-day 0 0 0 7-day 0007 0016 0006
14-day 0013 0024 0009 21-day 0016 0028 0009 28-day 0020 0033 0009 42-day 0027 0044 0011 56-day 0034 0063 0010
44
Table 7-14 shows a summary of properties of selected promising main concrete mixtures
Mixtures CFN-2 CFNS-3 and CFNS-4 were comparable to their reference concrete mixtures in
compressive strength at the ages of 7 days and later Based on the sulfate resistance of Mortar
N-4 it is expected that concrete Mixture CFNS-4 will also possess high resistance to sulfate
attack
Table 7-14 Summary of Proportions and Properties of Selected Final Concrete Mixtures and Mortar Mixtures
Mixture Designation C-4 CFN-2 CFNS-3
CFNS-4
Cement (mass of Cm) 100 70 60 40 Fly Ash (mass of Cm) 0 20 33 50
New Gypsum Wallboard (mass of Cm) 0 10 7 10 Sodium Sulfate (mass of Cm) 0 0 1 1
Time of Initial Setting (hours) 47 114 98 118 Compressive Strength (MPa)
1-day 159 42 58 38 3-day 302 174 237 178 7-day 347 265 301 297
28-day 408 414 415 420 91-day 515 501 443 497
Compressive Strength (psi) 1-day 2310 610 840 550 3-day 4380 2520 3440 2580 7-day 5040 3850 4370 4310
28-day 5920 6000 6020 6090 91-day 7470 7270 6430 7210
Length Change () 1-day 0 0 0 0
28-day 0002 0033 0010 0043 140-day -0035 -0017 -0035 0006
28-day Length Change of Mortar in 5 Sodium Sulfate Solution ()
0020 hellip 0033 0009
Cm Cementitious materials (Cement + Fly Ash + Gypsum Wallboard)
45
CHAPTER 8 ECONOMIC IMPACT ANALYSIS OF FULL-
SCALE IMPLEMENTATION
It is estimated that over 80000 tons of gypsum wallboard is disposed of each year from new
construction and demolition in Wisconsin If a tipping fee plus handling and transportation cost
of $30 per ton is assumed the disposal of gypsum wallboard costs Wisconsin citizens and
industry approximately $24 million dollars each year
Based on figures from the National Ready-Mixed Concrete Association Wisconsin produced
approximately 11 million cubic yards (84 million m3) of concrete in 2004 Based on a cement
content of 400 pounds per cubic yard (240 kgm3) of concrete 22 million tons of cement is used
in concrete each year in Wisconsin
This project showed that powdered gypsum wallboard could constitute approximately 10
of total cementitious materials used in a concrete mixture If this new cementitious material was
used in 20 of the concrete produced in Wisconsin approximately 44000 tons of gypsum
wallboard can be used In other words approximately half of the gypsum wallboard waste
generated in Wisconsin could be used in this application alone This would save Wisconsin
industry $13 million dollars each year in avoided disposal costs leading to reduce the cost for
concrete construction in Wisconsin Citizens would benefit also by reducing landfilling cost for
municipalities and increasing recycling rates of useful materials If 40 of the concrete
generated in Wisconsin used this new concrete mixture technology all of the waste gypsum
wallboard generated in Wisconsin could be used in this one application Therefore all 80000
tons of waste gypsum wallboard could be diverted from Wisconsin landfills It would save
Wisconsin citizens and industry over $24 million dollars each year in avoided disposal cost
46
This economic impact does not include incalculable dollar-benefits due to avoided possible
future environmental impact of sending such large quantities of gypsum wallboard into landfills
This project also showed that up to 60 of cement in concrete mixtures could be replaced
with a blend of Class C fly ash and gypsum wallboard Cement is a valuable commodity If it is
assumed that cement sells at $100 per ton and Class C fly ash sells at $50 per ton use of a
cementitious blend consisting of 40 cement 50 Class C fly ash and 10 powdered gypsum
in producing 40 of concrete in Wisconsin would result in savings on cement of about $50
million and expenditure on fly ash of about $20 million with a net savings of about $30 million
each year
Saving cement through this new technology would also reduce emissions of carbon dioxide
and other GHGs because production of one ton of cement releases about one ton of GHGs If
this new technology to use a blend of Class C fly ash and gypsum wallboard as a replacement of
cement were implemented in producing up to 40 of concrete in Wisconsin it would reduce the
GHG emissions by up to 12 million tons each year CO2 credits currently sell for about $20 per
ton Therefore CO2 credits would be worth $10 million each year
With a potential total value of $24 million in avoided disposal costs $30 million in savings
resulting from cement replacement plus $10 million in CO2 credits total economic benefit to
Wisconsin that could be generated by this project may be valued at about $42 million each year
47
CHAPTER 9 CONCLUSIONS
This project showed that from 30 to 60 of cement in concrete mixtures could be
successfully replaced with blends of Class C fly ash and powdered gypsum wallboard Several
concrete mixtures made by such replacements showed compressive strength nearly as high as
that of Reference concrete mixtures (without replacement of cement) at seven days The 28-day
compressive strength of these concrete mixtures containing fly ash and gypsum wallboard were
equivalent to that of Reference concrete mixtures Use of sodium sulfate as an activator was
essential in improving the 1-day and 3-day strength of concrete containing Class C fly ash and
gypsum wallboard
A concrete mixture made with a cementitious blend of 40 cement 50 Class C fly ash
and 10 powdered gypsum wallboard showed a relatively large expansion (0043) during
immersion in saturated limewater and shrunk during drying as much as it had expanded
resulting in very small net expansion at the age of 140 days This concrete mixture could be
used to minimize drying shrinkage cracking and subsequent increase in durability of concrete
A mortar mixture made with a cementitious blend of 40 cement 50 Class C fly ash and
10 powdered gypsum wallboard showed much higher resistance to sulfate attack compared
with Reference mortar (without replacement of cement)
Total economic benefit to Wisconsin that could be generated by this project may be valued at
up to about $42 million each year
48
CHAPTER 10 REFERENCES
ASTM C 33-03 ldquoStandard Specification for Concrete Aggregatesrdquo ASTM International West Conshohocken PA 11 pp
ASTM C 150-05 ldquoStandard Specification for Portland Cementrdquo ASTM International West Conshohocken PA 8 pp
ASTM C 192 C 192M-05 ldquoStandard Practice for Making and Curing Concrete Test Specimens in the Laboratoryrdquo 8 pp
ASTM C 494C 494M-05a ldquoStandard Specification for Chemical Admixtures for Concreterdquo ASTM International West Conshohocken PA 10 pp
ASTM C 618-03 ldquoStandard Specification for Coal Fly Ash and Raw or Calcined Natural Pozzolan for Use in Concreterdquo ASTM International West Conshohocken PA 3 pp
ASTM C 1012-04 ldquoStandard Test Method for Length Change of Hydraulic-Cement Mortars Exposed to a Sulfate Solutionrdquo ASTM International West Conshohocken PA 6 pp
Aimin X and Sarkar S L ldquoMicrostructural Study of Gypsum Activated Fly Ash Hydration in Cement Pasterdquo Cement and Concrete Research Vol 21 1991 pp 1137-1147
Drywallrecyclingorg lthttpwwwdrywallrecyclingorggt (February 2006)
EPA Presentation by the US Environmental Protection Agency at the Massachusetts DEP Gypsum Workgroup March 18 2004
Freeman R B and Carrasquillo R L ldquoProduction of Sulfate-Resistant Concrete Containing High-Calcium Fly Ash and Sodium Sulfate Admixturerdquo Proceedings of Fifth CANMETACI International Conference on Fly Ash Silica Fume Slag and Natural Pozzolans in Concrete ACI SP-153 Vol 1 1995 pp 153-176
ICF Northwest ldquoCalcium Spray Dryer Waste Management Design Guidelinesrdquo EPRI (Electric Power Research Institute) Report No CS-5312 September 1987 p 3-3
Krocak R F Meininger R and Yost P A Chapter 21 ldquoBeneficial Reuse of Aggregate Mineral Fines and Scrap New Construction Wallboardrdquo Land Application of Agricultural Industrial and Municipal By-Products (6) James F Powers and Warren P Dick ed SSSA Number 6 in the Soil Science Society of America Book Series ISBN 0-89118-834-7 Item Number 60901 2000 653 pages
Kumar P K and Monteiro P J M ldquoConcrete Microstructure Properties and Materialsrdquo 2nd Ed McGraw-Hill 1993
Lafarge Group ltwwwlafargecomgt (February 2006)
49
Ma W Liu C Brown P W and Komarneni S ldquoPore Structures of Fly Ashes Activated By Ca(OH)2 and CaSO42H2Ordquo Cement and Concrete Research Vol 25 No 2 1995 pp 417-425
McCall R ldquoWasteCap Wisconsin Drywall-To-Fertilizer Projectrdquo Final Report for the US Environmental Protection Agency August 1993
Merritt F S and Ricketts J T editors Building Design and Construction Handbook McGraw Hill 6th Ed 2001 pp 435-438
Mindness S Young J F and Darwin D ldquoConcreterdquo 2nd Ed Prentice Hall 2002
Naik T R Kraus R N Chun Y-m and Nageotte S O ldquoCoal-Combustion Bottom Ash for Reducing the Shrinkage of Concrete Made With Portland Cement and Sulfoaluminate Cementrdquo Jean Pera Symposium on Specialty Cements and Sustainability Issues a part of the proceedings of the Ninth CANMETACI International Conference on Recent Advances in Concrete Technology Warsaw Poland May 2007 pp 141-155
Neville A ldquoProperties of Concreterdquo 4th Ed Longman 1995
Pera J and Ambroise J ldquoNew Applications of Calcium Sulfoaluminate Cementrdquo Cement and Concrete Research Vol 34 No 4 April 2004 pp 671-676
Prusinski J R and Carrasquillo R L ldquoUsing Medium- to High-Volume Fly Ash Blended Cements to Improve the Sulfate Resistance of High-Lime Fly Ash Concreterdquo Proceedings of Fifth CANMETACI International Conference on Fly Ash Silica Fume Slag and Natural Pozzolans in Concrete ACI SP-153 Vol 1 1995 pp 43-65
Reindl J R ldquoBibliography of Gypsum Drywallrdquo available on the WasteCap Wisconsin website httpwwwwastecapwiorg August 2002 73 pages
WI-DNR ldquoSubstituting Waste Gypsum Wallboard for Agricultural Gypsumrdquo Wisconsin Department of Natural Resources Bureau of Waste Management DNR Publication WA-607-04 rev 2005
Wolkowski R ldquoDemonstration of Land Application of Crushed Gypsum Wallboard Waste for Alfalfardquo Final report to the Wisconsin Department of Natural Resources Waste Reduction and Recycling Grant Program and Dane County Department of Public Works August 12 1998
Wolkowski R P ldquoUsing Recycled Wallboard for Crop Production (A3782)rdquo WasteCap Wisconsin Inc 2003
Wu Z and Naik T R ldquoUse of Clean Coal Ash as Setting Time Regulator in Portland Cementrdquo Proceedings of the Fifth CANMETACI International Conference on Recent Advances in Concrete Technology Supplementary Papers 2001 pp 83-94
50
Wu Z and Naik T R ldquoProperties of Concrete Produced from Multicomponent Blended Cementsrdquo Cement and Concrete Research Vol 32 2002 pp 1937-1942
Wu Z and Naik T R ldquoChemically Activated Blended Cementsrdquo ACI Materials Journal September-October 2003 pp 434-440
- 08 Naik Chun cover
- 08 MIL NaikGypsumWallboard in concrete
-
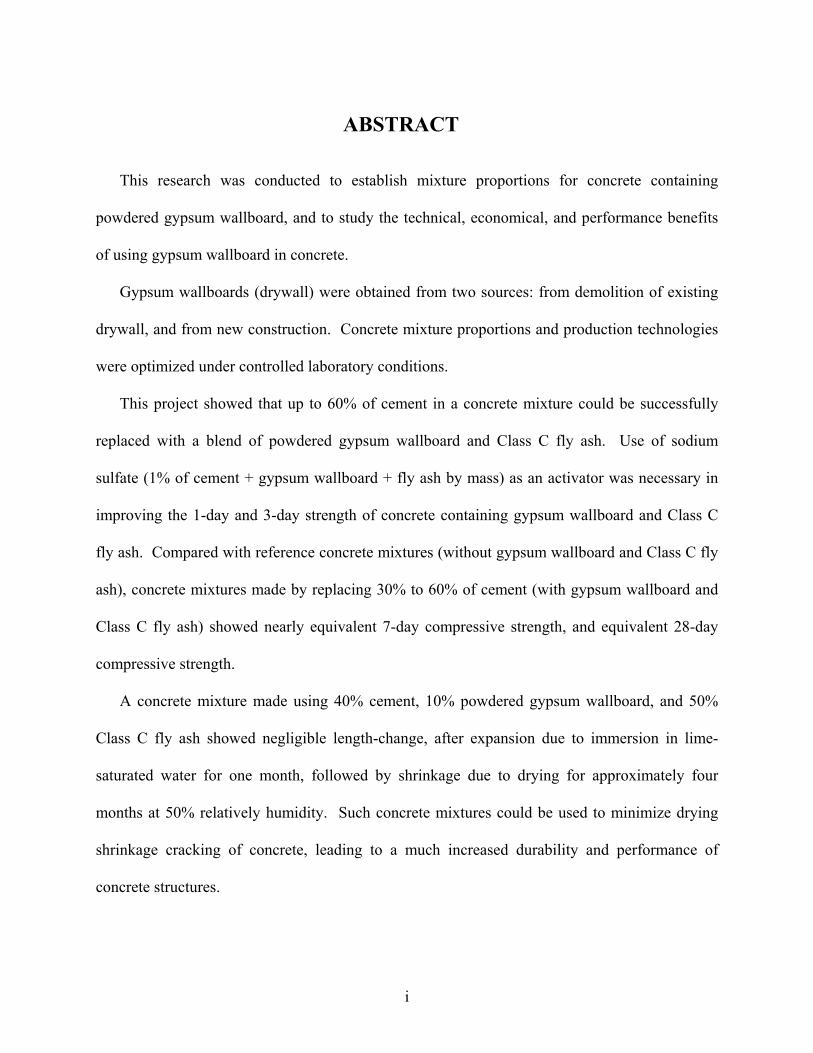
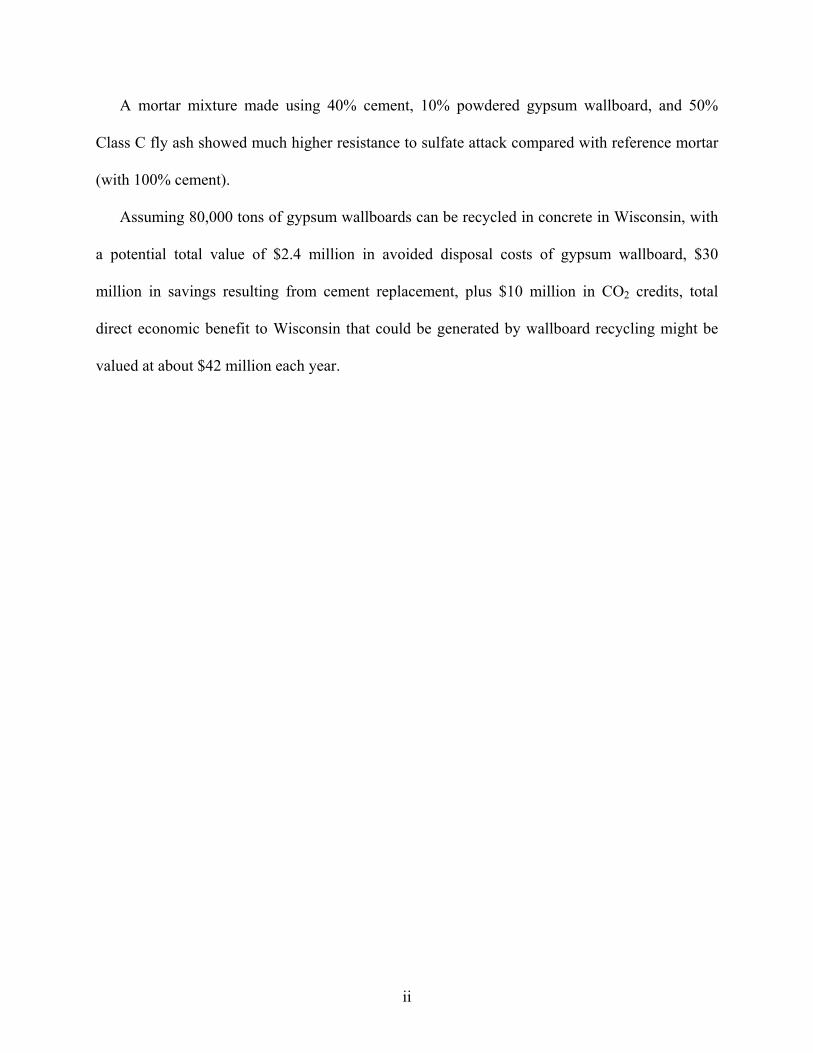
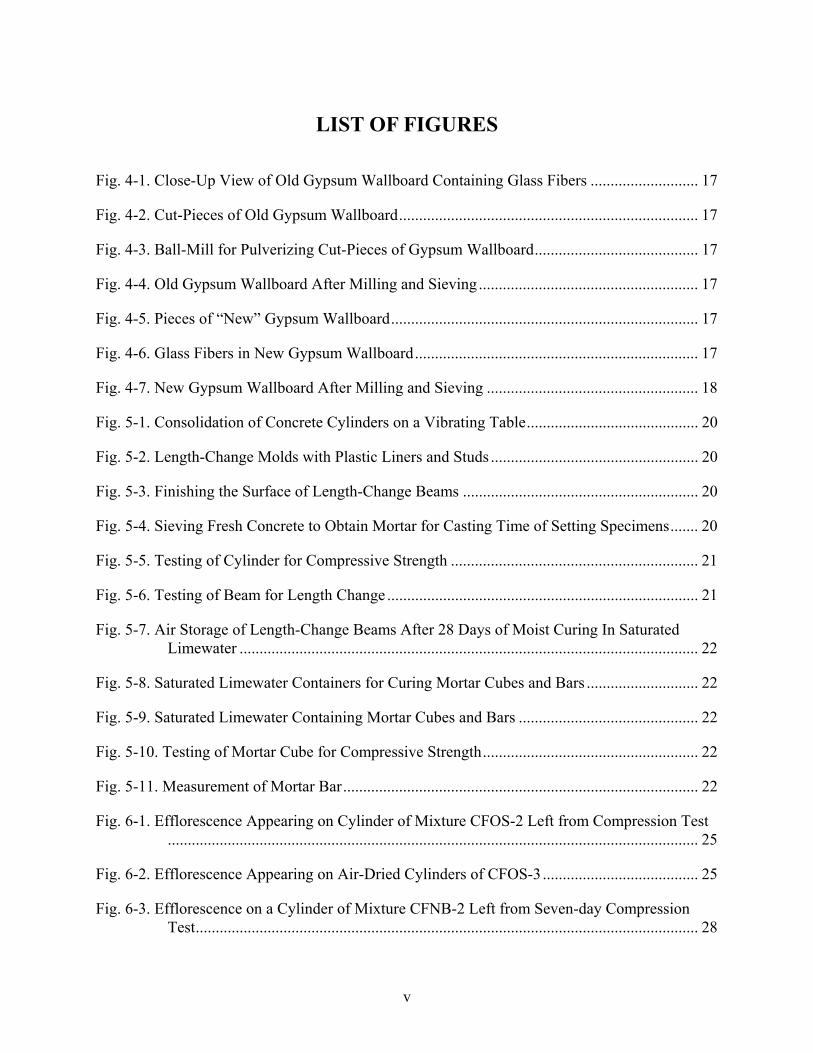
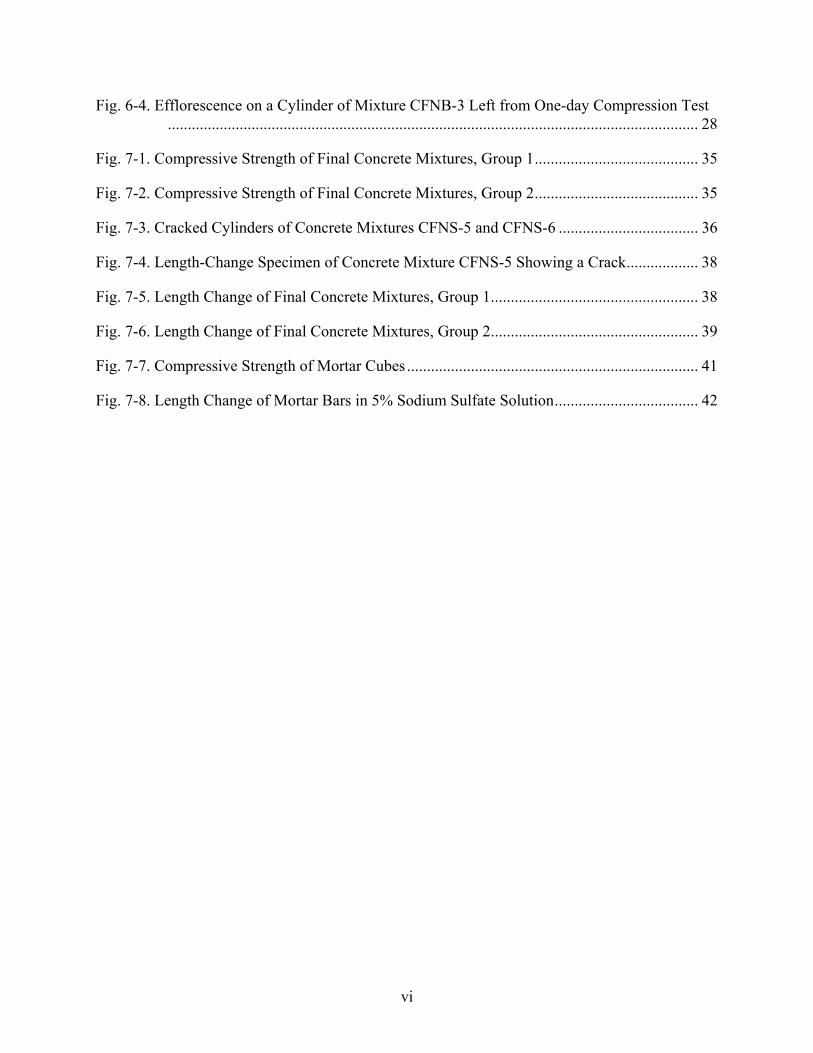
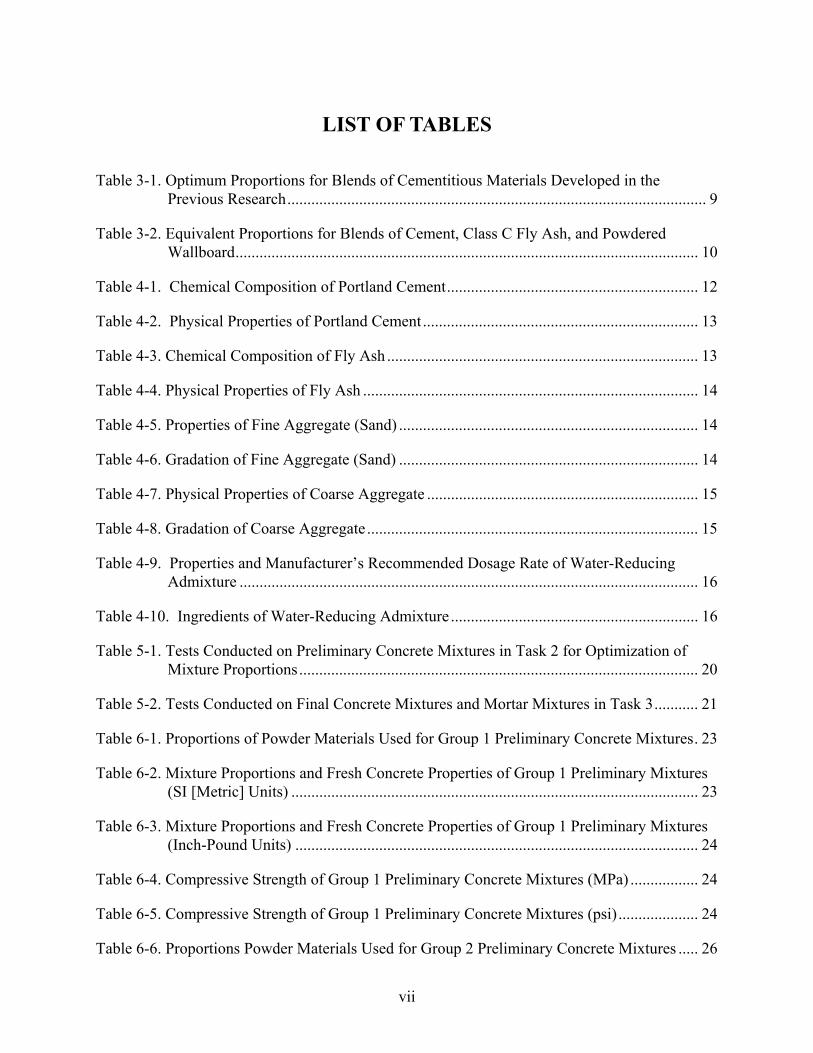
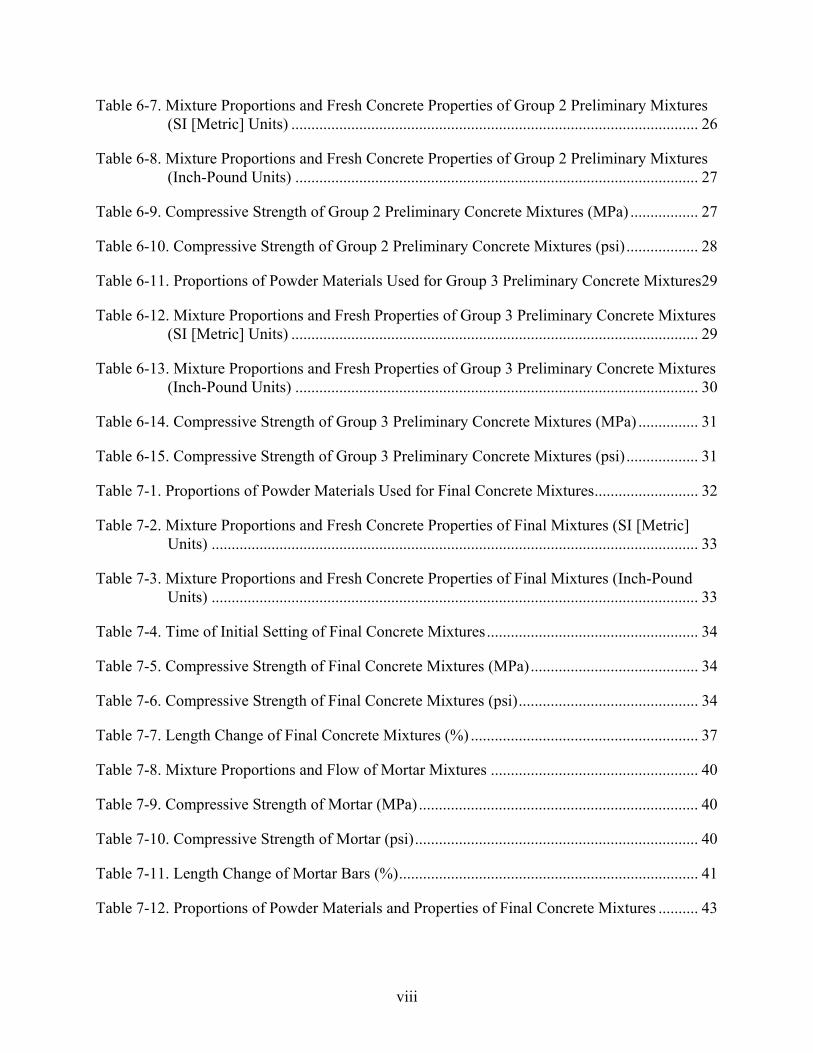
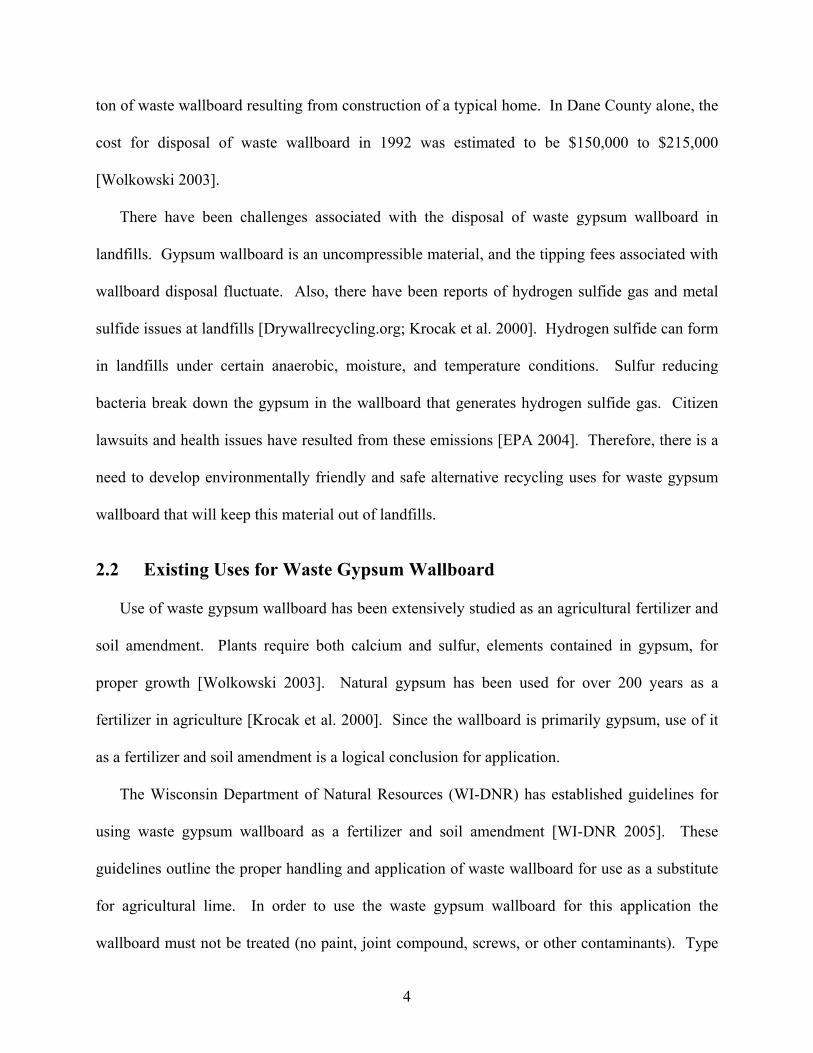
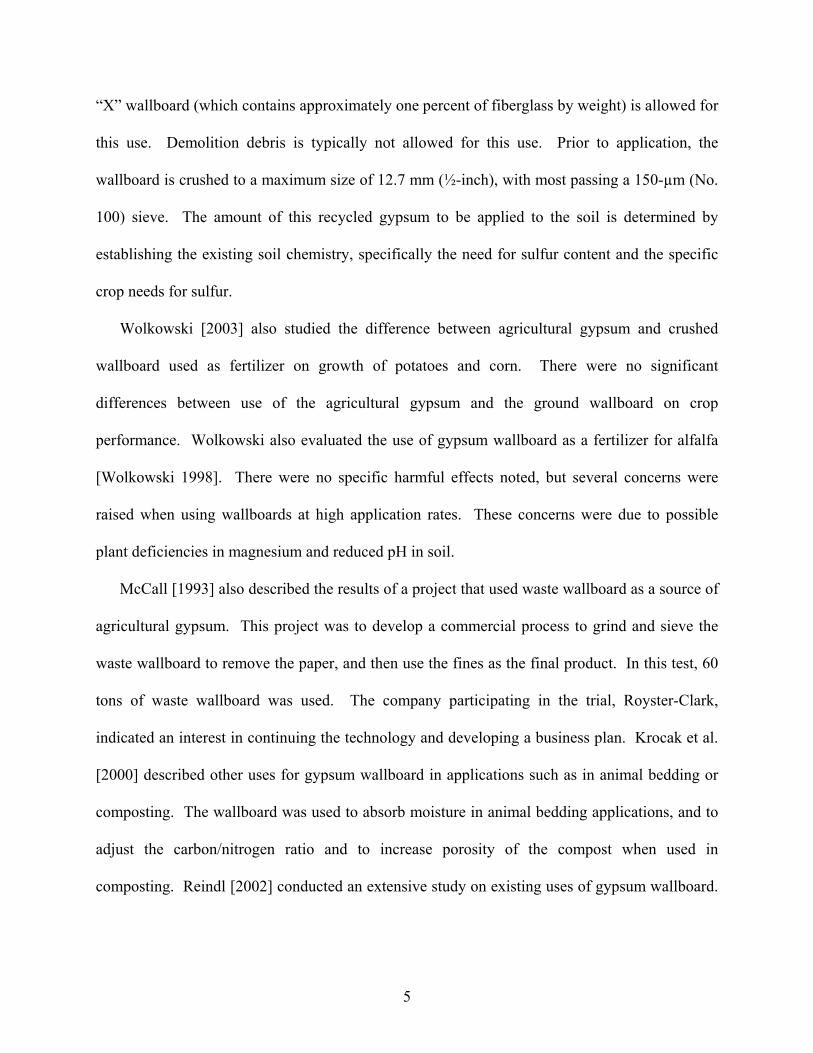
5
ldquoXrdquo wallboard (which contains approximately one percent of fiberglass by weight) is allowed for
this use Demolition debris is typically not allowed for this use Prior to application the
wallboard is crushed to a maximum size of 127 mm (frac12-inch) with most passing a 150-microm (No
100) sieve The amount of this recycled gypsum to be applied to the soil is determined by
establishing the existing soil chemistry specifically the need for sulfur content and the specific
crop needs for sulfur
Wolkowski [2003] also studied the difference between agricultural gypsum and crushed
wallboard used as fertilizer on growth of potatoes and corn There were no significant
differences between use of the agricultural gypsum and the ground wallboard on crop
performance Wolkowski also evaluated the use of gypsum wallboard as a fertilizer for alfalfa
[Wolkowski 1998] There were no specific harmful effects noted but several concerns were
raised when using wallboards at high application rates These concerns were due to possible
plant deficiencies in magnesium and reduced pH in soil
McCall [1993] also described the results of a project that used waste wallboard as a source of
agricultural gypsum This project was to develop a commercial process to grind and sieve the
waste wallboard to remove the paper and then use the fines as the final product In this test 60
tons of waste wallboard was used The company participating in the trial Royster-Clark
indicated an interest in continuing the technology and developing a business plan Krocak et al
[2000] described other uses for gypsum wallboard in applications such as in animal bedding or
composting The wallboard was used to absorb moisture in animal bedding applications and to
adjust the carbonnitrogen ratio and to increase porosity of the compost when used in
composting Reindl [2002] conducted an extensive study on existing uses of gypsum wallboard
6
Applications described include agricultural gypsum plaster absorbents adhesives cement
production composting remanufacture into wallboard and numerous other uses
Most of these applications have been developed and attempts have been made to implement
the technology on a larger scale However the problem of disposal for waste gypsum wallboard
remains Therefore the use of waste gypsum wallboard in an application such as the one studied
in this project in ready-mixed concrete is needed because ready-mixed concrete plants and
locations which can use waste gypsum wallboard are ubiquitous
23 Gypsum in Concrete
Gypsum (calcium sulfate di-hydrate CaSO42H2O) is an essential ingredient used in the
manufacture of portland cement as a set regulator [Wu and Naik 2001 2002 2003] Cement
clinkers are interground with about 5 gypsum Without gypsum portland cement (specifically
tricalcium aluminate (3CaOAl2O3 or C3A) in the cement) will react too rapidly with water
making the cement harden too fast and becoming useless [Kumar and Monteiro 1993] Thus a
small amount of gypsum is an integral part of portland cement as a set regulator Powdered
gypsum wallboard can perform this same function in portland cement On the other hand use of
a relatively large amount of gypsum can cause false set (stiffness) of fresh concrete mixture due
to the rapid formation of large crystals of gypsum [Kumar and Monteiro 1993 Mindness et al
2002] The false set when recognized as such can be easily disrupted by further mixing
Gypsum itself is non-hydraulic which means that gypsum by itself is not stable in water and can
be washed away Portland cement is hydraulic and portland cement sets and hardens in water
and is stable in water
It was reported that gypsum improved the reactivity of fly ash and the strength of fly ash
concrete [Naik and Ramme ndash unpublished research results from 1983 Aimin and Sarkar 1991
7
Ma et al 1995 Wu and Naik 2002 2003] It was also reported that use of gypsum (above and
beyond the amount inherent in portland cement) significantly improved sulfate resistance of
concrete made with Class C fly ash [Prusinski and Carrasquillo 1995] It was explained that the
gypsum supplied more than enough sulfate to react with all the C3A and other reactive
aluminates in concrete at early ages so that such aluminates would not be available to render
concrete susceptible to sulfate attack later It has also been reported that sodium sulfate
(Na2SO4) was effective in improving sulfate resistance and early-age strength of concrete
containing Class C fly ash [Freeman and Carrasquillo 1995] Wu and Naik [2002 2003]
reported that blended cements consisting of portland cement Class C fly ash and spray-dryer
ash outperformed plain portland cement in terms of the resistance of concrete to saltchloride
penetration sulfate attack and alkali-silica reaction A chemical activator was used to increase
the early-age reactivity of blended cements [Wu and Naik 2003]
Gypsum is one of the major materials present in spray-dryer ash Use of sulfate-bearing
materials such as gypsum can increase the formation of needlelike crystals of ettringite (calcium
sulfoaluminate hydrate) at early ages and can contribute to strength of concrete If on the other
hand the alumina-to-sulfate ratio increases later due to depletion of sulfates ettringite may
become unstable and decompose to monosulfate hydrate [Kumar and Monteiro 1993] In the
presence of calcium hydroxide when sulfate ions get into concrete later monosulfate hydrate is
converted back to ettringite Since this is an expansive reaction it can damage hardened (rigid)
concrete Now it is known and established [Wu and Naik 2002 2003] that the use of gypsum
can stabilize ettringite and that the replacement of cement by fly ash reduces the amounts of
aluminate and free calcium hydroxide in concrete This means that the quantities of susceptible
components (monosulfate hydrate and calcium hydroxide) in concrete could be minimized
8
through optimum use of gypsum and fly ash A chemical activator is helpful in boosting the
early-age strength of concrete containing these materials [Wu and Naik 2003]
Potentially there is another benefit of using gypsum in concrete When calcium hydroxide is
absent calcium sulfoaluminate cement is non-expansive and results in high early strength of
concrete [Pera and Ambroise 2004] Calcium sulfoaluminate cement has been used at the
UWM-CBU for a recent investigation for reduction of shrinkage of concrete and for high early
strength [Naik et al 2007]
9
CHAPTER 3 RESEARCH DESIGN AND TASKS
31 Research Design
It was planned that the proportions of cement powdered wallboard Class C fly ash would be
optimized based on a judicious selection of the proportions from past research results published
by UWM-CBU with proven laboratory performance [Wu and Naik 2002 2003] The optimum
proportions for blends of cementitious materials developed in the previous research on spray-
dryer ash are as shown below in Table 3-1
Table 3-1 Optimum Proportions for Blends of Cementitious Materials Developed in the Previous Research
Designation of blends of cementitious materials
Type I cement (mass )
Class C fly ash (mass )
Spray-dryer ash (mass )
Specialty activator
(mass ) Control (Type I) 100 0 0 0
BC40 60 20 20 2 BC60 40 30 30 2 BC80 20 20 60 4
Percent of total cementitious materials By considering that spray-dryer ash is ldquosimilarrdquo to a mixture consisting of 1 part of gypsum
and 2 parts of Class C fly ash the previously established optimum proportions approximately
translate into the proportions shown below in Table 3-2 These proportions are informative and
provided a conceptual basis for this new research using powdered-wallboard From these
proportions it was expected that gypsum wallboard could make up about 10 to 20 of the
cementitious materials for this first bench-scale proof for this wallboard project
10
Table 3-2 Equivalent Proportions for Blends of Cement Class C Fly Ash and Powdered Wallboard
Designation of blends of cementitious materials
Type I cement (mass )
Class C fly ash (mass )
Powdered gypsum
wallboard (mass )
Specialty activator
(mass )
Control (Type I) 100 0 0 0 BC40eq 60 33 7 2 BC60eq 40 50 10 2 BC80eq 20 60 20 4
Percent of total cementitious materials
32 Research Tasks
This research progressed through the following tasks
Task 1 Characterization of materials (portland cement gypsum wallboard Class C fly ash
aggregates and other concrete-making materials)
Task 2 Optimization of the proportions of portland cement powdered wallboard and Class
C fly ash through production of a series concrete mixtures and testing
Task 3 Production of concrete mixtures using optimum proportions of cementitious
materials for evaluation of slump retention initial setting strength and length change due to
shrinkage Mortar mixtures were made for evaluation of sulfate resistance in accordance with
ASTM
Previous research activities at UWM-CBU show that gypsum-containing coal ash could be
used for minimizing shrinkage-cracking that naturally occurs in concrete Therefore the length
change was included to evaluate the autogenous- and drying-shrinkage compensating potential
of this new cementitious material containing powdered gypsum wallboard It was known that
the use of a relatively large amount of gypsum can cause expansion in concrete at very early
11
ages but the concrete can safely accommodate such expansion at early ages If the net length
change due to early expansion and later drying shrinkage of concrete is negligible then such a
characteristic can help to minimize the overall cracking leading to enhanced durability of such
concretes
12
CHAPTER 4 MATERIALS
41 Portland Cement
ASTM Type I portland cement obtained from Lafarge North America was used in this
research The chemical composition and physical properties of the cement used are presented in
Table 4-1 and Table 4-2 respectively along with the requirements of ASTM Standard
Specification for Portland Cement [ASTM C 150] These data were provided by the cement
producer The cement met the standard chemical and physical requirements of ASTM C 150
Table 4-1 Chemical Composition of Portland Cement Item ( by mass) Cement
results Standard requirements of ASTM C
150 for Type I cement Silicon dioxide SiO2 202 hellip
Aluminum oxide Al2O3 45 hellip Ferric oxide Fe2O3 26 hellip Calcium oxide CaO 642 hellip
Magnesium oxide MgO 25 60 maximum Sulfur trioxide SO3 24 30 maximum when C3A le 8
35 maximum when C3A gt 8 Loss on ignition 14 30 maximum
Insoluble residue 04 075 maximum Free lime 15 hellip
Tricalcium silicate C3S 67 hellip Tricalcium aluminate C3A 8 hellip
Total alkali as sodium oxide 053 hellip
13
Table 4-2 Physical Properties of Portland Cement ASTM Property Cement
results Standard requirements of
ASTM C 150 for Type I cementC 185 Air content of mortar (volume ) 6 12 maximum C 204 Fineness (specific surface) by Blaine air-
permeability apparatus (m2kg) 364 280 minimum
C 151 Autoclave expansion () 007 080 maximum C 109 Compressive strength of Cement Mortars (psi)
1 day 2080 hellip 3 days 3590 1740 minimum 7 days 4400 2760 minimum 28 days 5620 hellip
C 191 Initial time of setting by Vicat needle (minutes) 105 Between 45 to 375 C 188 Density (gcm3) 315 hellip
42 Fly Ash
For this research ASTM Class C fly ash was obtained from Wisconsin Public Service
Corporationrsquos Weston Power Plant near Wausau Wisconsin The chemical composition and
physical properties of the fly ash are shown in Table 4-3 and Table 4-4 respectively along with
the requirements of ASTM Specification for Coal Fly Ash and Raw or Calcined Natural
Pozzolan for Use in Concrete [ASTM C 618] These data were provided by the fly ash producer
The fly ash met the requirements of ASTM C 618
Table 4-3 Chemical Composition of Fly Ash Item ( by mass) Fly ash results
Requirements of ASTM C
618 for Class C fly ash Silicon dioxide SiO2 409 hellip
Aluminum oxide Al2O3 188 hellip Ferric oxide Fe2O3 65 hellip
SiO2 + Al2O3 + Fe2O3 662 50 minimum Calcium oxide CaO 213 hellip
Magnesium oxide MgO 45 hellip Sulfur trioxide SO3 12 50 maximum
Sodium oxide Na2O 14 hellip Potassium oxide K2O 08 hellip
14
Table 4-4 Physical Properties of Fly Ash Property Fly ash
results Requirements of ASTM C 618
for Class C fly ash Strength activity index ( of Control)
7 days 28 days
107
Not available
75 minimum at either 7 or 28
days Water requirement ( of Control) 94 105 maximum
Autoclave expansion () 004 Between -080 and +080 Density (gcm3) 266 hellip
43 Fine Aggregate (Sand)
Natural sand was used as fine aggregate in this project The properties of fine aggregate are
shown in Table 4-5 Sieve analysis results are presented in Table 4-6 along with the grading
requirements of ASTM Standard Specification for Concrete Aggregates [ASTM C 33] The
sand met the requirements of ASTM C 33
Table 4-5 Properties of Fine Aggregate (Sand) ASTM Property Test result C 128 Bulk specific gravity on oven-dry basis 262
Bulk specific gravity on SSD basis 266 Apparent specific gravity 272 SSD Absorption () 137
C 29 Bulk density (kgm3) 1790 Bulk density (lbft3) 112 Void content () 33
Saturated surface-dry
Table 4-6 Gradation of Fine Aggregate (Sand) Amounts finer than each sieve ( by mass) Fineness
modulus 38-in 95 mm
No 4 475 mm
No 8 236 mm
No 16 118 mm
No 30 600 microm
No 50 300 microm
No 100 150 microm
Sand results 27 100 99 87 71 50 18 4 Requirements of ASTM
C 33 23 - 31 100 95 - 100 80 - 100 50 - 85 25 - 60 5 - 30 0 - 10
44 Coarse Aggregate
The coarse aggregate used in this research was crushed quartzite stone The physical
properties and the gradation of the coarse aggregate are shown in Table 4-7 and Table 4-8
15
respectively along with the requirements of ASTM C 33 The coarse aggregate met the
requirements of ASTM C 33 The coarse aggregate had a nominal maximum size of 34 inch
and met the grading requirements for AASHTO No 67
Table 4-7 Physical Properties of Coarse Aggregate ASTM Item Coarse
aggregate results
Requirements of ASTM C 33
C 117 Materials finer than 75microm by washing () 05 10 maximum C 127 Bulk specific gravity on oven-dry basis 265 hellip
Bulk specific gravity on SSD basis 266 hellip Apparent specific gravity 268 hellip SSD Absorption () 042 hellip
C 29 Bulk density (kgm3) 1550 hellip Bulk density (lbft3) 97 hellip Void content () 42 hellip
Saturated surface-dry
Table 4-8 Gradation of Coarse Aggregate Amounts finer than each sieve ( by mass) 250 mm
1-in 190 mm
34-in 125 mm
12-in 95 mm 38-in
475 mm No 4
236 mm No 8
Coarse aggregate results 100 95 55 31 3 2 Requirements of ASTM C 33 for Size No
67 100 90 - 100 hellip 20 - 55 0 - 10 0 - 5
45 Water-Reducing Admixture (WRA)
Water-reducing admixture (WRA) was used in several concrete mixtures The WRA was an
aqueous solution of modified lignosulfonates The WRA was a Type A admixture per ASTM
Standard Specification for Chemical Admixtures for Concrete [ASTM C 494] Table 4-9
presents the properties and manufacturerrsquos recommended dosage rate of the WRA Table 4-10
shows the ingredients of the WRA
16
Table 4-9 Properties and Manufacturerrsquos Recommended Dosage Rate of Water-Reducing Admixture
Chemical family name
Specific gravity
Water content ()
pH Dosage rate (mL100 kg of cementitious
materials)
Dosage rate (fl oz100 lb of cementitious
materials) Aqueous solution of
lignosulfonate amine and compound carbohydrates
11 - 12 ~ 50 65 - 75 190 - 375 3 - 6
Table 4-10 Ingredients of Water-Reducing Admixture Ingredient Chemical Abstracts Service
(CAS) Registry Number Maximum percent
Sodium o-phenylphenol 000132-27-4 lt 1 Triethanolamine 000102-71-6 1-10
Triethanolamine acetate 014806-72-5 1-10
46 Gypsum Wallboard
Gypsum wallboard was obtained from two locations on the campus of University of
Wisconsin-Milwaukee (Fig 4-1 to 4-7) One source was pieces of drywall from demolition of
existing walls and was designated as ldquoOldrdquo The label on the Old drywall showed that it was
ldquoType SCXrdquo drywall The other source was cuttings of drywall from new construction and was
designated as ldquoNewrdquo It was ldquoType Xrdquo drywall Both the Old and New gypsum wallboards
contained glass fibers Type X New gypsum wallboard appeared to contain more glass fibers
than Type SCX Old gypsum wallboard Paper covering of gypsum wallboard was removed as
much as possible and gypsum wallboard was ground into powder using a laboratory mechanical
ball-mill at UWM-CBU
17
Fig 4-1 Close-Up View of Old Gypsum
Wallboard Containing Glass Fibers
Fig 4-2 Cut-Pieces of Old Gypsum Wallboard
Fig 4-3 Ball-Mill for Pulverizing Cut-Pieces of
Gypsum Wallboard
Fig 4-4 Old Gypsum Wallboard After Milling
and Sieving
Fig 4-5 Pieces of ldquoNewrdquo Gypsum Wallboard
Fig 4-6 Glass Fibers in New Gypsum Wallboard
18
Fig 4-7 New Gypsum Wallboard After Milling
and Sieving
19
CHAPTER 5 SPECIMEN PREPARATION AND TEST
METHODS
51 Mixing and Specimen Preparation
Test specimens of concrete were prepared and cured in accordance with the ASTM Standard
Practice for Making and Curing Concrete Test Specimens in the Laboratory [ASTM C 192]
The concrete mixer used in this project was an electric-power driven revolving drum tilting
mixer
The cast specimens were removed from their molds 24 plusmn 4 hours after casting The
specimens were then moist cured in a moist room at a temperature of 23 plusmn 2degC (73 plusmn 35degF) and
a relative humidity of not less than 95 except for length-change specimens which were stored
in saturated limewater until the age of 28 days and then stored in air at a temperature of 23 plusmn 2degC
(73 plusmn 35degF) and a relative humidity of 50 plusmn 4
Mortar cubes and bars for sulfate resistance test were cured in 23degC (instead of in 35degC water
specified in ASTM C 1012 due to difficulty in sealing fresh specimens) until the cubes reached a
compressive strength of 20 MPa (2900 psi) The specimens were cured in a moist-enclosure
until the age of 24 hours and then in saturated limewater
Photographs for making test specimens are shown below Fig 5-1 to 5-4
20
Fig 5-1 Consolidation of Concrete Cylinders
on a Vibrating Table
Fig 5-2 Length-Change Molds with Plastic
Liners and Studs
Fig 5-3 Finishing the Surface of Length-
Change Beams
Fig 5-4 Sieving Fresh Concrete to Obtain
Mortar for Casting Time of Setting Specimens
52 Test Methods
The tests conducted on preliminary concrete mixtures are summarized below in Table 5-1
The tests conducted on final concrete mixtures and mortar mixtures are summarized in Table
5-2
Table 5-1 Tests Conducted on Preliminary Concrete Mixtures in Task 2 for Optimization of Mixture Proportions
Test ASTM 0-day 1-day 7-day 28-day Slump C 143 x Density C 138 x
Air content by the pressure method
C 231 x
Compressive strength C 39 x x x
21
Table 5-2 Tests Conducted on Final Concrete Mixtures and Mortar Mixtures in Task 3 Test ASTM 0-day 1-day 3-day 7-day 28-day 91-day
Slump and slump retention C 143 x Density C 138 x
Air content by the pressure method
C 231 x
Compressive strength C 39 x x x x x Time of initial setting C 403 x
Length change C 157 Start Sulfate resistancedagger C 1012
Slump was measured again 30 minutes after completion of concrete mixing dagger Test started when accompanying cubes reached compressive strength of 20 MPa (2900 psi) Compressive strength of concrete was determined by testing three 100-mm diameter times 200-
mm length (4 times 8 in) cylinders at each test age for each mixture Length change specimens
consisted of three 75 times 75 times 285 mm (3 times 3 times 1125 in) beams for each concrete mixture For
each mortar mixture six mortar prisms were cast for measuring length change in 5 sodium
sulfate solution to evaluate their sulfate resistance Some prisms broke in the process of
separating from molds and could not be tested
Photographs of testing are shown below Fig 5-5 to 5-11
Fig 5-5 Testing of Cylinder for Compressive
Strength
Fig 5-6 Testing of Beam for Length Change
22
Fig 5-7 Air Storage of Length-Change Beams
After 28 Days of Moist Curing In Saturated Limewater
Fig 5-8 Saturated Limewater Containers for
Curing Mortar Cubes and Bars
Fig 5-9 Saturated Limewater Containing
Mortar Cubes and Bars
Fig 5-10 Testing of Mortar Cube for
Compressive Strength
Fig 5-11 Measurement of Mortar Bar
23
CHAPTER 6 PRELIMINARY MIXTURES
A series of preliminary concrete mixtures were produced in order to establish mixture
proportions for final concrete mixtures
61 Group 1 Preliminary Mixtures
Group 1 preliminary concrete mixtures were made using ldquoOldrdquo gypsum wallboard The
mixture proportions of Group 1 concrete mixtures are shown in Table 6-1 (powder materials)
Table 6-2 (SI units) and Table 6-3 (inch-pound units) Mixtures CFOS-1 CFOS-2 and CFOS-3
were made with old gypsum wallboard using the proportions developed in Table 3-2 which was
based on previous UWM-CBU research projects Sodium sulfate was used as an activator
Table 6-1 Proportions of Powder Materials Used for Group 1 Preliminary Concrete Mixtures Mixture Designation C-1 CFO
S-1 CFOS-2
CFOS-3
CFO-1
CFO-2
CF-1 CO-1
Laboratory mixture designation Ref-1 Old-2 Old-3 Old-4 Old-5 Old-6 Old-7 Old-8Cement (mass of Cm) 100 60 40 20 60 40 67 93 Fly Ash (mass of Cm) 0 33 50 60 33 50 33 0
Old Gypsum Wallboard (mass of Cm) 0 7 10 20 7 10 0 7 Sodium Sulfate (mass of Cm) 0 2 2 4 0 0 0 0
Cm Cementitious materials (Cement + Fly Ash + Gypsum Wallboard)
Table 6-2 Mixture Proportions and Fresh Concrete Properties of Group 1 Preliminary Mixtures (SI [Metric] Units)
Mixture Designation C-1 CFOS-1
CFOS-2
CFOS-3
CFO-1
CFO-2
CF-1 CO-1
Cement (kgm3) 358 214 143 71 215 143 246 334 Class C Fly Ash Weston (kgm3) 0 118 179 213 119 179 121 0
Powdered Gypsum Wallboard Old (kgm3) 0 25 36 71 25 36 0 25 Water (kgm3) 171 161 162 155 163 159 151 164
Sand SSD (kgm3) 849 848 843 834 850 847 872 847 Crushed Stone 19-mm max SSD (kgm3) 1020 1020 1010 1010 1020 1020 1050 1020
Sodium Sulfate Na2SO4 (kgm3) 0 72 71 142 0 0 0 0 Water-Cementitious Ratio WCm 048 045 045 044 045 044 041 046
Slump (mm) 65 30 40 40 55 65 65 25 Air Content () 13 18 18 21 19 22 14 20
Air Temperature (degC) 23 23 23 24 23 23 23 23 Concrete Temperature (degC) 21 22 22 21 22 22 22 21
Density (kgm3) 2400 2390 2380 2370 2390 2380 2440 2390SSD Saturated surface-dry
24
Table 6-3 Mixture Proportions and Fresh Concrete Properties of Group 1 Preliminary Mixtures (Inch-Pound Units)
Mixture Designation C-1 CFOS-1
CFOS-2
CFOS-3
CFO-1
CFO-2
CF-1 CO-1
Cement (lbyd3) 603 361 240 120 362 241 414 562 Class C Fly Ash Weston (lbyd3) 0 199 301 358 200 302 204 0
Powdered Gypsum Wallboard Old (lbyd3) 0 42 60 120 42 60 0 42 Water (lbyd3) 288 270 273 261 274 268 255 276
Sand SSD (lbyd3) 1430 1430 1420 1400 1430 1430 1470 1430Crushed Stone 34 in max SSD (lbyd3) 1720 1720 1710 1700 1720 1710 1760 1710
Sodium Sulfate Na2SO4 (lbyd3) 0 12 12 24 0 0 0 0 Water-Cementitious Ratio WCm 048 045 045 044 045 044 041 046
Slump (in) 2 12 1 14 1 12 1 12 2 14 2 12 2 12 1 Air Content () 13 18 18 21 19 22 14 20
Air Temperature (degF) 74 74 74 75 73 73 73 73 Concrete Temperature (degF) 70 71 71 70 72 72 71 70
Density (lbft3) 150 149 149 148 149 149 152 149 SSD Saturated surface-dry Test results for compressive strength of Group 1 concrete mixtures are shown in Table 6-4
(in MPa) and Table 6-5 (in psi) Mixtures CFOS-1 and CFOS-2 were strong enough to be
demolded at one day and showed quite high compressive strength values of 347 MPa (5040 psi)
and 330 MPa (4790 psi) at seven days Mixture CFOS-3 was also strong enough to be
demolded at one day
Table 6-4 Compressive Strength of Group 1 Preliminary Concrete Mixtures (MPa) Age (days) C-1 CFO
S-1 CFOS-2
CFOS-3
CFO-1
CFO-2
CF-1 CO-1
1 106 59 39 23 28 07dagger 60 88 7 308 347 330 hellip 291 245 330 26528 396 456 429 hellip 428 379 480 429
dagger Result from testing only one cylinder all other results are from testing three cylinders each Cylinders had cracked on their own
Table 6-5 Compressive Strength of Group 1 Preliminary Concrete Mixtures (psi) Age (days) C-1 CFO
S-1 CFOS-2
CFOS-3
CFO-1
CFO-2
CF-1 CO-1
1 1540 850 560 340 400 100dagger 870 12707 4470 5040 4790 hellip 4220 3550 4780 385028 5740 6620 6220 hellip 6210 5490 6960 6220
dagger Result from testing only one cylinder all other results are from testing three cylinders each Cylinders had cracked on their own
25
Fig 6-1 is a photograph of a cylinder of Mixture CFOS-2 It was noted that white material
was appearing on a CFOS-2 cylinder obtained after compression test
Fig 6-2 shows a photograph of cylinders from Mixture CFOS-3 Mixture CFOS-3
developed a significant amount of efflorescence and cylinders cracked by themselves before
reaching the age of seven days
Mixtures CFO-1 and CFO-2 were made using the same proportions of cement fly ash and
old gypsum wallboard as Mixtures CFOS-1 and CFOS-2 but without using sodium sulfate
Mixtures CFO-1 and CFO-2 were weaker than Mixtures CFOS-1 and CFOS-2 especially at the
age of one day Mixture CFO-2 was so soft that two out of three cylinders broke during
demolding at the age of one day
Mixture CF-1 was made using only cement and fly ash Mixture CO-1 was made using only
cement and old gypsum wallboard Compared with Mixture C-1 Mixture CO-1 showed a lower
strength at 1 and 7 days and a higher strength at 28 days
Fig 6-1 Efflorescence Appearing on Cylinder
of Mixture CFOS-2 Left from Compression Test
Fig 6-2 Efflorescence Appearing on Air-Dried
Cylinders of CFOS-3
26
62 Group 2 Preliminary Mixtures
Group 2 preliminary concrete mixtures were made using ldquoNewrdquo gypsum wallboard Sodium
bicarbonate was used in the majority of the Group 2 mixtures for evaluation as an activator
Table 6-6 Table 6-7 and Table 6-8 show mixture proportions of Group 2 concrete mixtures
Proportions of Mixtures C-1 and CF-1 of Group 1 are shown as well for easier comparison
Unlike sodium sulfate use of sodium bicarbonate increased water demand of fresh concrete
resulting in high water-cementitious ratios for the desired workability
Table 6-6 Proportions Powder Materials Used for Group 2 Preliminary Concrete Mixtures Mixture Designation C-1 CF-1 CN-1 CFN-
1 CB-1 CFB-
1 CNB-
1 CFNB-1
CFNB-2
CFNB-3
Laboratory mixture designation Ref-1 Old-7 New-1
New-2
Ref-2 FA-1 New-3
New-4
New-5
New-6
Cement (mass of Cm) 100 67 93 60 100 67 93 60 40 53 Fly Ash (mass of Cm) 0 33 0 33 0 33 0 33 50 33
New Gypsum Wallboard (mass of Cm)
0 0 7 7 0 0 7 7 10 14
Sodium Bicarbonate (mass of Cm) 0 0 0 0 2 2 2 2 2 2 Cm Cementitious materials (Cement + Fly Ash + Gypsum Wallboard)
Table 6-7 Mixture Proportions and Fresh Concrete Properties of Group 2 Preliminary Mixtures (SI [Metric] Units)
Mixture Designation C-1 CF-1 CN-1 CFN-1
CB-1 CFB-1
CNB-1
CFNB-1
CFNB-2
CFNB-3
Cement (kgm3) 358 246 331 215 354 241 318 210 140 186 Class C Fly Ash Weston (kgm3) 0 121 0 119 0 119 0 116 175 115
Powdered Gypsum Wallboard New (kgm3)
0 0 25 25 0 0 24 25 35 49
Water (kgm3) 171 151 181 153 189 164 199 176 166 171 Sand SSD (kgm3) 849 872 840 850 841 857 809 830 827 825
Crushed Stone 19-mm max SSD (kgm3)
1020 1050 1010 1020 1010 1030 971 999 994 994
Sodium Bicarbonate NaHCO3 (kgm3) 0 0 0 0 71 72 68 70 70 70 Water-Cementitious Ratio WCm 048 041 051 043 053 045 058 050 047 049
Slump (mm) 65 65 45 50 70 55 95 65 65 65 Air Content () 13 14 18 19 14 12 21 18 23 22
Air Temperature (degC) 23 23 22 22 23 23 23 23 23 23 Concrete Temperature (degC) 21 22 21 20 23 23 23 22 22 23
Density (kgm3) 2400 2440 2390 2380 2400 2420 2330 2360 2340 2350SSD Saturated surface-dry
27
Table 6-8 Mixture Proportions and Fresh Concrete Properties of Group 2 Preliminary Mixtures (Inch-Pound Units)
Mixture Designation C-1 CF-1 CN-1 CFN-1
CB-1 CFB-1
CNB-1
CFNB-1
CFNB-2
CFNB-3
Cement (lbyd3) 603 414 557 362 596 407 536 354 236 313 Class C Fly Ash Weston (lbyd3) 0 204 0 200 0 201 0 195 295 194
Powdered Gypsum Wallboard New (lbyd3)
0 0 42 42 0 0 40 41 59 82
Water (lbyd3) 288 255 305 258 318 276 336 296 279 289 Sand SSD (lbyd3) 1430 1470 1410 1430 1420 1440 1360 1400 1390 1390
Crushed Stone 34 in max SSD (lbyd3)
1720 1760 1700 1720 1700 1730 1640 1680 1670 1670
Sodium Bicarbonate NaHCO3 (lbyd3) 0 0 0 0 12 12 12 12 12 12 Water-Cementitious Ratio WCm 048 041 051 043 053 045 058 050 047 049
Slump (in) 2 12 2 12 1 34 2 2 34 2 14 3 34 2 12 2 12 2 12Air Content () 13 14 18 19 14 12 21 18 23 22
Air Temperature (degF) 74 73 72 72 73 74 73 74 73 73 Concrete Temperature (degF) 70 71 69 68 74 73 73 71 72 74
Density (lbft3) 150 152 149 149 150 151 145 147 146 146 SSD Saturated surface-dry Table 6-9 and Table 6-10 show test results for compressive strength of Group 2 concrete
mixtures When sodium bicarbonate was used in concrete containing new gypsum wallboard
the 1-day compressive strength of concrete improved but the 28-day compressive strength was
reduced When sodium bicarbonate was used in concrete made with cement (without fly ash or
gypsum) and in concrete made with cement and fly ash (without gypsum) the compressive
strength of concrete was reduced at all test ages of 1 7 and 28 days Unlike Mixture CFOS-3
from Group 1 the test cylinders did not develop any cracking
Table 6-9 Compressive Strength of Group 2 Preliminary Concrete Mixtures (MPa) Age (days) C-1 CF-1 CN-1 CFN-
1 CB-1 CFB-
1 CNB-
1 CFNB-1
CFNB-2
CFNB-3
1 106 60 74 32 90 57 76 57 36 48 7 308 330 236 323 228 202 231 283 265 21528 396 480 347 407 294 299 327 354 400 315
28
Table 6-10 Compressive Strength of Group 2 Preliminary Concrete Mixtures (psi) Age (days) C-1 CF-1 CN-1 CFN-
1 CB-1 CFB-
1 CNB-
1 CFNB-1
CFNB-2
CFNB-3
1 1540 870 1080 470 1310 820 1100 830 520 690 7 4470 4780 3430 4690 3310 2930 3350 4110 3850 312028 5740 6960 5030 5900 4270 4330 4740 5130 5800 4570
Fig 6-3 and Fig 6-4 show cylinders of some of the Group 2 concrete mixtures
Efflorescence on the surface of concrete was noted
Fig 6-3 Efflorescence on a Cylinder of Mixture CFNB-2 Left from Seven-day Compression Test
Fig 6-4 Efflorescence on a Cylinder of Mixture CFNB-3 Left from One-day Compression Test
63 Group 3 Preliminary Mixtures
Group 3 preliminary concrete mixtures were made with ldquoNewrdquo gypsum wallboard and using
half as much sodium sulfate as the original planned see Table 3-2 Mixture CFNS-6 was made
with only one-quarter of the sodium sulfate planned see Table 3-2
Table 6-11 to Table 6-13 show mixture proportions of Group 3 concrete mixtures Mixture
CFNS-1-1 and CFNS-1-2 were twin mixtures made using identical proportions They used the
same proportions of cement fly ash and gypsum wallboard as Mixture CFOS-2 of Group 1
except the source of gypsum wallboard and the amount of sodium sulfate
29
Mixtures CFNS-2-1 and CFNS-2-2 were also twin mixtures made using the same proportions
of cement fly ash and gypsum wallboard as Mixture CFOS-3 of Group 1 except the source of
gypsum wallboard and the amount of sodium sulfate
Efflorescence was observed on leftover concrete from Mixtures CFNS-1-1 CFNS-1-2
CFNS-2-1 CFNS-2-2 and CFNS-6
Table 6-11 Proportions of Powder Materials Used for Group 3 Preliminary Concrete Mixtures Mixture Designation C-3 CFNS-
1-1 CFNS-
1-2 CFNS-
2-1 CFNS-
2-2 CFNS-
6 Laboratory mixture designation Ref-4 New-
10 New-
11 New-
12 New-
13 New-
17 Cement (mass of Cm) 100 40 40 20 20 20 Fly Ash (mass of Cm) 0 50 50 60 60 60
New Gypsum Wallboard (mass of Cm) 0 10 10 20 20 20 Sodium Sulfate (mass of Cm) 0 1 1 2 2 1
Cm Cementitious materials (Cement + Fly Ash + Gypsum Wallboard)
Table 6-12 Mixture Proportions and Fresh Properties of Group 3 Preliminary Concrete Mixtures (SI [Metric] Units)
Mixture Designation C-3 CFNS-1-1
CFNS-1-2
CFNS-2-1
CFNS-2-2
CFNS-6
Cement (kgm3) 360 146 147 72 73 73 Class C Fly Ash Weston (kgm3) 0 182 184 217 220 218
Powdered Gypsum Wallboard New (kgm3) 0 36 37 72 73 73 Water (kgm3) 163 164 160 165 145 155
Sand SSD (kgm3) 853 854 861 848 862 855 Crushed Stone 19-mm max SSD (kgm3) 1030 1040 1050 1030 1050 1030
Sodium Sulfate Na2SO4 (kgm3) 0 36 37 72 73 36 Water-Cementitious Ratio WCm 045 045 044 046 039 043
Slump (mm) 50 50 55 40 45 25 Air Content () 18 hellip hellip hellip hellip hellip
Air Temperature (degC) 23 23 24 23 23 24 Concrete Temperature (degC) 22 hellip hellip hellip hellip hellip
Density (kgm3) 2400 2420 2440 2410 2430 2410 SSD Saturated surface-dry
30
Table 6-13 Mixture Proportions and Fresh Properties of Group 3 Preliminary Concrete Mixtures (Inch-Pound Units)
Mixture Designation C-3 CFNS-1-1
CFNS-1-2
CFNS-2-1
CFNS-2-2
CFNS-6
Cement (lbyd3) 606 245 247 122 124 122 Class C Fly Ash Weston (lbyd3) 0 307 309 365 371 367
Powdered Gypsum Wallboard New (lbyd3) 0 61 62 122 124 122 Water (lbyd3) 274 276 269 278 244 261
Sand SSD (lbyd3) 1440 1440 1450 1430 1450 1440 Crushed Stone 34 in max SSD (lbyd3) 1730 1750 1760 1730 1760 1740
Sodium Sulfate Na2SO4 (lbyd3) 0 6 6 12 12 6 Water-Cementitious Ratio WCm 045 045 044 046 039 043
Slump (in) 2 2 2 14 1 12 1 34 1 Air Content () 18 hellip hellip hellip hellip hellip
Air Temperature (degF) 74 74 76 74 73 76 Concrete Temperature (degF) 72 hellip hellip hellip hellip hellip
Density (lbft3) 150 151 152 150 151 150 SSD Saturated surface-dry Table 6-14 and Table 6-15 show the test results for compressive strength of Group 3 concrete
mixtures The strength of Mixtures CFNS-1-1 and CFNS-1-2 were not significantly lower than
that of Mixture CFOS-2 Also the strength of Mixtures CFNS-2-1 and CFNS-2-2 were not
significantly lower than that of Mixture CFOS-3 The strength of Mixtures CFNS-1-1 CFNS-1-
2 CFNS-2-1 and CFNS-2-2 were quite acceptable
Upon careful inspection it was noted that cylinders of Mixture CFNS-6 cracked by
themselves before reaching the age of seven days Cylinders of Mixtures CFNS-2-1 and CFNS-
2-2 must have cracked as well
31
Table 6-14 Compressive Strength of Group 3 Preliminary Concrete Mixtures (MPa) Age (days) C-3 CFNS-
1-1 CFNS-
1-2 CFNS-
2-1 CFNS-
2-2 CFNS-
6 1 117 23Dagger 22 19 19 12Dagger 7 303 247dagger 258dagger 96dagger 85dagger hellip 28 359 hellip hellip hellip hellip hellip
Dagger Average from testing two cylinders dagger Result from testing one cylinder The rest are averages from three tests Cylinders had cracked on their own
Table 6-15 Compressive Strength of Group 3 Preliminary Concrete Mixtures (psi) Age (days) C-3 CFNS-
1-1 CFNS-
1-2 CFNS-
2-1 CFNS-
2-2 CFNS-
6 1 1690 330Dagger 320 270 270 180Dagger 7 4390 3580dagger 3740dagger 1390dagger 1240dagger hellip 28 5210 hellip hellip hellip hellip hellip
Dagger Average from testing two cylinders dagger Result from testing one cylinder The rest are averages from three tests Cylinders had cracked on their own Based on the results of preliminary mixing and testing of concrete it was decided to make
final mixture CFNS-4 using the mixture proportions of Mixtures CFNS-1-1 and CFNS-1-2
Final mixture CFNS-5 was made using the mixture proportions of Mixtures CFNS-2-1 and
CFNS-2-2
32
CHAPTER 7 FINAL MIXTURES
In total eight final concrete mixtures were made to evaluate the slump retention time of
initial setting compressive strength and length change of concrete In addition mortar bars
were made for evaluation of sulfate resistance
71 Mixture Proportions
Table 7-1 presents the proportions of powder materials used for final concrete mixtures The
mixtures were made in two groups Group 1 Mixtures C-2 CN-2 CFN-2 and CFN-3 were
made using up to 20 fly ash and 20 powdered wallboard with water-reducing admixture and
without sodium sulfate Group 2 Mixtures Ref-5 CFNS-3 CFNS-4 and CFNS-5 were made
using up to 60 fly ash 20 powdered wallboard 2 sodium sulfate and without water-
reducing admixture Sodium sulfate was added as powder to a concrete mixture
Table 7-1 Proportions of Powder Materials Used for Final Concrete Mixtures Mixture Designation C-2 CN-2 CFN-
2 CFN-
3 C-4 CFN
S-3 CFNS-4
CFNS-5
Laboratory mixture designation Ref-3 New-7
New-8
New-9
Ref-5 New-14
New-15
New-16
Cement (mass of Cm) 100 90 70 60 100 60 40 20 Fly Ash (mass of Cm) 0 0 20 20 0 33 50 60
New Gypsum Wallboard (mass of Cm) 0 10 10 20 0 7 10 20 Sodium Sulfate (mass of Cm) 0 0 0 0 0 1 1 2
Cm Cementitious materials (Cement + Fly Ash + Gypsum Wallboard) The mixture proportions and fresh properties of the main concrete mixtures are presented in
Table 7-2 (in SI units) and Table 7-3 (in inch-pound units) To evaluate retention of slump
slump was measured twice (1) immediately after mixing was done and (2) 30 minutes later In
general the concrete mixtures retained their workability
33
Table 7-2 Mixture Proportions and Fresh Concrete Properties of Final Mixtures (SI [Metric] Units) Mixture Designation C-2 CN-2 CFN-
2 CFN-
3 C-4 CFN
S-3 CFNS-4
CFNS-5
Cement (kgm3) 362 316 249 212 365 217 144 71 Class C Fly Ash Weston (kgm3) 0 0 71 71 0 119 180 213
Powdered Gypsum Wallboard New (kgm3) 0 35 35 71 0 25 36 71 Water (kgm3) 164 164 170 153 163 154 153 157
Sand SSD (kgm3) 856 830 840 835 861 854 852 839 Crushed Stone 19-mm max SSD (kgm3) 1030 999 1010 1010 1030 1030 1020 1010
Sodium Sulfate Na2SO4 (kgm3) 0 0 0 0 0 36 36 71 Water-Reducing Admixture (Lm3) 0 103 104 104 0 0 0 0 Water-Cementitious Ratio WCm 045 047 048 043 045 043 042 044
Slump (mm) 55 50 40 30 30 40 45 25 Slump 30 minutes later (mm) 30 40 25 20 40 30 15 15
Air Content () 18 37 26 32 14 22 15 17 Air Temperature (degC) 23 24 23 24 23 23 23 24
Concrete Temperature (degC) 23 23 23 25 24 24 25 25 Density (kgm3) 2410 2340 2380 2350 2420 2400 2390 2370
SSD Saturated surface-dry
Table 7-3 Mixture Proportions and Fresh Concrete Properties of Final Mixtures (Inch-Pound Units)
Mixture Designation C-2 CN-2 CFN-2
CFN-3
C-4 CFNS-3
CFNS-4
CFNS-5
Cement (lbyd3) 610 532 419 357 614 366 243 120 Class C Fly Ash Weston (lbyd3) 0 0 120 119 0 201 303 359
Powdered Gypsum Wallboard New (lbyd3) 0 59 59 119 0 43 61 120 Water (lbyd3) 276 276 287 257 274 259 257 264
Sand SSD (lbyd3) 1440 1400 1410 1410 1450 1440 1430 1410Crushed Stone 34 in max SSD (lbyd3) 1730 1680 1700 1690 1740 1730 1720 1700
Sodium Sulfate Na2SO4 (lbyd3) 0 0 0 0 0 6 6 12 Water-Reducing Admixture (fl ozyd3) 0 265 269 268 0 0 0 0
Water-Cementitious Ratio WCm 045 047 048 043 045 043 042 044Slump (in) 2 14 2 1 12 1 14 1 14 1 12 1 34 1
Slump 30 minutes later (in) 1 14 1 12 1 34 1 12 1 14 12 12 Air Content () 18 37 26 32 14 22 15 17
Air Temperature (degF) 73 75 74 75 74 74 74 75 Concrete Temperature (degF) 73 74 74 77 75 76 77 77
Density (lbft3) 150 146 148 146 151 150 149 148 SSD Saturated surface-dry
72 Time of Initial Setting
Table 7-4 presents test results of the time of initial setting final concrete mixtures It took
about twice as long for the mixtures containing fly ash and powdered gypsum wallboard to reach
34
initial setting as their reference concrete mixtures It is well known that concrete mixtures
containing large amount of fly ash may show delayed setting
Table 7-4 Time of Initial Setting of Final Concrete Mixtures Mixture Designation C-2 CN-2 CFN-
2 CFN-
3 C-4 CFN
S-3 CFNS-4
CFNS-5
Time of Initial Setting (hours) 48 72 114 120 47 98 118 105
73 Compressive Strength
Compressive strength test results for final concrete mixtures are shown in Table 7-5 (in
MPa) Table 7-6 (in psi) Fig 7-1 and Fig 7-2
Table 7-5 Compressive Strength of Final Concrete Mixtures (MPa) Age (days) C-2 CN-2 CFN-
2 CFN-
3 C-4 CFN
S-3 CFNS-4
CFNS-5
1 168 111 42 39 159 58 38 24 3 301 197 174 132 302 237 178 79 7 354 232 265 154 347 301 297 12528 448 285 414 211 408 415 420 hellip 91 508 419 501 289 515 443 497 hellip
Cylinders had already cracked on their own before testing started
Table 7-6 Compressive Strength of Final Concrete Mixtures (psi) Age (days) C-2 CN-2 CFN-
2 CFN-
3 C-4 CFN
S-3 CFNS-4
CFNS-5
1 2430 1610 610 560 2310 840 550 350 3 4360 2860 2520 1910 4380 3440 2580 11407 5140 3370 3850 2240 5040 4370 4310 1810
28 6500 4140 6000 3060 5920 6020 6090 hellip 91 7370 6070 7270 4190 7470 6430 7210 hellip
Cylinders had already cracked on their own before testing started
35
0
10
20
30
40
50
60
1 10 100
Age (days)
Com
pres
sive
Str
engt
h (M
Pa)
0
1000
2000
3000
4000
5000
6000
7000
8000
(psi
)
Ref-3New-7New-8New-9
Fig 7-1 Compressive Strength of Final Concrete Mixtures Group 1
The mixtures CN-2 CFN-2 and CFN-3 showed lower compressive strength than C-2
Mixture CFN-2 showed structural-grade strength of 265 MPa (3850 psi) at seven days and a
relatively high compressive strength of 41 MPa (6000 psi) at 28 days Mixture CN-2 showed
structural-grade strength of 285 MPa (4140 psi) at 28 days
0
10
20
30
40
50
60
1 10 100
Age (days)
Com
pres
sive
Str
engt
h (M
Pa)
0
1000
2000
3000
4000
5000
6000
7000
8000
(psi
)
Ref-5New-14New-15New-16
Fig 7-2 Compressive Strength of Final Concrete Mixtures Group 2
36
As early as at seven days the mixtures CFNS-3 and CFNS-4 showed structural-grade
strength of 301 MPa (4370 psi) and 297 MPa (4310 psi) This is noteworthy considering the
fact that Mixtures CFNS-3 and CFNS-4 were made by replacing 40 and 60 of cement with
blends of fly ash and powdered gypsum wallboard At the age of 28 days the mixtures CFNS-3
and CFNS-4 reached compressive strength of 415 MPa (6020 psi) and 420 MPa (6090 psi) and
became as strong as Mixture Ref-5
The cylinders made from Mixture CFNS-5 cracked on their own before reaching the age of
seven days (Fig 7-3) This was attributed to an excessive expansive reaction resulting from use
of the particular proportions of cement fly ash powdered gypsum wallboard and sodium sulfate
in Mixture CFNS-5 Mixture CFNS-6 was made using half as much sodium sulfate (1 of
cementitious materials) as CFNS-5 nonetheless cylinders made from Mixture CFNS-6 cracked
before reaching the age of seven days
Fig 7-3 Cracked Cylinders of Concrete Mixtures CFNS-5 and CFNS-6
37
74 Length Change
Test results for length change of final concrete mixtures are shown in Table 7-7 Fig 7-5
and Fig 7-6
Table 7-7 Length Change of Final Concrete Mixtures () Age (days) C-2 CN-2 CFN-2 CFN-3 C-4 CFNS-
3 CFNS-
4 CFNS-
5 1 0 0 0 0 0 0 0 0 3 -0001 0010 0015 0018 0000 0006 0041 0359 7 -0003 0013 0031 0036 0004 0005 0039 1708
28 0004 0026 0033 0116 0002 0010 0043 hellip 32 -0010 0009 0012 0098 -0007 -0007 0030 hellip 35 -0015 0003 0009 0089 -0013 -0013 0025 hellip 42 -0022 -0003 -0002 0077 -0018 -0020 0020 hellip 56 -0028 -0020 -0004 0057 -0024 -0028 0014 hellip 84 -0033 -0027 -0010 0037 -0031 -0035 0011 hellip 140 -0036 -0035 -0017 0027 -0035 -0035 0006 hellip
Specimens had cracked on their own All of the concrete mixtures made with powdered gypsum wallboard showed higher
expansion than their reference concrete mixtures during immersion in saturated limewater
Mixture CFN-3 containing 20 fly ash and 20 powdered gypsum wallboard showed a large
expansion (0120) Specimens made from Mixture CFNS-5 containing 60 fly ash and 20
powdered gypsum wallboard showed excessive expansion and they cracked before reaching the
age of seven days (Fig 7-4)
38
Fig 7-4 Length-Change Specimen of Concrete
Mixture CFNS-5 Showing a Crack
-004
-002
000
002
004
006
008
010
012
0 30 60 90 120 150
Age (days)
Leng
th C
hang
e (
)
Ref-3New-7New-8New-9
Fig 7-5 Length Change of Final Concrete Mixtures Group 1
During drying Mixture CN-2 and CFN-3 made by using high proportions of powdered
gypsum wallboard to fly ash shrunk by greater extents than Mixture C-2 At the age of 140
days the net shrinkage of Mixture CN-2 was 0035 which was approximately the same as that
of C-2 0036 Mixture CFN-3 showed a net expansion of 0027 at 140 day Mixture CFN-2
shrunk by approximately the same amount as Mixture C-2 resulting in a net shrinkage of
0017 at 140 days
39
-004
-002
000
002
004
006
008
010
012
0 30 60 90 120 150
Age (days)
Leng
th C
hang
e (
)
Ref-5New-14New-15New-16
Fig 7-6 Length Change of Final Concrete Mixtures Group 2
The length change of Mixture CFNS-3 (made with 60 cement 33 fly ash and 7
powdered gypsum wallboard) was approximately the same as that of Mixture Ref-5 Mixture
CFNS-4 (made with 40 cement 50 fly ash and 10 powdered gypsum wallboard) showed a
relatively large expansion (0043) during immersion in saturated limewater and shrunk during
drying as much as it had expanded resulting in very small net expansion of 0006 at the age of
140 days This concrete mixture could be used to minimize drying shrinkage cracking of
concrete Mixture CFNS-4 could be used to minimize drying shrinkage cracking of concrete
75 Sulfate Resistance
Mortar cubes and bars were made using the same proportions of cement fly ash and gypsum
wallboard as the final concrete mixtures Ref-5 CFNS-3 and CFNS-4 No mortar mixture was
made using the powder-materials proportions of concrete mixture CFNS-5 because it was
anticipated that such mortar would crack
Table 7-8 shows the proportions of the mortar mixtures produced
40
Table 7-8 Mixture Proportions and Flow of Mortar Mixtures Mixture Designation C-c C-b CFNS-1c CFNS-1b CFNS-2c CFNS-2b
Laboratory mixture designation C-2 cube C-2 bar N-3 cube N-3 bar N-4 cube N-4 barCement (mass of Cm) 100 100 60 60 40 40 Fly Ash (mass of Cm) 0 0 33 33 50 50
New Gypsum Wallboard (mass of Cm) 0 0 7 7 10 10 Sodium Sulfate (mass of Cm) 0 0 1 1 1 1
Cement (g) 500 740 300 444 200 296 Class C Fly Ash Weston (g) 0 0 165 2442 250 370
Powdered Gypsum Wallboard New (g) 0 0 35 518 50 74 Sodium Sulfate Na2SO4 (g) 0 0 5 74 5 76
Water (g) 242 359 216 3204 200 2967 Water-Cementitious Ratio WCm 0484 0485 0432 0433 0400 0401
Graded Standard Sand (g) 1375 2035 1375 2035 1375 2035 Flow (mm) 190 hellip 185 hellip 191 hellip
Cm Cementitious materials (Cement + Fly Ash + Gypsum Wallboard) Table 7-9 and Table 7-10 show test results for the compressive strength of mortar mixtures
It took approximately 15 days for Mixture C-c to attain a compressive strength of 20 MPa
(2900 psi) For Mixture N-3 it took 47 days and for Mixture N-4 7 days
Table 7-9 Compressive Strength of Mortar (MPa) Age (days) C-c CFNS-1c CFNS-2c
1 148 45 11 4 314 174 111 5 hellip 212 hellip
5125 hellip hellip 167 7 hellip hellip 197 24 hellip hellip 250 28 396 316
Note These results are averages obtained from testing two cubes for each mixture at each test age
Table 7-10 Compressive Strength of Mortar (psi) Age (days) C-c CFNS-1c CFNS-2c
1 2140 650 160 4 4550 2530 1610 5 hellip 3070 hellip
5125 hellip hellip 2420 7 hellip hellip 2850 24 hellip hellip 3630 28 5750 4580 hellip
Note These results are averages obtained from testing two cubes at each test age for each mixture
41
0
5
10
15
20
25
30
35
40
45
0 5 10 15 20 25 30Age (days)
Com
pres
sive
Str
engt
h (p
si)
0
1000
2000
3000
4000
5000
6000
(MP
a)
C-2N-3N-4
Fig 7-7 Compressive Strength of Mortar Cubes
Once the mixture attained the specified compressive strength of 20 MPa (2900 psi) the
mortar bars were immersed in a 5 sodium sulfate solution and length change of the bars were
measured after specified periods to assess sulfate resistance of mortar mixtures Table 7-11 and
Fig 7-8 show test results for length change of mortar bars A larger expansion implies a lower
resistance of mortar mixture to sulfate attack and a smaller expansion implies a higher resistance
to sulfate attack
Table 7-11 Length Change of Mortar Bars () Age after immersion in 5 sodium sulfate
solution (days) C-b CFNS-1b CFNS-2b
0 0 0 0 7 0007 0016 0006 14 0013 0024 0009 21 0016 0028 0009 28 0020 0033 0009 42 0027 0044 0011 56 0034 0063 0010
Number of specimens tested C-b five N-1-b six and N-2-b three
42
000
001
002
003
004
005
006
007
0 7 14 21 28 35 42 49 56 63
Days after immersion in Na2SO4 solution
Len
gth
Cha
nge
()
C-bCFNS-1bCFNS-2b
Fig 7-8 Length Change of Mortar Bars in 5 Sodium Sulfate Solution
After 56 days of immersion in sodium sulfate solution Mixture C-b (Control) showed an
expansion of approximately 0034 Mixture N-3 (made with 33 fly ash and 7 powdered
gypsum wallboard and 1 sodium sulfate) shows an expansion of 0063 which was
approximately 19 times that of Mixture C-b Mixture N-4 (made with 50 fly ash 10
powdered gypsum wallboard and 1 sodium sulfate) showed an expansion of 0010 which is
significantly lower than that of Mixture C-b (Control) This means that Mixture N-4 possesses
significantly higher resistance to sulfate attack than Mixture C-b Importantly the expansion of
mortar bars made from Mixture N-4 stabilized after 14 days of immersion in sodium sulfate
solution
76 Summary
Table 7-12 shows a summary of proportions of powder materials and properties of final
concrete mixtures Table 7-13 shows a summary of proportions and length change in sulfate
solution of mortar mixtures
43
Table 7-12 Proportions of Powder Materials and Properties of Final Concrete Mixtures Mixture Designation C-2 CN-2 CFN-2 CFN-3 C-4 CFNS-
3 CFNS-
4 CFNS-
5 Cement (mass of Cm) 100 90 70 60 100 60 40 20 Fly Ash (mass of Cm) 0 0 20 20 0 33 50 60
New Gypsum Wallboard (mass of Cm) 0 10 10 20 0 7 10 20 Sodium Sulfate (mass of Cm) 0 0 0 0 0 1 1 2
Time of Initial Setting (hours) 48 72 114 120 47 98 118 105 Compressive Strength (MPa)
1-day 168 111 42 39 159 58 38 24 3-day 301 197 174 132 302 237 178 79 7-day 354 232 265 154 347 301 297 125
28-day 448 285 414 211 408 415 420 hellip 91-day 508 419 501 289 515 443 497 hellip
Compressive Strength (psi) 1-day 2430 1610 610 560 2310 840 550 350 3-day 4360 2860 2520 1910 4380 3440 2580 1140 7-day 5140 3370 3850 2240 5040 4370 4310 1810
28-day 6500 4140 6000 3060 5920 6020 6090 hellip 91-day 7370 6070 7270 4190 7470 6430 7210 hellip
Length Change () 1-day 0 0 0 0 0 0 0 0 7-day -0003 0013 0031 0036 0004 0005 0039 1708
28-day 0004 0026 0033 0116 0002 0010 0043 hellip 140-day -0036 -0035 -0017 0027 -0035 -0035 0006 hellip
Cm Cementitious materials (Cement + Fly Ash + Gypsum Wallboard) Specimens had cracked on their own
Table 7-13 Proportions of Powder Materials and Length Change in Sulfate Solution of Mortar Mixtures
Mixture Designation C-b CFNS-1b
CFNS-2b
Laboratory mixture designation Cement (mass of Cm) 100 60 40 Fly Ash (mass of Cm) 0 33 50
New Gypsum Wallboard (mass of Cm) 0 7 10 Sodium Sulfate (mass of Cm) 0 1 1
Length Change in 5 Sodium Sulfate Solution () 0-day 0 0 0 7-day 0007 0016 0006
14-day 0013 0024 0009 21-day 0016 0028 0009 28-day 0020 0033 0009 42-day 0027 0044 0011 56-day 0034 0063 0010
44
Table 7-14 shows a summary of properties of selected promising main concrete mixtures
Mixtures CFN-2 CFNS-3 and CFNS-4 were comparable to their reference concrete mixtures in
compressive strength at the ages of 7 days and later Based on the sulfate resistance of Mortar
N-4 it is expected that concrete Mixture CFNS-4 will also possess high resistance to sulfate
attack
Table 7-14 Summary of Proportions and Properties of Selected Final Concrete Mixtures and Mortar Mixtures
Mixture Designation C-4 CFN-2 CFNS-3
CFNS-4
Cement (mass of Cm) 100 70 60 40 Fly Ash (mass of Cm) 0 20 33 50
New Gypsum Wallboard (mass of Cm) 0 10 7 10 Sodium Sulfate (mass of Cm) 0 0 1 1
Time of Initial Setting (hours) 47 114 98 118 Compressive Strength (MPa)
1-day 159 42 58 38 3-day 302 174 237 178 7-day 347 265 301 297
28-day 408 414 415 420 91-day 515 501 443 497
Compressive Strength (psi) 1-day 2310 610 840 550 3-day 4380 2520 3440 2580 7-day 5040 3850 4370 4310
28-day 5920 6000 6020 6090 91-day 7470 7270 6430 7210
Length Change () 1-day 0 0 0 0
28-day 0002 0033 0010 0043 140-day -0035 -0017 -0035 0006
28-day Length Change of Mortar in 5 Sodium Sulfate Solution ()
0020 hellip 0033 0009
Cm Cementitious materials (Cement + Fly Ash + Gypsum Wallboard)
45
CHAPTER 8 ECONOMIC IMPACT ANALYSIS OF FULL-
SCALE IMPLEMENTATION
It is estimated that over 80000 tons of gypsum wallboard is disposed of each year from new
construction and demolition in Wisconsin If a tipping fee plus handling and transportation cost
of $30 per ton is assumed the disposal of gypsum wallboard costs Wisconsin citizens and
industry approximately $24 million dollars each year
Based on figures from the National Ready-Mixed Concrete Association Wisconsin produced
approximately 11 million cubic yards (84 million m3) of concrete in 2004 Based on a cement
content of 400 pounds per cubic yard (240 kgm3) of concrete 22 million tons of cement is used
in concrete each year in Wisconsin
This project showed that powdered gypsum wallboard could constitute approximately 10
of total cementitious materials used in a concrete mixture If this new cementitious material was
used in 20 of the concrete produced in Wisconsin approximately 44000 tons of gypsum
wallboard can be used In other words approximately half of the gypsum wallboard waste
generated in Wisconsin could be used in this application alone This would save Wisconsin
industry $13 million dollars each year in avoided disposal costs leading to reduce the cost for
concrete construction in Wisconsin Citizens would benefit also by reducing landfilling cost for
municipalities and increasing recycling rates of useful materials If 40 of the concrete
generated in Wisconsin used this new concrete mixture technology all of the waste gypsum
wallboard generated in Wisconsin could be used in this one application Therefore all 80000
tons of waste gypsum wallboard could be diverted from Wisconsin landfills It would save
Wisconsin citizens and industry over $24 million dollars each year in avoided disposal cost
46
This economic impact does not include incalculable dollar-benefits due to avoided possible
future environmental impact of sending such large quantities of gypsum wallboard into landfills
This project also showed that up to 60 of cement in concrete mixtures could be replaced
with a blend of Class C fly ash and gypsum wallboard Cement is a valuable commodity If it is
assumed that cement sells at $100 per ton and Class C fly ash sells at $50 per ton use of a
cementitious blend consisting of 40 cement 50 Class C fly ash and 10 powdered gypsum
in producing 40 of concrete in Wisconsin would result in savings on cement of about $50
million and expenditure on fly ash of about $20 million with a net savings of about $30 million
each year
Saving cement through this new technology would also reduce emissions of carbon dioxide
and other GHGs because production of one ton of cement releases about one ton of GHGs If
this new technology to use a blend of Class C fly ash and gypsum wallboard as a replacement of
cement were implemented in producing up to 40 of concrete in Wisconsin it would reduce the
GHG emissions by up to 12 million tons each year CO2 credits currently sell for about $20 per
ton Therefore CO2 credits would be worth $10 million each year
With a potential total value of $24 million in avoided disposal costs $30 million in savings
resulting from cement replacement plus $10 million in CO2 credits total economic benefit to
Wisconsin that could be generated by this project may be valued at about $42 million each year
47
CHAPTER 9 CONCLUSIONS
This project showed that from 30 to 60 of cement in concrete mixtures could be
successfully replaced with blends of Class C fly ash and powdered gypsum wallboard Several
concrete mixtures made by such replacements showed compressive strength nearly as high as
that of Reference concrete mixtures (without replacement of cement) at seven days The 28-day
compressive strength of these concrete mixtures containing fly ash and gypsum wallboard were
equivalent to that of Reference concrete mixtures Use of sodium sulfate as an activator was
essential in improving the 1-day and 3-day strength of concrete containing Class C fly ash and
gypsum wallboard
A concrete mixture made with a cementitious blend of 40 cement 50 Class C fly ash
and 10 powdered gypsum wallboard showed a relatively large expansion (0043) during
immersion in saturated limewater and shrunk during drying as much as it had expanded
resulting in very small net expansion at the age of 140 days This concrete mixture could be
used to minimize drying shrinkage cracking and subsequent increase in durability of concrete
A mortar mixture made with a cementitious blend of 40 cement 50 Class C fly ash and
10 powdered gypsum wallboard showed much higher resistance to sulfate attack compared
with Reference mortar (without replacement of cement)
Total economic benefit to Wisconsin that could be generated by this project may be valued at
up to about $42 million each year
48
CHAPTER 10 REFERENCES
ASTM C 33-03 ldquoStandard Specification for Concrete Aggregatesrdquo ASTM International West Conshohocken PA 11 pp
ASTM C 150-05 ldquoStandard Specification for Portland Cementrdquo ASTM International West Conshohocken PA 8 pp
ASTM C 192 C 192M-05 ldquoStandard Practice for Making and Curing Concrete Test Specimens in the Laboratoryrdquo 8 pp
ASTM C 494C 494M-05a ldquoStandard Specification for Chemical Admixtures for Concreterdquo ASTM International West Conshohocken PA 10 pp
ASTM C 618-03 ldquoStandard Specification for Coal Fly Ash and Raw or Calcined Natural Pozzolan for Use in Concreterdquo ASTM International West Conshohocken PA 3 pp
ASTM C 1012-04 ldquoStandard Test Method for Length Change of Hydraulic-Cement Mortars Exposed to a Sulfate Solutionrdquo ASTM International West Conshohocken PA 6 pp
Aimin X and Sarkar S L ldquoMicrostructural Study of Gypsum Activated Fly Ash Hydration in Cement Pasterdquo Cement and Concrete Research Vol 21 1991 pp 1137-1147
Drywallrecyclingorg lthttpwwwdrywallrecyclingorggt (February 2006)
EPA Presentation by the US Environmental Protection Agency at the Massachusetts DEP Gypsum Workgroup March 18 2004
Freeman R B and Carrasquillo R L ldquoProduction of Sulfate-Resistant Concrete Containing High-Calcium Fly Ash and Sodium Sulfate Admixturerdquo Proceedings of Fifth CANMETACI International Conference on Fly Ash Silica Fume Slag and Natural Pozzolans in Concrete ACI SP-153 Vol 1 1995 pp 153-176
ICF Northwest ldquoCalcium Spray Dryer Waste Management Design Guidelinesrdquo EPRI (Electric Power Research Institute) Report No CS-5312 September 1987 p 3-3
Krocak R F Meininger R and Yost P A Chapter 21 ldquoBeneficial Reuse of Aggregate Mineral Fines and Scrap New Construction Wallboardrdquo Land Application of Agricultural Industrial and Municipal By-Products (6) James F Powers and Warren P Dick ed SSSA Number 6 in the Soil Science Society of America Book Series ISBN 0-89118-834-7 Item Number 60901 2000 653 pages
Kumar P K and Monteiro P J M ldquoConcrete Microstructure Properties and Materialsrdquo 2nd Ed McGraw-Hill 1993
Lafarge Group ltwwwlafargecomgt (February 2006)
49
Ma W Liu C Brown P W and Komarneni S ldquoPore Structures of Fly Ashes Activated By Ca(OH)2 and CaSO42H2Ordquo Cement and Concrete Research Vol 25 No 2 1995 pp 417-425
McCall R ldquoWasteCap Wisconsin Drywall-To-Fertilizer Projectrdquo Final Report for the US Environmental Protection Agency August 1993
Merritt F S and Ricketts J T editors Building Design and Construction Handbook McGraw Hill 6th Ed 2001 pp 435-438
Mindness S Young J F and Darwin D ldquoConcreterdquo 2nd Ed Prentice Hall 2002
Naik T R Kraus R N Chun Y-m and Nageotte S O ldquoCoal-Combustion Bottom Ash for Reducing the Shrinkage of Concrete Made With Portland Cement and Sulfoaluminate Cementrdquo Jean Pera Symposium on Specialty Cements and Sustainability Issues a part of the proceedings of the Ninth CANMETACI International Conference on Recent Advances in Concrete Technology Warsaw Poland May 2007 pp 141-155
Neville A ldquoProperties of Concreterdquo 4th Ed Longman 1995
Pera J and Ambroise J ldquoNew Applications of Calcium Sulfoaluminate Cementrdquo Cement and Concrete Research Vol 34 No 4 April 2004 pp 671-676
Prusinski J R and Carrasquillo R L ldquoUsing Medium- to High-Volume Fly Ash Blended Cements to Improve the Sulfate Resistance of High-Lime Fly Ash Concreterdquo Proceedings of Fifth CANMETACI International Conference on Fly Ash Silica Fume Slag and Natural Pozzolans in Concrete ACI SP-153 Vol 1 1995 pp 43-65
Reindl J R ldquoBibliography of Gypsum Drywallrdquo available on the WasteCap Wisconsin website httpwwwwastecapwiorg August 2002 73 pages
WI-DNR ldquoSubstituting Waste Gypsum Wallboard for Agricultural Gypsumrdquo Wisconsin Department of Natural Resources Bureau of Waste Management DNR Publication WA-607-04 rev 2005
Wolkowski R ldquoDemonstration of Land Application of Crushed Gypsum Wallboard Waste for Alfalfardquo Final report to the Wisconsin Department of Natural Resources Waste Reduction and Recycling Grant Program and Dane County Department of Public Works August 12 1998
Wolkowski R P ldquoUsing Recycled Wallboard for Crop Production (A3782)rdquo WasteCap Wisconsin Inc 2003
Wu Z and Naik T R ldquoUse of Clean Coal Ash as Setting Time Regulator in Portland Cementrdquo Proceedings of the Fifth CANMETACI International Conference on Recent Advances in Concrete Technology Supplementary Papers 2001 pp 83-94
50
Wu Z and Naik T R ldquoProperties of Concrete Produced from Multicomponent Blended Cementsrdquo Cement and Concrete Research Vol 32 2002 pp 1937-1942
Wu Z and Naik T R ldquoChemically Activated Blended Cementsrdquo ACI Materials Journal September-October 2003 pp 434-440
- 08 Naik Chun cover
- 08 MIL NaikGypsumWallboard in concrete
-
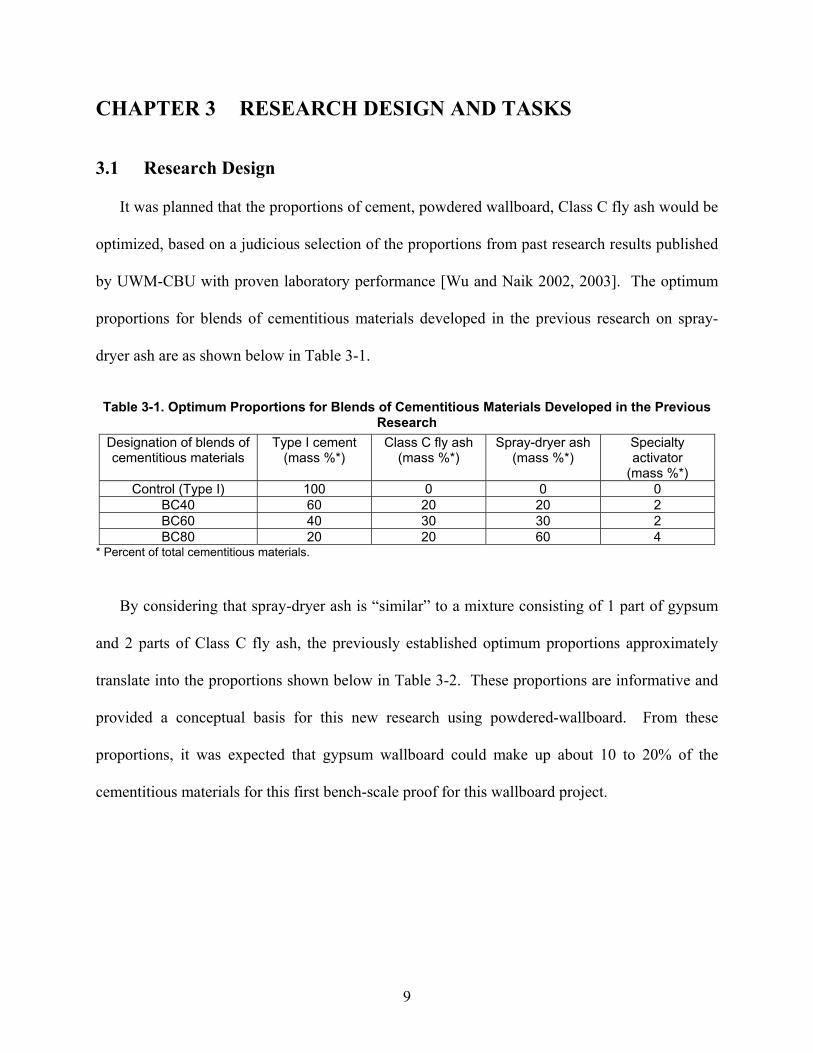
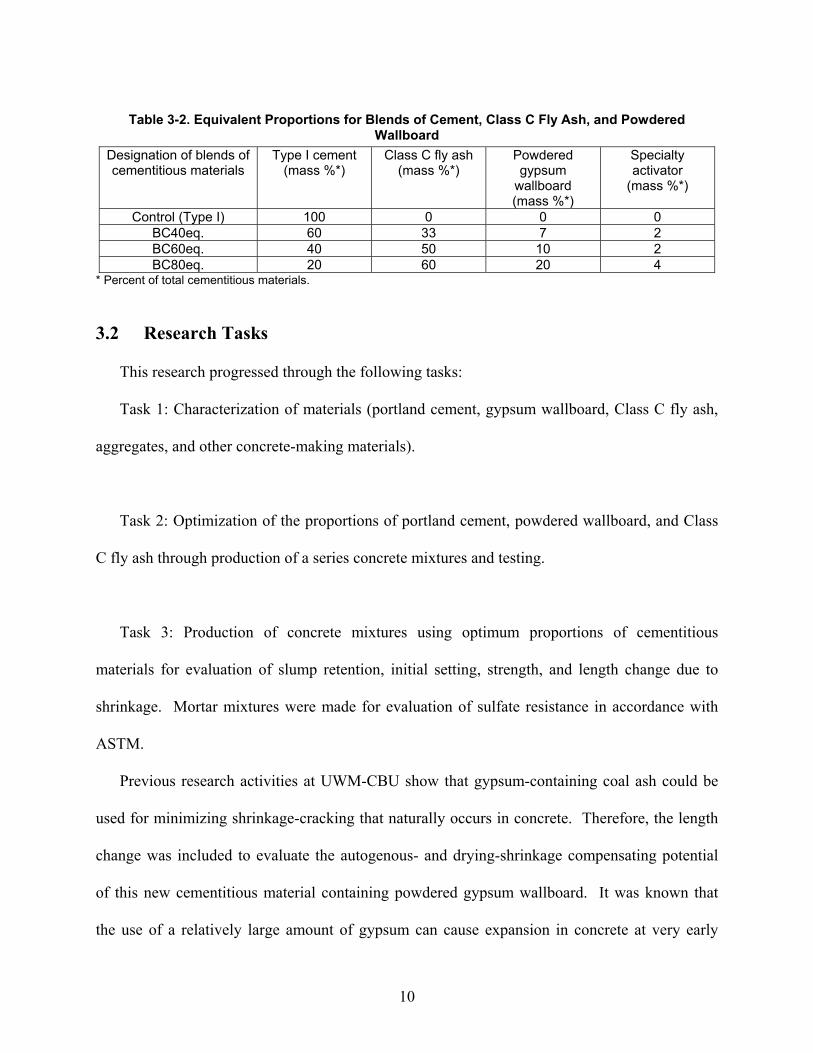
10
Table 3-2 Equivalent Proportions for Blends of Cement Class C Fly Ash and Powdered Wallboard
Designation of blends of cementitious materials
Type I cement (mass )
Class C fly ash (mass )
Powdered gypsum
wallboard (mass )
Specialty activator
(mass )
Control (Type I) 100 0 0 0 BC40eq 60 33 7 2 BC60eq 40 50 10 2 BC80eq 20 60 20 4
Percent of total cementitious materials
32 Research Tasks
This research progressed through the following tasks
Task 1 Characterization of materials (portland cement gypsum wallboard Class C fly ash
aggregates and other concrete-making materials)
Task 2 Optimization of the proportions of portland cement powdered wallboard and Class
C fly ash through production of a series concrete mixtures and testing
Task 3 Production of concrete mixtures using optimum proportions of cementitious
materials for evaluation of slump retention initial setting strength and length change due to
shrinkage Mortar mixtures were made for evaluation of sulfate resistance in accordance with
ASTM
Previous research activities at UWM-CBU show that gypsum-containing coal ash could be
used for minimizing shrinkage-cracking that naturally occurs in concrete Therefore the length
change was included to evaluate the autogenous- and drying-shrinkage compensating potential
of this new cementitious material containing powdered gypsum wallboard It was known that
the use of a relatively large amount of gypsum can cause expansion in concrete at very early
11
ages but the concrete can safely accommodate such expansion at early ages If the net length
change due to early expansion and later drying shrinkage of concrete is negligible then such a
characteristic can help to minimize the overall cracking leading to enhanced durability of such
concretes
12
CHAPTER 4 MATERIALS
41 Portland Cement
ASTM Type I portland cement obtained from Lafarge North America was used in this
research The chemical composition and physical properties of the cement used are presented in
Table 4-1 and Table 4-2 respectively along with the requirements of ASTM Standard
Specification for Portland Cement [ASTM C 150] These data were provided by the cement
producer The cement met the standard chemical and physical requirements of ASTM C 150
Table 4-1 Chemical Composition of Portland Cement Item ( by mass) Cement
results Standard requirements of ASTM C
150 for Type I cement Silicon dioxide SiO2 202 hellip
Aluminum oxide Al2O3 45 hellip Ferric oxide Fe2O3 26 hellip Calcium oxide CaO 642 hellip
Magnesium oxide MgO 25 60 maximum Sulfur trioxide SO3 24 30 maximum when C3A le 8
35 maximum when C3A gt 8 Loss on ignition 14 30 maximum
Insoluble residue 04 075 maximum Free lime 15 hellip
Tricalcium silicate C3S 67 hellip Tricalcium aluminate C3A 8 hellip
Total alkali as sodium oxide 053 hellip
13
Table 4-2 Physical Properties of Portland Cement ASTM Property Cement
results Standard requirements of
ASTM C 150 for Type I cementC 185 Air content of mortar (volume ) 6 12 maximum C 204 Fineness (specific surface) by Blaine air-
permeability apparatus (m2kg) 364 280 minimum
C 151 Autoclave expansion () 007 080 maximum C 109 Compressive strength of Cement Mortars (psi)
1 day 2080 hellip 3 days 3590 1740 minimum 7 days 4400 2760 minimum 28 days 5620 hellip
C 191 Initial time of setting by Vicat needle (minutes) 105 Between 45 to 375 C 188 Density (gcm3) 315 hellip
42 Fly Ash
For this research ASTM Class C fly ash was obtained from Wisconsin Public Service
Corporationrsquos Weston Power Plant near Wausau Wisconsin The chemical composition and
physical properties of the fly ash are shown in Table 4-3 and Table 4-4 respectively along with
the requirements of ASTM Specification for Coal Fly Ash and Raw or Calcined Natural
Pozzolan for Use in Concrete [ASTM C 618] These data were provided by the fly ash producer
The fly ash met the requirements of ASTM C 618
Table 4-3 Chemical Composition of Fly Ash Item ( by mass) Fly ash results
Requirements of ASTM C
618 for Class C fly ash Silicon dioxide SiO2 409 hellip
Aluminum oxide Al2O3 188 hellip Ferric oxide Fe2O3 65 hellip
SiO2 + Al2O3 + Fe2O3 662 50 minimum Calcium oxide CaO 213 hellip
Magnesium oxide MgO 45 hellip Sulfur trioxide SO3 12 50 maximum
Sodium oxide Na2O 14 hellip Potassium oxide K2O 08 hellip
14
Table 4-4 Physical Properties of Fly Ash Property Fly ash
results Requirements of ASTM C 618
for Class C fly ash Strength activity index ( of Control)
7 days 28 days
107
Not available
75 minimum at either 7 or 28
days Water requirement ( of Control) 94 105 maximum
Autoclave expansion () 004 Between -080 and +080 Density (gcm3) 266 hellip
43 Fine Aggregate (Sand)
Natural sand was used as fine aggregate in this project The properties of fine aggregate are
shown in Table 4-5 Sieve analysis results are presented in Table 4-6 along with the grading
requirements of ASTM Standard Specification for Concrete Aggregates [ASTM C 33] The
sand met the requirements of ASTM C 33
Table 4-5 Properties of Fine Aggregate (Sand) ASTM Property Test result C 128 Bulk specific gravity on oven-dry basis 262
Bulk specific gravity on SSD basis 266 Apparent specific gravity 272 SSD Absorption () 137
C 29 Bulk density (kgm3) 1790 Bulk density (lbft3) 112 Void content () 33
Saturated surface-dry
Table 4-6 Gradation of Fine Aggregate (Sand) Amounts finer than each sieve ( by mass) Fineness
modulus 38-in 95 mm
No 4 475 mm
No 8 236 mm
No 16 118 mm
No 30 600 microm
No 50 300 microm
No 100 150 microm
Sand results 27 100 99 87 71 50 18 4 Requirements of ASTM
C 33 23 - 31 100 95 - 100 80 - 100 50 - 85 25 - 60 5 - 30 0 - 10
44 Coarse Aggregate
The coarse aggregate used in this research was crushed quartzite stone The physical
properties and the gradation of the coarse aggregate are shown in Table 4-7 and Table 4-8
15
respectively along with the requirements of ASTM C 33 The coarse aggregate met the
requirements of ASTM C 33 The coarse aggregate had a nominal maximum size of 34 inch
and met the grading requirements for AASHTO No 67
Table 4-7 Physical Properties of Coarse Aggregate ASTM Item Coarse
aggregate results
Requirements of ASTM C 33
C 117 Materials finer than 75microm by washing () 05 10 maximum C 127 Bulk specific gravity on oven-dry basis 265 hellip
Bulk specific gravity on SSD basis 266 hellip Apparent specific gravity 268 hellip SSD Absorption () 042 hellip
C 29 Bulk density (kgm3) 1550 hellip Bulk density (lbft3) 97 hellip Void content () 42 hellip
Saturated surface-dry
Table 4-8 Gradation of Coarse Aggregate Amounts finer than each sieve ( by mass) 250 mm
1-in 190 mm
34-in 125 mm
12-in 95 mm 38-in
475 mm No 4
236 mm No 8
Coarse aggregate results 100 95 55 31 3 2 Requirements of ASTM C 33 for Size No
67 100 90 - 100 hellip 20 - 55 0 - 10 0 - 5
45 Water-Reducing Admixture (WRA)
Water-reducing admixture (WRA) was used in several concrete mixtures The WRA was an
aqueous solution of modified lignosulfonates The WRA was a Type A admixture per ASTM
Standard Specification for Chemical Admixtures for Concrete [ASTM C 494] Table 4-9
presents the properties and manufacturerrsquos recommended dosage rate of the WRA Table 4-10
shows the ingredients of the WRA
16
Table 4-9 Properties and Manufacturerrsquos Recommended Dosage Rate of Water-Reducing Admixture
Chemical family name
Specific gravity
Water content ()
pH Dosage rate (mL100 kg of cementitious
materials)
Dosage rate (fl oz100 lb of cementitious
materials) Aqueous solution of
lignosulfonate amine and compound carbohydrates
11 - 12 ~ 50 65 - 75 190 - 375 3 - 6
Table 4-10 Ingredients of Water-Reducing Admixture Ingredient Chemical Abstracts Service
(CAS) Registry Number Maximum percent
Sodium o-phenylphenol 000132-27-4 lt 1 Triethanolamine 000102-71-6 1-10
Triethanolamine acetate 014806-72-5 1-10
46 Gypsum Wallboard
Gypsum wallboard was obtained from two locations on the campus of University of
Wisconsin-Milwaukee (Fig 4-1 to 4-7) One source was pieces of drywall from demolition of
existing walls and was designated as ldquoOldrdquo The label on the Old drywall showed that it was
ldquoType SCXrdquo drywall The other source was cuttings of drywall from new construction and was
designated as ldquoNewrdquo It was ldquoType Xrdquo drywall Both the Old and New gypsum wallboards
contained glass fibers Type X New gypsum wallboard appeared to contain more glass fibers
than Type SCX Old gypsum wallboard Paper covering of gypsum wallboard was removed as
much as possible and gypsum wallboard was ground into powder using a laboratory mechanical
ball-mill at UWM-CBU
17
Fig 4-1 Close-Up View of Old Gypsum
Wallboard Containing Glass Fibers
Fig 4-2 Cut-Pieces of Old Gypsum Wallboard
Fig 4-3 Ball-Mill for Pulverizing Cut-Pieces of
Gypsum Wallboard
Fig 4-4 Old Gypsum Wallboard After Milling
and Sieving
Fig 4-5 Pieces of ldquoNewrdquo Gypsum Wallboard
Fig 4-6 Glass Fibers in New Gypsum Wallboard
18
Fig 4-7 New Gypsum Wallboard After Milling
and Sieving
19
CHAPTER 5 SPECIMEN PREPARATION AND TEST
METHODS
51 Mixing and Specimen Preparation
Test specimens of concrete were prepared and cured in accordance with the ASTM Standard
Practice for Making and Curing Concrete Test Specimens in the Laboratory [ASTM C 192]
The concrete mixer used in this project was an electric-power driven revolving drum tilting
mixer
The cast specimens were removed from their molds 24 plusmn 4 hours after casting The
specimens were then moist cured in a moist room at a temperature of 23 plusmn 2degC (73 plusmn 35degF) and
a relative humidity of not less than 95 except for length-change specimens which were stored
in saturated limewater until the age of 28 days and then stored in air at a temperature of 23 plusmn 2degC
(73 plusmn 35degF) and a relative humidity of 50 plusmn 4
Mortar cubes and bars for sulfate resistance test were cured in 23degC (instead of in 35degC water
specified in ASTM C 1012 due to difficulty in sealing fresh specimens) until the cubes reached a
compressive strength of 20 MPa (2900 psi) The specimens were cured in a moist-enclosure
until the age of 24 hours and then in saturated limewater
Photographs for making test specimens are shown below Fig 5-1 to 5-4
20
Fig 5-1 Consolidation of Concrete Cylinders
on a Vibrating Table
Fig 5-2 Length-Change Molds with Plastic
Liners and Studs
Fig 5-3 Finishing the Surface of Length-
Change Beams
Fig 5-4 Sieving Fresh Concrete to Obtain
Mortar for Casting Time of Setting Specimens
52 Test Methods
The tests conducted on preliminary concrete mixtures are summarized below in Table 5-1
The tests conducted on final concrete mixtures and mortar mixtures are summarized in Table
5-2
Table 5-1 Tests Conducted on Preliminary Concrete Mixtures in Task 2 for Optimization of Mixture Proportions
Test ASTM 0-day 1-day 7-day 28-day Slump C 143 x Density C 138 x
Air content by the pressure method
C 231 x
Compressive strength C 39 x x x
21
Table 5-2 Tests Conducted on Final Concrete Mixtures and Mortar Mixtures in Task 3 Test ASTM 0-day 1-day 3-day 7-day 28-day 91-day
Slump and slump retention C 143 x Density C 138 x
Air content by the pressure method
C 231 x
Compressive strength C 39 x x x x x Time of initial setting C 403 x
Length change C 157 Start Sulfate resistancedagger C 1012
Slump was measured again 30 minutes after completion of concrete mixing dagger Test started when accompanying cubes reached compressive strength of 20 MPa (2900 psi) Compressive strength of concrete was determined by testing three 100-mm diameter times 200-
mm length (4 times 8 in) cylinders at each test age for each mixture Length change specimens
consisted of three 75 times 75 times 285 mm (3 times 3 times 1125 in) beams for each concrete mixture For
each mortar mixture six mortar prisms were cast for measuring length change in 5 sodium
sulfate solution to evaluate their sulfate resistance Some prisms broke in the process of
separating from molds and could not be tested
Photographs of testing are shown below Fig 5-5 to 5-11
Fig 5-5 Testing of Cylinder for Compressive
Strength
Fig 5-6 Testing of Beam for Length Change
22
Fig 5-7 Air Storage of Length-Change Beams
After 28 Days of Moist Curing In Saturated Limewater
Fig 5-8 Saturated Limewater Containers for
Curing Mortar Cubes and Bars
Fig 5-9 Saturated Limewater Containing
Mortar Cubes and Bars
Fig 5-10 Testing of Mortar Cube for
Compressive Strength
Fig 5-11 Measurement of Mortar Bar
23
CHAPTER 6 PRELIMINARY MIXTURES
A series of preliminary concrete mixtures were produced in order to establish mixture
proportions for final concrete mixtures
61 Group 1 Preliminary Mixtures
Group 1 preliminary concrete mixtures were made using ldquoOldrdquo gypsum wallboard The
mixture proportions of Group 1 concrete mixtures are shown in Table 6-1 (powder materials)
Table 6-2 (SI units) and Table 6-3 (inch-pound units) Mixtures CFOS-1 CFOS-2 and CFOS-3
were made with old gypsum wallboard using the proportions developed in Table 3-2 which was
based on previous UWM-CBU research projects Sodium sulfate was used as an activator
Table 6-1 Proportions of Powder Materials Used for Group 1 Preliminary Concrete Mixtures Mixture Designation C-1 CFO
S-1 CFOS-2
CFOS-3
CFO-1
CFO-2
CF-1 CO-1
Laboratory mixture designation Ref-1 Old-2 Old-3 Old-4 Old-5 Old-6 Old-7 Old-8Cement (mass of Cm) 100 60 40 20 60 40 67 93 Fly Ash (mass of Cm) 0 33 50 60 33 50 33 0
Old Gypsum Wallboard (mass of Cm) 0 7 10 20 7 10 0 7 Sodium Sulfate (mass of Cm) 0 2 2 4 0 0 0 0
Cm Cementitious materials (Cement + Fly Ash + Gypsum Wallboard)
Table 6-2 Mixture Proportions and Fresh Concrete Properties of Group 1 Preliminary Mixtures (SI [Metric] Units)
Mixture Designation C-1 CFOS-1
CFOS-2
CFOS-3
CFO-1
CFO-2
CF-1 CO-1
Cement (kgm3) 358 214 143 71 215 143 246 334 Class C Fly Ash Weston (kgm3) 0 118 179 213 119 179 121 0
Powdered Gypsum Wallboard Old (kgm3) 0 25 36 71 25 36 0 25 Water (kgm3) 171 161 162 155 163 159 151 164
Sand SSD (kgm3) 849 848 843 834 850 847 872 847 Crushed Stone 19-mm max SSD (kgm3) 1020 1020 1010 1010 1020 1020 1050 1020
Sodium Sulfate Na2SO4 (kgm3) 0 72 71 142 0 0 0 0 Water-Cementitious Ratio WCm 048 045 045 044 045 044 041 046
Slump (mm) 65 30 40 40 55 65 65 25 Air Content () 13 18 18 21 19 22 14 20
Air Temperature (degC) 23 23 23 24 23 23 23 23 Concrete Temperature (degC) 21 22 22 21 22 22 22 21
Density (kgm3) 2400 2390 2380 2370 2390 2380 2440 2390SSD Saturated surface-dry
24
Table 6-3 Mixture Proportions and Fresh Concrete Properties of Group 1 Preliminary Mixtures (Inch-Pound Units)
Mixture Designation C-1 CFOS-1
CFOS-2
CFOS-3
CFO-1
CFO-2
CF-1 CO-1
Cement (lbyd3) 603 361 240 120 362 241 414 562 Class C Fly Ash Weston (lbyd3) 0 199 301 358 200 302 204 0
Powdered Gypsum Wallboard Old (lbyd3) 0 42 60 120 42 60 0 42 Water (lbyd3) 288 270 273 261 274 268 255 276
Sand SSD (lbyd3) 1430 1430 1420 1400 1430 1430 1470 1430Crushed Stone 34 in max SSD (lbyd3) 1720 1720 1710 1700 1720 1710 1760 1710
Sodium Sulfate Na2SO4 (lbyd3) 0 12 12 24 0 0 0 0 Water-Cementitious Ratio WCm 048 045 045 044 045 044 041 046
Slump (in) 2 12 1 14 1 12 1 12 2 14 2 12 2 12 1 Air Content () 13 18 18 21 19 22 14 20
Air Temperature (degF) 74 74 74 75 73 73 73 73 Concrete Temperature (degF) 70 71 71 70 72 72 71 70
Density (lbft3) 150 149 149 148 149 149 152 149 SSD Saturated surface-dry Test results for compressive strength of Group 1 concrete mixtures are shown in Table 6-4
(in MPa) and Table 6-5 (in psi) Mixtures CFOS-1 and CFOS-2 were strong enough to be
demolded at one day and showed quite high compressive strength values of 347 MPa (5040 psi)
and 330 MPa (4790 psi) at seven days Mixture CFOS-3 was also strong enough to be
demolded at one day
Table 6-4 Compressive Strength of Group 1 Preliminary Concrete Mixtures (MPa) Age (days) C-1 CFO
S-1 CFOS-2
CFOS-3
CFO-1
CFO-2
CF-1 CO-1
1 106 59 39 23 28 07dagger 60 88 7 308 347 330 hellip 291 245 330 26528 396 456 429 hellip 428 379 480 429
dagger Result from testing only one cylinder all other results are from testing three cylinders each Cylinders had cracked on their own
Table 6-5 Compressive Strength of Group 1 Preliminary Concrete Mixtures (psi) Age (days) C-1 CFO
S-1 CFOS-2
CFOS-3
CFO-1
CFO-2
CF-1 CO-1
1 1540 850 560 340 400 100dagger 870 12707 4470 5040 4790 hellip 4220 3550 4780 385028 5740 6620 6220 hellip 6210 5490 6960 6220
dagger Result from testing only one cylinder all other results are from testing three cylinders each Cylinders had cracked on their own
25
Fig 6-1 is a photograph of a cylinder of Mixture CFOS-2 It was noted that white material
was appearing on a CFOS-2 cylinder obtained after compression test
Fig 6-2 shows a photograph of cylinders from Mixture CFOS-3 Mixture CFOS-3
developed a significant amount of efflorescence and cylinders cracked by themselves before
reaching the age of seven days
Mixtures CFO-1 and CFO-2 were made using the same proportions of cement fly ash and
old gypsum wallboard as Mixtures CFOS-1 and CFOS-2 but without using sodium sulfate
Mixtures CFO-1 and CFO-2 were weaker than Mixtures CFOS-1 and CFOS-2 especially at the
age of one day Mixture CFO-2 was so soft that two out of three cylinders broke during
demolding at the age of one day
Mixture CF-1 was made using only cement and fly ash Mixture CO-1 was made using only
cement and old gypsum wallboard Compared with Mixture C-1 Mixture CO-1 showed a lower
strength at 1 and 7 days and a higher strength at 28 days
Fig 6-1 Efflorescence Appearing on Cylinder
of Mixture CFOS-2 Left from Compression Test
Fig 6-2 Efflorescence Appearing on Air-Dried
Cylinders of CFOS-3
26
62 Group 2 Preliminary Mixtures
Group 2 preliminary concrete mixtures were made using ldquoNewrdquo gypsum wallboard Sodium
bicarbonate was used in the majority of the Group 2 mixtures for evaluation as an activator
Table 6-6 Table 6-7 and Table 6-8 show mixture proportions of Group 2 concrete mixtures
Proportions of Mixtures C-1 and CF-1 of Group 1 are shown as well for easier comparison
Unlike sodium sulfate use of sodium bicarbonate increased water demand of fresh concrete
resulting in high water-cementitious ratios for the desired workability
Table 6-6 Proportions Powder Materials Used for Group 2 Preliminary Concrete Mixtures Mixture Designation C-1 CF-1 CN-1 CFN-
1 CB-1 CFB-
1 CNB-
1 CFNB-1
CFNB-2
CFNB-3
Laboratory mixture designation Ref-1 Old-7 New-1
New-2
Ref-2 FA-1 New-3
New-4
New-5
New-6
Cement (mass of Cm) 100 67 93 60 100 67 93 60 40 53 Fly Ash (mass of Cm) 0 33 0 33 0 33 0 33 50 33
New Gypsum Wallboard (mass of Cm)
0 0 7 7 0 0 7 7 10 14
Sodium Bicarbonate (mass of Cm) 0 0 0 0 2 2 2 2 2 2 Cm Cementitious materials (Cement + Fly Ash + Gypsum Wallboard)
Table 6-7 Mixture Proportions and Fresh Concrete Properties of Group 2 Preliminary Mixtures (SI [Metric] Units)
Mixture Designation C-1 CF-1 CN-1 CFN-1
CB-1 CFB-1
CNB-1
CFNB-1
CFNB-2
CFNB-3
Cement (kgm3) 358 246 331 215 354 241 318 210 140 186 Class C Fly Ash Weston (kgm3) 0 121 0 119 0 119 0 116 175 115
Powdered Gypsum Wallboard New (kgm3)
0 0 25 25 0 0 24 25 35 49
Water (kgm3) 171 151 181 153 189 164 199 176 166 171 Sand SSD (kgm3) 849 872 840 850 841 857 809 830 827 825
Crushed Stone 19-mm max SSD (kgm3)
1020 1050 1010 1020 1010 1030 971 999 994 994
Sodium Bicarbonate NaHCO3 (kgm3) 0 0 0 0 71 72 68 70 70 70 Water-Cementitious Ratio WCm 048 041 051 043 053 045 058 050 047 049
Slump (mm) 65 65 45 50 70 55 95 65 65 65 Air Content () 13 14 18 19 14 12 21 18 23 22
Air Temperature (degC) 23 23 22 22 23 23 23 23 23 23 Concrete Temperature (degC) 21 22 21 20 23 23 23 22 22 23
Density (kgm3) 2400 2440 2390 2380 2400 2420 2330 2360 2340 2350SSD Saturated surface-dry
27
Table 6-8 Mixture Proportions and Fresh Concrete Properties of Group 2 Preliminary Mixtures (Inch-Pound Units)
Mixture Designation C-1 CF-1 CN-1 CFN-1
CB-1 CFB-1
CNB-1
CFNB-1
CFNB-2
CFNB-3
Cement (lbyd3) 603 414 557 362 596 407 536 354 236 313 Class C Fly Ash Weston (lbyd3) 0 204 0 200 0 201 0 195 295 194
Powdered Gypsum Wallboard New (lbyd3)
0 0 42 42 0 0 40 41 59 82
Water (lbyd3) 288 255 305 258 318 276 336 296 279 289 Sand SSD (lbyd3) 1430 1470 1410 1430 1420 1440 1360 1400 1390 1390
Crushed Stone 34 in max SSD (lbyd3)
1720 1760 1700 1720 1700 1730 1640 1680 1670 1670
Sodium Bicarbonate NaHCO3 (lbyd3) 0 0 0 0 12 12 12 12 12 12 Water-Cementitious Ratio WCm 048 041 051 043 053 045 058 050 047 049
Slump (in) 2 12 2 12 1 34 2 2 34 2 14 3 34 2 12 2 12 2 12Air Content () 13 14 18 19 14 12 21 18 23 22
Air Temperature (degF) 74 73 72 72 73 74 73 74 73 73 Concrete Temperature (degF) 70 71 69 68 74 73 73 71 72 74
Density (lbft3) 150 152 149 149 150 151 145 147 146 146 SSD Saturated surface-dry Table 6-9 and Table 6-10 show test results for compressive strength of Group 2 concrete
mixtures When sodium bicarbonate was used in concrete containing new gypsum wallboard
the 1-day compressive strength of concrete improved but the 28-day compressive strength was
reduced When sodium bicarbonate was used in concrete made with cement (without fly ash or
gypsum) and in concrete made with cement and fly ash (without gypsum) the compressive
strength of concrete was reduced at all test ages of 1 7 and 28 days Unlike Mixture CFOS-3
from Group 1 the test cylinders did not develop any cracking
Table 6-9 Compressive Strength of Group 2 Preliminary Concrete Mixtures (MPa) Age (days) C-1 CF-1 CN-1 CFN-
1 CB-1 CFB-
1 CNB-
1 CFNB-1
CFNB-2
CFNB-3
1 106 60 74 32 90 57 76 57 36 48 7 308 330 236 323 228 202 231 283 265 21528 396 480 347 407 294 299 327 354 400 315
28
Table 6-10 Compressive Strength of Group 2 Preliminary Concrete Mixtures (psi) Age (days) C-1 CF-1 CN-1 CFN-
1 CB-1 CFB-
1 CNB-
1 CFNB-1
CFNB-2
CFNB-3
1 1540 870 1080 470 1310 820 1100 830 520 690 7 4470 4780 3430 4690 3310 2930 3350 4110 3850 312028 5740 6960 5030 5900 4270 4330 4740 5130 5800 4570
Fig 6-3 and Fig 6-4 show cylinders of some of the Group 2 concrete mixtures
Efflorescence on the surface of concrete was noted
Fig 6-3 Efflorescence on a Cylinder of Mixture CFNB-2 Left from Seven-day Compression Test
Fig 6-4 Efflorescence on a Cylinder of Mixture CFNB-3 Left from One-day Compression Test
63 Group 3 Preliminary Mixtures
Group 3 preliminary concrete mixtures were made with ldquoNewrdquo gypsum wallboard and using
half as much sodium sulfate as the original planned see Table 3-2 Mixture CFNS-6 was made
with only one-quarter of the sodium sulfate planned see Table 3-2
Table 6-11 to Table 6-13 show mixture proportions of Group 3 concrete mixtures Mixture
CFNS-1-1 and CFNS-1-2 were twin mixtures made using identical proportions They used the
same proportions of cement fly ash and gypsum wallboard as Mixture CFOS-2 of Group 1
except the source of gypsum wallboard and the amount of sodium sulfate
29
Mixtures CFNS-2-1 and CFNS-2-2 were also twin mixtures made using the same proportions
of cement fly ash and gypsum wallboard as Mixture CFOS-3 of Group 1 except the source of
gypsum wallboard and the amount of sodium sulfate
Efflorescence was observed on leftover concrete from Mixtures CFNS-1-1 CFNS-1-2
CFNS-2-1 CFNS-2-2 and CFNS-6
Table 6-11 Proportions of Powder Materials Used for Group 3 Preliminary Concrete Mixtures Mixture Designation C-3 CFNS-
1-1 CFNS-
1-2 CFNS-
2-1 CFNS-
2-2 CFNS-
6 Laboratory mixture designation Ref-4 New-
10 New-
11 New-
12 New-
13 New-
17 Cement (mass of Cm) 100 40 40 20 20 20 Fly Ash (mass of Cm) 0 50 50 60 60 60
New Gypsum Wallboard (mass of Cm) 0 10 10 20 20 20 Sodium Sulfate (mass of Cm) 0 1 1 2 2 1
Cm Cementitious materials (Cement + Fly Ash + Gypsum Wallboard)
Table 6-12 Mixture Proportions and Fresh Properties of Group 3 Preliminary Concrete Mixtures (SI [Metric] Units)
Mixture Designation C-3 CFNS-1-1
CFNS-1-2
CFNS-2-1
CFNS-2-2
CFNS-6
Cement (kgm3) 360 146 147 72 73 73 Class C Fly Ash Weston (kgm3) 0 182 184 217 220 218
Powdered Gypsum Wallboard New (kgm3) 0 36 37 72 73 73 Water (kgm3) 163 164 160 165 145 155
Sand SSD (kgm3) 853 854 861 848 862 855 Crushed Stone 19-mm max SSD (kgm3) 1030 1040 1050 1030 1050 1030
Sodium Sulfate Na2SO4 (kgm3) 0 36 37 72 73 36 Water-Cementitious Ratio WCm 045 045 044 046 039 043
Slump (mm) 50 50 55 40 45 25 Air Content () 18 hellip hellip hellip hellip hellip
Air Temperature (degC) 23 23 24 23 23 24 Concrete Temperature (degC) 22 hellip hellip hellip hellip hellip
Density (kgm3) 2400 2420 2440 2410 2430 2410 SSD Saturated surface-dry
30
Table 6-13 Mixture Proportions and Fresh Properties of Group 3 Preliminary Concrete Mixtures (Inch-Pound Units)
Mixture Designation C-3 CFNS-1-1
CFNS-1-2
CFNS-2-1
CFNS-2-2
CFNS-6
Cement (lbyd3) 606 245 247 122 124 122 Class C Fly Ash Weston (lbyd3) 0 307 309 365 371 367
Powdered Gypsum Wallboard New (lbyd3) 0 61 62 122 124 122 Water (lbyd3) 274 276 269 278 244 261
Sand SSD (lbyd3) 1440 1440 1450 1430 1450 1440 Crushed Stone 34 in max SSD (lbyd3) 1730 1750 1760 1730 1760 1740
Sodium Sulfate Na2SO4 (lbyd3) 0 6 6 12 12 6 Water-Cementitious Ratio WCm 045 045 044 046 039 043
Slump (in) 2 2 2 14 1 12 1 34 1 Air Content () 18 hellip hellip hellip hellip hellip
Air Temperature (degF) 74 74 76 74 73 76 Concrete Temperature (degF) 72 hellip hellip hellip hellip hellip
Density (lbft3) 150 151 152 150 151 150 SSD Saturated surface-dry Table 6-14 and Table 6-15 show the test results for compressive strength of Group 3 concrete
mixtures The strength of Mixtures CFNS-1-1 and CFNS-1-2 were not significantly lower than
that of Mixture CFOS-2 Also the strength of Mixtures CFNS-2-1 and CFNS-2-2 were not
significantly lower than that of Mixture CFOS-3 The strength of Mixtures CFNS-1-1 CFNS-1-
2 CFNS-2-1 and CFNS-2-2 were quite acceptable
Upon careful inspection it was noted that cylinders of Mixture CFNS-6 cracked by
themselves before reaching the age of seven days Cylinders of Mixtures CFNS-2-1 and CFNS-
2-2 must have cracked as well
31
Table 6-14 Compressive Strength of Group 3 Preliminary Concrete Mixtures (MPa) Age (days) C-3 CFNS-
1-1 CFNS-
1-2 CFNS-
2-1 CFNS-
2-2 CFNS-
6 1 117 23Dagger 22 19 19 12Dagger 7 303 247dagger 258dagger 96dagger 85dagger hellip 28 359 hellip hellip hellip hellip hellip
Dagger Average from testing two cylinders dagger Result from testing one cylinder The rest are averages from three tests Cylinders had cracked on their own
Table 6-15 Compressive Strength of Group 3 Preliminary Concrete Mixtures (psi) Age (days) C-3 CFNS-
1-1 CFNS-
1-2 CFNS-
2-1 CFNS-
2-2 CFNS-
6 1 1690 330Dagger 320 270 270 180Dagger 7 4390 3580dagger 3740dagger 1390dagger 1240dagger hellip 28 5210 hellip hellip hellip hellip hellip
Dagger Average from testing two cylinders dagger Result from testing one cylinder The rest are averages from three tests Cylinders had cracked on their own Based on the results of preliminary mixing and testing of concrete it was decided to make
final mixture CFNS-4 using the mixture proportions of Mixtures CFNS-1-1 and CFNS-1-2
Final mixture CFNS-5 was made using the mixture proportions of Mixtures CFNS-2-1 and
CFNS-2-2
32
CHAPTER 7 FINAL MIXTURES
In total eight final concrete mixtures were made to evaluate the slump retention time of
initial setting compressive strength and length change of concrete In addition mortar bars
were made for evaluation of sulfate resistance
71 Mixture Proportions
Table 7-1 presents the proportions of powder materials used for final concrete mixtures The
mixtures were made in two groups Group 1 Mixtures C-2 CN-2 CFN-2 and CFN-3 were
made using up to 20 fly ash and 20 powdered wallboard with water-reducing admixture and
without sodium sulfate Group 2 Mixtures Ref-5 CFNS-3 CFNS-4 and CFNS-5 were made
using up to 60 fly ash 20 powdered wallboard 2 sodium sulfate and without water-
reducing admixture Sodium sulfate was added as powder to a concrete mixture
Table 7-1 Proportions of Powder Materials Used for Final Concrete Mixtures Mixture Designation C-2 CN-2 CFN-
2 CFN-
3 C-4 CFN
S-3 CFNS-4
CFNS-5
Laboratory mixture designation Ref-3 New-7
New-8
New-9
Ref-5 New-14
New-15
New-16
Cement (mass of Cm) 100 90 70 60 100 60 40 20 Fly Ash (mass of Cm) 0 0 20 20 0 33 50 60
New Gypsum Wallboard (mass of Cm) 0 10 10 20 0 7 10 20 Sodium Sulfate (mass of Cm) 0 0 0 0 0 1 1 2
Cm Cementitious materials (Cement + Fly Ash + Gypsum Wallboard) The mixture proportions and fresh properties of the main concrete mixtures are presented in
Table 7-2 (in SI units) and Table 7-3 (in inch-pound units) To evaluate retention of slump
slump was measured twice (1) immediately after mixing was done and (2) 30 minutes later In
general the concrete mixtures retained their workability
33
Table 7-2 Mixture Proportions and Fresh Concrete Properties of Final Mixtures (SI [Metric] Units) Mixture Designation C-2 CN-2 CFN-
2 CFN-
3 C-4 CFN
S-3 CFNS-4
CFNS-5
Cement (kgm3) 362 316 249 212 365 217 144 71 Class C Fly Ash Weston (kgm3) 0 0 71 71 0 119 180 213
Powdered Gypsum Wallboard New (kgm3) 0 35 35 71 0 25 36 71 Water (kgm3) 164 164 170 153 163 154 153 157
Sand SSD (kgm3) 856 830 840 835 861 854 852 839 Crushed Stone 19-mm max SSD (kgm3) 1030 999 1010 1010 1030 1030 1020 1010
Sodium Sulfate Na2SO4 (kgm3) 0 0 0 0 0 36 36 71 Water-Reducing Admixture (Lm3) 0 103 104 104 0 0 0 0 Water-Cementitious Ratio WCm 045 047 048 043 045 043 042 044
Slump (mm) 55 50 40 30 30 40 45 25 Slump 30 minutes later (mm) 30 40 25 20 40 30 15 15
Air Content () 18 37 26 32 14 22 15 17 Air Temperature (degC) 23 24 23 24 23 23 23 24
Concrete Temperature (degC) 23 23 23 25 24 24 25 25 Density (kgm3) 2410 2340 2380 2350 2420 2400 2390 2370
SSD Saturated surface-dry
Table 7-3 Mixture Proportions and Fresh Concrete Properties of Final Mixtures (Inch-Pound Units)
Mixture Designation C-2 CN-2 CFN-2
CFN-3
C-4 CFNS-3
CFNS-4
CFNS-5
Cement (lbyd3) 610 532 419 357 614 366 243 120 Class C Fly Ash Weston (lbyd3) 0 0 120 119 0 201 303 359
Powdered Gypsum Wallboard New (lbyd3) 0 59 59 119 0 43 61 120 Water (lbyd3) 276 276 287 257 274 259 257 264
Sand SSD (lbyd3) 1440 1400 1410 1410 1450 1440 1430 1410Crushed Stone 34 in max SSD (lbyd3) 1730 1680 1700 1690 1740 1730 1720 1700
Sodium Sulfate Na2SO4 (lbyd3) 0 0 0 0 0 6 6 12 Water-Reducing Admixture (fl ozyd3) 0 265 269 268 0 0 0 0
Water-Cementitious Ratio WCm 045 047 048 043 045 043 042 044Slump (in) 2 14 2 1 12 1 14 1 14 1 12 1 34 1
Slump 30 minutes later (in) 1 14 1 12 1 34 1 12 1 14 12 12 Air Content () 18 37 26 32 14 22 15 17
Air Temperature (degF) 73 75 74 75 74 74 74 75 Concrete Temperature (degF) 73 74 74 77 75 76 77 77
Density (lbft3) 150 146 148 146 151 150 149 148 SSD Saturated surface-dry
72 Time of Initial Setting
Table 7-4 presents test results of the time of initial setting final concrete mixtures It took
about twice as long for the mixtures containing fly ash and powdered gypsum wallboard to reach
34
initial setting as their reference concrete mixtures It is well known that concrete mixtures
containing large amount of fly ash may show delayed setting
Table 7-4 Time of Initial Setting of Final Concrete Mixtures Mixture Designation C-2 CN-2 CFN-
2 CFN-
3 C-4 CFN
S-3 CFNS-4
CFNS-5
Time of Initial Setting (hours) 48 72 114 120 47 98 118 105
73 Compressive Strength
Compressive strength test results for final concrete mixtures are shown in Table 7-5 (in
MPa) Table 7-6 (in psi) Fig 7-1 and Fig 7-2
Table 7-5 Compressive Strength of Final Concrete Mixtures (MPa) Age (days) C-2 CN-2 CFN-
2 CFN-
3 C-4 CFN
S-3 CFNS-4
CFNS-5
1 168 111 42 39 159 58 38 24 3 301 197 174 132 302 237 178 79 7 354 232 265 154 347 301 297 12528 448 285 414 211 408 415 420 hellip 91 508 419 501 289 515 443 497 hellip
Cylinders had already cracked on their own before testing started
Table 7-6 Compressive Strength of Final Concrete Mixtures (psi) Age (days) C-2 CN-2 CFN-
2 CFN-
3 C-4 CFN
S-3 CFNS-4
CFNS-5
1 2430 1610 610 560 2310 840 550 350 3 4360 2860 2520 1910 4380 3440 2580 11407 5140 3370 3850 2240 5040 4370 4310 1810
28 6500 4140 6000 3060 5920 6020 6090 hellip 91 7370 6070 7270 4190 7470 6430 7210 hellip
Cylinders had already cracked on their own before testing started
35
0
10
20
30
40
50
60
1 10 100
Age (days)
Com
pres
sive
Str
engt
h (M
Pa)
0
1000
2000
3000
4000
5000
6000
7000
8000
(psi
)
Ref-3New-7New-8New-9
Fig 7-1 Compressive Strength of Final Concrete Mixtures Group 1
The mixtures CN-2 CFN-2 and CFN-3 showed lower compressive strength than C-2
Mixture CFN-2 showed structural-grade strength of 265 MPa (3850 psi) at seven days and a
relatively high compressive strength of 41 MPa (6000 psi) at 28 days Mixture CN-2 showed
structural-grade strength of 285 MPa (4140 psi) at 28 days
0
10
20
30
40
50
60
1 10 100
Age (days)
Com
pres
sive
Str
engt
h (M
Pa)
0
1000
2000
3000
4000
5000
6000
7000
8000
(psi
)
Ref-5New-14New-15New-16
Fig 7-2 Compressive Strength of Final Concrete Mixtures Group 2
36
As early as at seven days the mixtures CFNS-3 and CFNS-4 showed structural-grade
strength of 301 MPa (4370 psi) and 297 MPa (4310 psi) This is noteworthy considering the
fact that Mixtures CFNS-3 and CFNS-4 were made by replacing 40 and 60 of cement with
blends of fly ash and powdered gypsum wallboard At the age of 28 days the mixtures CFNS-3
and CFNS-4 reached compressive strength of 415 MPa (6020 psi) and 420 MPa (6090 psi) and
became as strong as Mixture Ref-5
The cylinders made from Mixture CFNS-5 cracked on their own before reaching the age of
seven days (Fig 7-3) This was attributed to an excessive expansive reaction resulting from use
of the particular proportions of cement fly ash powdered gypsum wallboard and sodium sulfate
in Mixture CFNS-5 Mixture CFNS-6 was made using half as much sodium sulfate (1 of
cementitious materials) as CFNS-5 nonetheless cylinders made from Mixture CFNS-6 cracked
before reaching the age of seven days
Fig 7-3 Cracked Cylinders of Concrete Mixtures CFNS-5 and CFNS-6
37
74 Length Change
Test results for length change of final concrete mixtures are shown in Table 7-7 Fig 7-5
and Fig 7-6
Table 7-7 Length Change of Final Concrete Mixtures () Age (days) C-2 CN-2 CFN-2 CFN-3 C-4 CFNS-
3 CFNS-
4 CFNS-
5 1 0 0 0 0 0 0 0 0 3 -0001 0010 0015 0018 0000 0006 0041 0359 7 -0003 0013 0031 0036 0004 0005 0039 1708
28 0004 0026 0033 0116 0002 0010 0043 hellip 32 -0010 0009 0012 0098 -0007 -0007 0030 hellip 35 -0015 0003 0009 0089 -0013 -0013 0025 hellip 42 -0022 -0003 -0002 0077 -0018 -0020 0020 hellip 56 -0028 -0020 -0004 0057 -0024 -0028 0014 hellip 84 -0033 -0027 -0010 0037 -0031 -0035 0011 hellip 140 -0036 -0035 -0017 0027 -0035 -0035 0006 hellip
Specimens had cracked on their own All of the concrete mixtures made with powdered gypsum wallboard showed higher
expansion than their reference concrete mixtures during immersion in saturated limewater
Mixture CFN-3 containing 20 fly ash and 20 powdered gypsum wallboard showed a large
expansion (0120) Specimens made from Mixture CFNS-5 containing 60 fly ash and 20
powdered gypsum wallboard showed excessive expansion and they cracked before reaching the
age of seven days (Fig 7-4)
38
Fig 7-4 Length-Change Specimen of Concrete
Mixture CFNS-5 Showing a Crack
-004
-002
000
002
004
006
008
010
012
0 30 60 90 120 150
Age (days)
Leng
th C
hang
e (
)
Ref-3New-7New-8New-9
Fig 7-5 Length Change of Final Concrete Mixtures Group 1
During drying Mixture CN-2 and CFN-3 made by using high proportions of powdered
gypsum wallboard to fly ash shrunk by greater extents than Mixture C-2 At the age of 140
days the net shrinkage of Mixture CN-2 was 0035 which was approximately the same as that
of C-2 0036 Mixture CFN-3 showed a net expansion of 0027 at 140 day Mixture CFN-2
shrunk by approximately the same amount as Mixture C-2 resulting in a net shrinkage of
0017 at 140 days
39
-004
-002
000
002
004
006
008
010
012
0 30 60 90 120 150
Age (days)
Leng
th C
hang
e (
)
Ref-5New-14New-15New-16
Fig 7-6 Length Change of Final Concrete Mixtures Group 2
The length change of Mixture CFNS-3 (made with 60 cement 33 fly ash and 7
powdered gypsum wallboard) was approximately the same as that of Mixture Ref-5 Mixture
CFNS-4 (made with 40 cement 50 fly ash and 10 powdered gypsum wallboard) showed a
relatively large expansion (0043) during immersion in saturated limewater and shrunk during
drying as much as it had expanded resulting in very small net expansion of 0006 at the age of
140 days This concrete mixture could be used to minimize drying shrinkage cracking of
concrete Mixture CFNS-4 could be used to minimize drying shrinkage cracking of concrete
75 Sulfate Resistance
Mortar cubes and bars were made using the same proportions of cement fly ash and gypsum
wallboard as the final concrete mixtures Ref-5 CFNS-3 and CFNS-4 No mortar mixture was
made using the powder-materials proportions of concrete mixture CFNS-5 because it was
anticipated that such mortar would crack
Table 7-8 shows the proportions of the mortar mixtures produced
40
Table 7-8 Mixture Proportions and Flow of Mortar Mixtures Mixture Designation C-c C-b CFNS-1c CFNS-1b CFNS-2c CFNS-2b
Laboratory mixture designation C-2 cube C-2 bar N-3 cube N-3 bar N-4 cube N-4 barCement (mass of Cm) 100 100 60 60 40 40 Fly Ash (mass of Cm) 0 0 33 33 50 50
New Gypsum Wallboard (mass of Cm) 0 0 7 7 10 10 Sodium Sulfate (mass of Cm) 0 0 1 1 1 1
Cement (g) 500 740 300 444 200 296 Class C Fly Ash Weston (g) 0 0 165 2442 250 370
Powdered Gypsum Wallboard New (g) 0 0 35 518 50 74 Sodium Sulfate Na2SO4 (g) 0 0 5 74 5 76
Water (g) 242 359 216 3204 200 2967 Water-Cementitious Ratio WCm 0484 0485 0432 0433 0400 0401
Graded Standard Sand (g) 1375 2035 1375 2035 1375 2035 Flow (mm) 190 hellip 185 hellip 191 hellip
Cm Cementitious materials (Cement + Fly Ash + Gypsum Wallboard) Table 7-9 and Table 7-10 show test results for the compressive strength of mortar mixtures
It took approximately 15 days for Mixture C-c to attain a compressive strength of 20 MPa
(2900 psi) For Mixture N-3 it took 47 days and for Mixture N-4 7 days
Table 7-9 Compressive Strength of Mortar (MPa) Age (days) C-c CFNS-1c CFNS-2c
1 148 45 11 4 314 174 111 5 hellip 212 hellip
5125 hellip hellip 167 7 hellip hellip 197 24 hellip hellip 250 28 396 316
Note These results are averages obtained from testing two cubes for each mixture at each test age
Table 7-10 Compressive Strength of Mortar (psi) Age (days) C-c CFNS-1c CFNS-2c
1 2140 650 160 4 4550 2530 1610 5 hellip 3070 hellip
5125 hellip hellip 2420 7 hellip hellip 2850 24 hellip hellip 3630 28 5750 4580 hellip
Note These results are averages obtained from testing two cubes at each test age for each mixture
41
0
5
10
15
20
25
30
35
40
45
0 5 10 15 20 25 30Age (days)
Com
pres
sive
Str
engt
h (p
si)
0
1000
2000
3000
4000
5000
6000
(MP
a)
C-2N-3N-4
Fig 7-7 Compressive Strength of Mortar Cubes
Once the mixture attained the specified compressive strength of 20 MPa (2900 psi) the
mortar bars were immersed in a 5 sodium sulfate solution and length change of the bars were
measured after specified periods to assess sulfate resistance of mortar mixtures Table 7-11 and
Fig 7-8 show test results for length change of mortar bars A larger expansion implies a lower
resistance of mortar mixture to sulfate attack and a smaller expansion implies a higher resistance
to sulfate attack
Table 7-11 Length Change of Mortar Bars () Age after immersion in 5 sodium sulfate
solution (days) C-b CFNS-1b CFNS-2b
0 0 0 0 7 0007 0016 0006 14 0013 0024 0009 21 0016 0028 0009 28 0020 0033 0009 42 0027 0044 0011 56 0034 0063 0010
Number of specimens tested C-b five N-1-b six and N-2-b three
42
000
001
002
003
004
005
006
007
0 7 14 21 28 35 42 49 56 63
Days after immersion in Na2SO4 solution
Len
gth
Cha
nge
()
C-bCFNS-1bCFNS-2b
Fig 7-8 Length Change of Mortar Bars in 5 Sodium Sulfate Solution
After 56 days of immersion in sodium sulfate solution Mixture C-b (Control) showed an
expansion of approximately 0034 Mixture N-3 (made with 33 fly ash and 7 powdered
gypsum wallboard and 1 sodium sulfate) shows an expansion of 0063 which was
approximately 19 times that of Mixture C-b Mixture N-4 (made with 50 fly ash 10
powdered gypsum wallboard and 1 sodium sulfate) showed an expansion of 0010 which is
significantly lower than that of Mixture C-b (Control) This means that Mixture N-4 possesses
significantly higher resistance to sulfate attack than Mixture C-b Importantly the expansion of
mortar bars made from Mixture N-4 stabilized after 14 days of immersion in sodium sulfate
solution
76 Summary
Table 7-12 shows a summary of proportions of powder materials and properties of final
concrete mixtures Table 7-13 shows a summary of proportions and length change in sulfate
solution of mortar mixtures
43
Table 7-12 Proportions of Powder Materials and Properties of Final Concrete Mixtures Mixture Designation C-2 CN-2 CFN-2 CFN-3 C-4 CFNS-
3 CFNS-
4 CFNS-
5 Cement (mass of Cm) 100 90 70 60 100 60 40 20 Fly Ash (mass of Cm) 0 0 20 20 0 33 50 60
New Gypsum Wallboard (mass of Cm) 0 10 10 20 0 7 10 20 Sodium Sulfate (mass of Cm) 0 0 0 0 0 1 1 2
Time of Initial Setting (hours) 48 72 114 120 47 98 118 105 Compressive Strength (MPa)
1-day 168 111 42 39 159 58 38 24 3-day 301 197 174 132 302 237 178 79 7-day 354 232 265 154 347 301 297 125
28-day 448 285 414 211 408 415 420 hellip 91-day 508 419 501 289 515 443 497 hellip
Compressive Strength (psi) 1-day 2430 1610 610 560 2310 840 550 350 3-day 4360 2860 2520 1910 4380 3440 2580 1140 7-day 5140 3370 3850 2240 5040 4370 4310 1810
28-day 6500 4140 6000 3060 5920 6020 6090 hellip 91-day 7370 6070 7270 4190 7470 6430 7210 hellip
Length Change () 1-day 0 0 0 0 0 0 0 0 7-day -0003 0013 0031 0036 0004 0005 0039 1708
28-day 0004 0026 0033 0116 0002 0010 0043 hellip 140-day -0036 -0035 -0017 0027 -0035 -0035 0006 hellip
Cm Cementitious materials (Cement + Fly Ash + Gypsum Wallboard) Specimens had cracked on their own
Table 7-13 Proportions of Powder Materials and Length Change in Sulfate Solution of Mortar Mixtures
Mixture Designation C-b CFNS-1b
CFNS-2b
Laboratory mixture designation Cement (mass of Cm) 100 60 40 Fly Ash (mass of Cm) 0 33 50
New Gypsum Wallboard (mass of Cm) 0 7 10 Sodium Sulfate (mass of Cm) 0 1 1
Length Change in 5 Sodium Sulfate Solution () 0-day 0 0 0 7-day 0007 0016 0006
14-day 0013 0024 0009 21-day 0016 0028 0009 28-day 0020 0033 0009 42-day 0027 0044 0011 56-day 0034 0063 0010
44
Table 7-14 shows a summary of properties of selected promising main concrete mixtures
Mixtures CFN-2 CFNS-3 and CFNS-4 were comparable to their reference concrete mixtures in
compressive strength at the ages of 7 days and later Based on the sulfate resistance of Mortar
N-4 it is expected that concrete Mixture CFNS-4 will also possess high resistance to sulfate
attack
Table 7-14 Summary of Proportions and Properties of Selected Final Concrete Mixtures and Mortar Mixtures
Mixture Designation C-4 CFN-2 CFNS-3
CFNS-4
Cement (mass of Cm) 100 70 60 40 Fly Ash (mass of Cm) 0 20 33 50
New Gypsum Wallboard (mass of Cm) 0 10 7 10 Sodium Sulfate (mass of Cm) 0 0 1 1
Time of Initial Setting (hours) 47 114 98 118 Compressive Strength (MPa)
1-day 159 42 58 38 3-day 302 174 237 178 7-day 347 265 301 297
28-day 408 414 415 420 91-day 515 501 443 497
Compressive Strength (psi) 1-day 2310 610 840 550 3-day 4380 2520 3440 2580 7-day 5040 3850 4370 4310
28-day 5920 6000 6020 6090 91-day 7470 7270 6430 7210
Length Change () 1-day 0 0 0 0
28-day 0002 0033 0010 0043 140-day -0035 -0017 -0035 0006
28-day Length Change of Mortar in 5 Sodium Sulfate Solution ()
0020 hellip 0033 0009
Cm Cementitious materials (Cement + Fly Ash + Gypsum Wallboard)
45
CHAPTER 8 ECONOMIC IMPACT ANALYSIS OF FULL-
SCALE IMPLEMENTATION
It is estimated that over 80000 tons of gypsum wallboard is disposed of each year from new
construction and demolition in Wisconsin If a tipping fee plus handling and transportation cost
of $30 per ton is assumed the disposal of gypsum wallboard costs Wisconsin citizens and
industry approximately $24 million dollars each year
Based on figures from the National Ready-Mixed Concrete Association Wisconsin produced
approximately 11 million cubic yards (84 million m3) of concrete in 2004 Based on a cement
content of 400 pounds per cubic yard (240 kgm3) of concrete 22 million tons of cement is used
in concrete each year in Wisconsin
This project showed that powdered gypsum wallboard could constitute approximately 10
of total cementitious materials used in a concrete mixture If this new cementitious material was
used in 20 of the concrete produced in Wisconsin approximately 44000 tons of gypsum
wallboard can be used In other words approximately half of the gypsum wallboard waste
generated in Wisconsin could be used in this application alone This would save Wisconsin
industry $13 million dollars each year in avoided disposal costs leading to reduce the cost for
concrete construction in Wisconsin Citizens would benefit also by reducing landfilling cost for
municipalities and increasing recycling rates of useful materials If 40 of the concrete
generated in Wisconsin used this new concrete mixture technology all of the waste gypsum
wallboard generated in Wisconsin could be used in this one application Therefore all 80000
tons of waste gypsum wallboard could be diverted from Wisconsin landfills It would save
Wisconsin citizens and industry over $24 million dollars each year in avoided disposal cost
46
This economic impact does not include incalculable dollar-benefits due to avoided possible
future environmental impact of sending such large quantities of gypsum wallboard into landfills
This project also showed that up to 60 of cement in concrete mixtures could be replaced
with a blend of Class C fly ash and gypsum wallboard Cement is a valuable commodity If it is
assumed that cement sells at $100 per ton and Class C fly ash sells at $50 per ton use of a
cementitious blend consisting of 40 cement 50 Class C fly ash and 10 powdered gypsum
in producing 40 of concrete in Wisconsin would result in savings on cement of about $50
million and expenditure on fly ash of about $20 million with a net savings of about $30 million
each year
Saving cement through this new technology would also reduce emissions of carbon dioxide
and other GHGs because production of one ton of cement releases about one ton of GHGs If
this new technology to use a blend of Class C fly ash and gypsum wallboard as a replacement of
cement were implemented in producing up to 40 of concrete in Wisconsin it would reduce the
GHG emissions by up to 12 million tons each year CO2 credits currently sell for about $20 per
ton Therefore CO2 credits would be worth $10 million each year
With a potential total value of $24 million in avoided disposal costs $30 million in savings
resulting from cement replacement plus $10 million in CO2 credits total economic benefit to
Wisconsin that could be generated by this project may be valued at about $42 million each year
47
CHAPTER 9 CONCLUSIONS
This project showed that from 30 to 60 of cement in concrete mixtures could be
successfully replaced with blends of Class C fly ash and powdered gypsum wallboard Several
concrete mixtures made by such replacements showed compressive strength nearly as high as
that of Reference concrete mixtures (without replacement of cement) at seven days The 28-day
compressive strength of these concrete mixtures containing fly ash and gypsum wallboard were
equivalent to that of Reference concrete mixtures Use of sodium sulfate as an activator was
essential in improving the 1-day and 3-day strength of concrete containing Class C fly ash and
gypsum wallboard
A concrete mixture made with a cementitious blend of 40 cement 50 Class C fly ash
and 10 powdered gypsum wallboard showed a relatively large expansion (0043) during
immersion in saturated limewater and shrunk during drying as much as it had expanded
resulting in very small net expansion at the age of 140 days This concrete mixture could be
used to minimize drying shrinkage cracking and subsequent increase in durability of concrete
A mortar mixture made with a cementitious blend of 40 cement 50 Class C fly ash and
10 powdered gypsum wallboard showed much higher resistance to sulfate attack compared
with Reference mortar (without replacement of cement)
Total economic benefit to Wisconsin that could be generated by this project may be valued at
up to about $42 million each year
48
CHAPTER 10 REFERENCES
ASTM C 33-03 ldquoStandard Specification for Concrete Aggregatesrdquo ASTM International West Conshohocken PA 11 pp
ASTM C 150-05 ldquoStandard Specification for Portland Cementrdquo ASTM International West Conshohocken PA 8 pp
ASTM C 192 C 192M-05 ldquoStandard Practice for Making and Curing Concrete Test Specimens in the Laboratoryrdquo 8 pp
ASTM C 494C 494M-05a ldquoStandard Specification for Chemical Admixtures for Concreterdquo ASTM International West Conshohocken PA 10 pp
ASTM C 618-03 ldquoStandard Specification for Coal Fly Ash and Raw or Calcined Natural Pozzolan for Use in Concreterdquo ASTM International West Conshohocken PA 3 pp
ASTM C 1012-04 ldquoStandard Test Method for Length Change of Hydraulic-Cement Mortars Exposed to a Sulfate Solutionrdquo ASTM International West Conshohocken PA 6 pp
Aimin X and Sarkar S L ldquoMicrostructural Study of Gypsum Activated Fly Ash Hydration in Cement Pasterdquo Cement and Concrete Research Vol 21 1991 pp 1137-1147
Drywallrecyclingorg lthttpwwwdrywallrecyclingorggt (February 2006)
EPA Presentation by the US Environmental Protection Agency at the Massachusetts DEP Gypsum Workgroup March 18 2004
Freeman R B and Carrasquillo R L ldquoProduction of Sulfate-Resistant Concrete Containing High-Calcium Fly Ash and Sodium Sulfate Admixturerdquo Proceedings of Fifth CANMETACI International Conference on Fly Ash Silica Fume Slag and Natural Pozzolans in Concrete ACI SP-153 Vol 1 1995 pp 153-176
ICF Northwest ldquoCalcium Spray Dryer Waste Management Design Guidelinesrdquo EPRI (Electric Power Research Institute) Report No CS-5312 September 1987 p 3-3
Krocak R F Meininger R and Yost P A Chapter 21 ldquoBeneficial Reuse of Aggregate Mineral Fines and Scrap New Construction Wallboardrdquo Land Application of Agricultural Industrial and Municipal By-Products (6) James F Powers and Warren P Dick ed SSSA Number 6 in the Soil Science Society of America Book Series ISBN 0-89118-834-7 Item Number 60901 2000 653 pages
Kumar P K and Monteiro P J M ldquoConcrete Microstructure Properties and Materialsrdquo 2nd Ed McGraw-Hill 1993
Lafarge Group ltwwwlafargecomgt (February 2006)
49
Ma W Liu C Brown P W and Komarneni S ldquoPore Structures of Fly Ashes Activated By Ca(OH)2 and CaSO42H2Ordquo Cement and Concrete Research Vol 25 No 2 1995 pp 417-425
McCall R ldquoWasteCap Wisconsin Drywall-To-Fertilizer Projectrdquo Final Report for the US Environmental Protection Agency August 1993
Merritt F S and Ricketts J T editors Building Design and Construction Handbook McGraw Hill 6th Ed 2001 pp 435-438
Mindness S Young J F and Darwin D ldquoConcreterdquo 2nd Ed Prentice Hall 2002
Naik T R Kraus R N Chun Y-m and Nageotte S O ldquoCoal-Combustion Bottom Ash for Reducing the Shrinkage of Concrete Made With Portland Cement and Sulfoaluminate Cementrdquo Jean Pera Symposium on Specialty Cements and Sustainability Issues a part of the proceedings of the Ninth CANMETACI International Conference on Recent Advances in Concrete Technology Warsaw Poland May 2007 pp 141-155
Neville A ldquoProperties of Concreterdquo 4th Ed Longman 1995
Pera J and Ambroise J ldquoNew Applications of Calcium Sulfoaluminate Cementrdquo Cement and Concrete Research Vol 34 No 4 April 2004 pp 671-676
Prusinski J R and Carrasquillo R L ldquoUsing Medium- to High-Volume Fly Ash Blended Cements to Improve the Sulfate Resistance of High-Lime Fly Ash Concreterdquo Proceedings of Fifth CANMETACI International Conference on Fly Ash Silica Fume Slag and Natural Pozzolans in Concrete ACI SP-153 Vol 1 1995 pp 43-65
Reindl J R ldquoBibliography of Gypsum Drywallrdquo available on the WasteCap Wisconsin website httpwwwwastecapwiorg August 2002 73 pages
WI-DNR ldquoSubstituting Waste Gypsum Wallboard for Agricultural Gypsumrdquo Wisconsin Department of Natural Resources Bureau of Waste Management DNR Publication WA-607-04 rev 2005
Wolkowski R ldquoDemonstration of Land Application of Crushed Gypsum Wallboard Waste for Alfalfardquo Final report to the Wisconsin Department of Natural Resources Waste Reduction and Recycling Grant Program and Dane County Department of Public Works August 12 1998
Wolkowski R P ldquoUsing Recycled Wallboard for Crop Production (A3782)rdquo WasteCap Wisconsin Inc 2003
Wu Z and Naik T R ldquoUse of Clean Coal Ash as Setting Time Regulator in Portland Cementrdquo Proceedings of the Fifth CANMETACI International Conference on Recent Advances in Concrete Technology Supplementary Papers 2001 pp 83-94
50
Wu Z and Naik T R ldquoProperties of Concrete Produced from Multicomponent Blended Cementsrdquo Cement and Concrete Research Vol 32 2002 pp 1937-1942
Wu Z and Naik T R ldquoChemically Activated Blended Cementsrdquo ACI Materials Journal September-October 2003 pp 434-440
- 08 Naik Chun cover
- 08 MIL NaikGypsumWallboard in concrete
-
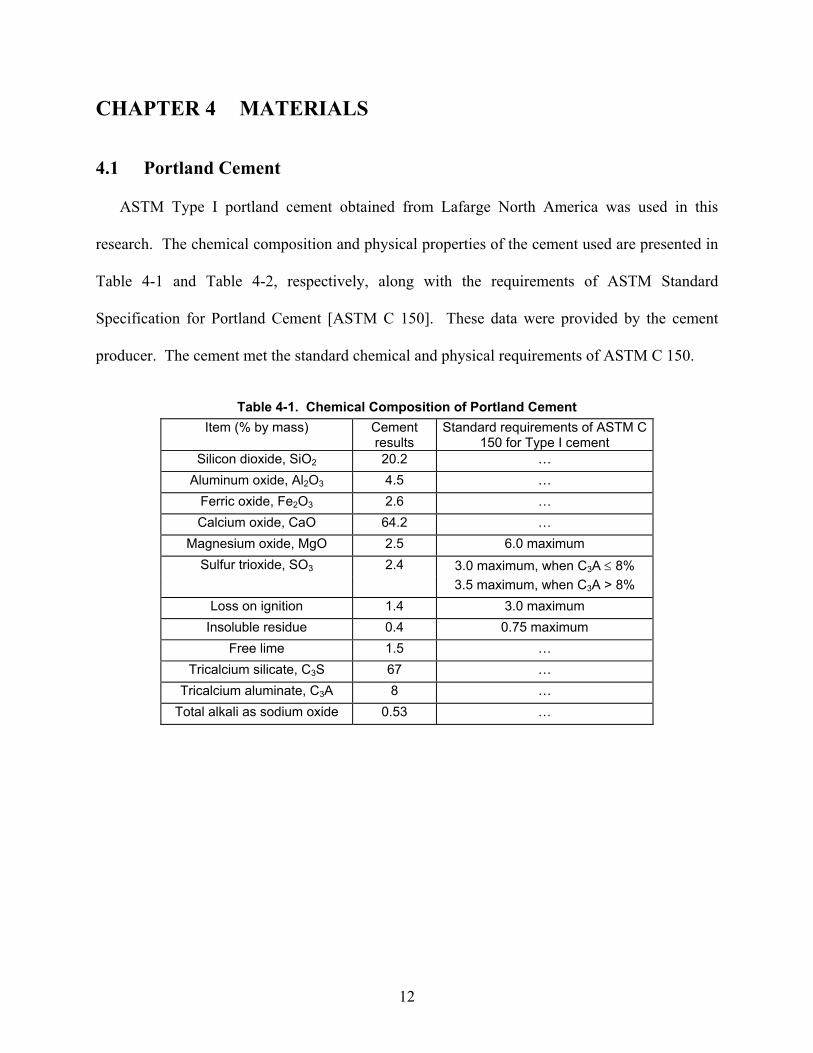
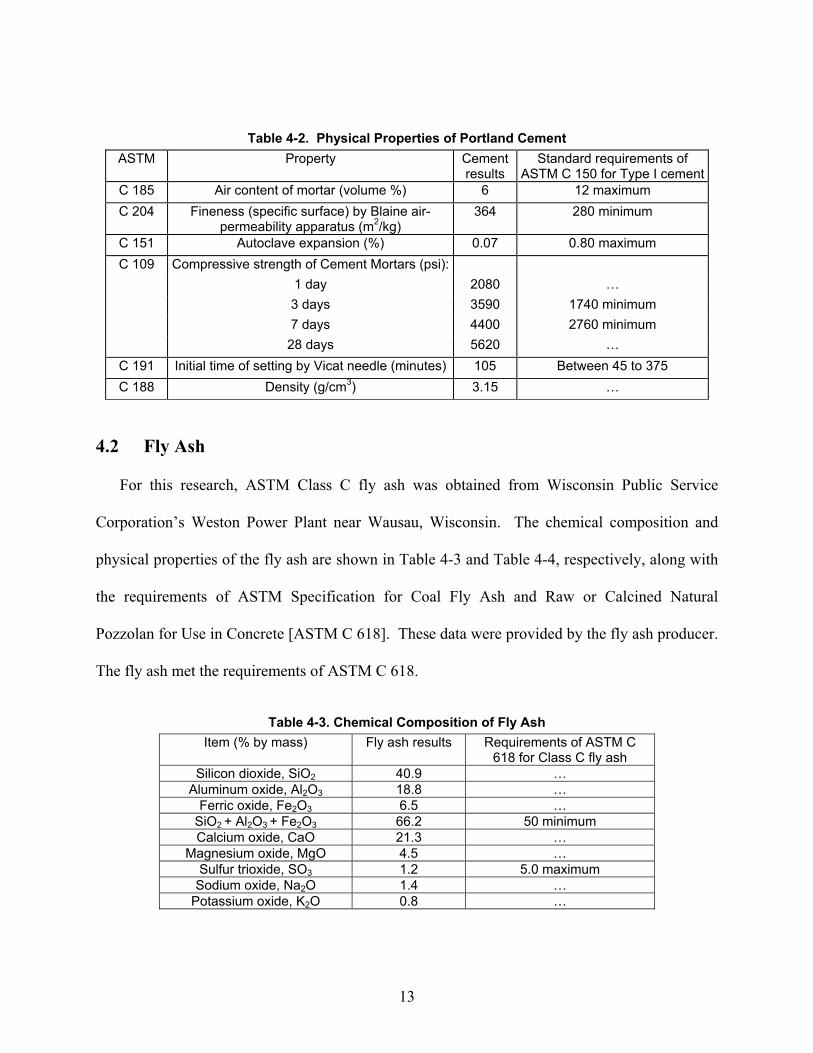
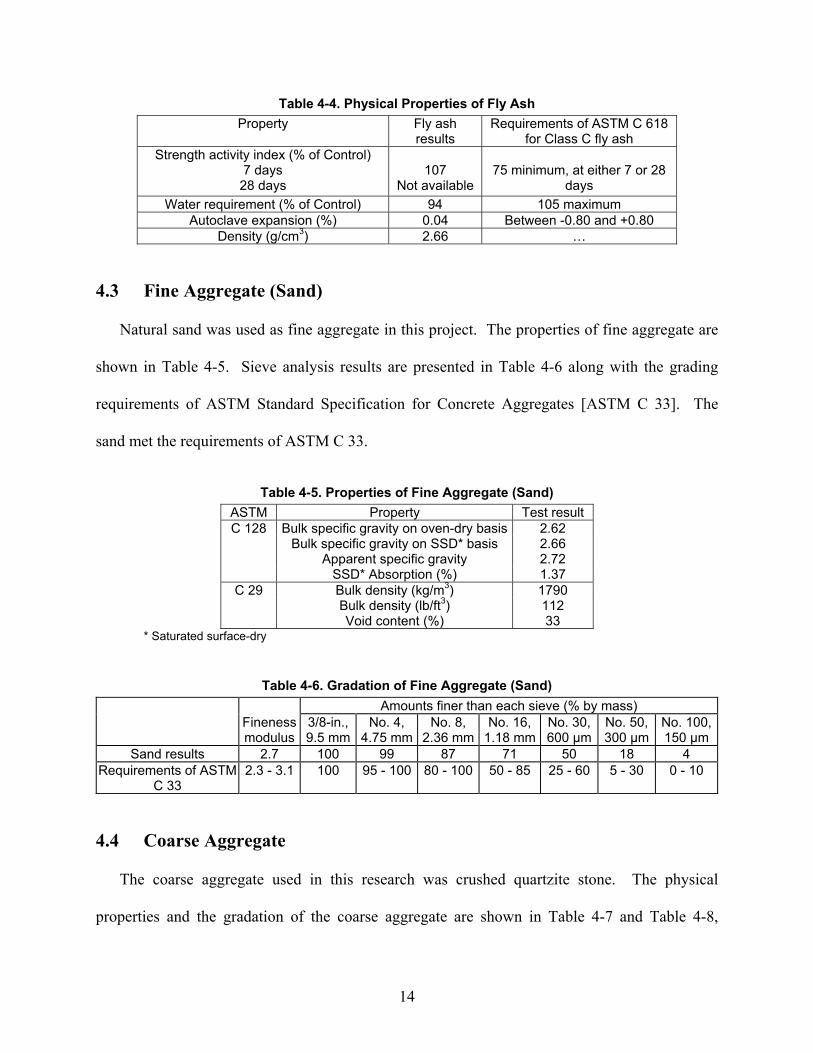
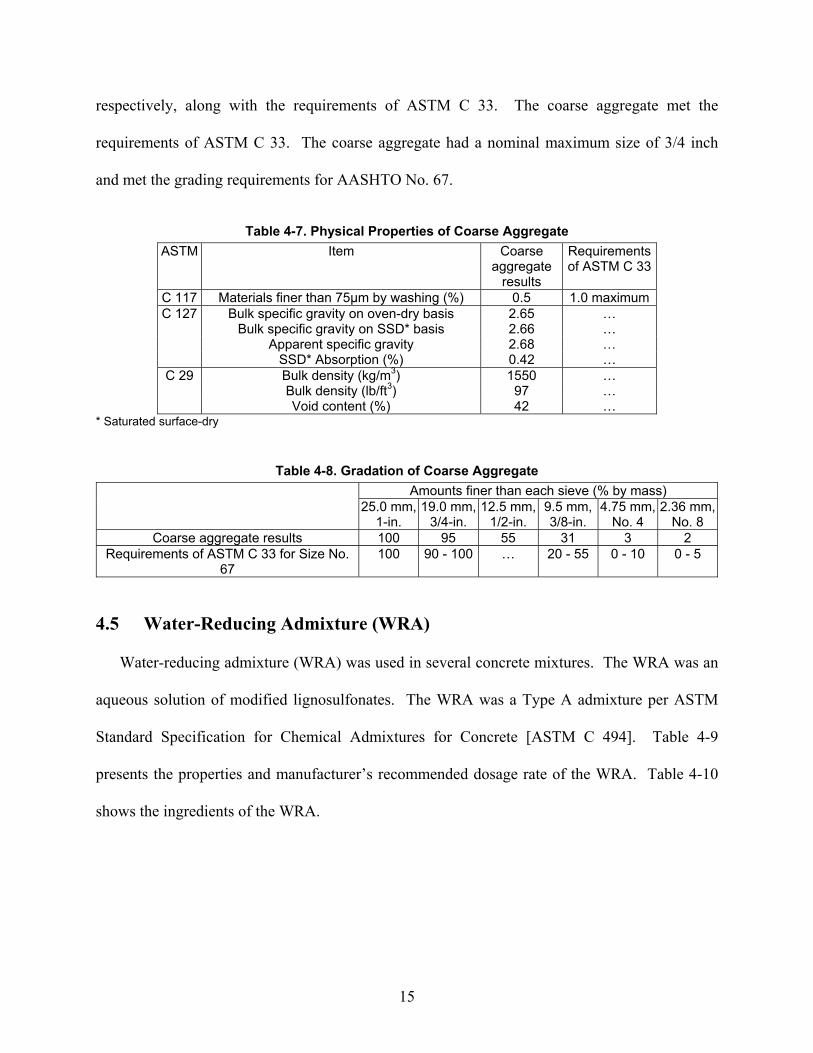
15
respectively along with the requirements of ASTM C 33 The coarse aggregate met the
requirements of ASTM C 33 The coarse aggregate had a nominal maximum size of 34 inch
and met the grading requirements for AASHTO No 67
Table 4-7 Physical Properties of Coarse Aggregate ASTM Item Coarse
aggregate results
Requirements of ASTM C 33
C 117 Materials finer than 75microm by washing () 05 10 maximum C 127 Bulk specific gravity on oven-dry basis 265 hellip
Bulk specific gravity on SSD basis 266 hellip Apparent specific gravity 268 hellip SSD Absorption () 042 hellip
C 29 Bulk density (kgm3) 1550 hellip Bulk density (lbft3) 97 hellip Void content () 42 hellip
Saturated surface-dry
Table 4-8 Gradation of Coarse Aggregate Amounts finer than each sieve ( by mass) 250 mm
1-in 190 mm
34-in 125 mm
12-in 95 mm 38-in
475 mm No 4
236 mm No 8
Coarse aggregate results 100 95 55 31 3 2 Requirements of ASTM C 33 for Size No
67 100 90 - 100 hellip 20 - 55 0 - 10 0 - 5
45 Water-Reducing Admixture (WRA)
Water-reducing admixture (WRA) was used in several concrete mixtures The WRA was an
aqueous solution of modified lignosulfonates The WRA was a Type A admixture per ASTM
Standard Specification for Chemical Admixtures for Concrete [ASTM C 494] Table 4-9
presents the properties and manufacturerrsquos recommended dosage rate of the WRA Table 4-10
shows the ingredients of the WRA
16
Table 4-9 Properties and Manufacturerrsquos Recommended Dosage Rate of Water-Reducing Admixture
Chemical family name
Specific gravity
Water content ()
pH Dosage rate (mL100 kg of cementitious
materials)
Dosage rate (fl oz100 lb of cementitious
materials) Aqueous solution of
lignosulfonate amine and compound carbohydrates
11 - 12 ~ 50 65 - 75 190 - 375 3 - 6
Table 4-10 Ingredients of Water-Reducing Admixture Ingredient Chemical Abstracts Service
(CAS) Registry Number Maximum percent
Sodium o-phenylphenol 000132-27-4 lt 1 Triethanolamine 000102-71-6 1-10
Triethanolamine acetate 014806-72-5 1-10
46 Gypsum Wallboard
Gypsum wallboard was obtained from two locations on the campus of University of
Wisconsin-Milwaukee (Fig 4-1 to 4-7) One source was pieces of drywall from demolition of
existing walls and was designated as ldquoOldrdquo The label on the Old drywall showed that it was
ldquoType SCXrdquo drywall The other source was cuttings of drywall from new construction and was
designated as ldquoNewrdquo It was ldquoType Xrdquo drywall Both the Old and New gypsum wallboards
contained glass fibers Type X New gypsum wallboard appeared to contain more glass fibers
than Type SCX Old gypsum wallboard Paper covering of gypsum wallboard was removed as
much as possible and gypsum wallboard was ground into powder using a laboratory mechanical
ball-mill at UWM-CBU
17
Fig 4-1 Close-Up View of Old Gypsum
Wallboard Containing Glass Fibers
Fig 4-2 Cut-Pieces of Old Gypsum Wallboard
Fig 4-3 Ball-Mill for Pulverizing Cut-Pieces of
Gypsum Wallboard
Fig 4-4 Old Gypsum Wallboard After Milling
and Sieving
Fig 4-5 Pieces of ldquoNewrdquo Gypsum Wallboard
Fig 4-6 Glass Fibers in New Gypsum Wallboard
18
Fig 4-7 New Gypsum Wallboard After Milling
and Sieving
19
CHAPTER 5 SPECIMEN PREPARATION AND TEST
METHODS
51 Mixing and Specimen Preparation
Test specimens of concrete were prepared and cured in accordance with the ASTM Standard
Practice for Making and Curing Concrete Test Specimens in the Laboratory [ASTM C 192]
The concrete mixer used in this project was an electric-power driven revolving drum tilting
mixer
The cast specimens were removed from their molds 24 plusmn 4 hours after casting The
specimens were then moist cured in a moist room at a temperature of 23 plusmn 2degC (73 plusmn 35degF) and
a relative humidity of not less than 95 except for length-change specimens which were stored
in saturated limewater until the age of 28 days and then stored in air at a temperature of 23 plusmn 2degC
(73 plusmn 35degF) and a relative humidity of 50 plusmn 4
Mortar cubes and bars for sulfate resistance test were cured in 23degC (instead of in 35degC water
specified in ASTM C 1012 due to difficulty in sealing fresh specimens) until the cubes reached a
compressive strength of 20 MPa (2900 psi) The specimens were cured in a moist-enclosure
until the age of 24 hours and then in saturated limewater
Photographs for making test specimens are shown below Fig 5-1 to 5-4
20
Fig 5-1 Consolidation of Concrete Cylinders
on a Vibrating Table
Fig 5-2 Length-Change Molds with Plastic
Liners and Studs
Fig 5-3 Finishing the Surface of Length-
Change Beams
Fig 5-4 Sieving Fresh Concrete to Obtain
Mortar for Casting Time of Setting Specimens
52 Test Methods
The tests conducted on preliminary concrete mixtures are summarized below in Table 5-1
The tests conducted on final concrete mixtures and mortar mixtures are summarized in Table
5-2
Table 5-1 Tests Conducted on Preliminary Concrete Mixtures in Task 2 for Optimization of Mixture Proportions
Test ASTM 0-day 1-day 7-day 28-day Slump C 143 x Density C 138 x
Air content by the pressure method
C 231 x
Compressive strength C 39 x x x
21
Table 5-2 Tests Conducted on Final Concrete Mixtures and Mortar Mixtures in Task 3 Test ASTM 0-day 1-day 3-day 7-day 28-day 91-day
Slump and slump retention C 143 x Density C 138 x
Air content by the pressure method
C 231 x
Compressive strength C 39 x x x x x Time of initial setting C 403 x
Length change C 157 Start Sulfate resistancedagger C 1012
Slump was measured again 30 minutes after completion of concrete mixing dagger Test started when accompanying cubes reached compressive strength of 20 MPa (2900 psi) Compressive strength of concrete was determined by testing three 100-mm diameter times 200-
mm length (4 times 8 in) cylinders at each test age for each mixture Length change specimens
consisted of three 75 times 75 times 285 mm (3 times 3 times 1125 in) beams for each concrete mixture For
each mortar mixture six mortar prisms were cast for measuring length change in 5 sodium
sulfate solution to evaluate their sulfate resistance Some prisms broke in the process of
separating from molds and could not be tested
Photographs of testing are shown below Fig 5-5 to 5-11
Fig 5-5 Testing of Cylinder for Compressive
Strength
Fig 5-6 Testing of Beam for Length Change
22
Fig 5-7 Air Storage of Length-Change Beams
After 28 Days of Moist Curing In Saturated Limewater
Fig 5-8 Saturated Limewater Containers for
Curing Mortar Cubes and Bars
Fig 5-9 Saturated Limewater Containing
Mortar Cubes and Bars
Fig 5-10 Testing of Mortar Cube for
Compressive Strength
Fig 5-11 Measurement of Mortar Bar
23
CHAPTER 6 PRELIMINARY MIXTURES
A series of preliminary concrete mixtures were produced in order to establish mixture
proportions for final concrete mixtures
61 Group 1 Preliminary Mixtures
Group 1 preliminary concrete mixtures were made using ldquoOldrdquo gypsum wallboard The
mixture proportions of Group 1 concrete mixtures are shown in Table 6-1 (powder materials)
Table 6-2 (SI units) and Table 6-3 (inch-pound units) Mixtures CFOS-1 CFOS-2 and CFOS-3
were made with old gypsum wallboard using the proportions developed in Table 3-2 which was
based on previous UWM-CBU research projects Sodium sulfate was used as an activator
Table 6-1 Proportions of Powder Materials Used for Group 1 Preliminary Concrete Mixtures Mixture Designation C-1 CFO
S-1 CFOS-2
CFOS-3
CFO-1
CFO-2
CF-1 CO-1
Laboratory mixture designation Ref-1 Old-2 Old-3 Old-4 Old-5 Old-6 Old-7 Old-8Cement (mass of Cm) 100 60 40 20 60 40 67 93 Fly Ash (mass of Cm) 0 33 50 60 33 50 33 0
Old Gypsum Wallboard (mass of Cm) 0 7 10 20 7 10 0 7 Sodium Sulfate (mass of Cm) 0 2 2 4 0 0 0 0
Cm Cementitious materials (Cement + Fly Ash + Gypsum Wallboard)
Table 6-2 Mixture Proportions and Fresh Concrete Properties of Group 1 Preliminary Mixtures (SI [Metric] Units)
Mixture Designation C-1 CFOS-1
CFOS-2
CFOS-3
CFO-1
CFO-2
CF-1 CO-1
Cement (kgm3) 358 214 143 71 215 143 246 334 Class C Fly Ash Weston (kgm3) 0 118 179 213 119 179 121 0
Powdered Gypsum Wallboard Old (kgm3) 0 25 36 71 25 36 0 25 Water (kgm3) 171 161 162 155 163 159 151 164
Sand SSD (kgm3) 849 848 843 834 850 847 872 847 Crushed Stone 19-mm max SSD (kgm3) 1020 1020 1010 1010 1020 1020 1050 1020
Sodium Sulfate Na2SO4 (kgm3) 0 72 71 142 0 0 0 0 Water-Cementitious Ratio WCm 048 045 045 044 045 044 041 046
Slump (mm) 65 30 40 40 55 65 65 25 Air Content () 13 18 18 21 19 22 14 20
Air Temperature (degC) 23 23 23 24 23 23 23 23 Concrete Temperature (degC) 21 22 22 21 22 22 22 21
Density (kgm3) 2400 2390 2380 2370 2390 2380 2440 2390SSD Saturated surface-dry
24
Table 6-3 Mixture Proportions and Fresh Concrete Properties of Group 1 Preliminary Mixtures (Inch-Pound Units)
Mixture Designation C-1 CFOS-1
CFOS-2
CFOS-3
CFO-1
CFO-2
CF-1 CO-1
Cement (lbyd3) 603 361 240 120 362 241 414 562 Class C Fly Ash Weston (lbyd3) 0 199 301 358 200 302 204 0
Powdered Gypsum Wallboard Old (lbyd3) 0 42 60 120 42 60 0 42 Water (lbyd3) 288 270 273 261 274 268 255 276
Sand SSD (lbyd3) 1430 1430 1420 1400 1430 1430 1470 1430Crushed Stone 34 in max SSD (lbyd3) 1720 1720 1710 1700 1720 1710 1760 1710
Sodium Sulfate Na2SO4 (lbyd3) 0 12 12 24 0 0 0 0 Water-Cementitious Ratio WCm 048 045 045 044 045 044 041 046
Slump (in) 2 12 1 14 1 12 1 12 2 14 2 12 2 12 1 Air Content () 13 18 18 21 19 22 14 20
Air Temperature (degF) 74 74 74 75 73 73 73 73 Concrete Temperature (degF) 70 71 71 70 72 72 71 70
Density (lbft3) 150 149 149 148 149 149 152 149 SSD Saturated surface-dry Test results for compressive strength of Group 1 concrete mixtures are shown in Table 6-4
(in MPa) and Table 6-5 (in psi) Mixtures CFOS-1 and CFOS-2 were strong enough to be
demolded at one day and showed quite high compressive strength values of 347 MPa (5040 psi)
and 330 MPa (4790 psi) at seven days Mixture CFOS-3 was also strong enough to be
demolded at one day
Table 6-4 Compressive Strength of Group 1 Preliminary Concrete Mixtures (MPa) Age (days) C-1 CFO
S-1 CFOS-2
CFOS-3
CFO-1
CFO-2
CF-1 CO-1
1 106 59 39 23 28 07dagger 60 88 7 308 347 330 hellip 291 245 330 26528 396 456 429 hellip 428 379 480 429
dagger Result from testing only one cylinder all other results are from testing three cylinders each Cylinders had cracked on their own
Table 6-5 Compressive Strength of Group 1 Preliminary Concrete Mixtures (psi) Age (days) C-1 CFO
S-1 CFOS-2
CFOS-3
CFO-1
CFO-2
CF-1 CO-1
1 1540 850 560 340 400 100dagger 870 12707 4470 5040 4790 hellip 4220 3550 4780 385028 5740 6620 6220 hellip 6210 5490 6960 6220
dagger Result from testing only one cylinder all other results are from testing three cylinders each Cylinders had cracked on their own
25
Fig 6-1 is a photograph of a cylinder of Mixture CFOS-2 It was noted that white material
was appearing on a CFOS-2 cylinder obtained after compression test
Fig 6-2 shows a photograph of cylinders from Mixture CFOS-3 Mixture CFOS-3
developed a significant amount of efflorescence and cylinders cracked by themselves before
reaching the age of seven days
Mixtures CFO-1 and CFO-2 were made using the same proportions of cement fly ash and
old gypsum wallboard as Mixtures CFOS-1 and CFOS-2 but without using sodium sulfate
Mixtures CFO-1 and CFO-2 were weaker than Mixtures CFOS-1 and CFOS-2 especially at the
age of one day Mixture CFO-2 was so soft that two out of three cylinders broke during
demolding at the age of one day
Mixture CF-1 was made using only cement and fly ash Mixture CO-1 was made using only
cement and old gypsum wallboard Compared with Mixture C-1 Mixture CO-1 showed a lower
strength at 1 and 7 days and a higher strength at 28 days
Fig 6-1 Efflorescence Appearing on Cylinder
of Mixture CFOS-2 Left from Compression Test
Fig 6-2 Efflorescence Appearing on Air-Dried
Cylinders of CFOS-3
26
62 Group 2 Preliminary Mixtures
Group 2 preliminary concrete mixtures were made using ldquoNewrdquo gypsum wallboard Sodium
bicarbonate was used in the majority of the Group 2 mixtures for evaluation as an activator
Table 6-6 Table 6-7 and Table 6-8 show mixture proportions of Group 2 concrete mixtures
Proportions of Mixtures C-1 and CF-1 of Group 1 are shown as well for easier comparison
Unlike sodium sulfate use of sodium bicarbonate increased water demand of fresh concrete
resulting in high water-cementitious ratios for the desired workability
Table 6-6 Proportions Powder Materials Used for Group 2 Preliminary Concrete Mixtures Mixture Designation C-1 CF-1 CN-1 CFN-
1 CB-1 CFB-
1 CNB-
1 CFNB-1
CFNB-2
CFNB-3
Laboratory mixture designation Ref-1 Old-7 New-1
New-2
Ref-2 FA-1 New-3
New-4
New-5
New-6
Cement (mass of Cm) 100 67 93 60 100 67 93 60 40 53 Fly Ash (mass of Cm) 0 33 0 33 0 33 0 33 50 33
New Gypsum Wallboard (mass of Cm)
0 0 7 7 0 0 7 7 10 14
Sodium Bicarbonate (mass of Cm) 0 0 0 0 2 2 2 2 2 2 Cm Cementitious materials (Cement + Fly Ash + Gypsum Wallboard)
Table 6-7 Mixture Proportions and Fresh Concrete Properties of Group 2 Preliminary Mixtures (SI [Metric] Units)
Mixture Designation C-1 CF-1 CN-1 CFN-1
CB-1 CFB-1
CNB-1
CFNB-1
CFNB-2
CFNB-3
Cement (kgm3) 358 246 331 215 354 241 318 210 140 186 Class C Fly Ash Weston (kgm3) 0 121 0 119 0 119 0 116 175 115
Powdered Gypsum Wallboard New (kgm3)
0 0 25 25 0 0 24 25 35 49
Water (kgm3) 171 151 181 153 189 164 199 176 166 171 Sand SSD (kgm3) 849 872 840 850 841 857 809 830 827 825
Crushed Stone 19-mm max SSD (kgm3)
1020 1050 1010 1020 1010 1030 971 999 994 994
Sodium Bicarbonate NaHCO3 (kgm3) 0 0 0 0 71 72 68 70 70 70 Water-Cementitious Ratio WCm 048 041 051 043 053 045 058 050 047 049
Slump (mm) 65 65 45 50 70 55 95 65 65 65 Air Content () 13 14 18 19 14 12 21 18 23 22
Air Temperature (degC) 23 23 22 22 23 23 23 23 23 23 Concrete Temperature (degC) 21 22 21 20 23 23 23 22 22 23
Density (kgm3) 2400 2440 2390 2380 2400 2420 2330 2360 2340 2350SSD Saturated surface-dry
27
Table 6-8 Mixture Proportions and Fresh Concrete Properties of Group 2 Preliminary Mixtures (Inch-Pound Units)
Mixture Designation C-1 CF-1 CN-1 CFN-1
CB-1 CFB-1
CNB-1
CFNB-1
CFNB-2
CFNB-3
Cement (lbyd3) 603 414 557 362 596 407 536 354 236 313 Class C Fly Ash Weston (lbyd3) 0 204 0 200 0 201 0 195 295 194
Powdered Gypsum Wallboard New (lbyd3)
0 0 42 42 0 0 40 41 59 82
Water (lbyd3) 288 255 305 258 318 276 336 296 279 289 Sand SSD (lbyd3) 1430 1470 1410 1430 1420 1440 1360 1400 1390 1390
Crushed Stone 34 in max SSD (lbyd3)
1720 1760 1700 1720 1700 1730 1640 1680 1670 1670
Sodium Bicarbonate NaHCO3 (lbyd3) 0 0 0 0 12 12 12 12 12 12 Water-Cementitious Ratio WCm 048 041 051 043 053 045 058 050 047 049
Slump (in) 2 12 2 12 1 34 2 2 34 2 14 3 34 2 12 2 12 2 12Air Content () 13 14 18 19 14 12 21 18 23 22
Air Temperature (degF) 74 73 72 72 73 74 73 74 73 73 Concrete Temperature (degF) 70 71 69 68 74 73 73 71 72 74
Density (lbft3) 150 152 149 149 150 151 145 147 146 146 SSD Saturated surface-dry Table 6-9 and Table 6-10 show test results for compressive strength of Group 2 concrete
mixtures When sodium bicarbonate was used in concrete containing new gypsum wallboard
the 1-day compressive strength of concrete improved but the 28-day compressive strength was
reduced When sodium bicarbonate was used in concrete made with cement (without fly ash or
gypsum) and in concrete made with cement and fly ash (without gypsum) the compressive
strength of concrete was reduced at all test ages of 1 7 and 28 days Unlike Mixture CFOS-3
from Group 1 the test cylinders did not develop any cracking
Table 6-9 Compressive Strength of Group 2 Preliminary Concrete Mixtures (MPa) Age (days) C-1 CF-1 CN-1 CFN-
1 CB-1 CFB-
1 CNB-
1 CFNB-1
CFNB-2
CFNB-3
1 106 60 74 32 90 57 76 57 36 48 7 308 330 236 323 228 202 231 283 265 21528 396 480 347 407 294 299 327 354 400 315
28
Table 6-10 Compressive Strength of Group 2 Preliminary Concrete Mixtures (psi) Age (days) C-1 CF-1 CN-1 CFN-
1 CB-1 CFB-
1 CNB-
1 CFNB-1
CFNB-2
CFNB-3
1 1540 870 1080 470 1310 820 1100 830 520 690 7 4470 4780 3430 4690 3310 2930 3350 4110 3850 312028 5740 6960 5030 5900 4270 4330 4740 5130 5800 4570
Fig 6-3 and Fig 6-4 show cylinders of some of the Group 2 concrete mixtures
Efflorescence on the surface of concrete was noted
Fig 6-3 Efflorescence on a Cylinder of Mixture CFNB-2 Left from Seven-day Compression Test
Fig 6-4 Efflorescence on a Cylinder of Mixture CFNB-3 Left from One-day Compression Test
63 Group 3 Preliminary Mixtures
Group 3 preliminary concrete mixtures were made with ldquoNewrdquo gypsum wallboard and using
half as much sodium sulfate as the original planned see Table 3-2 Mixture CFNS-6 was made
with only one-quarter of the sodium sulfate planned see Table 3-2
Table 6-11 to Table 6-13 show mixture proportions of Group 3 concrete mixtures Mixture
CFNS-1-1 and CFNS-1-2 were twin mixtures made using identical proportions They used the
same proportions of cement fly ash and gypsum wallboard as Mixture CFOS-2 of Group 1
except the source of gypsum wallboard and the amount of sodium sulfate
29
Mixtures CFNS-2-1 and CFNS-2-2 were also twin mixtures made using the same proportions
of cement fly ash and gypsum wallboard as Mixture CFOS-3 of Group 1 except the source of
gypsum wallboard and the amount of sodium sulfate
Efflorescence was observed on leftover concrete from Mixtures CFNS-1-1 CFNS-1-2
CFNS-2-1 CFNS-2-2 and CFNS-6
Table 6-11 Proportions of Powder Materials Used for Group 3 Preliminary Concrete Mixtures Mixture Designation C-3 CFNS-
1-1 CFNS-
1-2 CFNS-
2-1 CFNS-
2-2 CFNS-
6 Laboratory mixture designation Ref-4 New-
10 New-
11 New-
12 New-
13 New-
17 Cement (mass of Cm) 100 40 40 20 20 20 Fly Ash (mass of Cm) 0 50 50 60 60 60
New Gypsum Wallboard (mass of Cm) 0 10 10 20 20 20 Sodium Sulfate (mass of Cm) 0 1 1 2 2 1
Cm Cementitious materials (Cement + Fly Ash + Gypsum Wallboard)
Table 6-12 Mixture Proportions and Fresh Properties of Group 3 Preliminary Concrete Mixtures (SI [Metric] Units)
Mixture Designation C-3 CFNS-1-1
CFNS-1-2
CFNS-2-1
CFNS-2-2
CFNS-6
Cement (kgm3) 360 146 147 72 73 73 Class C Fly Ash Weston (kgm3) 0 182 184 217 220 218
Powdered Gypsum Wallboard New (kgm3) 0 36 37 72 73 73 Water (kgm3) 163 164 160 165 145 155
Sand SSD (kgm3) 853 854 861 848 862 855 Crushed Stone 19-mm max SSD (kgm3) 1030 1040 1050 1030 1050 1030
Sodium Sulfate Na2SO4 (kgm3) 0 36 37 72 73 36 Water-Cementitious Ratio WCm 045 045 044 046 039 043
Slump (mm) 50 50 55 40 45 25 Air Content () 18 hellip hellip hellip hellip hellip
Air Temperature (degC) 23 23 24 23 23 24 Concrete Temperature (degC) 22 hellip hellip hellip hellip hellip
Density (kgm3) 2400 2420 2440 2410 2430 2410 SSD Saturated surface-dry
30
Table 6-13 Mixture Proportions and Fresh Properties of Group 3 Preliminary Concrete Mixtures (Inch-Pound Units)
Mixture Designation C-3 CFNS-1-1
CFNS-1-2
CFNS-2-1
CFNS-2-2
CFNS-6
Cement (lbyd3) 606 245 247 122 124 122 Class C Fly Ash Weston (lbyd3) 0 307 309 365 371 367
Powdered Gypsum Wallboard New (lbyd3) 0 61 62 122 124 122 Water (lbyd3) 274 276 269 278 244 261
Sand SSD (lbyd3) 1440 1440 1450 1430 1450 1440 Crushed Stone 34 in max SSD (lbyd3) 1730 1750 1760 1730 1760 1740
Sodium Sulfate Na2SO4 (lbyd3) 0 6 6 12 12 6 Water-Cementitious Ratio WCm 045 045 044 046 039 043
Slump (in) 2 2 2 14 1 12 1 34 1 Air Content () 18 hellip hellip hellip hellip hellip
Air Temperature (degF) 74 74 76 74 73 76 Concrete Temperature (degF) 72 hellip hellip hellip hellip hellip
Density (lbft3) 150 151 152 150 151 150 SSD Saturated surface-dry Table 6-14 and Table 6-15 show the test results for compressive strength of Group 3 concrete
mixtures The strength of Mixtures CFNS-1-1 and CFNS-1-2 were not significantly lower than
that of Mixture CFOS-2 Also the strength of Mixtures CFNS-2-1 and CFNS-2-2 were not
significantly lower than that of Mixture CFOS-3 The strength of Mixtures CFNS-1-1 CFNS-1-
2 CFNS-2-1 and CFNS-2-2 were quite acceptable
Upon careful inspection it was noted that cylinders of Mixture CFNS-6 cracked by
themselves before reaching the age of seven days Cylinders of Mixtures CFNS-2-1 and CFNS-
2-2 must have cracked as well
31
Table 6-14 Compressive Strength of Group 3 Preliminary Concrete Mixtures (MPa) Age (days) C-3 CFNS-
1-1 CFNS-
1-2 CFNS-
2-1 CFNS-
2-2 CFNS-
6 1 117 23Dagger 22 19 19 12Dagger 7 303 247dagger 258dagger 96dagger 85dagger hellip 28 359 hellip hellip hellip hellip hellip
Dagger Average from testing two cylinders dagger Result from testing one cylinder The rest are averages from three tests Cylinders had cracked on their own
Table 6-15 Compressive Strength of Group 3 Preliminary Concrete Mixtures (psi) Age (days) C-3 CFNS-
1-1 CFNS-
1-2 CFNS-
2-1 CFNS-
2-2 CFNS-
6 1 1690 330Dagger 320 270 270 180Dagger 7 4390 3580dagger 3740dagger 1390dagger 1240dagger hellip 28 5210 hellip hellip hellip hellip hellip
Dagger Average from testing two cylinders dagger Result from testing one cylinder The rest are averages from three tests Cylinders had cracked on their own Based on the results of preliminary mixing and testing of concrete it was decided to make
final mixture CFNS-4 using the mixture proportions of Mixtures CFNS-1-1 and CFNS-1-2
Final mixture CFNS-5 was made using the mixture proportions of Mixtures CFNS-2-1 and
CFNS-2-2
32
CHAPTER 7 FINAL MIXTURES
In total eight final concrete mixtures were made to evaluate the slump retention time of
initial setting compressive strength and length change of concrete In addition mortar bars
were made for evaluation of sulfate resistance
71 Mixture Proportions
Table 7-1 presents the proportions of powder materials used for final concrete mixtures The
mixtures were made in two groups Group 1 Mixtures C-2 CN-2 CFN-2 and CFN-3 were
made using up to 20 fly ash and 20 powdered wallboard with water-reducing admixture and
without sodium sulfate Group 2 Mixtures Ref-5 CFNS-3 CFNS-4 and CFNS-5 were made
using up to 60 fly ash 20 powdered wallboard 2 sodium sulfate and without water-
reducing admixture Sodium sulfate was added as powder to a concrete mixture
Table 7-1 Proportions of Powder Materials Used for Final Concrete Mixtures Mixture Designation C-2 CN-2 CFN-
2 CFN-
3 C-4 CFN
S-3 CFNS-4
CFNS-5
Laboratory mixture designation Ref-3 New-7
New-8
New-9
Ref-5 New-14
New-15
New-16
Cement (mass of Cm) 100 90 70 60 100 60 40 20 Fly Ash (mass of Cm) 0 0 20 20 0 33 50 60
New Gypsum Wallboard (mass of Cm) 0 10 10 20 0 7 10 20 Sodium Sulfate (mass of Cm) 0 0 0 0 0 1 1 2
Cm Cementitious materials (Cement + Fly Ash + Gypsum Wallboard) The mixture proportions and fresh properties of the main concrete mixtures are presented in
Table 7-2 (in SI units) and Table 7-3 (in inch-pound units) To evaluate retention of slump
slump was measured twice (1) immediately after mixing was done and (2) 30 minutes later In
general the concrete mixtures retained their workability
33
Table 7-2 Mixture Proportions and Fresh Concrete Properties of Final Mixtures (SI [Metric] Units) Mixture Designation C-2 CN-2 CFN-
2 CFN-
3 C-4 CFN
S-3 CFNS-4
CFNS-5
Cement (kgm3) 362 316 249 212 365 217 144 71 Class C Fly Ash Weston (kgm3) 0 0 71 71 0 119 180 213
Powdered Gypsum Wallboard New (kgm3) 0 35 35 71 0 25 36 71 Water (kgm3) 164 164 170 153 163 154 153 157
Sand SSD (kgm3) 856 830 840 835 861 854 852 839 Crushed Stone 19-mm max SSD (kgm3) 1030 999 1010 1010 1030 1030 1020 1010
Sodium Sulfate Na2SO4 (kgm3) 0 0 0 0 0 36 36 71 Water-Reducing Admixture (Lm3) 0 103 104 104 0 0 0 0 Water-Cementitious Ratio WCm 045 047 048 043 045 043 042 044
Slump (mm) 55 50 40 30 30 40 45 25 Slump 30 minutes later (mm) 30 40 25 20 40 30 15 15
Air Content () 18 37 26 32 14 22 15 17 Air Temperature (degC) 23 24 23 24 23 23 23 24
Concrete Temperature (degC) 23 23 23 25 24 24 25 25 Density (kgm3) 2410 2340 2380 2350 2420 2400 2390 2370
SSD Saturated surface-dry
Table 7-3 Mixture Proportions and Fresh Concrete Properties of Final Mixtures (Inch-Pound Units)
Mixture Designation C-2 CN-2 CFN-2
CFN-3
C-4 CFNS-3
CFNS-4
CFNS-5
Cement (lbyd3) 610 532 419 357 614 366 243 120 Class C Fly Ash Weston (lbyd3) 0 0 120 119 0 201 303 359
Powdered Gypsum Wallboard New (lbyd3) 0 59 59 119 0 43 61 120 Water (lbyd3) 276 276 287 257 274 259 257 264
Sand SSD (lbyd3) 1440 1400 1410 1410 1450 1440 1430 1410Crushed Stone 34 in max SSD (lbyd3) 1730 1680 1700 1690 1740 1730 1720 1700
Sodium Sulfate Na2SO4 (lbyd3) 0 0 0 0 0 6 6 12 Water-Reducing Admixture (fl ozyd3) 0 265 269 268 0 0 0 0
Water-Cementitious Ratio WCm 045 047 048 043 045 043 042 044Slump (in) 2 14 2 1 12 1 14 1 14 1 12 1 34 1
Slump 30 minutes later (in) 1 14 1 12 1 34 1 12 1 14 12 12 Air Content () 18 37 26 32 14 22 15 17
Air Temperature (degF) 73 75 74 75 74 74 74 75 Concrete Temperature (degF) 73 74 74 77 75 76 77 77
Density (lbft3) 150 146 148 146 151 150 149 148 SSD Saturated surface-dry
72 Time of Initial Setting
Table 7-4 presents test results of the time of initial setting final concrete mixtures It took
about twice as long for the mixtures containing fly ash and powdered gypsum wallboard to reach
34
initial setting as their reference concrete mixtures It is well known that concrete mixtures
containing large amount of fly ash may show delayed setting
Table 7-4 Time of Initial Setting of Final Concrete Mixtures Mixture Designation C-2 CN-2 CFN-
2 CFN-
3 C-4 CFN
S-3 CFNS-4
CFNS-5
Time of Initial Setting (hours) 48 72 114 120 47 98 118 105
73 Compressive Strength
Compressive strength test results for final concrete mixtures are shown in Table 7-5 (in
MPa) Table 7-6 (in psi) Fig 7-1 and Fig 7-2
Table 7-5 Compressive Strength of Final Concrete Mixtures (MPa) Age (days) C-2 CN-2 CFN-
2 CFN-
3 C-4 CFN
S-3 CFNS-4
CFNS-5
1 168 111 42 39 159 58 38 24 3 301 197 174 132 302 237 178 79 7 354 232 265 154 347 301 297 12528 448 285 414 211 408 415 420 hellip 91 508 419 501 289 515 443 497 hellip
Cylinders had already cracked on their own before testing started
Table 7-6 Compressive Strength of Final Concrete Mixtures (psi) Age (days) C-2 CN-2 CFN-
2 CFN-
3 C-4 CFN
S-3 CFNS-4
CFNS-5
1 2430 1610 610 560 2310 840 550 350 3 4360 2860 2520 1910 4380 3440 2580 11407 5140 3370 3850 2240 5040 4370 4310 1810
28 6500 4140 6000 3060 5920 6020 6090 hellip 91 7370 6070 7270 4190 7470 6430 7210 hellip
Cylinders had already cracked on their own before testing started
35
0
10
20
30
40
50
60
1 10 100
Age (days)
Com
pres
sive
Str
engt
h (M
Pa)
0
1000
2000
3000
4000
5000
6000
7000
8000
(psi
)
Ref-3New-7New-8New-9
Fig 7-1 Compressive Strength of Final Concrete Mixtures Group 1
The mixtures CN-2 CFN-2 and CFN-3 showed lower compressive strength than C-2
Mixture CFN-2 showed structural-grade strength of 265 MPa (3850 psi) at seven days and a
relatively high compressive strength of 41 MPa (6000 psi) at 28 days Mixture CN-2 showed
structural-grade strength of 285 MPa (4140 psi) at 28 days
0
10
20
30
40
50
60
1 10 100
Age (days)
Com
pres
sive
Str
engt
h (M
Pa)
0
1000
2000
3000
4000
5000
6000
7000
8000
(psi
)
Ref-5New-14New-15New-16
Fig 7-2 Compressive Strength of Final Concrete Mixtures Group 2
36
As early as at seven days the mixtures CFNS-3 and CFNS-4 showed structural-grade
strength of 301 MPa (4370 psi) and 297 MPa (4310 psi) This is noteworthy considering the
fact that Mixtures CFNS-3 and CFNS-4 were made by replacing 40 and 60 of cement with
blends of fly ash and powdered gypsum wallboard At the age of 28 days the mixtures CFNS-3
and CFNS-4 reached compressive strength of 415 MPa (6020 psi) and 420 MPa (6090 psi) and
became as strong as Mixture Ref-5
The cylinders made from Mixture CFNS-5 cracked on their own before reaching the age of
seven days (Fig 7-3) This was attributed to an excessive expansive reaction resulting from use
of the particular proportions of cement fly ash powdered gypsum wallboard and sodium sulfate
in Mixture CFNS-5 Mixture CFNS-6 was made using half as much sodium sulfate (1 of
cementitious materials) as CFNS-5 nonetheless cylinders made from Mixture CFNS-6 cracked
before reaching the age of seven days
Fig 7-3 Cracked Cylinders of Concrete Mixtures CFNS-5 and CFNS-6
37
74 Length Change
Test results for length change of final concrete mixtures are shown in Table 7-7 Fig 7-5
and Fig 7-6
Table 7-7 Length Change of Final Concrete Mixtures () Age (days) C-2 CN-2 CFN-2 CFN-3 C-4 CFNS-
3 CFNS-
4 CFNS-
5 1 0 0 0 0 0 0 0 0 3 -0001 0010 0015 0018 0000 0006 0041 0359 7 -0003 0013 0031 0036 0004 0005 0039 1708
28 0004 0026 0033 0116 0002 0010 0043 hellip 32 -0010 0009 0012 0098 -0007 -0007 0030 hellip 35 -0015 0003 0009 0089 -0013 -0013 0025 hellip 42 -0022 -0003 -0002 0077 -0018 -0020 0020 hellip 56 -0028 -0020 -0004 0057 -0024 -0028 0014 hellip 84 -0033 -0027 -0010 0037 -0031 -0035 0011 hellip 140 -0036 -0035 -0017 0027 -0035 -0035 0006 hellip
Specimens had cracked on their own All of the concrete mixtures made with powdered gypsum wallboard showed higher
expansion than their reference concrete mixtures during immersion in saturated limewater
Mixture CFN-3 containing 20 fly ash and 20 powdered gypsum wallboard showed a large
expansion (0120) Specimens made from Mixture CFNS-5 containing 60 fly ash and 20
powdered gypsum wallboard showed excessive expansion and they cracked before reaching the
age of seven days (Fig 7-4)
38
Fig 7-4 Length-Change Specimen of Concrete
Mixture CFNS-5 Showing a Crack
-004
-002
000
002
004
006
008
010
012
0 30 60 90 120 150
Age (days)
Leng
th C
hang
e (
)
Ref-3New-7New-8New-9
Fig 7-5 Length Change of Final Concrete Mixtures Group 1
During drying Mixture CN-2 and CFN-3 made by using high proportions of powdered
gypsum wallboard to fly ash shrunk by greater extents than Mixture C-2 At the age of 140
days the net shrinkage of Mixture CN-2 was 0035 which was approximately the same as that
of C-2 0036 Mixture CFN-3 showed a net expansion of 0027 at 140 day Mixture CFN-2
shrunk by approximately the same amount as Mixture C-2 resulting in a net shrinkage of
0017 at 140 days
39
-004
-002
000
002
004
006
008
010
012
0 30 60 90 120 150
Age (days)
Leng
th C
hang
e (
)
Ref-5New-14New-15New-16
Fig 7-6 Length Change of Final Concrete Mixtures Group 2
The length change of Mixture CFNS-3 (made with 60 cement 33 fly ash and 7
powdered gypsum wallboard) was approximately the same as that of Mixture Ref-5 Mixture
CFNS-4 (made with 40 cement 50 fly ash and 10 powdered gypsum wallboard) showed a
relatively large expansion (0043) during immersion in saturated limewater and shrunk during
drying as much as it had expanded resulting in very small net expansion of 0006 at the age of
140 days This concrete mixture could be used to minimize drying shrinkage cracking of
concrete Mixture CFNS-4 could be used to minimize drying shrinkage cracking of concrete
75 Sulfate Resistance
Mortar cubes and bars were made using the same proportions of cement fly ash and gypsum
wallboard as the final concrete mixtures Ref-5 CFNS-3 and CFNS-4 No mortar mixture was
made using the powder-materials proportions of concrete mixture CFNS-5 because it was
anticipated that such mortar would crack
Table 7-8 shows the proportions of the mortar mixtures produced
40
Table 7-8 Mixture Proportions and Flow of Mortar Mixtures Mixture Designation C-c C-b CFNS-1c CFNS-1b CFNS-2c CFNS-2b
Laboratory mixture designation C-2 cube C-2 bar N-3 cube N-3 bar N-4 cube N-4 barCement (mass of Cm) 100 100 60 60 40 40 Fly Ash (mass of Cm) 0 0 33 33 50 50
New Gypsum Wallboard (mass of Cm) 0 0 7 7 10 10 Sodium Sulfate (mass of Cm) 0 0 1 1 1 1
Cement (g) 500 740 300 444 200 296 Class C Fly Ash Weston (g) 0 0 165 2442 250 370
Powdered Gypsum Wallboard New (g) 0 0 35 518 50 74 Sodium Sulfate Na2SO4 (g) 0 0 5 74 5 76
Water (g) 242 359 216 3204 200 2967 Water-Cementitious Ratio WCm 0484 0485 0432 0433 0400 0401
Graded Standard Sand (g) 1375 2035 1375 2035 1375 2035 Flow (mm) 190 hellip 185 hellip 191 hellip
Cm Cementitious materials (Cement + Fly Ash + Gypsum Wallboard) Table 7-9 and Table 7-10 show test results for the compressive strength of mortar mixtures
It took approximately 15 days for Mixture C-c to attain a compressive strength of 20 MPa
(2900 psi) For Mixture N-3 it took 47 days and for Mixture N-4 7 days
Table 7-9 Compressive Strength of Mortar (MPa) Age (days) C-c CFNS-1c CFNS-2c
1 148 45 11 4 314 174 111 5 hellip 212 hellip
5125 hellip hellip 167 7 hellip hellip 197 24 hellip hellip 250 28 396 316
Note These results are averages obtained from testing two cubes for each mixture at each test age
Table 7-10 Compressive Strength of Mortar (psi) Age (days) C-c CFNS-1c CFNS-2c
1 2140 650 160 4 4550 2530 1610 5 hellip 3070 hellip
5125 hellip hellip 2420 7 hellip hellip 2850 24 hellip hellip 3630 28 5750 4580 hellip
Note These results are averages obtained from testing two cubes at each test age for each mixture
41
0
5
10
15
20
25
30
35
40
45
0 5 10 15 20 25 30Age (days)
Com
pres
sive
Str
engt
h (p
si)
0
1000
2000
3000
4000
5000
6000
(MP
a)
C-2N-3N-4
Fig 7-7 Compressive Strength of Mortar Cubes
Once the mixture attained the specified compressive strength of 20 MPa (2900 psi) the
mortar bars were immersed in a 5 sodium sulfate solution and length change of the bars were
measured after specified periods to assess sulfate resistance of mortar mixtures Table 7-11 and
Fig 7-8 show test results for length change of mortar bars A larger expansion implies a lower
resistance of mortar mixture to sulfate attack and a smaller expansion implies a higher resistance
to sulfate attack
Table 7-11 Length Change of Mortar Bars () Age after immersion in 5 sodium sulfate
solution (days) C-b CFNS-1b CFNS-2b
0 0 0 0 7 0007 0016 0006 14 0013 0024 0009 21 0016 0028 0009 28 0020 0033 0009 42 0027 0044 0011 56 0034 0063 0010
Number of specimens tested C-b five N-1-b six and N-2-b three
42
000
001
002
003
004
005
006
007
0 7 14 21 28 35 42 49 56 63
Days after immersion in Na2SO4 solution
Len
gth
Cha
nge
()
C-bCFNS-1bCFNS-2b
Fig 7-8 Length Change of Mortar Bars in 5 Sodium Sulfate Solution
After 56 days of immersion in sodium sulfate solution Mixture C-b (Control) showed an
expansion of approximately 0034 Mixture N-3 (made with 33 fly ash and 7 powdered
gypsum wallboard and 1 sodium sulfate) shows an expansion of 0063 which was
approximately 19 times that of Mixture C-b Mixture N-4 (made with 50 fly ash 10
powdered gypsum wallboard and 1 sodium sulfate) showed an expansion of 0010 which is
significantly lower than that of Mixture C-b (Control) This means that Mixture N-4 possesses
significantly higher resistance to sulfate attack than Mixture C-b Importantly the expansion of
mortar bars made from Mixture N-4 stabilized after 14 days of immersion in sodium sulfate
solution
76 Summary
Table 7-12 shows a summary of proportions of powder materials and properties of final
concrete mixtures Table 7-13 shows a summary of proportions and length change in sulfate
solution of mortar mixtures
43
Table 7-12 Proportions of Powder Materials and Properties of Final Concrete Mixtures Mixture Designation C-2 CN-2 CFN-2 CFN-3 C-4 CFNS-
3 CFNS-
4 CFNS-
5 Cement (mass of Cm) 100 90 70 60 100 60 40 20 Fly Ash (mass of Cm) 0 0 20 20 0 33 50 60
New Gypsum Wallboard (mass of Cm) 0 10 10 20 0 7 10 20 Sodium Sulfate (mass of Cm) 0 0 0 0 0 1 1 2
Time of Initial Setting (hours) 48 72 114 120 47 98 118 105 Compressive Strength (MPa)
1-day 168 111 42 39 159 58 38 24 3-day 301 197 174 132 302 237 178 79 7-day 354 232 265 154 347 301 297 125
28-day 448 285 414 211 408 415 420 hellip 91-day 508 419 501 289 515 443 497 hellip
Compressive Strength (psi) 1-day 2430 1610 610 560 2310 840 550 350 3-day 4360 2860 2520 1910 4380 3440 2580 1140 7-day 5140 3370 3850 2240 5040 4370 4310 1810
28-day 6500 4140 6000 3060 5920 6020 6090 hellip 91-day 7370 6070 7270 4190 7470 6430 7210 hellip
Length Change () 1-day 0 0 0 0 0 0 0 0 7-day -0003 0013 0031 0036 0004 0005 0039 1708
28-day 0004 0026 0033 0116 0002 0010 0043 hellip 140-day -0036 -0035 -0017 0027 -0035 -0035 0006 hellip
Cm Cementitious materials (Cement + Fly Ash + Gypsum Wallboard) Specimens had cracked on their own
Table 7-13 Proportions of Powder Materials and Length Change in Sulfate Solution of Mortar Mixtures
Mixture Designation C-b CFNS-1b
CFNS-2b
Laboratory mixture designation Cement (mass of Cm) 100 60 40 Fly Ash (mass of Cm) 0 33 50
New Gypsum Wallboard (mass of Cm) 0 7 10 Sodium Sulfate (mass of Cm) 0 1 1
Length Change in 5 Sodium Sulfate Solution () 0-day 0 0 0 7-day 0007 0016 0006
14-day 0013 0024 0009 21-day 0016 0028 0009 28-day 0020 0033 0009 42-day 0027 0044 0011 56-day 0034 0063 0010
44
Table 7-14 shows a summary of properties of selected promising main concrete mixtures
Mixtures CFN-2 CFNS-3 and CFNS-4 were comparable to their reference concrete mixtures in
compressive strength at the ages of 7 days and later Based on the sulfate resistance of Mortar
N-4 it is expected that concrete Mixture CFNS-4 will also possess high resistance to sulfate
attack
Table 7-14 Summary of Proportions and Properties of Selected Final Concrete Mixtures and Mortar Mixtures
Mixture Designation C-4 CFN-2 CFNS-3
CFNS-4
Cement (mass of Cm) 100 70 60 40 Fly Ash (mass of Cm) 0 20 33 50
New Gypsum Wallboard (mass of Cm) 0 10 7 10 Sodium Sulfate (mass of Cm) 0 0 1 1
Time of Initial Setting (hours) 47 114 98 118 Compressive Strength (MPa)
1-day 159 42 58 38 3-day 302 174 237 178 7-day 347 265 301 297
28-day 408 414 415 420 91-day 515 501 443 497
Compressive Strength (psi) 1-day 2310 610 840 550 3-day 4380 2520 3440 2580 7-day 5040 3850 4370 4310
28-day 5920 6000 6020 6090 91-day 7470 7270 6430 7210
Length Change () 1-day 0 0 0 0
28-day 0002 0033 0010 0043 140-day -0035 -0017 -0035 0006
28-day Length Change of Mortar in 5 Sodium Sulfate Solution ()
0020 hellip 0033 0009
Cm Cementitious materials (Cement + Fly Ash + Gypsum Wallboard)
45
CHAPTER 8 ECONOMIC IMPACT ANALYSIS OF FULL-
SCALE IMPLEMENTATION
It is estimated that over 80000 tons of gypsum wallboard is disposed of each year from new
construction and demolition in Wisconsin If a tipping fee plus handling and transportation cost
of $30 per ton is assumed the disposal of gypsum wallboard costs Wisconsin citizens and
industry approximately $24 million dollars each year
Based on figures from the National Ready-Mixed Concrete Association Wisconsin produced
approximately 11 million cubic yards (84 million m3) of concrete in 2004 Based on a cement
content of 400 pounds per cubic yard (240 kgm3) of concrete 22 million tons of cement is used
in concrete each year in Wisconsin
This project showed that powdered gypsum wallboard could constitute approximately 10
of total cementitious materials used in a concrete mixture If this new cementitious material was
used in 20 of the concrete produced in Wisconsin approximately 44000 tons of gypsum
wallboard can be used In other words approximately half of the gypsum wallboard waste
generated in Wisconsin could be used in this application alone This would save Wisconsin
industry $13 million dollars each year in avoided disposal costs leading to reduce the cost for
concrete construction in Wisconsin Citizens would benefit also by reducing landfilling cost for
municipalities and increasing recycling rates of useful materials If 40 of the concrete
generated in Wisconsin used this new concrete mixture technology all of the waste gypsum
wallboard generated in Wisconsin could be used in this one application Therefore all 80000
tons of waste gypsum wallboard could be diverted from Wisconsin landfills It would save
Wisconsin citizens and industry over $24 million dollars each year in avoided disposal cost
46
This economic impact does not include incalculable dollar-benefits due to avoided possible
future environmental impact of sending such large quantities of gypsum wallboard into landfills
This project also showed that up to 60 of cement in concrete mixtures could be replaced
with a blend of Class C fly ash and gypsum wallboard Cement is a valuable commodity If it is
assumed that cement sells at $100 per ton and Class C fly ash sells at $50 per ton use of a
cementitious blend consisting of 40 cement 50 Class C fly ash and 10 powdered gypsum
in producing 40 of concrete in Wisconsin would result in savings on cement of about $50
million and expenditure on fly ash of about $20 million with a net savings of about $30 million
each year
Saving cement through this new technology would also reduce emissions of carbon dioxide
and other GHGs because production of one ton of cement releases about one ton of GHGs If
this new technology to use a blend of Class C fly ash and gypsum wallboard as a replacement of
cement were implemented in producing up to 40 of concrete in Wisconsin it would reduce the
GHG emissions by up to 12 million tons each year CO2 credits currently sell for about $20 per
ton Therefore CO2 credits would be worth $10 million each year
With a potential total value of $24 million in avoided disposal costs $30 million in savings
resulting from cement replacement plus $10 million in CO2 credits total economic benefit to
Wisconsin that could be generated by this project may be valued at about $42 million each year
47
CHAPTER 9 CONCLUSIONS
This project showed that from 30 to 60 of cement in concrete mixtures could be
successfully replaced with blends of Class C fly ash and powdered gypsum wallboard Several
concrete mixtures made by such replacements showed compressive strength nearly as high as
that of Reference concrete mixtures (without replacement of cement) at seven days The 28-day
compressive strength of these concrete mixtures containing fly ash and gypsum wallboard were
equivalent to that of Reference concrete mixtures Use of sodium sulfate as an activator was
essential in improving the 1-day and 3-day strength of concrete containing Class C fly ash and
gypsum wallboard
A concrete mixture made with a cementitious blend of 40 cement 50 Class C fly ash
and 10 powdered gypsum wallboard showed a relatively large expansion (0043) during
immersion in saturated limewater and shrunk during drying as much as it had expanded
resulting in very small net expansion at the age of 140 days This concrete mixture could be
used to minimize drying shrinkage cracking and subsequent increase in durability of concrete
A mortar mixture made with a cementitious blend of 40 cement 50 Class C fly ash and
10 powdered gypsum wallboard showed much higher resistance to sulfate attack compared
with Reference mortar (without replacement of cement)
Total economic benefit to Wisconsin that could be generated by this project may be valued at
up to about $42 million each year
48
CHAPTER 10 REFERENCES
ASTM C 33-03 ldquoStandard Specification for Concrete Aggregatesrdquo ASTM International West Conshohocken PA 11 pp
ASTM C 150-05 ldquoStandard Specification for Portland Cementrdquo ASTM International West Conshohocken PA 8 pp
ASTM C 192 C 192M-05 ldquoStandard Practice for Making and Curing Concrete Test Specimens in the Laboratoryrdquo 8 pp
ASTM C 494C 494M-05a ldquoStandard Specification for Chemical Admixtures for Concreterdquo ASTM International West Conshohocken PA 10 pp
ASTM C 618-03 ldquoStandard Specification for Coal Fly Ash and Raw or Calcined Natural Pozzolan for Use in Concreterdquo ASTM International West Conshohocken PA 3 pp
ASTM C 1012-04 ldquoStandard Test Method for Length Change of Hydraulic-Cement Mortars Exposed to a Sulfate Solutionrdquo ASTM International West Conshohocken PA 6 pp
Aimin X and Sarkar S L ldquoMicrostructural Study of Gypsum Activated Fly Ash Hydration in Cement Pasterdquo Cement and Concrete Research Vol 21 1991 pp 1137-1147
Drywallrecyclingorg lthttpwwwdrywallrecyclingorggt (February 2006)
EPA Presentation by the US Environmental Protection Agency at the Massachusetts DEP Gypsum Workgroup March 18 2004
Freeman R B and Carrasquillo R L ldquoProduction of Sulfate-Resistant Concrete Containing High-Calcium Fly Ash and Sodium Sulfate Admixturerdquo Proceedings of Fifth CANMETACI International Conference on Fly Ash Silica Fume Slag and Natural Pozzolans in Concrete ACI SP-153 Vol 1 1995 pp 153-176
ICF Northwest ldquoCalcium Spray Dryer Waste Management Design Guidelinesrdquo EPRI (Electric Power Research Institute) Report No CS-5312 September 1987 p 3-3
Krocak R F Meininger R and Yost P A Chapter 21 ldquoBeneficial Reuse of Aggregate Mineral Fines and Scrap New Construction Wallboardrdquo Land Application of Agricultural Industrial and Municipal By-Products (6) James F Powers and Warren P Dick ed SSSA Number 6 in the Soil Science Society of America Book Series ISBN 0-89118-834-7 Item Number 60901 2000 653 pages
Kumar P K and Monteiro P J M ldquoConcrete Microstructure Properties and Materialsrdquo 2nd Ed McGraw-Hill 1993
Lafarge Group ltwwwlafargecomgt (February 2006)
49
Ma W Liu C Brown P W and Komarneni S ldquoPore Structures of Fly Ashes Activated By Ca(OH)2 and CaSO42H2Ordquo Cement and Concrete Research Vol 25 No 2 1995 pp 417-425
McCall R ldquoWasteCap Wisconsin Drywall-To-Fertilizer Projectrdquo Final Report for the US Environmental Protection Agency August 1993
Merritt F S and Ricketts J T editors Building Design and Construction Handbook McGraw Hill 6th Ed 2001 pp 435-438
Mindness S Young J F and Darwin D ldquoConcreterdquo 2nd Ed Prentice Hall 2002
Naik T R Kraus R N Chun Y-m and Nageotte S O ldquoCoal-Combustion Bottom Ash for Reducing the Shrinkage of Concrete Made With Portland Cement and Sulfoaluminate Cementrdquo Jean Pera Symposium on Specialty Cements and Sustainability Issues a part of the proceedings of the Ninth CANMETACI International Conference on Recent Advances in Concrete Technology Warsaw Poland May 2007 pp 141-155
Neville A ldquoProperties of Concreterdquo 4th Ed Longman 1995
Pera J and Ambroise J ldquoNew Applications of Calcium Sulfoaluminate Cementrdquo Cement and Concrete Research Vol 34 No 4 April 2004 pp 671-676
Prusinski J R and Carrasquillo R L ldquoUsing Medium- to High-Volume Fly Ash Blended Cements to Improve the Sulfate Resistance of High-Lime Fly Ash Concreterdquo Proceedings of Fifth CANMETACI International Conference on Fly Ash Silica Fume Slag and Natural Pozzolans in Concrete ACI SP-153 Vol 1 1995 pp 43-65
Reindl J R ldquoBibliography of Gypsum Drywallrdquo available on the WasteCap Wisconsin website httpwwwwastecapwiorg August 2002 73 pages
WI-DNR ldquoSubstituting Waste Gypsum Wallboard for Agricultural Gypsumrdquo Wisconsin Department of Natural Resources Bureau of Waste Management DNR Publication WA-607-04 rev 2005
Wolkowski R ldquoDemonstration of Land Application of Crushed Gypsum Wallboard Waste for Alfalfardquo Final report to the Wisconsin Department of Natural Resources Waste Reduction and Recycling Grant Program and Dane County Department of Public Works August 12 1998
Wolkowski R P ldquoUsing Recycled Wallboard for Crop Production (A3782)rdquo WasteCap Wisconsin Inc 2003
Wu Z and Naik T R ldquoUse of Clean Coal Ash as Setting Time Regulator in Portland Cementrdquo Proceedings of the Fifth CANMETACI International Conference on Recent Advances in Concrete Technology Supplementary Papers 2001 pp 83-94
50
Wu Z and Naik T R ldquoProperties of Concrete Produced from Multicomponent Blended Cementsrdquo Cement and Concrete Research Vol 32 2002 pp 1937-1942
Wu Z and Naik T R ldquoChemically Activated Blended Cementsrdquo ACI Materials Journal September-October 2003 pp 434-440
- 08 Naik Chun cover
- 08 MIL NaikGypsumWallboard in concrete
-
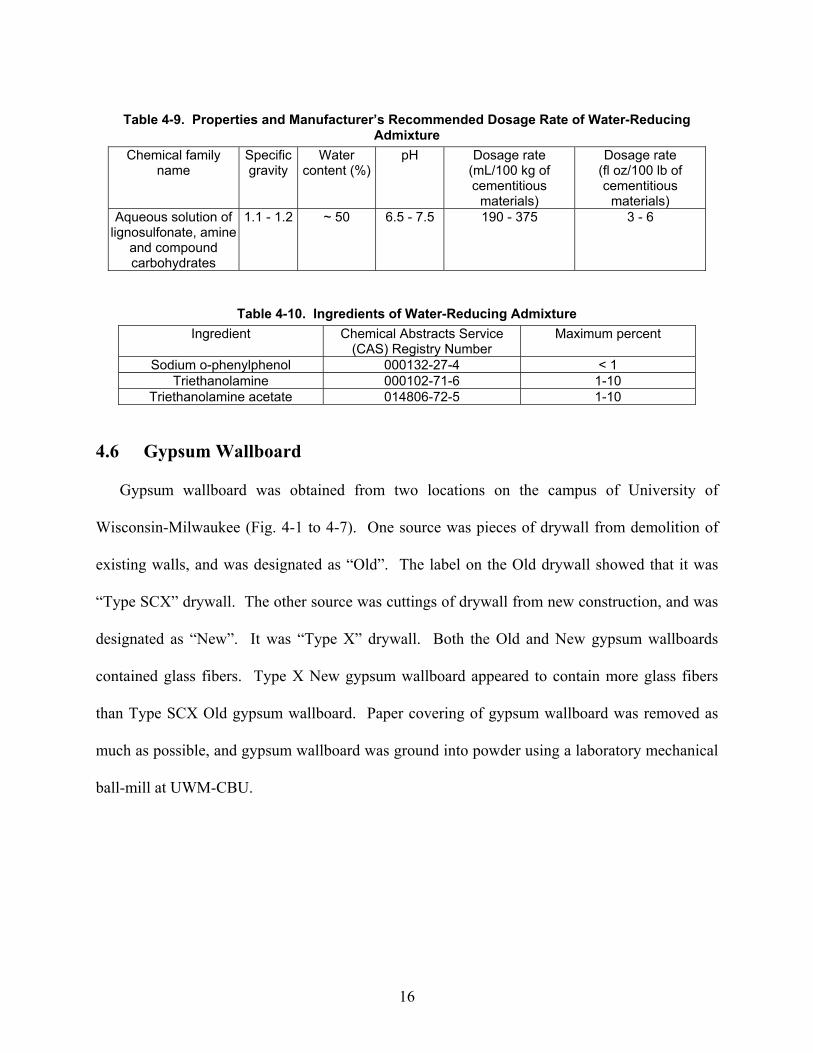
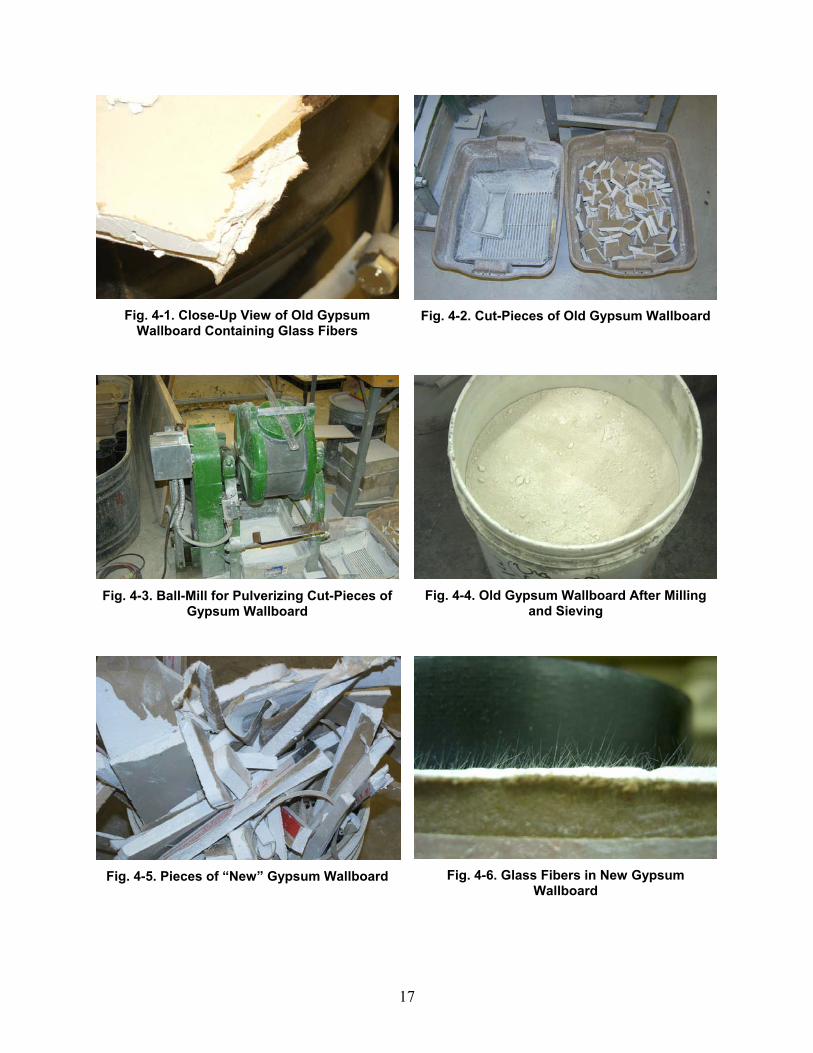
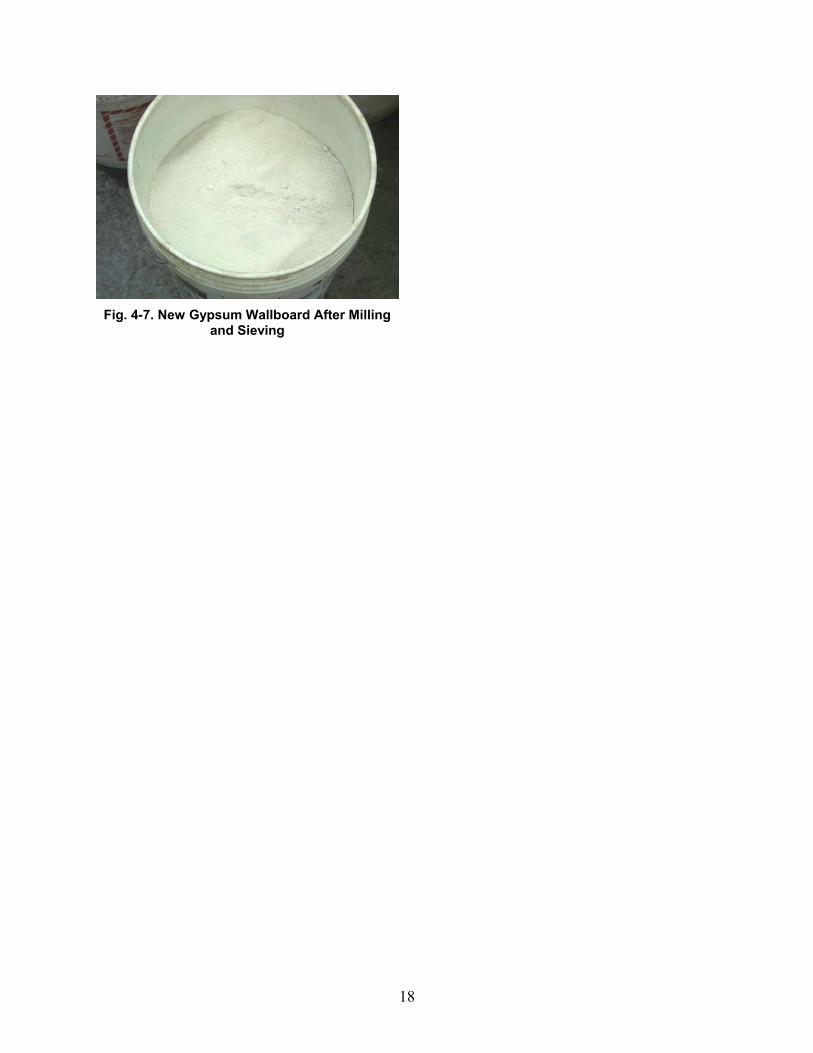
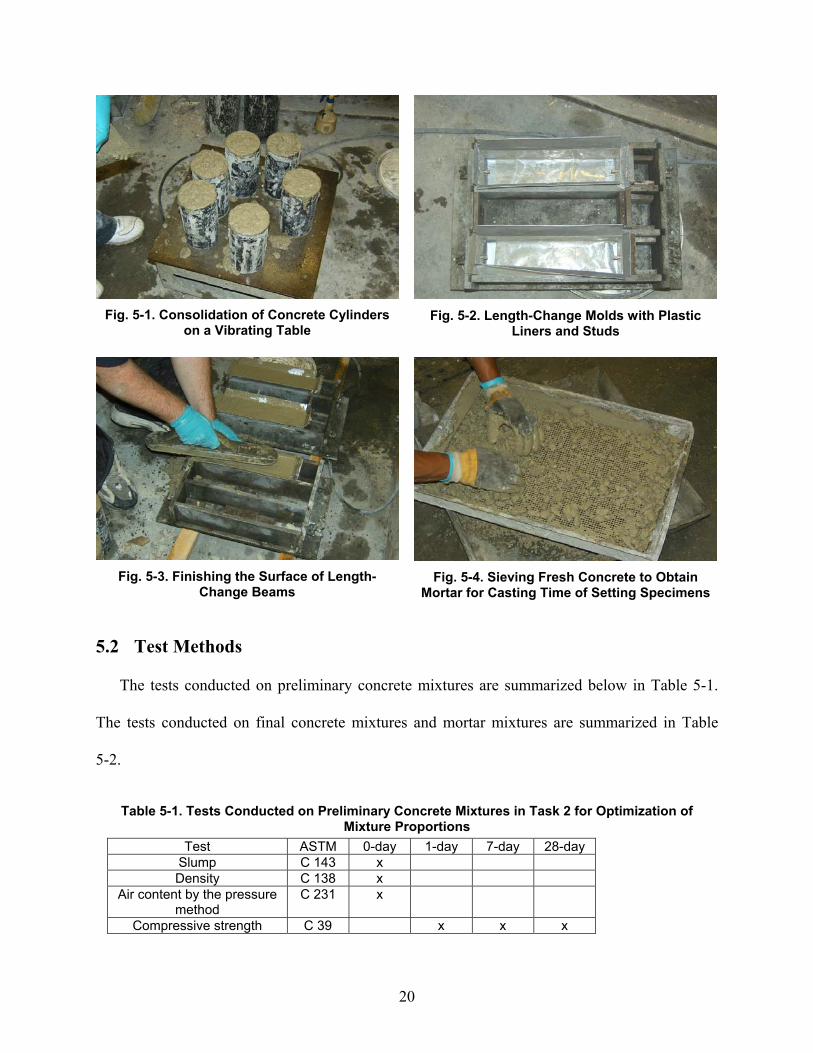
20
Fig 5-1 Consolidation of Concrete Cylinders
on a Vibrating Table
Fig 5-2 Length-Change Molds with Plastic
Liners and Studs
Fig 5-3 Finishing the Surface of Length-
Change Beams
Fig 5-4 Sieving Fresh Concrete to Obtain
Mortar for Casting Time of Setting Specimens
52 Test Methods
The tests conducted on preliminary concrete mixtures are summarized below in Table 5-1
The tests conducted on final concrete mixtures and mortar mixtures are summarized in Table
5-2
Table 5-1 Tests Conducted on Preliminary Concrete Mixtures in Task 2 for Optimization of Mixture Proportions
Test ASTM 0-day 1-day 7-day 28-day Slump C 143 x Density C 138 x
Air content by the pressure method
C 231 x
Compressive strength C 39 x x x
21
Table 5-2 Tests Conducted on Final Concrete Mixtures and Mortar Mixtures in Task 3 Test ASTM 0-day 1-day 3-day 7-day 28-day 91-day
Slump and slump retention C 143 x Density C 138 x
Air content by the pressure method
C 231 x
Compressive strength C 39 x x x x x Time of initial setting C 403 x
Length change C 157 Start Sulfate resistancedagger C 1012
Slump was measured again 30 minutes after completion of concrete mixing dagger Test started when accompanying cubes reached compressive strength of 20 MPa (2900 psi) Compressive strength of concrete was determined by testing three 100-mm diameter times 200-
mm length (4 times 8 in) cylinders at each test age for each mixture Length change specimens
consisted of three 75 times 75 times 285 mm (3 times 3 times 1125 in) beams for each concrete mixture For
each mortar mixture six mortar prisms were cast for measuring length change in 5 sodium
sulfate solution to evaluate their sulfate resistance Some prisms broke in the process of
separating from molds and could not be tested
Photographs of testing are shown below Fig 5-5 to 5-11
Fig 5-5 Testing of Cylinder for Compressive
Strength
Fig 5-6 Testing of Beam for Length Change
22
Fig 5-7 Air Storage of Length-Change Beams
After 28 Days of Moist Curing In Saturated Limewater
Fig 5-8 Saturated Limewater Containers for
Curing Mortar Cubes and Bars
Fig 5-9 Saturated Limewater Containing
Mortar Cubes and Bars
Fig 5-10 Testing of Mortar Cube for
Compressive Strength
Fig 5-11 Measurement of Mortar Bar
23
CHAPTER 6 PRELIMINARY MIXTURES
A series of preliminary concrete mixtures were produced in order to establish mixture
proportions for final concrete mixtures
61 Group 1 Preliminary Mixtures
Group 1 preliminary concrete mixtures were made using ldquoOldrdquo gypsum wallboard The
mixture proportions of Group 1 concrete mixtures are shown in Table 6-1 (powder materials)
Table 6-2 (SI units) and Table 6-3 (inch-pound units) Mixtures CFOS-1 CFOS-2 and CFOS-3
were made with old gypsum wallboard using the proportions developed in Table 3-2 which was
based on previous UWM-CBU research projects Sodium sulfate was used as an activator
Table 6-1 Proportions of Powder Materials Used for Group 1 Preliminary Concrete Mixtures Mixture Designation C-1 CFO
S-1 CFOS-2
CFOS-3
CFO-1
CFO-2
CF-1 CO-1
Laboratory mixture designation Ref-1 Old-2 Old-3 Old-4 Old-5 Old-6 Old-7 Old-8Cement (mass of Cm) 100 60 40 20 60 40 67 93 Fly Ash (mass of Cm) 0 33 50 60 33 50 33 0
Old Gypsum Wallboard (mass of Cm) 0 7 10 20 7 10 0 7 Sodium Sulfate (mass of Cm) 0 2 2 4 0 0 0 0
Cm Cementitious materials (Cement + Fly Ash + Gypsum Wallboard)
Table 6-2 Mixture Proportions and Fresh Concrete Properties of Group 1 Preliminary Mixtures (SI [Metric] Units)
Mixture Designation C-1 CFOS-1
CFOS-2
CFOS-3
CFO-1
CFO-2
CF-1 CO-1
Cement (kgm3) 358 214 143 71 215 143 246 334 Class C Fly Ash Weston (kgm3) 0 118 179 213 119 179 121 0
Powdered Gypsum Wallboard Old (kgm3) 0 25 36 71 25 36 0 25 Water (kgm3) 171 161 162 155 163 159 151 164
Sand SSD (kgm3) 849 848 843 834 850 847 872 847 Crushed Stone 19-mm max SSD (kgm3) 1020 1020 1010 1010 1020 1020 1050 1020
Sodium Sulfate Na2SO4 (kgm3) 0 72 71 142 0 0 0 0 Water-Cementitious Ratio WCm 048 045 045 044 045 044 041 046
Slump (mm) 65 30 40 40 55 65 65 25 Air Content () 13 18 18 21 19 22 14 20
Air Temperature (degC) 23 23 23 24 23 23 23 23 Concrete Temperature (degC) 21 22 22 21 22 22 22 21
Density (kgm3) 2400 2390 2380 2370 2390 2380 2440 2390SSD Saturated surface-dry
24
Table 6-3 Mixture Proportions and Fresh Concrete Properties of Group 1 Preliminary Mixtures (Inch-Pound Units)
Mixture Designation C-1 CFOS-1
CFOS-2
CFOS-3
CFO-1
CFO-2
CF-1 CO-1
Cement (lbyd3) 603 361 240 120 362 241 414 562 Class C Fly Ash Weston (lbyd3) 0 199 301 358 200 302 204 0
Powdered Gypsum Wallboard Old (lbyd3) 0 42 60 120 42 60 0 42 Water (lbyd3) 288 270 273 261 274 268 255 276
Sand SSD (lbyd3) 1430 1430 1420 1400 1430 1430 1470 1430Crushed Stone 34 in max SSD (lbyd3) 1720 1720 1710 1700 1720 1710 1760 1710
Sodium Sulfate Na2SO4 (lbyd3) 0 12 12 24 0 0 0 0 Water-Cementitious Ratio WCm 048 045 045 044 045 044 041 046
Slump (in) 2 12 1 14 1 12 1 12 2 14 2 12 2 12 1 Air Content () 13 18 18 21 19 22 14 20
Air Temperature (degF) 74 74 74 75 73 73 73 73 Concrete Temperature (degF) 70 71 71 70 72 72 71 70
Density (lbft3) 150 149 149 148 149 149 152 149 SSD Saturated surface-dry Test results for compressive strength of Group 1 concrete mixtures are shown in Table 6-4
(in MPa) and Table 6-5 (in psi) Mixtures CFOS-1 and CFOS-2 were strong enough to be
demolded at one day and showed quite high compressive strength values of 347 MPa (5040 psi)
and 330 MPa (4790 psi) at seven days Mixture CFOS-3 was also strong enough to be
demolded at one day
Table 6-4 Compressive Strength of Group 1 Preliminary Concrete Mixtures (MPa) Age (days) C-1 CFO
S-1 CFOS-2
CFOS-3
CFO-1
CFO-2
CF-1 CO-1
1 106 59 39 23 28 07dagger 60 88 7 308 347 330 hellip 291 245 330 26528 396 456 429 hellip 428 379 480 429
dagger Result from testing only one cylinder all other results are from testing three cylinders each Cylinders had cracked on their own
Table 6-5 Compressive Strength of Group 1 Preliminary Concrete Mixtures (psi) Age (days) C-1 CFO
S-1 CFOS-2
CFOS-3
CFO-1
CFO-2
CF-1 CO-1
1 1540 850 560 340 400 100dagger 870 12707 4470 5040 4790 hellip 4220 3550 4780 385028 5740 6620 6220 hellip 6210 5490 6960 6220
dagger Result from testing only one cylinder all other results are from testing three cylinders each Cylinders had cracked on their own
25
Fig 6-1 is a photograph of a cylinder of Mixture CFOS-2 It was noted that white material
was appearing on a CFOS-2 cylinder obtained after compression test
Fig 6-2 shows a photograph of cylinders from Mixture CFOS-3 Mixture CFOS-3
developed a significant amount of efflorescence and cylinders cracked by themselves before
reaching the age of seven days
Mixtures CFO-1 and CFO-2 were made using the same proportions of cement fly ash and
old gypsum wallboard as Mixtures CFOS-1 and CFOS-2 but without using sodium sulfate
Mixtures CFO-1 and CFO-2 were weaker than Mixtures CFOS-1 and CFOS-2 especially at the
age of one day Mixture CFO-2 was so soft that two out of three cylinders broke during
demolding at the age of one day
Mixture CF-1 was made using only cement and fly ash Mixture CO-1 was made using only
cement and old gypsum wallboard Compared with Mixture C-1 Mixture CO-1 showed a lower
strength at 1 and 7 days and a higher strength at 28 days
Fig 6-1 Efflorescence Appearing on Cylinder
of Mixture CFOS-2 Left from Compression Test
Fig 6-2 Efflorescence Appearing on Air-Dried
Cylinders of CFOS-3
26
62 Group 2 Preliminary Mixtures
Group 2 preliminary concrete mixtures were made using ldquoNewrdquo gypsum wallboard Sodium
bicarbonate was used in the majority of the Group 2 mixtures for evaluation as an activator
Table 6-6 Table 6-7 and Table 6-8 show mixture proportions of Group 2 concrete mixtures
Proportions of Mixtures C-1 and CF-1 of Group 1 are shown as well for easier comparison
Unlike sodium sulfate use of sodium bicarbonate increased water demand of fresh concrete
resulting in high water-cementitious ratios for the desired workability
Table 6-6 Proportions Powder Materials Used for Group 2 Preliminary Concrete Mixtures Mixture Designation C-1 CF-1 CN-1 CFN-
1 CB-1 CFB-
1 CNB-
1 CFNB-1
CFNB-2
CFNB-3
Laboratory mixture designation Ref-1 Old-7 New-1
New-2
Ref-2 FA-1 New-3
New-4
New-5
New-6
Cement (mass of Cm) 100 67 93 60 100 67 93 60 40 53 Fly Ash (mass of Cm) 0 33 0 33 0 33 0 33 50 33
New Gypsum Wallboard (mass of Cm)
0 0 7 7 0 0 7 7 10 14
Sodium Bicarbonate (mass of Cm) 0 0 0 0 2 2 2 2 2 2 Cm Cementitious materials (Cement + Fly Ash + Gypsum Wallboard)
Table 6-7 Mixture Proportions and Fresh Concrete Properties of Group 2 Preliminary Mixtures (SI [Metric] Units)
Mixture Designation C-1 CF-1 CN-1 CFN-1
CB-1 CFB-1
CNB-1
CFNB-1
CFNB-2
CFNB-3
Cement (kgm3) 358 246 331 215 354 241 318 210 140 186 Class C Fly Ash Weston (kgm3) 0 121 0 119 0 119 0 116 175 115
Powdered Gypsum Wallboard New (kgm3)
0 0 25 25 0 0 24 25 35 49
Water (kgm3) 171 151 181 153 189 164 199 176 166 171 Sand SSD (kgm3) 849 872 840 850 841 857 809 830 827 825
Crushed Stone 19-mm max SSD (kgm3)
1020 1050 1010 1020 1010 1030 971 999 994 994
Sodium Bicarbonate NaHCO3 (kgm3) 0 0 0 0 71 72 68 70 70 70 Water-Cementitious Ratio WCm 048 041 051 043 053 045 058 050 047 049
Slump (mm) 65 65 45 50 70 55 95 65 65 65 Air Content () 13 14 18 19 14 12 21 18 23 22
Air Temperature (degC) 23 23 22 22 23 23 23 23 23 23 Concrete Temperature (degC) 21 22 21 20 23 23 23 22 22 23
Density (kgm3) 2400 2440 2390 2380 2400 2420 2330 2360 2340 2350SSD Saturated surface-dry
27
Table 6-8 Mixture Proportions and Fresh Concrete Properties of Group 2 Preliminary Mixtures (Inch-Pound Units)
Mixture Designation C-1 CF-1 CN-1 CFN-1
CB-1 CFB-1
CNB-1
CFNB-1
CFNB-2
CFNB-3
Cement (lbyd3) 603 414 557 362 596 407 536 354 236 313 Class C Fly Ash Weston (lbyd3) 0 204 0 200 0 201 0 195 295 194
Powdered Gypsum Wallboard New (lbyd3)
0 0 42 42 0 0 40 41 59 82
Water (lbyd3) 288 255 305 258 318 276 336 296 279 289 Sand SSD (lbyd3) 1430 1470 1410 1430 1420 1440 1360 1400 1390 1390
Crushed Stone 34 in max SSD (lbyd3)
1720 1760 1700 1720 1700 1730 1640 1680 1670 1670
Sodium Bicarbonate NaHCO3 (lbyd3) 0 0 0 0 12 12 12 12 12 12 Water-Cementitious Ratio WCm 048 041 051 043 053 045 058 050 047 049
Slump (in) 2 12 2 12 1 34 2 2 34 2 14 3 34 2 12 2 12 2 12Air Content () 13 14 18 19 14 12 21 18 23 22
Air Temperature (degF) 74 73 72 72 73 74 73 74 73 73 Concrete Temperature (degF) 70 71 69 68 74 73 73 71 72 74
Density (lbft3) 150 152 149 149 150 151 145 147 146 146 SSD Saturated surface-dry Table 6-9 and Table 6-10 show test results for compressive strength of Group 2 concrete
mixtures When sodium bicarbonate was used in concrete containing new gypsum wallboard
the 1-day compressive strength of concrete improved but the 28-day compressive strength was
reduced When sodium bicarbonate was used in concrete made with cement (without fly ash or
gypsum) and in concrete made with cement and fly ash (without gypsum) the compressive
strength of concrete was reduced at all test ages of 1 7 and 28 days Unlike Mixture CFOS-3
from Group 1 the test cylinders did not develop any cracking
Table 6-9 Compressive Strength of Group 2 Preliminary Concrete Mixtures (MPa) Age (days) C-1 CF-1 CN-1 CFN-
1 CB-1 CFB-
1 CNB-
1 CFNB-1
CFNB-2
CFNB-3
1 106 60 74 32 90 57 76 57 36 48 7 308 330 236 323 228 202 231 283 265 21528 396 480 347 407 294 299 327 354 400 315
28
Table 6-10 Compressive Strength of Group 2 Preliminary Concrete Mixtures (psi) Age (days) C-1 CF-1 CN-1 CFN-
1 CB-1 CFB-
1 CNB-
1 CFNB-1
CFNB-2
CFNB-3
1 1540 870 1080 470 1310 820 1100 830 520 690 7 4470 4780 3430 4690 3310 2930 3350 4110 3850 312028 5740 6960 5030 5900 4270 4330 4740 5130 5800 4570
Fig 6-3 and Fig 6-4 show cylinders of some of the Group 2 concrete mixtures
Efflorescence on the surface of concrete was noted
Fig 6-3 Efflorescence on a Cylinder of Mixture CFNB-2 Left from Seven-day Compression Test
Fig 6-4 Efflorescence on a Cylinder of Mixture CFNB-3 Left from One-day Compression Test
63 Group 3 Preliminary Mixtures
Group 3 preliminary concrete mixtures were made with ldquoNewrdquo gypsum wallboard and using
half as much sodium sulfate as the original planned see Table 3-2 Mixture CFNS-6 was made
with only one-quarter of the sodium sulfate planned see Table 3-2
Table 6-11 to Table 6-13 show mixture proportions of Group 3 concrete mixtures Mixture
CFNS-1-1 and CFNS-1-2 were twin mixtures made using identical proportions They used the
same proportions of cement fly ash and gypsum wallboard as Mixture CFOS-2 of Group 1
except the source of gypsum wallboard and the amount of sodium sulfate
29
Mixtures CFNS-2-1 and CFNS-2-2 were also twin mixtures made using the same proportions
of cement fly ash and gypsum wallboard as Mixture CFOS-3 of Group 1 except the source of
gypsum wallboard and the amount of sodium sulfate
Efflorescence was observed on leftover concrete from Mixtures CFNS-1-1 CFNS-1-2
CFNS-2-1 CFNS-2-2 and CFNS-6
Table 6-11 Proportions of Powder Materials Used for Group 3 Preliminary Concrete Mixtures Mixture Designation C-3 CFNS-
1-1 CFNS-
1-2 CFNS-
2-1 CFNS-
2-2 CFNS-
6 Laboratory mixture designation Ref-4 New-
10 New-
11 New-
12 New-
13 New-
17 Cement (mass of Cm) 100 40 40 20 20 20 Fly Ash (mass of Cm) 0 50 50 60 60 60
New Gypsum Wallboard (mass of Cm) 0 10 10 20 20 20 Sodium Sulfate (mass of Cm) 0 1 1 2 2 1
Cm Cementitious materials (Cement + Fly Ash + Gypsum Wallboard)
Table 6-12 Mixture Proportions and Fresh Properties of Group 3 Preliminary Concrete Mixtures (SI [Metric] Units)
Mixture Designation C-3 CFNS-1-1
CFNS-1-2
CFNS-2-1
CFNS-2-2
CFNS-6
Cement (kgm3) 360 146 147 72 73 73 Class C Fly Ash Weston (kgm3) 0 182 184 217 220 218
Powdered Gypsum Wallboard New (kgm3) 0 36 37 72 73 73 Water (kgm3) 163 164 160 165 145 155
Sand SSD (kgm3) 853 854 861 848 862 855 Crushed Stone 19-mm max SSD (kgm3) 1030 1040 1050 1030 1050 1030
Sodium Sulfate Na2SO4 (kgm3) 0 36 37 72 73 36 Water-Cementitious Ratio WCm 045 045 044 046 039 043
Slump (mm) 50 50 55 40 45 25 Air Content () 18 hellip hellip hellip hellip hellip
Air Temperature (degC) 23 23 24 23 23 24 Concrete Temperature (degC) 22 hellip hellip hellip hellip hellip
Density (kgm3) 2400 2420 2440 2410 2430 2410 SSD Saturated surface-dry
30
Table 6-13 Mixture Proportions and Fresh Properties of Group 3 Preliminary Concrete Mixtures (Inch-Pound Units)
Mixture Designation C-3 CFNS-1-1
CFNS-1-2
CFNS-2-1
CFNS-2-2
CFNS-6
Cement (lbyd3) 606 245 247 122 124 122 Class C Fly Ash Weston (lbyd3) 0 307 309 365 371 367
Powdered Gypsum Wallboard New (lbyd3) 0 61 62 122 124 122 Water (lbyd3) 274 276 269 278 244 261
Sand SSD (lbyd3) 1440 1440 1450 1430 1450 1440 Crushed Stone 34 in max SSD (lbyd3) 1730 1750 1760 1730 1760 1740
Sodium Sulfate Na2SO4 (lbyd3) 0 6 6 12 12 6 Water-Cementitious Ratio WCm 045 045 044 046 039 043
Slump (in) 2 2 2 14 1 12 1 34 1 Air Content () 18 hellip hellip hellip hellip hellip
Air Temperature (degF) 74 74 76 74 73 76 Concrete Temperature (degF) 72 hellip hellip hellip hellip hellip
Density (lbft3) 150 151 152 150 151 150 SSD Saturated surface-dry Table 6-14 and Table 6-15 show the test results for compressive strength of Group 3 concrete
mixtures The strength of Mixtures CFNS-1-1 and CFNS-1-2 were not significantly lower than
that of Mixture CFOS-2 Also the strength of Mixtures CFNS-2-1 and CFNS-2-2 were not
significantly lower than that of Mixture CFOS-3 The strength of Mixtures CFNS-1-1 CFNS-1-
2 CFNS-2-1 and CFNS-2-2 were quite acceptable
Upon careful inspection it was noted that cylinders of Mixture CFNS-6 cracked by
themselves before reaching the age of seven days Cylinders of Mixtures CFNS-2-1 and CFNS-
2-2 must have cracked as well
31
Table 6-14 Compressive Strength of Group 3 Preliminary Concrete Mixtures (MPa) Age (days) C-3 CFNS-
1-1 CFNS-
1-2 CFNS-
2-1 CFNS-
2-2 CFNS-
6 1 117 23Dagger 22 19 19 12Dagger 7 303 247dagger 258dagger 96dagger 85dagger hellip 28 359 hellip hellip hellip hellip hellip
Dagger Average from testing two cylinders dagger Result from testing one cylinder The rest are averages from three tests Cylinders had cracked on their own
Table 6-15 Compressive Strength of Group 3 Preliminary Concrete Mixtures (psi) Age (days) C-3 CFNS-
1-1 CFNS-
1-2 CFNS-
2-1 CFNS-
2-2 CFNS-
6 1 1690 330Dagger 320 270 270 180Dagger 7 4390 3580dagger 3740dagger 1390dagger 1240dagger hellip 28 5210 hellip hellip hellip hellip hellip
Dagger Average from testing two cylinders dagger Result from testing one cylinder The rest are averages from three tests Cylinders had cracked on their own Based on the results of preliminary mixing and testing of concrete it was decided to make
final mixture CFNS-4 using the mixture proportions of Mixtures CFNS-1-1 and CFNS-1-2
Final mixture CFNS-5 was made using the mixture proportions of Mixtures CFNS-2-1 and
CFNS-2-2
32
CHAPTER 7 FINAL MIXTURES
In total eight final concrete mixtures were made to evaluate the slump retention time of
initial setting compressive strength and length change of concrete In addition mortar bars
were made for evaluation of sulfate resistance
71 Mixture Proportions
Table 7-1 presents the proportions of powder materials used for final concrete mixtures The
mixtures were made in two groups Group 1 Mixtures C-2 CN-2 CFN-2 and CFN-3 were
made using up to 20 fly ash and 20 powdered wallboard with water-reducing admixture and
without sodium sulfate Group 2 Mixtures Ref-5 CFNS-3 CFNS-4 and CFNS-5 were made
using up to 60 fly ash 20 powdered wallboard 2 sodium sulfate and without water-
reducing admixture Sodium sulfate was added as powder to a concrete mixture
Table 7-1 Proportions of Powder Materials Used for Final Concrete Mixtures Mixture Designation C-2 CN-2 CFN-
2 CFN-
3 C-4 CFN
S-3 CFNS-4
CFNS-5
Laboratory mixture designation Ref-3 New-7
New-8
New-9
Ref-5 New-14
New-15
New-16
Cement (mass of Cm) 100 90 70 60 100 60 40 20 Fly Ash (mass of Cm) 0 0 20 20 0 33 50 60
New Gypsum Wallboard (mass of Cm) 0 10 10 20 0 7 10 20 Sodium Sulfate (mass of Cm) 0 0 0 0 0 1 1 2
Cm Cementitious materials (Cement + Fly Ash + Gypsum Wallboard) The mixture proportions and fresh properties of the main concrete mixtures are presented in
Table 7-2 (in SI units) and Table 7-3 (in inch-pound units) To evaluate retention of slump
slump was measured twice (1) immediately after mixing was done and (2) 30 minutes later In
general the concrete mixtures retained their workability
33
Table 7-2 Mixture Proportions and Fresh Concrete Properties of Final Mixtures (SI [Metric] Units) Mixture Designation C-2 CN-2 CFN-
2 CFN-
3 C-4 CFN
S-3 CFNS-4
CFNS-5
Cement (kgm3) 362 316 249 212 365 217 144 71 Class C Fly Ash Weston (kgm3) 0 0 71 71 0 119 180 213
Powdered Gypsum Wallboard New (kgm3) 0 35 35 71 0 25 36 71 Water (kgm3) 164 164 170 153 163 154 153 157
Sand SSD (kgm3) 856 830 840 835 861 854 852 839 Crushed Stone 19-mm max SSD (kgm3) 1030 999 1010 1010 1030 1030 1020 1010
Sodium Sulfate Na2SO4 (kgm3) 0 0 0 0 0 36 36 71 Water-Reducing Admixture (Lm3) 0 103 104 104 0 0 0 0 Water-Cementitious Ratio WCm 045 047 048 043 045 043 042 044
Slump (mm) 55 50 40 30 30 40 45 25 Slump 30 minutes later (mm) 30 40 25 20 40 30 15 15
Air Content () 18 37 26 32 14 22 15 17 Air Temperature (degC) 23 24 23 24 23 23 23 24
Concrete Temperature (degC) 23 23 23 25 24 24 25 25 Density (kgm3) 2410 2340 2380 2350 2420 2400 2390 2370
SSD Saturated surface-dry
Table 7-3 Mixture Proportions and Fresh Concrete Properties of Final Mixtures (Inch-Pound Units)
Mixture Designation C-2 CN-2 CFN-2
CFN-3
C-4 CFNS-3
CFNS-4
CFNS-5
Cement (lbyd3) 610 532 419 357 614 366 243 120 Class C Fly Ash Weston (lbyd3) 0 0 120 119 0 201 303 359
Powdered Gypsum Wallboard New (lbyd3) 0 59 59 119 0 43 61 120 Water (lbyd3) 276 276 287 257 274 259 257 264
Sand SSD (lbyd3) 1440 1400 1410 1410 1450 1440 1430 1410Crushed Stone 34 in max SSD (lbyd3) 1730 1680 1700 1690 1740 1730 1720 1700
Sodium Sulfate Na2SO4 (lbyd3) 0 0 0 0 0 6 6 12 Water-Reducing Admixture (fl ozyd3) 0 265 269 268 0 0 0 0
Water-Cementitious Ratio WCm 045 047 048 043 045 043 042 044Slump (in) 2 14 2 1 12 1 14 1 14 1 12 1 34 1
Slump 30 minutes later (in) 1 14 1 12 1 34 1 12 1 14 12 12 Air Content () 18 37 26 32 14 22 15 17
Air Temperature (degF) 73 75 74 75 74 74 74 75 Concrete Temperature (degF) 73 74 74 77 75 76 77 77
Density (lbft3) 150 146 148 146 151 150 149 148 SSD Saturated surface-dry
72 Time of Initial Setting
Table 7-4 presents test results of the time of initial setting final concrete mixtures It took
about twice as long for the mixtures containing fly ash and powdered gypsum wallboard to reach
34
initial setting as their reference concrete mixtures It is well known that concrete mixtures
containing large amount of fly ash may show delayed setting
Table 7-4 Time of Initial Setting of Final Concrete Mixtures Mixture Designation C-2 CN-2 CFN-
2 CFN-
3 C-4 CFN
S-3 CFNS-4
CFNS-5
Time of Initial Setting (hours) 48 72 114 120 47 98 118 105
73 Compressive Strength
Compressive strength test results for final concrete mixtures are shown in Table 7-5 (in
MPa) Table 7-6 (in psi) Fig 7-1 and Fig 7-2
Table 7-5 Compressive Strength of Final Concrete Mixtures (MPa) Age (days) C-2 CN-2 CFN-
2 CFN-
3 C-4 CFN
S-3 CFNS-4
CFNS-5
1 168 111 42 39 159 58 38 24 3 301 197 174 132 302 237 178 79 7 354 232 265 154 347 301 297 12528 448 285 414 211 408 415 420 hellip 91 508 419 501 289 515 443 497 hellip
Cylinders had already cracked on their own before testing started
Table 7-6 Compressive Strength of Final Concrete Mixtures (psi) Age (days) C-2 CN-2 CFN-
2 CFN-
3 C-4 CFN
S-3 CFNS-4
CFNS-5
1 2430 1610 610 560 2310 840 550 350 3 4360 2860 2520 1910 4380 3440 2580 11407 5140 3370 3850 2240 5040 4370 4310 1810
28 6500 4140 6000 3060 5920 6020 6090 hellip 91 7370 6070 7270 4190 7470 6430 7210 hellip
Cylinders had already cracked on their own before testing started
35
0
10
20
30
40
50
60
1 10 100
Age (days)
Com
pres
sive
Str
engt
h (M
Pa)
0
1000
2000
3000
4000
5000
6000
7000
8000
(psi
)
Ref-3New-7New-8New-9
Fig 7-1 Compressive Strength of Final Concrete Mixtures Group 1
The mixtures CN-2 CFN-2 and CFN-3 showed lower compressive strength than C-2
Mixture CFN-2 showed structural-grade strength of 265 MPa (3850 psi) at seven days and a
relatively high compressive strength of 41 MPa (6000 psi) at 28 days Mixture CN-2 showed
structural-grade strength of 285 MPa (4140 psi) at 28 days
0
10
20
30
40
50
60
1 10 100
Age (days)
Com
pres
sive
Str
engt
h (M
Pa)
0
1000
2000
3000
4000
5000
6000
7000
8000
(psi
)
Ref-5New-14New-15New-16
Fig 7-2 Compressive Strength of Final Concrete Mixtures Group 2
36
As early as at seven days the mixtures CFNS-3 and CFNS-4 showed structural-grade
strength of 301 MPa (4370 psi) and 297 MPa (4310 psi) This is noteworthy considering the
fact that Mixtures CFNS-3 and CFNS-4 were made by replacing 40 and 60 of cement with
blends of fly ash and powdered gypsum wallboard At the age of 28 days the mixtures CFNS-3
and CFNS-4 reached compressive strength of 415 MPa (6020 psi) and 420 MPa (6090 psi) and
became as strong as Mixture Ref-5
The cylinders made from Mixture CFNS-5 cracked on their own before reaching the age of
seven days (Fig 7-3) This was attributed to an excessive expansive reaction resulting from use
of the particular proportions of cement fly ash powdered gypsum wallboard and sodium sulfate
in Mixture CFNS-5 Mixture CFNS-6 was made using half as much sodium sulfate (1 of
cementitious materials) as CFNS-5 nonetheless cylinders made from Mixture CFNS-6 cracked
before reaching the age of seven days
Fig 7-3 Cracked Cylinders of Concrete Mixtures CFNS-5 and CFNS-6
37
74 Length Change
Test results for length change of final concrete mixtures are shown in Table 7-7 Fig 7-5
and Fig 7-6
Table 7-7 Length Change of Final Concrete Mixtures () Age (days) C-2 CN-2 CFN-2 CFN-3 C-4 CFNS-
3 CFNS-
4 CFNS-
5 1 0 0 0 0 0 0 0 0 3 -0001 0010 0015 0018 0000 0006 0041 0359 7 -0003 0013 0031 0036 0004 0005 0039 1708
28 0004 0026 0033 0116 0002 0010 0043 hellip 32 -0010 0009 0012 0098 -0007 -0007 0030 hellip 35 -0015 0003 0009 0089 -0013 -0013 0025 hellip 42 -0022 -0003 -0002 0077 -0018 -0020 0020 hellip 56 -0028 -0020 -0004 0057 -0024 -0028 0014 hellip 84 -0033 -0027 -0010 0037 -0031 -0035 0011 hellip 140 -0036 -0035 -0017 0027 -0035 -0035 0006 hellip
Specimens had cracked on their own All of the concrete mixtures made with powdered gypsum wallboard showed higher
expansion than their reference concrete mixtures during immersion in saturated limewater
Mixture CFN-3 containing 20 fly ash and 20 powdered gypsum wallboard showed a large
expansion (0120) Specimens made from Mixture CFNS-5 containing 60 fly ash and 20
powdered gypsum wallboard showed excessive expansion and they cracked before reaching the
age of seven days (Fig 7-4)
38
Fig 7-4 Length-Change Specimen of Concrete
Mixture CFNS-5 Showing a Crack
-004
-002
000
002
004
006
008
010
012
0 30 60 90 120 150
Age (days)
Leng
th C
hang
e (
)
Ref-3New-7New-8New-9
Fig 7-5 Length Change of Final Concrete Mixtures Group 1
During drying Mixture CN-2 and CFN-3 made by using high proportions of powdered
gypsum wallboard to fly ash shrunk by greater extents than Mixture C-2 At the age of 140
days the net shrinkage of Mixture CN-2 was 0035 which was approximately the same as that
of C-2 0036 Mixture CFN-3 showed a net expansion of 0027 at 140 day Mixture CFN-2
shrunk by approximately the same amount as Mixture C-2 resulting in a net shrinkage of
0017 at 140 days
39
-004
-002
000
002
004
006
008
010
012
0 30 60 90 120 150
Age (days)
Leng
th C
hang
e (
)
Ref-5New-14New-15New-16
Fig 7-6 Length Change of Final Concrete Mixtures Group 2
The length change of Mixture CFNS-3 (made with 60 cement 33 fly ash and 7
powdered gypsum wallboard) was approximately the same as that of Mixture Ref-5 Mixture
CFNS-4 (made with 40 cement 50 fly ash and 10 powdered gypsum wallboard) showed a
relatively large expansion (0043) during immersion in saturated limewater and shrunk during
drying as much as it had expanded resulting in very small net expansion of 0006 at the age of
140 days This concrete mixture could be used to minimize drying shrinkage cracking of
concrete Mixture CFNS-4 could be used to minimize drying shrinkage cracking of concrete
75 Sulfate Resistance
Mortar cubes and bars were made using the same proportions of cement fly ash and gypsum
wallboard as the final concrete mixtures Ref-5 CFNS-3 and CFNS-4 No mortar mixture was
made using the powder-materials proportions of concrete mixture CFNS-5 because it was
anticipated that such mortar would crack
Table 7-8 shows the proportions of the mortar mixtures produced
40
Table 7-8 Mixture Proportions and Flow of Mortar Mixtures Mixture Designation C-c C-b CFNS-1c CFNS-1b CFNS-2c CFNS-2b
Laboratory mixture designation C-2 cube C-2 bar N-3 cube N-3 bar N-4 cube N-4 barCement (mass of Cm) 100 100 60 60 40 40 Fly Ash (mass of Cm) 0 0 33 33 50 50
New Gypsum Wallboard (mass of Cm) 0 0 7 7 10 10 Sodium Sulfate (mass of Cm) 0 0 1 1 1 1
Cement (g) 500 740 300 444 200 296 Class C Fly Ash Weston (g) 0 0 165 2442 250 370
Powdered Gypsum Wallboard New (g) 0 0 35 518 50 74 Sodium Sulfate Na2SO4 (g) 0 0 5 74 5 76
Water (g) 242 359 216 3204 200 2967 Water-Cementitious Ratio WCm 0484 0485 0432 0433 0400 0401
Graded Standard Sand (g) 1375 2035 1375 2035 1375 2035 Flow (mm) 190 hellip 185 hellip 191 hellip
Cm Cementitious materials (Cement + Fly Ash + Gypsum Wallboard) Table 7-9 and Table 7-10 show test results for the compressive strength of mortar mixtures
It took approximately 15 days for Mixture C-c to attain a compressive strength of 20 MPa
(2900 psi) For Mixture N-3 it took 47 days and for Mixture N-4 7 days
Table 7-9 Compressive Strength of Mortar (MPa) Age (days) C-c CFNS-1c CFNS-2c
1 148 45 11 4 314 174 111 5 hellip 212 hellip
5125 hellip hellip 167 7 hellip hellip 197 24 hellip hellip 250 28 396 316
Note These results are averages obtained from testing two cubes for each mixture at each test age
Table 7-10 Compressive Strength of Mortar (psi) Age (days) C-c CFNS-1c CFNS-2c
1 2140 650 160 4 4550 2530 1610 5 hellip 3070 hellip
5125 hellip hellip 2420 7 hellip hellip 2850 24 hellip hellip 3630 28 5750 4580 hellip
Note These results are averages obtained from testing two cubes at each test age for each mixture
41
0
5
10
15
20
25
30
35
40
45
0 5 10 15 20 25 30Age (days)
Com
pres
sive
Str
engt
h (p
si)
0
1000
2000
3000
4000
5000
6000
(MP
a)
C-2N-3N-4
Fig 7-7 Compressive Strength of Mortar Cubes
Once the mixture attained the specified compressive strength of 20 MPa (2900 psi) the
mortar bars were immersed in a 5 sodium sulfate solution and length change of the bars were
measured after specified periods to assess sulfate resistance of mortar mixtures Table 7-11 and
Fig 7-8 show test results for length change of mortar bars A larger expansion implies a lower
resistance of mortar mixture to sulfate attack and a smaller expansion implies a higher resistance
to sulfate attack
Table 7-11 Length Change of Mortar Bars () Age after immersion in 5 sodium sulfate
solution (days) C-b CFNS-1b CFNS-2b
0 0 0 0 7 0007 0016 0006 14 0013 0024 0009 21 0016 0028 0009 28 0020 0033 0009 42 0027 0044 0011 56 0034 0063 0010
Number of specimens tested C-b five N-1-b six and N-2-b three
42
000
001
002
003
004
005
006
007
0 7 14 21 28 35 42 49 56 63
Days after immersion in Na2SO4 solution
Len
gth
Cha
nge
()
C-bCFNS-1bCFNS-2b
Fig 7-8 Length Change of Mortar Bars in 5 Sodium Sulfate Solution
After 56 days of immersion in sodium sulfate solution Mixture C-b (Control) showed an
expansion of approximately 0034 Mixture N-3 (made with 33 fly ash and 7 powdered
gypsum wallboard and 1 sodium sulfate) shows an expansion of 0063 which was
approximately 19 times that of Mixture C-b Mixture N-4 (made with 50 fly ash 10
powdered gypsum wallboard and 1 sodium sulfate) showed an expansion of 0010 which is
significantly lower than that of Mixture C-b (Control) This means that Mixture N-4 possesses
significantly higher resistance to sulfate attack than Mixture C-b Importantly the expansion of
mortar bars made from Mixture N-4 stabilized after 14 days of immersion in sodium sulfate
solution
76 Summary
Table 7-12 shows a summary of proportions of powder materials and properties of final
concrete mixtures Table 7-13 shows a summary of proportions and length change in sulfate
solution of mortar mixtures
43
Table 7-12 Proportions of Powder Materials and Properties of Final Concrete Mixtures Mixture Designation C-2 CN-2 CFN-2 CFN-3 C-4 CFNS-
3 CFNS-
4 CFNS-
5 Cement (mass of Cm) 100 90 70 60 100 60 40 20 Fly Ash (mass of Cm) 0 0 20 20 0 33 50 60
New Gypsum Wallboard (mass of Cm) 0 10 10 20 0 7 10 20 Sodium Sulfate (mass of Cm) 0 0 0 0 0 1 1 2
Time of Initial Setting (hours) 48 72 114 120 47 98 118 105 Compressive Strength (MPa)
1-day 168 111 42 39 159 58 38 24 3-day 301 197 174 132 302 237 178 79 7-day 354 232 265 154 347 301 297 125
28-day 448 285 414 211 408 415 420 hellip 91-day 508 419 501 289 515 443 497 hellip
Compressive Strength (psi) 1-day 2430 1610 610 560 2310 840 550 350 3-day 4360 2860 2520 1910 4380 3440 2580 1140 7-day 5140 3370 3850 2240 5040 4370 4310 1810
28-day 6500 4140 6000 3060 5920 6020 6090 hellip 91-day 7370 6070 7270 4190 7470 6430 7210 hellip
Length Change () 1-day 0 0 0 0 0 0 0 0 7-day -0003 0013 0031 0036 0004 0005 0039 1708
28-day 0004 0026 0033 0116 0002 0010 0043 hellip 140-day -0036 -0035 -0017 0027 -0035 -0035 0006 hellip
Cm Cementitious materials (Cement + Fly Ash + Gypsum Wallboard) Specimens had cracked on their own
Table 7-13 Proportions of Powder Materials and Length Change in Sulfate Solution of Mortar Mixtures
Mixture Designation C-b CFNS-1b
CFNS-2b
Laboratory mixture designation Cement (mass of Cm) 100 60 40 Fly Ash (mass of Cm) 0 33 50
New Gypsum Wallboard (mass of Cm) 0 7 10 Sodium Sulfate (mass of Cm) 0 1 1
Length Change in 5 Sodium Sulfate Solution () 0-day 0 0 0 7-day 0007 0016 0006
14-day 0013 0024 0009 21-day 0016 0028 0009 28-day 0020 0033 0009 42-day 0027 0044 0011 56-day 0034 0063 0010
44
Table 7-14 shows a summary of properties of selected promising main concrete mixtures
Mixtures CFN-2 CFNS-3 and CFNS-4 were comparable to their reference concrete mixtures in
compressive strength at the ages of 7 days and later Based on the sulfate resistance of Mortar
N-4 it is expected that concrete Mixture CFNS-4 will also possess high resistance to sulfate
attack
Table 7-14 Summary of Proportions and Properties of Selected Final Concrete Mixtures and Mortar Mixtures
Mixture Designation C-4 CFN-2 CFNS-3
CFNS-4
Cement (mass of Cm) 100 70 60 40 Fly Ash (mass of Cm) 0 20 33 50
New Gypsum Wallboard (mass of Cm) 0 10 7 10 Sodium Sulfate (mass of Cm) 0 0 1 1
Time of Initial Setting (hours) 47 114 98 118 Compressive Strength (MPa)
1-day 159 42 58 38 3-day 302 174 237 178 7-day 347 265 301 297
28-day 408 414 415 420 91-day 515 501 443 497
Compressive Strength (psi) 1-day 2310 610 840 550 3-day 4380 2520 3440 2580 7-day 5040 3850 4370 4310
28-day 5920 6000 6020 6090 91-day 7470 7270 6430 7210
Length Change () 1-day 0 0 0 0
28-day 0002 0033 0010 0043 140-day -0035 -0017 -0035 0006
28-day Length Change of Mortar in 5 Sodium Sulfate Solution ()
0020 hellip 0033 0009
Cm Cementitious materials (Cement + Fly Ash + Gypsum Wallboard)
45
CHAPTER 8 ECONOMIC IMPACT ANALYSIS OF FULL-
SCALE IMPLEMENTATION
It is estimated that over 80000 tons of gypsum wallboard is disposed of each year from new
construction and demolition in Wisconsin If a tipping fee plus handling and transportation cost
of $30 per ton is assumed the disposal of gypsum wallboard costs Wisconsin citizens and
industry approximately $24 million dollars each year
Based on figures from the National Ready-Mixed Concrete Association Wisconsin produced
approximately 11 million cubic yards (84 million m3) of concrete in 2004 Based on a cement
content of 400 pounds per cubic yard (240 kgm3) of concrete 22 million tons of cement is used
in concrete each year in Wisconsin
This project showed that powdered gypsum wallboard could constitute approximately 10
of total cementitious materials used in a concrete mixture If this new cementitious material was
used in 20 of the concrete produced in Wisconsin approximately 44000 tons of gypsum
wallboard can be used In other words approximately half of the gypsum wallboard waste
generated in Wisconsin could be used in this application alone This would save Wisconsin
industry $13 million dollars each year in avoided disposal costs leading to reduce the cost for
concrete construction in Wisconsin Citizens would benefit also by reducing landfilling cost for
municipalities and increasing recycling rates of useful materials If 40 of the concrete
generated in Wisconsin used this new concrete mixture technology all of the waste gypsum
wallboard generated in Wisconsin could be used in this one application Therefore all 80000
tons of waste gypsum wallboard could be diverted from Wisconsin landfills It would save
Wisconsin citizens and industry over $24 million dollars each year in avoided disposal cost
46
This economic impact does not include incalculable dollar-benefits due to avoided possible
future environmental impact of sending such large quantities of gypsum wallboard into landfills
This project also showed that up to 60 of cement in concrete mixtures could be replaced
with a blend of Class C fly ash and gypsum wallboard Cement is a valuable commodity If it is
assumed that cement sells at $100 per ton and Class C fly ash sells at $50 per ton use of a
cementitious blend consisting of 40 cement 50 Class C fly ash and 10 powdered gypsum
in producing 40 of concrete in Wisconsin would result in savings on cement of about $50
million and expenditure on fly ash of about $20 million with a net savings of about $30 million
each year
Saving cement through this new technology would also reduce emissions of carbon dioxide
and other GHGs because production of one ton of cement releases about one ton of GHGs If
this new technology to use a blend of Class C fly ash and gypsum wallboard as a replacement of
cement were implemented in producing up to 40 of concrete in Wisconsin it would reduce the
GHG emissions by up to 12 million tons each year CO2 credits currently sell for about $20 per
ton Therefore CO2 credits would be worth $10 million each year
With a potential total value of $24 million in avoided disposal costs $30 million in savings
resulting from cement replacement plus $10 million in CO2 credits total economic benefit to
Wisconsin that could be generated by this project may be valued at about $42 million each year
47
CHAPTER 9 CONCLUSIONS
This project showed that from 30 to 60 of cement in concrete mixtures could be
successfully replaced with blends of Class C fly ash and powdered gypsum wallboard Several
concrete mixtures made by such replacements showed compressive strength nearly as high as
that of Reference concrete mixtures (without replacement of cement) at seven days The 28-day
compressive strength of these concrete mixtures containing fly ash and gypsum wallboard were
equivalent to that of Reference concrete mixtures Use of sodium sulfate as an activator was
essential in improving the 1-day and 3-day strength of concrete containing Class C fly ash and
gypsum wallboard
A concrete mixture made with a cementitious blend of 40 cement 50 Class C fly ash
and 10 powdered gypsum wallboard showed a relatively large expansion (0043) during
immersion in saturated limewater and shrunk during drying as much as it had expanded
resulting in very small net expansion at the age of 140 days This concrete mixture could be
used to minimize drying shrinkage cracking and subsequent increase in durability of concrete
A mortar mixture made with a cementitious blend of 40 cement 50 Class C fly ash and
10 powdered gypsum wallboard showed much higher resistance to sulfate attack compared
with Reference mortar (without replacement of cement)
Total economic benefit to Wisconsin that could be generated by this project may be valued at
up to about $42 million each year
48
CHAPTER 10 REFERENCES
ASTM C 33-03 ldquoStandard Specification for Concrete Aggregatesrdquo ASTM International West Conshohocken PA 11 pp
ASTM C 150-05 ldquoStandard Specification for Portland Cementrdquo ASTM International West Conshohocken PA 8 pp
ASTM C 192 C 192M-05 ldquoStandard Practice for Making and Curing Concrete Test Specimens in the Laboratoryrdquo 8 pp
ASTM C 494C 494M-05a ldquoStandard Specification for Chemical Admixtures for Concreterdquo ASTM International West Conshohocken PA 10 pp
ASTM C 618-03 ldquoStandard Specification for Coal Fly Ash and Raw or Calcined Natural Pozzolan for Use in Concreterdquo ASTM International West Conshohocken PA 3 pp
ASTM C 1012-04 ldquoStandard Test Method for Length Change of Hydraulic-Cement Mortars Exposed to a Sulfate Solutionrdquo ASTM International West Conshohocken PA 6 pp
Aimin X and Sarkar S L ldquoMicrostructural Study of Gypsum Activated Fly Ash Hydration in Cement Pasterdquo Cement and Concrete Research Vol 21 1991 pp 1137-1147
Drywallrecyclingorg lthttpwwwdrywallrecyclingorggt (February 2006)
EPA Presentation by the US Environmental Protection Agency at the Massachusetts DEP Gypsum Workgroup March 18 2004
Freeman R B and Carrasquillo R L ldquoProduction of Sulfate-Resistant Concrete Containing High-Calcium Fly Ash and Sodium Sulfate Admixturerdquo Proceedings of Fifth CANMETACI International Conference on Fly Ash Silica Fume Slag and Natural Pozzolans in Concrete ACI SP-153 Vol 1 1995 pp 153-176
ICF Northwest ldquoCalcium Spray Dryer Waste Management Design Guidelinesrdquo EPRI (Electric Power Research Institute) Report No CS-5312 September 1987 p 3-3
Krocak R F Meininger R and Yost P A Chapter 21 ldquoBeneficial Reuse of Aggregate Mineral Fines and Scrap New Construction Wallboardrdquo Land Application of Agricultural Industrial and Municipal By-Products (6) James F Powers and Warren P Dick ed SSSA Number 6 in the Soil Science Society of America Book Series ISBN 0-89118-834-7 Item Number 60901 2000 653 pages
Kumar P K and Monteiro P J M ldquoConcrete Microstructure Properties and Materialsrdquo 2nd Ed McGraw-Hill 1993
Lafarge Group ltwwwlafargecomgt (February 2006)
49
Ma W Liu C Brown P W and Komarneni S ldquoPore Structures of Fly Ashes Activated By Ca(OH)2 and CaSO42H2Ordquo Cement and Concrete Research Vol 25 No 2 1995 pp 417-425
McCall R ldquoWasteCap Wisconsin Drywall-To-Fertilizer Projectrdquo Final Report for the US Environmental Protection Agency August 1993
Merritt F S and Ricketts J T editors Building Design and Construction Handbook McGraw Hill 6th Ed 2001 pp 435-438
Mindness S Young J F and Darwin D ldquoConcreterdquo 2nd Ed Prentice Hall 2002
Naik T R Kraus R N Chun Y-m and Nageotte S O ldquoCoal-Combustion Bottom Ash for Reducing the Shrinkage of Concrete Made With Portland Cement and Sulfoaluminate Cementrdquo Jean Pera Symposium on Specialty Cements and Sustainability Issues a part of the proceedings of the Ninth CANMETACI International Conference on Recent Advances in Concrete Technology Warsaw Poland May 2007 pp 141-155
Neville A ldquoProperties of Concreterdquo 4th Ed Longman 1995
Pera J and Ambroise J ldquoNew Applications of Calcium Sulfoaluminate Cementrdquo Cement and Concrete Research Vol 34 No 4 April 2004 pp 671-676
Prusinski J R and Carrasquillo R L ldquoUsing Medium- to High-Volume Fly Ash Blended Cements to Improve the Sulfate Resistance of High-Lime Fly Ash Concreterdquo Proceedings of Fifth CANMETACI International Conference on Fly Ash Silica Fume Slag and Natural Pozzolans in Concrete ACI SP-153 Vol 1 1995 pp 43-65
Reindl J R ldquoBibliography of Gypsum Drywallrdquo available on the WasteCap Wisconsin website httpwwwwastecapwiorg August 2002 73 pages
WI-DNR ldquoSubstituting Waste Gypsum Wallboard for Agricultural Gypsumrdquo Wisconsin Department of Natural Resources Bureau of Waste Management DNR Publication WA-607-04 rev 2005
Wolkowski R ldquoDemonstration of Land Application of Crushed Gypsum Wallboard Waste for Alfalfardquo Final report to the Wisconsin Department of Natural Resources Waste Reduction and Recycling Grant Program and Dane County Department of Public Works August 12 1998
Wolkowski R P ldquoUsing Recycled Wallboard for Crop Production (A3782)rdquo WasteCap Wisconsin Inc 2003
Wu Z and Naik T R ldquoUse of Clean Coal Ash as Setting Time Regulator in Portland Cementrdquo Proceedings of the Fifth CANMETACI International Conference on Recent Advances in Concrete Technology Supplementary Papers 2001 pp 83-94
50
Wu Z and Naik T R ldquoProperties of Concrete Produced from Multicomponent Blended Cementsrdquo Cement and Concrete Research Vol 32 2002 pp 1937-1942
Wu Z and Naik T R ldquoChemically Activated Blended Cementsrdquo ACI Materials Journal September-October 2003 pp 434-440
- 08 Naik Chun cover
- 08 MIL NaikGypsumWallboard in concrete
-
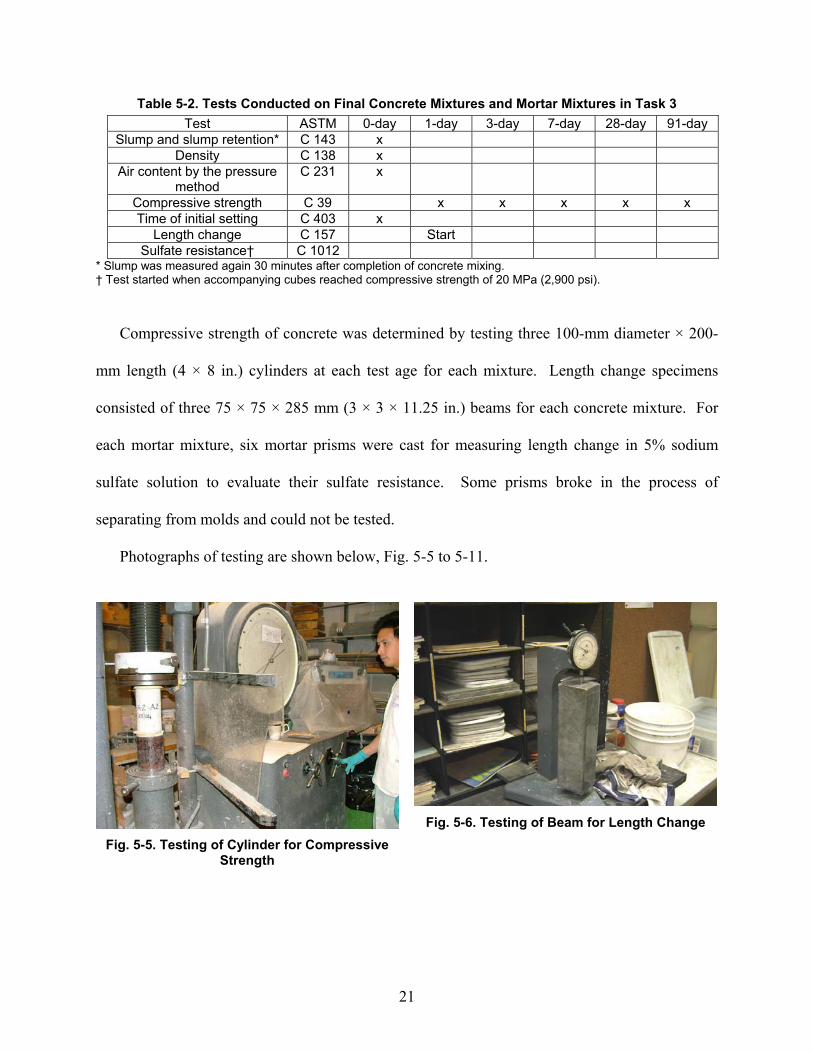
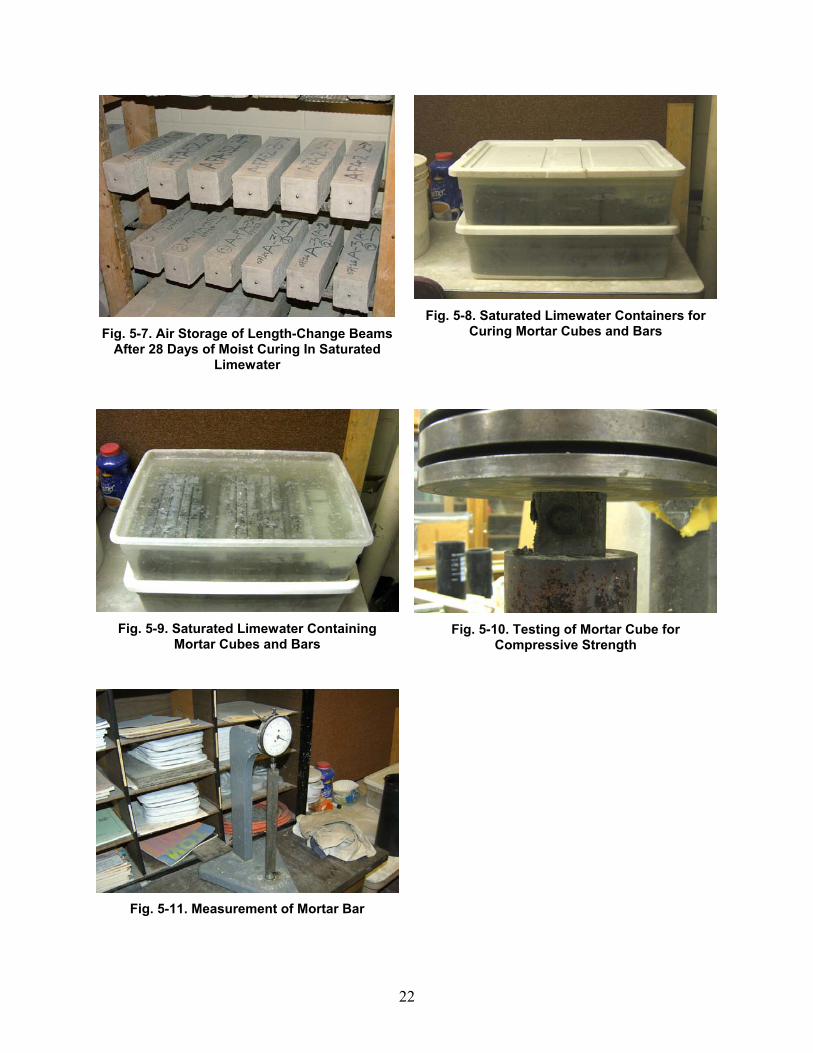
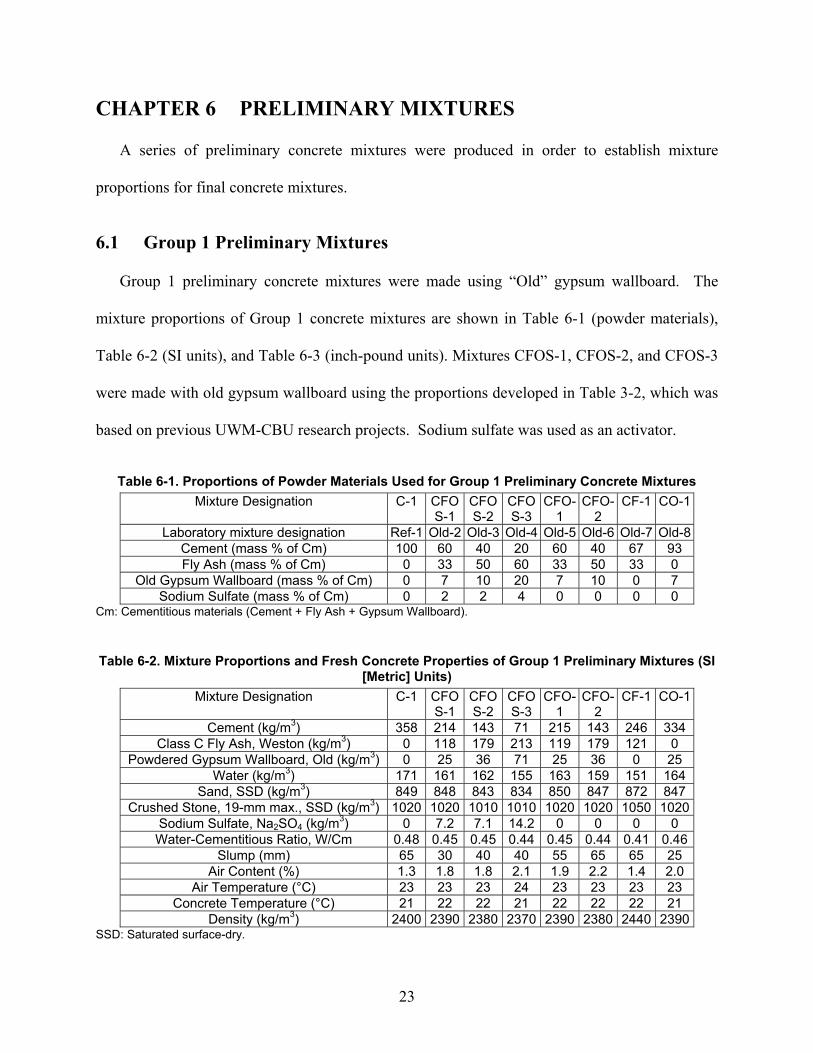
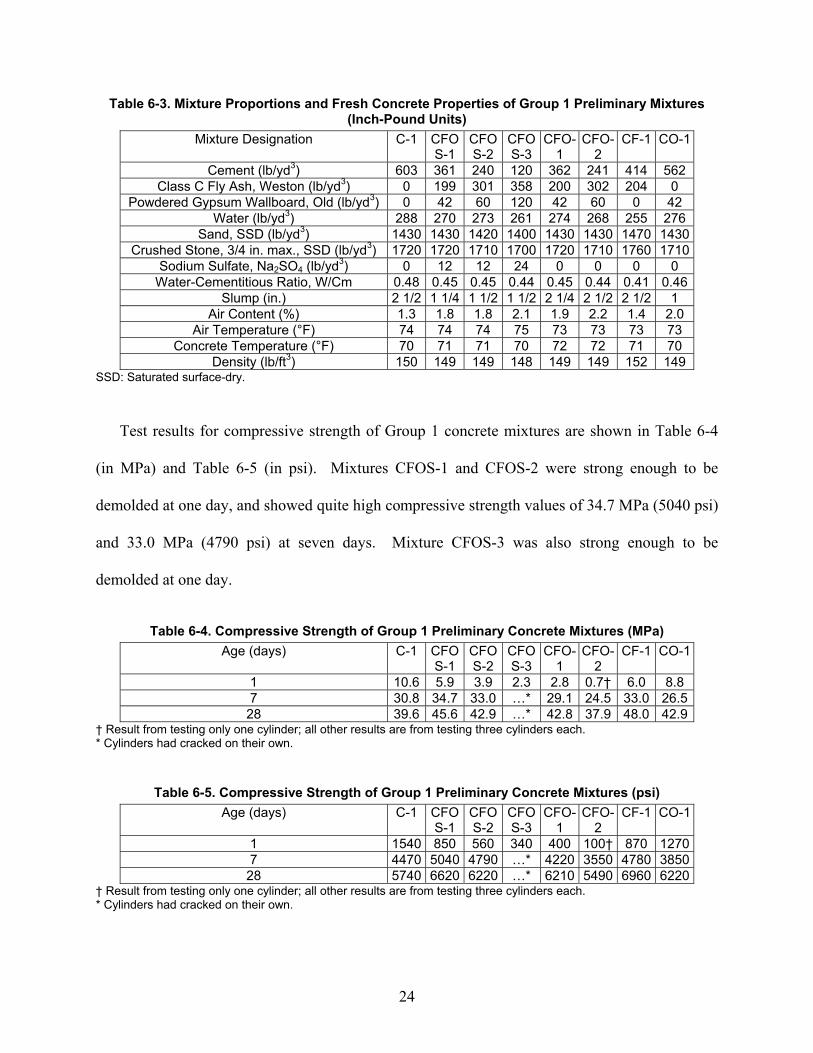
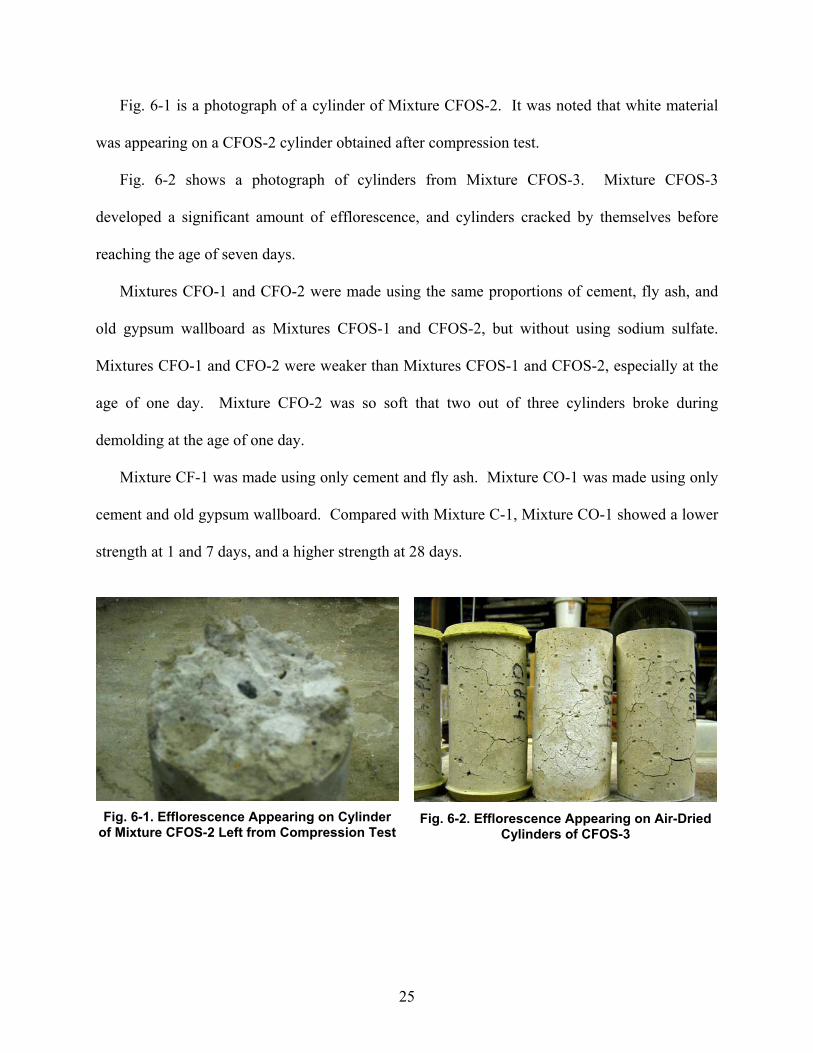
25
Fig 6-1 is a photograph of a cylinder of Mixture CFOS-2 It was noted that white material
was appearing on a CFOS-2 cylinder obtained after compression test
Fig 6-2 shows a photograph of cylinders from Mixture CFOS-3 Mixture CFOS-3
developed a significant amount of efflorescence and cylinders cracked by themselves before
reaching the age of seven days
Mixtures CFO-1 and CFO-2 were made using the same proportions of cement fly ash and
old gypsum wallboard as Mixtures CFOS-1 and CFOS-2 but without using sodium sulfate
Mixtures CFO-1 and CFO-2 were weaker than Mixtures CFOS-1 and CFOS-2 especially at the
age of one day Mixture CFO-2 was so soft that two out of three cylinders broke during
demolding at the age of one day
Mixture CF-1 was made using only cement and fly ash Mixture CO-1 was made using only
cement and old gypsum wallboard Compared with Mixture C-1 Mixture CO-1 showed a lower
strength at 1 and 7 days and a higher strength at 28 days
Fig 6-1 Efflorescence Appearing on Cylinder
of Mixture CFOS-2 Left from Compression Test
Fig 6-2 Efflorescence Appearing on Air-Dried
Cylinders of CFOS-3
26
62 Group 2 Preliminary Mixtures
Group 2 preliminary concrete mixtures were made using ldquoNewrdquo gypsum wallboard Sodium
bicarbonate was used in the majority of the Group 2 mixtures for evaluation as an activator
Table 6-6 Table 6-7 and Table 6-8 show mixture proportions of Group 2 concrete mixtures
Proportions of Mixtures C-1 and CF-1 of Group 1 are shown as well for easier comparison
Unlike sodium sulfate use of sodium bicarbonate increased water demand of fresh concrete
resulting in high water-cementitious ratios for the desired workability
Table 6-6 Proportions Powder Materials Used for Group 2 Preliminary Concrete Mixtures Mixture Designation C-1 CF-1 CN-1 CFN-
1 CB-1 CFB-
1 CNB-
1 CFNB-1
CFNB-2
CFNB-3
Laboratory mixture designation Ref-1 Old-7 New-1
New-2
Ref-2 FA-1 New-3
New-4
New-5
New-6
Cement (mass of Cm) 100 67 93 60 100 67 93 60 40 53 Fly Ash (mass of Cm) 0 33 0 33 0 33 0 33 50 33
New Gypsum Wallboard (mass of Cm)
0 0 7 7 0 0 7 7 10 14
Sodium Bicarbonate (mass of Cm) 0 0 0 0 2 2 2 2 2 2 Cm Cementitious materials (Cement + Fly Ash + Gypsum Wallboard)
Table 6-7 Mixture Proportions and Fresh Concrete Properties of Group 2 Preliminary Mixtures (SI [Metric] Units)
Mixture Designation C-1 CF-1 CN-1 CFN-1
CB-1 CFB-1
CNB-1
CFNB-1
CFNB-2
CFNB-3
Cement (kgm3) 358 246 331 215 354 241 318 210 140 186 Class C Fly Ash Weston (kgm3) 0 121 0 119 0 119 0 116 175 115
Powdered Gypsum Wallboard New (kgm3)
0 0 25 25 0 0 24 25 35 49
Water (kgm3) 171 151 181 153 189 164 199 176 166 171 Sand SSD (kgm3) 849 872 840 850 841 857 809 830 827 825
Crushed Stone 19-mm max SSD (kgm3)
1020 1050 1010 1020 1010 1030 971 999 994 994
Sodium Bicarbonate NaHCO3 (kgm3) 0 0 0 0 71 72 68 70 70 70 Water-Cementitious Ratio WCm 048 041 051 043 053 045 058 050 047 049
Slump (mm) 65 65 45 50 70 55 95 65 65 65 Air Content () 13 14 18 19 14 12 21 18 23 22
Air Temperature (degC) 23 23 22 22 23 23 23 23 23 23 Concrete Temperature (degC) 21 22 21 20 23 23 23 22 22 23
Density (kgm3) 2400 2440 2390 2380 2400 2420 2330 2360 2340 2350SSD Saturated surface-dry
27
Table 6-8 Mixture Proportions and Fresh Concrete Properties of Group 2 Preliminary Mixtures (Inch-Pound Units)
Mixture Designation C-1 CF-1 CN-1 CFN-1
CB-1 CFB-1
CNB-1
CFNB-1
CFNB-2
CFNB-3
Cement (lbyd3) 603 414 557 362 596 407 536 354 236 313 Class C Fly Ash Weston (lbyd3) 0 204 0 200 0 201 0 195 295 194
Powdered Gypsum Wallboard New (lbyd3)
0 0 42 42 0 0 40 41 59 82
Water (lbyd3) 288 255 305 258 318 276 336 296 279 289 Sand SSD (lbyd3) 1430 1470 1410 1430 1420 1440 1360 1400 1390 1390
Crushed Stone 34 in max SSD (lbyd3)
1720 1760 1700 1720 1700 1730 1640 1680 1670 1670
Sodium Bicarbonate NaHCO3 (lbyd3) 0 0 0 0 12 12 12 12 12 12 Water-Cementitious Ratio WCm 048 041 051 043 053 045 058 050 047 049
Slump (in) 2 12 2 12 1 34 2 2 34 2 14 3 34 2 12 2 12 2 12Air Content () 13 14 18 19 14 12 21 18 23 22
Air Temperature (degF) 74 73 72 72 73 74 73 74 73 73 Concrete Temperature (degF) 70 71 69 68 74 73 73 71 72 74
Density (lbft3) 150 152 149 149 150 151 145 147 146 146 SSD Saturated surface-dry Table 6-9 and Table 6-10 show test results for compressive strength of Group 2 concrete
mixtures When sodium bicarbonate was used in concrete containing new gypsum wallboard
the 1-day compressive strength of concrete improved but the 28-day compressive strength was
reduced When sodium bicarbonate was used in concrete made with cement (without fly ash or
gypsum) and in concrete made with cement and fly ash (without gypsum) the compressive
strength of concrete was reduced at all test ages of 1 7 and 28 days Unlike Mixture CFOS-3
from Group 1 the test cylinders did not develop any cracking
Table 6-9 Compressive Strength of Group 2 Preliminary Concrete Mixtures (MPa) Age (days) C-1 CF-1 CN-1 CFN-
1 CB-1 CFB-
1 CNB-
1 CFNB-1
CFNB-2
CFNB-3
1 106 60 74 32 90 57 76 57 36 48 7 308 330 236 323 228 202 231 283 265 21528 396 480 347 407 294 299 327 354 400 315
28
Table 6-10 Compressive Strength of Group 2 Preliminary Concrete Mixtures (psi) Age (days) C-1 CF-1 CN-1 CFN-
1 CB-1 CFB-
1 CNB-
1 CFNB-1
CFNB-2
CFNB-3
1 1540 870 1080 470 1310 820 1100 830 520 690 7 4470 4780 3430 4690 3310 2930 3350 4110 3850 312028 5740 6960 5030 5900 4270 4330 4740 5130 5800 4570
Fig 6-3 and Fig 6-4 show cylinders of some of the Group 2 concrete mixtures
Efflorescence on the surface of concrete was noted
Fig 6-3 Efflorescence on a Cylinder of Mixture CFNB-2 Left from Seven-day Compression Test
Fig 6-4 Efflorescence on a Cylinder of Mixture CFNB-3 Left from One-day Compression Test
63 Group 3 Preliminary Mixtures
Group 3 preliminary concrete mixtures were made with ldquoNewrdquo gypsum wallboard and using
half as much sodium sulfate as the original planned see Table 3-2 Mixture CFNS-6 was made
with only one-quarter of the sodium sulfate planned see Table 3-2
Table 6-11 to Table 6-13 show mixture proportions of Group 3 concrete mixtures Mixture
CFNS-1-1 and CFNS-1-2 were twin mixtures made using identical proportions They used the
same proportions of cement fly ash and gypsum wallboard as Mixture CFOS-2 of Group 1
except the source of gypsum wallboard and the amount of sodium sulfate
29
Mixtures CFNS-2-1 and CFNS-2-2 were also twin mixtures made using the same proportions
of cement fly ash and gypsum wallboard as Mixture CFOS-3 of Group 1 except the source of
gypsum wallboard and the amount of sodium sulfate
Efflorescence was observed on leftover concrete from Mixtures CFNS-1-1 CFNS-1-2
CFNS-2-1 CFNS-2-2 and CFNS-6
Table 6-11 Proportions of Powder Materials Used for Group 3 Preliminary Concrete Mixtures Mixture Designation C-3 CFNS-
1-1 CFNS-
1-2 CFNS-
2-1 CFNS-
2-2 CFNS-
6 Laboratory mixture designation Ref-4 New-
10 New-
11 New-
12 New-
13 New-
17 Cement (mass of Cm) 100 40 40 20 20 20 Fly Ash (mass of Cm) 0 50 50 60 60 60
New Gypsum Wallboard (mass of Cm) 0 10 10 20 20 20 Sodium Sulfate (mass of Cm) 0 1 1 2 2 1
Cm Cementitious materials (Cement + Fly Ash + Gypsum Wallboard)
Table 6-12 Mixture Proportions and Fresh Properties of Group 3 Preliminary Concrete Mixtures (SI [Metric] Units)
Mixture Designation C-3 CFNS-1-1
CFNS-1-2
CFNS-2-1
CFNS-2-2
CFNS-6
Cement (kgm3) 360 146 147 72 73 73 Class C Fly Ash Weston (kgm3) 0 182 184 217 220 218
Powdered Gypsum Wallboard New (kgm3) 0 36 37 72 73 73 Water (kgm3) 163 164 160 165 145 155
Sand SSD (kgm3) 853 854 861 848 862 855 Crushed Stone 19-mm max SSD (kgm3) 1030 1040 1050 1030 1050 1030
Sodium Sulfate Na2SO4 (kgm3) 0 36 37 72 73 36 Water-Cementitious Ratio WCm 045 045 044 046 039 043
Slump (mm) 50 50 55 40 45 25 Air Content () 18 hellip hellip hellip hellip hellip
Air Temperature (degC) 23 23 24 23 23 24 Concrete Temperature (degC) 22 hellip hellip hellip hellip hellip
Density (kgm3) 2400 2420 2440 2410 2430 2410 SSD Saturated surface-dry
30
Table 6-13 Mixture Proportions and Fresh Properties of Group 3 Preliminary Concrete Mixtures (Inch-Pound Units)
Mixture Designation C-3 CFNS-1-1
CFNS-1-2
CFNS-2-1
CFNS-2-2
CFNS-6
Cement (lbyd3) 606 245 247 122 124 122 Class C Fly Ash Weston (lbyd3) 0 307 309 365 371 367
Powdered Gypsum Wallboard New (lbyd3) 0 61 62 122 124 122 Water (lbyd3) 274 276 269 278 244 261
Sand SSD (lbyd3) 1440 1440 1450 1430 1450 1440 Crushed Stone 34 in max SSD (lbyd3) 1730 1750 1760 1730 1760 1740
Sodium Sulfate Na2SO4 (lbyd3) 0 6 6 12 12 6 Water-Cementitious Ratio WCm 045 045 044 046 039 043
Slump (in) 2 2 2 14 1 12 1 34 1 Air Content () 18 hellip hellip hellip hellip hellip
Air Temperature (degF) 74 74 76 74 73 76 Concrete Temperature (degF) 72 hellip hellip hellip hellip hellip
Density (lbft3) 150 151 152 150 151 150 SSD Saturated surface-dry Table 6-14 and Table 6-15 show the test results for compressive strength of Group 3 concrete
mixtures The strength of Mixtures CFNS-1-1 and CFNS-1-2 were not significantly lower than
that of Mixture CFOS-2 Also the strength of Mixtures CFNS-2-1 and CFNS-2-2 were not
significantly lower than that of Mixture CFOS-3 The strength of Mixtures CFNS-1-1 CFNS-1-
2 CFNS-2-1 and CFNS-2-2 were quite acceptable
Upon careful inspection it was noted that cylinders of Mixture CFNS-6 cracked by
themselves before reaching the age of seven days Cylinders of Mixtures CFNS-2-1 and CFNS-
2-2 must have cracked as well
31
Table 6-14 Compressive Strength of Group 3 Preliminary Concrete Mixtures (MPa) Age (days) C-3 CFNS-
1-1 CFNS-
1-2 CFNS-
2-1 CFNS-
2-2 CFNS-
6 1 117 23Dagger 22 19 19 12Dagger 7 303 247dagger 258dagger 96dagger 85dagger hellip 28 359 hellip hellip hellip hellip hellip
Dagger Average from testing two cylinders dagger Result from testing one cylinder The rest are averages from three tests Cylinders had cracked on their own
Table 6-15 Compressive Strength of Group 3 Preliminary Concrete Mixtures (psi) Age (days) C-3 CFNS-
1-1 CFNS-
1-2 CFNS-
2-1 CFNS-
2-2 CFNS-
6 1 1690 330Dagger 320 270 270 180Dagger 7 4390 3580dagger 3740dagger 1390dagger 1240dagger hellip 28 5210 hellip hellip hellip hellip hellip
Dagger Average from testing two cylinders dagger Result from testing one cylinder The rest are averages from three tests Cylinders had cracked on their own Based on the results of preliminary mixing and testing of concrete it was decided to make
final mixture CFNS-4 using the mixture proportions of Mixtures CFNS-1-1 and CFNS-1-2
Final mixture CFNS-5 was made using the mixture proportions of Mixtures CFNS-2-1 and
CFNS-2-2
32
CHAPTER 7 FINAL MIXTURES
In total eight final concrete mixtures were made to evaluate the slump retention time of
initial setting compressive strength and length change of concrete In addition mortar bars
were made for evaluation of sulfate resistance
71 Mixture Proportions
Table 7-1 presents the proportions of powder materials used for final concrete mixtures The
mixtures were made in two groups Group 1 Mixtures C-2 CN-2 CFN-2 and CFN-3 were
made using up to 20 fly ash and 20 powdered wallboard with water-reducing admixture and
without sodium sulfate Group 2 Mixtures Ref-5 CFNS-3 CFNS-4 and CFNS-5 were made
using up to 60 fly ash 20 powdered wallboard 2 sodium sulfate and without water-
reducing admixture Sodium sulfate was added as powder to a concrete mixture
Table 7-1 Proportions of Powder Materials Used for Final Concrete Mixtures Mixture Designation C-2 CN-2 CFN-
2 CFN-
3 C-4 CFN
S-3 CFNS-4
CFNS-5
Laboratory mixture designation Ref-3 New-7
New-8
New-9
Ref-5 New-14
New-15
New-16
Cement (mass of Cm) 100 90 70 60 100 60 40 20 Fly Ash (mass of Cm) 0 0 20 20 0 33 50 60
New Gypsum Wallboard (mass of Cm) 0 10 10 20 0 7 10 20 Sodium Sulfate (mass of Cm) 0 0 0 0 0 1 1 2
Cm Cementitious materials (Cement + Fly Ash + Gypsum Wallboard) The mixture proportions and fresh properties of the main concrete mixtures are presented in
Table 7-2 (in SI units) and Table 7-3 (in inch-pound units) To evaluate retention of slump
slump was measured twice (1) immediately after mixing was done and (2) 30 minutes later In
general the concrete mixtures retained their workability
33
Table 7-2 Mixture Proportions and Fresh Concrete Properties of Final Mixtures (SI [Metric] Units) Mixture Designation C-2 CN-2 CFN-
2 CFN-
3 C-4 CFN
S-3 CFNS-4
CFNS-5
Cement (kgm3) 362 316 249 212 365 217 144 71 Class C Fly Ash Weston (kgm3) 0 0 71 71 0 119 180 213
Powdered Gypsum Wallboard New (kgm3) 0 35 35 71 0 25 36 71 Water (kgm3) 164 164 170 153 163 154 153 157
Sand SSD (kgm3) 856 830 840 835 861 854 852 839 Crushed Stone 19-mm max SSD (kgm3) 1030 999 1010 1010 1030 1030 1020 1010
Sodium Sulfate Na2SO4 (kgm3) 0 0 0 0 0 36 36 71 Water-Reducing Admixture (Lm3) 0 103 104 104 0 0 0 0 Water-Cementitious Ratio WCm 045 047 048 043 045 043 042 044
Slump (mm) 55 50 40 30 30 40 45 25 Slump 30 minutes later (mm) 30 40 25 20 40 30 15 15
Air Content () 18 37 26 32 14 22 15 17 Air Temperature (degC) 23 24 23 24 23 23 23 24
Concrete Temperature (degC) 23 23 23 25 24 24 25 25 Density (kgm3) 2410 2340 2380 2350 2420 2400 2390 2370
SSD Saturated surface-dry
Table 7-3 Mixture Proportions and Fresh Concrete Properties of Final Mixtures (Inch-Pound Units)
Mixture Designation C-2 CN-2 CFN-2
CFN-3
C-4 CFNS-3
CFNS-4
CFNS-5
Cement (lbyd3) 610 532 419 357 614 366 243 120 Class C Fly Ash Weston (lbyd3) 0 0 120 119 0 201 303 359
Powdered Gypsum Wallboard New (lbyd3) 0 59 59 119 0 43 61 120 Water (lbyd3) 276 276 287 257 274 259 257 264
Sand SSD (lbyd3) 1440 1400 1410 1410 1450 1440 1430 1410Crushed Stone 34 in max SSD (lbyd3) 1730 1680 1700 1690 1740 1730 1720 1700
Sodium Sulfate Na2SO4 (lbyd3) 0 0 0 0 0 6 6 12 Water-Reducing Admixture (fl ozyd3) 0 265 269 268 0 0 0 0
Water-Cementitious Ratio WCm 045 047 048 043 045 043 042 044Slump (in) 2 14 2 1 12 1 14 1 14 1 12 1 34 1
Slump 30 minutes later (in) 1 14 1 12 1 34 1 12 1 14 12 12 Air Content () 18 37 26 32 14 22 15 17
Air Temperature (degF) 73 75 74 75 74 74 74 75 Concrete Temperature (degF) 73 74 74 77 75 76 77 77
Density (lbft3) 150 146 148 146 151 150 149 148 SSD Saturated surface-dry
72 Time of Initial Setting
Table 7-4 presents test results of the time of initial setting final concrete mixtures It took
about twice as long for the mixtures containing fly ash and powdered gypsum wallboard to reach
34
initial setting as their reference concrete mixtures It is well known that concrete mixtures
containing large amount of fly ash may show delayed setting
Table 7-4 Time of Initial Setting of Final Concrete Mixtures Mixture Designation C-2 CN-2 CFN-
2 CFN-
3 C-4 CFN
S-3 CFNS-4
CFNS-5
Time of Initial Setting (hours) 48 72 114 120 47 98 118 105
73 Compressive Strength
Compressive strength test results for final concrete mixtures are shown in Table 7-5 (in
MPa) Table 7-6 (in psi) Fig 7-1 and Fig 7-2
Table 7-5 Compressive Strength of Final Concrete Mixtures (MPa) Age (days) C-2 CN-2 CFN-
2 CFN-
3 C-4 CFN
S-3 CFNS-4
CFNS-5
1 168 111 42 39 159 58 38 24 3 301 197 174 132 302 237 178 79 7 354 232 265 154 347 301 297 12528 448 285 414 211 408 415 420 hellip 91 508 419 501 289 515 443 497 hellip
Cylinders had already cracked on their own before testing started
Table 7-6 Compressive Strength of Final Concrete Mixtures (psi) Age (days) C-2 CN-2 CFN-
2 CFN-
3 C-4 CFN
S-3 CFNS-4
CFNS-5
1 2430 1610 610 560 2310 840 550 350 3 4360 2860 2520 1910 4380 3440 2580 11407 5140 3370 3850 2240 5040 4370 4310 1810
28 6500 4140 6000 3060 5920 6020 6090 hellip 91 7370 6070 7270 4190 7470 6430 7210 hellip
Cylinders had already cracked on their own before testing started
35
0
10
20
30
40
50
60
1 10 100
Age (days)
Com
pres
sive
Str
engt
h (M
Pa)
0
1000
2000
3000
4000
5000
6000
7000
8000
(psi
)
Ref-3New-7New-8New-9
Fig 7-1 Compressive Strength of Final Concrete Mixtures Group 1
The mixtures CN-2 CFN-2 and CFN-3 showed lower compressive strength than C-2
Mixture CFN-2 showed structural-grade strength of 265 MPa (3850 psi) at seven days and a
relatively high compressive strength of 41 MPa (6000 psi) at 28 days Mixture CN-2 showed
structural-grade strength of 285 MPa (4140 psi) at 28 days
0
10
20
30
40
50
60
1 10 100
Age (days)
Com
pres
sive
Str
engt
h (M
Pa)
0
1000
2000
3000
4000
5000
6000
7000
8000
(psi
)
Ref-5New-14New-15New-16
Fig 7-2 Compressive Strength of Final Concrete Mixtures Group 2
36
As early as at seven days the mixtures CFNS-3 and CFNS-4 showed structural-grade
strength of 301 MPa (4370 psi) and 297 MPa (4310 psi) This is noteworthy considering the
fact that Mixtures CFNS-3 and CFNS-4 were made by replacing 40 and 60 of cement with
blends of fly ash and powdered gypsum wallboard At the age of 28 days the mixtures CFNS-3
and CFNS-4 reached compressive strength of 415 MPa (6020 psi) and 420 MPa (6090 psi) and
became as strong as Mixture Ref-5
The cylinders made from Mixture CFNS-5 cracked on their own before reaching the age of
seven days (Fig 7-3) This was attributed to an excessive expansive reaction resulting from use
of the particular proportions of cement fly ash powdered gypsum wallboard and sodium sulfate
in Mixture CFNS-5 Mixture CFNS-6 was made using half as much sodium sulfate (1 of
cementitious materials) as CFNS-5 nonetheless cylinders made from Mixture CFNS-6 cracked
before reaching the age of seven days
Fig 7-3 Cracked Cylinders of Concrete Mixtures CFNS-5 and CFNS-6
37
74 Length Change
Test results for length change of final concrete mixtures are shown in Table 7-7 Fig 7-5
and Fig 7-6
Table 7-7 Length Change of Final Concrete Mixtures () Age (days) C-2 CN-2 CFN-2 CFN-3 C-4 CFNS-
3 CFNS-
4 CFNS-
5 1 0 0 0 0 0 0 0 0 3 -0001 0010 0015 0018 0000 0006 0041 0359 7 -0003 0013 0031 0036 0004 0005 0039 1708
28 0004 0026 0033 0116 0002 0010 0043 hellip 32 -0010 0009 0012 0098 -0007 -0007 0030 hellip 35 -0015 0003 0009 0089 -0013 -0013 0025 hellip 42 -0022 -0003 -0002 0077 -0018 -0020 0020 hellip 56 -0028 -0020 -0004 0057 -0024 -0028 0014 hellip 84 -0033 -0027 -0010 0037 -0031 -0035 0011 hellip 140 -0036 -0035 -0017 0027 -0035 -0035 0006 hellip
Specimens had cracked on their own All of the concrete mixtures made with powdered gypsum wallboard showed higher
expansion than their reference concrete mixtures during immersion in saturated limewater
Mixture CFN-3 containing 20 fly ash and 20 powdered gypsum wallboard showed a large
expansion (0120) Specimens made from Mixture CFNS-5 containing 60 fly ash and 20
powdered gypsum wallboard showed excessive expansion and they cracked before reaching the
age of seven days (Fig 7-4)
38
Fig 7-4 Length-Change Specimen of Concrete
Mixture CFNS-5 Showing a Crack
-004
-002
000
002
004
006
008
010
012
0 30 60 90 120 150
Age (days)
Leng
th C
hang
e (
)
Ref-3New-7New-8New-9
Fig 7-5 Length Change of Final Concrete Mixtures Group 1
During drying Mixture CN-2 and CFN-3 made by using high proportions of powdered
gypsum wallboard to fly ash shrunk by greater extents than Mixture C-2 At the age of 140
days the net shrinkage of Mixture CN-2 was 0035 which was approximately the same as that
of C-2 0036 Mixture CFN-3 showed a net expansion of 0027 at 140 day Mixture CFN-2
shrunk by approximately the same amount as Mixture C-2 resulting in a net shrinkage of
0017 at 140 days
39
-004
-002
000
002
004
006
008
010
012
0 30 60 90 120 150
Age (days)
Leng
th C
hang
e (
)
Ref-5New-14New-15New-16
Fig 7-6 Length Change of Final Concrete Mixtures Group 2
The length change of Mixture CFNS-3 (made with 60 cement 33 fly ash and 7
powdered gypsum wallboard) was approximately the same as that of Mixture Ref-5 Mixture
CFNS-4 (made with 40 cement 50 fly ash and 10 powdered gypsum wallboard) showed a
relatively large expansion (0043) during immersion in saturated limewater and shrunk during
drying as much as it had expanded resulting in very small net expansion of 0006 at the age of
140 days This concrete mixture could be used to minimize drying shrinkage cracking of
concrete Mixture CFNS-4 could be used to minimize drying shrinkage cracking of concrete
75 Sulfate Resistance
Mortar cubes and bars were made using the same proportions of cement fly ash and gypsum
wallboard as the final concrete mixtures Ref-5 CFNS-3 and CFNS-4 No mortar mixture was
made using the powder-materials proportions of concrete mixture CFNS-5 because it was
anticipated that such mortar would crack
Table 7-8 shows the proportions of the mortar mixtures produced
40
Table 7-8 Mixture Proportions and Flow of Mortar Mixtures Mixture Designation C-c C-b CFNS-1c CFNS-1b CFNS-2c CFNS-2b
Laboratory mixture designation C-2 cube C-2 bar N-3 cube N-3 bar N-4 cube N-4 barCement (mass of Cm) 100 100 60 60 40 40 Fly Ash (mass of Cm) 0 0 33 33 50 50
New Gypsum Wallboard (mass of Cm) 0 0 7 7 10 10 Sodium Sulfate (mass of Cm) 0 0 1 1 1 1
Cement (g) 500 740 300 444 200 296 Class C Fly Ash Weston (g) 0 0 165 2442 250 370
Powdered Gypsum Wallboard New (g) 0 0 35 518 50 74 Sodium Sulfate Na2SO4 (g) 0 0 5 74 5 76
Water (g) 242 359 216 3204 200 2967 Water-Cementitious Ratio WCm 0484 0485 0432 0433 0400 0401
Graded Standard Sand (g) 1375 2035 1375 2035 1375 2035 Flow (mm) 190 hellip 185 hellip 191 hellip
Cm Cementitious materials (Cement + Fly Ash + Gypsum Wallboard) Table 7-9 and Table 7-10 show test results for the compressive strength of mortar mixtures
It took approximately 15 days for Mixture C-c to attain a compressive strength of 20 MPa
(2900 psi) For Mixture N-3 it took 47 days and for Mixture N-4 7 days
Table 7-9 Compressive Strength of Mortar (MPa) Age (days) C-c CFNS-1c CFNS-2c
1 148 45 11 4 314 174 111 5 hellip 212 hellip
5125 hellip hellip 167 7 hellip hellip 197 24 hellip hellip 250 28 396 316
Note These results are averages obtained from testing two cubes for each mixture at each test age
Table 7-10 Compressive Strength of Mortar (psi) Age (days) C-c CFNS-1c CFNS-2c
1 2140 650 160 4 4550 2530 1610 5 hellip 3070 hellip
5125 hellip hellip 2420 7 hellip hellip 2850 24 hellip hellip 3630 28 5750 4580 hellip
Note These results are averages obtained from testing two cubes at each test age for each mixture
41
0
5
10
15
20
25
30
35
40
45
0 5 10 15 20 25 30Age (days)
Com
pres
sive
Str
engt
h (p
si)
0
1000
2000
3000
4000
5000
6000
(MP
a)
C-2N-3N-4
Fig 7-7 Compressive Strength of Mortar Cubes
Once the mixture attained the specified compressive strength of 20 MPa (2900 psi) the
mortar bars were immersed in a 5 sodium sulfate solution and length change of the bars were
measured after specified periods to assess sulfate resistance of mortar mixtures Table 7-11 and
Fig 7-8 show test results for length change of mortar bars A larger expansion implies a lower
resistance of mortar mixture to sulfate attack and a smaller expansion implies a higher resistance
to sulfate attack
Table 7-11 Length Change of Mortar Bars () Age after immersion in 5 sodium sulfate
solution (days) C-b CFNS-1b CFNS-2b
0 0 0 0 7 0007 0016 0006 14 0013 0024 0009 21 0016 0028 0009 28 0020 0033 0009 42 0027 0044 0011 56 0034 0063 0010
Number of specimens tested C-b five N-1-b six and N-2-b three
42
000
001
002
003
004
005
006
007
0 7 14 21 28 35 42 49 56 63
Days after immersion in Na2SO4 solution
Len
gth
Cha
nge
()
C-bCFNS-1bCFNS-2b
Fig 7-8 Length Change of Mortar Bars in 5 Sodium Sulfate Solution
After 56 days of immersion in sodium sulfate solution Mixture C-b (Control) showed an
expansion of approximately 0034 Mixture N-3 (made with 33 fly ash and 7 powdered
gypsum wallboard and 1 sodium sulfate) shows an expansion of 0063 which was
approximately 19 times that of Mixture C-b Mixture N-4 (made with 50 fly ash 10
powdered gypsum wallboard and 1 sodium sulfate) showed an expansion of 0010 which is
significantly lower than that of Mixture C-b (Control) This means that Mixture N-4 possesses
significantly higher resistance to sulfate attack than Mixture C-b Importantly the expansion of
mortar bars made from Mixture N-4 stabilized after 14 days of immersion in sodium sulfate
solution
76 Summary
Table 7-12 shows a summary of proportions of powder materials and properties of final
concrete mixtures Table 7-13 shows a summary of proportions and length change in sulfate
solution of mortar mixtures
43
Table 7-12 Proportions of Powder Materials and Properties of Final Concrete Mixtures Mixture Designation C-2 CN-2 CFN-2 CFN-3 C-4 CFNS-
3 CFNS-
4 CFNS-
5 Cement (mass of Cm) 100 90 70 60 100 60 40 20 Fly Ash (mass of Cm) 0 0 20 20 0 33 50 60
New Gypsum Wallboard (mass of Cm) 0 10 10 20 0 7 10 20 Sodium Sulfate (mass of Cm) 0 0 0 0 0 1 1 2
Time of Initial Setting (hours) 48 72 114 120 47 98 118 105 Compressive Strength (MPa)
1-day 168 111 42 39 159 58 38 24 3-day 301 197 174 132 302 237 178 79 7-day 354 232 265 154 347 301 297 125
28-day 448 285 414 211 408 415 420 hellip 91-day 508 419 501 289 515 443 497 hellip
Compressive Strength (psi) 1-day 2430 1610 610 560 2310 840 550 350 3-day 4360 2860 2520 1910 4380 3440 2580 1140 7-day 5140 3370 3850 2240 5040 4370 4310 1810
28-day 6500 4140 6000 3060 5920 6020 6090 hellip 91-day 7370 6070 7270 4190 7470 6430 7210 hellip
Length Change () 1-day 0 0 0 0 0 0 0 0 7-day -0003 0013 0031 0036 0004 0005 0039 1708
28-day 0004 0026 0033 0116 0002 0010 0043 hellip 140-day -0036 -0035 -0017 0027 -0035 -0035 0006 hellip
Cm Cementitious materials (Cement + Fly Ash + Gypsum Wallboard) Specimens had cracked on their own
Table 7-13 Proportions of Powder Materials and Length Change in Sulfate Solution of Mortar Mixtures
Mixture Designation C-b CFNS-1b
CFNS-2b
Laboratory mixture designation Cement (mass of Cm) 100 60 40 Fly Ash (mass of Cm) 0 33 50
New Gypsum Wallboard (mass of Cm) 0 7 10 Sodium Sulfate (mass of Cm) 0 1 1
Length Change in 5 Sodium Sulfate Solution () 0-day 0 0 0 7-day 0007 0016 0006
14-day 0013 0024 0009 21-day 0016 0028 0009 28-day 0020 0033 0009 42-day 0027 0044 0011 56-day 0034 0063 0010
44
Table 7-14 shows a summary of properties of selected promising main concrete mixtures
Mixtures CFN-2 CFNS-3 and CFNS-4 were comparable to their reference concrete mixtures in
compressive strength at the ages of 7 days and later Based on the sulfate resistance of Mortar
N-4 it is expected that concrete Mixture CFNS-4 will also possess high resistance to sulfate
attack
Table 7-14 Summary of Proportions and Properties of Selected Final Concrete Mixtures and Mortar Mixtures
Mixture Designation C-4 CFN-2 CFNS-3
CFNS-4
Cement (mass of Cm) 100 70 60 40 Fly Ash (mass of Cm) 0 20 33 50
New Gypsum Wallboard (mass of Cm) 0 10 7 10 Sodium Sulfate (mass of Cm) 0 0 1 1
Time of Initial Setting (hours) 47 114 98 118 Compressive Strength (MPa)
1-day 159 42 58 38 3-day 302 174 237 178 7-day 347 265 301 297
28-day 408 414 415 420 91-day 515 501 443 497
Compressive Strength (psi) 1-day 2310 610 840 550 3-day 4380 2520 3440 2580 7-day 5040 3850 4370 4310
28-day 5920 6000 6020 6090 91-day 7470 7270 6430 7210
Length Change () 1-day 0 0 0 0
28-day 0002 0033 0010 0043 140-day -0035 -0017 -0035 0006
28-day Length Change of Mortar in 5 Sodium Sulfate Solution ()
0020 hellip 0033 0009
Cm Cementitious materials (Cement + Fly Ash + Gypsum Wallboard)
45
CHAPTER 8 ECONOMIC IMPACT ANALYSIS OF FULL-
SCALE IMPLEMENTATION
It is estimated that over 80000 tons of gypsum wallboard is disposed of each year from new
construction and demolition in Wisconsin If a tipping fee plus handling and transportation cost
of $30 per ton is assumed the disposal of gypsum wallboard costs Wisconsin citizens and
industry approximately $24 million dollars each year
Based on figures from the National Ready-Mixed Concrete Association Wisconsin produced
approximately 11 million cubic yards (84 million m3) of concrete in 2004 Based on a cement
content of 400 pounds per cubic yard (240 kgm3) of concrete 22 million tons of cement is used
in concrete each year in Wisconsin
This project showed that powdered gypsum wallboard could constitute approximately 10
of total cementitious materials used in a concrete mixture If this new cementitious material was
used in 20 of the concrete produced in Wisconsin approximately 44000 tons of gypsum
wallboard can be used In other words approximately half of the gypsum wallboard waste
generated in Wisconsin could be used in this application alone This would save Wisconsin
industry $13 million dollars each year in avoided disposal costs leading to reduce the cost for
concrete construction in Wisconsin Citizens would benefit also by reducing landfilling cost for
municipalities and increasing recycling rates of useful materials If 40 of the concrete
generated in Wisconsin used this new concrete mixture technology all of the waste gypsum
wallboard generated in Wisconsin could be used in this one application Therefore all 80000
tons of waste gypsum wallboard could be diverted from Wisconsin landfills It would save
Wisconsin citizens and industry over $24 million dollars each year in avoided disposal cost
46
This economic impact does not include incalculable dollar-benefits due to avoided possible
future environmental impact of sending such large quantities of gypsum wallboard into landfills
This project also showed that up to 60 of cement in concrete mixtures could be replaced
with a blend of Class C fly ash and gypsum wallboard Cement is a valuable commodity If it is
assumed that cement sells at $100 per ton and Class C fly ash sells at $50 per ton use of a
cementitious blend consisting of 40 cement 50 Class C fly ash and 10 powdered gypsum
in producing 40 of concrete in Wisconsin would result in savings on cement of about $50
million and expenditure on fly ash of about $20 million with a net savings of about $30 million
each year
Saving cement through this new technology would also reduce emissions of carbon dioxide
and other GHGs because production of one ton of cement releases about one ton of GHGs If
this new technology to use a blend of Class C fly ash and gypsum wallboard as a replacement of
cement were implemented in producing up to 40 of concrete in Wisconsin it would reduce the
GHG emissions by up to 12 million tons each year CO2 credits currently sell for about $20 per
ton Therefore CO2 credits would be worth $10 million each year
With a potential total value of $24 million in avoided disposal costs $30 million in savings
resulting from cement replacement plus $10 million in CO2 credits total economic benefit to
Wisconsin that could be generated by this project may be valued at about $42 million each year
47
CHAPTER 9 CONCLUSIONS
This project showed that from 30 to 60 of cement in concrete mixtures could be
successfully replaced with blends of Class C fly ash and powdered gypsum wallboard Several
concrete mixtures made by such replacements showed compressive strength nearly as high as
that of Reference concrete mixtures (without replacement of cement) at seven days The 28-day
compressive strength of these concrete mixtures containing fly ash and gypsum wallboard were
equivalent to that of Reference concrete mixtures Use of sodium sulfate as an activator was
essential in improving the 1-day and 3-day strength of concrete containing Class C fly ash and
gypsum wallboard
A concrete mixture made with a cementitious blend of 40 cement 50 Class C fly ash
and 10 powdered gypsum wallboard showed a relatively large expansion (0043) during
immersion in saturated limewater and shrunk during drying as much as it had expanded
resulting in very small net expansion at the age of 140 days This concrete mixture could be
used to minimize drying shrinkage cracking and subsequent increase in durability of concrete
A mortar mixture made with a cementitious blend of 40 cement 50 Class C fly ash and
10 powdered gypsum wallboard showed much higher resistance to sulfate attack compared
with Reference mortar (without replacement of cement)
Total economic benefit to Wisconsin that could be generated by this project may be valued at
up to about $42 million each year
48
CHAPTER 10 REFERENCES
ASTM C 33-03 ldquoStandard Specification for Concrete Aggregatesrdquo ASTM International West Conshohocken PA 11 pp
ASTM C 150-05 ldquoStandard Specification for Portland Cementrdquo ASTM International West Conshohocken PA 8 pp
ASTM C 192 C 192M-05 ldquoStandard Practice for Making and Curing Concrete Test Specimens in the Laboratoryrdquo 8 pp
ASTM C 494C 494M-05a ldquoStandard Specification for Chemical Admixtures for Concreterdquo ASTM International West Conshohocken PA 10 pp
ASTM C 618-03 ldquoStandard Specification for Coal Fly Ash and Raw or Calcined Natural Pozzolan for Use in Concreterdquo ASTM International West Conshohocken PA 3 pp
ASTM C 1012-04 ldquoStandard Test Method for Length Change of Hydraulic-Cement Mortars Exposed to a Sulfate Solutionrdquo ASTM International West Conshohocken PA 6 pp
Aimin X and Sarkar S L ldquoMicrostructural Study of Gypsum Activated Fly Ash Hydration in Cement Pasterdquo Cement and Concrete Research Vol 21 1991 pp 1137-1147
Drywallrecyclingorg lthttpwwwdrywallrecyclingorggt (February 2006)
EPA Presentation by the US Environmental Protection Agency at the Massachusetts DEP Gypsum Workgroup March 18 2004
Freeman R B and Carrasquillo R L ldquoProduction of Sulfate-Resistant Concrete Containing High-Calcium Fly Ash and Sodium Sulfate Admixturerdquo Proceedings of Fifth CANMETACI International Conference on Fly Ash Silica Fume Slag and Natural Pozzolans in Concrete ACI SP-153 Vol 1 1995 pp 153-176
ICF Northwest ldquoCalcium Spray Dryer Waste Management Design Guidelinesrdquo EPRI (Electric Power Research Institute) Report No CS-5312 September 1987 p 3-3
Krocak R F Meininger R and Yost P A Chapter 21 ldquoBeneficial Reuse of Aggregate Mineral Fines and Scrap New Construction Wallboardrdquo Land Application of Agricultural Industrial and Municipal By-Products (6) James F Powers and Warren P Dick ed SSSA Number 6 in the Soil Science Society of America Book Series ISBN 0-89118-834-7 Item Number 60901 2000 653 pages
Kumar P K and Monteiro P J M ldquoConcrete Microstructure Properties and Materialsrdquo 2nd Ed McGraw-Hill 1993
Lafarge Group ltwwwlafargecomgt (February 2006)
49
Ma W Liu C Brown P W and Komarneni S ldquoPore Structures of Fly Ashes Activated By Ca(OH)2 and CaSO42H2Ordquo Cement and Concrete Research Vol 25 No 2 1995 pp 417-425
McCall R ldquoWasteCap Wisconsin Drywall-To-Fertilizer Projectrdquo Final Report for the US Environmental Protection Agency August 1993
Merritt F S and Ricketts J T editors Building Design and Construction Handbook McGraw Hill 6th Ed 2001 pp 435-438
Mindness S Young J F and Darwin D ldquoConcreterdquo 2nd Ed Prentice Hall 2002
Naik T R Kraus R N Chun Y-m and Nageotte S O ldquoCoal-Combustion Bottom Ash for Reducing the Shrinkage of Concrete Made With Portland Cement and Sulfoaluminate Cementrdquo Jean Pera Symposium on Specialty Cements and Sustainability Issues a part of the proceedings of the Ninth CANMETACI International Conference on Recent Advances in Concrete Technology Warsaw Poland May 2007 pp 141-155
Neville A ldquoProperties of Concreterdquo 4th Ed Longman 1995
Pera J and Ambroise J ldquoNew Applications of Calcium Sulfoaluminate Cementrdquo Cement and Concrete Research Vol 34 No 4 April 2004 pp 671-676
Prusinski J R and Carrasquillo R L ldquoUsing Medium- to High-Volume Fly Ash Blended Cements to Improve the Sulfate Resistance of High-Lime Fly Ash Concreterdquo Proceedings of Fifth CANMETACI International Conference on Fly Ash Silica Fume Slag and Natural Pozzolans in Concrete ACI SP-153 Vol 1 1995 pp 43-65
Reindl J R ldquoBibliography of Gypsum Drywallrdquo available on the WasteCap Wisconsin website httpwwwwastecapwiorg August 2002 73 pages
WI-DNR ldquoSubstituting Waste Gypsum Wallboard for Agricultural Gypsumrdquo Wisconsin Department of Natural Resources Bureau of Waste Management DNR Publication WA-607-04 rev 2005
Wolkowski R ldquoDemonstration of Land Application of Crushed Gypsum Wallboard Waste for Alfalfardquo Final report to the Wisconsin Department of Natural Resources Waste Reduction and Recycling Grant Program and Dane County Department of Public Works August 12 1998
Wolkowski R P ldquoUsing Recycled Wallboard for Crop Production (A3782)rdquo WasteCap Wisconsin Inc 2003
Wu Z and Naik T R ldquoUse of Clean Coal Ash as Setting Time Regulator in Portland Cementrdquo Proceedings of the Fifth CANMETACI International Conference on Recent Advances in Concrete Technology Supplementary Papers 2001 pp 83-94
50
Wu Z and Naik T R ldquoProperties of Concrete Produced from Multicomponent Blended Cementsrdquo Cement and Concrete Research Vol 32 2002 pp 1937-1942
Wu Z and Naik T R ldquoChemically Activated Blended Cementsrdquo ACI Materials Journal September-October 2003 pp 434-440
- 08 Naik Chun cover
- 08 MIL NaikGypsumWallboard in concrete
-
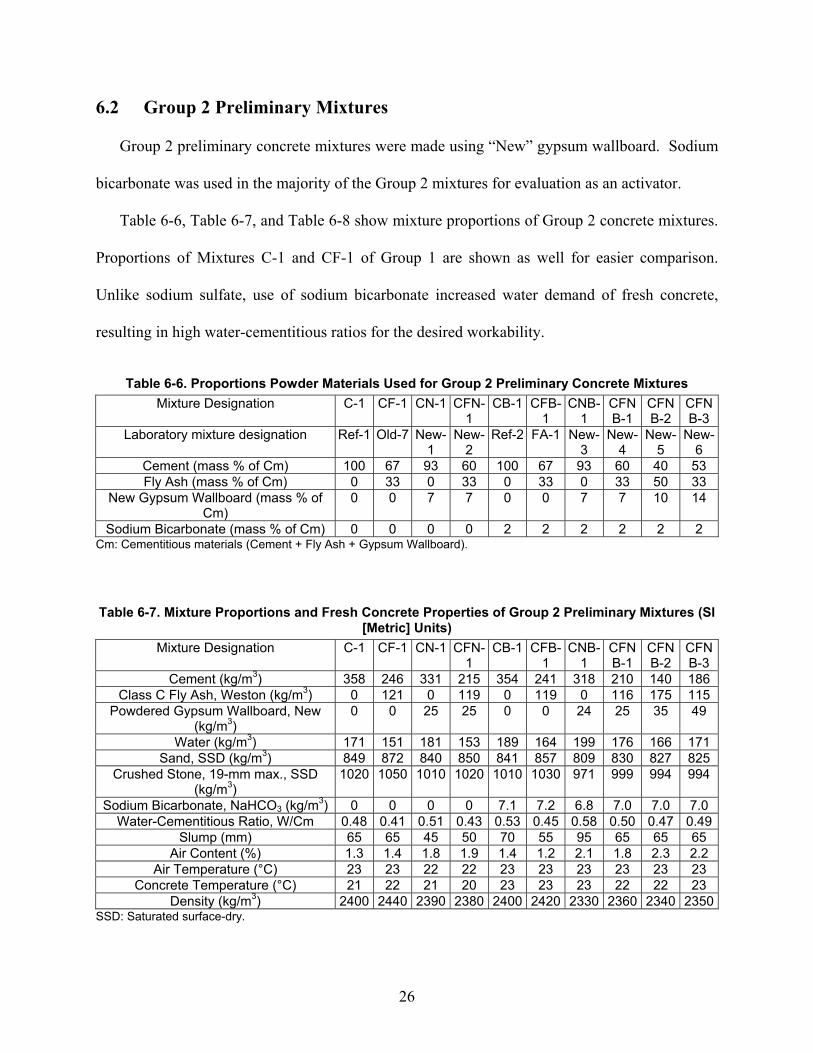
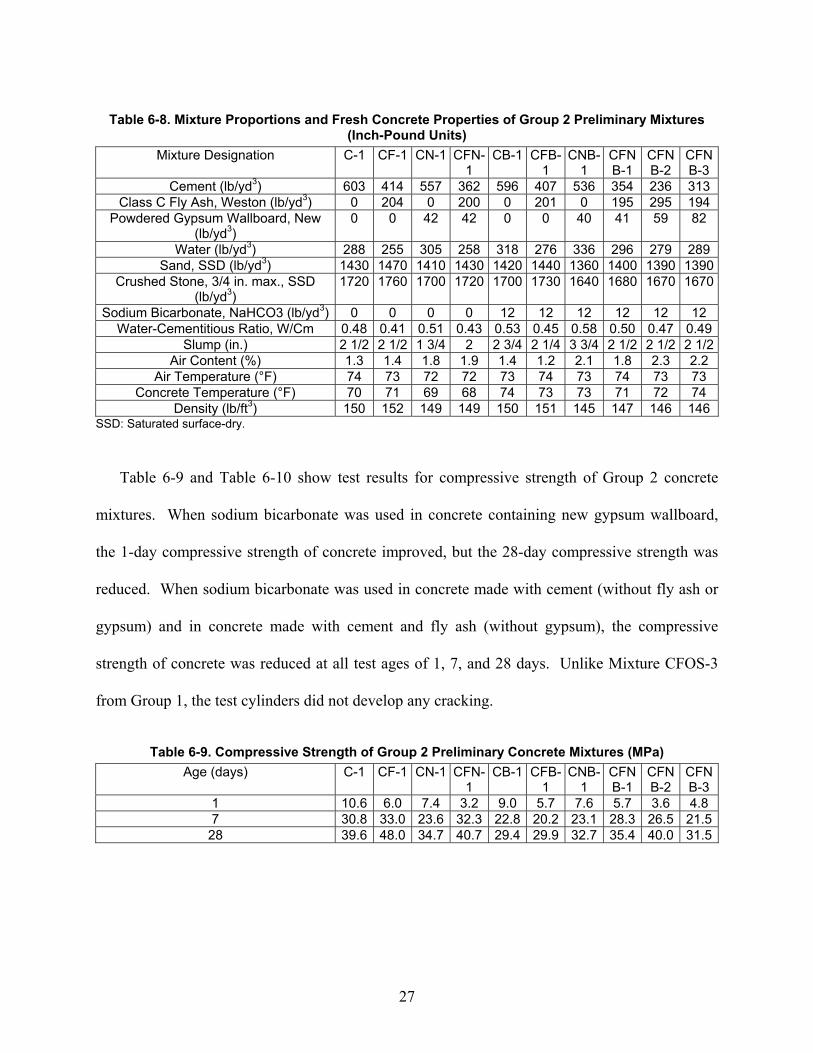
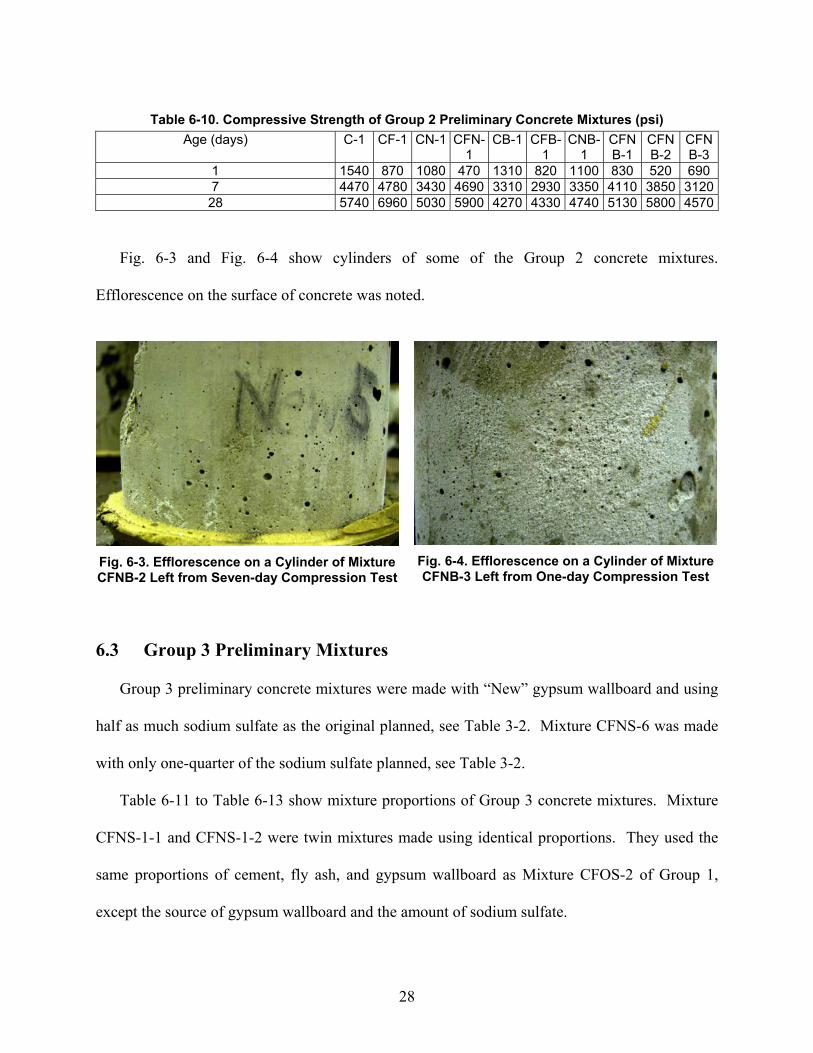
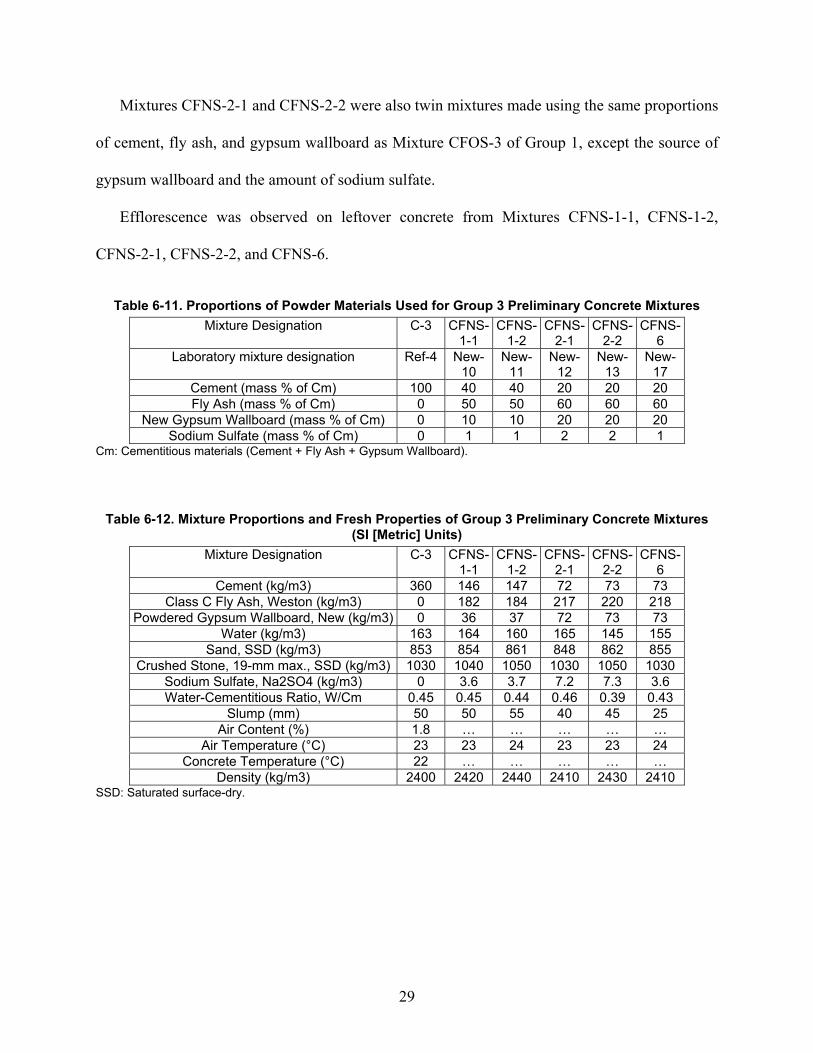
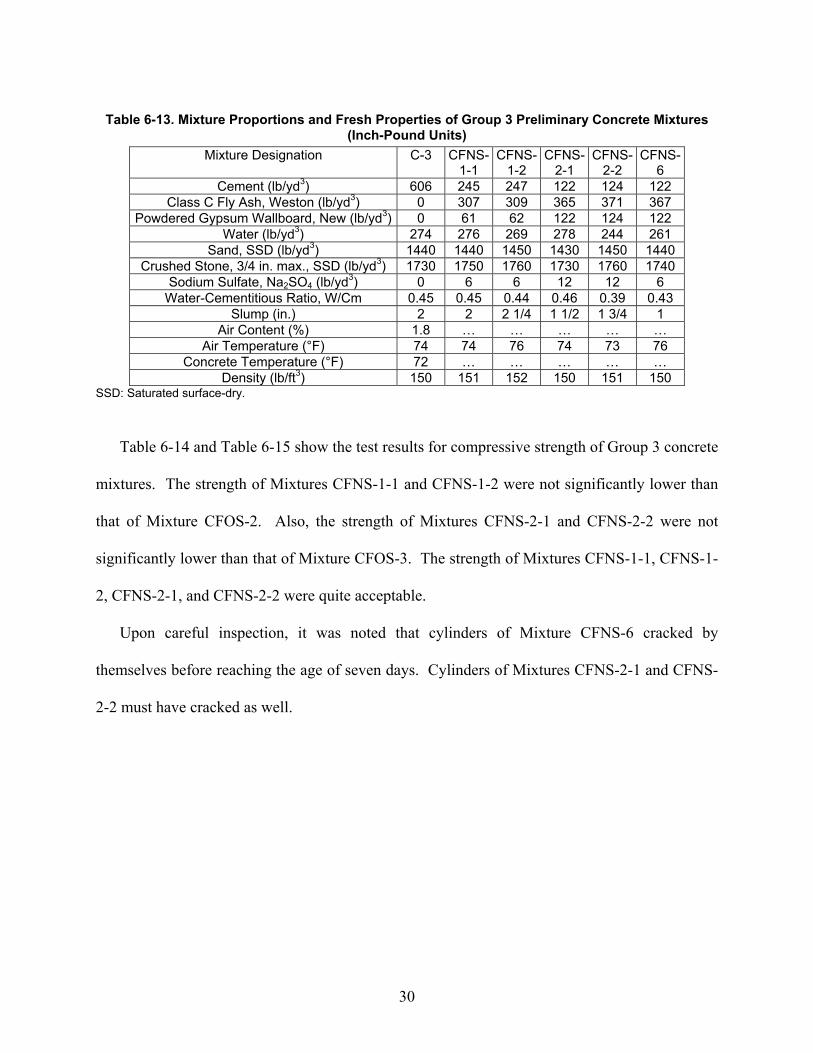
30
Table 6-13 Mixture Proportions and Fresh Properties of Group 3 Preliminary Concrete Mixtures (Inch-Pound Units)
Mixture Designation C-3 CFNS-1-1
CFNS-1-2
CFNS-2-1
CFNS-2-2
CFNS-6
Cement (lbyd3) 606 245 247 122 124 122 Class C Fly Ash Weston (lbyd3) 0 307 309 365 371 367
Powdered Gypsum Wallboard New (lbyd3) 0 61 62 122 124 122 Water (lbyd3) 274 276 269 278 244 261
Sand SSD (lbyd3) 1440 1440 1450 1430 1450 1440 Crushed Stone 34 in max SSD (lbyd3) 1730 1750 1760 1730 1760 1740
Sodium Sulfate Na2SO4 (lbyd3) 0 6 6 12 12 6 Water-Cementitious Ratio WCm 045 045 044 046 039 043
Slump (in) 2 2 2 14 1 12 1 34 1 Air Content () 18 hellip hellip hellip hellip hellip
Air Temperature (degF) 74 74 76 74 73 76 Concrete Temperature (degF) 72 hellip hellip hellip hellip hellip
Density (lbft3) 150 151 152 150 151 150 SSD Saturated surface-dry Table 6-14 and Table 6-15 show the test results for compressive strength of Group 3 concrete
mixtures The strength of Mixtures CFNS-1-1 and CFNS-1-2 were not significantly lower than
that of Mixture CFOS-2 Also the strength of Mixtures CFNS-2-1 and CFNS-2-2 were not
significantly lower than that of Mixture CFOS-3 The strength of Mixtures CFNS-1-1 CFNS-1-
2 CFNS-2-1 and CFNS-2-2 were quite acceptable
Upon careful inspection it was noted that cylinders of Mixture CFNS-6 cracked by
themselves before reaching the age of seven days Cylinders of Mixtures CFNS-2-1 and CFNS-
2-2 must have cracked as well
31
Table 6-14 Compressive Strength of Group 3 Preliminary Concrete Mixtures (MPa) Age (days) C-3 CFNS-
1-1 CFNS-
1-2 CFNS-
2-1 CFNS-
2-2 CFNS-
6 1 117 23Dagger 22 19 19 12Dagger 7 303 247dagger 258dagger 96dagger 85dagger hellip 28 359 hellip hellip hellip hellip hellip
Dagger Average from testing two cylinders dagger Result from testing one cylinder The rest are averages from three tests Cylinders had cracked on their own
Table 6-15 Compressive Strength of Group 3 Preliminary Concrete Mixtures (psi) Age (days) C-3 CFNS-
1-1 CFNS-
1-2 CFNS-
2-1 CFNS-
2-2 CFNS-
6 1 1690 330Dagger 320 270 270 180Dagger 7 4390 3580dagger 3740dagger 1390dagger 1240dagger hellip 28 5210 hellip hellip hellip hellip hellip
Dagger Average from testing two cylinders dagger Result from testing one cylinder The rest are averages from three tests Cylinders had cracked on their own Based on the results of preliminary mixing and testing of concrete it was decided to make
final mixture CFNS-4 using the mixture proportions of Mixtures CFNS-1-1 and CFNS-1-2
Final mixture CFNS-5 was made using the mixture proportions of Mixtures CFNS-2-1 and
CFNS-2-2
32
CHAPTER 7 FINAL MIXTURES
In total eight final concrete mixtures were made to evaluate the slump retention time of
initial setting compressive strength and length change of concrete In addition mortar bars
were made for evaluation of sulfate resistance
71 Mixture Proportions
Table 7-1 presents the proportions of powder materials used for final concrete mixtures The
mixtures were made in two groups Group 1 Mixtures C-2 CN-2 CFN-2 and CFN-3 were
made using up to 20 fly ash and 20 powdered wallboard with water-reducing admixture and
without sodium sulfate Group 2 Mixtures Ref-5 CFNS-3 CFNS-4 and CFNS-5 were made
using up to 60 fly ash 20 powdered wallboard 2 sodium sulfate and without water-
reducing admixture Sodium sulfate was added as powder to a concrete mixture
Table 7-1 Proportions of Powder Materials Used for Final Concrete Mixtures Mixture Designation C-2 CN-2 CFN-
2 CFN-
3 C-4 CFN
S-3 CFNS-4
CFNS-5
Laboratory mixture designation Ref-3 New-7
New-8
New-9
Ref-5 New-14
New-15
New-16
Cement (mass of Cm) 100 90 70 60 100 60 40 20 Fly Ash (mass of Cm) 0 0 20 20 0 33 50 60
New Gypsum Wallboard (mass of Cm) 0 10 10 20 0 7 10 20 Sodium Sulfate (mass of Cm) 0 0 0 0 0 1 1 2
Cm Cementitious materials (Cement + Fly Ash + Gypsum Wallboard) The mixture proportions and fresh properties of the main concrete mixtures are presented in
Table 7-2 (in SI units) and Table 7-3 (in inch-pound units) To evaluate retention of slump
slump was measured twice (1) immediately after mixing was done and (2) 30 minutes later In
general the concrete mixtures retained their workability
33
Table 7-2 Mixture Proportions and Fresh Concrete Properties of Final Mixtures (SI [Metric] Units) Mixture Designation C-2 CN-2 CFN-
2 CFN-
3 C-4 CFN
S-3 CFNS-4
CFNS-5
Cement (kgm3) 362 316 249 212 365 217 144 71 Class C Fly Ash Weston (kgm3) 0 0 71 71 0 119 180 213
Powdered Gypsum Wallboard New (kgm3) 0 35 35 71 0 25 36 71 Water (kgm3) 164 164 170 153 163 154 153 157
Sand SSD (kgm3) 856 830 840 835 861 854 852 839 Crushed Stone 19-mm max SSD (kgm3) 1030 999 1010 1010 1030 1030 1020 1010
Sodium Sulfate Na2SO4 (kgm3) 0 0 0 0 0 36 36 71 Water-Reducing Admixture (Lm3) 0 103 104 104 0 0 0 0 Water-Cementitious Ratio WCm 045 047 048 043 045 043 042 044
Slump (mm) 55 50 40 30 30 40 45 25 Slump 30 minutes later (mm) 30 40 25 20 40 30 15 15
Air Content () 18 37 26 32 14 22 15 17 Air Temperature (degC) 23 24 23 24 23 23 23 24
Concrete Temperature (degC) 23 23 23 25 24 24 25 25 Density (kgm3) 2410 2340 2380 2350 2420 2400 2390 2370
SSD Saturated surface-dry
Table 7-3 Mixture Proportions and Fresh Concrete Properties of Final Mixtures (Inch-Pound Units)
Mixture Designation C-2 CN-2 CFN-2
CFN-3
C-4 CFNS-3
CFNS-4
CFNS-5
Cement (lbyd3) 610 532 419 357 614 366 243 120 Class C Fly Ash Weston (lbyd3) 0 0 120 119 0 201 303 359
Powdered Gypsum Wallboard New (lbyd3) 0 59 59 119 0 43 61 120 Water (lbyd3) 276 276 287 257 274 259 257 264
Sand SSD (lbyd3) 1440 1400 1410 1410 1450 1440 1430 1410Crushed Stone 34 in max SSD (lbyd3) 1730 1680 1700 1690 1740 1730 1720 1700
Sodium Sulfate Na2SO4 (lbyd3) 0 0 0 0 0 6 6 12 Water-Reducing Admixture (fl ozyd3) 0 265 269 268 0 0 0 0
Water-Cementitious Ratio WCm 045 047 048 043 045 043 042 044Slump (in) 2 14 2 1 12 1 14 1 14 1 12 1 34 1
Slump 30 minutes later (in) 1 14 1 12 1 34 1 12 1 14 12 12 Air Content () 18 37 26 32 14 22 15 17
Air Temperature (degF) 73 75 74 75 74 74 74 75 Concrete Temperature (degF) 73 74 74 77 75 76 77 77
Density (lbft3) 150 146 148 146 151 150 149 148 SSD Saturated surface-dry
72 Time of Initial Setting
Table 7-4 presents test results of the time of initial setting final concrete mixtures It took
about twice as long for the mixtures containing fly ash and powdered gypsum wallboard to reach
34
initial setting as their reference concrete mixtures It is well known that concrete mixtures
containing large amount of fly ash may show delayed setting
Table 7-4 Time of Initial Setting of Final Concrete Mixtures Mixture Designation C-2 CN-2 CFN-
2 CFN-
3 C-4 CFN
S-3 CFNS-4
CFNS-5
Time of Initial Setting (hours) 48 72 114 120 47 98 118 105
73 Compressive Strength
Compressive strength test results for final concrete mixtures are shown in Table 7-5 (in
MPa) Table 7-6 (in psi) Fig 7-1 and Fig 7-2
Table 7-5 Compressive Strength of Final Concrete Mixtures (MPa) Age (days) C-2 CN-2 CFN-
2 CFN-
3 C-4 CFN
S-3 CFNS-4
CFNS-5
1 168 111 42 39 159 58 38 24 3 301 197 174 132 302 237 178 79 7 354 232 265 154 347 301 297 12528 448 285 414 211 408 415 420 hellip 91 508 419 501 289 515 443 497 hellip
Cylinders had already cracked on their own before testing started
Table 7-6 Compressive Strength of Final Concrete Mixtures (psi) Age (days) C-2 CN-2 CFN-
2 CFN-
3 C-4 CFN
S-3 CFNS-4
CFNS-5
1 2430 1610 610 560 2310 840 550 350 3 4360 2860 2520 1910 4380 3440 2580 11407 5140 3370 3850 2240 5040 4370 4310 1810
28 6500 4140 6000 3060 5920 6020 6090 hellip 91 7370 6070 7270 4190 7470 6430 7210 hellip
Cylinders had already cracked on their own before testing started
35
0
10
20
30
40
50
60
1 10 100
Age (days)
Com
pres
sive
Str
engt
h (M
Pa)
0
1000
2000
3000
4000
5000
6000
7000
8000
(psi
)
Ref-3New-7New-8New-9
Fig 7-1 Compressive Strength of Final Concrete Mixtures Group 1
The mixtures CN-2 CFN-2 and CFN-3 showed lower compressive strength than C-2
Mixture CFN-2 showed structural-grade strength of 265 MPa (3850 psi) at seven days and a
relatively high compressive strength of 41 MPa (6000 psi) at 28 days Mixture CN-2 showed
structural-grade strength of 285 MPa (4140 psi) at 28 days
0
10
20
30
40
50
60
1 10 100
Age (days)
Com
pres
sive
Str
engt
h (M
Pa)
0
1000
2000
3000
4000
5000
6000
7000
8000
(psi
)
Ref-5New-14New-15New-16
Fig 7-2 Compressive Strength of Final Concrete Mixtures Group 2
36
As early as at seven days the mixtures CFNS-3 and CFNS-4 showed structural-grade
strength of 301 MPa (4370 psi) and 297 MPa (4310 psi) This is noteworthy considering the
fact that Mixtures CFNS-3 and CFNS-4 were made by replacing 40 and 60 of cement with
blends of fly ash and powdered gypsum wallboard At the age of 28 days the mixtures CFNS-3
and CFNS-4 reached compressive strength of 415 MPa (6020 psi) and 420 MPa (6090 psi) and
became as strong as Mixture Ref-5
The cylinders made from Mixture CFNS-5 cracked on their own before reaching the age of
seven days (Fig 7-3) This was attributed to an excessive expansive reaction resulting from use
of the particular proportions of cement fly ash powdered gypsum wallboard and sodium sulfate
in Mixture CFNS-5 Mixture CFNS-6 was made using half as much sodium sulfate (1 of
cementitious materials) as CFNS-5 nonetheless cylinders made from Mixture CFNS-6 cracked
before reaching the age of seven days
Fig 7-3 Cracked Cylinders of Concrete Mixtures CFNS-5 and CFNS-6
37
74 Length Change
Test results for length change of final concrete mixtures are shown in Table 7-7 Fig 7-5
and Fig 7-6
Table 7-7 Length Change of Final Concrete Mixtures () Age (days) C-2 CN-2 CFN-2 CFN-3 C-4 CFNS-
3 CFNS-
4 CFNS-
5 1 0 0 0 0 0 0 0 0 3 -0001 0010 0015 0018 0000 0006 0041 0359 7 -0003 0013 0031 0036 0004 0005 0039 1708
28 0004 0026 0033 0116 0002 0010 0043 hellip 32 -0010 0009 0012 0098 -0007 -0007 0030 hellip 35 -0015 0003 0009 0089 -0013 -0013 0025 hellip 42 -0022 -0003 -0002 0077 -0018 -0020 0020 hellip 56 -0028 -0020 -0004 0057 -0024 -0028 0014 hellip 84 -0033 -0027 -0010 0037 -0031 -0035 0011 hellip 140 -0036 -0035 -0017 0027 -0035 -0035 0006 hellip
Specimens had cracked on their own All of the concrete mixtures made with powdered gypsum wallboard showed higher
expansion than their reference concrete mixtures during immersion in saturated limewater
Mixture CFN-3 containing 20 fly ash and 20 powdered gypsum wallboard showed a large
expansion (0120) Specimens made from Mixture CFNS-5 containing 60 fly ash and 20
powdered gypsum wallboard showed excessive expansion and they cracked before reaching the
age of seven days (Fig 7-4)
38
Fig 7-4 Length-Change Specimen of Concrete
Mixture CFNS-5 Showing a Crack
-004
-002
000
002
004
006
008
010
012
0 30 60 90 120 150
Age (days)
Leng
th C
hang
e (
)
Ref-3New-7New-8New-9
Fig 7-5 Length Change of Final Concrete Mixtures Group 1
During drying Mixture CN-2 and CFN-3 made by using high proportions of powdered
gypsum wallboard to fly ash shrunk by greater extents than Mixture C-2 At the age of 140
days the net shrinkage of Mixture CN-2 was 0035 which was approximately the same as that
of C-2 0036 Mixture CFN-3 showed a net expansion of 0027 at 140 day Mixture CFN-2
shrunk by approximately the same amount as Mixture C-2 resulting in a net shrinkage of
0017 at 140 days
39
-004
-002
000
002
004
006
008
010
012
0 30 60 90 120 150
Age (days)
Leng
th C
hang
e (
)
Ref-5New-14New-15New-16
Fig 7-6 Length Change of Final Concrete Mixtures Group 2
The length change of Mixture CFNS-3 (made with 60 cement 33 fly ash and 7
powdered gypsum wallboard) was approximately the same as that of Mixture Ref-5 Mixture
CFNS-4 (made with 40 cement 50 fly ash and 10 powdered gypsum wallboard) showed a
relatively large expansion (0043) during immersion in saturated limewater and shrunk during
drying as much as it had expanded resulting in very small net expansion of 0006 at the age of
140 days This concrete mixture could be used to minimize drying shrinkage cracking of
concrete Mixture CFNS-4 could be used to minimize drying shrinkage cracking of concrete
75 Sulfate Resistance
Mortar cubes and bars were made using the same proportions of cement fly ash and gypsum
wallboard as the final concrete mixtures Ref-5 CFNS-3 and CFNS-4 No mortar mixture was
made using the powder-materials proportions of concrete mixture CFNS-5 because it was
anticipated that such mortar would crack
Table 7-8 shows the proportions of the mortar mixtures produced
40
Table 7-8 Mixture Proportions and Flow of Mortar Mixtures Mixture Designation C-c C-b CFNS-1c CFNS-1b CFNS-2c CFNS-2b
Laboratory mixture designation C-2 cube C-2 bar N-3 cube N-3 bar N-4 cube N-4 barCement (mass of Cm) 100 100 60 60 40 40 Fly Ash (mass of Cm) 0 0 33 33 50 50
New Gypsum Wallboard (mass of Cm) 0 0 7 7 10 10 Sodium Sulfate (mass of Cm) 0 0 1 1 1 1
Cement (g) 500 740 300 444 200 296 Class C Fly Ash Weston (g) 0 0 165 2442 250 370
Powdered Gypsum Wallboard New (g) 0 0 35 518 50 74 Sodium Sulfate Na2SO4 (g) 0 0 5 74 5 76
Water (g) 242 359 216 3204 200 2967 Water-Cementitious Ratio WCm 0484 0485 0432 0433 0400 0401
Graded Standard Sand (g) 1375 2035 1375 2035 1375 2035 Flow (mm) 190 hellip 185 hellip 191 hellip
Cm Cementitious materials (Cement + Fly Ash + Gypsum Wallboard) Table 7-9 and Table 7-10 show test results for the compressive strength of mortar mixtures
It took approximately 15 days for Mixture C-c to attain a compressive strength of 20 MPa
(2900 psi) For Mixture N-3 it took 47 days and for Mixture N-4 7 days
Table 7-9 Compressive Strength of Mortar (MPa) Age (days) C-c CFNS-1c CFNS-2c
1 148 45 11 4 314 174 111 5 hellip 212 hellip
5125 hellip hellip 167 7 hellip hellip 197 24 hellip hellip 250 28 396 316
Note These results are averages obtained from testing two cubes for each mixture at each test age
Table 7-10 Compressive Strength of Mortar (psi) Age (days) C-c CFNS-1c CFNS-2c
1 2140 650 160 4 4550 2530 1610 5 hellip 3070 hellip
5125 hellip hellip 2420 7 hellip hellip 2850 24 hellip hellip 3630 28 5750 4580 hellip
Note These results are averages obtained from testing two cubes at each test age for each mixture
41
0
5
10
15
20
25
30
35
40
45
0 5 10 15 20 25 30Age (days)
Com
pres
sive
Str
engt
h (p
si)
0
1000
2000
3000
4000
5000
6000
(MP
a)
C-2N-3N-4
Fig 7-7 Compressive Strength of Mortar Cubes
Once the mixture attained the specified compressive strength of 20 MPa (2900 psi) the
mortar bars were immersed in a 5 sodium sulfate solution and length change of the bars were
measured after specified periods to assess sulfate resistance of mortar mixtures Table 7-11 and
Fig 7-8 show test results for length change of mortar bars A larger expansion implies a lower
resistance of mortar mixture to sulfate attack and a smaller expansion implies a higher resistance
to sulfate attack
Table 7-11 Length Change of Mortar Bars () Age after immersion in 5 sodium sulfate
solution (days) C-b CFNS-1b CFNS-2b
0 0 0 0 7 0007 0016 0006 14 0013 0024 0009 21 0016 0028 0009 28 0020 0033 0009 42 0027 0044 0011 56 0034 0063 0010
Number of specimens tested C-b five N-1-b six and N-2-b three
42
000
001
002
003
004
005
006
007
0 7 14 21 28 35 42 49 56 63
Days after immersion in Na2SO4 solution
Len
gth
Cha
nge
()
C-bCFNS-1bCFNS-2b
Fig 7-8 Length Change of Mortar Bars in 5 Sodium Sulfate Solution
After 56 days of immersion in sodium sulfate solution Mixture C-b (Control) showed an
expansion of approximately 0034 Mixture N-3 (made with 33 fly ash and 7 powdered
gypsum wallboard and 1 sodium sulfate) shows an expansion of 0063 which was
approximately 19 times that of Mixture C-b Mixture N-4 (made with 50 fly ash 10
powdered gypsum wallboard and 1 sodium sulfate) showed an expansion of 0010 which is
significantly lower than that of Mixture C-b (Control) This means that Mixture N-4 possesses
significantly higher resistance to sulfate attack than Mixture C-b Importantly the expansion of
mortar bars made from Mixture N-4 stabilized after 14 days of immersion in sodium sulfate
solution
76 Summary
Table 7-12 shows a summary of proportions of powder materials and properties of final
concrete mixtures Table 7-13 shows a summary of proportions and length change in sulfate
solution of mortar mixtures
43
Table 7-12 Proportions of Powder Materials and Properties of Final Concrete Mixtures Mixture Designation C-2 CN-2 CFN-2 CFN-3 C-4 CFNS-
3 CFNS-
4 CFNS-
5 Cement (mass of Cm) 100 90 70 60 100 60 40 20 Fly Ash (mass of Cm) 0 0 20 20 0 33 50 60
New Gypsum Wallboard (mass of Cm) 0 10 10 20 0 7 10 20 Sodium Sulfate (mass of Cm) 0 0 0 0 0 1 1 2
Time of Initial Setting (hours) 48 72 114 120 47 98 118 105 Compressive Strength (MPa)
1-day 168 111 42 39 159 58 38 24 3-day 301 197 174 132 302 237 178 79 7-day 354 232 265 154 347 301 297 125
28-day 448 285 414 211 408 415 420 hellip 91-day 508 419 501 289 515 443 497 hellip
Compressive Strength (psi) 1-day 2430 1610 610 560 2310 840 550 350 3-day 4360 2860 2520 1910 4380 3440 2580 1140 7-day 5140 3370 3850 2240 5040 4370 4310 1810
28-day 6500 4140 6000 3060 5920 6020 6090 hellip 91-day 7370 6070 7270 4190 7470 6430 7210 hellip
Length Change () 1-day 0 0 0 0 0 0 0 0 7-day -0003 0013 0031 0036 0004 0005 0039 1708
28-day 0004 0026 0033 0116 0002 0010 0043 hellip 140-day -0036 -0035 -0017 0027 -0035 -0035 0006 hellip
Cm Cementitious materials (Cement + Fly Ash + Gypsum Wallboard) Specimens had cracked on their own
Table 7-13 Proportions of Powder Materials and Length Change in Sulfate Solution of Mortar Mixtures
Mixture Designation C-b CFNS-1b
CFNS-2b
Laboratory mixture designation Cement (mass of Cm) 100 60 40 Fly Ash (mass of Cm) 0 33 50
New Gypsum Wallboard (mass of Cm) 0 7 10 Sodium Sulfate (mass of Cm) 0 1 1
Length Change in 5 Sodium Sulfate Solution () 0-day 0 0 0 7-day 0007 0016 0006
14-day 0013 0024 0009 21-day 0016 0028 0009 28-day 0020 0033 0009 42-day 0027 0044 0011 56-day 0034 0063 0010
44
Table 7-14 shows a summary of properties of selected promising main concrete mixtures
Mixtures CFN-2 CFNS-3 and CFNS-4 were comparable to their reference concrete mixtures in
compressive strength at the ages of 7 days and later Based on the sulfate resistance of Mortar
N-4 it is expected that concrete Mixture CFNS-4 will also possess high resistance to sulfate
attack
Table 7-14 Summary of Proportions and Properties of Selected Final Concrete Mixtures and Mortar Mixtures
Mixture Designation C-4 CFN-2 CFNS-3
CFNS-4
Cement (mass of Cm) 100 70 60 40 Fly Ash (mass of Cm) 0 20 33 50
New Gypsum Wallboard (mass of Cm) 0 10 7 10 Sodium Sulfate (mass of Cm) 0 0 1 1
Time of Initial Setting (hours) 47 114 98 118 Compressive Strength (MPa)
1-day 159 42 58 38 3-day 302 174 237 178 7-day 347 265 301 297
28-day 408 414 415 420 91-day 515 501 443 497
Compressive Strength (psi) 1-day 2310 610 840 550 3-day 4380 2520 3440 2580 7-day 5040 3850 4370 4310
28-day 5920 6000 6020 6090 91-day 7470 7270 6430 7210
Length Change () 1-day 0 0 0 0
28-day 0002 0033 0010 0043 140-day -0035 -0017 -0035 0006
28-day Length Change of Mortar in 5 Sodium Sulfate Solution ()
0020 hellip 0033 0009
Cm Cementitious materials (Cement + Fly Ash + Gypsum Wallboard)
45
CHAPTER 8 ECONOMIC IMPACT ANALYSIS OF FULL-
SCALE IMPLEMENTATION
It is estimated that over 80000 tons of gypsum wallboard is disposed of each year from new
construction and demolition in Wisconsin If a tipping fee plus handling and transportation cost
of $30 per ton is assumed the disposal of gypsum wallboard costs Wisconsin citizens and
industry approximately $24 million dollars each year
Based on figures from the National Ready-Mixed Concrete Association Wisconsin produced
approximately 11 million cubic yards (84 million m3) of concrete in 2004 Based on a cement
content of 400 pounds per cubic yard (240 kgm3) of concrete 22 million tons of cement is used
in concrete each year in Wisconsin
This project showed that powdered gypsum wallboard could constitute approximately 10
of total cementitious materials used in a concrete mixture If this new cementitious material was
used in 20 of the concrete produced in Wisconsin approximately 44000 tons of gypsum
wallboard can be used In other words approximately half of the gypsum wallboard waste
generated in Wisconsin could be used in this application alone This would save Wisconsin
industry $13 million dollars each year in avoided disposal costs leading to reduce the cost for
concrete construction in Wisconsin Citizens would benefit also by reducing landfilling cost for
municipalities and increasing recycling rates of useful materials If 40 of the concrete
generated in Wisconsin used this new concrete mixture technology all of the waste gypsum
wallboard generated in Wisconsin could be used in this one application Therefore all 80000
tons of waste gypsum wallboard could be diverted from Wisconsin landfills It would save
Wisconsin citizens and industry over $24 million dollars each year in avoided disposal cost
46
This economic impact does not include incalculable dollar-benefits due to avoided possible
future environmental impact of sending such large quantities of gypsum wallboard into landfills
This project also showed that up to 60 of cement in concrete mixtures could be replaced
with a blend of Class C fly ash and gypsum wallboard Cement is a valuable commodity If it is
assumed that cement sells at $100 per ton and Class C fly ash sells at $50 per ton use of a
cementitious blend consisting of 40 cement 50 Class C fly ash and 10 powdered gypsum
in producing 40 of concrete in Wisconsin would result in savings on cement of about $50
million and expenditure on fly ash of about $20 million with a net savings of about $30 million
each year
Saving cement through this new technology would also reduce emissions of carbon dioxide
and other GHGs because production of one ton of cement releases about one ton of GHGs If
this new technology to use a blend of Class C fly ash and gypsum wallboard as a replacement of
cement were implemented in producing up to 40 of concrete in Wisconsin it would reduce the
GHG emissions by up to 12 million tons each year CO2 credits currently sell for about $20 per
ton Therefore CO2 credits would be worth $10 million each year
With a potential total value of $24 million in avoided disposal costs $30 million in savings
resulting from cement replacement plus $10 million in CO2 credits total economic benefit to
Wisconsin that could be generated by this project may be valued at about $42 million each year
47
CHAPTER 9 CONCLUSIONS
This project showed that from 30 to 60 of cement in concrete mixtures could be
successfully replaced with blends of Class C fly ash and powdered gypsum wallboard Several
concrete mixtures made by such replacements showed compressive strength nearly as high as
that of Reference concrete mixtures (without replacement of cement) at seven days The 28-day
compressive strength of these concrete mixtures containing fly ash and gypsum wallboard were
equivalent to that of Reference concrete mixtures Use of sodium sulfate as an activator was
essential in improving the 1-day and 3-day strength of concrete containing Class C fly ash and
gypsum wallboard
A concrete mixture made with a cementitious blend of 40 cement 50 Class C fly ash
and 10 powdered gypsum wallboard showed a relatively large expansion (0043) during
immersion in saturated limewater and shrunk during drying as much as it had expanded
resulting in very small net expansion at the age of 140 days This concrete mixture could be
used to minimize drying shrinkage cracking and subsequent increase in durability of concrete
A mortar mixture made with a cementitious blend of 40 cement 50 Class C fly ash and
10 powdered gypsum wallboard showed much higher resistance to sulfate attack compared
with Reference mortar (without replacement of cement)
Total economic benefit to Wisconsin that could be generated by this project may be valued at
up to about $42 million each year
48
CHAPTER 10 REFERENCES
ASTM C 33-03 ldquoStandard Specification for Concrete Aggregatesrdquo ASTM International West Conshohocken PA 11 pp
ASTM C 150-05 ldquoStandard Specification for Portland Cementrdquo ASTM International West Conshohocken PA 8 pp
ASTM C 192 C 192M-05 ldquoStandard Practice for Making and Curing Concrete Test Specimens in the Laboratoryrdquo 8 pp
ASTM C 494C 494M-05a ldquoStandard Specification for Chemical Admixtures for Concreterdquo ASTM International West Conshohocken PA 10 pp
ASTM C 618-03 ldquoStandard Specification for Coal Fly Ash and Raw or Calcined Natural Pozzolan for Use in Concreterdquo ASTM International West Conshohocken PA 3 pp
ASTM C 1012-04 ldquoStandard Test Method for Length Change of Hydraulic-Cement Mortars Exposed to a Sulfate Solutionrdquo ASTM International West Conshohocken PA 6 pp
Aimin X and Sarkar S L ldquoMicrostructural Study of Gypsum Activated Fly Ash Hydration in Cement Pasterdquo Cement and Concrete Research Vol 21 1991 pp 1137-1147
Drywallrecyclingorg lthttpwwwdrywallrecyclingorggt (February 2006)
EPA Presentation by the US Environmental Protection Agency at the Massachusetts DEP Gypsum Workgroup March 18 2004
Freeman R B and Carrasquillo R L ldquoProduction of Sulfate-Resistant Concrete Containing High-Calcium Fly Ash and Sodium Sulfate Admixturerdquo Proceedings of Fifth CANMETACI International Conference on Fly Ash Silica Fume Slag and Natural Pozzolans in Concrete ACI SP-153 Vol 1 1995 pp 153-176
ICF Northwest ldquoCalcium Spray Dryer Waste Management Design Guidelinesrdquo EPRI (Electric Power Research Institute) Report No CS-5312 September 1987 p 3-3
Krocak R F Meininger R and Yost P A Chapter 21 ldquoBeneficial Reuse of Aggregate Mineral Fines and Scrap New Construction Wallboardrdquo Land Application of Agricultural Industrial and Municipal By-Products (6) James F Powers and Warren P Dick ed SSSA Number 6 in the Soil Science Society of America Book Series ISBN 0-89118-834-7 Item Number 60901 2000 653 pages
Kumar P K and Monteiro P J M ldquoConcrete Microstructure Properties and Materialsrdquo 2nd Ed McGraw-Hill 1993
Lafarge Group ltwwwlafargecomgt (February 2006)
49
Ma W Liu C Brown P W and Komarneni S ldquoPore Structures of Fly Ashes Activated By Ca(OH)2 and CaSO42H2Ordquo Cement and Concrete Research Vol 25 No 2 1995 pp 417-425
McCall R ldquoWasteCap Wisconsin Drywall-To-Fertilizer Projectrdquo Final Report for the US Environmental Protection Agency August 1993
Merritt F S and Ricketts J T editors Building Design and Construction Handbook McGraw Hill 6th Ed 2001 pp 435-438
Mindness S Young J F and Darwin D ldquoConcreterdquo 2nd Ed Prentice Hall 2002
Naik T R Kraus R N Chun Y-m and Nageotte S O ldquoCoal-Combustion Bottom Ash for Reducing the Shrinkage of Concrete Made With Portland Cement and Sulfoaluminate Cementrdquo Jean Pera Symposium on Specialty Cements and Sustainability Issues a part of the proceedings of the Ninth CANMETACI International Conference on Recent Advances in Concrete Technology Warsaw Poland May 2007 pp 141-155
Neville A ldquoProperties of Concreterdquo 4th Ed Longman 1995
Pera J and Ambroise J ldquoNew Applications of Calcium Sulfoaluminate Cementrdquo Cement and Concrete Research Vol 34 No 4 April 2004 pp 671-676
Prusinski J R and Carrasquillo R L ldquoUsing Medium- to High-Volume Fly Ash Blended Cements to Improve the Sulfate Resistance of High-Lime Fly Ash Concreterdquo Proceedings of Fifth CANMETACI International Conference on Fly Ash Silica Fume Slag and Natural Pozzolans in Concrete ACI SP-153 Vol 1 1995 pp 43-65
Reindl J R ldquoBibliography of Gypsum Drywallrdquo available on the WasteCap Wisconsin website httpwwwwastecapwiorg August 2002 73 pages
WI-DNR ldquoSubstituting Waste Gypsum Wallboard for Agricultural Gypsumrdquo Wisconsin Department of Natural Resources Bureau of Waste Management DNR Publication WA-607-04 rev 2005
Wolkowski R ldquoDemonstration of Land Application of Crushed Gypsum Wallboard Waste for Alfalfardquo Final report to the Wisconsin Department of Natural Resources Waste Reduction and Recycling Grant Program and Dane County Department of Public Works August 12 1998
Wolkowski R P ldquoUsing Recycled Wallboard for Crop Production (A3782)rdquo WasteCap Wisconsin Inc 2003
Wu Z and Naik T R ldquoUse of Clean Coal Ash as Setting Time Regulator in Portland Cementrdquo Proceedings of the Fifth CANMETACI International Conference on Recent Advances in Concrete Technology Supplementary Papers 2001 pp 83-94
50
Wu Z and Naik T R ldquoProperties of Concrete Produced from Multicomponent Blended Cementsrdquo Cement and Concrete Research Vol 32 2002 pp 1937-1942
Wu Z and Naik T R ldquoChemically Activated Blended Cementsrdquo ACI Materials Journal September-October 2003 pp 434-440
- 08 Naik Chun cover
- 08 MIL NaikGypsumWallboard in concrete
-
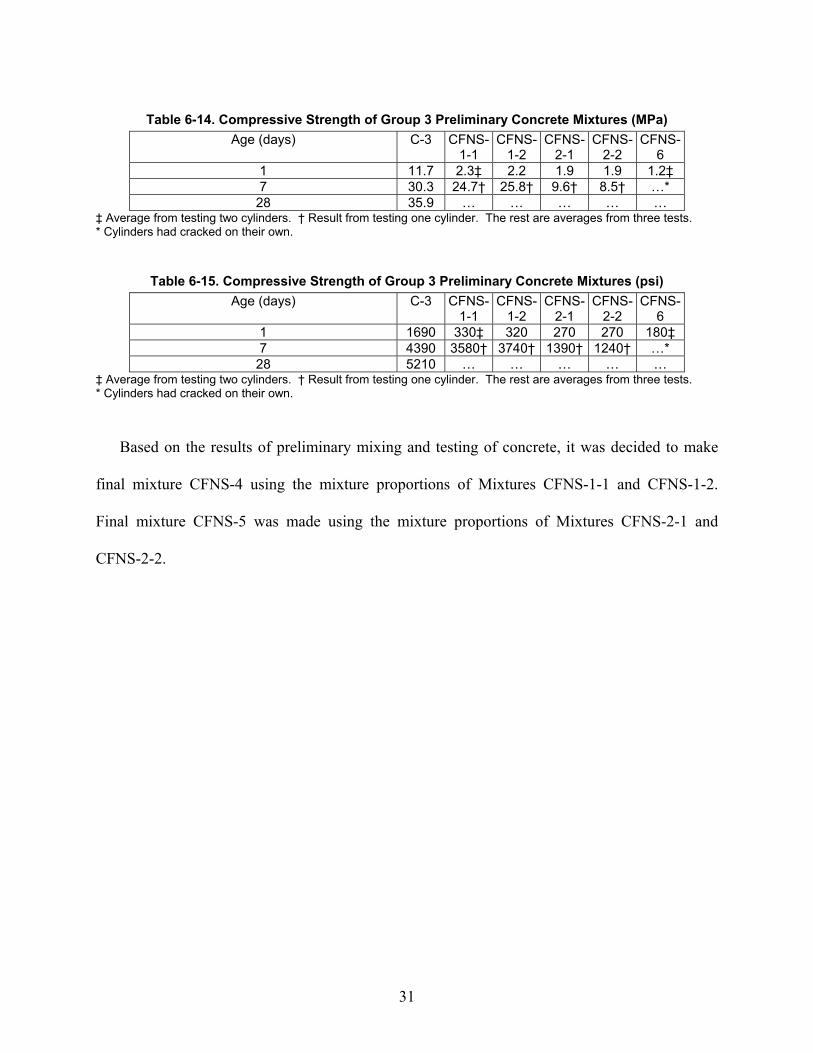
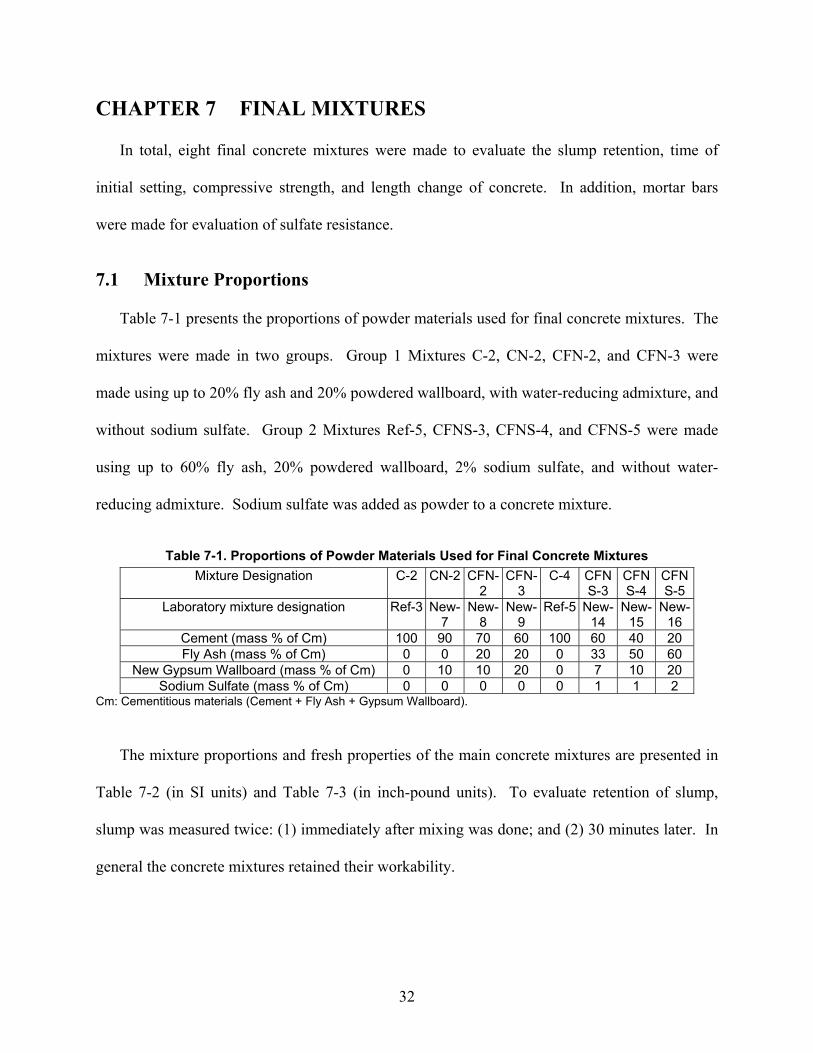
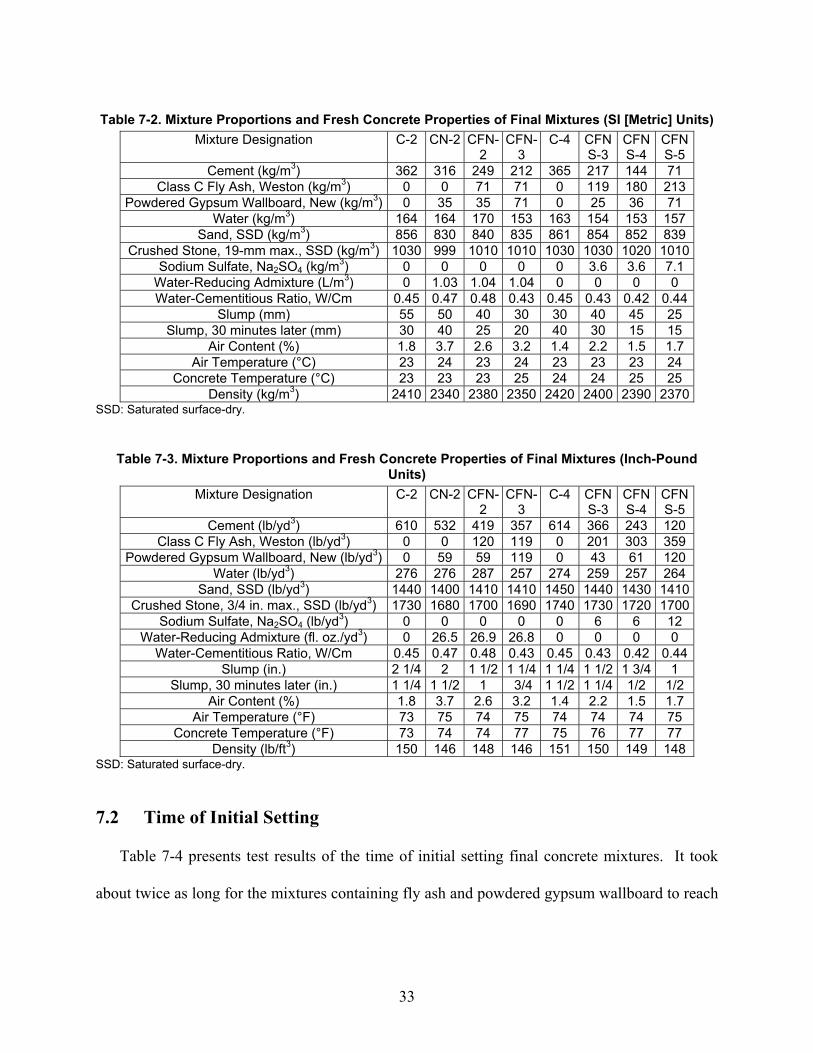
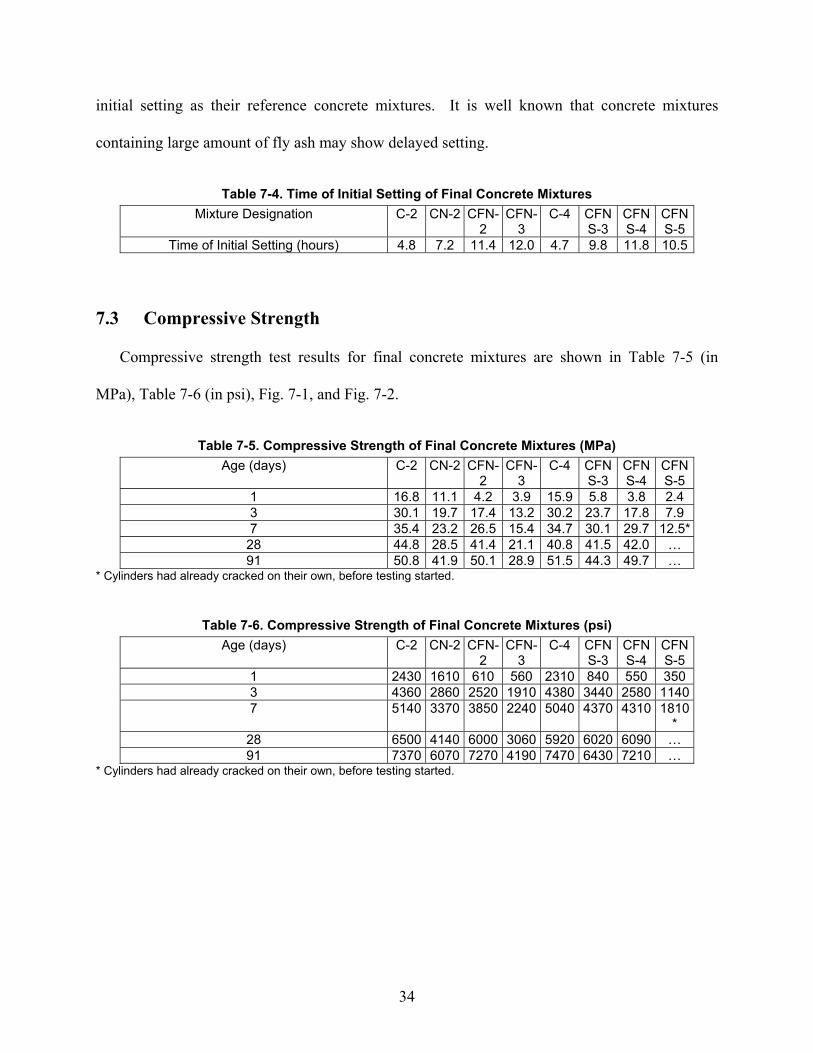
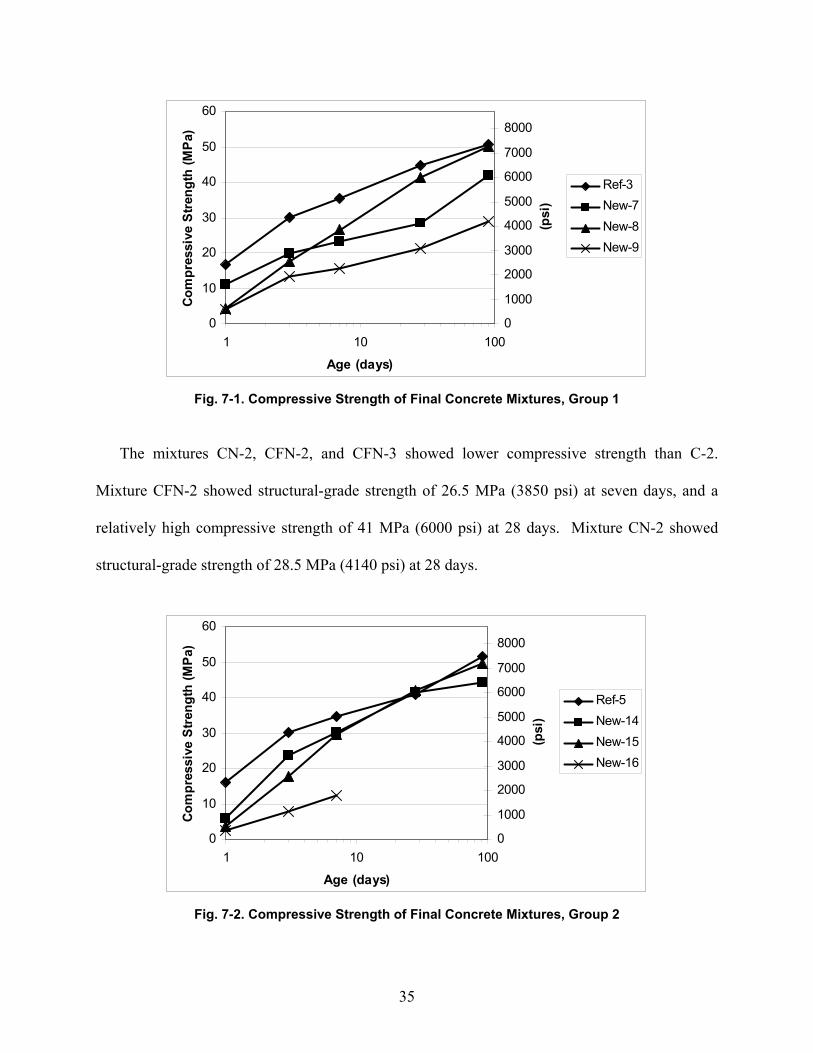
35
0
10
20
30
40
50
60
1 10 100
Age (days)
Com
pres
sive
Str
engt
h (M
Pa)
0
1000
2000
3000
4000
5000
6000
7000
8000
(psi
)
Ref-3New-7New-8New-9
Fig 7-1 Compressive Strength of Final Concrete Mixtures Group 1
The mixtures CN-2 CFN-2 and CFN-3 showed lower compressive strength than C-2
Mixture CFN-2 showed structural-grade strength of 265 MPa (3850 psi) at seven days and a
relatively high compressive strength of 41 MPa (6000 psi) at 28 days Mixture CN-2 showed
structural-grade strength of 285 MPa (4140 psi) at 28 days
0
10
20
30
40
50
60
1 10 100
Age (days)
Com
pres
sive
Str
engt
h (M
Pa)
0
1000
2000
3000
4000
5000
6000
7000
8000
(psi
)
Ref-5New-14New-15New-16
Fig 7-2 Compressive Strength of Final Concrete Mixtures Group 2
36
As early as at seven days the mixtures CFNS-3 and CFNS-4 showed structural-grade
strength of 301 MPa (4370 psi) and 297 MPa (4310 psi) This is noteworthy considering the
fact that Mixtures CFNS-3 and CFNS-4 were made by replacing 40 and 60 of cement with
blends of fly ash and powdered gypsum wallboard At the age of 28 days the mixtures CFNS-3
and CFNS-4 reached compressive strength of 415 MPa (6020 psi) and 420 MPa (6090 psi) and
became as strong as Mixture Ref-5
The cylinders made from Mixture CFNS-5 cracked on their own before reaching the age of
seven days (Fig 7-3) This was attributed to an excessive expansive reaction resulting from use
of the particular proportions of cement fly ash powdered gypsum wallboard and sodium sulfate
in Mixture CFNS-5 Mixture CFNS-6 was made using half as much sodium sulfate (1 of
cementitious materials) as CFNS-5 nonetheless cylinders made from Mixture CFNS-6 cracked
before reaching the age of seven days
Fig 7-3 Cracked Cylinders of Concrete Mixtures CFNS-5 and CFNS-6
37
74 Length Change
Test results for length change of final concrete mixtures are shown in Table 7-7 Fig 7-5
and Fig 7-6
Table 7-7 Length Change of Final Concrete Mixtures () Age (days) C-2 CN-2 CFN-2 CFN-3 C-4 CFNS-
3 CFNS-
4 CFNS-
5 1 0 0 0 0 0 0 0 0 3 -0001 0010 0015 0018 0000 0006 0041 0359 7 -0003 0013 0031 0036 0004 0005 0039 1708
28 0004 0026 0033 0116 0002 0010 0043 hellip 32 -0010 0009 0012 0098 -0007 -0007 0030 hellip 35 -0015 0003 0009 0089 -0013 -0013 0025 hellip 42 -0022 -0003 -0002 0077 -0018 -0020 0020 hellip 56 -0028 -0020 -0004 0057 -0024 -0028 0014 hellip 84 -0033 -0027 -0010 0037 -0031 -0035 0011 hellip 140 -0036 -0035 -0017 0027 -0035 -0035 0006 hellip
Specimens had cracked on their own All of the concrete mixtures made with powdered gypsum wallboard showed higher
expansion than their reference concrete mixtures during immersion in saturated limewater
Mixture CFN-3 containing 20 fly ash and 20 powdered gypsum wallboard showed a large
expansion (0120) Specimens made from Mixture CFNS-5 containing 60 fly ash and 20
powdered gypsum wallboard showed excessive expansion and they cracked before reaching the
age of seven days (Fig 7-4)
38
Fig 7-4 Length-Change Specimen of Concrete
Mixture CFNS-5 Showing a Crack
-004
-002
000
002
004
006
008
010
012
0 30 60 90 120 150
Age (days)
Leng
th C
hang
e (
)
Ref-3New-7New-8New-9
Fig 7-5 Length Change of Final Concrete Mixtures Group 1
During drying Mixture CN-2 and CFN-3 made by using high proportions of powdered
gypsum wallboard to fly ash shrunk by greater extents than Mixture C-2 At the age of 140
days the net shrinkage of Mixture CN-2 was 0035 which was approximately the same as that
of C-2 0036 Mixture CFN-3 showed a net expansion of 0027 at 140 day Mixture CFN-2
shrunk by approximately the same amount as Mixture C-2 resulting in a net shrinkage of
0017 at 140 days
39
-004
-002
000
002
004
006
008
010
012
0 30 60 90 120 150
Age (days)
Leng
th C
hang
e (
)
Ref-5New-14New-15New-16
Fig 7-6 Length Change of Final Concrete Mixtures Group 2
The length change of Mixture CFNS-3 (made with 60 cement 33 fly ash and 7
powdered gypsum wallboard) was approximately the same as that of Mixture Ref-5 Mixture
CFNS-4 (made with 40 cement 50 fly ash and 10 powdered gypsum wallboard) showed a
relatively large expansion (0043) during immersion in saturated limewater and shrunk during
drying as much as it had expanded resulting in very small net expansion of 0006 at the age of
140 days This concrete mixture could be used to minimize drying shrinkage cracking of
concrete Mixture CFNS-4 could be used to minimize drying shrinkage cracking of concrete
75 Sulfate Resistance
Mortar cubes and bars were made using the same proportions of cement fly ash and gypsum
wallboard as the final concrete mixtures Ref-5 CFNS-3 and CFNS-4 No mortar mixture was
made using the powder-materials proportions of concrete mixture CFNS-5 because it was
anticipated that such mortar would crack
Table 7-8 shows the proportions of the mortar mixtures produced
40
Table 7-8 Mixture Proportions and Flow of Mortar Mixtures Mixture Designation C-c C-b CFNS-1c CFNS-1b CFNS-2c CFNS-2b
Laboratory mixture designation C-2 cube C-2 bar N-3 cube N-3 bar N-4 cube N-4 barCement (mass of Cm) 100 100 60 60 40 40 Fly Ash (mass of Cm) 0 0 33 33 50 50
New Gypsum Wallboard (mass of Cm) 0 0 7 7 10 10 Sodium Sulfate (mass of Cm) 0 0 1 1 1 1
Cement (g) 500 740 300 444 200 296 Class C Fly Ash Weston (g) 0 0 165 2442 250 370
Powdered Gypsum Wallboard New (g) 0 0 35 518 50 74 Sodium Sulfate Na2SO4 (g) 0 0 5 74 5 76
Water (g) 242 359 216 3204 200 2967 Water-Cementitious Ratio WCm 0484 0485 0432 0433 0400 0401
Graded Standard Sand (g) 1375 2035 1375 2035 1375 2035 Flow (mm) 190 hellip 185 hellip 191 hellip
Cm Cementitious materials (Cement + Fly Ash + Gypsum Wallboard) Table 7-9 and Table 7-10 show test results for the compressive strength of mortar mixtures
It took approximately 15 days for Mixture C-c to attain a compressive strength of 20 MPa
(2900 psi) For Mixture N-3 it took 47 days and for Mixture N-4 7 days
Table 7-9 Compressive Strength of Mortar (MPa) Age (days) C-c CFNS-1c CFNS-2c
1 148 45 11 4 314 174 111 5 hellip 212 hellip
5125 hellip hellip 167 7 hellip hellip 197 24 hellip hellip 250 28 396 316
Note These results are averages obtained from testing two cubes for each mixture at each test age
Table 7-10 Compressive Strength of Mortar (psi) Age (days) C-c CFNS-1c CFNS-2c
1 2140 650 160 4 4550 2530 1610 5 hellip 3070 hellip
5125 hellip hellip 2420 7 hellip hellip 2850 24 hellip hellip 3630 28 5750 4580 hellip
Note These results are averages obtained from testing two cubes at each test age for each mixture
41
0
5
10
15
20
25
30
35
40
45
0 5 10 15 20 25 30Age (days)
Com
pres
sive
Str
engt
h (p
si)
0
1000
2000
3000
4000
5000
6000
(MP
a)
C-2N-3N-4
Fig 7-7 Compressive Strength of Mortar Cubes
Once the mixture attained the specified compressive strength of 20 MPa (2900 psi) the
mortar bars were immersed in a 5 sodium sulfate solution and length change of the bars were
measured after specified periods to assess sulfate resistance of mortar mixtures Table 7-11 and
Fig 7-8 show test results for length change of mortar bars A larger expansion implies a lower
resistance of mortar mixture to sulfate attack and a smaller expansion implies a higher resistance
to sulfate attack
Table 7-11 Length Change of Mortar Bars () Age after immersion in 5 sodium sulfate
solution (days) C-b CFNS-1b CFNS-2b
0 0 0 0 7 0007 0016 0006 14 0013 0024 0009 21 0016 0028 0009 28 0020 0033 0009 42 0027 0044 0011 56 0034 0063 0010
Number of specimens tested C-b five N-1-b six and N-2-b three
42
000
001
002
003
004
005
006
007
0 7 14 21 28 35 42 49 56 63
Days after immersion in Na2SO4 solution
Len
gth
Cha
nge
()
C-bCFNS-1bCFNS-2b
Fig 7-8 Length Change of Mortar Bars in 5 Sodium Sulfate Solution
After 56 days of immersion in sodium sulfate solution Mixture C-b (Control) showed an
expansion of approximately 0034 Mixture N-3 (made with 33 fly ash and 7 powdered
gypsum wallboard and 1 sodium sulfate) shows an expansion of 0063 which was
approximately 19 times that of Mixture C-b Mixture N-4 (made with 50 fly ash 10
powdered gypsum wallboard and 1 sodium sulfate) showed an expansion of 0010 which is
significantly lower than that of Mixture C-b (Control) This means that Mixture N-4 possesses
significantly higher resistance to sulfate attack than Mixture C-b Importantly the expansion of
mortar bars made from Mixture N-4 stabilized after 14 days of immersion in sodium sulfate
solution
76 Summary
Table 7-12 shows a summary of proportions of powder materials and properties of final
concrete mixtures Table 7-13 shows a summary of proportions and length change in sulfate
solution of mortar mixtures
43
Table 7-12 Proportions of Powder Materials and Properties of Final Concrete Mixtures Mixture Designation C-2 CN-2 CFN-2 CFN-3 C-4 CFNS-
3 CFNS-
4 CFNS-
5 Cement (mass of Cm) 100 90 70 60 100 60 40 20 Fly Ash (mass of Cm) 0 0 20 20 0 33 50 60
New Gypsum Wallboard (mass of Cm) 0 10 10 20 0 7 10 20 Sodium Sulfate (mass of Cm) 0 0 0 0 0 1 1 2
Time of Initial Setting (hours) 48 72 114 120 47 98 118 105 Compressive Strength (MPa)
1-day 168 111 42 39 159 58 38 24 3-day 301 197 174 132 302 237 178 79 7-day 354 232 265 154 347 301 297 125
28-day 448 285 414 211 408 415 420 hellip 91-day 508 419 501 289 515 443 497 hellip
Compressive Strength (psi) 1-day 2430 1610 610 560 2310 840 550 350 3-day 4360 2860 2520 1910 4380 3440 2580 1140 7-day 5140 3370 3850 2240 5040 4370 4310 1810
28-day 6500 4140 6000 3060 5920 6020 6090 hellip 91-day 7370 6070 7270 4190 7470 6430 7210 hellip
Length Change () 1-day 0 0 0 0 0 0 0 0 7-day -0003 0013 0031 0036 0004 0005 0039 1708
28-day 0004 0026 0033 0116 0002 0010 0043 hellip 140-day -0036 -0035 -0017 0027 -0035 -0035 0006 hellip
Cm Cementitious materials (Cement + Fly Ash + Gypsum Wallboard) Specimens had cracked on their own
Table 7-13 Proportions of Powder Materials and Length Change in Sulfate Solution of Mortar Mixtures
Mixture Designation C-b CFNS-1b
CFNS-2b
Laboratory mixture designation Cement (mass of Cm) 100 60 40 Fly Ash (mass of Cm) 0 33 50
New Gypsum Wallboard (mass of Cm) 0 7 10 Sodium Sulfate (mass of Cm) 0 1 1
Length Change in 5 Sodium Sulfate Solution () 0-day 0 0 0 7-day 0007 0016 0006
14-day 0013 0024 0009 21-day 0016 0028 0009 28-day 0020 0033 0009 42-day 0027 0044 0011 56-day 0034 0063 0010
44
Table 7-14 shows a summary of properties of selected promising main concrete mixtures
Mixtures CFN-2 CFNS-3 and CFNS-4 were comparable to their reference concrete mixtures in
compressive strength at the ages of 7 days and later Based on the sulfate resistance of Mortar
N-4 it is expected that concrete Mixture CFNS-4 will also possess high resistance to sulfate
attack
Table 7-14 Summary of Proportions and Properties of Selected Final Concrete Mixtures and Mortar Mixtures
Mixture Designation C-4 CFN-2 CFNS-3
CFNS-4
Cement (mass of Cm) 100 70 60 40 Fly Ash (mass of Cm) 0 20 33 50
New Gypsum Wallboard (mass of Cm) 0 10 7 10 Sodium Sulfate (mass of Cm) 0 0 1 1
Time of Initial Setting (hours) 47 114 98 118 Compressive Strength (MPa)
1-day 159 42 58 38 3-day 302 174 237 178 7-day 347 265 301 297
28-day 408 414 415 420 91-day 515 501 443 497
Compressive Strength (psi) 1-day 2310 610 840 550 3-day 4380 2520 3440 2580 7-day 5040 3850 4370 4310
28-day 5920 6000 6020 6090 91-day 7470 7270 6430 7210
Length Change () 1-day 0 0 0 0
28-day 0002 0033 0010 0043 140-day -0035 -0017 -0035 0006
28-day Length Change of Mortar in 5 Sodium Sulfate Solution ()
0020 hellip 0033 0009
Cm Cementitious materials (Cement + Fly Ash + Gypsum Wallboard)
45
CHAPTER 8 ECONOMIC IMPACT ANALYSIS OF FULL-
SCALE IMPLEMENTATION
It is estimated that over 80000 tons of gypsum wallboard is disposed of each year from new
construction and demolition in Wisconsin If a tipping fee plus handling and transportation cost
of $30 per ton is assumed the disposal of gypsum wallboard costs Wisconsin citizens and
industry approximately $24 million dollars each year
Based on figures from the National Ready-Mixed Concrete Association Wisconsin produced
approximately 11 million cubic yards (84 million m3) of concrete in 2004 Based on a cement
content of 400 pounds per cubic yard (240 kgm3) of concrete 22 million tons of cement is used
in concrete each year in Wisconsin
This project showed that powdered gypsum wallboard could constitute approximately 10
of total cementitious materials used in a concrete mixture If this new cementitious material was
used in 20 of the concrete produced in Wisconsin approximately 44000 tons of gypsum
wallboard can be used In other words approximately half of the gypsum wallboard waste
generated in Wisconsin could be used in this application alone This would save Wisconsin
industry $13 million dollars each year in avoided disposal costs leading to reduce the cost for
concrete construction in Wisconsin Citizens would benefit also by reducing landfilling cost for
municipalities and increasing recycling rates of useful materials If 40 of the concrete
generated in Wisconsin used this new concrete mixture technology all of the waste gypsum
wallboard generated in Wisconsin could be used in this one application Therefore all 80000
tons of waste gypsum wallboard could be diverted from Wisconsin landfills It would save
Wisconsin citizens and industry over $24 million dollars each year in avoided disposal cost
46
This economic impact does not include incalculable dollar-benefits due to avoided possible
future environmental impact of sending such large quantities of gypsum wallboard into landfills
This project also showed that up to 60 of cement in concrete mixtures could be replaced
with a blend of Class C fly ash and gypsum wallboard Cement is a valuable commodity If it is
assumed that cement sells at $100 per ton and Class C fly ash sells at $50 per ton use of a
cementitious blend consisting of 40 cement 50 Class C fly ash and 10 powdered gypsum
in producing 40 of concrete in Wisconsin would result in savings on cement of about $50
million and expenditure on fly ash of about $20 million with a net savings of about $30 million
each year
Saving cement through this new technology would also reduce emissions of carbon dioxide
and other GHGs because production of one ton of cement releases about one ton of GHGs If
this new technology to use a blend of Class C fly ash and gypsum wallboard as a replacement of
cement were implemented in producing up to 40 of concrete in Wisconsin it would reduce the
GHG emissions by up to 12 million tons each year CO2 credits currently sell for about $20 per
ton Therefore CO2 credits would be worth $10 million each year
With a potential total value of $24 million in avoided disposal costs $30 million in savings
resulting from cement replacement plus $10 million in CO2 credits total economic benefit to
Wisconsin that could be generated by this project may be valued at about $42 million each year
47
CHAPTER 9 CONCLUSIONS
This project showed that from 30 to 60 of cement in concrete mixtures could be
successfully replaced with blends of Class C fly ash and powdered gypsum wallboard Several
concrete mixtures made by such replacements showed compressive strength nearly as high as
that of Reference concrete mixtures (without replacement of cement) at seven days The 28-day
compressive strength of these concrete mixtures containing fly ash and gypsum wallboard were
equivalent to that of Reference concrete mixtures Use of sodium sulfate as an activator was
essential in improving the 1-day and 3-day strength of concrete containing Class C fly ash and
gypsum wallboard
A concrete mixture made with a cementitious blend of 40 cement 50 Class C fly ash
and 10 powdered gypsum wallboard showed a relatively large expansion (0043) during
immersion in saturated limewater and shrunk during drying as much as it had expanded
resulting in very small net expansion at the age of 140 days This concrete mixture could be
used to minimize drying shrinkage cracking and subsequent increase in durability of concrete
A mortar mixture made with a cementitious blend of 40 cement 50 Class C fly ash and
10 powdered gypsum wallboard showed much higher resistance to sulfate attack compared
with Reference mortar (without replacement of cement)
Total economic benefit to Wisconsin that could be generated by this project may be valued at
up to about $42 million each year
48
CHAPTER 10 REFERENCES
ASTM C 33-03 ldquoStandard Specification for Concrete Aggregatesrdquo ASTM International West Conshohocken PA 11 pp
ASTM C 150-05 ldquoStandard Specification for Portland Cementrdquo ASTM International West Conshohocken PA 8 pp
ASTM C 192 C 192M-05 ldquoStandard Practice for Making and Curing Concrete Test Specimens in the Laboratoryrdquo 8 pp
ASTM C 494C 494M-05a ldquoStandard Specification for Chemical Admixtures for Concreterdquo ASTM International West Conshohocken PA 10 pp
ASTM C 618-03 ldquoStandard Specification for Coal Fly Ash and Raw or Calcined Natural Pozzolan for Use in Concreterdquo ASTM International West Conshohocken PA 3 pp
ASTM C 1012-04 ldquoStandard Test Method for Length Change of Hydraulic-Cement Mortars Exposed to a Sulfate Solutionrdquo ASTM International West Conshohocken PA 6 pp
Aimin X and Sarkar S L ldquoMicrostructural Study of Gypsum Activated Fly Ash Hydration in Cement Pasterdquo Cement and Concrete Research Vol 21 1991 pp 1137-1147
Drywallrecyclingorg lthttpwwwdrywallrecyclingorggt (February 2006)
EPA Presentation by the US Environmental Protection Agency at the Massachusetts DEP Gypsum Workgroup March 18 2004
Freeman R B and Carrasquillo R L ldquoProduction of Sulfate-Resistant Concrete Containing High-Calcium Fly Ash and Sodium Sulfate Admixturerdquo Proceedings of Fifth CANMETACI International Conference on Fly Ash Silica Fume Slag and Natural Pozzolans in Concrete ACI SP-153 Vol 1 1995 pp 153-176
ICF Northwest ldquoCalcium Spray Dryer Waste Management Design Guidelinesrdquo EPRI (Electric Power Research Institute) Report No CS-5312 September 1987 p 3-3
Krocak R F Meininger R and Yost P A Chapter 21 ldquoBeneficial Reuse of Aggregate Mineral Fines and Scrap New Construction Wallboardrdquo Land Application of Agricultural Industrial and Municipal By-Products (6) James F Powers and Warren P Dick ed SSSA Number 6 in the Soil Science Society of America Book Series ISBN 0-89118-834-7 Item Number 60901 2000 653 pages
Kumar P K and Monteiro P J M ldquoConcrete Microstructure Properties and Materialsrdquo 2nd Ed McGraw-Hill 1993
Lafarge Group ltwwwlafargecomgt (February 2006)
49
Ma W Liu C Brown P W and Komarneni S ldquoPore Structures of Fly Ashes Activated By Ca(OH)2 and CaSO42H2Ordquo Cement and Concrete Research Vol 25 No 2 1995 pp 417-425
McCall R ldquoWasteCap Wisconsin Drywall-To-Fertilizer Projectrdquo Final Report for the US Environmental Protection Agency August 1993
Merritt F S and Ricketts J T editors Building Design and Construction Handbook McGraw Hill 6th Ed 2001 pp 435-438
Mindness S Young J F and Darwin D ldquoConcreterdquo 2nd Ed Prentice Hall 2002
Naik T R Kraus R N Chun Y-m and Nageotte S O ldquoCoal-Combustion Bottom Ash for Reducing the Shrinkage of Concrete Made With Portland Cement and Sulfoaluminate Cementrdquo Jean Pera Symposium on Specialty Cements and Sustainability Issues a part of the proceedings of the Ninth CANMETACI International Conference on Recent Advances in Concrete Technology Warsaw Poland May 2007 pp 141-155
Neville A ldquoProperties of Concreterdquo 4th Ed Longman 1995
Pera J and Ambroise J ldquoNew Applications of Calcium Sulfoaluminate Cementrdquo Cement and Concrete Research Vol 34 No 4 April 2004 pp 671-676
Prusinski J R and Carrasquillo R L ldquoUsing Medium- to High-Volume Fly Ash Blended Cements to Improve the Sulfate Resistance of High-Lime Fly Ash Concreterdquo Proceedings of Fifth CANMETACI International Conference on Fly Ash Silica Fume Slag and Natural Pozzolans in Concrete ACI SP-153 Vol 1 1995 pp 43-65
Reindl J R ldquoBibliography of Gypsum Drywallrdquo available on the WasteCap Wisconsin website httpwwwwastecapwiorg August 2002 73 pages
WI-DNR ldquoSubstituting Waste Gypsum Wallboard for Agricultural Gypsumrdquo Wisconsin Department of Natural Resources Bureau of Waste Management DNR Publication WA-607-04 rev 2005
Wolkowski R ldquoDemonstration of Land Application of Crushed Gypsum Wallboard Waste for Alfalfardquo Final report to the Wisconsin Department of Natural Resources Waste Reduction and Recycling Grant Program and Dane County Department of Public Works August 12 1998
Wolkowski R P ldquoUsing Recycled Wallboard for Crop Production (A3782)rdquo WasteCap Wisconsin Inc 2003
Wu Z and Naik T R ldquoUse of Clean Coal Ash as Setting Time Regulator in Portland Cementrdquo Proceedings of the Fifth CANMETACI International Conference on Recent Advances in Concrete Technology Supplementary Papers 2001 pp 83-94
50
Wu Z and Naik T R ldquoProperties of Concrete Produced from Multicomponent Blended Cementsrdquo Cement and Concrete Research Vol 32 2002 pp 1937-1942
Wu Z and Naik T R ldquoChemically Activated Blended Cementsrdquo ACI Materials Journal September-October 2003 pp 434-440
- 08 Naik Chun cover
- 08 MIL NaikGypsumWallboard in concrete
-
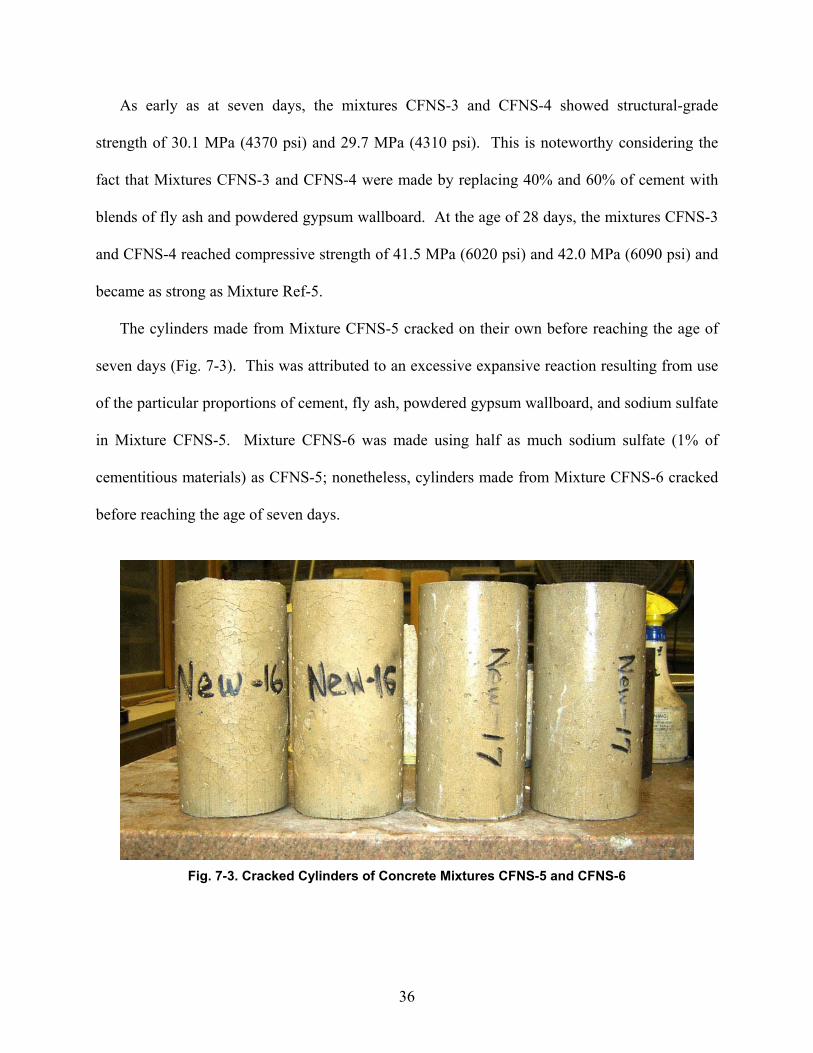
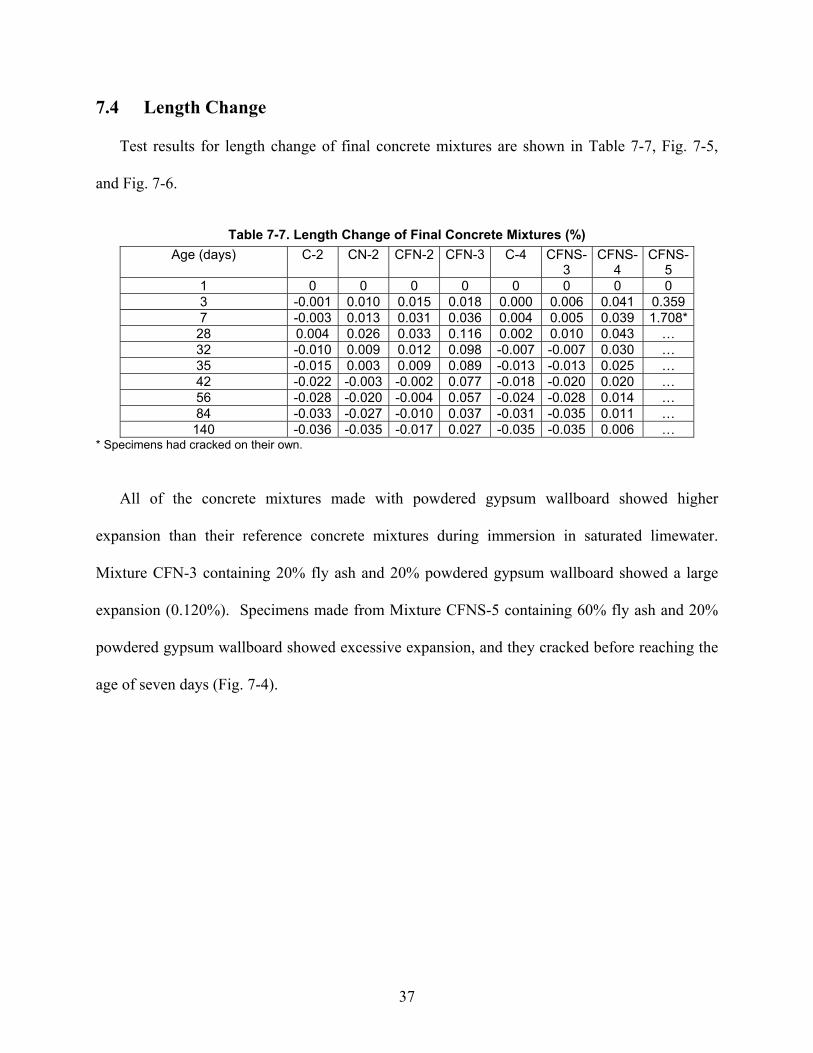
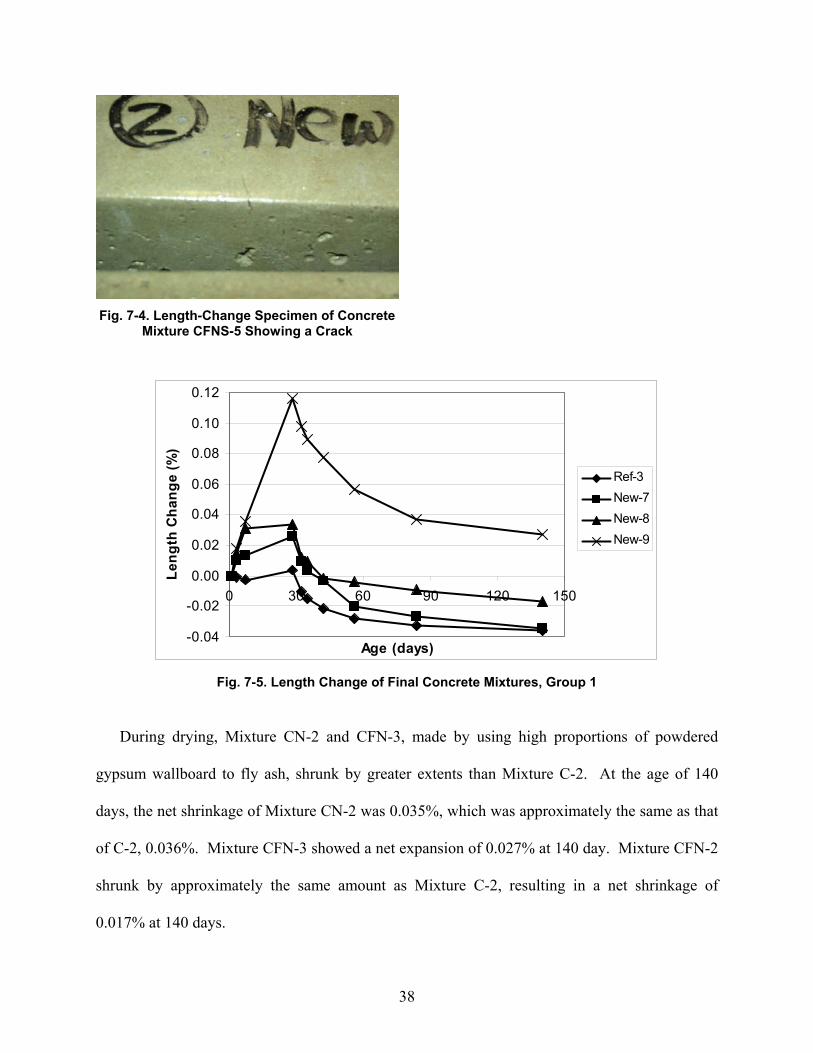
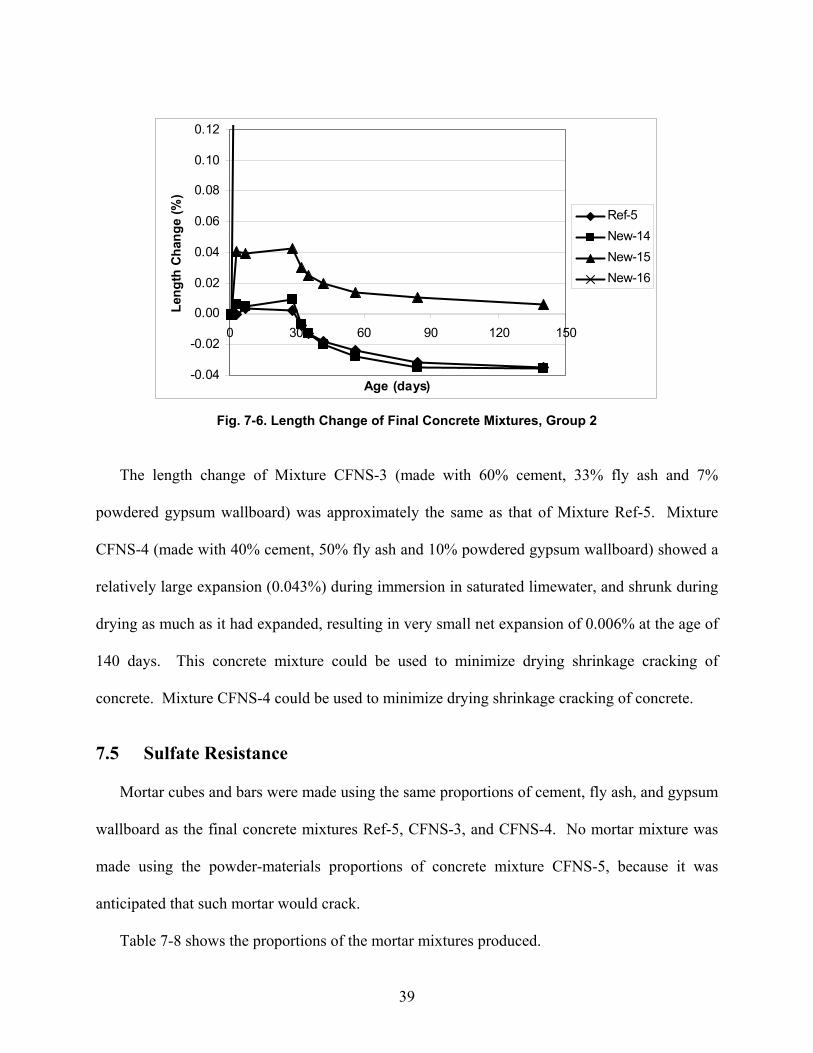
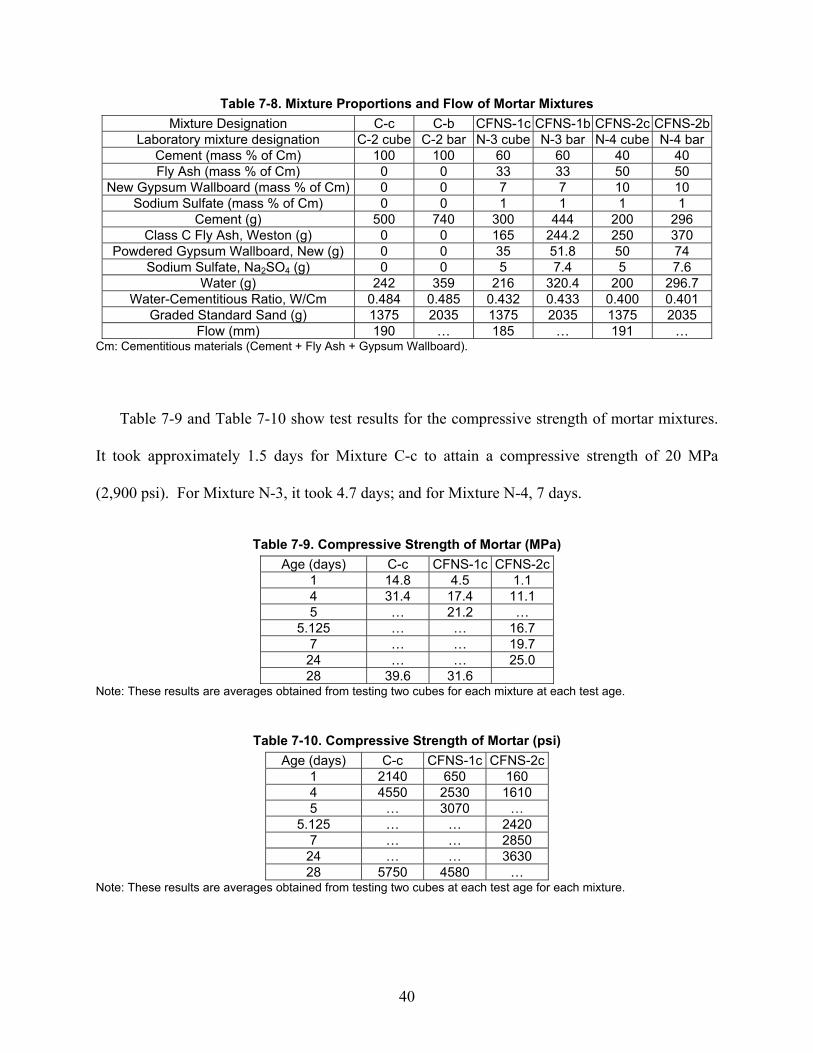
40
Table 7-8 Mixture Proportions and Flow of Mortar Mixtures Mixture Designation C-c C-b CFNS-1c CFNS-1b CFNS-2c CFNS-2b
Laboratory mixture designation C-2 cube C-2 bar N-3 cube N-3 bar N-4 cube N-4 barCement (mass of Cm) 100 100 60 60 40 40 Fly Ash (mass of Cm) 0 0 33 33 50 50
New Gypsum Wallboard (mass of Cm) 0 0 7 7 10 10 Sodium Sulfate (mass of Cm) 0 0 1 1 1 1
Cement (g) 500 740 300 444 200 296 Class C Fly Ash Weston (g) 0 0 165 2442 250 370
Powdered Gypsum Wallboard New (g) 0 0 35 518 50 74 Sodium Sulfate Na2SO4 (g) 0 0 5 74 5 76
Water (g) 242 359 216 3204 200 2967 Water-Cementitious Ratio WCm 0484 0485 0432 0433 0400 0401
Graded Standard Sand (g) 1375 2035 1375 2035 1375 2035 Flow (mm) 190 hellip 185 hellip 191 hellip
Cm Cementitious materials (Cement + Fly Ash + Gypsum Wallboard) Table 7-9 and Table 7-10 show test results for the compressive strength of mortar mixtures
It took approximately 15 days for Mixture C-c to attain a compressive strength of 20 MPa
(2900 psi) For Mixture N-3 it took 47 days and for Mixture N-4 7 days
Table 7-9 Compressive Strength of Mortar (MPa) Age (days) C-c CFNS-1c CFNS-2c
1 148 45 11 4 314 174 111 5 hellip 212 hellip
5125 hellip hellip 167 7 hellip hellip 197 24 hellip hellip 250 28 396 316
Note These results are averages obtained from testing two cubes for each mixture at each test age
Table 7-10 Compressive Strength of Mortar (psi) Age (days) C-c CFNS-1c CFNS-2c
1 2140 650 160 4 4550 2530 1610 5 hellip 3070 hellip
5125 hellip hellip 2420 7 hellip hellip 2850 24 hellip hellip 3630 28 5750 4580 hellip
Note These results are averages obtained from testing two cubes at each test age for each mixture
41
0
5
10
15
20
25
30
35
40
45
0 5 10 15 20 25 30Age (days)
Com
pres
sive
Str
engt
h (p
si)
0
1000
2000
3000
4000
5000
6000
(MP
a)
C-2N-3N-4
Fig 7-7 Compressive Strength of Mortar Cubes
Once the mixture attained the specified compressive strength of 20 MPa (2900 psi) the
mortar bars were immersed in a 5 sodium sulfate solution and length change of the bars were
measured after specified periods to assess sulfate resistance of mortar mixtures Table 7-11 and
Fig 7-8 show test results for length change of mortar bars A larger expansion implies a lower
resistance of mortar mixture to sulfate attack and a smaller expansion implies a higher resistance
to sulfate attack
Table 7-11 Length Change of Mortar Bars () Age after immersion in 5 sodium sulfate
solution (days) C-b CFNS-1b CFNS-2b
0 0 0 0 7 0007 0016 0006 14 0013 0024 0009 21 0016 0028 0009 28 0020 0033 0009 42 0027 0044 0011 56 0034 0063 0010
Number of specimens tested C-b five N-1-b six and N-2-b three
42
000
001
002
003
004
005
006
007
0 7 14 21 28 35 42 49 56 63
Days after immersion in Na2SO4 solution
Len
gth
Cha
nge
()
C-bCFNS-1bCFNS-2b
Fig 7-8 Length Change of Mortar Bars in 5 Sodium Sulfate Solution
After 56 days of immersion in sodium sulfate solution Mixture C-b (Control) showed an
expansion of approximately 0034 Mixture N-3 (made with 33 fly ash and 7 powdered
gypsum wallboard and 1 sodium sulfate) shows an expansion of 0063 which was
approximately 19 times that of Mixture C-b Mixture N-4 (made with 50 fly ash 10
powdered gypsum wallboard and 1 sodium sulfate) showed an expansion of 0010 which is
significantly lower than that of Mixture C-b (Control) This means that Mixture N-4 possesses
significantly higher resistance to sulfate attack than Mixture C-b Importantly the expansion of
mortar bars made from Mixture N-4 stabilized after 14 days of immersion in sodium sulfate
solution
76 Summary
Table 7-12 shows a summary of proportions of powder materials and properties of final
concrete mixtures Table 7-13 shows a summary of proportions and length change in sulfate
solution of mortar mixtures
43
Table 7-12 Proportions of Powder Materials and Properties of Final Concrete Mixtures Mixture Designation C-2 CN-2 CFN-2 CFN-3 C-4 CFNS-
3 CFNS-
4 CFNS-
5 Cement (mass of Cm) 100 90 70 60 100 60 40 20 Fly Ash (mass of Cm) 0 0 20 20 0 33 50 60
New Gypsum Wallboard (mass of Cm) 0 10 10 20 0 7 10 20 Sodium Sulfate (mass of Cm) 0 0 0 0 0 1 1 2
Time of Initial Setting (hours) 48 72 114 120 47 98 118 105 Compressive Strength (MPa)
1-day 168 111 42 39 159 58 38 24 3-day 301 197 174 132 302 237 178 79 7-day 354 232 265 154 347 301 297 125
28-day 448 285 414 211 408 415 420 hellip 91-day 508 419 501 289 515 443 497 hellip
Compressive Strength (psi) 1-day 2430 1610 610 560 2310 840 550 350 3-day 4360 2860 2520 1910 4380 3440 2580 1140 7-day 5140 3370 3850 2240 5040 4370 4310 1810
28-day 6500 4140 6000 3060 5920 6020 6090 hellip 91-day 7370 6070 7270 4190 7470 6430 7210 hellip
Length Change () 1-day 0 0 0 0 0 0 0 0 7-day -0003 0013 0031 0036 0004 0005 0039 1708
28-day 0004 0026 0033 0116 0002 0010 0043 hellip 140-day -0036 -0035 -0017 0027 -0035 -0035 0006 hellip
Cm Cementitious materials (Cement + Fly Ash + Gypsum Wallboard) Specimens had cracked on their own
Table 7-13 Proportions of Powder Materials and Length Change in Sulfate Solution of Mortar Mixtures
Mixture Designation C-b CFNS-1b
CFNS-2b
Laboratory mixture designation Cement (mass of Cm) 100 60 40 Fly Ash (mass of Cm) 0 33 50
New Gypsum Wallboard (mass of Cm) 0 7 10 Sodium Sulfate (mass of Cm) 0 1 1
Length Change in 5 Sodium Sulfate Solution () 0-day 0 0 0 7-day 0007 0016 0006
14-day 0013 0024 0009 21-day 0016 0028 0009 28-day 0020 0033 0009 42-day 0027 0044 0011 56-day 0034 0063 0010
44
Table 7-14 shows a summary of properties of selected promising main concrete mixtures
Mixtures CFN-2 CFNS-3 and CFNS-4 were comparable to their reference concrete mixtures in
compressive strength at the ages of 7 days and later Based on the sulfate resistance of Mortar
N-4 it is expected that concrete Mixture CFNS-4 will also possess high resistance to sulfate
attack
Table 7-14 Summary of Proportions and Properties of Selected Final Concrete Mixtures and Mortar Mixtures
Mixture Designation C-4 CFN-2 CFNS-3
CFNS-4
Cement (mass of Cm) 100 70 60 40 Fly Ash (mass of Cm) 0 20 33 50
New Gypsum Wallboard (mass of Cm) 0 10 7 10 Sodium Sulfate (mass of Cm) 0 0 1 1
Time of Initial Setting (hours) 47 114 98 118 Compressive Strength (MPa)
1-day 159 42 58 38 3-day 302 174 237 178 7-day 347 265 301 297
28-day 408 414 415 420 91-day 515 501 443 497
Compressive Strength (psi) 1-day 2310 610 840 550 3-day 4380 2520 3440 2580 7-day 5040 3850 4370 4310
28-day 5920 6000 6020 6090 91-day 7470 7270 6430 7210
Length Change () 1-day 0 0 0 0
28-day 0002 0033 0010 0043 140-day -0035 -0017 -0035 0006
28-day Length Change of Mortar in 5 Sodium Sulfate Solution ()
0020 hellip 0033 0009
Cm Cementitious materials (Cement + Fly Ash + Gypsum Wallboard)
45
CHAPTER 8 ECONOMIC IMPACT ANALYSIS OF FULL-
SCALE IMPLEMENTATION
It is estimated that over 80000 tons of gypsum wallboard is disposed of each year from new
construction and demolition in Wisconsin If a tipping fee plus handling and transportation cost
of $30 per ton is assumed the disposal of gypsum wallboard costs Wisconsin citizens and
industry approximately $24 million dollars each year
Based on figures from the National Ready-Mixed Concrete Association Wisconsin produced
approximately 11 million cubic yards (84 million m3) of concrete in 2004 Based on a cement
content of 400 pounds per cubic yard (240 kgm3) of concrete 22 million tons of cement is used
in concrete each year in Wisconsin
This project showed that powdered gypsum wallboard could constitute approximately 10
of total cementitious materials used in a concrete mixture If this new cementitious material was
used in 20 of the concrete produced in Wisconsin approximately 44000 tons of gypsum
wallboard can be used In other words approximately half of the gypsum wallboard waste
generated in Wisconsin could be used in this application alone This would save Wisconsin
industry $13 million dollars each year in avoided disposal costs leading to reduce the cost for
concrete construction in Wisconsin Citizens would benefit also by reducing landfilling cost for
municipalities and increasing recycling rates of useful materials If 40 of the concrete
generated in Wisconsin used this new concrete mixture technology all of the waste gypsum
wallboard generated in Wisconsin could be used in this one application Therefore all 80000
tons of waste gypsum wallboard could be diverted from Wisconsin landfills It would save
Wisconsin citizens and industry over $24 million dollars each year in avoided disposal cost
46
This economic impact does not include incalculable dollar-benefits due to avoided possible
future environmental impact of sending such large quantities of gypsum wallboard into landfills
This project also showed that up to 60 of cement in concrete mixtures could be replaced
with a blend of Class C fly ash and gypsum wallboard Cement is a valuable commodity If it is
assumed that cement sells at $100 per ton and Class C fly ash sells at $50 per ton use of a
cementitious blend consisting of 40 cement 50 Class C fly ash and 10 powdered gypsum
in producing 40 of concrete in Wisconsin would result in savings on cement of about $50
million and expenditure on fly ash of about $20 million with a net savings of about $30 million
each year
Saving cement through this new technology would also reduce emissions of carbon dioxide
and other GHGs because production of one ton of cement releases about one ton of GHGs If
this new technology to use a blend of Class C fly ash and gypsum wallboard as a replacement of
cement were implemented in producing up to 40 of concrete in Wisconsin it would reduce the
GHG emissions by up to 12 million tons each year CO2 credits currently sell for about $20 per
ton Therefore CO2 credits would be worth $10 million each year
With a potential total value of $24 million in avoided disposal costs $30 million in savings
resulting from cement replacement plus $10 million in CO2 credits total economic benefit to
Wisconsin that could be generated by this project may be valued at about $42 million each year
47
CHAPTER 9 CONCLUSIONS
This project showed that from 30 to 60 of cement in concrete mixtures could be
successfully replaced with blends of Class C fly ash and powdered gypsum wallboard Several
concrete mixtures made by such replacements showed compressive strength nearly as high as
that of Reference concrete mixtures (without replacement of cement) at seven days The 28-day
compressive strength of these concrete mixtures containing fly ash and gypsum wallboard were
equivalent to that of Reference concrete mixtures Use of sodium sulfate as an activator was
essential in improving the 1-day and 3-day strength of concrete containing Class C fly ash and
gypsum wallboard
A concrete mixture made with a cementitious blend of 40 cement 50 Class C fly ash
and 10 powdered gypsum wallboard showed a relatively large expansion (0043) during
immersion in saturated limewater and shrunk during drying as much as it had expanded
resulting in very small net expansion at the age of 140 days This concrete mixture could be
used to minimize drying shrinkage cracking and subsequent increase in durability of concrete
A mortar mixture made with a cementitious blend of 40 cement 50 Class C fly ash and
10 powdered gypsum wallboard showed much higher resistance to sulfate attack compared
with Reference mortar (without replacement of cement)
Total economic benefit to Wisconsin that could be generated by this project may be valued at
up to about $42 million each year
48
CHAPTER 10 REFERENCES
ASTM C 33-03 ldquoStandard Specification for Concrete Aggregatesrdquo ASTM International West Conshohocken PA 11 pp
ASTM C 150-05 ldquoStandard Specification for Portland Cementrdquo ASTM International West Conshohocken PA 8 pp
ASTM C 192 C 192M-05 ldquoStandard Practice for Making and Curing Concrete Test Specimens in the Laboratoryrdquo 8 pp
ASTM C 494C 494M-05a ldquoStandard Specification for Chemical Admixtures for Concreterdquo ASTM International West Conshohocken PA 10 pp
ASTM C 618-03 ldquoStandard Specification for Coal Fly Ash and Raw or Calcined Natural Pozzolan for Use in Concreterdquo ASTM International West Conshohocken PA 3 pp
ASTM C 1012-04 ldquoStandard Test Method for Length Change of Hydraulic-Cement Mortars Exposed to a Sulfate Solutionrdquo ASTM International West Conshohocken PA 6 pp
Aimin X and Sarkar S L ldquoMicrostructural Study of Gypsum Activated Fly Ash Hydration in Cement Pasterdquo Cement and Concrete Research Vol 21 1991 pp 1137-1147
Drywallrecyclingorg lthttpwwwdrywallrecyclingorggt (February 2006)
EPA Presentation by the US Environmental Protection Agency at the Massachusetts DEP Gypsum Workgroup March 18 2004
Freeman R B and Carrasquillo R L ldquoProduction of Sulfate-Resistant Concrete Containing High-Calcium Fly Ash and Sodium Sulfate Admixturerdquo Proceedings of Fifth CANMETACI International Conference on Fly Ash Silica Fume Slag and Natural Pozzolans in Concrete ACI SP-153 Vol 1 1995 pp 153-176
ICF Northwest ldquoCalcium Spray Dryer Waste Management Design Guidelinesrdquo EPRI (Electric Power Research Institute) Report No CS-5312 September 1987 p 3-3
Krocak R F Meininger R and Yost P A Chapter 21 ldquoBeneficial Reuse of Aggregate Mineral Fines and Scrap New Construction Wallboardrdquo Land Application of Agricultural Industrial and Municipal By-Products (6) James F Powers and Warren P Dick ed SSSA Number 6 in the Soil Science Society of America Book Series ISBN 0-89118-834-7 Item Number 60901 2000 653 pages
Kumar P K and Monteiro P J M ldquoConcrete Microstructure Properties and Materialsrdquo 2nd Ed McGraw-Hill 1993
Lafarge Group ltwwwlafargecomgt (February 2006)
49
Ma W Liu C Brown P W and Komarneni S ldquoPore Structures of Fly Ashes Activated By Ca(OH)2 and CaSO42H2Ordquo Cement and Concrete Research Vol 25 No 2 1995 pp 417-425
McCall R ldquoWasteCap Wisconsin Drywall-To-Fertilizer Projectrdquo Final Report for the US Environmental Protection Agency August 1993
Merritt F S and Ricketts J T editors Building Design and Construction Handbook McGraw Hill 6th Ed 2001 pp 435-438
Mindness S Young J F and Darwin D ldquoConcreterdquo 2nd Ed Prentice Hall 2002
Naik T R Kraus R N Chun Y-m and Nageotte S O ldquoCoal-Combustion Bottom Ash for Reducing the Shrinkage of Concrete Made With Portland Cement and Sulfoaluminate Cementrdquo Jean Pera Symposium on Specialty Cements and Sustainability Issues a part of the proceedings of the Ninth CANMETACI International Conference on Recent Advances in Concrete Technology Warsaw Poland May 2007 pp 141-155
Neville A ldquoProperties of Concreterdquo 4th Ed Longman 1995
Pera J and Ambroise J ldquoNew Applications of Calcium Sulfoaluminate Cementrdquo Cement and Concrete Research Vol 34 No 4 April 2004 pp 671-676
Prusinski J R and Carrasquillo R L ldquoUsing Medium- to High-Volume Fly Ash Blended Cements to Improve the Sulfate Resistance of High-Lime Fly Ash Concreterdquo Proceedings of Fifth CANMETACI International Conference on Fly Ash Silica Fume Slag and Natural Pozzolans in Concrete ACI SP-153 Vol 1 1995 pp 43-65
Reindl J R ldquoBibliography of Gypsum Drywallrdquo available on the WasteCap Wisconsin website httpwwwwastecapwiorg August 2002 73 pages
WI-DNR ldquoSubstituting Waste Gypsum Wallboard for Agricultural Gypsumrdquo Wisconsin Department of Natural Resources Bureau of Waste Management DNR Publication WA-607-04 rev 2005
Wolkowski R ldquoDemonstration of Land Application of Crushed Gypsum Wallboard Waste for Alfalfardquo Final report to the Wisconsin Department of Natural Resources Waste Reduction and Recycling Grant Program and Dane County Department of Public Works August 12 1998
Wolkowski R P ldquoUsing Recycled Wallboard for Crop Production (A3782)rdquo WasteCap Wisconsin Inc 2003
Wu Z and Naik T R ldquoUse of Clean Coal Ash as Setting Time Regulator in Portland Cementrdquo Proceedings of the Fifth CANMETACI International Conference on Recent Advances in Concrete Technology Supplementary Papers 2001 pp 83-94
50
Wu Z and Naik T R ldquoProperties of Concrete Produced from Multicomponent Blended Cementsrdquo Cement and Concrete Research Vol 32 2002 pp 1937-1942
Wu Z and Naik T R ldquoChemically Activated Blended Cementsrdquo ACI Materials Journal September-October 2003 pp 434-440
- 08 Naik Chun cover
- 08 MIL NaikGypsumWallboard in concrete
-
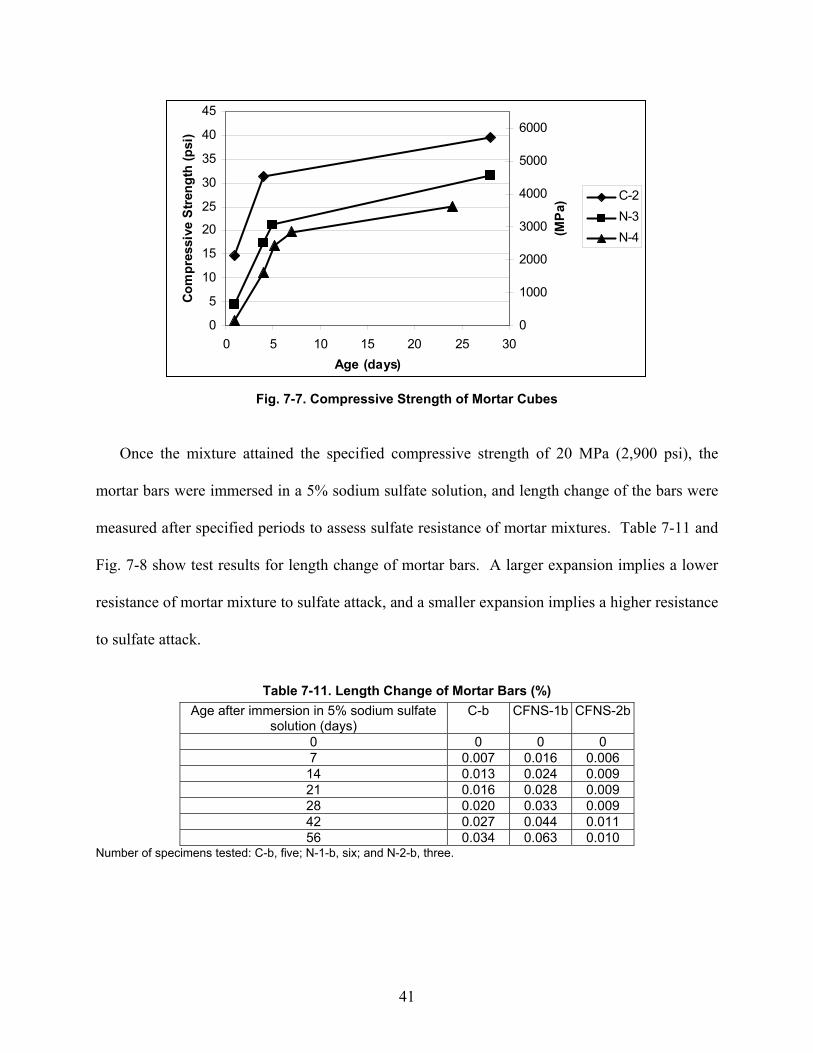
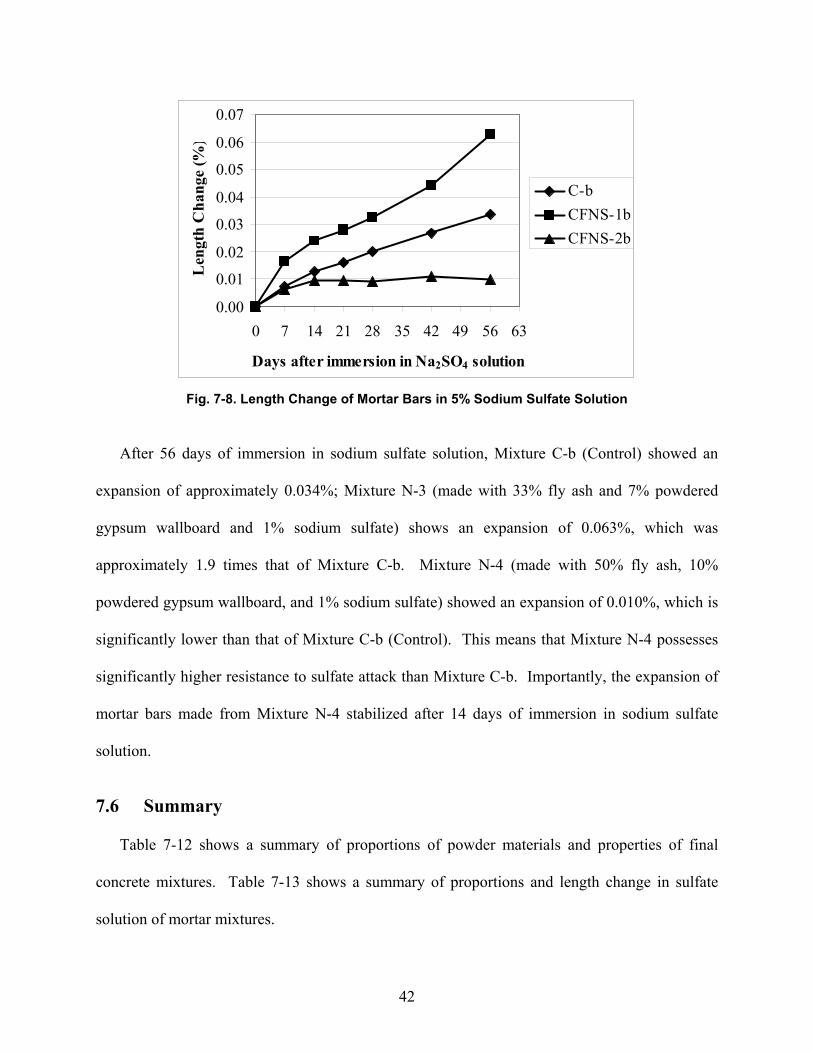
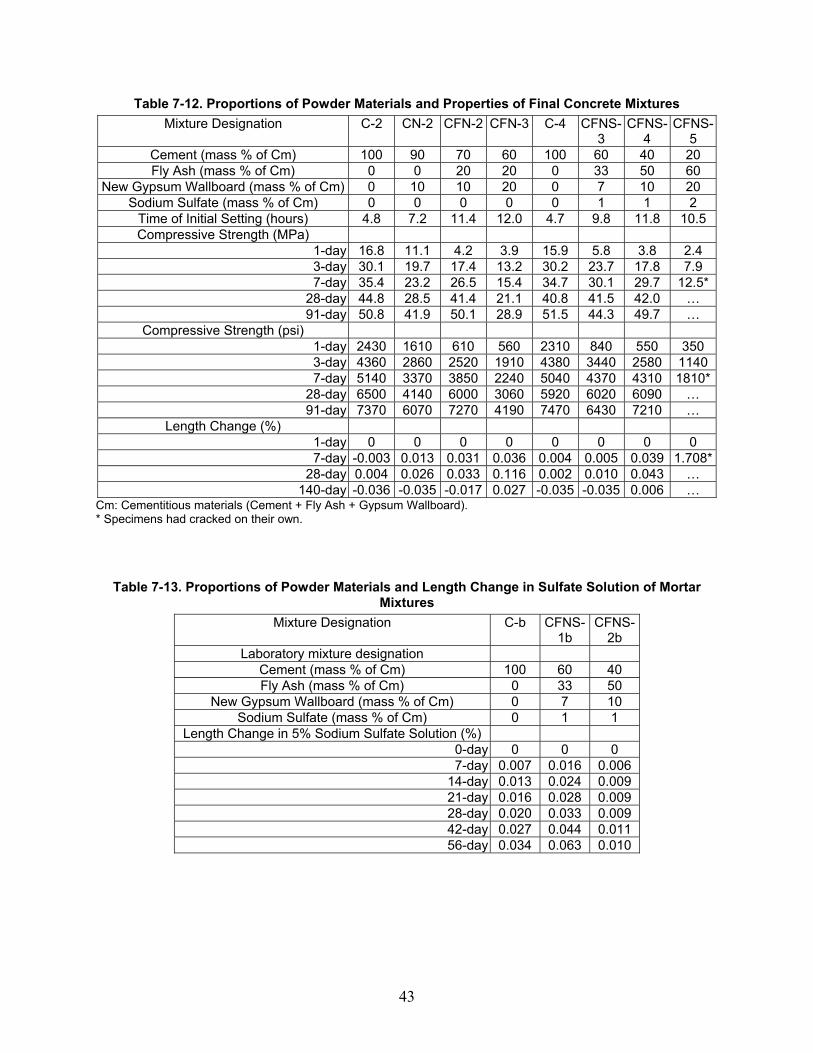
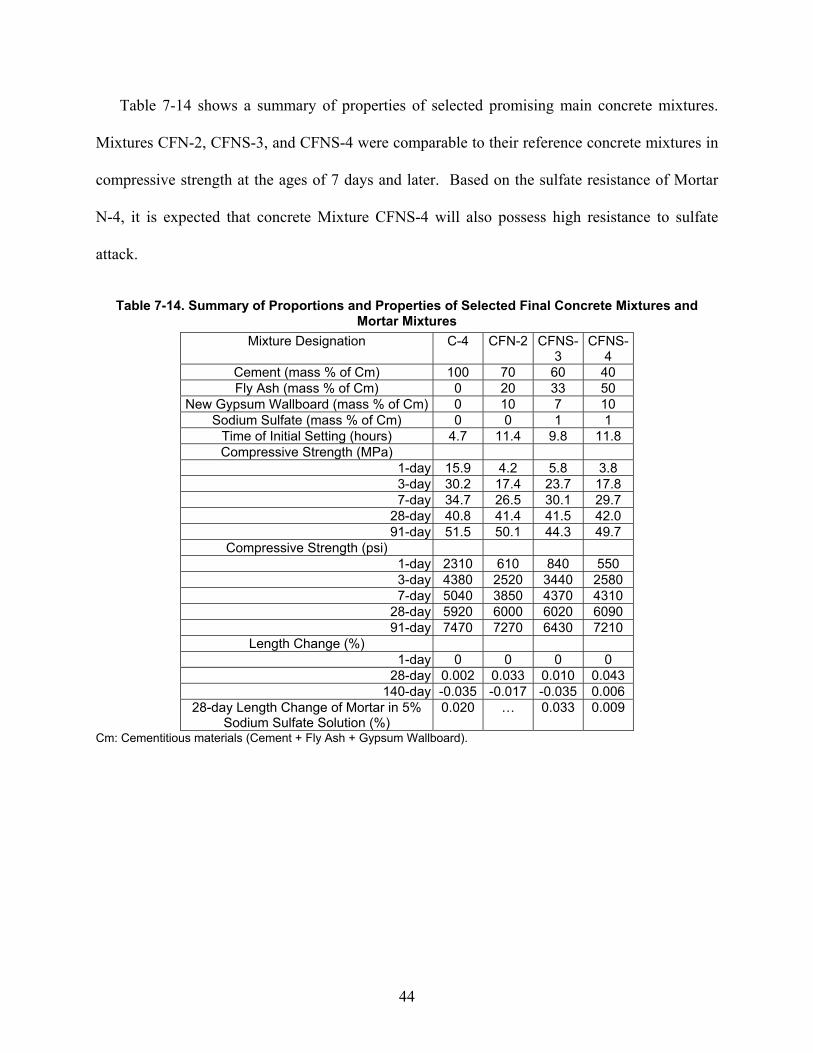