
Jon Schendt University of Wisconsin-Platteville Image Processing – A Computational Approach.
IMPLEMENTING KEY PERFORMANCE INDICATORS (KPI) METRICS IN A WAREHOUSE SETTING 1
UNIVERSITY OF WISCONSIN, PLATTEVILLE
UNITED STATES OF AMERICA
The attached educational project, by JOHN GAFFNEY, entitled IMPLEMENTING KEY
PERFORMANCE INDICATORS (KPI) METRICS IN A WAREHOUSE SETTING, when
completed, is to be submitted to the Graduate Faculty of the University of Wisconsin-Platteville
in partial fulfillment of the requirements for the (MASTER OF SCIENCE IN INTEGRATED
SUPPLY CHAIN MANAGEMENT) degree.
Approved: _______________________________Date: _________________________
Project Advisor
Professor Xiaotong Liu, PhD
12/27/2020
IMPLEMENTING KEY PERFORMANCE INDICATORS (KPI) METRICS IN A WAREHOUSE SETTING 2
A Seminar Paper
Submitted to
The Graduate Faculty of the
University of Wisconsin – Platteville
In Partial Fulfillment
For the Degree of
MASTER OF SCIENCE IN INTEGRATED SUPPLY CHAIN MANAGEMENT
By
JOHN GAFFNEY
Year of Graduation: Fall 2020
IMPLEMENTING KEY PERFORMANCE INDICATORS (KPI) METRICS IN A WAREHOUSE SETTING 3
ABSTRACT
This seminar research paper will focus on the ramifications of implementing KPI (Key
Performance Indicators) metrics in a warehouse setting as compared to those who simply hire
employees and hope they have enough staff to work in a Safe, Accurate, Fast, and Efficient
(S.A.F.E.) manner. The primary purpose of this research is to highlight commonly used KPI
metrics in the industry while providing advantages and disadvantages of others that exist.
IMPLEMENTING KEY PERFORMANCE INDICATORS (KPI) METRICS IN A WAREHOUSE SETTING 4
TABLE OF CONTENTS
Page
APPROVAL PAGE I
TITLE PAGE II
ABSTRACT III
TABLE OF CONTENTS IV
INTRODUCTION 5-6
LITERATURE REVIEW 7
DISCUSSION 8-19
CONCLUSION 20
REFERENCES 21
IMPLEMENTING KEY PERFORMANCE INDICATORS (KPI) METRICS IN A WAREHOUSE SETTING 5
INTRODUCTION
A number of companies often open warehouse operations with little to no thought about
Key Performance Indicator (KPI) metrics and ideas regarding how large the number of
employees needs to be to run it (until well after the warehouse is already up and running). Key
Performance Indicators (KPI’s) refer to “a set of quantifiable measurements used to gauge a
company’s overall long-term performance” (Investopedia.com, 2020). KPI’s are used for
individuals and branches within the company. Businesses can save themselves valuable time,
money, and resources by setting up their operation in a manner to maximize efficiencies and
measure productivity. KPI metrics can achieve both goals (and many more) if implemented
sooner than later.
The primary purpose of this research is to highlight commonly used metrics in the
industry while offering up advantages and disadvantages of others that exist (but may not have
been discussed or considered by many companies).
An additional purpose of this research paper is to illustrate what kind of operations
decisions can be made (once some raw data is made available). For example, an employee may
be found to score high in one metric, but low in another. This employee can then be re-assigned
to take advantage of their better skill set. By the same token, an employee can be re-trained or be
held to disciplinary standards should they continue to fall below established standards.
The significance of this research resides within its ability to assist warehouse
management teams with making decisions that address what is typically the number one or two
expense in that company’s department: Wages and Salaries (as well as Overtime). When
companies implement metrics, they can gradually steer their employees toward established goals

IMPLEMENTING KEY PERFORMANCE INDICATORS (KPI) METRICS IN A WAREHOUSE SETTING 6 to reduce costs and maintain or improve productivity. For example, an employee that is picking
50% of the established KPI rate will decrease costs if they pick at 90-100% of rate by decreasing
the need to hire a second employee (at 50% to achieve the needed 100%).
IMPLEMENTING KEY PERFORMANCE INDICATORS (KPI) METRICS IN A WAREHOUSE SETTING 7
LITERATURE REVIEW
“As supply chains get more and more advanced, the number of tools used to measure
warehouse performance will also increase” (Nelson, 2001). Metrics that are used for
performance evaluations are not always a good indicator as the ONLY measurement for an
employee’s performance. For that reason, this literature review will focus on operational
warehouse performance measurements ONLY. “Warehouse managers need to carry out periodic
data analysis based upon Key Performance Indicators (KPI)” (Paul R. Murphy, 2018). Some KPI
examples include pallets per hour picked or cases replenished per hour. The specific performance
indicators for this paper will include data compilation and analysis gathered from professional
journals, books, periodicals, and websites. The data will look at KPI metrics as they relate to
productivity, time, cost, and quality for warehouse operations. Based upon the literature review
and analysis, the paper will provide past and present trends in warehouses as well as provide a
framework for warehouse managers to base their decisions on how to measure specific aspects of
their operation. Each KPI metric will be clearly defined, specific aspects of how to measure that
KPI, and a framework providing their limitations.
IMPLEMENTING KEY PERFORMANCE INDICATORS (KPI) METRICS IN A WAREHOUSE SETTING 8
DISCUSSION
In the field of warehouse management (as with MANY fields in the current business
climate), employers are seeking out methods of evaluating and measuring the overall
productivity of their employees. Warehouses utilize a number of pieces of equipment (including
forklifts, cherry pickers, pallet jacks, and pacers just to name a few). Those same warehouses
also utilize different racking systems, Warehouse Management Systems (WMS) and almost
always have different skill levels for their workforce. In order to manage these challenges, it is
important for employers to establish safe, reliable, and attainable goals as set forth by common
Key Performance Indicators (KPI) metrics. KPI’s “allow you to set a benchmark for month-on-
month improvements and help identify areas that will have a direct effect on both overall
business costs and customer satisfaction” (veequo.com, 2020). It’s up to the Warehouse
management team to choose, implement, and track these KPI. The frequency of KPI metrics can
be adjusted accordingly as well. The following list defines warehouse KPIs that (if improved
upon) can help to put a warehouse on track to save on costs and to increase both individual and
company overall performance.
• Carrying Cost of Inventory (Inventory Carrying Rate × Average Inventory Value
= Carrying Cost of Inventory)
A warehouse manager tries to avoid stagnant inventory due to the extreme costs
associated with goods that are not turning over. Quantifying specific inventory
costs (such as capital costs, risk, and service costs to name just a few) gives a
warehouse manager the ability to select better buying and forecasting options.
IMPLEMENTING KEY PERFORMANCE INDICATORS (KPI) METRICS IN A WAREHOUSE SETTING 9
Once these more advantageous buying and forecasting options are implemented,
it should lead to higher turnover and lower carrying costs.
• Inventory Turnover (Cost of Goods Sold) / (Average Inventory) = Inventory
Turnover)
When a warehouse manager knows the inventory turnover rate, they also will be
aware that the higher the rate of inventory turnover, then the higher the product
demand. A Warehouse Management System (WMS) is designed to provide
inventory tracking, movement of goods, and overall material visibility. Some
notable WMS systems include SAP, JDE, the AS400, and Supply Rite (just to
name a few). A company’s inventory turnover KPI details how many times per
year a particular inventory item is re-ordered. Businesses can then compare their
rate against competitors and industry averages to gauge the performance of their
distribution center.
• Inventory to sales ratio (End of Month Inventory Balance) / (Sales for Same
Month) = Inventory to Sales Ratio)
A company’s ability to withstand unanticipated disruptions to their sales
projections (or not) is revealed by utilizing an inventory-to-sales ratio. Warehouse
managers can use this ratio to help pinpoint early cash-flow problems by
comparing increased inventory levels to declining sales figures. Back orders can
even be prevented by showing that an increase in sales and an increase in buying
will be able to satisfy said demand. By dedicating time for monitoring this KPI,
warehouse managers can use it as a tool for inventory forecasting and to predict
other upcoming needs.
IMPLEMENTING KEY PERFORMANCE INDICATORS (KPI) METRICS IN A WAREHOUSE SETTING 10
• Inventory Accuracy (Database Inventory Count) / (Physical Inventory Count) =
Inventory Accuracy)
The physical inventory accuracy should always match the figures that are listed in
the Warehouse Management System (WMS). However, in many cases, the larger
the distribution center, the larger the gap in quantity tends to be. The higher the
rate of inaccuracies, the higher the number of back orders (and oftentimes)
canceled orders. Customer service typically takes a hit when inventory levels are
not as they are said they were in the WMS. The result of inaccurate inventory
levels tends to be overall higher costs. An inventory accuracy rate can be
improved by conducting cycle counts, announced (and unannounced) spot checks,
and by performing more regular checks of higher sales volume inventory items
against the WMS.
• Inventory Shrinkage (Cost of Recorded Inventory – Cost of Physical Inventory) /
(Cost of Recorded Inventory) = Inventory Shrinkage)
Inventory shrinkage is typically an inventory cost that is associated with internal
losses in goods. The Inventory Shrinkage KPI is used to calculate the loss of
inventory due to a number of reasons. Some of those reasons include (but are not
limited to): employee theft, warehouse damages during either the receiving or
picking/shipping process, lost inventory, and even fraud on the part of the
supplier. The Inventory Shrinkage KPI is calculated by comparing WMS
inventory levels against the actual physical inventory. The difference will equal
the shrinkage rate. A low rate of shrinkage will have little to no impact on a
IMPLEMENTING KEY PERFORMANCE INDICATORS (KPI) METRICS IN A WAREHOUSE SETTING 11
business. However, a high rate will prove to be extremely costly for a business’
profitability.
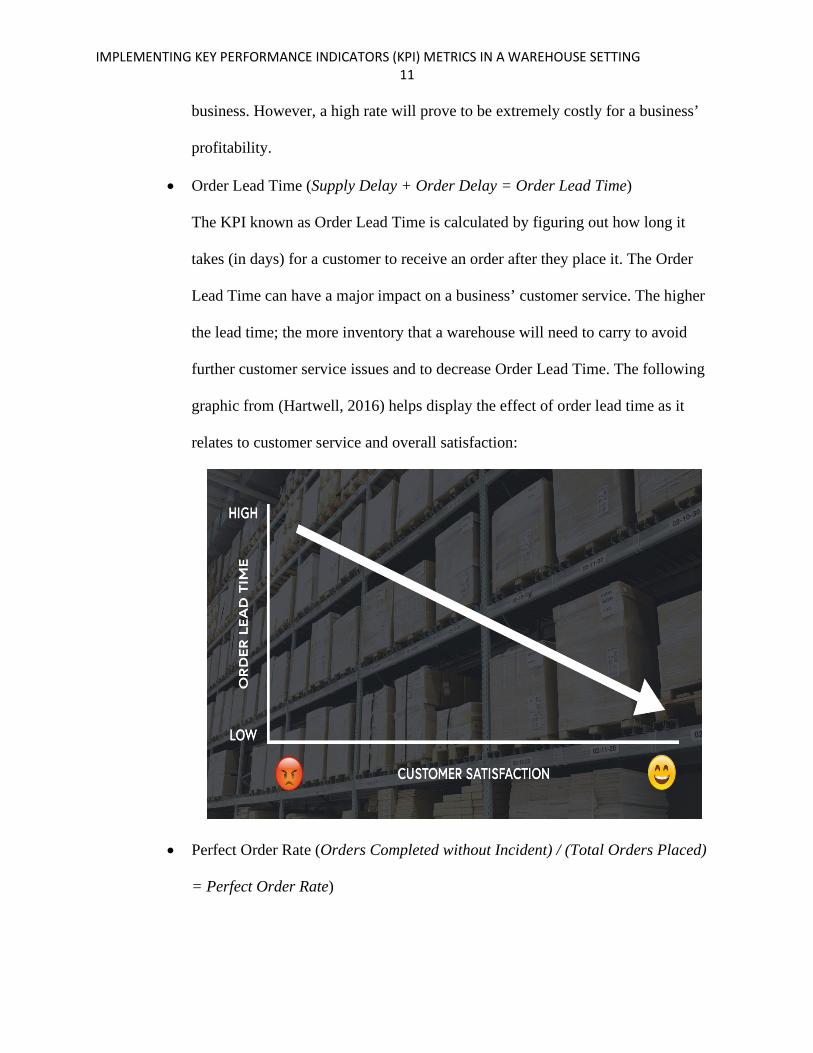
• Order Lead Time (Supply Delay + Order Delay = Order Lead Time)
The KPI known as Order Lead Time is calculated by figuring out how long it
takes (in days) for a customer to receive an order after they place it. The Order
Lead Time can have a major impact on a business’ customer service. The higher
the lead time; the more inventory that a warehouse will need to carry to avoid
further customer service issues and to decrease Order Lead Time. The following
graphic from (Hartwell, 2016) helps display the effect of order lead time as it
relates to customer service and overall satisfaction:
• Perfect Order Rate (Orders Completed without Incident) / (Total Orders Placed)
= Perfect Order Rate)
IMPLEMENTING KEY PERFORMANCE INDICATORS (KPI) METRICS IN A WAREHOUSE SETTING 12
The Perfect Order Rate KPI calculates how many orders that the warehouse is
able to deliver accurately. The right inventory must be picked exactly to standard.
For example, the right color, size, texture, and specifications of an inventory item
must be picked and shipped exactly as the customer requested. In addition, the
inventory must also be received in pristine condition by the customer that ordered
it. Having a quality control department in a warehouse operation often aides in
assuring orders are being picked and processed as ordered.
• Order Picking Accuracy (Total Number of Orders) / (Perfect Order Rate) =
Order Picking Accuracy)
Order Picking Accuracy is a closely related KPI to Perfect Order Rate. For Order
Picking Accuracy, the actual pickers can be looked at more closely to gauge if
there are any gaps in training or if inventory items are simply being picked
inaccurately by the distribution center employees. Inaccurate orders often result in
inventory having to be returned their picking locations. Once inventory is having
to be returned, it leads to increased costs for the company as well as increased
shipping time per average order (while the correct item is located, picked, and
shipped).
• Units Per Transaction (Number of Units Sold) / (Number of Transactions) = Units
per Transaction)
The KPI for Units Per Transaction (UPT) is a common metric for most
warehouses and/or distribution centers. Depending upon any number of factors,
businesses may or may not have their UPT increase. In order to discover if any
relevant trends exist utilizing the UPT, businesses can compare current UPT with
IMPLEMENTING KEY PERFORMANCE INDICATORS (KPI) METRICS IN A WAREHOUSE SETTING 13
historical averages and trends. Those same businesses can compare those same
UPT numbers with their competitors for comparative studies. UPT is a common
KPI used in sales for tracking more and better upselling by a company salesforce.
• Back Order Rate (Orders Unfulfilled at Time of Purchase) / (Total Orders
Placed) = Back Order Rate)
Warehouse back order rates are calculations that establish whether forecasting
efforts and projected supply purchases are being done with any measure of
accuracy. An increase in demand for any inventory item will lead to a high back
order rate. However, a high or an increasing overall back order rate is evidence
that forecasting efforts and projected supply purchases are not being performed at
a high level. A company would be wise to investigate who is leading said efforts
and get to the root cause of why the back-order rate is so high. In addition,
businesses can help decrease their back-order rate by accurately improving on the
aforementioned Inventory Accuracy Rate KPI.
• Rate of Return (Number of Units Returned) / (Number of Units Sold) = Rate of
Return)
For a distribution center, the Rate of Return KPI is very important in order to
pinpoint the exact reason for the return. For example, if the delivery was late, did
the carrier deliver it late or was the distribution center late in picking the order.
Another example could be from damage. In this case, was the warehouse
responsible for damaging the item? Was the carrier responsible for the damage?
Was the customer determined to have been the cause for the damage? And was
the damage the result of poor materials and/or engineering of the inventory? And
IMPLEMENTING KEY PERFORMANCE INDICATORS (KPI) METRICS IN A WAREHOUSE SETTING 14
finally, was the item returned due to an inaccurate product description? If so, the
change can be made immediately, but if sales were high, then the distribution
center should be prepared for a large volume of additional returns.
• Cost Per Line (Total Cost of Receiving) / (Total Line Items) = Cost per Line
The cost per line KPI is used to measure the total cost of receiving an inventory
item on a purchase order. Predictably, when the cost per line KPI is high, the
distribution center is operating less effectively during the receiving process. The
more comprehension that a warehouse manager has in terms of the Cost Per Line
KPI, the easier it is to move forward with receiving changes for decreasing costs.
• Receiving Efficiency (Volume / (Number of Man Hours) = Receiving Efficiency)
A warehouse operation “all starts with actively receiving and booking in
incoming stock” (veequo.com, 2020). The KPI for Receiving Efficiency is used to
evaluate distribution center productivity during the receipt of inventory. If there
are inefficiencies during the receiving process, it typically spreads to other
distribution center operations (such as picking, cycle counting, and putaways). It
is very important for warehouse managers to investigate inefficiencies as soon as
possible so that the rest of the distribution center can operate at peak efficiency.
• Receiving Cycle Time (Total Time for Delivery) / (Number of Deliveries) =
Receiving Cycle Time)
The KPI known as Receiving Cycle Time refers to the total amount of time it
takes to process an order. If a distribution center has a long receiving cycle time,
they have undiscovered issues with their efficiencies and need to trouble shoot
this KPI in short order. If a distribution center has a short receiving cycle time it is
IMPLEMENTING KEY PERFORMANCE INDICATORS (KPI) METRICS IN A WAREHOUSE SETTING 15
operating at peak efficiency. A distribution center can work with their carriers and
logistics departments to decrease and/or reschedule orders so that more time can
be allocated to incoming deliveries.
• Accuracy Rate (Inventory Put Away Correctly) / (Total Inventory Put Away) =
Accuracy Rate)
A distribution centers’ Accuracy Rate is the percentage of inventory items that
were put away correctly the FIRST TIME. Anytime a warehouse has to move
inventory that is NOT either incoming or outgoing, it costs the company money
and is an inefficient practice to continually move inventory around. The goal of
every warehouse operation is to have a 100% Accuracy Rate each and every day.
The size and scope of larger warehouse operations often make this rate more
challenging.
• Put Away Cost Per Line (Total Cost of Put Away) / (Total Line Items) = Put
Away Cost per Line)
The distribution center put away cost per line KPI is virtually the same thing as
the receiving cost per line KPI. However, cost per line DOES measure an
individual line item’s cost versus the entire purchase order or shipment. As is the
case in receiving cost per line KPI, the higher the cost per line, the less efficiency
that the distribution center is running at.
• Put Away Cycle Time (Total Time for Put Away) / (Total Time) = Put Away
Cycle Time)
A warehouse’s put away cycle time measures the total amount of time that it takes
to put away items. The shorter the put away cycle time; the more efficient the
IMPLEMENTING KEY PERFORMANCE INDICATORS (KPI) METRICS IN A WAREHOUSE SETTING 16
distribution center is running. Conversely, the longer the put away cycle time, the
less efficient the distribution center is running. Two of the simplest quick fixes for
improving put away cycle times are to dedicate more time for training and to
streamline the layout of the physical warehouse.
• Time Lost Due to Injury (Lost Time in Hours Due to Accidents) / (Total Number
of Hours Worked) = Time Lost Due to Injury)
Every distribution center typically has safety at the forefront of their efforts.
Moving pallets, using forklifts, and wrapping pallets by hand are just a few of the
more strenuous and dangerous tasks that can be performed in a warehouse. The
Occupational Safety and Health Administration (O.S.H.A.) spends a considerable
amount of time annually investigating distribution center accidents and incidents.
It is the job of every warehouse manager to ensure the safety and well-being of
their employees. However, on occasion, accidents do occur. Loss of time due to
injury severely impacts both the individual AND the company. Productivity and
overall costs increase with every lost work day. Warehouse managers MUST
identify and eliminate workplace hazards and provide training as needed to help
avoid time lost due to injury.
• Accidents Per Year (Number of Accidents/365)
The warehouse manager will track the accidents per year KPI. The higher the
number of accidents, the more likely that the business can/will get a visit from
O.S.H.A. In those cases, not only is the business losing the employee’s
productivity and increases the overall costs, but O.S.H.A. can (and often does)
IMPLEMENTING KEY PERFORMANCE INDICATORS (KPI) METRICS IN A WAREHOUSE SETTING 17
levy hefty fines for businesses with a high number of injuries and accidents per
year. Zero accidents per year is the goal of every business.
• Time Since Last Accident (Subtract Number of Days Between Accidents)
Much like accidents per year, this KPI is a key indicator of warehouse safety.
Distribution centers favor a high number of days since the last accident to be high.
• Total Recordable Incident Rate (Number of Recorded Injuries in a Year ×
200,000)) / (Number of Hours Worked in a Year) = Total Recordable Incident
Rate)
“A warehouse’s total recordable incident rate (TRIR), sometimes referred to as
the total case incident rate (TCIR), is the total number of work-related injuries per
100 full-time workers during a one-year period” (osha.gov, 2020). TRIR is an
important KPI to monitor O.S.H.A. uses this same metric to gauge a companies’
safety performance. “The higher the TRIR, the more likely a warehouse will be
subject to surprise OSHA inspections and penalties” (Cook, 2012).
• Employee Turnover Rate (Employees Who Have Left) / (Average Number of
Employees) × 100 = Employee Turnover Rate %)
Warehouses typically have high turnover rates. However, a high turnover rate is
can sometimes stem from other issues in the company. Some companies utilize
exit interviews to seek out common root causes for a high Employee Turnover
Rate (ETR). Oftentimes, the issues of pay, management, hours worked, and
training (or lack thereof) wind up as prevalent indicators. Determining the
prevalent root causes are essential to decreasing the ETR.
IMPLEMENTING KEY PERFORMANCE INDICATORS (KPI) METRICS IN A WAREHOUSE SETTING 18
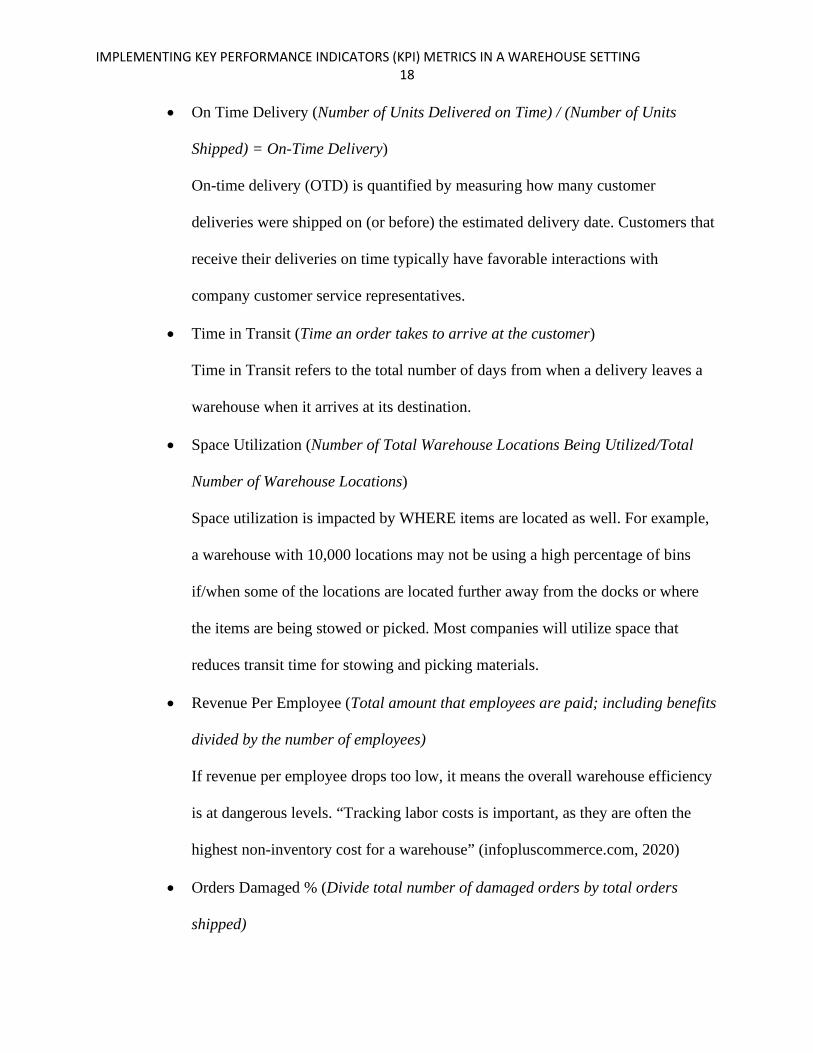
• On Time Delivery (Number of Units Delivered on Time) / (Number of Units
Shipped) = On-Time Delivery)
On-time delivery (OTD) is quantified by measuring how many customer
deliveries were shipped on (or before) the estimated delivery date. Customers that
receive their deliveries on time typically have favorable interactions with
company customer service representatives.
• Time in Transit (Time an order takes to arrive at the customer)
Time in Transit refers to the total number of days from when a delivery leaves a
warehouse when it arrives at its destination.
• Space Utilization (Number of Total Warehouse Locations Being Utilized/Total
Number of Warehouse Locations)
Space utilization is impacted by WHERE items are located as well. For example,
a warehouse with 10,000 locations may not be using a high percentage of bins
if/when some of the locations are located further away from the docks or where
the items are being stowed or picked. Most companies will utilize space that
reduces transit time for stowing and picking materials.
• Revenue Per Employee (Total amount that employees are paid; including benefits
divided by the number of employees)
If revenue per employee drops too low, it means the overall warehouse efficiency
is at dangerous levels. “Tracking labor costs is important, as they are often the
highest non-inventory cost for a warehouse” (infopluscommerce.com, 2020)
• Orders Damaged % (Divide total number of damaged orders by total orders
shipped)
IMPLEMENTING KEY PERFORMANCE INDICATORS (KPI) METRICS IN A WAREHOUSE SETTING 19
Distribution centers typically allow for 1% or lower when it comes to an
acceptable level of breakage for a warehouse operation. If a warehouse is
exceeding 1%, they should discuss options with other vendors or approach
carriers directly to lower this percentage.
In terms of UNMEASURED activity within a warehouse environment,
there are always going to be factors that directly (or indirectly) affect KPI’s. For
example, a warehouse has a number of different types of racking (gravity feed,
drive-in, and stand alone just to name a few). When determining a KPI regarding
picking speed, accuracy, and damages, all three of these types of racking systems
present their own unique challenges. For example, a gravity feed rack oftentimes
has inventory stuck in the middle. Additionally, a drive-in rack has to be picked in
a top-down fashion (or drivers run the risk of driving under potentially falling
inventory). And finally, stand along racks present the issue of only picking one
pallet at a time (versus the prior two where a driver can haul two or three per trip.
Another type of UNMEASURED warehouse activity centers around
transit time. Some warehouses will have it built into the measure, but others do
not account for the fact that one pallet might be twenty feet from its destination,
while another is 200 feet from its destination. A similar activity that is
UNMEASURED revolves around meetings and housekeeping. When a manager
calls for a meeting or for housekeeping duties to be performed, not every
employee will be in transit for the same amount of time. All of these are minor
examples of how warehouse KPI’s are not an exact science, but are a helpful tool
in managing in a distribution center environment.
IMPLEMENTING KEY PERFORMANCE INDICATORS (KPI) METRICS IN A WAREHOUSE SETTING 20
CONCLUSION
This research project should provide a specific contribution to the field of
warehouse management. The project will provide a consolidated and comprehensive resource for
making concrete decisions regarding metrics. It is anticipated that this research project will serve
as an educational resource for start-up and existing warehouse operations to make concrete
decisions regarding metrics before they have to make difficult decisions down the road with
under-performing staff or over-staffed crews. There are many financial, social and safety
complications that can hinder a Warehouse’s success if the implementation of KPI metrics are
completely ignored or delayed. Financial, social, and safety burdens may result if companies
wait too long (or simply refuse to) implement KPI metrics in their warehouse operations.
IMPLEMENTING KEY PERFORMANCE INDICATORS (KPI) METRICS IN A WAREHOUSE SETTING 21
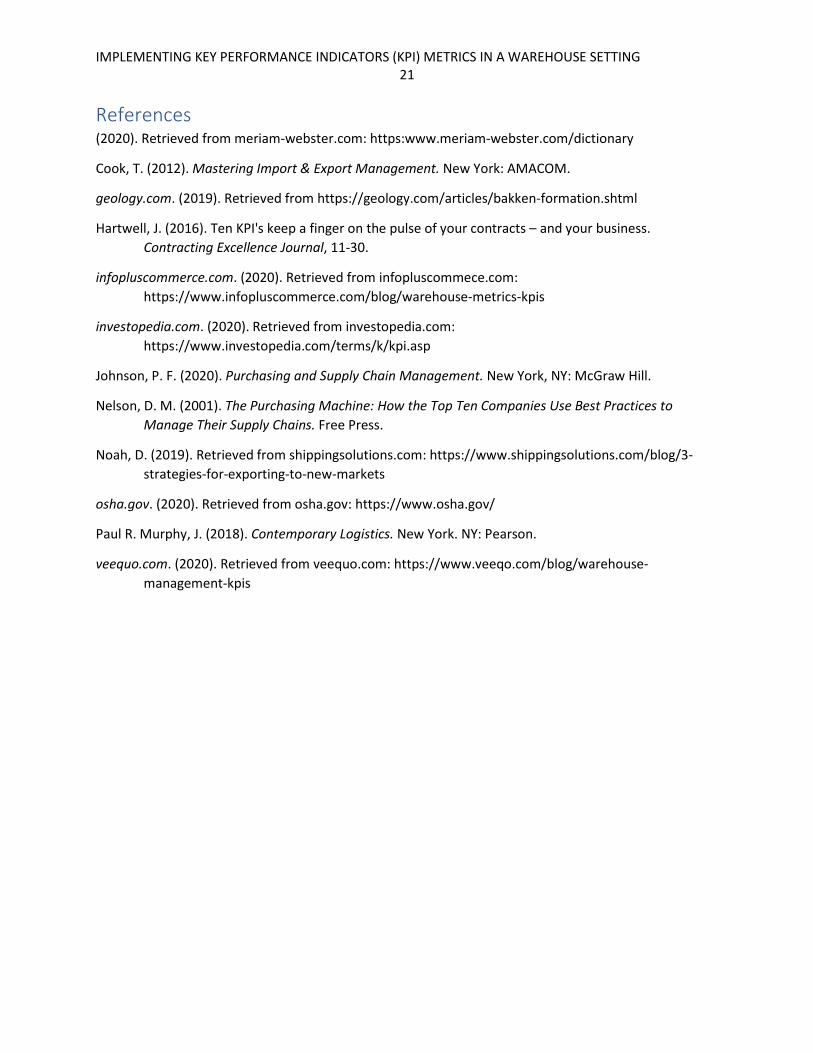
References (2020). Retrieved from meriam-webster.com: https:www.meriam-webster.com/dictionary
Cook, T. (2012). Mastering Import & Export Management. New York: AMACOM.
geology.com. (2019). Retrieved from https://geology.com/articles/bakken-formation.shtml
Hartwell, J. (2016). Ten KPI's keep a finger on the pulse of your contracts – and your business. Contracting Excellence Journal, 11-30.
infopluscommerce.com. (2020). Retrieved from infopluscommece.com: https://www.infopluscommerce.com/blog/warehouse-metrics-kpis
investopedia.com. (2020). Retrieved from investopedia.com: https://www.investopedia.com/terms/k/kpi.asp
Johnson, P. F. (2020). Purchasing and Supply Chain Management. New York, NY: McGraw Hill.
Nelson, D. M. (2001). The Purchasing Machine: How the Top Ten Companies Use Best Practices to Manage Their Supply Chains. Free Press.
Noah, D. (2019). Retrieved from shippingsolutions.com: https://www.shippingsolutions.com/blog/3-strategies-for-exporting-to-new-markets
osha.gov. (2020). Retrieved from osha.gov: https://www.osha.gov/
Paul R. Murphy, J. (2018). Contemporary Logistics. New York. NY: Pearson.
veequo.com. (2020). Retrieved from veequo.com: https://www.veeqo.com/blog/warehouse-management-kpis