
University of Thessaly Department of Civil Engineering Road Safety Audit Tools in Urban Areas
UNIVERSITY OF THESSALY
SCHOOL OF ENGINEERING
DEPARTMENT OF MECHANICAL ENGINEERING
Diploma Thesis
ΒΕΛΤΙΣΤΟΠΟΙΗΣΗ ΣΥΝΘΗΚΩΝ ΚΟΠΗΣ ΧΑΛΥΒΑ ARMOX 500,
ΜΕ LASER ΔΙΟΞΕΙΔΙΟΥ ΤΟΥ ΑΝΘΡΑΚΑ
CO2 LASER CUTTING CONDITIONS OPTIMIZATION
FOR ARMOX 500 STEEL
by
KARDARAS FOTIOS
Supervisor
ANNA ZERVAKI
Submitted for the Partial Fulfillment
of the requirements for the degree of
Diploma in Mechanical Engineering
2016
Institutional Repository - Library & Information Centre - University of Thessaly09/12/2017 12:18:41 EET - 137.108.70.7

© Kardaras Fotios 2016
The approval of the Diploma Thesis by the Department of Mechanical Engineering of
the University of Thessaly does not imply acceptance of the author’s opinions. (Law
5343/32, article 202, paragraph 2).
Institutional Repository - Library & Information Centre - University of Thessaly09/12/2017 12:18:41 EET - 137.108.70.7

Certified by the member of the thesis committee:
First examiner Dr. Anna Zervaki (Supervisor) Lab Teaching Staff, Department of Mechanical Engineering, University of Thessaly
Second examiner Dr. Gregory Haidemenopoulos Professor, Department of Mechanical Engineering, University of Thessaly
Third examiner Dr. Nikolaos Andritsos Professor, Department of Mechanical Engineering, University of Thessaly
Institutional Repository - Library & Information Centre - University of Thessaly09/12/2017 12:18:41 EET - 137.108.70.7

AKNOWLEDGMENTS
This project is accomplished in the scope of partial fulfillment of the requirement for
the degree of the Diploma in Mechanical Engineering at University of Thessaly.
For the completion of this Thesis, I would like to thank my thesis supervisor, Dr. Anna
Zervaki whose expertise, valuable suggestions, comments, guidance and patience
added considerably to my knowledge and for the tremendous support over this
semester.
Furthermore, very special thanks go to professors Gregory Haidemenopoulos and
Andritsos Nikolaos for accepting to be the examiners of this work.
I would also like to express my very great appreciation to Lazarou Bros Sheet Metal
Works, for providing the CO2 laser machine, and specially to Mr. Lazaros Lazarou for
his valuable suggestion, patience and flawless cooperation.
I would also like to thank the Instructor Dr. Eleni Kamoutsi for her help and guidance
with the laboratory machinery.
Last but not least, special recognition goes to my family for their continuous support
and encouragement during this study.
Kardaras Fotios
Institutional Repository - Library & Information Centre - University of Thessaly09/12/2017 12:18:41 EET - 137.108.70.7
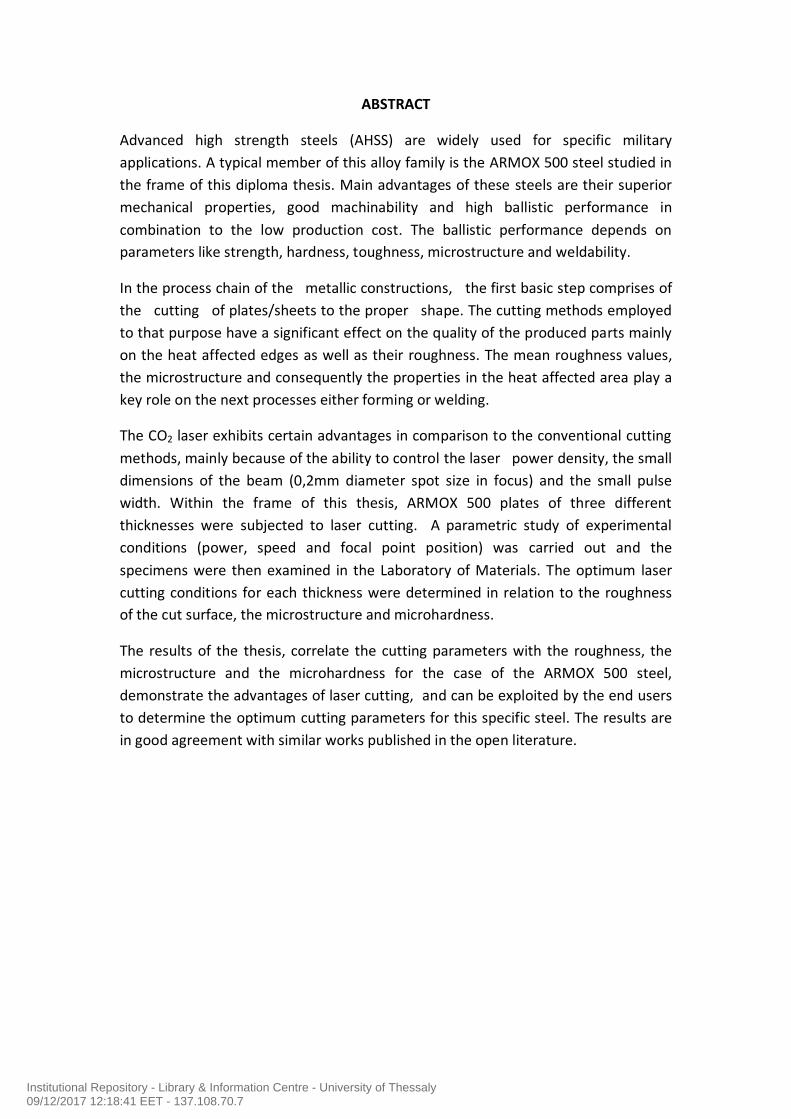
ABSTRACT
Advanced high strength steels (AHSS) are widely used for specific military
applications. A typical member of this alloy family is the ARMOX 500 steel studied in
the frame of this diploma thesis. Main advantages of these steels are their superior
mechanical properties, good machinability and high ballistic performance in
combination to the low production cost. The ballistic performance depends on
parameters like strength, hardness, toughness, microstructure and weldability.
In the process chain of the metallic constructions, the first basic step comprises of
the cutting of plates/sheets to the proper shape. The cutting methods employed
to that purpose have a significant effect on the quality of the produced parts mainly
on the heat affected edges as well as their roughness. The mean roughness values,
the microstructure and consequently the properties in the heat affected area play a
key role on the next processes either forming or welding.
The CO2 laser exhibits certain advantages in comparison to the conventional cutting
methods, mainly because of the ability to control the laser power density, the small
dimensions of the beam (0,2mm diameter spot size in focus) and the small pulse
width. Within the frame of this thesis, ARMOX 500 plates of three different
thicknesses were subjected to laser cutting. A parametric study of experimental
conditions (power, speed and focal point position) was carried out and the
specimens were then examined in the Laboratory of Materials. The optimum laser
cutting conditions for each thickness were determined in relation to the roughness
of the cut surface, the microstructure and microhardness.
The results of the thesis, correlate the cutting parameters with the roughness, the
microstructure and the microhardness for the case of the ARMOX 500 steel,
demonstrate the advantages of laser cutting, and can be exploited by the end users
to determine the optimum cutting parameters for this specific steel. The results are
in good agreement with similar works published in the open literature.
Institutional Repository - Library & Information Centre - University of Thessaly09/12/2017 12:18:41 EET - 137.108.70.7

ΠΕΡΙΛΗΨΗ
Οι προηγμένοι χάλυβες υψηλής αντοχής με μικρή περιεκτικότητα κραματικών
στοιχείων (ΑΗSS) στην οικογένεια των οποίων ανήκει και ο χάλυβας ARMOX 500T -
που μελετήθηκε στην παρούσα εργασία- βρίσκουν ευρεία εφαρμογή μεταξύ άλλων
και σε εξειδικευμένες στρατιωτικές χρήσεις. Τα κύρια πλεονεκτήματά τους είναι το
χαμηλό κόστος παραγωγής σε συνδυασμό με τις εξαιρετικές μηχανικές τους
ιδιότητες, την καλή κατεργασιμότητά τους καθώς και την υψηλή τους απόδοση σε
βαλλιστικές εφαρμογές. Η απόδοση αυτή εξαρτάται από ιδιότητες όπως η αντοχή,
η ολκιμότητα, η σκληρότητα η μικροδομή καθώς και η καλή συμπεριφορά στη
συγκόλληση.
Για την παραγωγή σύνθετων κατασκευών από ARMOX 500T η αρχική φάση κάθε
κατεργασίας είναι η κοπή των ελασμάτων στα επιθυμητά κάθε φορά σχήματα και
διαστάσεις. Οι μέθοδοι κοπής που χρησιμοποιούνται επηρεάζουν σημαντικά την
ποιότητα των τμημάτων των ελασμάτων που παράγονται, λόγω τόσο της θερμικής
επιρροής στην περιοχή της κοπής όσο και λόγω της τραχύτητας των αντίστοιχων
επιφανειών κοπής. Οι μεταβολές στην τραχύτητα, στη μικροδομή και κατά
συνέπεια στις ιδιότητες του χάλυβα θα πρέπει να διατηρούνται στη μικρότερη
δυνατή έκταση, ώστε το επόμενο στάδιο της κατεργασίας διαμόρφωσης ή
συγκόλλησης να επηρεάζεται στο μικρότερο δυνατό βαθμό.
Η κοπή με CO2 laser παρέχει σημαντικά ποιοτικά πλεονεκτήματα έναντι των
συμβατικών μεθόδων κυρίως λόγω της δυνατότητας πλήρους ελέγχου της
παρεχόμενης πυκνότητας ισχύος κατά την κοπή, των πολύ μικρών διαστάσεων της
δέσμης (0,2mm) καθώς και της μικρής διάρκειας παλμού του laser. Στα πλαίσια της
παρούσας εργασίας χρησιμοποιήθηκε CO2 laser για την κοπή ελασμάτων ARMOX
500 σε τρία διαφορετικά πάχη. Πραγματοποιήθηκε παραμετρική μελέτη εύρους
πειραματικών συνθηκών (ισχύς, ταχύτητα κοπής, θέση σημείου εστίασης) και
προσδιορίστηκαν οι βέλτιστες συνθήκες κοπής για κάθε πάχος που μελετήθηκε σε
σχέση με την τραχύτητα των επιφανειών κοπής, την μικροδομή και την
μικροσκληρότητα.
Τα αποτελέσματα της εργασίας, δείχνουν τα πλεονεκτήματα της μεθόδου όσον
αφορά το εύρος της επιρροής των συνθηκών κοπής στο παραγόμενο κάθε φορά
αποτέλεσμα, συσχετίζουν τις πειραματικές συνθήκες με τη μικροδομή, τη
μικροσκληρότητα και την τραχύτητα, και μπορούν να αξιοποιηθούν από τους
τελικούς χρήστες προκειμένου να προσδιοριστούν οι βέλτιστες συνθήκες κοπής
για τον χάλυβα ARMOX 500T.
Institutional Repository - Library & Information Centre - University of Thessaly09/12/2017 12:18:41 EET - 137.108.70.7
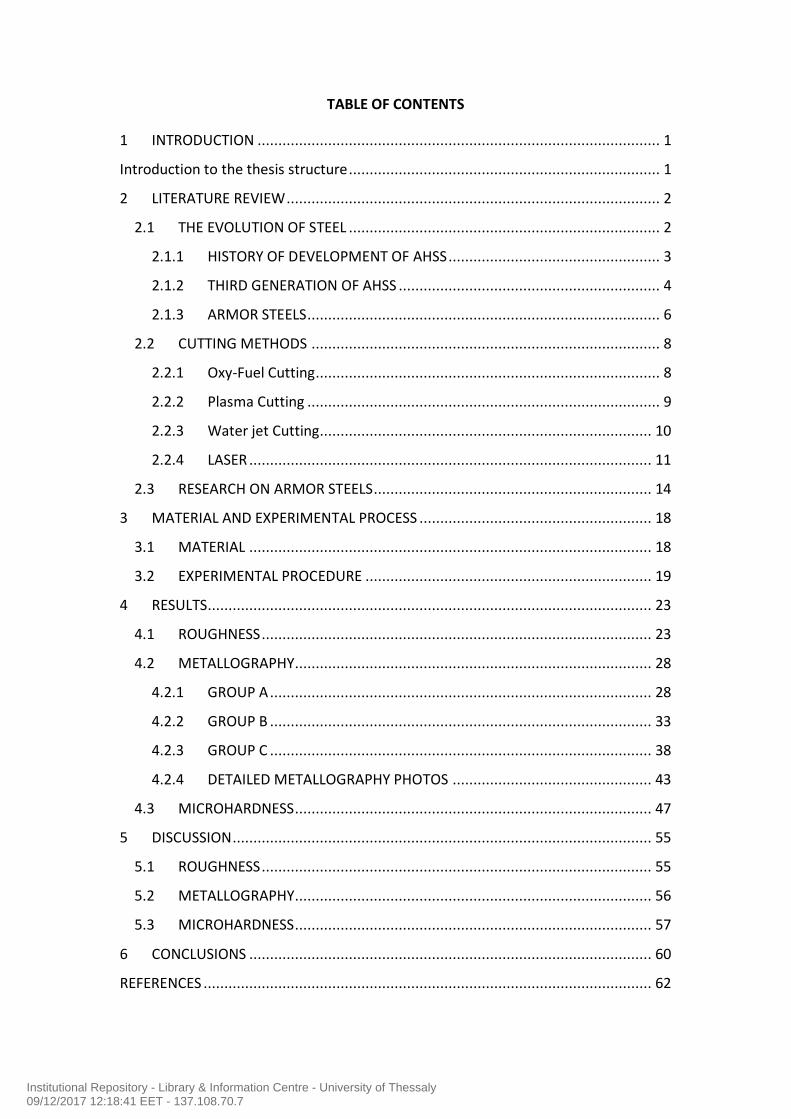
TABLE OF CONTENTS
1 INTRODUCTION ................................................................................................. 1
Introduction to the thesis structure ........................................................................... 1
2 LITERATURE REVIEW .......................................................................................... 2
2.1 THE EVOLUTION OF STEEL ........................................................................... 2
2.1.1 HISTORY OF DEVELOPMENT OF AHSS ................................................... 3
2.1.2 THIRD GENERATION OF AHSS ............................................................... 4
2.1.3 ARMOR STEELS ..................................................................................... 6
2.2 CUTTING METHODS .................................................................................... 8
2.2.1 Oxy-Fuel Cutting ................................................................................... 8
2.2.2 Plasma Cutting ..................................................................................... 9
2.2.3 Water jet Cutting................................................................................ 10
2.2.4 LASER ................................................................................................. 11
2.3 RESEARCH ON ARMOR STEELS ................................................................... 14
3 MATERIAL AND EXPERIMENTAL PROCESS ........................................................ 18
3.1 MATERIAL ................................................................................................. 18
3.2 EXPERIMENTAL PROCEDURE ..................................................................... 19
4 RESULTS........................................................................................................... 23
4.1 ROUGHNESS .............................................................................................. 23
4.2 METALLOGRAPHY...................................................................................... 28
4.2.1 GROUP A ............................................................................................ 28
4.2.2 GROUP B ............................................................................................ 33
4.2.3 GROUP C ............................................................................................ 38
4.2.4 DETAILED METALLOGRAPHY PHOTOS ................................................ 43
4.3 MICROHARDNESS ...................................................................................... 47
5 DISCUSSION ..................................................................................................... 55
5.1 ROUGHNESS .............................................................................................. 55
5.2 METALLOGRAPHY...................................................................................... 56
5.3 MICROHARDNESS ...................................................................................... 57
6 CONCLUSIONS ................................................................................................. 60
REFERENCES ............................................................................................................ 62
Institutional Repository - Library & Information Centre - University of Thessaly09/12/2017 12:18:41 EET - 137.108.70.7

FIGURE CONTENTS
Figure 2.1 – OXY FUEL CUTTING................................................................................. 8
Figure 2.2 – PLASMA NOZZLE .................................................................................... 9
Figure 2.3 – WATER JET NOZZLE .............................................................................. 10
Figure 2.4 – FOCAL LENGHT ..................................................................................... 12
Figure 2.5 – FOCAL POINT ........................................................................................ 12
Figure 3.1 – LASER CUTTING HEAD .......................................................................... 19
Figure 3.2 – TRUMPF - TRUMATIC L 3050 ................................................................ 21
Figure 3.3 – ROUGHNESS MEASURED AREA ............................................................. 21
Figure 3.4 – ROUGHNESS TESTING ........................................................................... 22
Figure 3.5 - SCHEMATIC REPRESENTATION OF THE METALLOGRAPHIC CROSS
SECTION, AND THE POSITION OF THE MICROHARDNESS PROFILES IN RELATION TO
PLATE THICKNESS AND THE LASER CUT ................................................................... 22
Figure 4.1 - SCHEMATIC REPRESENTATION OF THE METALLOGRAPHIC CROSS
SECTION, AND THE POSITION OF THE MICROHARDNESS PROFILES IN RELATION TO
PLATE THICKNESS AND THE LASER CUT ................................................................... 28
Figure 4.2 (x1000) - A GROUP’S UNAFFECTED MATERIAL, TEMPERED MARTENSITE 28
Figure 4.3 (x200) – A1 SPECIMEN’S HAZ, NEAR THE TOP PLATE’S SURFACE ............. 29
Figure 4.4 (x200) – A1 SPECIMEN’S HAZ, NEAR THE BOTTOM PLATE’S SURFACE ..... 29
Figure 4.5 (x200) – A2 SPECIMEN’S HAZ, NEAR THE TOP PLATE’S SURFACE ............. 30
Figure 4.6 (x200) – A2 SPECIMEN’S HAZ, NEAR THE BOTTOM PLATE’S SURFACE ...... 30
Figure 4.7 (x200) – A3 SPECIMEN’S HAZ, NEAR THE TOP PLATE’S SURFACE ............. 31
Figure 4.8 (x200) – A3 SPECIMEN’S HAZ, NEAR THE BOTTOM PLATE’S SURFACE ...... 31
Figure 4.9 (x200) – A4 SPECIMEN’S HAZ, NEAR THE TOP PLATE’S SURFACE ............. 32
Figure 4.10 (x100) - A2 SPECIMEN’S HAZ, NEAR THE BOTTOM PLATE’S SURFACE .... 32
Figure 4.11 (x500) – B GROUP’S UNAFFECTED MATERIAL ........................................ 33
Figure 4.12 (x200) – B1 SPECIMEN’S HAZ, NEAR THE TOP PLATE’S SURFACE............ 34
Figure 4.13 (x200) – B1 SPECIMEN’S HAZ, NEAR THE BOTTOM PLATE’S SURFACE .... 34
Figure 4.14 (x200) – B2 SPECIMEN’S HAZ, NEAR THE TOP PLATE’S SURFACE............ 35
Figure 4.15 (x200) – B2 SPECIMEN’S HAZ, NEAR THE BOTTOM PLATE’S SURFACE .... 35
Figure 4.16 (x200) – B3 SPECIMEN’S HAZ, NEAR THE TOP PLATE’S SURFACE............ 36
Figure 4.17 (x100) – B1 SPECIMEN’S HAZ, NEAR THE BOTTOM PLATE’S SURFACE .... 36
Figure 4.18 (x200) – B4 SPECIMEN’S HAZ, NEAR THE TOP PLATE’S SURFACE............ 37
Figure 4.19 (x200) – B4 SPECIMEN’S HAZ, NEAR THE BOTTOM PLATE’S SURFACE .... 37
Figure 4.20 (x200) - C GROUP’S UNAFFECTED MATERIAL, ........................................ 38
Figure 4.21 (x100) – C1 SPECIMEN’S HAZ, NEAR THE TOP PLATE’S SURFACE ............ 39
Figure 4.22 (x100) - C1 SPECIMEN’S HAZ, NEAR THE BOTTOM PLATE’S SURFACE ..... 39
Figure 4.23 (x100) – C2 SPECIMEN’S HAZ, NEAR THE TOP PLATE’S SURFACE ............ 40
Figure 4.24 (x100) - C2 SPECIMEN’S HAZ, NEAR THE BOTTOM PLATE’S SURFACE ..... 40
Figure 4.25 (x100) – C3 SPECIMEN’S HAZ, NEAR THE TOP PLATE’S SURFACE ............ 41
Institutional Repository - Library & Information Centre - University of Thessaly09/12/2017 12:18:41 EET - 137.108.70.7

Figure 4.26 (x100) – C3 SPECIMEN’S HAZ, NEAR THE BOTTOM PLATE’S SURFACE .... 41
Figure 4.27 (x200) – C4 SPECIMEN’S HAZ, NEAR THE TOP PLATE’S SURFACE ............ 42
Figure 4.28 (x200) – C4 SPECIMEN’S HAZ, NEAR THE BOTTOM PLATE’S SURFACE .... 42
Figure 4.29 (x500) - HAZ OF C4 SPECIMEN, BAINITIC MICROSTRUCTURE ................. 43
Figure 4.30 (x500) – HAZ OF SPECIMEN A2 NEAR THE TOP SURFACE ....................... 43
Figure 4.31 (x1000) – BULK MATERIAL NEAR HAZ OF C4 SPECIMEN, FINE GRAINED
MARTENSITE ........................................................................................................... 44
Figure 4.32 (x1000) – CENTER OF C4 SPECIMEN – FINE GRAINED MARTENSITE ....... 44
Figure 4.33- A2 HAZ 200x ........................................................................................ 45
Figure 4.34 – A2 CUT TO BAINITE 500X .................................................................... 45
Figure 4.35 – A2 AFTER HAZ 500X ............................................................................ 46
Figure 5.1 – CUT FACE OF SPECIMEN C4 .................................................................. 55
Figure 5.2 – CUT FACE OF SPECIMEN C2 .................................................................. 55
Figure 5.3 - CCT diagram of ARMOX 500T cooling, a) starting temperature 1000°C, b)
starting temperature 500° [8] .................................................................................. 56
Figure 5.4 (x50) – MICROHARDNESS GRAPH AND MICROSTRUCTURE OF A2
SPECIMEN NEAR THE TOP SURFACE ........................................................................ 58
Figure 5.5 (x50) – MICROHARDNESS GRAPH AND MICROSTRUCTURE OF B1
SPECIMEN NEAR THE BOTTOM SURFACE ................................................................. 59
Institutional Repository - Library & Information Centre - University of Thessaly09/12/2017 12:18:41 EET - 137.108.70.7
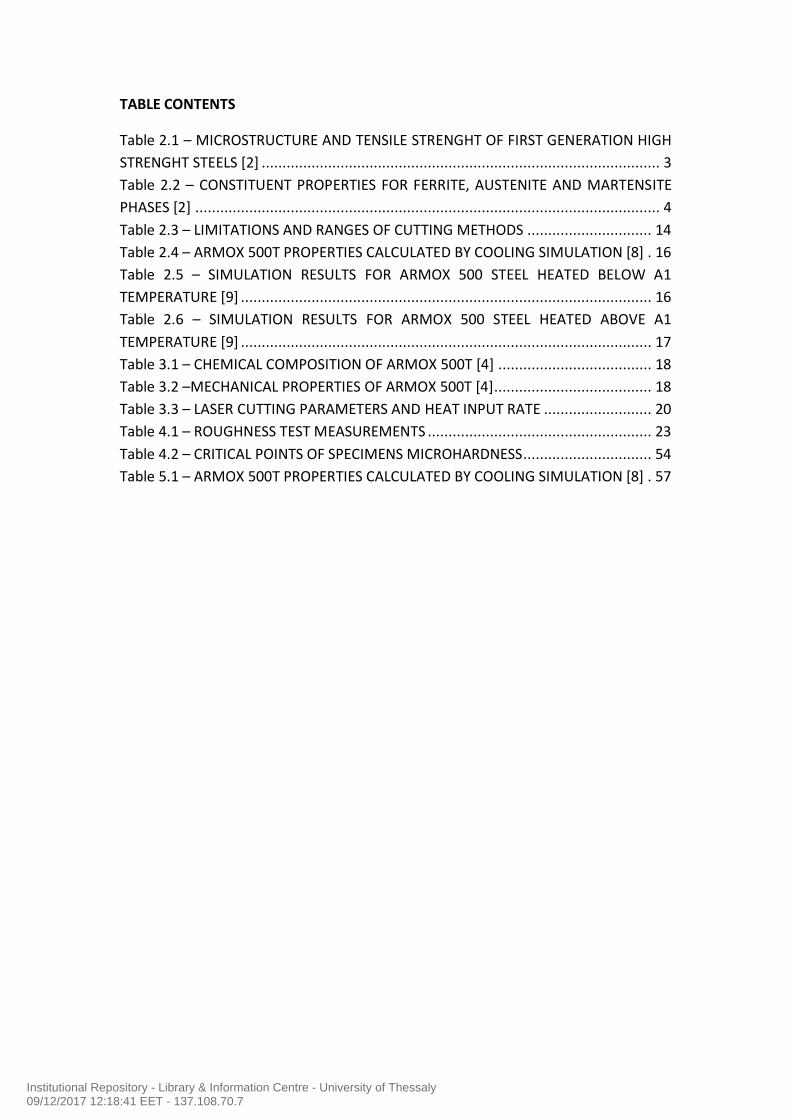
TABLE CONTENTS
Table 2.1 – MICROSTRUCTURE AND TENSILE STRENGHT OF FIRST GENERATION HIGH
STRENGHT STEELS [2] ................................................................................................ 3
Table 2.2 – CONSTITUENT PROPERTIES FOR FERRITE, AUSTENITE AND MARTENSITE
PHASES [2] ................................................................................................................ 4
Table 2.3 – LIMITATIONS AND RANGES OF CUTTING METHODS .............................. 14
Table 2.4 – ARMOX 500T PROPERTIES CALCULATED BY COOLING SIMULATION [8] . 16
Table 2.5 – SIMULATION RESULTS FOR ARMOX 500 STEEL HEATED BELOW A1
TEMPERATURE [9] ................................................................................................... 16
Table 2.6 – SIMULATION RESULTS FOR ARMOX 500 STEEL HEATED ABOVE A1
TEMPERATURE [9] ................................................................................................... 17
Table 3.1 – CHEMICAL COMPOSITION OF ARMOX 500T [4] ..................................... 18
Table 3.2 –MECHANICAL PROPERTIES OF ARMOX 500T [4]...................................... 18
Table 3.3 – LASER CUTTING PARAMETERS AND HEAT INPUT RATE .......................... 20
Table 4.1 – ROUGHNESS TEST MEASUREMENTS ...................................................... 23
Table 4.2 – CRITICAL POINTS OF SPECIMENS MICROHARDNESS............................... 54
Table 5.1 – ARMOX 500T PROPERTIES CALCULATED BY COOLING SIMULATION [8] . 57
Institutional Repository - Library & Information Centre - University of Thessaly09/12/2017 12:18:41 EET - 137.108.70.7

GRAPH CONTENTS
Graph 2.1 - STEEL CATEGORIES BASED ON STRENGTH AND DUCTILITY ...................... 2
Graph 2.2 PREDICTED STRENGTH/DUCTILITY RELATIONSHIPS FOR TWO
HYPOTHETICAL STEEL MICROSTRUCTURES: FERRITE + MARTENSITE (I.E. DP STEEL)
AND STABLE AUSTENITE + MARTENSITE [2]. .............................................................. 5
Graph 2.3 – Compination of figures 2.1 and 2.2 ......................................................... 5
Graph 2.4 – DISTRIBUTION OF THE MICROHARDNESS IN THE CROSS-SECTION OF THE
WELDED JOINT AFTER WELDING OF QT a) AND TMCP b) STEELS [6] ........................ 15
Graph 2.5 – EXPERIMENTAL RESULTS – YIELD STRENGHT OF BASIC AND WELDED
MATERIAL [8] .......................................................................................................... 15
Graph 3.1 - CCT DIAGRAM OF ARMOX 500T [8] ....................................................... 19
Graph 4.1 – ROUGHNESS OF 5mm SPECIMENS ........................................................ 24
Graph 4.2 – ROUGHNESS OF 10mm SPECIMENS ...................................................... 24
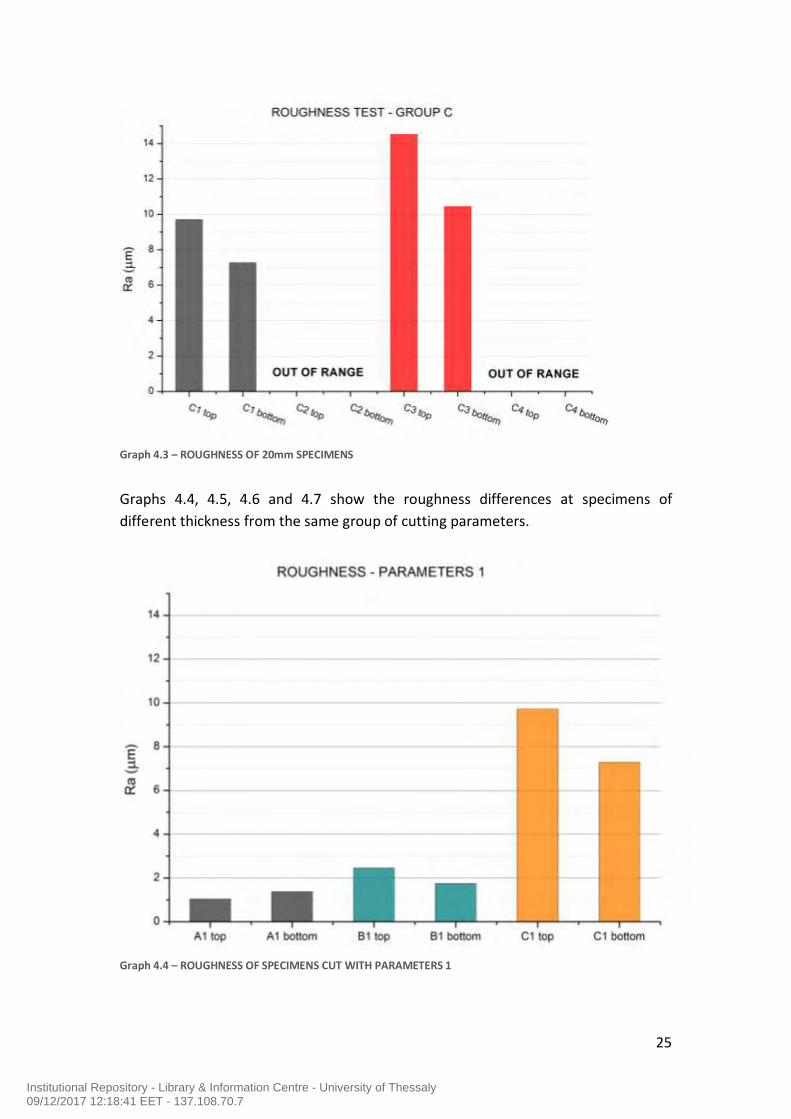
Graph 4.3 – ROUGHNESS OF 20mm SPECIMENS ...................................................... 25
Graph 4.4 – ROUGHNESS OF SPECIMENS CUT WITH PARAMETERS 1 ....................... 25
Graph 4.5 – ROUGHNESS OF SPECIMENS CUT WITH PARAMETERS 2 ....................... 26
Graph 4.6 – ROUGHNESS OF SPECIMENS CUT WITH PARAMETERS 3 ....................... 26
Graph 4.7 – ROUGHNESS OF SPECIMENS CUT WITH PARAMETERS 4 ....................... 27
Graph 4.8 - MICROHARDNESS ON THE CROSS SECTION OF GROUP A SPECIMENS,
NEAR THE TOP SURFACE .......................................................................................... 47
Graph 4.9 - MICROHARDNESS ON THE CROSS SECTION OF GROUP A SPECIMENS,
NEAR THE BOTTOM SURFACE .................................................................................. 47
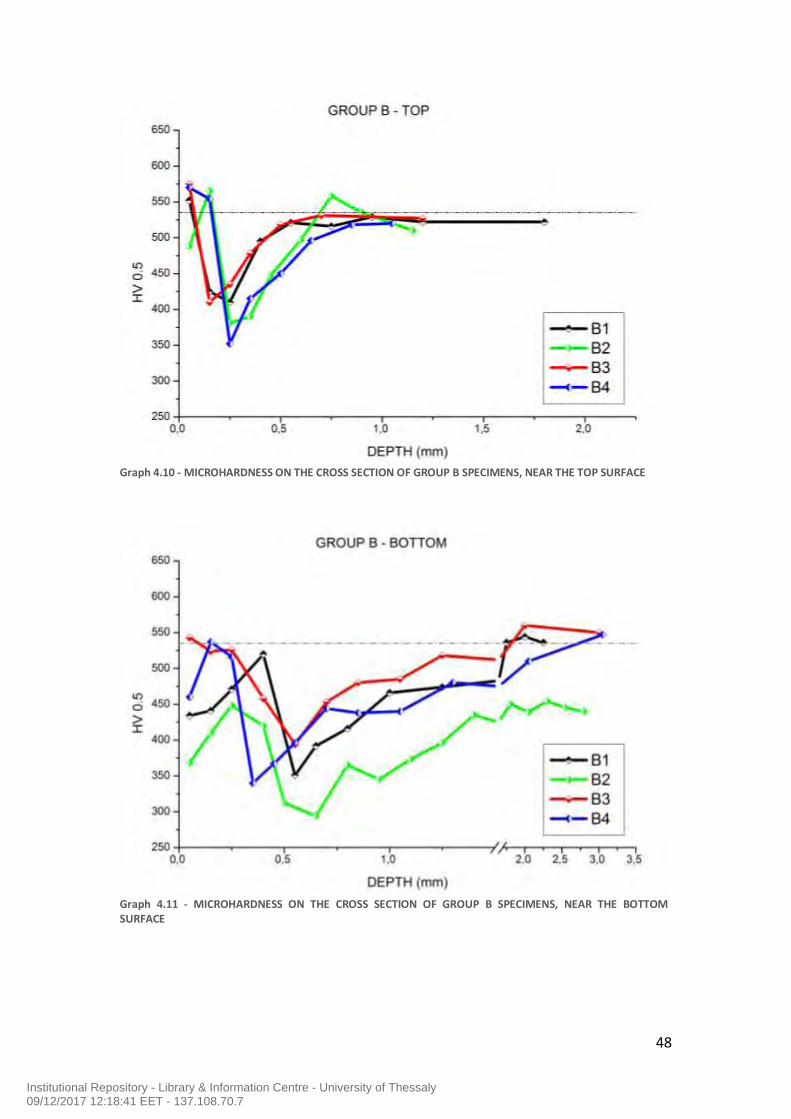
Graph 4.10 - MICROHARDNESS ON THE CROSS SECTION OF GROUP B SPECIMENS,
NEAR THE TOP SURFACE .......................................................................................... 48
Graph 4.11 - MICROHARDNESS ON THE CROSS SECTION OF GROUP B SPECIMENS,
NEAR THE BOTTOM SURFACE .................................................................................. 48
Graph 4.12 - MICROHARDNESS ON THE CROSS SECTION OF GROUP C SPECIMENS,
NEAR THE TOP SURFACE .......................................................................................... 49
Graph 4.13 - MICROHARDNESS ON THE CROSS SECTION OF GROUP C SPECIMENS,
NEAR THE BOTTOM SURFACE .................................................................................. 49
Graph 4.14 - MICROHARDNESS ON THE CROSS SECTION OF SPECIMENS CUT WITH
PARAMETERS 1, NEAR THE TOP SURFACE ................................................................ 50
Graph 4.15 - MICROHARDNESS ON THE CROSS SECTION OF SPECIMENS CUT WITH
PARAMETERS 1, NEAR THE BOTTOM SURFACE ........................................................ 50
Graph 4.16 - MICROHARDNESS ON THE CROSS SECTION OF SPECIMENS CUT WITH
PARAMETERS 2, NEAR THE TOP SURFACE ................................................................ 51
Graph 4.17 - MICROHARDNESS ON THE CROSS SECTION OF SPECIMENS CUT WITH
PARAMETERS 2, NEAR THE BOTTOM SURFACE ........................................................ 51
Graph 4.18 - MICROHARDNESS ON THE CROSS SECTION OF SPECIMENS CUT WITH
PARAMETERS 3, NEAR THE TOP SURFACE ................................................................ 52
Institutional Repository - Library & Information Centre - University of Thessaly09/12/2017 12:18:41 EET - 137.108.70.7

Graph 4.19 - MICROHARDNESS ON THE CROSS SECTION OF SPECIMENS CUT WITH
PARAMETERS 3, NEAR THE BOTTOM SURFACE ....................................................... 52
Graph 4.20 - MICROHARDNESS ON THE CROSS SECTION OF SPECIMENS CUT WITH
PARAMETERS 4, NEAR THE TOP SURFACE ................................................................ 53
Graph 4.21 - MICROHARDNESS ON THE CROSS SECTION OF SPECIMENS CUT WITH
PARAMETERS 4, NEAR THE BOTTOM SURFACE ........................................................ 53
Institutional Repository - Library & Information Centre - University of Thessaly09/12/2017 12:18:41 EET - 137.108.70.7

1
1 INTRODUCTION Armor steels are very sensitive at high temperatures and temperature changes,
which lead to degradation of their mechanical properties. Such conditions are met at
secondary processes through a construction, such as welding and thermal cutting.
The aim of this thesis was, through experimental procedure, to analyze the effect of
the laser cutting method and the affection of the method’s different parameters on
Armox 500T steel. In the frame of the current work laser cutting was employed for
the preparation of selected plates of ARMOX 500 steel before welding. The
roughness of the cut surface, the microstructure and microhardness changes on
transverse cross sections of the plates were the main subjects of study as well as
their dependency on the laser parameters .The purpose was to determine the extent
of deterioration at the cutting edge and to define the optimum laser cutting
conditions so as to minimize the effect from the cutting process.
Introduction to the thesis structure
The second chapter of this thesis includes a history review of the evolution of steel.
The basic characteristics of each generation and the reasons that led the researches
to carry on are mentioned. At the second segment, a brief reference at the four
primary cutting methods used today is done. The reference focuses on the basic
operating principals, the advantages and the disadvantages of each method. Finally a
more extended reference on armor steels is included in the third and final segment
of this chapter.
The beginning of the third chapter refers to the material’s production process,
microstructural characteristics, chemical composition and its mechanical properties.
This is followed by a step by step illustration of the applied experimental process and
the tools that were used.
The fourth chapter contains the experimental results in form of tables and graphs.
The results are discussed at the fifth chapter and the conclusions are developed at
the sixth one.
Institutional Repository - Library & Information Centre - University of Thessaly09/12/2017 12:18:41 EET - 137.108.70.7

2
2 LITERATURE REVIEW
2.1 THE EVOLUTION OF STEEL
Traditionally, in most constructions, mild steel and cast iron are widely used as the
dominant material. However modern technology and market trends demand
products with higher strength and lower weight. The cost is a major factor of any
product and also steel’s bigger benefit upon other competitive materials such as
aluminum alloys, magnesium alloys and fiber-reinforced composites. This in
association with the already extensive knowledge and familiarity with
manufacturing, processing and forming of steel, intensified the researches to
develop advanced high strength steels, instead of substitute steel with other
materials.
Steel has evolved over the years from mild steel in early 1900’s to high-strength low-
alloy (HSLA) steels in the late 1970’ and the first generation of advanced high
strength steel AHSS in the 1990’s. Recent approaches to improve the properties of
steel have been based on developing steel microstructures of higher strength in
order to reduce component section size and weight. In the last two decades have
there are significant improvements in the composition, microstructure, strength,
ductility and processing approaches to steel manufacture.
Graph 2.1 provides an overview of the steel categories based on strength and
ductility. At the lower end of the strength spectrum are the interstitial (IF) and mild
steels. These steels are very soft and formable. In the middle are the conventional
grades of HSS that include interstitial-free, high strength (IF-HS), isotropic (IS), bake-
hardenable (BH) and high strength,
low-alloy (HSLA) steels. These steels
have higher strength compared to
traditional grades but their ductility
is much lower. At the high end are
the AHSS that include dual-phase
(DP), complex-phase (CP),
transformation-included plasticity
(TRIP) and martensitic steels (MS).
These steels exhibits very high
strength and except the MS grade,
have good formability. [1]
Graph 2.1 - STEEL CATEGORIES BASED ON STRENGTH AND DUCTILITY
Institutional Repository - Library & Information Centre - University of Thessaly09/12/2017 12:18:41 EET - 137.108.70.7

3
2.1.1 HISTORY OF DEVELOPMENT OF AHSS Early efforts to obtain lighter weight and enhanced strength were aimed at the development of High Strength Low Alloy (HSLA) steel. This kind of conventional High Strength Steel (HSS) has a tensile strength of 250 to 590 MPa. However, the tradeoff between strength and ductility limited the performance and the manufacturability of HSLA steels. To fulfill the requirements for steel with higher strength while retaining its formability, Advanced High Strength Steels (AHSS) were developed during mid - 1990’s. Advanced High Strength Steels, refers to steels with 500 MPa or more tensile strength and complex microstructures such as bainite, martensite and retained austenite. The strengthening mechanisms include solid solution strengthening, precipitation strengthening, grain refinement and phase transformation. There are two generations of AHSS based upon the microstructure of the steels. The first generation of AHSS are ferrite based steels, including dual-phase (DP) steel, martensitic steel (MS), complex-phase (CP) steel and transformation-induced plasticity (TRIP) steel. [2] The microstructure and tensile strength of these steels are listed in Table 2.1.
Although the strength level for the 1st generation of AHSS was far beyond that of the conventional HSS, the limited formability remained a problem. During the past few years, a second generation of AHSS was developed based upon an austenitic microstructure. Twinning-induced plasticity (TWIP) steel, lightweight steel with induced plasticity (L-IP) and shear band formation-induced plasticity (SIP) steel are different grades in this catalog. A ductile austenite matrix provides better formability to the 2nd generation of AHSS than the 1st generation. However, the high austenite stabilizer content, such as 20 wt. pct. manganese and nickel, limits the use of the 2nd generation of AHSS because of its high cost. [2]
DUAL-PHASE Ferrite + martensite 400 to1000
MARTENSITIC martensite 700 to 1600
COMPLEX PHASE Ferrite + bainite + pearlite 400 to1000
TRANSFORMATION-
INDUCED PLASTICITYFerrite + martensite/ bainite +austenite 500 to 1000
1st GEN. AHSS MICROSTRUCTURE STRENGHT (MPa)
MICROSTRUCTURE AND TENSILE STRENGHT - FIRST GENERATION HIGH
STRENGHT STEELS
Table 2.1 – MICROSTRUCTURE AND TENSILE STRENGHT OF FIRST GENERATION HIGH STRENGHT STEELS [2]
Institutional Repository - Library & Information Centre - University of Thessaly09/12/2017 12:18:41 EET - 137.108.70.7

4
2.1.2 THIRD GENERATION OF AHSS
Despite the growing market for AHSS, the trade-off between the strength and formability of the AHSS remains the limitation for their application. According to Graph2.1, the conventional HSS provides steels with total elongation in the range of 10 to 50 %, but the tensile strength of the steels are all below 800 MPa. Most of the first generation of AHSS have tensile strength larger than the conventional HSS. However, the total elongation of this generation of steels drops to as low as 10 %. when the tensile strength reaches 1000 MPa. Although the second generation of AHSS solved the problem caused by the competition between tensile strength and total elongation according to Graph2.1, the high cost for this solution remains the main obstacle for its broad application. Recently, the need to develop AHSS with a range of properties that give engineers more flexibility in selecting an ideal grade of steel for any given application has raised increasing interest in developing a third generation of AHSS. The design of the 3rd generation of AHSS is intended to produce steels with a better combination of strength and ductility than the 1st generation of AHSS and at a lower cost than the 2nd generation of AHSS. The mechanical properties of the 3rd generation of AHSS are intended to fall within the gap between the 1st and 2nd generation of AHSS in Graph 2.1. In order to reduce the cost, lean alloy steel compositions will need to be used in developing the 3rd generation of AHSS. Because microstructure determines the behavior and performance of AHSS steels, the design and control of the microstructure becomes essential for the 3rd generation of AHSS. It is predicted, based on the rule of mixtures, that the properties of the 3rd generation AHSS could be achieved using steels with martensite and austenite microstructures. The data in Table 2.2 show the ultimate tensile strength and true uniform strain for ferrite, austenite and martensite, which indicate the high strength of martensite and the great ductility of austenite.
Constituent Ultimate Tensile Strength (MPa) Uniform True Strain
Ferrite 300 0.3
Austenite 640 0.6
Martensite 2000 0.08
CONSTITUENT PROPERTIES FOR FERRITE, AUSTENITE AND MARTENSITE PHASES
Table 2.2 – CONSTITUENT PROPERTIES FOR FERRITE, AUSTENITE AND MARTENSITE PHASES [2]
Institutional Repository - Library & Information Centre - University of Thessaly09/12/2017 12:18:41 EET - 137.108.70.7

5
The prediction of strength/ductility relationships for steels with ferrite/martensite and austenite/martensite microstructures is shown in Figure 2.1. Steel with a microstructure containing austenite and martensite has larger strain energy than steel consisting of ferrite and martensite. The volume fraction of austenite has stronger influence on the ductility of the steel than ferrite does. A combination of Graph 1.3 and 2.1 in Graph 1.6 reveals that the prediction on the mechanical properties of steels, with a ferrite/martensite microstructure, fits well with the experimental values. And the mechanical properties required for the 3rd generation of AHSS could be realized by producing AHSS with austenite and martensite microstructure.
The key point for obtaining the 3rd generation AHSS with high tensile strength as well as high ductility is that there is a significant amount of retained austenite in the steels, and the retained austenite can transform to martensite at higher strains, so that the work hardening rate of the steel will increase. Because austenite is not an equilibrium phase in the steel at room temperature, the main challenge of producing the 3rd generation of AHSS lies in the stabilization of a high content of retained austenite in the final structure. [2]
Graph 2.3 – Compination of figures 2.1 and 2.2
Graph 2.2 PREDICTED STRENGTH/DUCTILITY RELATIONSHIPS FOR TWO HYPOTHETICAL STEEL MICROSTRUCTURES: FERRITE + MARTENSITE (I.E. DP STEEL) AND STABLE AUSTENITE + MARTENSITE [2].
Institutional Repository - Library & Information Centre - University of Thessaly09/12/2017 12:18:41 EET - 137.108.70.7

6
2.1.3 ARMOR STEELS
Suitable material selection is very crucial with respect to reduction in weight of armor and it is essential to determine the material with lowest possible areal density for a defined threat. Many high strength steels, aluminum alloys and titanium alloys are being used as armor. Amongst them AHSS are predominantly used for armor applications owing to their low cost, superior mechanical properties, good machinability and high performance. Ballistic performance of metallic materials depends on parameters like strength, hardness, toughness, microstructure and strain hardening rate, but does not depend on any specific independent parameter. Instead, an optimized value of all the parameters leads to the best ballistic performance and has long been of practical interest in military applications. Heat treatment is the commonly used process to develop desired properties in steels. Of all the microstructures produced by heat treatment, martensite forms the highest level of strength in steels. However, because of large internal stresses associated with the martensitic transformation, martensite phase is rarely used in an untempered condition. Temperature and time are the two parameters in tempering that play vital roles in determining the mechanical properties of the material. In steels, tempering increases the ductility and toughness, which are essential for enhancing impact energy absorption. However, there is a slight decrease in strength and hardness. [3] If the steel is exposed to the temperature above 200°C some phase transformations take place in the microstructure and the degradation of mechanical properties needed for the steel usage occurs. These conditions are typical for secondary processing of the steel as are cutting or welding. There are published several studies about microstructure changes of carbon or low alloyed steels after plasma or laser cutting in scientific literature. Heat affected zone (HAZ) after the cutting by these processes could be classified to three different areas according that knowledge: 1. Surface area with full recrystallization to the austenite and back to pearlite,
bainite or martensite (temperature range from A3 to the solidus). The depth of this area is relatively low (about 50 µm) and depends on chemical composition of steel and parameters of used cutting process as are cutting speed or heat input. If martensitic transformation occurs in the area it may leads to internal stresses generation and consequently to the crack creation.
2. Area with partial recrystallization (temperature range from A1 to A3) where the heating up period is very short and therefore the austenitization is just partial. There is new phase created as a result of partial austenitization beside origin microstructure phases. The amount of new phase decreases in relation to distance from surface. In contrast to full recrystallization area in surface layer, the heating up temperature of this area is not so high and followed cooling is not so rapid. Therefore, the new created phases are more in steady state (bainitic or pearlitic type). The depth of this area is about 500 µm.
Institutional Repository - Library & Information Centre - University of Thessaly09/12/2017 12:18:41 EET - 137.108.70.7

7
3. Transition area between HAZ and core material (heating up below A1) where any essential phase transformation is not present. Processes known from basics of tempering process take place in steels with martensitic structure. Morphology of martensite is changed from tetragonal to cubic tempered martensite, transformation of the residual austenite occurs and cementite and other carbides are created. This area could reach the depth of several millimeters from surface. [4]
In the next paragraphs a review on the main thermal cutting processes is given.
Institutional Repository - Library & Information Centre - University of Thessaly09/12/2017 12:18:41 EET - 137.108.70.7

8
2.2 CUTTING METHODS
2.2.1 Oxy-Fuel Cutting
The process is now about 111-112 years old as it was patented in 1901 by Thomas
Fletcher. It is a Thermo-Chemical Process requiring a source of intense heat, referred
to as “Preheat”, and pure oxygen.
The process for all thicknesses is the same and that
is the material must be “preheated” to a
temperature of 870-1000 degrees °C, then the pure
Oxygen is discharged into the preheated area and
the steel is then oxidized or burned, hence the term
“burning”.
Advantages
Wide thickness cutting range, from sheet metal to 100 inch thick material
Quite excellent quality of the final cut surface, with sharp top edge, flat cut
surface, and a sharp slag- free lower edge.
Multiple torches can be used at once, multiplying productivity
Disadvantages
It is a relatively slow process
The pure oxygen requirement is of a 99.5% minimum purity. While the source
of the Oxygen may be pure, improper connections, bad hoses, or leaks of any
sort can allow impurities in the system thereby reducing the cutting speed
The high purity of the Oxygen presents a very dangerous situation and
requires extreme care in the selection of equipment and the design of piping
systems for its use
The basic requirement that the oxide formed must have a lower melting
point than the base material to be cut
Oxy-fuel cutting is ideal for plates thicker than 1 inch, but thin materials are
very challenging to flame cut.
Manufacturer recommendation
This process can be applied to high-hardness Armox plate up to 80 mm thickness. It
generates a kerf of 2-5 mm and a HAZ which is usually 4-10 mm wide. [5]
Figure 2.1 – OXY FUEL CUTTING
Institutional Repository - Library & Information Centre - University of Thessaly09/12/2017 12:18:41 EET - 137.108.70.7
9
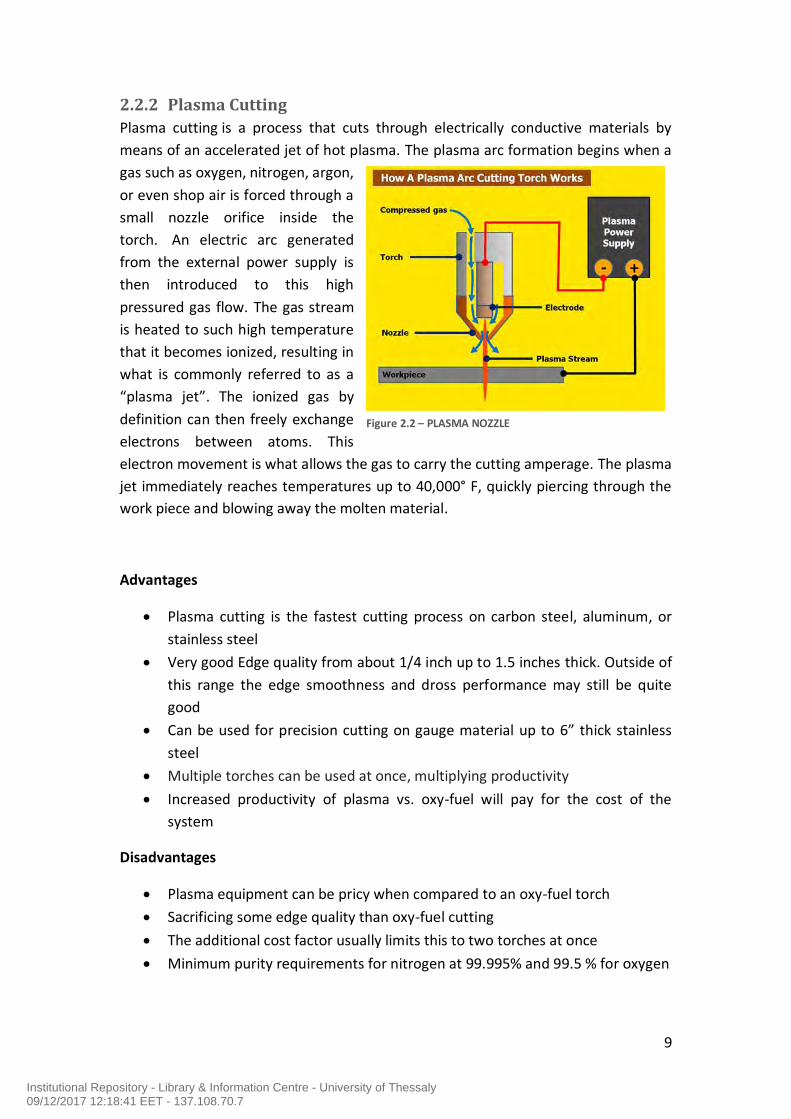
2.2.2 Plasma Cutting
Plasma cutting is a process that cuts through electrically conductive materials by
means of an accelerated jet of hot plasma. The plasma arc formation begins when a
gas such as oxygen, nitrogen, argon,
or even shop air is forced through a
small nozzle orifice inside the
torch. An electric arc generated
from the external power supply is
then introduced to this high
pressured gas flow. The gas stream
is heated to such high temperature
that it becomes ionized, resulting in
what is commonly referred to as a
“plasma jet”. The ionized gas by
definition can then freely exchange
electrons between atoms. This
electron movement is what allows the gas to carry the cutting amperage. The plasma
jet immediately reaches temperatures up to 40,000° F, quickly piercing through the
work piece and blowing away the molten material.
Advantages
Plasma cutting is the fastest cutting process on carbon steel, aluminum, or
stainless steel
Very good Edge quality from about 1/4 inch up to 1.5 inches thick. Outside of
this range the edge smoothness and dross performance may still be quite
good
Can be used for precision cutting on gauge material up to 6” thick stainless
steel
Multiple torches can be used at once, multiplying productivity
Increased productivity of plasma vs. oxy-fuel will pay for the cost of the
system
Disadvantages
Plasma equipment can be pricy when compared to an oxy-fuel torch
Sacrificing some edge quality than oxy-fuel cutting
The additional cost factor usually limits this to two torches at once
Minimum purity requirements for nitrogen at 99.995% and 99.5 % for oxygen
Figure 2.2 – PLASMA NOZZLE
Institutional Repository - Library & Information Centre - University of Thessaly09/12/2017 12:18:41 EET - 137.108.70.7

10
Manufacturer recommendation
High-hardness Armox plate up to around 25 mm thickness can be cut using this
process. It generates a kerf, usually 3-4 mm, and a HAZ up to 5 mm. Plasma cutting
can be performed under water, which minimizes the amount of distortion. [5]
2.2.3 Water jet Cutting
At water jet cutting, pressurized water is delivered to a
cutting head by high pressure tubing or hose. At the
cutting head, the high pressure water is applied to an
orifice with a typical diameter ranging from 0.005” to
0.020”. The orifice defines and creates the water
stream which cuts through the material.
After the water stream exits the orifice, an abrasive,
which is usually crushed garnet, can be added to the
water stream, allowing to cut hard materials. When
cutting hard materials, including steel, stainless steel,
aluminum, stone, wood, plastic, glass, etc., it is the
abrasive that does the actual cutting using a mechanical
sawing type action. When cutting soft materials, such as
rubber, leather, cloth, paper, cardboard, insulation,
foam, etc., abrasive is not used as the high pressure
water stream does the cutting.
Advantages
Is the most versatile process. It is able to cut almost any type of material.
Highest precision cutting on virtually any material.
It has a narrow kerf width, allowing fine contours to be cut, and producing
high tolerance parts
Leaves a smooth, precision cut surface
There is no heat distortion
It has a narrow kerf width, allowing fine contours to be cut, and producing
high tolerance parts
The practical limit on water jet cutting is around 6 to 8 inches
Multiple heads can be used at once, multiplying productivity
Figure 2.3 – WATER JET NOZZLE
Institutional Repository - Library & Information Centre - University of Thessaly09/12/2017 12:18:41 EET - 137.108.70.7
11
Disadvantages
It is very slow
The cost-per-hour to run water jet is much higher, when compared to plasma
on most metals, primarily due to the cost of the garnet abrasive
Up front equipment costs are usually a little higher than plasma, but not as
high as laser
Manufacturer recommendation
This process can be applied to the complete range of high-hardness Armox plate,
and is recommended as the best method, because the absence of HAZ eliminates the
risk of cracking. [5]
2.2.4 LASER
The laser cutting process uses a focused laser beam and an assist gas to a metallic
plate with high accuracy and exceptional process reliability. The laser beam is a
column of very high intensity light, of a single wavelength, which is generated by a
resonator. It is delivered through the cutting nozzle via a system of mirrors, so as to
go through the bore of the nozzle and hit the plate. Also compressed gas, such as
Oxygen or Nitrogen is flowing through the nozzle.
Focusing of the laser beam takes place in the laser cutting head by a special lens, or by a curved mirror. This results in high power density at the focal point, leading in rapid heating, melting and partial or complete vaporizing of the material. Two laser cutting methods exist:
Fusion Cutting, or high pressure cutting, where the material is fused by the energy of the laser beam. In this case nitrogen at high pressure (10 to 20 bars), is used to drive out the molten material from the kerf. This cutting method protects the cut edges from oxidation and is mainly used with stainless steels, aluminum and their alloys.
Oxidation Cutting, or laser torch cutting, in which the material is heated by
the laser beam to combustion temperature. In this case oxygen at a medium
pressure (0.4 to 5 bar) is used to oxidize the material and to drive the slag out
of the kerf. The exothermic reaction of the oxygen with the material supplies
a large part of the energy for the cutting process. This cutting method is the
quickest and is used for the economical cutting of carbon steels.
There are many parameters that affect cut quality, when all are controlled properly laser cutting is a stable, reliable, and very accurate cutting process. The following points are especially important for achieving good cutting results:
Institutional Repository - Library & Information Centre - University of Thessaly09/12/2017 12:18:41 EET - 137.108.70.7

12
Laser power: The laser power must be adjusted to suit the type and thickness of the
work-piece. Laser power is the total energy emitted in the form of laser light per
second. The intensity of a laser beam is equal to its power divided by the area over
which the power is concentrated. The high intensity causes the material to heat up
rapidly so that little time is available for heat to dissipate into the surrounding
material. This produces high cutting rates and an excellent quality of cut. A laser’s
intensity also determines the thickness that can be cut. The thicker the material to
be cut, the higher the intensity needed. Higher intensities can be reached by
increasing laser power.
Focal length: Optical systems with 5" and 7.5" focal lengths are typically used for
cutting. 5" optics are only suitable for thin materials. For thicker materials the 7.5"
optics are used. With the 5" optics the kerf is narrower compared to the 7.5" optics,
giving a higher energy density for the same laser power. The possible cutting speeds
for the 5" optics are therefore slightly higher for the same material thickness and
laser power. The 7.5" optics has the advantage of a greater depth of focus, i.e. the
maximum cutting thickness is greater. The 7.5" optics can be used universally for a
large range of thickness, but they are mainly used for thicker materials. The
definition of focal length is shown in figure 2.4.
Focus position: Exact positioning of the focal point is an important requirement for
good cutting results. The focal point can be at, below or above the plate’s surface, as
shown in figure 2.5.
Figure 2.5 – FOCAL POINT
Figure 2.4 – FOCAL LENGHT
Institutional Repository - Library & Information Centre - University of Thessaly09/12/2017 12:18:41 EET - 137.108.70.7

13
Cutting speed: The cutting speed must be matched to the type and thickness of the
work-piece. A speed which is too fast or too slow leads to increased roughness, burr
formation and to large drag lines. Cutting speed, though, is determined by the
average power level. The higher the average power, the higher the cutting speed.
Type and pressure of cutting gas: The type of material and the requirements of the
cutting results determine the cutting gas to be used. The material thickness of the
work-piece must be matched to the gas pressure. When thin metallic materials are
cut with the torch cutting method a higher gas pressure than thicker materials is
appropriate. If the pressure is too low, the fluid slag remains adhered to the base
material, forming a permanent burr or closing the kerf again. If the pressure is too
high, the lower edges of the cut are burnt out and often make the cut unusable. In
contrast, with high pressure cutting thicker work-pieces are cut at higher gas
pressure.
Nozzle size and standoff distance: Gas assistance is essential in laser cutting.
Therefore, nozzle geometry and standoff distance are important.
Advantages
High accuracy
Excellent cut quality
High processing speed
Very narrow kerf width
Very small heat-affected zone compared to other thermal cutting processes
It is possible to cut complex geometrical shapes, small holes, and beveled
parts
Cutting and marking with the same tool
Cutting many types of materials
Very thin oxide layer
High-pressure laser cutting with nitrogen enables oxide-free cutting
Edge quality is usually very good, with extremely small serrations and lag
lines, very square edges, and little to no dross
Disadvantages
The laser cutting process is suitable for cutting mild steel from gauge
thickness up to about 1.25 inch.
The speed is limited by the speed of the chemical reaction between Iron and
Oxygen.
Institutional Repository - Library & Information Centre - University of Thessaly09/12/2017 12:18:41 EET - 137.108.70.7
14
Cutting with multiple heads on the same machine is not possible, except for
fiber lasers
Manufacturer recommendation
High-hardness Armox plate up to around 20 mm thickness can be cut using this
process. It generates a narrow kerf, usually less than 1 mm, and a narrow HAZ,
usually less than 3 mm. [5]
2.3 RESEARCH ON ARMOR STEELS
Many studies have been conducted on the negative effects of secondary thermal
processes on the performance of armor steels. These studies are aiming to analyze,
find ways to predict and reduce those effects as much as possible.
A study focused on cutting methods on armor steels shows that changes in
microstructure, after laser and plasma cutting process reported that a surface layer
consisted of martensitic needles is formed after both processes. Also, an area where
partial recrystallization is observed, wider at the plasma cutting. Plasma cut also
produces HAZ with significantly higher depth, while, white coherent oxide layer and
partial saturation by gases (N2, O2) was observed. [4]
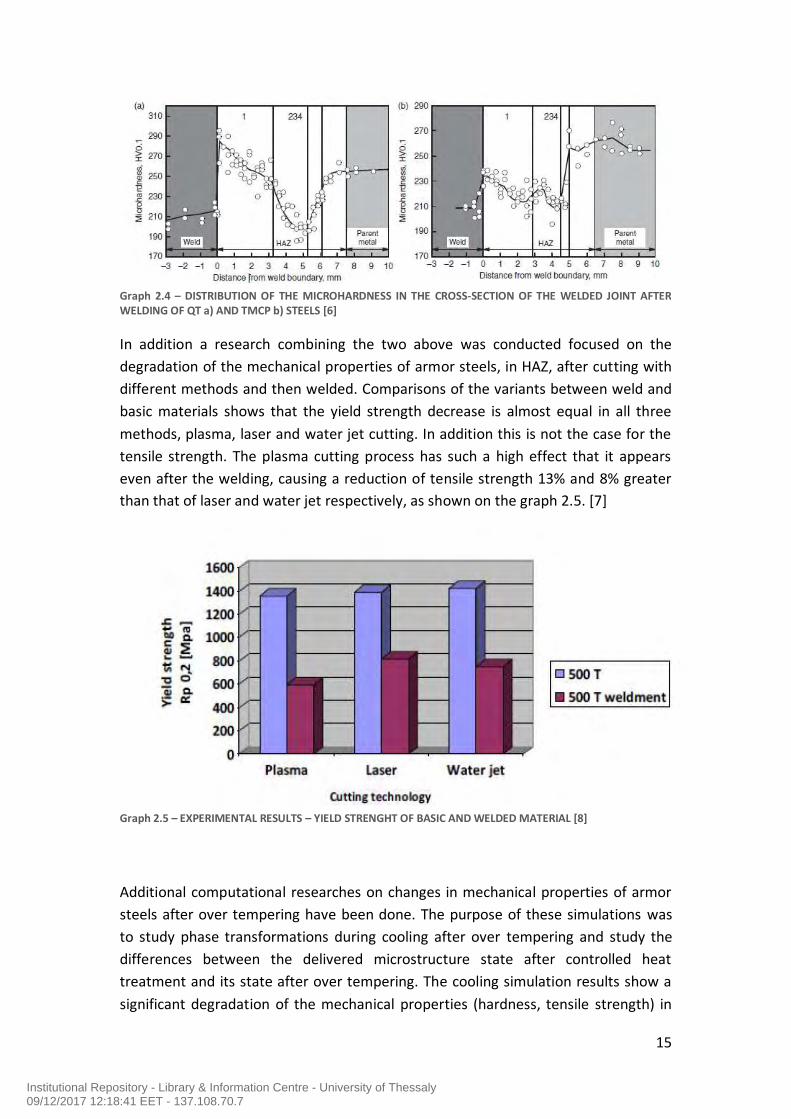
Another paper investigates the post welding degradation of the mechanical
properties of armor steels, produced either by the quenching and tempering method
or by thermomechanical rolling with accelerated cooling. It shows that at the same
strength of the steels the microstructure of the heat-affected zone (HAZ) greatly
differs for the same welding conditions. Also, it is mentioned that the softened zone
of the HAZ in the TMCP steel is wider than in the steel produced by QT. The
distribution of microhardness can be seen at graph 2.4. [6]
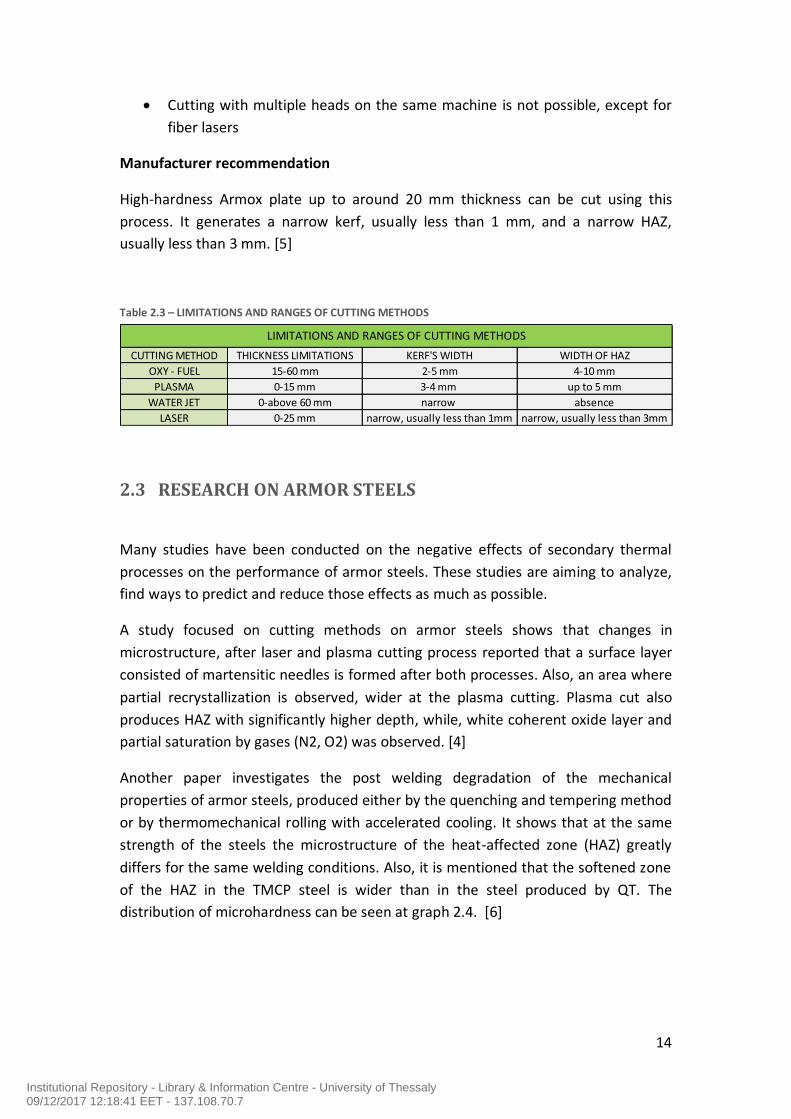
CUTTING METHOD THICKNESS LIMITATIONS KERF'S WIDTH WIDTH OF HAZ
OXY - FUEL 15-60 mm 2-5 mm 4-10 mm
PLASMA 0-15 mm 3-4 mm up to 5 mm
WATER JET 0-above 60 mm narrow absence
LASER 0-25 mm narrow, usually less than 1mm narrow, usually less than 3mm
LIMITATIONS AND RANGES OF CUTTING METHODS
Table 2.3 – LIMITATIONS AND RANGES OF CUTTING METHODS
Institutional Repository - Library & Information Centre - University of Thessaly09/12/2017 12:18:41 EET - 137.108.70.7
15
In addition a research combining the two above was conducted focused on the
degradation of the mechanical properties of armor steels, in HAZ, after cutting with
different methods and then welded. Comparisons of the variants between weld and
basic materials shows that the yield strength decrease is almost equal in all three
methods, plasma, laser and water jet cutting. In addition this is not the case for the
tensile strength. The plasma cutting process has such a high effect that it appears
even after the welding, causing a reduction of tensile strength 13% and 8% greater
than that of laser and water jet respectively, as shown on the graph 2.5. [7]
Additional computational researches on changes in mechanical properties of armor
steels after over tempering have been done. The purpose of these simulations was
to study phase transformations during cooling after over tempering and study the
differences between the delivered microstructure state after controlled heat
treatment and its state after over tempering. The cooling simulation results show a
significant degradation of the mechanical properties (hardness, tensile strength) in
Graph 2.5 – EXPERIMENTAL RESULTS – YIELD STRENGHT OF BASIC AND WELDED MATERIAL [8]
Graph 2.4 – DISTRIBUTION OF THE MICROHARDNESS IN THE CROSS-SECTION OF THE WELDED JOINT AFTER WELDING OF QT a) AND TMCP b) STEELS [6]
Institutional Repository - Library & Information Centre - University of Thessaly09/12/2017 12:18:41 EET - 137.108.70.7

16
areas where material affected by over tempering. Additional exposure of the
material to over tempering temperatures cause continuation of the tempering
process and therefore degradation of its mechanical properties. The intensity of
degradation rises proportionally with the increase in temperature and the time of
exposure. Some of the results are given in table 2.4. [8]
At another research, simulations of armor steels were carried out with TTSteel 2.1
software. This software was designated for the determination and calculation of
mechanical properties of constructional, micro alloyed and tool steels after their
heat treatment. The software creates transformation diagram of simulated steels
based on their chemical composition. Then, it calculates cooling curve according the
transformation diagram and also input cooling conditions. Next step is the
determination of microstructure phases in simulated sample volume based on stated
cooling curve. Finally, the mechanical properties are calculated according to
microstructure components in every volume element. The results of a simulation on
armor steels, show that the degradation of mechanical properties is in range of 20-
30% when heated up above the A1 temperature and in range of 14-19% when
heated up just below the A1 temperature and then cooled slowly in air of 20°C
temperature. Some results are given in tables 2.6 and 2.7. [8] [9]
Table 2.5 – SIMULATION RESULTS FOR ARMOX 500 STEEL HEATED BELOW A1 TEMPERATURE [9]
Table 2.4 – ARMOX 500T PROPERTIES CALCULATED BY COOLING SIMULATION [8]
Institutional Repository - Library & Information Centre - University of Thessaly09/12/2017 12:18:41 EET - 137.108.70.7

17
In the frame of the current work laser cutting was employed for the preparation of
selected plates of ARMOX 500 steel before welding. The purpose was to determine
the extent of deterioration at the cutting edge and to define the optimum laser
cutting conditions so as to minimize the effect from the cutting process.
Table 2.6 – SIMULATION RESULTS FOR ARMOX 500 STEEL HEATED ABOVE A1 TEMPERATURE [9]
Institutional Repository - Library & Information Centre - University of Thessaly09/12/2017 12:18:41 EET - 137.108.70.7
18
3 MATERIAL AND EXPERIMENTAL PROCESS
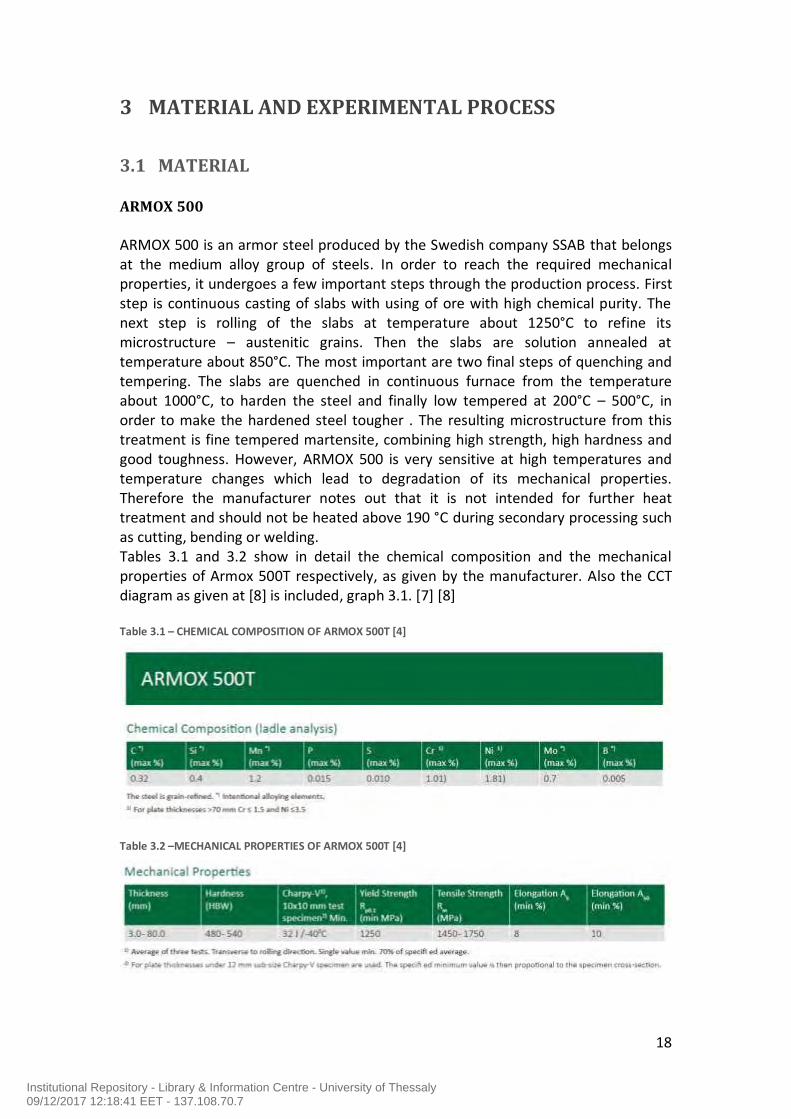
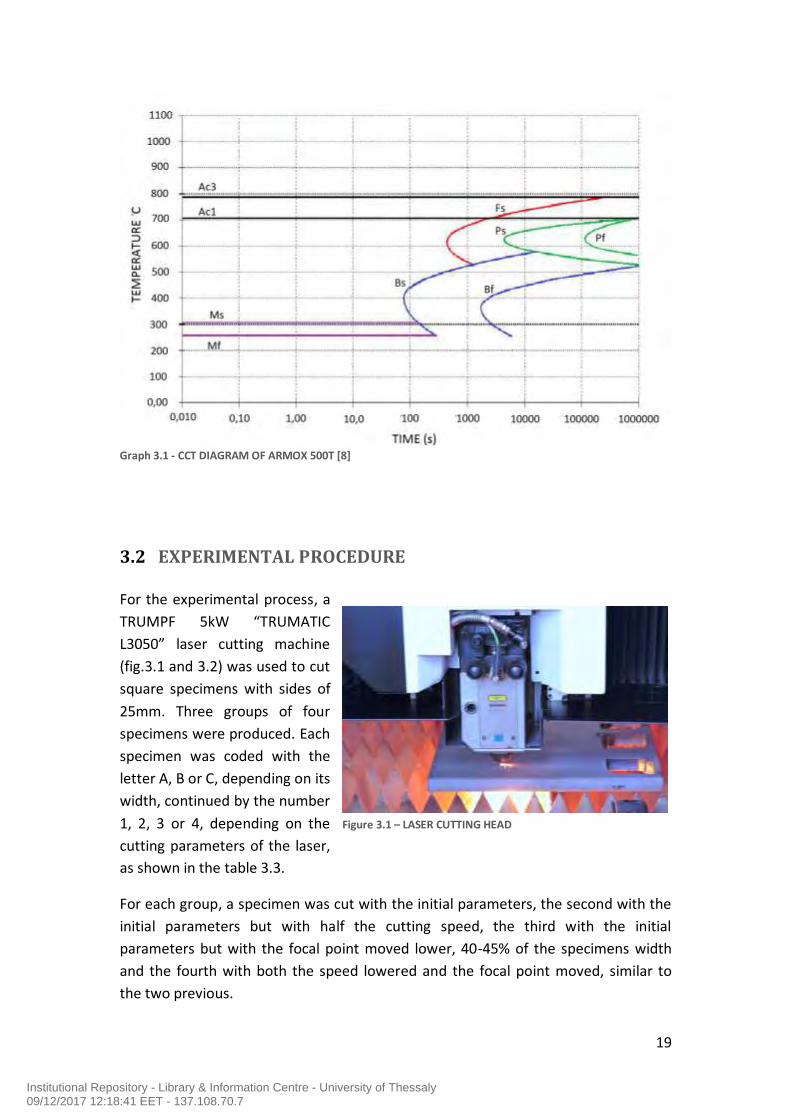
3.1 MATERIAL ARMOX 500 ARMOX 500 is an armor steel produced by the Swedish company SSAB that belongs at the medium alloy group of steels. In order to reach the required mechanical properties, it undergoes a few important steps through the production process. First step is continuous casting of slabs with using of ore with high chemical purity. The next step is rolling of the slabs at temperature about 1250°C to refine its microstructure – austenitic grains. Then the slabs are solution annealed at temperature about 850°C. The most important are two final steps of quenching and tempering. The slabs are quenched in continuous furnace from the temperature about 1000°C, to harden the steel and finally low tempered at 200°C – 500°C, in order to make the hardened steel tougher . The resulting microstructure from this treatment is fine tempered martensite, combining high strength, high hardness and good toughness. However, ARMOX 500 is very sensitive at high temperatures and temperature changes which lead to degradation of its mechanical properties. Therefore the manufacturer notes out that it is not intended for further heat treatment and should not be heated above 190 °C during secondary processing such as cutting, bending or welding. Tables 3.1 and 3.2 show in detail the chemical composition and the mechanical properties of Armox 500T respectively, as given by the manufacturer. Also the CCT diagram as given at [8] is included, graph 3.1. [7] [8]
Table 3.2 –MECHANICAL PROPERTIES OF ARMOX 500T [4]
Table 3.1 – CHEMICAL COMPOSITION OF ARMOX 500T [4]
Institutional Repository - Library & Information Centre - University of Thessaly09/12/2017 12:18:41 EET - 137.108.70.7
19
3.2 EXPERIMENTAL PROCEDURE
For the experimental process, a
TRUMPF 5kW “TRUMATIC
L3050” laser cutting machine
(fig.3.1 and 3.2) was used to cut
square specimens with sides of
25mm. Three groups of four
specimens were produced. Each
specimen was coded with the
letter A, B or C, depending on its
width, continued by the number
1, 2, 3 or 4, depending on the
cutting parameters of the laser,
as shown in the table 3.3.
For each group, a specimen was cut with the initial parameters, the second with the
initial parameters but with half the cutting speed, the third with the initial
parameters but with the focal point moved lower, 40-45% of the specimens width
and the fourth with both the speed lowered and the focal point moved, similar to
the two previous.
Graph 3.1 - CCT DIAGRAM OF ARMOX 500T [8]
Figure 3.1 – LASER CUTTING HEAD
Institutional Repository - Library & Information Centre - University of Thessaly09/12/2017 12:18:41 EET - 137.108.70.7

20
PARAMETER 1 2 3 4 1 2 3 4 1 2 3 4
FOCAL LENGTH (in) 7,5 7,5 7,5 7,5 7,5 7,5 7,5 7,5 7,5 7,5 7,5 7,5
NOZZLE (mm) 1 1 1 1 1,2 1,2 1,2 1,2 2 2 2 2
GAS O2 O2 O2 O2 O2 O2 O2 O2 O2 O2 O2 O2
FOCAL POINT (mm)* 0 0 -2 -2 +0,5 +0,5 -3,5 -3,5 +4,5 +4,5 -4,5 -4,5
LASER POWER (W) 4800 4800 4800 4800 4800 4800 4800 4800 4800 4800 4800 4800
GATING FREQUENCY (Hz) 20.000 20.000 20.000 20.000 20.000 20.000 20.000 20.000 20.000 20.000 20.000 20.000
SPEED (m/min) 3200 1600 3200 1600 1920 960 1920 960 880 440 880 440
NOZZLE STAND OFF (mm) 1,2 1,2 1,2 1,2 1,5 1,5 1,5 1,5 1 1 1 1
GAS PRESSURE (bar) 0,8 0,8 0,8 0,8 0,8 0,8 0,8 0,8 0,6 0,6 0,6 0,6
HIR (J/mm) 0,09 0,18 0,09 0,18 0,15 0,30 0,15 0,30 0,33 0,65 0,33 0,65
CUTTING PARAMETERS & HEAT INPUT RATE
*The focal point is measured from the plate's top surface and is considered positive when it is above this surface (near the nozzle) and negative when it is below this
surface (inside the plate's width)
A (ta=5mm) B (tb=10mm) C (tc=20mm)
GROUP
SPECIMEN
Table 3.3 – LASER CUTTING PARAMETERS AND HEAT INPUT RATE
Institutional Repository - Library & Information Centre - University of Thessaly09/12/2017 12:18:41 EET - 137.108.70.7

21
From these parameters the Heat Input Rate is calculated. Heat Input Rate is the
power of the laser beam divided by the cutting speed. The results are shown in the
table 3.3.
For each specimen the experimental procedure followed included:
Roughness measurement: Roughness test was performed on the cutting surface, after the cutting process, at 1mm below the upper plate’s surface and 1mm above the lower plate’s surface with Taylor Hobsons “Surtronic 25” roughness meter, as shown in figures 3.3 and 3.4. The roughness parameter, Ra, is the arithmetic average of the absolute values of the profile height deviations from the mean line.
Figure 3.3 – ROUGHNESS MEASURED AREA
Figure 3.2 – TRUMPF - TRUMATIC L 3050
Institutional Repository - Library & Information Centre - University of Thessaly09/12/2017 12:18:41 EET - 137.108.70.7
22
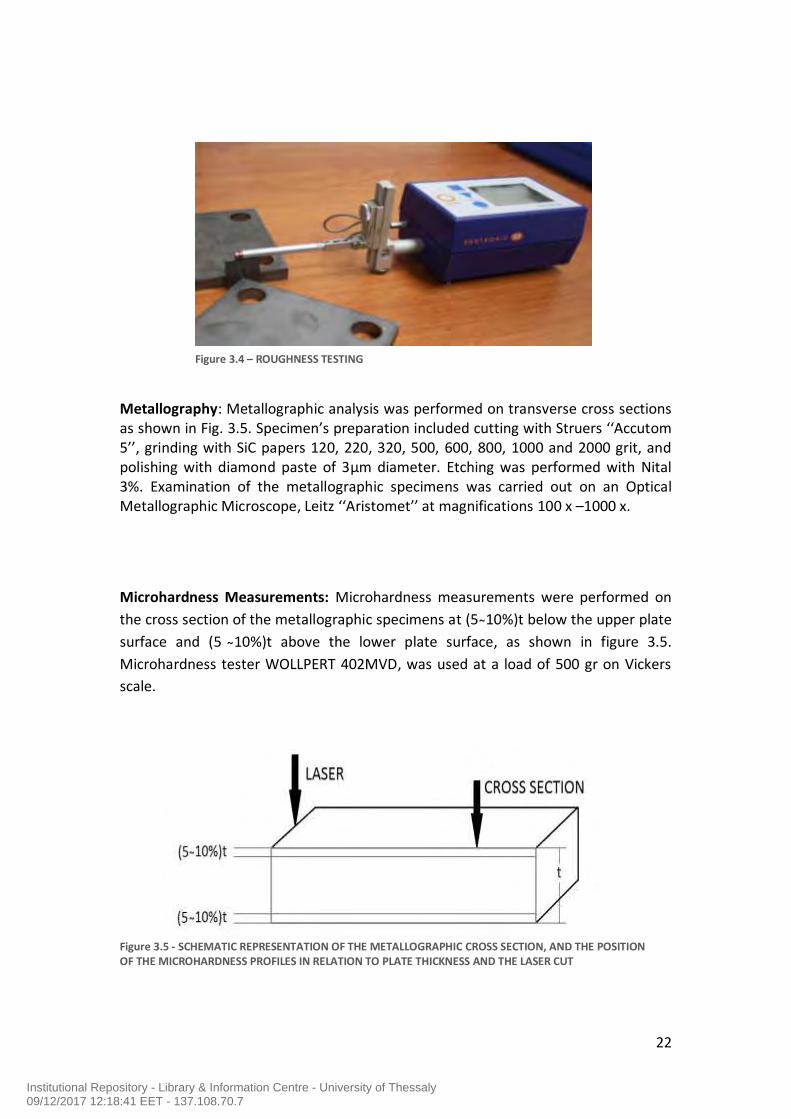
Metallography: Metallographic analysis was performed on transverse cross sections as shown in Fig. 3.5. Specimen’s preparation included cutting with Struers ‘‘Accutom 5’’, grinding with SiC papers 120, 220, 320, 500, 600, 800, 1000 and 2000 grit, and polishing with diamond paste of 3μm diameter. Etching was performed with Nital 3%. Examination of the metallographic specimens was carried out on an Optical Metallographic Microscope, Leitz ‘‘Aristomet’’ at magnifications 100 x –1000 x.
Microhardness Measurements: Microhardness measurements were performed on
the cross section of the metallographic specimens at (5 10%)t below the upper plate
surface and (5 10%)t above the lower plate surface, as shown in figure 3.5.
Microhardness tester WOLLPERT 402MVD, was used at a load of 500 gr on Vickers
scale.
Figure 3.5 - SCHEMATIC REPRESENTATION OF THE METALLOGRAPHIC CROSS SECTION, AND THE POSITION OF THE MICROHARDNESS PROFILES IN RELATION TO PLATE THICKNESS AND THE LASER CUT
Figure 3.4 – ROUGHNESS TESTING
Institutional Repository - Library & Information Centre - University of Thessaly09/12/2017 12:18:41 EET - 137.108.70.7
23
4 RESULTS
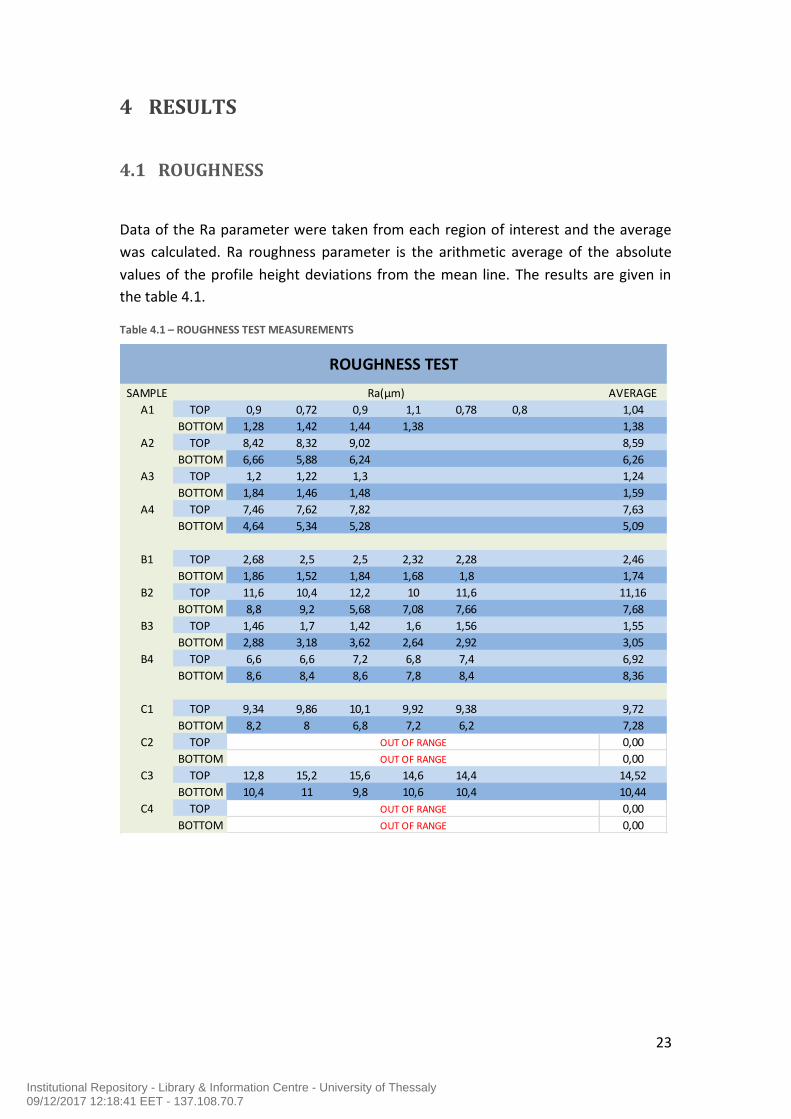
4.1 ROUGHNESS
Data of the Ra parameter were taken from each region of interest and the average
was calculated. Ra roughness parameter is the arithmetic average of the absolute
values of the profile height deviations from the mean line. The results are given in
the table 4.1.
SAMPLE AVERAGE
A1 TOP 0,9 0,72 0,9 1,1 0,78 0,8 1,04
BOTTOM 1,28 1,42 1,44 1,38 1,38
A2 TOP 8,42 8,32 9,02 8,59
BOTTOM 6,66 5,88 6,24 6,26
A3 TOP 1,2 1,22 1,3 1,24
BOTTOM 1,84 1,46 1,48 1,59
A4 TOP 7,46 7,62 7,82 7,63
BOTTOM 4,64 5,34 5,28 5,09
B1 TOP 2,68 2,5 2,5 2,32 2,28 2,46
BOTTOM 1,86 1,52 1,84 1,68 1,8 1,74
B2 TOP 11,6 10,4 12,2 10 11,6 11,16
BOTTOM 8,8 9,2 5,68 7,08 7,66 7,68
B3 TOP 1,46 1,7 1,42 1,6 1,56 1,55
BOTTOM 2,88 3,18 3,62 2,64 2,92 3,05
B4 TOP 6,6 6,6 7,2 6,8 7,4 6,92
BOTTOM 8,6 8,4 8,6 7,8 8,4 8,36
C1 TOP 9,34 9,86 10,1 9,92 9,38 9,72
BOTTOM 8,2 8 6,8 7,2 6,2 7,28
C2 TOP 0,00
BOTTOM 0,00
C3 TOP 12,8 15,2 15,6 14,6 14,4 14,52
BOTTOM 10,4 11 9,8 10,6 10,4 10,44
C4 TOP 0,00
BOTTOM 0,00
Ra(μm)
OUT OF RANGE
OUT OF RANGE
OUT OF RANGE
OUT OF RANGE
ROUGHNESS TEST
Table 4.1 – ROUGHNESS TEST MEASUREMENTS
Institutional Repository - Library & Information Centre - University of Thessaly09/12/2017 12:18:41 EET - 137.108.70.7

24
Graphs 4.1, 4.2 AND 4.3show the effect of cutting parameters on roughness at
specimens of the same thickness.
Graph 4.2 – ROUGHNESS OF 10mm SPECIMENS
Graph 4.1 – ROUGHNESS OF 5mm SPECIMENS
Institutional Repository - Library & Information Centre - University of Thessaly09/12/2017 12:18:41 EET - 137.108.70.7
25
Graphs 4.4, 4.5, 4.6 and 4.7 show the roughness differences at specimens of
different thickness from the same group of cutting parameters.
Graph 4.4 – ROUGHNESS OF SPECIMENS CUT WITH PARAMETERS 1
Graph 4.3 – ROUGHNESS OF 20mm SPECIMENS
Institutional Repository - Library & Information Centre - University of Thessaly09/12/2017 12:18:41 EET - 137.108.70.7

26
Graph 4.6 – ROUGHNESS OF SPECIMENS CUT WITH PARAMETERS 3
Graph 4.5 – ROUGHNESS OF SPECIMENS CUT WITH PARAMETERS 2
Institutional Repository - Library & Information Centre - University of Thessaly09/12/2017 12:18:41 EET - 137.108.70.7

27
Graph 4.7 – ROUGHNESS OF SPECIMENS CUT WITH PARAMETERS 4
Institutional Repository - Library & Information Centre - University of Thessaly09/12/2017 12:18:41 EET - 137.108.70.7

28
4.2 METALLOGRAPHY
Metallographic analysis was performed on transverse cross sections and was mainly
focus on three regions. The first of the base, unaffected, material in the middle of the
specimen and the other two at the heat affected zone, near the top and near the
bottom, as shown in figure 4.1.
4.2.1 GROUP A
Figure 4.1 shows the unaffected material of Group A specimens. The microstructure
consists of tempered martensite.
Figure 4.2 (x1000) - A GROUP’S UNAFFECTED MATERIAL, TEMPERED MARTENSITE
Figure 4.1 - SCHEMATIC REPRESENTATION OF THE METALLOGRAPHIC CROSS SECTION, AND THE POSITION OF THE MICROHARDNESS PROFILES IN RELATION TO PLATE THICKNESS AND THE LASER CUT
Institutional Repository - Library & Information Centre - University of Thessaly09/12/2017 12:18:41 EET - 137.108.70.7

29
SPECIMEN A1
Figures 4.2 and 4.3 show the microstructure of A1 specimen’s HAZ near the top and
near the bottom respectively. There HAZ appeared narrower at the top of the
specimen in comparison to the bottom.
Figure 4.4 (x200) – A1 SPECIMEN’S HAZ, NEAR THE BOTTOM PLATE’S SURFACE
Figure 4.3 (x200) – A1 SPECIMEN’S HAZ, NEAR THE TOP PLATE’S SURFACE
Institutional Repository - Library & Information Centre - University of Thessaly09/12/2017 12:18:41 EET - 137.108.70.7
30
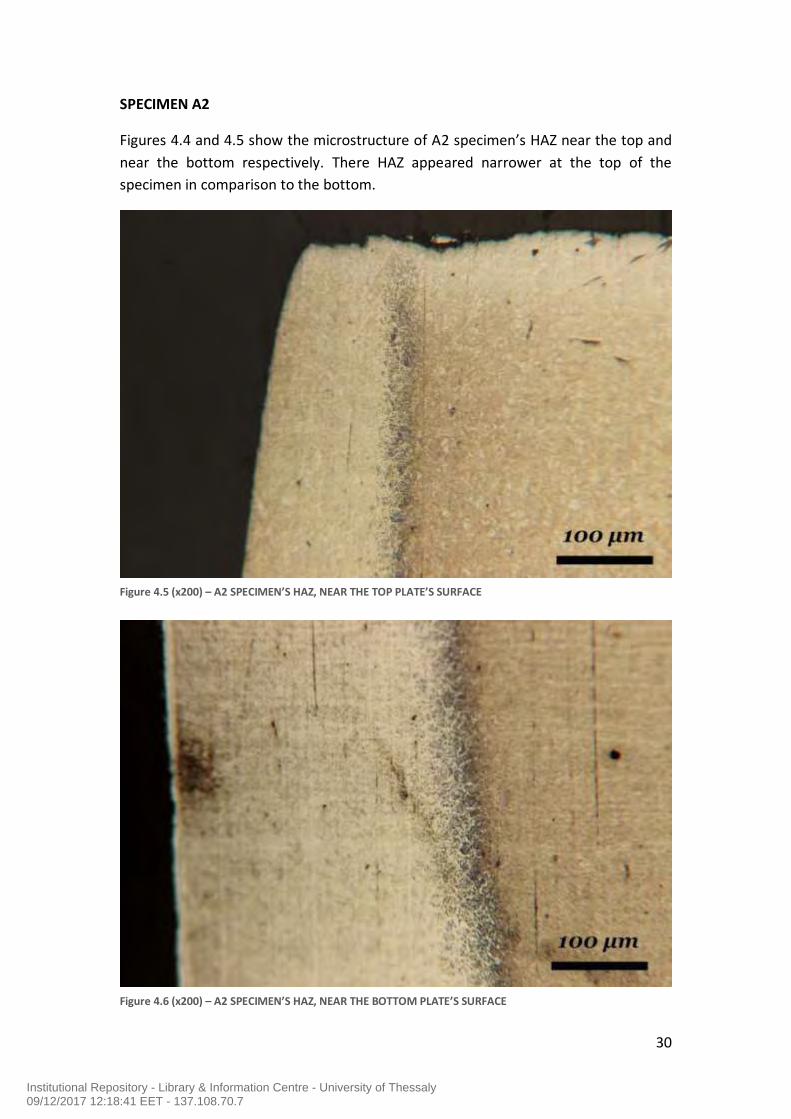
SPECIMEN A2
Figures 4.4 and 4.5 show the microstructure of A2 specimen’s HAZ near the top and
near the bottom respectively. There HAZ appeared narrower at the top of the
specimen in comparison to the bottom.
Figure 4.6 (x200) – A2 SPECIMEN’S HAZ, NEAR THE BOTTOM PLATE’S SURFACE
Figure 4.5 (x200) – A2 SPECIMEN’S HAZ, NEAR THE TOP PLATE’S SURFACE
Institutional Repository - Library & Information Centre - University of Thessaly09/12/2017 12:18:41 EET - 137.108.70.7
31
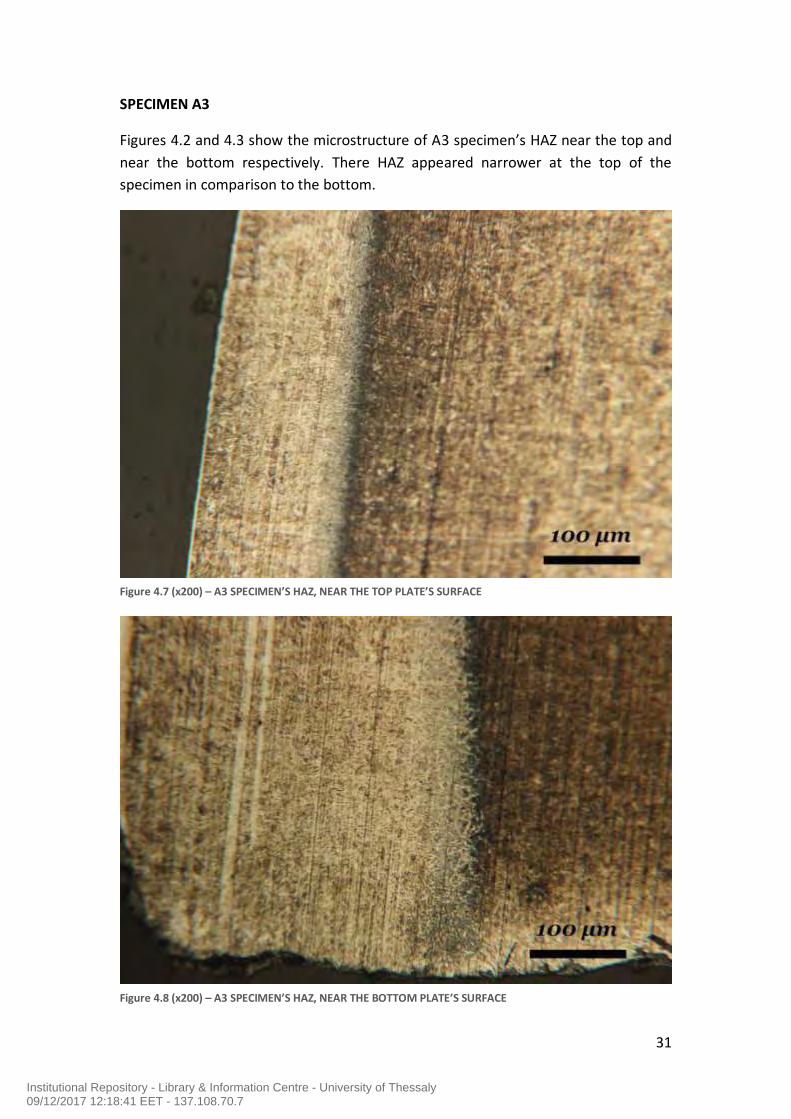
SPECIMEN A3
Figures 4.2 and 4.3 show the microstructure of A3 specimen’s HAZ near the top and
near the bottom respectively. There HAZ appeared narrower at the top of the
specimen in comparison to the bottom.
Figure 4.8 (x200) – A3 SPECIMEN’S HAZ, NEAR THE BOTTOM PLATE’S SURFACE
Figure 4.7 (x200) – A3 SPECIMEN’S HAZ, NEAR THE TOP PLATE’S SURFACE
Institutional Repository - Library & Information Centre - University of Thessaly09/12/2017 12:18:41 EET - 137.108.70.7

32
SPECIMEN A4
Figures 4.8 and 4.9 show the microstructure of A4 specimen’s HAZ near the top and
near the bottom respectively. There HAZ appeared narrower at the top of the
specimen in comparison to the bottom.
Figure 4.10 (x100) - A2 SPECIMEN’S HAZ, NEAR THE BOTTOM PLATE’S SURFACE
Figure 4.9 (x200) – A4 SPECIMEN’S HAZ, NEAR THE TOP PLATE’S SURFACE
Institutional Repository - Library & Information Centre - University of Thessaly09/12/2017 12:18:41 EET - 137.108.70.7

33
4.2.2 GROUP B
Figure 4.10 shows the unaffected material of Group B specimens. The microstructure
consists of tempered martensite.
Figure 4.11 (x500) – B GROUP’S UNAFFECTED MATERIAL
Institutional Repository - Library & Information Centre - University of Thessaly09/12/2017 12:18:41 EET - 137.108.70.7

34
SPECIMEN B1
Figures 4.11 and 4.12 show the microstructure of B1 specimen’s HAZ near the top
and near the bottom respectively. There HAZ appeared narrower at the top of the
specimen in comparison to the bottom.
Figure 4.13 (x200) – B1 SPECIMEN’S HAZ, NEAR THE BOTTOM PLATE’S SURFACE
Figure 4.12 (x200) – B1 SPECIMEN’S HAZ, NEAR THE TOP PLATE’S SURFACE
Institutional Repository - Library & Information Centre - University of Thessaly09/12/2017 12:18:41 EET - 137.108.70.7

35
SPECIMEN B2
Figures 4.13 and 4.14 show the microstructure of B2 specimen’s HAZ near the top
and near the bottom respectively. There HAZ appeared narrower at the top of the
specimen in comparison to the bottom.
Figure 4.15 (x200) – B2 SPECIMEN’S HAZ, NEAR THE BOTTOM PLATE’S SURFACE
Figure 4.14 (x200) – B2 SPECIMEN’S HAZ, NEAR THE TOP PLATE’S SURFACE
Institutional Repository - Library & Information Centre - University of Thessaly09/12/2017 12:18:41 EET - 137.108.70.7
36
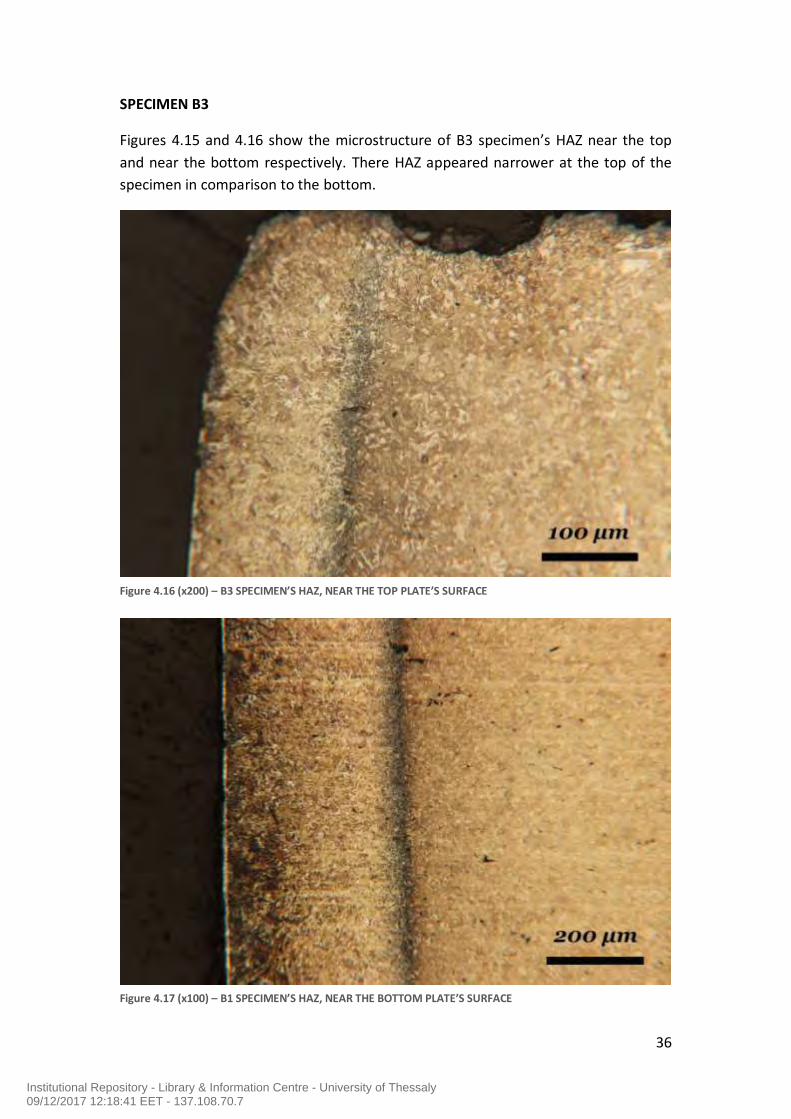
SPECIMEN B3
Figures 4.15 and 4.16 show the microstructure of B3 specimen’s HAZ near the top
and near the bottom respectively. There HAZ appeared narrower at the top of the
specimen in comparison to the bottom.
Figure 4.17 (x100) – B1 SPECIMEN’S HAZ, NEAR THE BOTTOM PLATE’S SURFACE
Figure 4.16 (x200) – B3 SPECIMEN’S HAZ, NEAR THE TOP PLATE’S SURFACE
Institutional Repository - Library & Information Centre - University of Thessaly09/12/2017 12:18:41 EET - 137.108.70.7

37
SPECIMEN B4
Figures 4.17 and 4.18 show the microstructure of B4 specimen’s HAZ near the top
and near the bottom respectively. There HAZ appeared narrower at the top of the
specimen in comparison to the bottom.
Figure 4.19 (x200) – B4 SPECIMEN’S HAZ, NEAR THE BOTTOM PLATE’S SURFACE
Figure 4.18 (x200) – B4 SPECIMEN’S HAZ, NEAR THE TOP PLATE’S SURFACE
Institutional Repository - Library & Information Centre - University of Thessaly09/12/2017 12:18:41 EET - 137.108.70.7

38
4.2.3 GROUP C
Figure 4.19 shows the unaffected material of Group C specimens. The microstructure
consists of tempered martensite.
Figure 4.20 (x200) - C GROUP’S UNAFFECTED MATERIAL,
Institutional Repository - Library & Information Centre - University of Thessaly09/12/2017 12:18:41 EET - 137.108.70.7

39
SPECIMEN C1
Figures 4.20 and 4.21 show the microstructure of C1 specimen’s HAZ near the top
and near the bottom respectively. There HAZ appeared narrower at the top of the
specimen in comparison to the bottom.
Figure 4.22 (x100) - C1 SPECIMEN’S HAZ, NEAR THE BOTTOM PLATE’S SURFACE
Figure 4.21 (x100) – C1 SPECIMEN’S HAZ, NEAR THE TOP PLATE’S SURFACE
Institutional Repository - Library & Information Centre - University of Thessaly09/12/2017 12:18:41 EET - 137.108.70.7
40
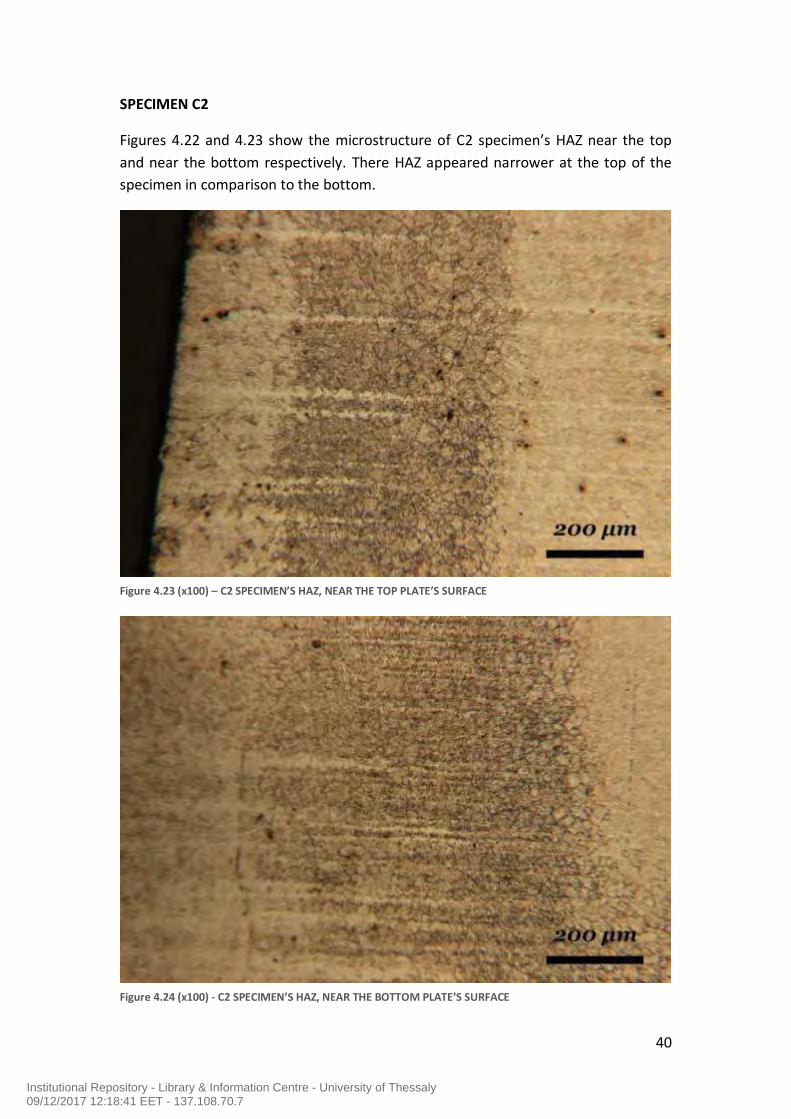
SPECIMEN C2
Figures 4.22 and 4.23 show the microstructure of C2 specimen’s HAZ near the top
and near the bottom respectively. There HAZ appeared narrower at the top of the
specimen in comparison to the bottom.
Figure 4.24 (x100) - C2 SPECIMEN’S HAZ, NEAR THE BOTTOM PLATE’S SURFACE
Figure 4.23 (x100) – C2 SPECIMEN’S HAZ, NEAR THE TOP PLATE’S SURFACE
Institutional Repository - Library & Information Centre - University of Thessaly09/12/2017 12:18:41 EET - 137.108.70.7
41
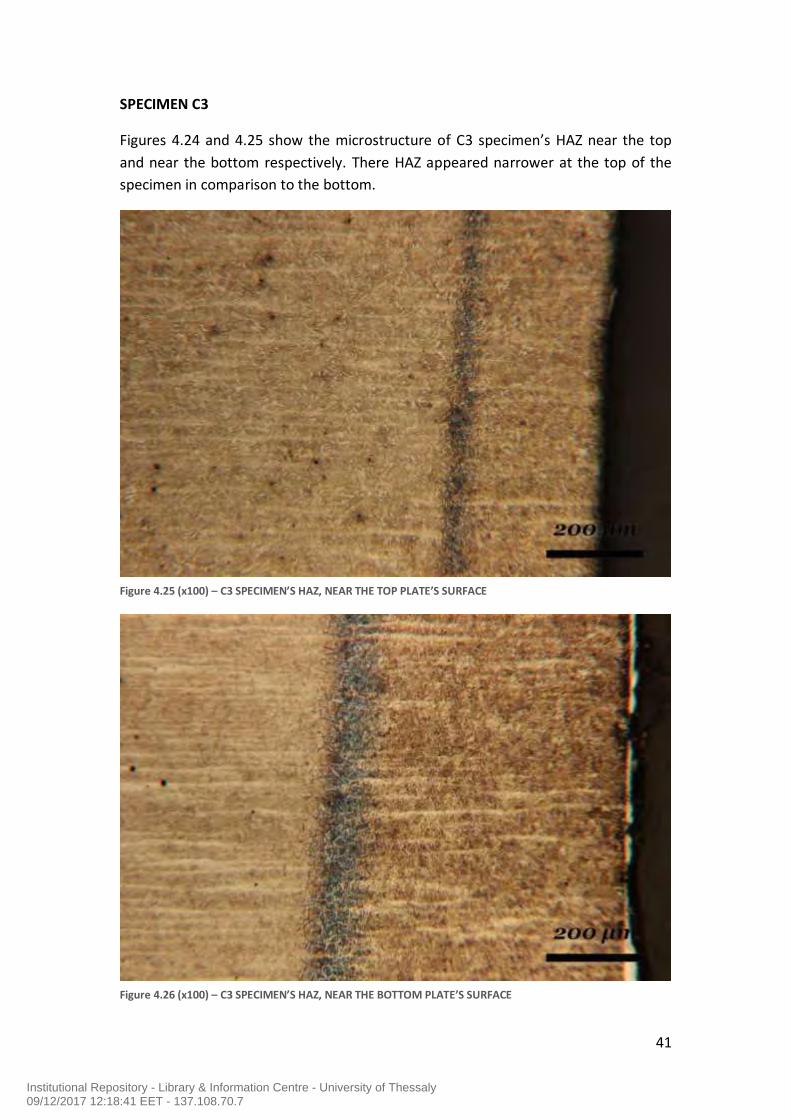
SPECIMEN C3
Figures 4.24 and 4.25 show the microstructure of C3 specimen’s HAZ near the top
and near the bottom respectively. There HAZ appeared narrower at the top of the
specimen in comparison to the bottom.
Figure 4.26 (x100) – C3 SPECIMEN’S HAZ, NEAR THE BOTTOM PLATE’S SURFACE
Figure 4.25 (x100) – C3 SPECIMEN’S HAZ, NEAR THE TOP PLATE’S SURFACE
Institutional Repository - Library & Information Centre - University of Thessaly09/12/2017 12:18:41 EET - 137.108.70.7

42
SPECIMEN C4
Figures 4.26 and 4.27 show the microstructure of C4 specimen’s HAZ near the top
and near the bottom respectively. There HAZ appeared narrower at the top of the
specimen in comparison to the bottom.
Figure 4.28 (x200) – C4 SPECIMEN’S HAZ, NEAR THE BOTTOM PLATE’S SURFACE
Figure 4.27 (x200) – C4 SPECIMEN’S HAZ, NEAR THE TOP PLATE’S SURFACE
Institutional Repository - Library & Information Centre - University of Thessaly09/12/2017 12:18:41 EET - 137.108.70.7

43
4.2.4 METALLOGRAPHY IN HIGHER MAGNIFICATIONS
Figures 4.29 and 4.30 show the bainitic microstructure at the HAZ of specimens C4
and A2 respectively.
Figure 4.30 (x500) – HAZ OF SPECIMEN A2 NEAR THE TOP SURFACE
Figure 4.29 (x500) - HAZ OF C4 SPECIMEN, BAINITIC MICROSTRUCTURE
Institutional Repository - Library & Information Centre - University of Thessaly09/12/2017 12:18:41 EET - 137.108.70.7
44
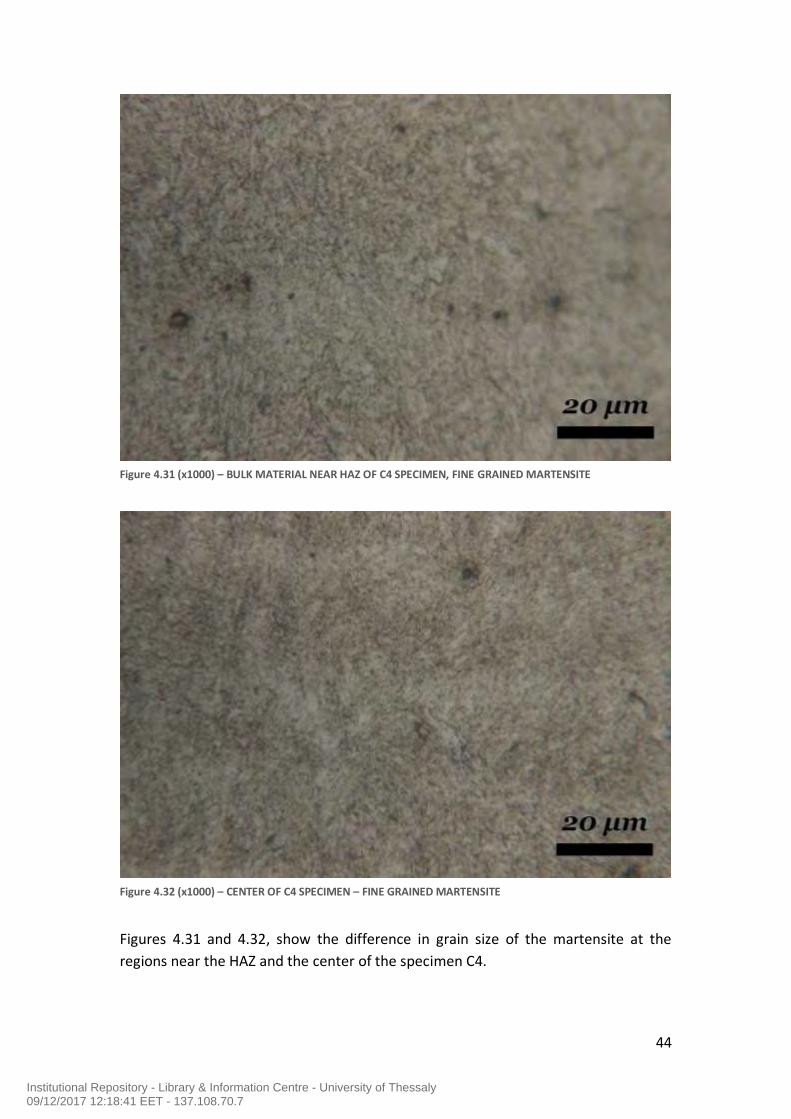
Figures 4.31 and 4.32, show the difference in grain size of the martensite at the
regions near the HAZ and the center of the specimen C4.
Figure 4.32 (x1000) – CENTER OF C4 SPECIMEN – FINE GRAINED MARTENSITE
Figure 4.31 (x1000) – BULK MATERIAL NEAR HAZ OF C4 SPECIMEN, FINE GRAINED MARTENSITE
Institutional Repository - Library & Information Centre - University of Thessaly09/12/2017 12:18:41 EET - 137.108.70.7

45
Figure 4.34 – A2 CUT TO BAINITE 500X
Figure 4.33- A2 HAZ 200x
Institutional Repository - Library & Information Centre - University of Thessaly09/12/2017 12:18:41 EET - 137.108.70.7
46
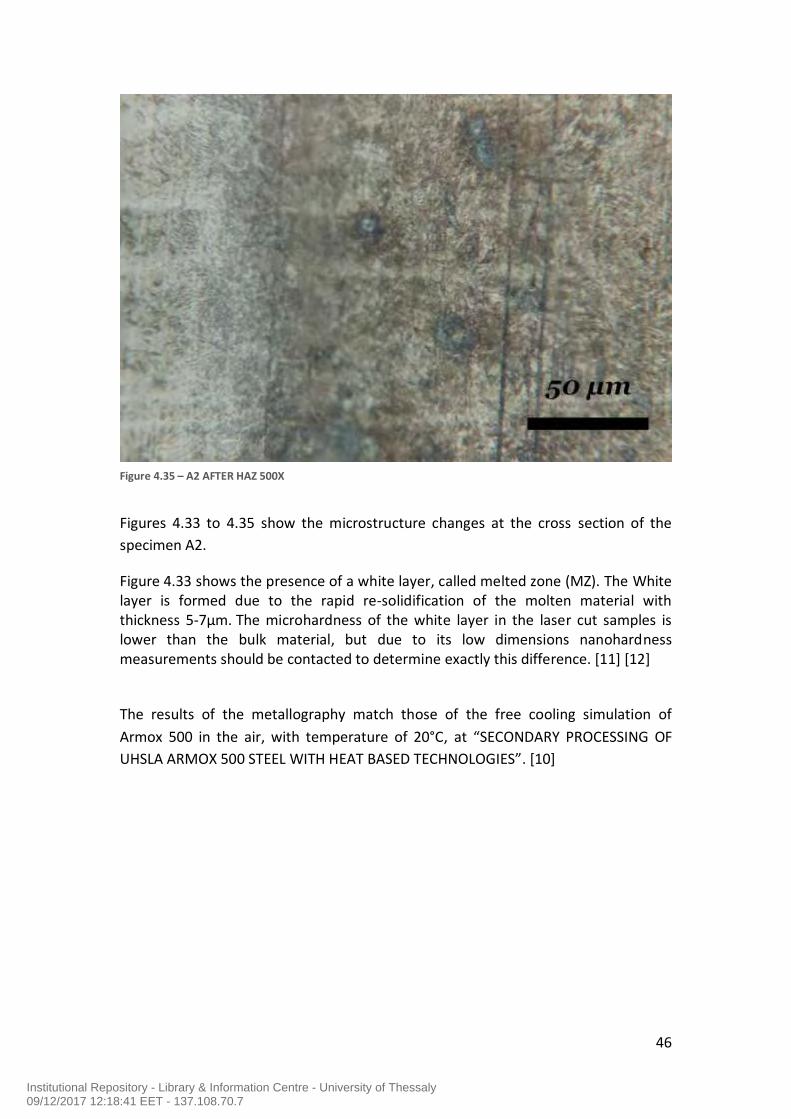
Figures 4.33 to 4.35 show the microstructure changes at the cross section of the
specimen A2.
Figure 4.33 shows the presence of a white layer, called melted zone (MZ). The White layer is formed due to the rapid re-solidification of the molten material with thickness 5-7μm. The microhardness of the white layer in the laser cut samples is lower than the bulk material, but due to its low dimensions nanohardness measurements should be contacted to determine exactly this difference. [11] [12]
The results of the metallography match those of the free cooling simulation of
Armox 500 in the air, with temperature of 20°C, at “SECONDARY PROCESSING OF
UHSLA ARMOX 500 STEEL WITH HEAT BASED TECHNOLOGIES”. [10]
Figure 4.35 – A2 AFTER HAZ 500X
Institutional Repository - Library & Information Centre - University of Thessaly09/12/2017 12:18:41 EET - 137.108.70.7

47
4.3 MICROHARDNESS Graphs 4.8 to 4.13 show the effect of cutting parameters on hardness, at specimens
of the same thickness.
Graph 4.9 - MICROHARDNESS ON THE CROSS SECTION OF GROUP A SPECIMENS, NEAR THE BOTTOM SURFACE
Graph 4.8 - MICROHARDNESS ON THE CROSS SECTION OF GROUP A SPECIMENS, NEAR THE TOP SURFACE
Institutional Repository - Library & Information Centre - University of Thessaly09/12/2017 12:18:41 EET - 137.108.70.7
48
Graph 4.11 - MICROHARDNESS ON THE CROSS SECTION OF GROUP B SPECIMENS, NEAR THE BOTTOM SURFACE
Graph 4.10 - MICROHARDNESS ON THE CROSS SECTION OF GROUP B SPECIMENS, NEAR THE TOP SURFACE
Institutional Repository - Library & Information Centre - University of Thessaly09/12/2017 12:18:41 EET - 137.108.70.7

49
Graph 4.13 - MICROHARDNESS ON THE CROSS SECTION OF GROUP C SPECIMENS, NEAR THE BOTTOM SURFACE
Graph 4.12 - MICROHARDNESS ON THE CROSS SECTION OF GROUP C SPECIMENS, NEAR THE TOP SURFACE
Institutional Repository - Library & Information Centre - University of Thessaly09/12/2017 12:18:41 EET - 137.108.70.7
50
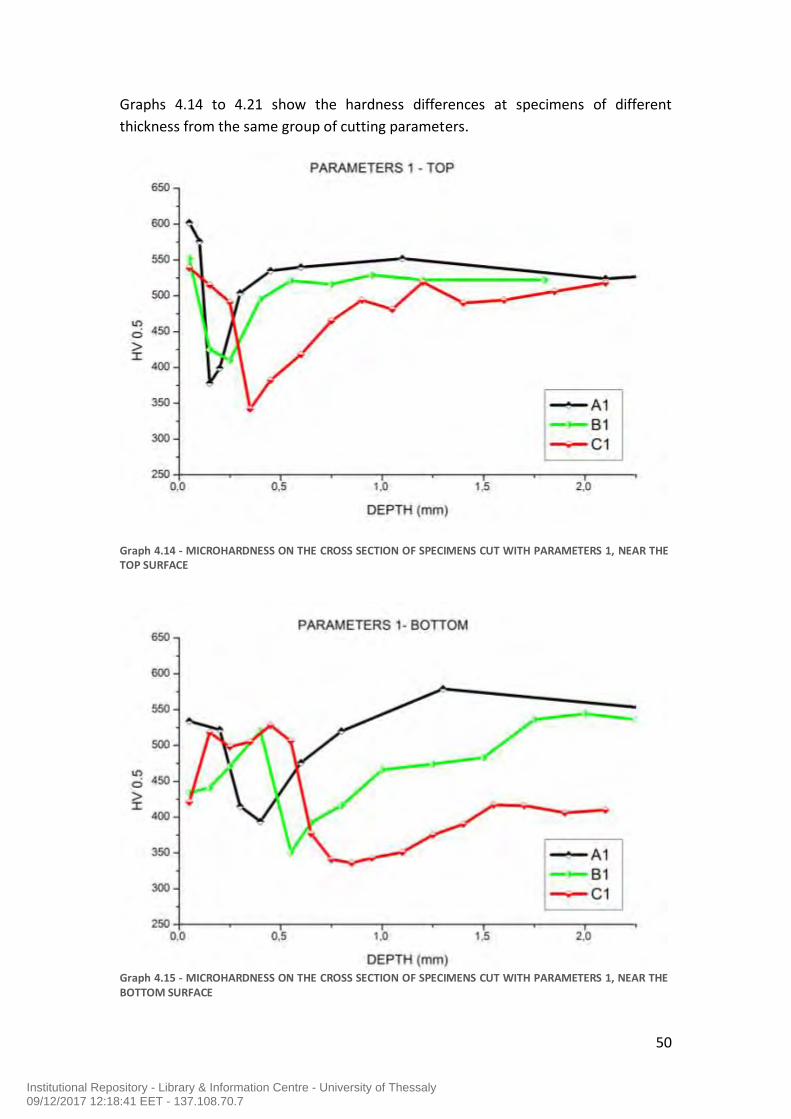
Graphs 4.14 to 4.21 show the hardness differences at specimens of different
thickness from the same group of cutting parameters.
Graph 4.15 - MICROHARDNESS ON THE CROSS SECTION OF SPECIMENS CUT WITH PARAMETERS 1, NEAR THE BOTTOM SURFACE
Graph 4.14 - MICROHARDNESS ON THE CROSS SECTION OF SPECIMENS CUT WITH PARAMETERS 1, NEAR THE TOP SURFACE
Institutional Repository - Library & Information Centre - University of Thessaly09/12/2017 12:18:41 EET - 137.108.70.7

51
Graph 4.17 - MICROHARDNESS ON THE CROSS SECTION OF SPECIMENS CUT WITH PARAMETERS 2, NEAR THE BOTTOM SURFACE
Graph 4.16 - MICROHARDNESS ON THE CROSS SECTION OF SPECIMENS CUT WITH PARAMETERS 2, NEAR THE TOP SURFACE
Institutional Repository - Library & Information Centre - University of Thessaly09/12/2017 12:18:41 EET - 137.108.70.7

52
Graph 4.19 - MICROHARDNESS ON THE CROSS SECTION OF SPECIMENS CUT WITH PARAMETERS 3, NEAR THE BOTTOM SURFACE
Graph 4.18 - MICROHARDNESS ON THE CROSS SECTION OF SPECIMENS CUT WITH PARAMETERS 3, NEAR THE TOP SURFACE
Institutional Repository - Library & Information Centre - University of Thessaly09/12/2017 12:18:41 EET - 137.108.70.7

53
Graph 4.21 - MICROHARDNESS ON THE CROSS SECTION OF SPECIMENS CUT WITH PARAMETERS 4, NEAR THE BOTTOM SURFACE
Graph 4.20 - MICROHARDNESS ON THE CROSS SECTION OF SPECIMENS CUT WITH PARAMETERS 4, NEAR THE TOP SURFACE
Institutional Repository - Library & Information Centre - University of Thessaly09/12/2017 12:18:41 EET - 137.108.70.7

54
Table 4.2 summarizes the critical points of the microhardness measurements. For each specimen the value of minimum hardness and its
position are listed, as well as the depth of the heat affected zone. For each group, the lowest values of hardness and HAZ depth are marked
with red background.
SPECIMEN
unaffected
material
hardness
(HV0,5)
min Hardness
(HV0,5)% degradation
pos.(mm) of
min Hardness
pos.(mm) of
bulk hardness
min Hardness
(HV0,5)% degradation
pos. (mm) of
min Hardness
pos. (mm) of
bulk hardness
A1 378 35,9 0,15 - 394 33,2 0,4 1,25
A2 347 41,2 0,15 2,2 414 29,8 0,25 2,35
A3 469 20,5 0,15 0,45 397 32,7 0,4 1,5
A4 408 30,8 0,2 2,4 420 28,8 0,8 5,25
B1 410 22,6 0,25 0,5 351 33,8 0,55 1,75
B2 381 28,1 0,25 0,65 294 44,5 0,65 -
B3 410 22,6 0,15 0,45 394 25,7 0,55 1,2
B4 352 33,6 0,25 0,8 340 35,8 0,35 2,05
C1 342 34,2 0,35 1,1 336 35,4 0,85 -
C2 355 31,7 0,55 - 268 48,5 3 -
C3 350 32,7 0,35 - 277 46,7 1,2 -
C4 324 37,7 0,35 - 310 40,4 2,15 -
BOTTOM
CRITICAL POINTS
TOP
520 (± 20)
530 (± 20)
590 (± 20)
Table 4.2 – CRITICAL POINTS OF SPECIMENS MICROHARDNESS
Institutional Repository - Library & Information Centre - University of Thessaly09/12/2017 12:18:41 EET - 137.108.70.7

55
5 DISCUSSION
5.1 ROUGHNESS From the roughness measurements it is observed that, comparatively to the first
specimen, reduction in speed leads to rapid increase of roughness both near the top
and bottom surface. The increase is in the range of 250%-520%. (Comparison of 1st
and 2nd specimen of each group)
Also an increase of roughness was observed at the specimens at which the focal
point was moved, but in this case the increase was in the range of 10%-
20%.(Comparison of 1st and 3rd specimen of each group)
Furthermore, the movement of the focal point improves the roughness results, 15%-
20%, at the specimens with the cutting speed reduced. (Comparison of 2nd and 4th
specimen of each group)
At the first specimen of 5mm width (Group A) better roughness is observed near the
top surface. The reduction of cutting speed led to the opposite results, surface with
better roughness near the bottom of the plate. (Comparison of A2, A4 with A1, A3
specimens)
In addition, a completely reversed situation is going on with specimens of 10mm
width (Group B), at which roughness is better near the top surface when the focal
point is moved. (Comparison of B3, B4 with B1, B2 specimens)
For the specimens of 20mm width (Group C), with the reduced cutting speed, the
roughness was so high that measurement was not possible with the available
equipment. Additional photos of these specimens are shown in figures 5.1 and 5.2.
Figure 5.2 – CUT FACE OF SPECIMEN C2 Figure 5.1 – CUT FACE OF SPECIMEN C4
Institutional Repository - Library & Information Centre - University of Thessaly09/12/2017 12:18:41 EET - 137.108.70.7
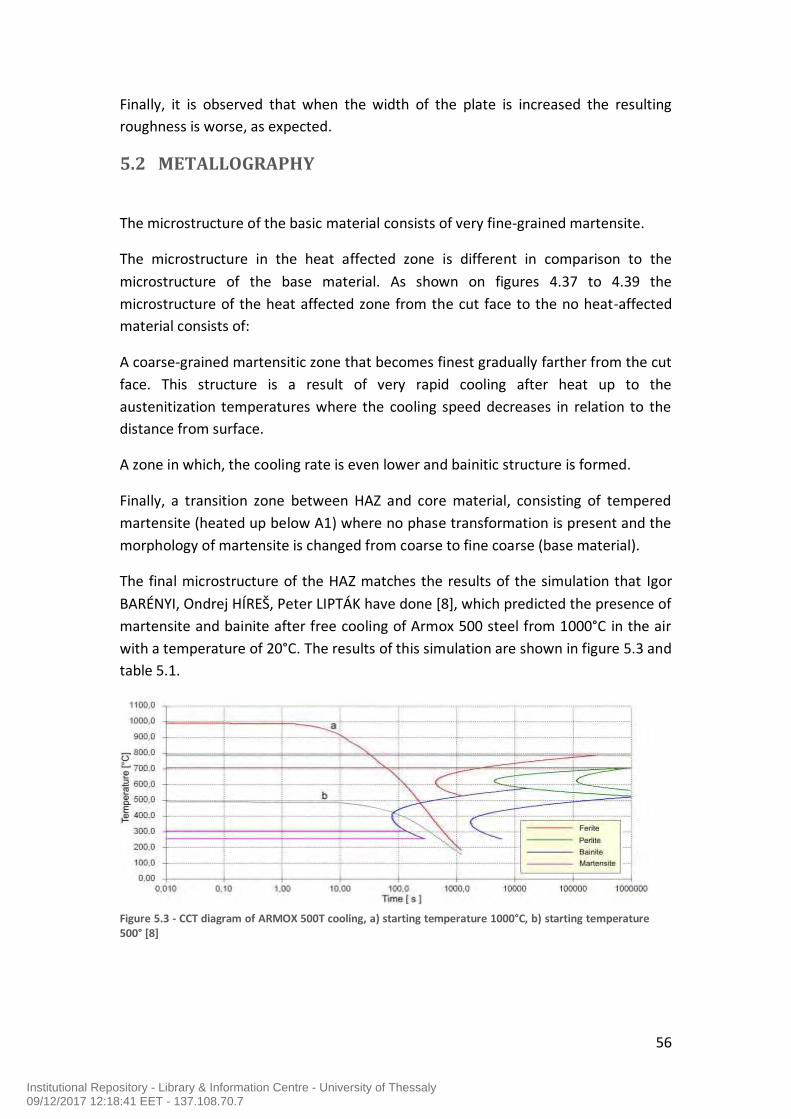
56
Finally, it is observed that when the width of the plate is increased the resulting
roughness is worse, as expected.
5.2 METALLOGRAPHY
The microstructure of the basic material consists of very fine-grained martensite.
The microstructure in the heat affected zone is different in comparison to the
microstructure of the base material. As shown on figures 4.37 to 4.39 the
microstructure of the heat affected zone from the cut face to the no heat-affected
material consists of:
A coarse-grained martensitic zone that becomes finest gradually farther from the cut
face. This structure is a result of very rapid cooling after heat up to the
austenitization temperatures where the cooling speed decreases in relation to the
distance from surface.
A zone in which, the cooling rate is even lower and bainitic structure is formed.
Finally, a transition zone between HAZ and core material, consisting of tempered
martensite (heated up below A1) where no phase transformation is present and the
morphology of martensite is changed from coarse to fine coarse (base material).
The final microstructure of the HAZ matches the results of the simulation that Igor
BARÉNYI, Ondrej HÍREŠ, Peter LIPTÁK have done [8], which predicted the presence of
martensite and bainite after free cooling of Armox 500 steel from 1000°C in the air
with a temperature of 20°C. The results of this simulation are shown in figure 5.3 and
table 5.1.
Figure 5.3 - CCT diagram of ARMOX 500T cooling, a) starting temperature 1000°C, b) starting temperature 500° [8]
Institutional Repository - Library & Information Centre - University of Thessaly09/12/2017 12:18:41 EET - 137.108.70.7
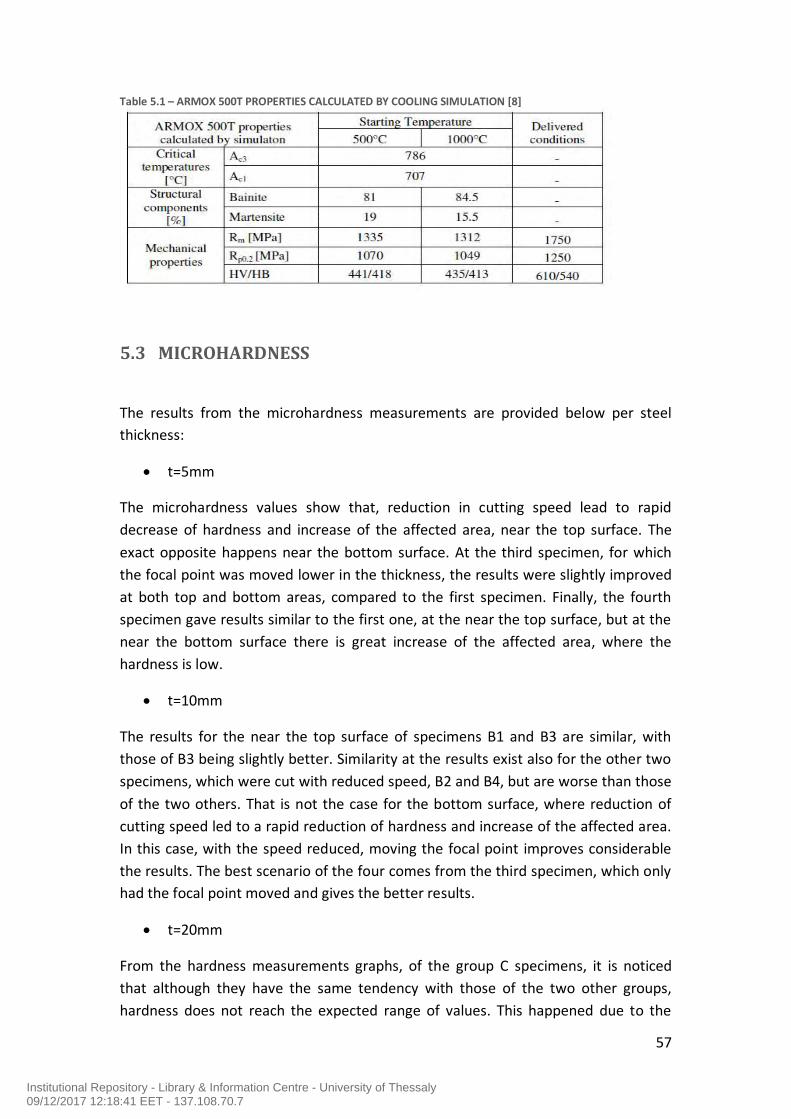
57
5.3 MICROHARDNESS
The results from the microhardness measurements are provided below per steel
thickness:
t=5mm
The microhardness values show that, reduction in cutting speed lead to rapid
decrease of hardness and increase of the affected area, near the top surface. The
exact opposite happens near the bottom surface. At the third specimen, for which
the focal point was moved lower in the thickness, the results were slightly improved
at both top and bottom areas, compared to the first specimen. Finally, the fourth
specimen gave results similar to the first one, at the near the top surface, but at the
near the bottom surface there is great increase of the affected area, where the
hardness is low.
t=10mm
The results for the near the top surface of specimens B1 and B3 are similar, with
those of B3 being slightly better. Similarity at the results exist also for the other two
specimens, which were cut with reduced speed, B2 and B4, but are worse than those
of the two others. That is not the case for the bottom surface, where reduction of
cutting speed led to a rapid reduction of hardness and increase of the affected area.
In this case, with the speed reduced, moving the focal point improves considerable
the results. The best scenario of the four comes from the third specimen, which only
had the focal point moved and gives the better results.
t=20mm
From the hardness measurements graphs, of the group C specimens, it is noticed
that although they have the same tendency with those of the two other groups,
hardness does not reach the expected range of values. This happened due to the
Table 5.1 – ARMOX 500T PROPERTIES CALCULATED BY COOLING SIMULATION [8]
Institutional Repository - Library & Information Centre - University of Thessaly09/12/2017 12:18:41 EET - 137.108.70.7

58
small width to thickness ratio of the cut specimens, which affected the temperature
and cooling rate even at the center of the specimens, enough to affect their
properties. However, some observations can be done. Both at the near the top and
near the bottom surfaces, the first cutting parameters provided the best results. At
the rest of the specimens the only difference is that of the third specimen, having
slightly better results at the near the top surface than the two others.
Moreover, while moving from the cut face to the center of the specimens at the
cross sections, the microhardness starts from a low value, at area of coarse grained
martensite and then raises, at the area of fine grained martensite before it fall again
and reaches its minimum, at the area with bainitic structure. As we move further
from the bainitic structure it raises again in respective to the microstructure
becoming from coarse grained to fine grained martensitic. This can be seen in figures
5.4 and 5.5.
The phenomenon at the near the cut face, may not be clear at the specimens with
relatively small HAZ, where very small area between the cut face and the bainitic
microstructure occurs and not enough microhardness measurements could be done.
Such an example is shown in figure 5.5.
Figure 5.4 (x50) – MICROHARDNESS GRAPH AND MICROSTRUCTURE OF A2 SPECIMEN NEAR THE TOP SURFACE
Institutional Repository - Library & Information Centre - University of Thessaly09/12/2017 12:18:41 EET - 137.108.70.7

59
Finally from table 4.2 it is observed that the degradation of microhardness in the
HAZ varies from 20% to 50% depending on the cutting parameters.
Figure 5.5 (x50) – MICROHARDNESS GRAPH AND MICROSTRUCTURE OF B1 SPECIMEN NEAR THE BOTTOM SURFACE
Institutional Repository - Library & Information Centre - University of Thessaly09/12/2017 12:18:41 EET - 137.108.70.7

60
6 CONCLUSIONS
From the results presented above the following conclusions can be drawn:
The heat input rate affects the roughness of the cutting surface. The higher
heat input rates increase significantly the roughness. The lowest roughness
values (Ra) were determined for each thickness as follows:
t=5mm, HIR=0.09 J/mm, focal point: 0mm
t=10mm, HIR=0.15 J/mm, focal point: +0,5mm
t=20mm, HIR=0.33 J/mm, focal point: +4,5 mm
The minimum width of the HAZ was measured (lower surface):
t=5mm, HIR=0.09 J/mm, focal point: 0mm
t=10mm, HIR=0.15 J/mm, focal point: -3,5mm
t=20mm, microhardness does not reach the expected range of values,
however the best results were found for HIR=0.33 J/mm, focal point: +4,5mm
The minimum microhardness values were determined:
t=5mm, HIR=0.09 J/mm, focal point: 0mm
t=10mm, HIR=0.3 J/mm, focal point: +0,5mm
t=20mm, HIR=0.65 J/mm, focal point: +4,5mm
The HAZ consists of four zones:
A white layer (5-9μm) which was formed due to the rapid re-solidification of
the molten material. The micrhardness of the white layer in the laser cut
samples is lower than the bulk material, but due to its low dimensions
nanohardenss measurements should be contacted to determine exactly this
difference.
A coarse-grained martensitic zone that becomes finest gradually farther from
the cut face. This structure is a result of very rapid cooling after heat up to
Institutional Repository - Library & Information Centre - University of Thessaly09/12/2017 12:18:41 EET - 137.108.70.7

61
the austenitization temperatures where the cooling rate decreases in relation
to the distance from surface.
A zone in which, the cooling rate is even lower and bainitic structure was
formed.
Finally, a transition zone between HAZ and core material, consists of
tempered martensite (heated up below A1). The morphology of martensite
is changed from coarse to fine coarse (base material).
The results are in good agreement with the literature. Based on the above results
the optimum laser cutting conditions are:
t=5mm, HIR=0.09 J/mm, focal point: -2mm
t=10mm, HIR=0.15 J/mm, focal point: -3,5mm
t=20mm, HIR=0.33 J/mm, focal point: +4,5mm
Institutional Repository - Library & Information Centre - University of Thessaly09/12/2017 12:18:41 EET - 137.108.70.7
62
REFERENCES [1] MAHMOUD Y. DEMERI, ADVANCED HIGH-STRENGTH STEELS: SCIENCE,
TECHNOLOGY, AND APPLICATIONS
[2] HAO QU, ADVANCED HIGH STRENGTH STEEL THROUGH PARAEQUILIBRIUM
CARBON PARTITIONING AND AUSTENITE STABILIZATION, DEPARTMENT OF
MATERIALS SCIENCE AND ENGINEERING CASE WESTERN RESERVE UNIVERSITY,
JANUARY 2011
[3] PRADIPTA KUMAR JENA∗, PONGURU SENTHIL P., SIVA KUMAR K., EFFECT OF
TEMPERING TIME ON THE BALLISTIC PERFORMANCE OF A HIGH STRENGTH ARMOUR
STEEL, AVAILABLE ONLINE AT www.sciencedirect.com, JOURNAL OF APPLIED
RESEARCH AND TECHNOLOGY, 14 (2016) 47–53
[4] IGOR BARÉNYI MICROSTRUCTURE CHANGES IN CUT FACE OBTAINED BY PLASMA
AND LASER CUTTING OF SELECTED HIGH STRENGTH STEELS, U.P.B. SCI. BULL., SERIES
D, VOL. 78, ISS. 1, 2016 ISSN 1454-2358
[5] ESAB KNOWLEDGE CENTER
http://www.esabna.com/us/en/education/blog/index.cfm
[6] M. PIRINENA, YU. MARTIKAINENA, S.YU. IVANOVB AND V.A. KARKHINB,
COMPARATIVE ANALYSIS OF THE MICROSTRUCTURE OF THE HEAT-AFFECTED ZONE
METAL IN WELDING OF HIGH-STRENGTH STEELS, ISSN: 0950-7116 (PRINT) 1754-2138
(ONLINE) JOURNAL HOMEPAGE: http://www.tandfonline.com/loi/twld20
[7] IGOR BARÉNYI, DEGRADATION OF MECHANICAL PROPERTIES OF SELECTED UHSS
STEELS IN HAZ AFTER THEIR WELDING, UNIVERSITY REVIEW, VOL. 8, 2014, NO. 3-4, P.
99-103 99
[8] IGOR BARÉNYI, ONDREJ HÍREŠ, PETER LIPTÁK, CHANGES IN MECHANICAL
PROPERTIES OF ARMOURED UHSLA STEEL ARMOX 500 AFTER OVER TEMPERING,
ISSN 2081-5891 4, 4 (14), 2013, 7-14
[9] SIMULATION OF ARMOX STEELS MECHANICAL PROPERTIES DEGRADATION IN
HAZ AFTER SELECTED THERMAL CUTTING PROCESSES, IGOR BARÉNYI, UNIVERSITY
REVIEW, VOL. 8, 2014, NO. 3-4, P. 18-22
[10] SECONDARY PROCESSING OF UHSLA ARMOX 500 STEEL WITH HEAT BASED
TECHNOLOGIES, IGOR BARÉNYI
[11] IMED MIRAOUI, MOHAMED BOUJELBENE, AND MOUNA ZAIED, ADVANCES IN
MATERIALS SCIENCE AND ENGINEERING, VOLUME 2016 (2016), HIGH-POWER LASER
CUTTING OF STEEL PLATES: HEAT AFFECTED ZONE ANALYSIS
Institutional Repository - Library & Information Centre - University of Thessaly09/12/2017 12:18:41 EET - 137.108.70.7

63
[12] C.H. FUA , J.F. LIUA , Y.B. GUOA *, Q.Z. ZHAO, A COMPARATIVE STUDY ON
WHITE LAYER PROPERTIES BY LASER CUTTING VS. ELECTRICAL DISCHARGE
MACHINING OF NITINOL SHAPE MEMORY ALLOY, PROCEDIA CIRP 42 ( 2016 ) 246 –
251]
Institutional Repository - Library & Information Centre - University of Thessaly09/12/2017 12:18:41 EET - 137.108.70.7


