University of Strathclyde Mechanical Engineering …s3.amazonaws.com/zanran_storage/... · 2.2.3...
218
Page 1 of 218 University of Strathclyde Mechanical Engineering Department Renewable Hydrogen Energy System For Household Applications Thesis Submitted for the MSc degree Energy Systems & The Environment Student: Asterios Bouzoukas Supervisor: Dr S.Jovanovic Date: 08 September 2003
Transcript of University of Strathclyde Mechanical Engineering …s3.amazonaws.com/zanran_storage/... · 2.2.3...
Page 1 of 218
University of Strathclyde
Mechanical Engineering Department
Renewable Hydrogen Energy System
For Household Applications
Thesis Submitted for the MSc degree
Energy Systems & The Environment
Student: Asterios Bouzoukas
Supervisor: Dr S.Jovanovic
Date: 08 September 2003

Page 2 of 218
The copyright of this thesis belongs to the author under the terms of the United
Kingdom copyright acts as qualified by the University of Strathclyde Regulation 3.49.
Due acknowledgement must always be made of the use of any material contained
in or derived from this thesis.

Page 3 of 218
Acknowledgements
The following people have helped me throughout the completion of this thesis and
of the MSc course and I would like to express my gratitude to them.
My supervisor, Dr Slobodan Jovanovich, for his insight, help, patience and support
during the research and writing of the thesis.
I also wish to express my thanks to all the lecturer and staff of the Engineering
Department for helping throughout this one-year MSc course.
Last but not least, thanks to all my colleagues of the MSc in Energy Systems and
the Environment for a wonderful working atmosphere, without you all the work
would not have been such a fun.
Finally I want to thank my parents and my fiancee for their absolute faith in me.
Page 4 of 218
Abstract
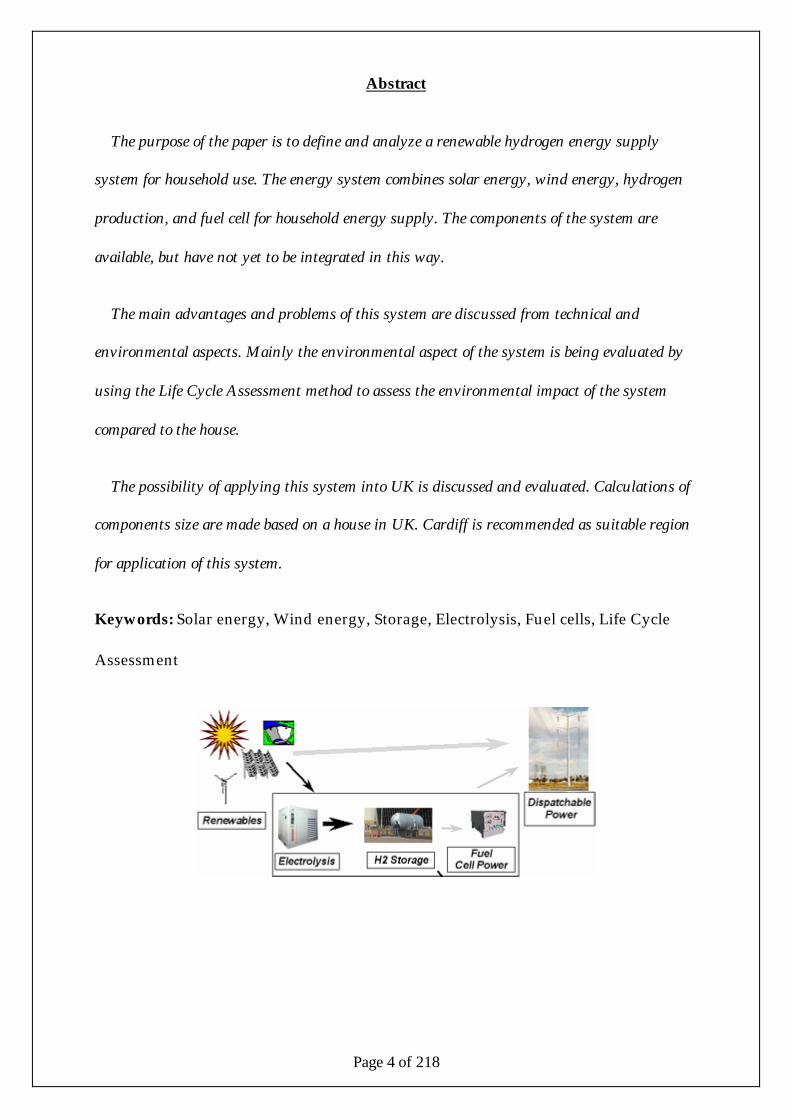
The purpose of the paper is to define and analyze a renewable hydrogen energy supply
system for household use. The energy system combines solar energy, wind energy, hydrogen
production, and fuel cell for household energy supply. The components of the system are
available, but have not yet to be integrated in this way.
The main advantages and problems of this system are discussed from technical and
environmental aspects. Mainly the environmental aspect of the system is being evaluated by
using the Life Cycle Assessment method to assess the environmental impact of the system
compared to the house.
The possibility of applying this system into UK is discussed and evaluated. Calculations of
components size are made based on a house in UK. Cardiff is recommended as suitable region
for application of this system.
Keywords: Solar energy, Wind energy, Storage, Electrolysis, Fuel cells, Life Cycle
Assessment
Page 5 of 218
Table of Contents
0.1 Title 1
0.2 Copyright 2
0.3 Acknowledgements 3
0.4 Abstract 4
0.5 Table of Contents 5
0.6 Figures – Tables 10
CHAPTER 1
1.1 Introduction 20
1.2 Project Aims 26
CHAPTER 2
2.1 Solar Photovoltaic Power 28
2.1.1 Solar Thermal Panels 28
2.1.2 Solar Electric Panels 29
2.1.3 How Photovoltaic Panels are Used 29
2.1.4 Types of PV Cell 30
2.1.5 Types of PV System 32
2.1.6 Types of Panels and their Use 33
2.1.7 Benefits of Solar Energy 34
2.1.8 How Photovoltaic Panels Work 35
2.1.9 PV Systems with Batteries 37
2.1.10 PV Advantages 38
2.2 Wind Turbines for Home Power 40
2.2.1 Wind Turbine Basics 40
2.2.2 How Wind Turbines are Used 40

Page 6 of 218
2.2.3 Types of Wind Generators 43
2.2.4 Small Wind Turbines 43
2.2.5 Benefits of Wind Energy 45
2.3 Hydrogen Production – Storage 47
2.3.1 Hydrogen Production 47
2.3.2 Where does the Hydrogen come from? 50
2.3.3 Hydrogen Storage 52
2.3.4 Choice of Storage 54
2.3.5 Environmental Considerations 59
2.4 Home Power Hydrogen Fuel Cell 62
2.4.1 What is a Fuel Cell? 62
2.4.2 How Fuel Cells Work? 63
2.4.3 Types of Fuel Cell 65
2.4.4 Application for Fuel Cells 67
2.4.5 Fuel Cell Engineering Benefits 69
2.4.6 Advantages and Uses of Fuel Cell 71
2.4.7 Fuel Cell Vs Traditional Batteries 71
2.5 Basic Battery Information 73
2.5.1 Battery Capacity 73
2.5.2 Types of Batteries 74
2.5.3 Nickel Alloy Batteries 76
2.5.4 How Batteries are used in Home Power 77
2.5.5 Basic Lead Acid Battery Function 77
2.5.6 Battery Charging and Maintenance 79
Page 7 of 218
CHAPTER 3
3.1 House Energy Consumption 80
3.2 House Analysis 81
3.3 Heat Losses 83
3.4 Calculation of Heat Losses 85
3.5 Fabric Heat Loss 85
3.6 Ventilation Heat Loss 87
3.7 Appliances Consumption 91
3.8 Total Energy Consumption 93
CHAPTER 4
4.1 Site Analysis 95
4.1.1 Solar Site Analysis 95
4.1.2 Wind Site Analysis 96
4.1.3 What to do with the Data? 97
4.2 Wind + PV + Batteries Size Analysis 98
4.2.1 Solar Size Analysis 98
4.2.2 Wind Size Analysis 100
4.2.3 Wind + PV 103
4.2.4 Batteries Size Analysis 104
4.3 Matching Demand and Supply 106
4.3.1 Winter Period 106
4.3.2 Summer Period 109
4.4 Wind + PV + Electrolyser – Fuel Cell Size Analysis 112
4.4.1 Solar Size Analysis 112
4.4.2 Wind Size Analysis 114
Page 8 of 218
4.4.3 Wind + PV 116
4.4.4 Hydrogen Production and Storage Size Analysis 116
4.4.5 Fuel Cell Size Analysis 118
4.5 Matching Demand and Supply 119
4.5.1 Winter Period 119
4.5.2 Summer Period 122
4.6 How the Renewable System works with Batteries and with Fuel Cell 126
4.6.1 With Batteries 126
4.6.2 With Fuel Cell 128
CHAPTER 5
5.1 Life Cycle Stages for Renewable Energy Technologies 130
5.2 Wind Turbines 132
5.3 PV 135
5.4 Fuel Cell 136
5.5 Introduction to Life Cycle Analysis 139
5.6 What is LCA? 139
5.7 Impact Factors 143
5.8 LCA in the House 144
5.9 LCA in the PV 154
5.10 LCA in the Wind Turbine 163
5.11 LCA in the Batteries 169
5.12 LCA in the Electrolyser/Fuel Cell 176
5.13 LCA of the Total House and Renewable System 182
5.14 What are the Benefits of Conducting an LCA? 194
5.15 Limitations of Conducting an LCA 195

Page 9 of 218
5.16 What are the Challenges? 196
CHAPTER 6
6.1 Discussion 197
6.2 Conclusion 204
6.3 Recommendations for Future Work 206
0.7 References 207
0.8 Appendices 213
Page 10 of 218
CHAPTER 1
Figures
Figure 1.1: World Primary Energy Breakdown 20
Figure 1.2: Energy Consumption by Sector 22
Figure 1.3: Energy Breakdown in Houses 22
Figure 1.4: World Energy Generation 25
Tables
CHAPTER 2
Figures
Figure 2.1: Typical PV System 30
Figure 2.2: Residential Grid – Connected PV System 32
Figure 2.3: A Hybrid Wind – PV System 33
Figure 2.4: A Grid – Connected Wind Turbine 44
Figure 2.5: Wind Turbine Components 45
Figure 2.6: Renewable Hydrogen Energy System 51
Figure 2.7: Hydrogen Production, Transport, Storage and Utilization 61
Figure 2.8: A Hydrogen Fuel Cell System 63
Figure 2.9: Basic Hydrogen Fuel Cell System 64
Figure 2.10: Types of Fuel Cells 66
Figure 2.11: A Fuel Cell Power Plant 68
Figure 2.12: How a Fuel Cell Works 69
Tables
Table 2.1: Advantages of Fuel Cells Vs. Batteries 72
CHAPTER 3
Figures
Page 11 of 218
Figure 3.1: Chosen Place for Calculations 80
Figure 3.2: Diagram of the House 82
Figure 3.3: Annual Energy Consumption 94
Tables
Table 3.1: House Breakdown 81
Table 3.2: Heat Losses from Kitchen 87
Table 3.3: Heat Losses from the House 87
Table 3.4: Heat Losses from the House 88
Table 3.5: Total Losses from the House 89
Table 3.6: Daily and Monthly Energy Consumption from the House 89
Table 3.7: Total Household Consumption 92
Table 3.8: Heating and Appliance Consumption in a Year 93
CHAPTER 4
Figures
Figure 4.1: Energy Gain from PV per month 100
Figure 4.2: Wind Speed Vs Days 101
Figure 4.3: Wind Speed Vs Power Rated 102
Figure 4.4: Energy Gain from Wind per month 103
Figure 4.5: Number of Batteries Needed 105
Figure 4.6: A Typical Wind, PV, Battery System 105
Figure 4.7: Power Consumption for a Day 106
Figure 4.8: Power Demand for 2 Days in Winter 106
Figure 4.9: Wind Power in 2 Winter Days 107
Figure 4.10: PV Power in 2 Winter Days 107
Figure 4.11: Match Demand and Supply in 2 Winter Days 108
Page 12 of 218
Figure 4.12: Match Demand and Supply in 2 Winter Days 108
Figure 4.13: Power Demand for Summer 109
Figure 4.14: Power Demand for 2 Summer Days 109
Figure 4.15: Wind Power for 2 Summer Days 110
Figure 4.16: PV Power for 2 Summer Days 110
Figure 4.17: Match Demand and Supply for 2 Summer Days 111
Figure 4.18: Match Demand and Supply for 2 Summer Days 111
Figure 4.19: Energy Gain from PV per month 113
Figure 4.20: Wind Speed Vs Days 114
Figure 4.21: Wind Speed Vs Power Rated 115
Figure 4.22: Energy Gain from Wind per month 115
Figure 4.23: Hydrogen Production per month in m3 116
Figure 4.24: A Renewable Hydrogen Energy System 117
Figure 4.25: Energy Production from Fuel Cell 118
Figure 4.26: How a Renewable System Works with a Fuel Cell 119
Figure 4.27: Power Consumption for 1 Day 119
Figure 4.28: Power Demand for 2 Winter Days 120
Figure 4.29: Wind Power in 2 Winter Days 120
Figure 4.30: PV Power in 2 Winter Days 121
Figure 4.31: Match Demand and Supply for 2 Winter Days 121
Figure 4.32: Match Demand and Supply for 2 Winter Days 122
Figure 4.33: Power Demand for 1 Summer Day 122
Figure 4.34: Power Demand for 2 Summer Days 123
Figure 4.35: Wind Power in 2 Summer Days 123
Figure 4.36: PV Power in 2 Summer Days 123
Page 13 of 218
Figure 4.37: Match Demand and Supply for 2 Summer Days 124
Figure 4.38: Match Demand and Supply for 2 Summer Days 125
Figure 4.39: A Wind, PV, Battery System 126
Figure 4.40: A Wind, PV, Battery System 127
Figure 4.41: A Wind, PV, Fuel Cell System 128
Tables
Table 4.1: Monthly Energy Generation from PV 99
Table 4.2: Monthly Energy Generation from PV 112
CHAPTER 5
Figures
Figure 5.1: Comparison of the Environmental Impact of Renewable 138
Technologies with the Conventional
Figure 5.2: Life Cycle Stages 140
Figure 5.3: Life Cycle Stages 141
Figure 5.4: Phases of an LCA 143
Figure 5.5: Environmental Life Cycle of the Building 144
Figure 5.6: System Boundaries for the Building 146
Figure 5.7: NRE Impact for each phase 152
Figure 5.8: GWP Impact for each phase 152
Figure 5.9: AP Impact for each phase 153
Figure 5.10: POCP Impact for each phase 153
Figure 5.11: Percentage Allocation of the House Emissions 154
Figure 5.12: GWP Impact for each phase 162
Figure 5.13: Percentage Allocation of PV Emissions 162
Figure 5.14: GWP Impacts for each phase 168
Page 14 of 218
Figure 5.15: Percentage Allocation of Wind Turbine Emissions 169
Figure 5.16: GWP Impact for each phase 175
Figure 5.17: Percentage Allocation of Batteries Emissions 176
Figure 5.18: GWP Impact for each phase 181
Figure 5.19: Percentage Allocation of EL/FC Emissions 182
Figure 5.20: GWP Impact of House Vs House + Renewable System with 185
EL/FC
Figure 5.21: GWP Impact of House Vs House + Renewable System with 185
Batteries
Figure 5.22: GWP Impact of House+RE+EL/FC Vs House+RE+Batteries 186
Figure 5.23: RES with EL/FC Vs RES with Batteries 186
Figure 5.24: GWP Impact of EL/FC Vs Batteries 187
Figure 5.25: Wind Vs PV Vs EL/FC Vs Renewable System 187
Figure 5.26: Wind Vs PV Vs Batteries Vs Renewable System 188
Figure 5.27: Wind Vs PV Vs EL/FC Vs Batteries 188
Figure 5.28: Percentage of House Environmental Impact from each phase189
Figure 5.29: Percentage of House + Renewable System Environmental 190
Impact from each phase
Figure 5.30: Percentage of Renewable System Environmental Impact of Pre-Use
Phase 190
Figure 5.31: Percentage of Renewable System Environmental Impact of Use Phase
191
Figure 5.32: Percentage of Renewable System Environmental Impact of
Elimination Phase 191
Page 15 of 218
Figure 5.33: Percentage of Renewable System Environmental Impact of Pre-Use
Phase 192
Figure 5.34: Percentage of Renewable System Environmental Impact of Use Phase
193
Figure 5.35: Percentage of Renewable System Environmental Impact of
Elimination Phase 193
Tables
Table 5.1: House Characteristics 144
Table 5.2: Calculation of Bricks Mass 145
Table 5.3: Impact of producing 1kg of Brick 147
Table 5.4: Impact of producing 2082 kg of Brick 147
Table 5.5: Impact of the House 147
Table 5.6: Impact of transport 1 tkm of Brick 148
Table 5.7: Impact of transport 312.3 tkm kg of Brick 148
Table 5.8: Impact of transport the materials of the House 148
Table 5.9: Impact from Electricity Usage of 1MJ 148
Table 5.10: Impact from 20 years Electricity Usage 149
Table 5.11: Impact of transport 1 tkm of Brick 149
Table 5.12: Impact of transport 312.3 tkm of Brick 149
Table 5.13: Impact of transport the materials of the House 149
Table 5.14: Impact of 1 kg of Brick in the landfill 150
Table 5.15: Impact of 2082 kg of Brick in the landfill 150
Table 5.16: Impact of the House in the landfill 150
Table 5.17: Impact from all Life Cycle Stages for the House 150
Table 5.18: Impact from the three phases for the House 151

Page 16 of 218
Table 5.19: General Characteristics of the PV 154
Table 5.20: Total Mass of the Silicon in the PV 155
Table 5.21: Impact from 1 kg of Silicon 155
Table 5.22: Impact from 396 kg of Silicon 155
Table 5.23: Impact from all the PV 155
Table 5.24: Impact of transport 1 tkm of Silicon 156
Table 5.25: Impact of transport 396 tkm of Silicon 156
Table 5.26: Impact of transport for all the PV 156
Table 5.27: Impact from Electricity Usage of 1MJ 158
Table 5.28: Impact from 20 years of Electricity Usage 159
Table 5.29: Impact of transport 1 tkm of Silicon 159
Table 5.30: Impact of transport 79.2 tkm of Silicon 159
Table 5.31: Impact of transport all the PV 159
Table 5.32: Impact of 1 kg Silicon in the landfill 160
Table 5.33: Impact of 396 kg of Silicon in the landfill 160
Table 5.34: Impact of the PV in the landfill 160
Table 5.35: Impact from all Life Cycle Stages for the PV 161
Table 5.36: Impact from the three phases for PV 161
Table 5.37: General Characteristics of Wind Turbine 163
Table 5.38: Impact from 1 kg of Copper 163
Table 5.39: Impact from 49.5 kg of Copper 163
Table 5.40: Impact from the whole Wind turbine 163
Table 5.41: Impact from transport 1 tkm of Copper 164
Table 5.42: Impact from transport 99 tkm of Copper 164
Table 5.43: Impact from the whole Wind turbine 164
Page 17 of 218
Table 5.44: Impact from the Electricity Usage of 1 MJ 165
Table 5.45: Impact for 20 years from the Electricity Usage 166
Table 5.46: Impact from transport 1 tkm of Copper 166
Table 5.47: Impact from transport 9.9 tkm of Copper 166
Table 5.48: Impact from transport the whole Wind turbine 166
Table 5.49: Impact from 1 kg of Copper in the landfill 167
Table 5.50: Impact from 49.5 kg of Copper in the landfill 167
Table 5.51: Impact from the whole Wind turbine in the landfill 167
Table 5.52: Impact from all Life Cycle Stages for the Wind Turbine 167
Table 5.53: Impact from the three phases for the Wind Turbine 168
Table 5.54: General Characteristics of the Batteries 169
Table 5.55: Total Mass of the Polyethylene for the Batteries 170
Table 5.56: Impact from 1 kg of Polyethylene 170
Table 5.57: Impact from 712.8 kg of Polyethylene 170
Table 5.58: Impact from the all Batteries 170
Table 5.59: Impact from transport 1 tkm of Polyethylene 170
Table 5.60: Impact from transport 570.24 tkm of Polyethylene 171
Table 5.61: Impact of transport all the batteries 171
Table 5.62: Impact from Electricity Usage of 1 MJ 172
Table 5.63: Impact from 20 years of Electricity Usage 172
Table 5.64: Impact from transport 1 tkm of Polyethylene 172
Table 5.65: Impact from transport 142.56 tkm of Polyethylene 173
Table 5.66: Impact of transport for all Batteries 173
Table 5.67: Impact from 1 kg of Polyethylene in the landfill 173
Table 5.68: Impact from 712.8 kg of Polyethylene in the landfill 173
Page 18 of 218
Table 5.69: Impact from all the Batteries in the landfill 174
Table 5.70: Impact from all the Life Cycle Stages of the Batteries 174
Table 5.71: Impact from the three phases for the Batteries 174
Table 5.72: General Characteristics of the EL/FC 176
Table 5.73: Impact from 1 kg of Platinum 176
Table 5.74: Impact from 170.5 kg of Platinum 177
Table 5.75: Impact from all the EL/FC System 177
Table 5.76: Impact from transport 1 tkm of Platinum 177
Table 5.77: Impact from transport 255.75 tkm of Platinum 177
Table 5.78: Impact of transport all the EL/FC System 178
Table 5.79: Impact from Electricity Usage of 1 MJ 178
Table 5.80: Impact from 20 Years Electricity Usage 178
Table 5.81: Impact for transport 1 tkm of Platinum 179
Table 5.82: Impact for transport 34.1 tkm of Platinum 179
Table 5.83: Impact for transport all the EL/FC System 179
Table 5.84: Impact of 1 kg Platinum in the landfill 179
Table 5.85: Impact of 170.5 kg Platinum in the landfill 180
Table 5.86: Impact of all the EL/FC System 180
Table 5.87: Impact of all the Life Cycle Stages for the EL/FC System 180
Table 5.88: Impact of the three phases for the EL/FC System 181
Table 5.89: All the results for each phase 182
CHAPTER 6
Figures
Figure 6.1: Growth In Global Key Indicators Rebased To 1970 197
Figure 6.2: World Primary Energy Mix 198
Page 19 of 218
Figure 6.3: Growth Rates Of Energy Sources 199
Figure 6.4: OECD Electricity Mix 199
Figure 6.5: Renewables Could Meet Energy Needs 200
Figure 6.6: Growth Rate Of Renewable Energy Sources 201
Figure 6.7: Renewable Energy Sources Forecast 202
Figure 6.8: Production And Use Of Hydrogen 203
Figure 6.9: A Renewable Hydrogen Energy System 204
Figure 6.10: The Life Cycle Stage 205
Figure 6.11: Wind, PV, Hydrogen, Fuel Cell Power for a Remote 206
Community
Tables
Appendices
Figures
Figure 0.7.1: Comparison of Life Cycle Carbon Dioxide Emissions from
Renewables and Fossil Fuel Generation 213
Figure 0.7.2: Comparison of Life Cycle Sulphur Dioxide Emissions from
Renewables and Fossil Fuel Generation 213
Figure 0.7.3: Comparison of Life Cycle Nitrogen Oxides Emissions from
Renewables and Fossil Fuel Generation 214
Tables
Table 0.7.1: Summary of Potential Environmental Burdens for PV 214
Table 0.7.2: Systems Summary of Potential Environmental Burdens for 216 Wind
Page 20 of 218
CHAPTER 1
INTRODUCTION
At present, the large scale use of fossil fuels is a dominant feature of industrial
societies. It is regarded as essential for the growing, distribution and preparation of
foods, for construction, manufacturing, communication and organisation, and many
other activities.
As we have seen, modern societies, and particularly industrial societies, are now
totally dependent upon the use of large quantities of energy, most of it in the form of
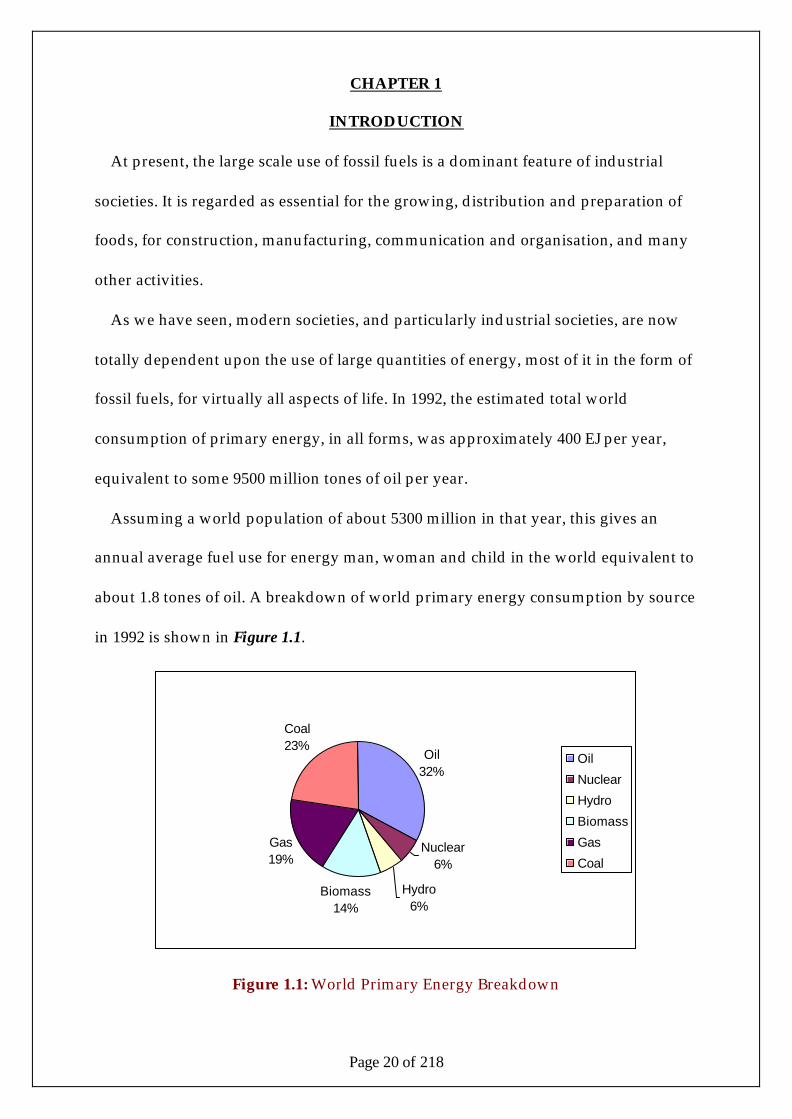
fossil fuels, for virtually all aspects of life. In 1992, the estimated total world
consumption of primary energy, in all forms, was approximately 400 EJ per year,
equivalent to some 9500 million tones of oil per year.
Assuming a world population of about 5300 million in that year, this gives an
annual average fuel use for energy man, woman and child in the world equivalent to
about 1.8 tones of oil. A breakdown of world primary energy consumption by source
in 1992 is shown in Figure 1.1.
Oil32%
Nuclear6%
Hydro6%
Biomass14%
Gas19%
Coal23%
Oil
Nuclear
Hydro
Biomass
Gas
Coal
Figure 1.1: World Primary Energy Breakdown
Page 21 of 218
Oil is the dominant fuel, contributing some 32%, followed by coal at 23%. Coal was
once the dominant world fuel, but is now losing ground rapidly to oil and gas, which
has a 19% share. Hydroelectricity and nuclear are used much less, at around 6% each.
The estimated share of traditional non-commercial fuels such as biomass is around
14%.
To understand how best to make use of renewable sources, and also to understand
fully the problems caused by the present use of fuels, we must take a closer look at
the way energy is currently used in industrial societies.
To make some sense of the great variety of energy use, it is necessary to categorise
it. In most official statistics human activity is divided into four main sectors:
• The transport sector (which includes road, rail, air and water transport, both
public and private, and both goods and passengers)
• The domestic sector (private households)
• The commercial and institutional sector (which includes government buildings,
commercial offices, education, health, shops, restaurants, commercial
warehouses, plus pubs, clubs, entertainment, religious buildings, and
miscellaneous other energy users)
• The industrial sector (which includes manufacturing, iron and steel, food and
drink, chemicals, buildings, agriculture)
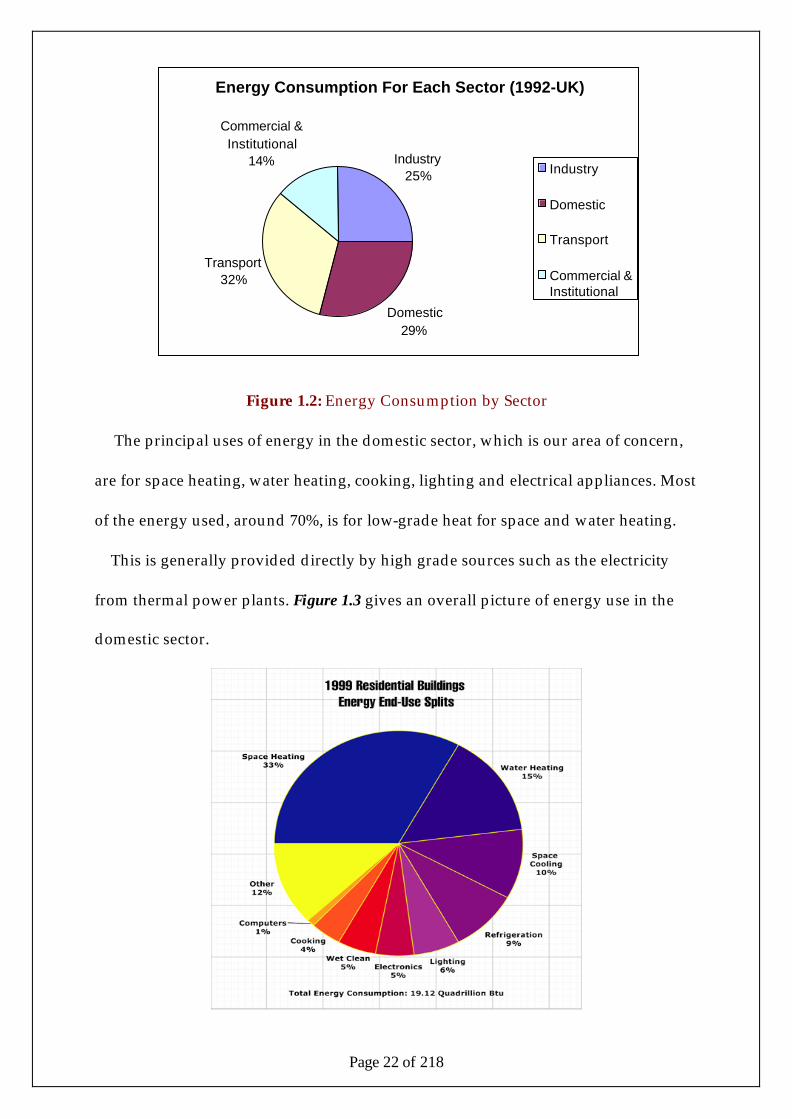
The first question to consider is how much energy is used by each sector. The
domestic sector comprises the second most important energy consumer as we can see
from the Figure 1.2.
Page 22 of 218
Figure 1.2: Energy Consumption by Sector
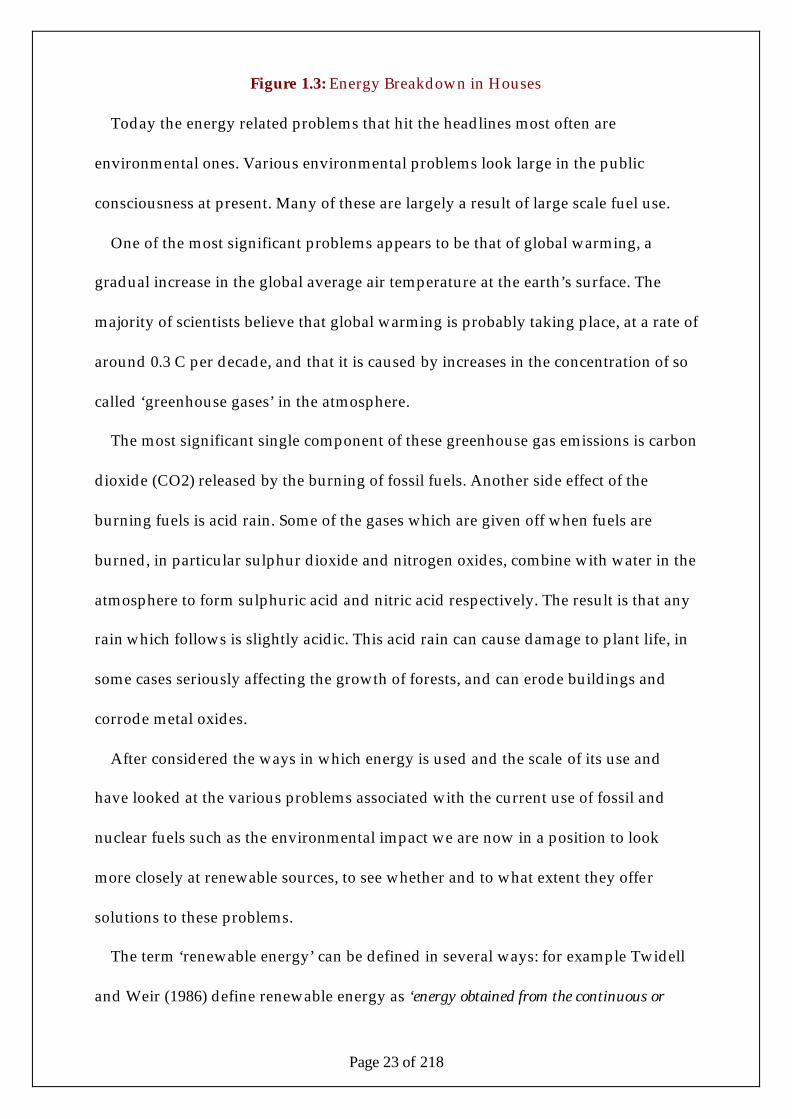
The principal uses of energy in the domestic sector, which is our area of concern,
are for space heating, water heating, cooking, lighting and electrical appliances. Most
of the energy used, around 70%, is for low-grade heat for space and water heating.
This is generally provided directly by high grade sources such as the electricity
from thermal power plants. Figure 1.3 gives an overall picture of energy use in the
domestic sector.
Energy Consumption For Each Sector (1992-UK)
Industry25%
Domestic29%
Transport32%
Commercial & Institutional
14% Industry
Domestic
Transport
Commercial &Institutional
Page 23 of 218
Figure 1.3: Energy Breakdown in Houses
Today the energy related problems that hit the headlines most often are
environmental ones. Various environmental problems look large in the public
consciousness at present. Many of these are largely a result of large scale fuel use.
One of the most significant problems appears to be that of global warming, a
gradual increase in the global average air temperature at the earth’s surface. The
majority of scientists believe that global warming is probably taking place, at a rate of
around 0.3 C per decade, and that it is caused by increases in the concentration of so
called ‘greenhouse gases’ in the atmosphere.
The most significant single component of these greenhouse gas emissions is carbon
dioxide (CO2) released by the burning of fossil fuels. Another side effect of the
burning fuels is acid rain. Some of the gases which are given off when fuels are
burned, in particular sulphur dioxide and nitrogen oxides, combine with water in the
atmosphere to form sulphuric acid and nitric acid respectively. The result is that any
rain which follows is slightly acidic. This acid rain can cause damage to plant life, in
some cases seriously affecting the growth of forests, and can erode buildings and
corrode metal oxides.
After considered the ways in which energy is used and the scale of its use and
have looked at the various problems associated with the current use of fossil and
nuclear fuels such as the environmental impact we are now in a position to look
more closely at renewable sources, to see whether and to what extent they offer
solutions to these problems.
The term ‘renewable energy’ can be defined in several ways: for example Twidell
and Weir (1986) define renewable energy as ‘energy obtained from the continuous or

Page 24 of 218
repetitive currents of energy recurring in the natural environment.’ Sorensen (1979)
defines renewable energy as ‘energy flows which are replenished at the same rate as they
are “used”’, adding that the term renewable energy may be taken to include ‘the
usage of any energy storage reservoir which is being “refilled” at rates comparable to
that of extraction’.
Most renewable energy sources are derived from solar radiation, including the
direct use of solar energy for heating or electricity generation, and indirect forms
such as energy from the wind, waves and running water, and from plants and
animals. Tidal sources of energy result from the gravitational pull of the moon and
sun, and geothermal energy comes from the heat generated within the earth. Energy
from wastes of all kinds is also often included under the heading of renewable.
The use of renewable on a more significant scale than at present would at the very
least replace a further significant proportion of fossil and nuclear fuel use, thereby
reducing the associated environmental impacts. Most of the renewable sources
enable the forms to be avoided, but all have some form of local environmental impact
of their own, ranging from very minor to major in the case of the larger tidal and
hydroelectric schemes.
As clearly shown on the following Figure 1.4, renewable sources are likely to make
up more than 50% of the total energy supply after 2050. While, the use of oil will start
to decline after the year 2020, the message someone can get from the diagram is quite
simple. The power plant for the domestic sector will need to use a fuel that can be
derived from a variety of sources. This means that major structural changes are
needed in the infrastructure of fuel supply and the domestic sector itself.

Page 25 of 218
Figure 1.4: World Energy Generation
Summarizing all of the above it can be said that renewable energy sources seem to
be a promising new way of producing energy, better and cleaner from the energy
produced from the burnt of oil. With the passage of time, and as the fossil fuel
reserves are getting smaller, renewable source of energy will eventually bring
changes worldwide in the energy sector as they may offer a solution to the matter
above.
Page 26 of 218
Project Aims
The aim of the project is to investigate the use of renewable energy in the domestic
sector and more specifically for an isolated house by providing the 100% of the
needed energy from renewable. The technology that is gone to be used is by wind
energy, photovoltaic, hydrogen production and fuel cell.
Although the first uses of renewable sources such as the wind and photovoltaic are
likely to involve the direct production and use of electricity, the potential for utilizing
renewable for electricity is limited by the intermittent character of solar radiation and
wind energy by the difficulty of using electricity when the extraction of energy from
such technologies is limited. The role of renewable in the global economy could be
greatly extended if they could be converted to energy carriers that are easily stored.
Even if nowadays this problem has been overcome with the use of batteries still
some environmental concerns prevent the acceptance of the system. But since this
new technology of producing hydrogen and use it in the fuel cell is in a very early
stage of development it is very difficult to be able to replace the existing batteries
with a hydrogen-fuel cell system at the moment. Further developments have first to
be accomplished before the above application to be feasible.
On the other hand, many electrical applications could be powered by this coming
technology without using power from the grid or from the batteries as it is being
done at the moment. Thus, replacing the batteries of a system like the wind –
photovoltaic with a fuel cell system the author investigates how this could work and
if can improve the efficiency of it. Hence, a better view of the fuel cell technology can
be obtained for the use in the domestic sector.
Page 27 of 218
As we mentioned before batteries cause a significant environmental impact from
the time of production until the elimination phase. To assess which system, batteries
or fuel cell, is the most environmental friendly and which causes the largest impact
we compared them by using the Life Cycle Assessment method.
“The life cycle assessment is an objective process to evaluate the environmental
burdens associated with a product, process, or activity by identifying and
quantifying energy and material usage and environmental releases, to assess the
impacts of those energy and material uses and releases to the environment, and to
evaluate and implement opportunities to effect environmental improvements. The
assessment includes the entire life cycle of the product, process, or activity,
encompassing extracting and processing raw materials; manufacturing
transportation and distribution; use/re-use/maintenance; recycling, and final
disposal.” (Guidelines for Life-Cycle Assessment: A 'Code of Practice', SETAC,
Brussels, 1993)
By using the LCA method not only in the batteries and the fuel cell but also in the
entire house and the remaining system of wind turbine and photovoltaic we could
evaluate the whole system once with the batteries and once with the fuel cell. With
this way we could compare which technology is most environmental friendly. Also
we compared the entire system with the house to evaluate the degree of the impact
the system has against the house.
Page 28 of 218
CHAPTER 2
Solar Photovoltaic Power
Solar energy runs the engines of the earth. It heats its atmosphere and its lands,
generates its winds, drives the water cycle, warms its oceans, grows its plants, feeds
its animals, and even (over the long haul) produces its fossil fuels. This energy can be
converted into heat and cold, driving force and electricity.
Solar power is one of the first things that come to most people's minds when the
subject of alternative energy comes up. Solar power first gained wide public
awareness during the 1970's energy crisis, and while it may not be such a hot topic
these days, solar technology has made great advances since then.
Solar Thermal Panels
The first widespread residential use of solar energy came in the form of solar
thermal heating panels. By covering a system of copper pipes with a black heat-
collecting surface beneath a greenhouse-style pane of glass, fluid inside the copper
pipes can be heated with solar radiation and pumped through a baseboard heating
system, used for household water heating or for heating swimming pools.
However solar thermal panels aren't very efficient for applications requiring very
high heat fluid. While these systems may be ideal for keeping a small swimming
pool at a comfortable temperature, baseboard heating or household hot water would
likely require a gas or electric secondary heater. In Alaska, during much of the year
solar radiation would not be sufficient to counteract the extreme cold, so these
systems are probably best left for summer cabins and more southern homes.
Page 29 of 218
Solar Electric Panels
Photovoltaic (PV) panels, which use sunlight to produce electricity, are much more
efficient for their purpose than their solar thermal cousins. They are also much more
useful in northern climates. While the manufacturing process and the mechanism by
which they work is more technical than solar thermal, they are much simpler to
install and maintain in actual use. Following is an overview of the function and
purpose of photovoltaic panels, as well as the many benefits they have in alternative
energy systems.
How Photovoltaic Panels are Used
Solar electric panels are probably one of the simplest alternative energy sources to
use. They can be mounted on a rooftop or a freestanding solar array rack. Once
mounted, a wire needs to be run from the solar panel to a solar charge controller, and
a wire needs to be run from the charge controller to a deep cycle battery bank. If the
building's electrical system runs on DC power, the battery bank can be wired directly
into the system.
Multiple solar panels increase the wiring complexity a bit, and of course, most
homes will use 120 volt AC power or a combination of AC and DC power. AC power
systems will require the use of an inverter to convert the DC battery power into
useable 120VAC power, and other details can be added, expanded and customized
from there.
However, the fundamentals of using solar power remain simple. The solar panels
turn sunlight into electricity, and that power is stored in a battery bank for
household use. The household power needs are drawn out of the stored battery

Page 30 of 218
power, and the solar panels recharge the batteries when their charge drops below a
certain level.
Figure 2.1: Typical PV System
Types of PV Cell
Monocrystalline Silicon Cells:
Made using cells saw-cut from a single cylindrical crystal of silicon, this is the most
efficient of the photovoltaic (PV) technologies. The principle advantage of
monocrystalline cells are their high efficiencies, typically around 15%, although the
manufacturing process required to produce monocrystalline silicon is complicated,
resulting in slightly higher costs than other technologies.
Multicrystalline Silicon Cells:
Made from cells cut from an ingot of melted and recrystallised silicon. In the
manufacturing process, molten silicon is cast into ingots of polycrystalline silicon,
these ingots are then saw-cut into very thin wafers and assembled into complete
cells. Multicrystalline cells are cheaper to produce than monocrystalline ones, due to
the simpler manufacturing process. However, they tend to be slightly less efficient,
with average efficiencies of around 12%., creating a granular texture.

Page 31 of 218
Thick-film Silicon:
Another multicrystalline technology where the silicon is deposited in a continuous
process onto a base material giving a fine grained, sparkling appearance. Like all
crystalline PV, this is encapsulated in a transparent insulating polymer with a
tempered glass cover and usually bound into a strong aluminium frame.
Amorphous Silicon:
Amorphous silicon cells are composed of silicon atoms in a thin homogenous layer
rather than a crystal structure. Amorphous silicon absorbs light more effectively than
crystalline silicon, so the cells can be thinner. For this reason, amorphous silicon is
also known as a "thin film" PV technology. Amorphous silicon can be deposited on a
wide range of substrates, both rigid and flexible, which makes it ideal for curved
surfaces and "fold-away" modules. Amorphous cells are, however, less efficient than
crystalline based cells, with typical efficiencies of around 6%, but they are easier and
therefore cheaper to produce. Their low cost makes them ideally suited for many
applications where high efficiency is not required and low cost is important.
Other Thin Films:
A number of other promising materials such as cadmium telluride (CdTe) and
copper indium diselenide (CIS) are now being used for PV modules. The attraction of
these technologies is that they can be manufactured by relatively inexpensive
industrial processes, certainly in comparison to crystalline silicon technologies, yet
they typically offer higher module efficiencies than amorphous silicon. New
technologies based on the photosynthesis process are not yet on the market.
Page 32 of 218
Types of PV System
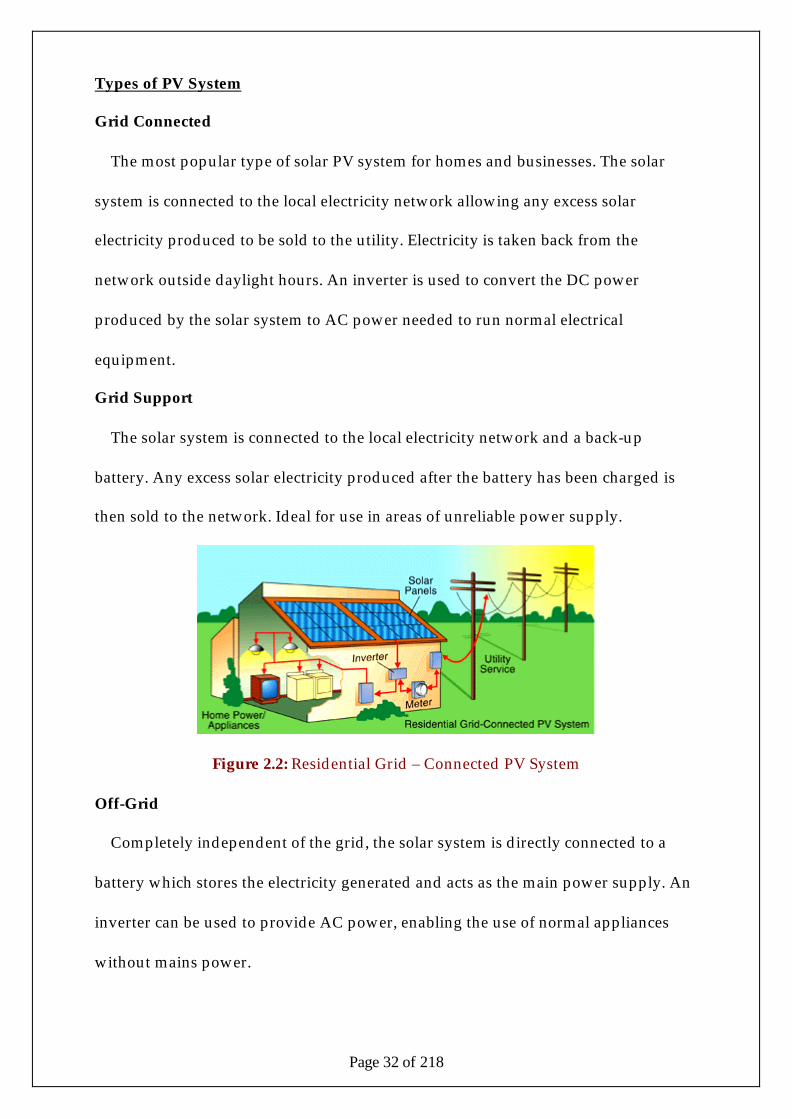
Grid Connected
The most popular type of solar PV system for homes and businesses. The solar
system is connected to the local electricity network allowing any excess solar
electricity produced to be sold to the utility. Electricity is taken back from the
network outside daylight hours. An inverter is used to convert the DC power
produced by the solar system to AC power needed to run normal electrical
equipment.
Grid Support
The solar system is connected to the local electricity network and a back-up
battery. Any excess solar electricity produced after the battery has been charged is
then sold to the network. Ideal for use in areas of unreliable power supply.
Figure 2.2: Residential Grid – Connected PV System
Off-Grid
Completely independent of the grid, the solar system is directly connected to a
battery which stores the electricity generated and acts as the main power supply. An
inverter can be used to provide AC power, enabling the use of normal appliances
without mains power.
Page 33 of 218
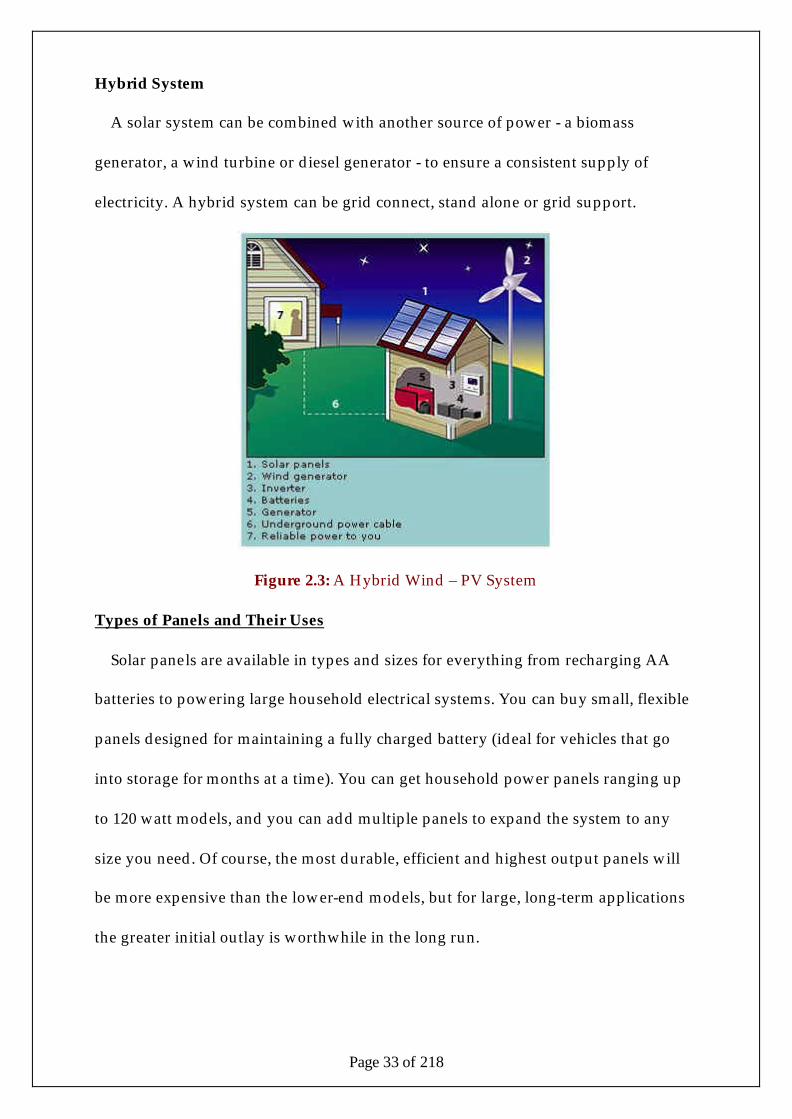
Hybrid System
A solar system can be combined with another source of power - a biomass
generator, a wind turbine or diesel generator - to ensure a consistent supply of
electricity. A hybrid system can be grid connect, stand alone or grid support.
Figure 2.3: A Hybrid Wind – PV System
Types of Panels and Their Uses
Solar panels are available in types and sizes for everything from recharging AA
batteries to powering large household electrical systems. You can buy small, flexible
panels designed for maintaining a fully charged battery (ideal for vehicles that go
into storage for months at a time). You can get household power panels ranging up
to 120 watt models, and you can add multiple panels to expand the system to any
size you need. Of course, the most durable, efficient and highest output panels will
be more expensive than the lower-end models, but for large, long-term applications
the greater initial outlay is worthwhile in the long run.

Page 34 of 218
Flexible panels are limited to smaller output sizes. They tend to be more expensive
per watt of rated output, and less durable in long-term applications. However,
they're extremely convenient for intermittent use where the panel may need to be
stored and moved around regularly.
Unframed rigid panels also tend to be available primarily in smaller sizes. They're
much lighter weight than the more common framed panels, and convenient for
portable applications. What these panels lose in convenience as compared to flexible
panels, they make up in cost per watt and durability.
Framed rigid panels are the most common type of solar panel for full solar power
systems. They are the most durable type of panel, and are generally used in
permanent or long term installations for household, RV or marine power systems.
Large framed panels can get quite expensive, but with 20-25 year warranties, high
durability and low maintenance, they're worth it.
Solar roofing is one of the newer styles of photovoltaic unit. For a large household
system, solar roofing can be found that mimics the appearance of regular roofing
shingles or regular metal channel roofing. Probably the most cosmetically pleasing
option for a full-house solar system, these products are now becoming available on a
widespread basis.
Benefits of Solar Energy
Photovoltaic power is one of the most benign forms of electrical power available. It
produces no emissions, uses no fuel, and other than the power storage batteries, PV
system components are all solid-state, with no hazardous materials involved.
Page 35 of 218
Most rigid photovoltaic panels come with 20-25 year warranties on their rated
power output, and they require virtually no maintenance during that time. Cleaning
the surface of the panels and maintaining a proper fluid level in the storage batteries
are the two primary maintenance duties.
For villages and individuals outside the reach of the grid power system, solar
panels can be a highly reliable and relatively economical source of power. In
northern climates, photovoltaic are perfectly suited for powering remote summer
vacation cabins, or providing a seasonal power source for year-round homes.
For commercial and industrial use, PV panels can be put to use powering
monitoring stations, signal lights, telecommunications towers, and other remote sites
where there are no full-time employees stationed. Solar power is also useful for small
power loads even in grid-powered areas where running grid power to the load
would be inconvenient or expensive (such as signal lights on an airstrip or parking
lot lighting).
How Photovoltaic Panels Work
Solar electric panels are composed mainly of silicon. Silicon is used because it
naturally releases electrons (electrical energy) when hit with a photon (light source).
The trick for photovoltaic manufacturers was to find a way to "catch" the displaced
electrons and use their energy.
Most solar panels consist of a clear protective top layer, two layers of specially
treated silicon with collecting circuitry attached to the top layer, and a tough
polymer backing layer. From there, the panel can be framed (adds durability) or
Page 36 of 218
unframed (reduces weight), and in some cases the layers are even comprised of
flexible materials. The vast majority of PV panels work in the same way:
The top layer of silicon is treated to give it an electrically negative character. The
back layer is treated to make it electrically positive. Due to these treatments and
added elements, the top layer is rich in electrons, and the back layer is relatively
electron poor. These two layers are separated by an electrically charged junction,
which allows electrons to flow from back to front, but not the other way around.
When light strikes the PV panel, some of the photons are absorbed by the silicon
layers. The photons cause electrons to be released from the silicon crystal, and those
electrons "wander around" looking for somewhere to attach themselves. Some of the
electrons are freed from the bottom layer, and they find their way through the
junction into the top (electron rich) layer. Some of the electrons are freed from the top
layer, and since they cannot travel to the bottom (electron poor) layer, and are being
"crowded" by new electrons from the bottom layer, they are left free to be collected
by electrical contacts on the surface of the top layer.
Those collected electrons are routed through an external circuit, providing power
to the electrical system attached to the panels. The circuit is completed when the
electrons return to the bottom layer of the PV panel, find "resting spots" in the
electron poor bottom layer, and wait for the next photon to shake them loose.
There are no moving parts in the PV panel, so maintenance is limited to keeping the
junction boxes and wiring free from moisture and corrosion, and keeping the surface
of the panel clean enough to allow light through to the silicon layers.
Page 37 of 218
PV SYSTEMS WITH BATTERIES
The simplest solutions have certain drawbacks - the most obvious one being that in
case of PV powered pump or fan could only be used during the daytime, when the
sun is shining. To compensate for these limitations, a battery is added to the system.
The battery is charged by the solar generator, stores the energy and makes it
available at the times and in the amounts needed. In the most remote and hostile
environments, PV-generated electrical energy stored in batteries can power a wide
variety of equipment. Storing electrical energy makes PV systems a reliable source of
electric power day and night, rain or shine. PV systems with battery storage are
being used all over the world to power lights, sensors, recording equipment,
switches, appliances, telephones, televisions, and even power tools.
A solar module generates a direct current (DC), generally at a voltage of 12 V.
Many appliances, such as lights, TV’s, refrigerators, fans, tools etc., are now
available for 12V DC operation. Nevertheless the majority of common electrical
household appliances are designed to operate on 110 V or 220 V alternating current
(AC). PV systems with batteries can be designed to power DC or AC equipment.
People who want to run conventional AC equipment add a power conditioning
device called an inverter between the batteries and the load. Although a small
amount of energy is lost in converting DC to AC, an inverter makes PV-generated
electricity behave like utility power to operate everyday AC appliances, lights, or
computers.
PV systems with batteries operate by connecting the PV modules to a battery, and
the battery, in turn, to the load. During daylight hours, the PV modules charge the
battery. The battery supplies power to the load whenever needed. A simple electrical
Page 38 of 218
device called a charge controller keeps the batteries charged properly and helps
prolong their life by protecting them from overcharging or from being completely
drained. Batteries make PV systems useful in more situations, but also require some
maintenance.
The batteries used in PV systems are often similar to car batteries, but are built
somewhat differently to allow more of their stored energy to be used each day. They
are said to be deep cycling. Batteries designed for PV projects pose the same risks
and demand the same caution in handling and storage as automotive batteries. The
fluid in unsealed batteries should be checked periodically, and batteries should be
protected from extremely cold weather.
A solar generating system with batteries supplies electricity when it is needed.
How much electricity can be used after sunset or on cloudy days is determined by
the output of the PV modules and the nature of the battery bank. Including more
modules and batteries increases system cost, so energy usage must be carefully
studied to determine optimum system size. A well-designed system balances cost
and convenience to meet the user’s needs, and can be expanded if those needs
change.
PV ADVANTAGES
High Reliability
PV cells were originally developed for use in space, where repair is extremely
expensive, if not impossible. PV still powers nearly every satellite circling the earth
because it operates reliably for long periods of time with virtually no maintenance.
Low Operating Costs
PV cells use the energy from sunlight to produce electricity - the fuel is free. With

Page 39 of 218
no moving parts, the cells require low-maintenance. Cost-effective PV systems are
ideal for supplying power to communication stations on mountain tops, navigational
buoys at sea, or homes far from utility power lines.
Non-polluting
Because they burn no fuel and have no moving parts, PV systems are clean and
silent. This is especially important where the main alternatives for obtaining power
and light are from diesel generators and kerosene lanterns.
Modular
A PV system can be constructed to any size. Furthermore, the owner of a PV
system can enlarge or move it if his or her energy needs change. For instance,
homeowners can add modules every few years as their energy usage and financial
resources grow. Ranchers can use mobile trailer-mounted pumping systems to water
cattle as they are rotated between fields.
Low Construction Costs
PV systems are usually placed close to where the electricity is used, meaning much
shorter wire runs than if power is brought in from the utility grid. In addition, using
PV eliminates the need for a step-down transformer from the utility line. Fewer wires
mean lower costs and shorter construction time.

Page 40 of 218
Wind Turbines for Home Power
Wind energy is a form of solar energy produced by uneven heating of the Earth’s
surface. The sun radiates 100,000,000,000,000 kilowatt hours of energy to the earth
per hour. In other words, the earth receives 10 to the 17th power of watts of power.
About 1 to 2 per cent of the energy coming from the sun is converted into wind
energy. That is about 50 to 100 times more than the energy converted into biomass by
all plants on earth.
With good, consistent wind flow, wind energy is one of the most economical forms
of alternative energy available today. If your wind flow fluctuates, wind turbines can
still be an excellent addition to a solar system, providing more consistent year-round
power.
Advances in wind turbine technology have focused on improving the efficiency of
the components and reducing the number of moving parts, resulting in very reliable
and effective turbine designs. Today, wind turbines are an essential part of a reliable
renewable energy system.
Wind Turbine Basics
Essentially, a wind turbine (or: wind generator) is an alternator attached to a
propeller. When the wind blows, the propeller turns and the alternator begin
producing electricity. The design details that determine which turbines are best
suited for various wind speeds get more involved, but all wind turbines operate in
the same manner.
How Wind Turbines are Used
Installing a wind turbine is a bit more involved than installing solar panels, but
they are still relatively easy to incorporate into alternative energy system. The

Page 41 of 218
turbine needs to be mounted in an area free from obstructions to wind flow (nearby
buildings, trees, etc.).
Some smaller turbines can be mounted to the rooftop of houses, but vibrations
from the turbine may be transferred to the frame of the building. Rooftop turbine
mounts often come with rubber vibration dampers to minimize this problem. As a
general rule however, the higher in the air you can get wind turbine the more
effective it will be, so independent, guyed towers are the recommended mounting
system.
When installing the controls and wiring of a wind generator, it is important to
understand two fundamental differences between wind turbines and solar panels:
Current Rectifiers: Solar panels produce direct current (DC) electricity required by
power storage batteries, and can be connected directly to the battery bank without
causing harm. Wind generators do not produce DC electricity, so a device called a
"rectifier" is used to convert the turbine's output current to DC.
Some turbines have a rectifier built in. In most cases though, the rectifier is
supplied as a separate component that must be installed between the wind turbine
and the battery. Often, the rectifier is combined with a charge controller into one
complete wind turbine control unit.
Load Diversion: Solar panels are "passive" electricity producers. Even though the
sun is shining, they only produce electricity when a charge is needed by the battery.
Wind generators are "active" electricity producers. If the wind is blowing, they will
produce current whether the battery bank needs the charge or not. In order to
prevent damage to the wind turbine, all of the electricity it produces must be "used"
in some way.

Page 42 of 218
When the system batteries need charging current, they provide an electrical load to
use the wind turbine's electricity. If the batteries are fully charged, the turbine's
output must be "diverted" to another electrical load.
A load diverting charge controller regulates wind generator output so batteries
receive charging current when they need it, and any excess electricity generated by
the wind turbine is diverted to an alternate load when the batteries are fully charged.
Some wind turbines have charge control features built-in, diverting their own
excess current and allowing it to dissipate as heat through the wind turbine housing.
In most turbine systems however, the charge controller is an external unit, and while
DC rectifiers are always included as part of a basic wind turbine package, the load
diverting controller may not be.
Some load-diverting charge controllers come with a heat-sink resistor to attach as
the diversion load. When the batteries reach full charge, the load-diverting controller
will simply send electricity to this resistor, where the energy will be released as heat.
Some wind turbines have diversion features built into the turbine body itself, and the
turbines outer shell acts as a heat sink for the excess power. Many charge controllers
allow to use the diverted current for other uses, such as running a water heating coil,
a ventilating fan or a space heating system, making the wind generator an even more
useful and efficient source of power.
Once a load-diverting charge controller is attached between the wind turbine and
the storage batteries, the electrical system can be connected to the batteries, either
directly for a matching-voltage DC system, or through an inverter for an AC or
mixed AC/DC system.

Page 43 of 218
Types of Wind Generators
Wind turbines come in a range of output voltages, to match the overall voltage of
the electrical system. While 12 volt is common for small to mid-sized systems, large
systems can be designed in 24 or 48 volt configurations.
The primary consideration in a wind generator is the average wind speed at the
installation site. A different turbine will give optimum performance at a site with
average wind speeds below 15mph than one at a site with speeds in the low 20mph
range. Generally, low speed generators will either have longer rotor blades or a
larger number of short, wide blades to maximize power drawn from minimal wind.
High speed generators may be built of more durable material, and will have
narrow, relatively short blades to minimize potential rotor damage in extremely high
winds.
Before choosing which type of turbine is best for a particular site, some sort of
wind speed measurement should be taken for a few consecutive months (or ideally, a
full year). With long term wind measurements an accurate average wind speed can
be calculated, as well as determining likely maximum wind speeds. Armed with this
information, a turbine can be chosen that will maximize performance at the average
wind speed, as well as one that will withstand the likely maximum forces.
SMALL WIND TURBINES
Small wind energy systems can be used in connection with an electricity
transmission and distribution system (called grid-connected systems), or in stand-
alone applications that are not connected to the utility grid. A grid-connected wind
turbine can reduce consumption of utility-supplied electricity for lighting,
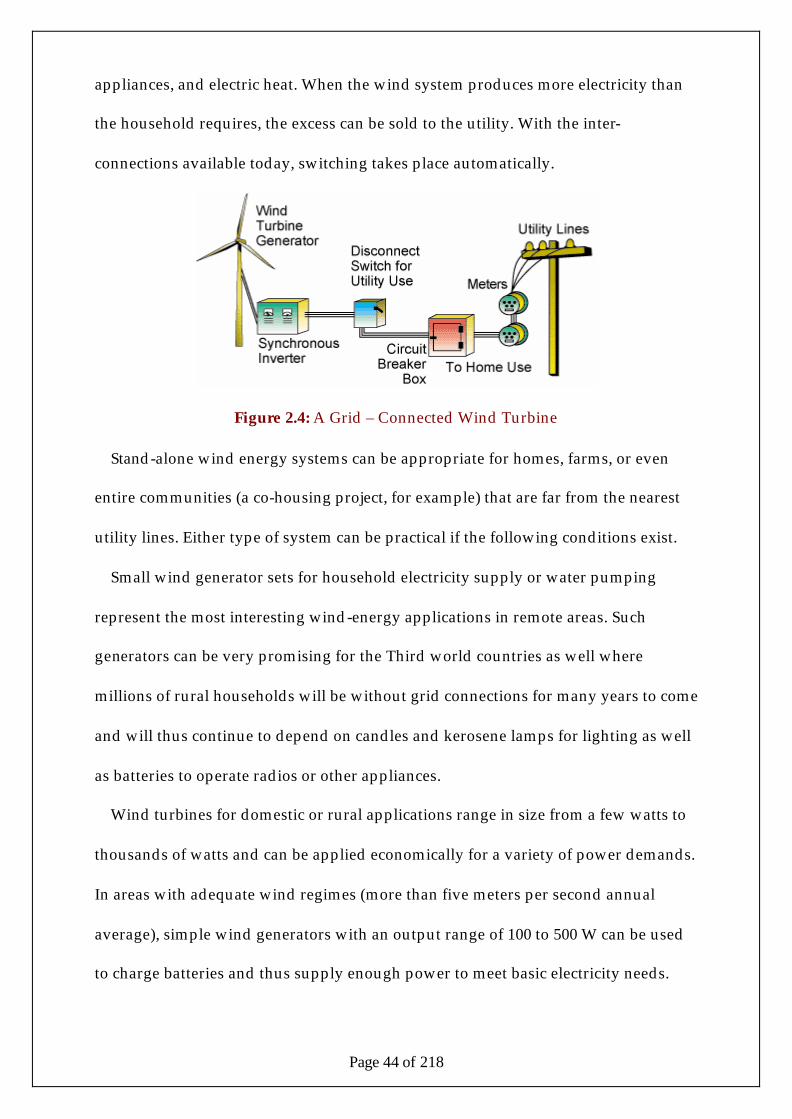
Page 44 of 218
appliances, and electric heat. When the wind system produces more electricity than
the household requires, the excess can be sold to the utility. With the inter-
connections available today, switching takes place automatically.
Figure 2.4: A Grid – Connected Wind Turbine
Stand-alone wind energy systems can be appropriate for homes, farms, or even
entire communities (a co-housing project, for example) that are far from the nearest
utility lines. Either type of system can be practical if the following conditions exist.
Small wind generator sets for household electricity supply or water pumping
represent the most interesting wind-energy applications in remote areas. Such
generators can be very promising for the Third world countries as well where
millions of rural households will be without grid connections for many years to come
and will thus continue to depend on candles and kerosene lamps for lighting as well
as batteries to operate radios or other appliances.
Wind turbines for domestic or rural applications range in size from a few watts to
thousands of watts and can be applied economically for a variety of power demands.
In areas with adequate wind regimes (more than five meters per second annual
average), simple wind generators with an output range of 100 to 500 W can be used
to charge batteries and thus supply enough power to meet basic electricity needs.
Page 45 of 218
In the past reliability of small wind turbines was a problem. Small turbines
designed in the late 1970’s had a well deserved reputation for not being very reliable.
Today’s products, however, are technically advanced over these earlier units and
they are substantially more reliable. Small turbines are now available that can
operate 5 years or more, even at harsh sites, without need for maintenance or
inspections. The reliability and cost of operation of these units is equal to that of
photovoltaic systems.
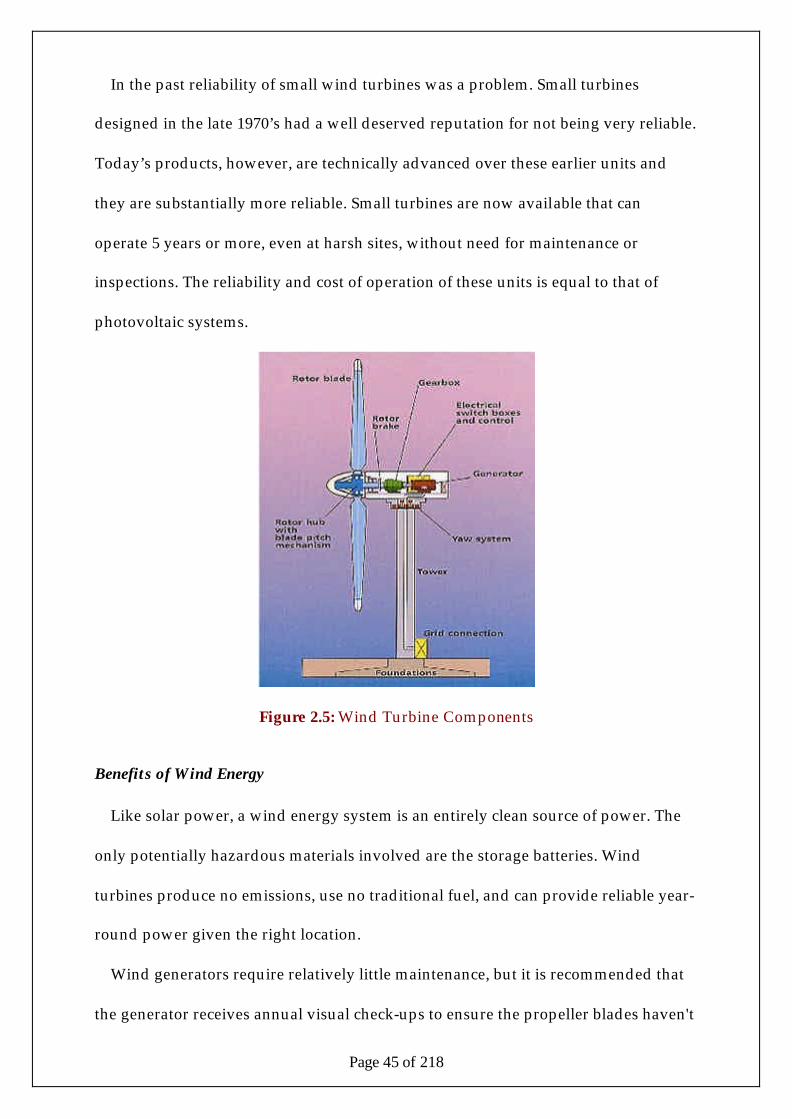
Figure 2.5: Wind Turbine Components
Benefits of Wind Energy
Like solar power, a wind energy system is an entirely clean source of power. The
only potentially hazardous materials involved are the storage batteries. Wind
turbines produce no emissions, use no traditional fuel, and can provide reliable year-
round power given the right location.
Wind generators require relatively little maintenance, but it is recommended that
the generator receives annual visual check-ups to ensure the propeller blades haven't

Page 46 of 218
been damaged. If the turbine is located in a good spot it's very unlikely to be
damaged by any flying debris, but a chipped or cracked blade can be a hazard
should it break completely, and a chipped or damaged blade will also negatively
affect the turbine's performance.
Wind turbines are very useful in almost any marine or household electrical system.
In marine use, the movement of the boat will raise enough breeze to get the generator
turning even when actual winds are fairly low, making them an extremely reliable
source of on-board power. For residential systems, wind power can be a wonderful
source of power during low-light winter months and even year-round, depending on
the site. They can also be configured to power dedicated water pumping systems,
which may be of particular interest to individuals currently without running water.
For commercial and industrial use, wind turbines are particularly useful in rugged
remote locations such as mountaintop repeater stations or offshore oil platforms.
High elevation and offshore or seaside remote sites often have fairly high year-round
wind current that will make the most of wind generation systems. Industrial grade
wind generators are available to withstand the worst storm winds present at such
sites.
Page 47 of 218
Hydrogen Production - Storage
Hydrogen has been widely regarded as a possible ultimate fuel and energy storage
medium for the next century and beyond. This view is mainly based upon scenarios
in which fossil fuel are no longer available, while other primary energy sources such
as nuclear and solar are employed to generate hydrogen.
The potential of hydrogen for the storage and cheap transmission of energy over
long distances has led to the concept of the so-called “hydrogen economy”.
The interest in hydrogen as an ideal secondary fuel stemmed initially from concern
over the growing pollution associated with fossil fuel combustion. The use of
hydrogen is essentially non-polluting. It can be derived from water if a source of
high quality energy is available and combusted back to water in a closed chemical
cycle involving no release of pollutants except possibly those connected with the
source of high quality energy.
However there are major technical and economic problems associated with both
production and storage of hydrogen.
Hydrogen Production
Fossil Fuel Based Hydrogen Production
A closer look at the chemical formula for any fossil fuel reveals that hydrogen is
present in all of the formulas. The trick is to remove the hydrogen safely, efficiently
and without any of the other elements present in the original compound.
Hydrogen has been produced from coal, gasoline, methanol, natural gas and any
other fossil fuel currently available. Some fossil fuels have high hydrogen to oxygen
ratio making them better candidates for the reforming process. The more hydrogen
present and the fewer extraneous compounds make the reforming process simpler
Page 48 of 218
and more efficient. The fossil fuel that has the best hydrogen to carbon ratio is
natural gas or methane (CH4).
Steam Reforming of Natural Gas
Hydrogen production from natural gas commonly employs a process known as
steam reforming. Steam reforming of natural gas involves two steps.
The initial phase involves rendering the natural gas into hydrogen, carbon dioxide
and carbon monoxide. This breakdown of the natural gas is accomplished by
exposing the natural gas to high temperature steam. The second phase of steam
reforming consists of creating additional hydrogen and carbon dioxide by utilizing
the carbon monoxide created in the first phase. The carbon monoxide is treated with
high temperature steam and the resulting hydrogen and carbon dioxide is
sequestered and stored in tanks.
Most of the hydrogen utilized by the chemical and petroleum industries is
generated with steam reforming. Steam reforming reaches efficiencies of 70% - 90%.
The reformer component on a complete fuel cell system is usually a smaller variation
of the process described above. Component reformers operate under varying
operating conditions and the chemical path that the hydrogen generation follows
will vary from manufacturer to manufacturer, but the resulting hydrogen reformate
is essentially the same.
Water Based Hydrogen Production
Electrolysis
Electrolysis is the technical name for using electricity to split water into its
constituent elements, hydrogen and oxygen. The splitting of water is accomplished
by passing an electric current through water. The electricity enters the water at the
Page 49 of 218
cathode, a negatively charged terminal, passes through the water and exists via the
anode, the positively charged terminal. The hydrogen is collected at the cathode and
the oxygen is collected at the anode. Electrolysis produces very pure hydrogen for
use in the electronics, pharmaceutical and food industries.
Relative to steam reforming, electrolysis is very expensive. The electrical inputs
required to split the water into hydrogen and oxygen account for about 80% of the
cost of hydrogen generation. Potentially, electrolysis, when coupled with a
renewable energy source, can provide a completely clean and renewable source of
energy. In other circumstances, electrolysis can couple with hydroelectric or off-peak
electricity to reduce the cost of electrolysis.
Photo electrolysis
Photo electrolysis, known as the hydrogen holy grail in some circles, is the direct
conversion of sunlight into electricity. Photovoltaic, semiconductors and an
electrolyser are combined to create a device that generates hydrogen. The
photoelectrolyzer is placed in water and when exposed to sunlight begins to generate
hydrogen. The photovoltaic and the semiconductor combine to generate enough
electricity from the sunlight to power the electrolyser. The hydrogen is then collected
and stored. Much of the research in this field takes place in Golden, Colorado at the
National Renewable Energy Laboratory.
Photo biological
Photo biological production of hydrogen involves using sunlight, a biological
component, catalysts and an engineered system. Specific organisms, algae and
bacteria, produce hydrogen as a by-product of their metabolic processes. These
organisms generally live in water and therefore are biologically splitting the water

Page 50 of 218
into its component elements. Currently, this technology is still in the research and
development stage and the theoretical sunlight conversion efficiencies have been
estimated up to 24%. Over 400 strains of primitive plants capable of producing
hydrogen have been identified, with 25 impressively achieving carbon monoxide to
hydrogen conversion efficiencies of 100%.
In one example, researchers have discovered that the alga, Chlamydomonas
reinhardtii, possesses an enzyme called hydrogenase that is capable of splitting water
into its component parts of hydrogen and oxygen. The researchers have determined
the mechanism for starting and stopping this process, which could lead to an almost
limitless method for producing clean, renewable hydrogen. The algae need sulphur
to grow and photosynthesize. Scientists found that when they starved the algae of
sulphur, in an oxygen-free environment, the algae reverted to a hydrogenase-
utilizing mode. This mechanism was developed over millions of years of evolution
for survival in oxygen-rich and oxygen-free environments. Once in this cycle, the
algae released hydrogen, not oxygen. Further research is necessary to improve the
efficiencies of the engineered plant systems, collection methods and the costs of
hydrogen generation.
Where does the hydrogen come from?
Hydrogen made from renewable energy resources provides a clean and abundant
energy source, capable of meeting most of the future's high energy needs. When
hydrogen is used as an energy source in a fuel cell, the only emission that is created
is water, which can then be electrolyzed to make more hydrogen – the waste product
supplies more fuel. This continuous cycle of energy production has potential to
Page 51 of 218
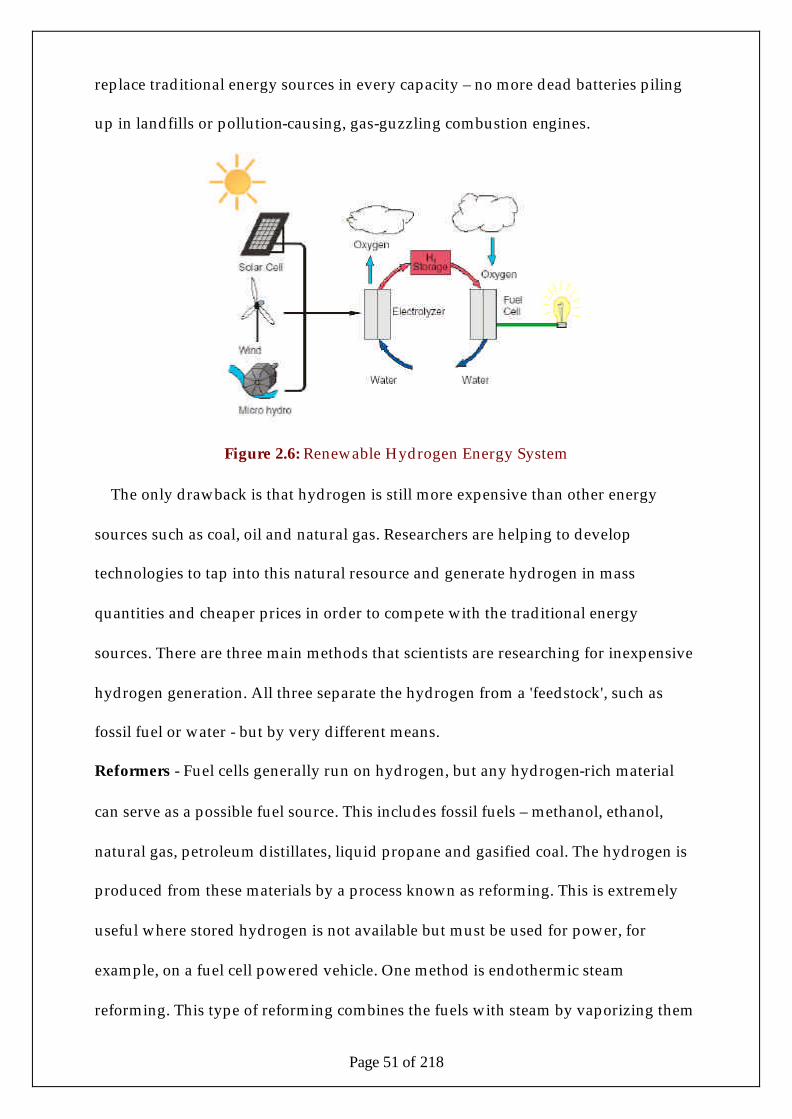
replace traditional energy sources in every capacity – no more dead batteries piling
up in landfills or pollution-causing, gas-guzzling combustion engines.
Figure 2.6: Renewable Hydrogen Energy System
The only drawback is that hydrogen is still more expensive than other energy
sources such as coal, oil and natural gas. Researchers are helping to develop
technologies to tap into this natural resource and generate hydrogen in mass
quantities and cheaper prices in order to compete with the traditional energy
sources. There are three main methods that scientists are researching for inexpensive
hydrogen generation. All three separate the hydrogen from a 'feedstock', such as
fossil fuel or water - but by very different means.
Reformers - Fuel cells generally run on hydrogen, but any hydrogen-rich material
can serve as a possible fuel source. This includes fossil fuels – methanol, ethanol,
natural gas, petroleum distillates, liquid propane and gasified coal. The hydrogen is
produced from these materials by a process known as reforming. This is extremely
useful where stored hydrogen is not available but must be used for power, for
example, on a fuel cell powered vehicle. One method is endothermic steam
reforming. This type of reforming combines the fuels with steam by vaporizing them
Page 52 of 218
together at high temperatures. Hydrogen is then separated out using membranes.
One drawback of steam reforming is that is an endothermic process – meaning
energy is consumed. Another type of reformer is the partial oxidation (POX)
reformer. CO2 is emitted in the reforming process, which makes it not emission-free,
but the emissions of NOX, SOX, Particulates, and other smog producing agents are
probably more distasteful than the CO2. And fuel cells cut them to zero.
Enzymes - Another method to generate hydrogen is with bacteria and algae. The
cyanobacteria, an abundant single-celled organism, produces hydrogen through its
normal metabolic function. Cyanobacteria can grow in the air or water, and contain
enzymes that absorb sunlight for energy and split the molecules of water, thus
producing hydrogen. Since cyanobacteria take water and synthesize it to hydrogen,
the waste emitted is more water, which becomes food for the next metabolism.
Solar- and Wind- powered generation - By harnessing the renewable energy of the
sun and wind, researchers are able to generate hydrogen by using power from
photovoltaic (PVs), solar cells, or wind turbines to electrolyze water into hydrogen
and oxygen. In this manner, hydrogen becomes an energy carrier – able to transport
the power from the generation site to another location for use in a fuel cell. This
would be a truly zero-emissions way of producing hydrogen for a fuel cell.
Hydrogen Storage
If new sources of energy are to be fully exploited then an efficient energy storage
system must be developed to meet variable demand. This is so because, in most
cases, energy demands are periodic in nature whereas energy supply operates most
efficiently on a constant output basis.
Page 53 of 218
The supply and demand patterns of the electric utility industry illustrate the point
well. Generating capacity must be sized for maximum demand, which can be more
than twice minimum demand, since no economic storage method is currently
available on a large-scale basis. The result is that fixed charges contribute
significantly to electricity costs and consumers must pay heavily for a guaranteed
supply.
At present, the relative ease with which fossil-fuels are stored is taken for granted.
The energy associated with such fuels is in the form of latent chemical energy which
can be released on combustion. On the other hand, in the case of new energy sources
the actual form of energy is different. It is usually kinetic (wind, tidal) or heat
(nuclear, geothermal, solar) energy. Also it is not available uniformly, but rather on a
cyclic basis.
In order to enable effective storage, these new energy sources need to be converted
into a secondary energy form. Electricity and hydrogen are the two most promising
candidates to fulfil this role. However, electricity suffers from the disadvantage that
it is almost impossible to store efficiently. Storage of electricity by means of batteries
is not practical.
In contrast to electricity, hydrogen closely resembles our present fuels, especially
natural gas. It can be made fluid and hence can be moved and stored in the same
manner as today’s fuels.
Hydrogen can be stored in three forms: as a gas, as liquid, or as a solid combined
chemically with a metal. The first two methods are applicable to natural gas storage
but the third is unique to hydrogen.
Page 54 of 218
Which of the above forms will serve best as a form to store hydrogen will depend
upon the gas’s end use? In addition the economic criteria, safety aspects must also be
carefully considered.
CHOICE OF STORAGE
The choice of which method of hydrogen storage is best depends on:
• The application (Is liquid hydrogen required? What pressure is required?)
• The required energy density (What form of hydrogen delivery will be used?
Is space an issue?)
• The quantity of hydrogen to be stored (Is the storage used as a buffer, or
primary storage for a large amount of hydrogen?)
• The storage period (Will the storage be used to keep hydrogen for a few
hours, or is it seasonal storage?)
• What forms of energy are readily available (Is there waste heat available? Is
there high-pressure steam available for a turbine?)
• What is the geology of the area (Are there abandoned natural gas well
available?)
• Any future expansion needs (Are there reasons to believe additional storage
will be needed in the future?)
• Maintenance requirements (Is high reliability required? How often can the
storage system be shut down for maintenance?)
• Capital costs (Are high capital costs prohibitive?)

Page 55 of 218
Application
If hydrogen is required for a cryogenic application, the only choice is liquid
hydrogen. If on the other hand, hydrogen can be used as a gas, this would allow all
forms of storage and delivery to be considered.
Energy Density
The energy density of the hydrogen may be an important consideration. For
example, if the hydrogen must be delivered to a site far away, liquid hydrogen
would probably be the best option. The higher density of liquid hydrogen means one
truck can carry as much liquid hydrogen as 20 trucks carrying compressed gas.
Energy density can be expressed in terms of the volumetric energy density or the
weight density. If hydrogen is being delivered continuously by pipeline, little if any
hydrogen storage may be required, and it would not make sense to liquefy the
hydrogen, then deliver it to a pipeline as a gas. In pipelines with large variation in
flow, hydrogen may need to be stored to meet peak demand. The method of storage
in that case would depend on the quantity to be stored and the storage time.
Quantity
The quantity of hydrogen to be stored is a major consideration because the capital
cost per pound of hydrogen is generally lower for larger capacity storage units. In
the case of liquid hydrogen, boil-off rates are also inversely proportional to the vessel
size, so larger storage units will have lower boil-off rates. Compressed gas storage
can be used for small quantities of hydrogen when cryogenic temperatures are not
required. Because of the high capital cost of a liquefaction plant, liquid hydrogen
would be cost-prohibitive for small quantities of hydrogen, and the high boil-off
rates associated with the smaller vessel size would raise this cost even more. A metal
hydride might be a cost-effective option if the hydrogen is produced at a low
Page 56 of 218
pressure and a high- pressure gas is required. A metal hydride could also be used if
the hydrogen must be purified. With very small quantities of hydrogen, the cost
difference between compressed gas and metal hydride storage is not great because
both require a pressure vessel and the metal hydride alloy cost is small compared to
the vessel cost for small units. As the storage requirements increase, the metal
hydride alloy becomes a larger percentage of the unit cost and becomes the driving
cost factor. At the same time, the cost of compressed gas storage decreases per unit
volume with larger vessels, making compressed gas storage more economical. Metal
hydride storage may still be economical if high pressure hydrogen is needed and a
source of waste heat is available. For even greater quantities of hydrogen, liquid
hydrogen starts to become competitive because of the lower storage unit cost per
pound of hydrogen. For small quantities of hydrogen, the pressure vessel cost for the
compressed gas is lower than the combined costs of the insulated dewar, liquefier,
high boil off, and high energy use. However, as the quantity of hydrogen to be stored
increases, the cost of the pressure vessel increases faster than the liquefaction costs.
Underground storage is a special case of compressed gas storage where the vessel
cost is very low. In most cases, underground storage in a natural geological
formation will cost less than any other storage technique. The only case it wouldn’t
be cheaper is with small quantities of gas in large caverns where the amount of
working capital invested in the cushion gas is large compared to the amount of
hydrogen stored.
Compressed gas storage is generally limited to 1,300 kg (2,800 lb) of hydrogen or
less because of high capital costs. Over this, liquid hydrogen storage or underground
storage should be considered.
Page 57 of 218
Storage Period
The longer hydrogen is to be stored, the more favourable underground or liquid
hydrogen storage becomes because of lower capital costs. If hydrogen is stored for a
long time, the operating cost can be a small factor compared to the capital costs of
storage. Underground storage is the cheapest for short-term storage, followed by
above-ground compressed gas storage, which should be considered for storage times
of several hours to several days. Liquid storage and underground storage should be
considered for seasonal or long-term storage of hydrogen for periods longer than a
couple of days or 5% annual turnover rates of gas. Metal hydride storage is not
economical for large quantities of gas because of the high capital cost of the metal
hydride.
Energy Availability
The available energy may be another consideration when choosing methods of
storage. For compressed gas storage and hydrogen liquefaction, compressor power
consumption can be quite high. If inexpensive electricity, gas turbine, or steam
turbine power is available, the compression costs will be lower. A cheap source of
thermal energy or waste heat would benefit metal hydride storage by reducing the
energy costs for releasing the hydrogen from the hydride.
Maintenance and Reliability
Maintenance and reliability will depend on how simple the storage method is to
operate and maintain. A liquefaction plant will be much more complicated and more
costly to maintain than a metal hydride storage unit that has no rotating assemblies.
Liquefaction will have the highest maintenance requirements, followed by
compressed gas storage, and then metal hydrides.
Page 58 of 218
Safety
Safety is a concern with any option. When the main options for storage are
examined, metal hydrides appear to be the safest storage option because the storage
unit is at low pressure. If there is a leak in the container, very little hydrogen will leak
out because a source of continuous heat is required to release the bond between the
metal and the hydrogen. For compressed gas, there are two dangers. First, a high-
pressure vessel always presents some level of risk, whether it is an inert gas or a
reactive gas such as hydrogen. Second, if a compressed gas tank develops a leak, it
will result in the release of a large amount of hydrogen very quickly. Liquid
hydrogen has the potential to release even more hydrogen than compressed gas if a
storage container leaks because the liquid hydrogen will quickly vaporize. In open
areas there is, however, little chance of detonation, because hydrogen diffuses into
air quickly.
Summary
Based on current hydrogen storage technology, the following generalizations can
be made:
• Underground Storage - For large quantities of gas or long-term storage.
• Liquid Hydrogen - For large quantities of gas, long-term storage, low
electricity costs or applications requiring liquid hydrogen.
• Compressed Gas - For small quantities of gas, high cycle times or short storage
times.
• Metal Hydrides - For small quantities of gas.
Page 59 of 218
ENVIRONMENTAL CONSIDERATIONS
Emissions Of Greenhouse Gases And Air Pollutants
Hydrogen can be used with zero or near zero emissions at the point of use. When
hydrogen is burned in air, the main combustion product is H2O, with traces of NOx,
which can be controlled to very low levels. No particulates, CO, unburned
hydrocarbons or sulphur oxides are emitted. With hydrogen fuel cells, water vapour
is the only emission. Moreover, the total fuel cycle emissions of pollutants and
greenhouse gases, (such as CO2, which could contribute to global climate change)
can be much reduced compared to conventional energy systems.
Fuel cycle emissions are all the emissions involved in producing, transmitting, and
using an alternative fuel. For example, for hydrogen made from natural gas, there
would be emissions of CO2 and NOx at the hydrogen production plant, emissions
associated with producing electricity to run hydrogen pipeline compressors (the
nature of these emissions would depend on the source of electricity), and zero local
emissions if the hydrogen is used in a fuel cell. The more efficient the end-use device
(e.g. a fuel cell vehicle), the lower the fuel cycle emissions per unit of energy service
(e.g. emissions per mile travelled).
Various primary resources are considered for hydrogen production (natural gas,
biomass, coal, solar, wind and nuclear) and methanol production (natural gas,
biomass, coal). The effect of sequestration of carbon is shown for hydrogen
production from natural gas, biomass and coal.
If hydrogen is made from renewable energy sources such as biomass, solar or
wind, the fuel cycle greenhouse gas emissions are virtually eliminated. Emissions

Page 60 of 218
from electrolytic hydrogen production depend on the source of the low cost
electricity.
In cases such as Brazil, where the source is hydropower, greenhouse gas emissions
should be essentially zero. With biomass hydrogen and carbon sequestration, it
would be possible to have a net negative carbon balance: carbon would be removed
from the atmosphere. It would be possible to envision a future energy system based
on hydrogen and fuel cells with little or no emissions of pollutants or greenhouse
gases in fuel production, distribution or use.
Resource, Land and Water Use for Hydrogen Production
As mentioned above, there are a variety of primary sources which can be used to
make hydrogen. Over the next few decades and probably well into the next century,
fossil sources such as natural gas or coal may offer the lowest costs in many
locations, with small contributions from electrolysis powered by low cost
hydropower. In the longer term (or where locally preferred) renewable resources
such as wastes, biomass, solar or wind might be brought into use.

Page 61 of 218
Figure 2.7: Hydrogen Production, Transport, Storage and Utilization
Page 62 of 218
Home Power Hydrogen Fuel Cells
Hydrogen fuel cells are one of the most promising up-and-coming clean power
sources today. Fuel cells have been used for decades on NASA spacecraft, and other
types of fuel cells are currently in use for power generation at a variety of
commercial and industrial sites. Use of fuel cells in small system/home power
applications has so far been limited by cost considerations, but prices are falling and
fuel cells should emerge as a viable home power source within the next year or two.
What Is A Fuel Cell
In principle, a fuel cell operates like a battery. Unlike a battery, a fuel cell does not
run down or require recharging. It will produce energy in the form of electricity and
heat as long as fuel is supplied. A fuel cell consists of two electrodes sandwiched
around an electrolyte. Oxygen passes over one electrode and hydrogen over the
other, generating electricity, water and heat.
Hydrogen fuel is fed into the "anode" of the fuel cell. Oxygen (or air) enters the fuel
cell through the cathode. Encouraged by a catalyst, the hydrogen atom splits into a
proton and an electron, which take different paths to the cathode. The proton passes
through the electrolyte. The electrons create a separate current that can be utilized
before they return to the cathode, to be reunited with the hydrogen and oxygen in a
molecule of water.
A fuel cell system which includes a "fuel reformer" can utilize the hydrogen from
any hydrocarbon fuel - from natural gas to methanol, and even gasoline. Since the
fuel cell relies on chemistry and not combustion, emissions from this type of a system

Page 63 of 218
would still be much smaller than emissions from the cleanest fuel combustion
processes.
Figure 2.8: A Hydrogen Fuel Cell System
How Fuel Cells Work
A fuel cell consists of a central electrolyte layer, sandwiched between two catalyst
layers. Various materials for these layers are used, but the basic process is the same.
When a hydrogen atom contacts the negative anode catalyst layer, it splits into a
proton and an electron. The proton passes straight through the central electrolyte
layer, while the electron produces electricity as it passes through an external circuit.
The circuit returns the electrons to the positive side of the electrolyte layer, where
they bond again with the protons and join with an oxygen molecule, creating water
in the positive cathode catalyst layer.
The fuel cell itself can be roughly correlated to the alternator in a wind, hydro or
engine generator. The fuel cell itself is the mechanism that actually produces the
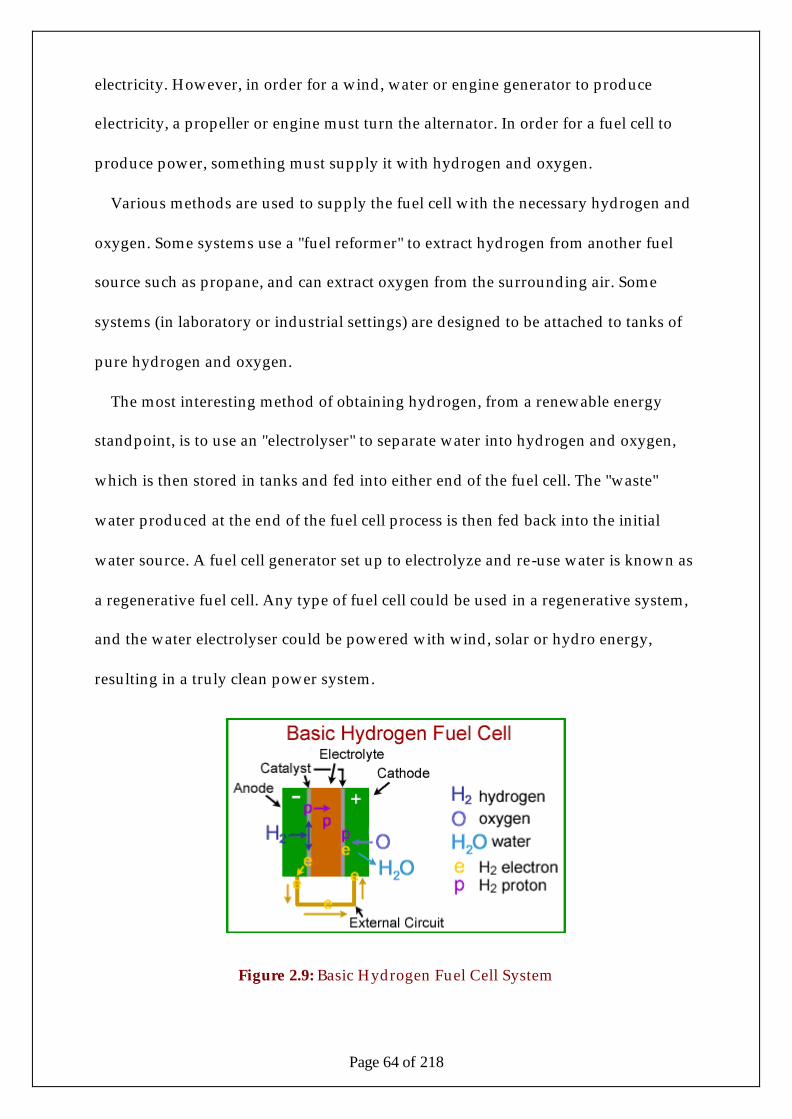
Page 64 of 218
electricity. However, in order for a wind, water or engine generator to produce
electricity, a propeller or engine must turn the alternator. In order for a fuel cell to
produce power, something must supply it with hydrogen and oxygen.
Various methods are used to supply the fuel cell with the necessary hydrogen and
oxygen. Some systems use a "fuel reformer" to extract hydrogen from another fuel
source such as propane, and can extract oxygen from the surrounding air. Some
systems (in laboratory or industrial settings) are designed to be attached to tanks of
pure hydrogen and oxygen.
The most interesting method of obtaining hydrogen, from a renewable energy
standpoint, is to use an "electrolyser" to separate water into hydrogen and oxygen,
which is then stored in tanks and fed into either end of the fuel cell. The "waste"
water produced at the end of the fuel cell process is then fed back into the initial
water source. A fuel cell generator set up to electrolyze and re-use water is known as
a regenerative fuel cell. Any type of fuel cell could be used in a regenerative system,
and the water electrolyser could be powered with wind, solar or hydro energy,
resulting in a truly clean power system.
Figure 2.9: Basic Hydrogen Fuel Cell System
Page 65 of 218
Types of Fuel Cells
Proton Exchange Membrane (PEM) fuel cells are currently being considered for
development of fuel cell powered cars, home power generators, and other small
applications. Instead of using a liquid electrolyte, they use a thin polymer membrane.
They operate in the range of 200º Fahrenheit, and can quickly vary power output
depending on current demand. Many companies are currently working to develop
commercially available, mass-produced PEM fuel cells.
Alkaline fuel cells have been used by NASA to provide power to spacecraft since
the 1960s. They use alkaline potassium chloride as their electrolyte. Alkaline fuel cells
can reach power generating efficiency of 70%, although their production costs have
long rendered them out of range for mass production. A few companies are currently
working on mass production techniques for these cells that would reduce their price
within range of commercial use.
Phosphoric Acid fuel cells are by far the most widely used type of fuel cell today.
They are primarily used for large back-up and remote power applications in
hospitals, schools and other locations where an engine generator would traditionally
be used. They operate in the 400º F range, and can reach 40% power generation
efficiency (much higher if by-product heat and steam are used for other purposes).
Phosphoric acid cells can also be used in large vehicles, such as buses and train
engines.
Solid Oxide fuel cells are currently being refined for optimum operation in high-
power industrial and utility applications. Operating efficiency could reach 60%, and
the use of a hard ceramic electrolyte allows operating temperatures to run as high as
1800º F.
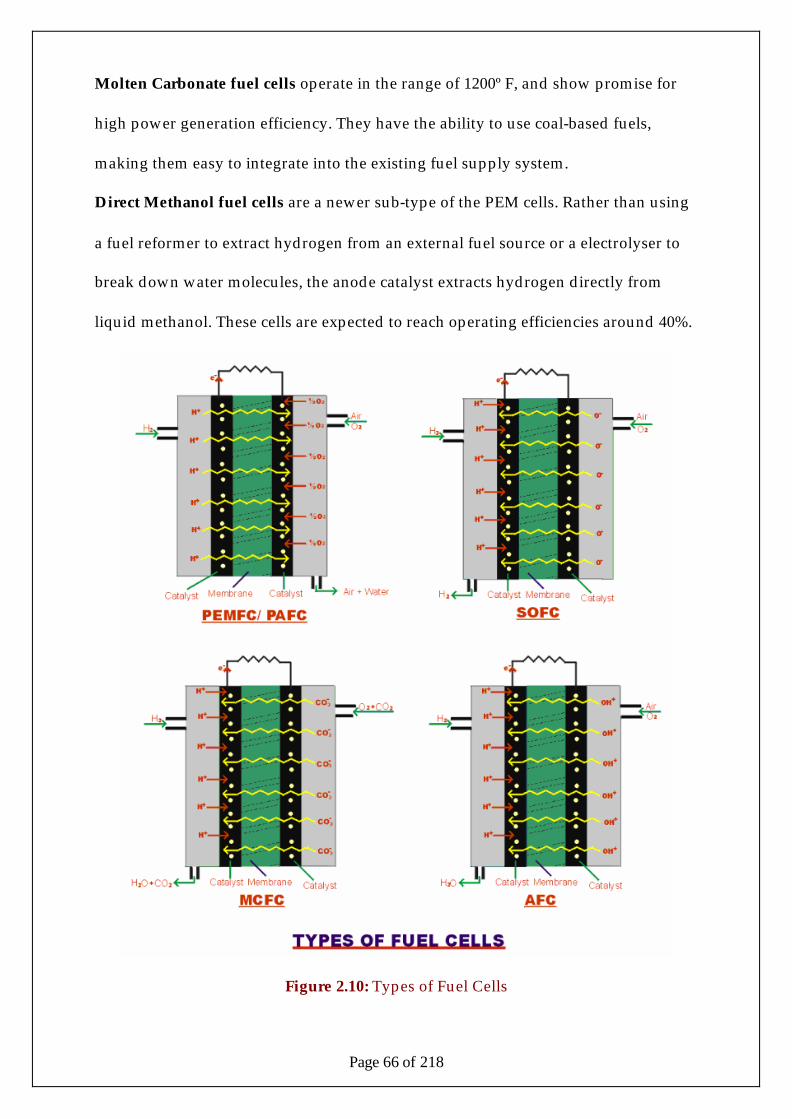
Page 66 of 218
Molten Carbonate fuel cells operate in the range of 1200º F, and show promise for
high power generation efficiency. They have the ability to use coal-based fuels,
making them easy to integrate into the existing fuel supply system.
Direct Methanol fuel cells are a newer sub-type of the PEM cells. Rather than using
a fuel reformer to extract hydrogen from an external fuel source or a electrolyser to
break down water molecules, the anode catalyst extracts hydrogen directly from
liquid methanol. These cells are expected to reach operating efficiencies around 40%.
Figure 2.10: Types of Fuel Cells
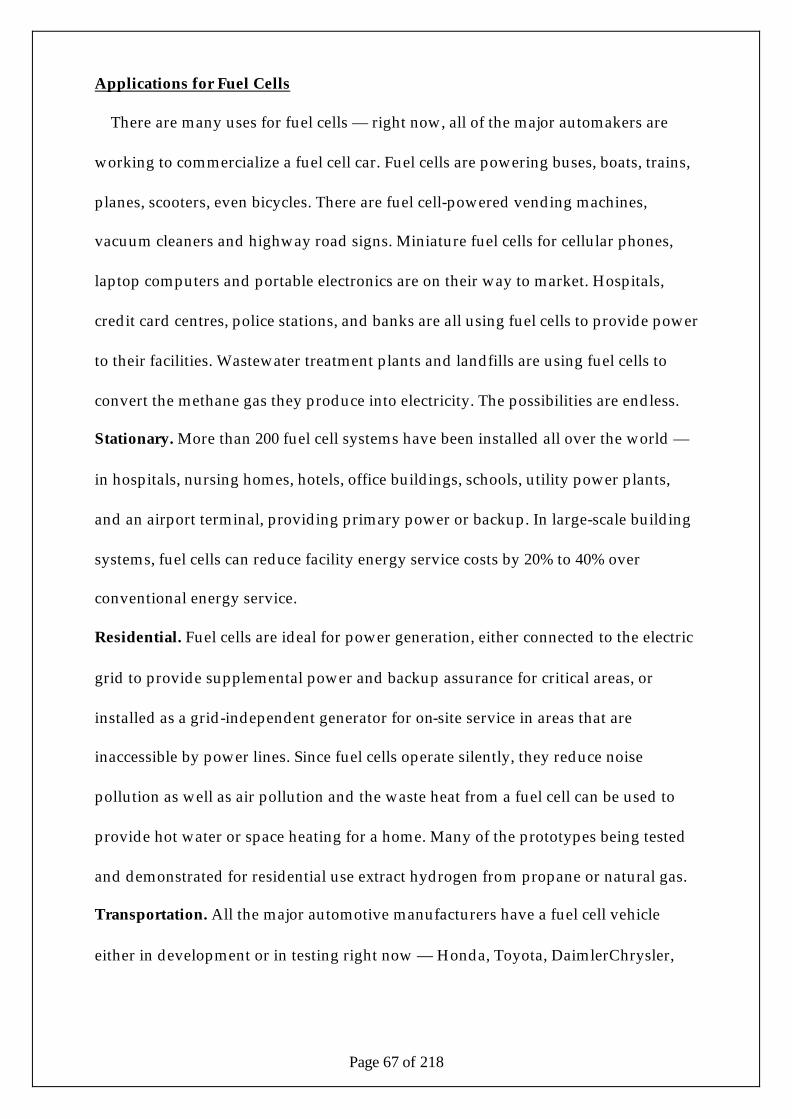
Page 67 of 218
Applications for Fuel Cells
There are many uses for fuel cells — right now, all of the major automakers are
working to commercialize a fuel cell car. Fuel cells are powering buses, boats, trains,
planes, scooters, even bicycles. There are fuel cell-powered vending machines,
vacuum cleaners and highway road signs. Miniature fuel cells for cellular phones,
laptop computers and portable electronics are on their way to market. Hospitals,
credit card centres, police stations, and banks are all using fuel cells to provide power
to their facilities. Wastewater treatment plants and landfills are using fuel cells to
convert the methane gas they produce into electricity. The possibilities are endless.
Stationary. More than 200 fuel cell systems have been installed all over the world —
in hospitals, nursing homes, hotels, office buildings, schools, utility power plants,
and an airport terminal, providing primary power or backup. In large-scale building
systems, fuel cells can reduce facility energy service costs by 20% to 40% over
conventional energy service.
Residential. Fuel cells are ideal for power generation, either connected to the electric
grid to provide supplemental power and backup assurance for critical areas, or
installed as a grid-independent generator for on-site service in areas that are
inaccessible by power lines. Since fuel cells operate silently, they reduce noise
pollution as well as air pollution and the waste heat from a fuel cell can be used to
provide hot water or space heating for a home. Many of the prototypes being tested
and demonstrated for residential use extract hydrogen from propane or natural gas.
Transportation. All the major automotive manufacturers have a fuel cell vehicle
either in development or in testing right now — Honda, Toyota, DaimlerChrysler,
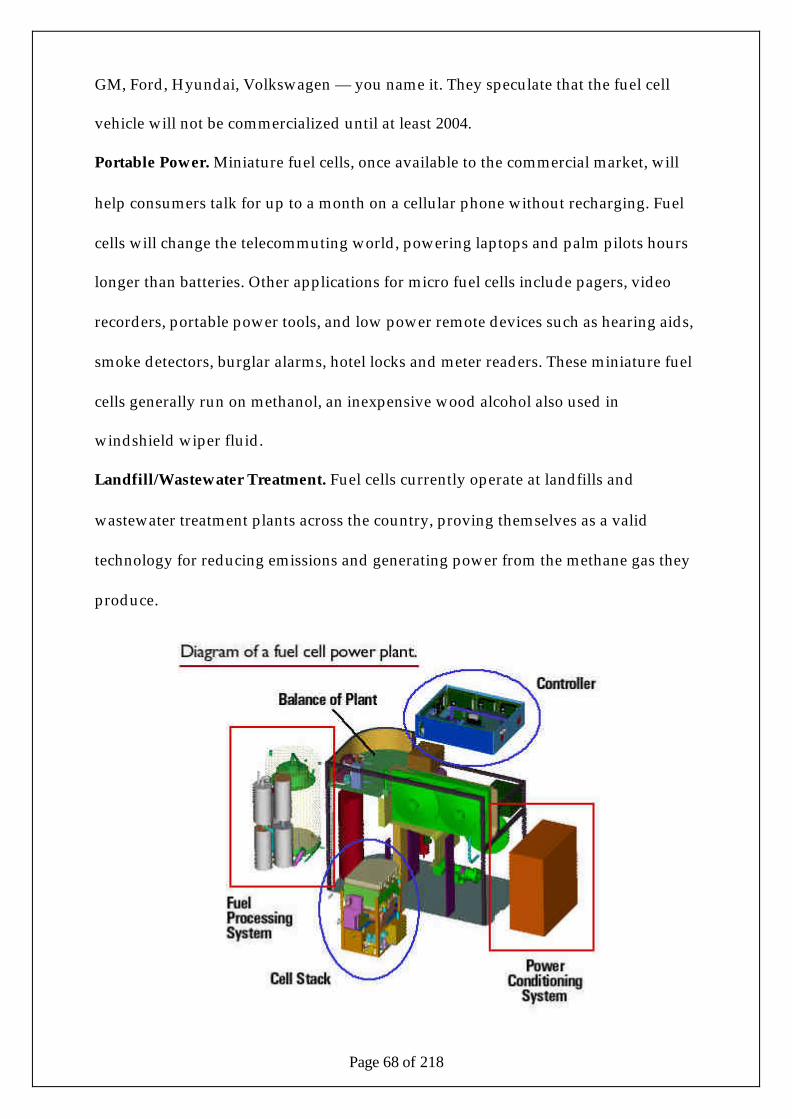
Page 68 of 218
GM, Ford, Hyundai, Volkswagen — you name it. They speculate that the fuel cell
vehicle will not be commercialized until at least 2004.
Portable Power. Miniature fuel cells, once available to the commercial market, will
help consumers talk for up to a month on a cellular phone without recharging. Fuel
cells will change the telecommuting world, powering laptops and palm pilots hours
longer than batteries. Other applications for micro fuel cells include pagers, video
recorders, portable power tools, and low power remote devices such as hearing aids,
smoke detectors, burglar alarms, hotel locks and meter readers. These miniature fuel
cells generally run on methanol, an inexpensive wood alcohol also used in
windshield wiper fluid.
Landfill/Wastewater Treatment. Fuel cells currently operate at landfills and
wastewater treatment plants across the country, proving themselves as a valid
technology for reducing emissions and generating power from the methane gas they
produce.
Page 69 of 218
Figure 2.11: A Fuel Cell Power Plant
Fuel Cell Engineering Benefits
Figure 2.12: How a Fuel Cell Works
Fuel Flexibility
Fuel cells are capable of operating on hydrogen, or hydrogen reformed from any of
the common fossil fuels available today.
High Power Densities
The amount of power a fuel cell can generate within a given volume is usually
given in kWh/liter. These numbers continue to rise as manufacturers continue
research and development on their respective products.
Low Operating Temperatures and Pressures
Fuel cells operate at 80o C to over 1,000o C, depending on the type of fuel cell.
These numbers might seem high, but the temperature inside your vehicle's internal
combustion engine can reach over 2,300o C.
Page 70 of 218
Site Flexibility
Fuel cells, with their inherently quiet operation, zero to minimal emissions and
reduced permitting requirements, can be located in a variety of areas, both
residential and commercial, inside and outside.
Cogeneration Capability
When the waste heat from the fuel cell's electrochemical reaction is captured, it can
be utilized for water, space heating and cooling. With cogeneration capabilities the
efficiencies achieved by a fuel cell system approach 90%.
Quick Response to Load Variations
To receive additional energy from a fuel cell, more fuel is introduced into the
system. Fuel cell load response is analogous to depressing the gas pedal in your
vehicle, more fuel more power.
Engineering Simplicity
Fuel cells do not contain any moving parts. The lack of movement allows for a
simpler design, higher reliability's, quite operation and a system that is less likely to
fail.
Independence from the Power Grid
A residential fuel cell system allows people to become independent of the brown
outs, power failures and voltage irregularities that are commonplace when connected
to the utility grid. Any one of these common power disruptions can damage sensitive
computer systems, electronic equipment and the quality of life people desire to have.
Reliable energy in areas that are subjected to weather related power outages.
Page 71 of 218
Advantages and Uses of Fuel Cells
A fuel cell would be of most use in one of two ways. For individuals with an
existing solar, wind or hydro power system, the fuel cell could be used for backup
power in place of an engine generator. Given that an engine generator operates at
approximately 30% efficiency and the least efficient fuel cell currently offers 40%
efficiency (up to 80-90% if by-product heat and/or steam are used for other heating
needs), the advantage is clear. When you also consider that the fuel cell will operate
silently, with no waste products in regenerative systems and minimal waste in
others, the fuel cell comes out a clear winner.
For individuals without an existing alternative energy system, a larger capacity
fuel cell could comprise their primary power system. Since a fuel cell can produce
power on demand, as long as hydrogen is available, there is no need for storage
batteries if the fuel cell generator is large enough to support the electrical system in
question. A wind turbine and/or solar panels could be added to power the water
electrolyser or fuel reformer, and the entire power system would be virtually self-
contained.
Fuel Cells vs. Traditional Batteries
Fuel cells offer a reduction in weight and come in a compact package for the same
amount of available energy when compared to batteries.
To increase the power in a fuel cell, more fuel is introduced into the system. To
increase the power of a battery, more batteries have to be added increasing the cost,
weight and complexity of the system.
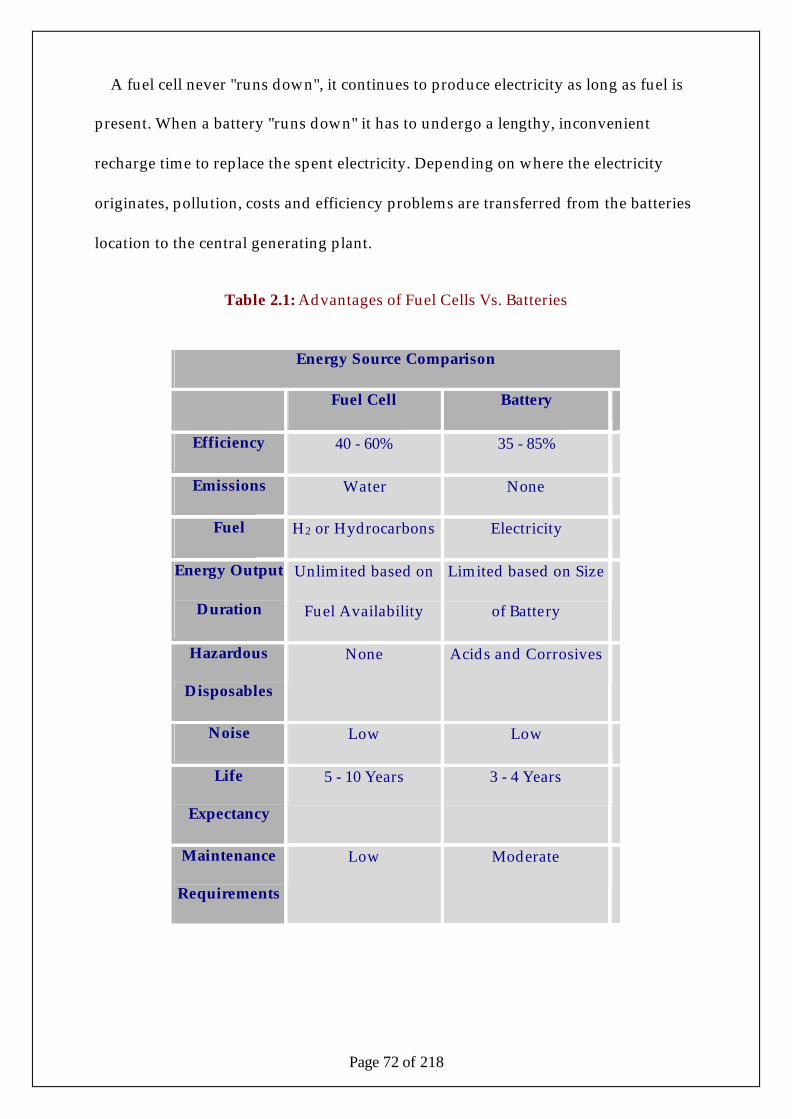
Page 72 of 218
A fuel cell never "runs down", it continues to produce electricity as long as fuel is
present. When a battery "runs down" it has to undergo a lengthy, inconvenient
recharge time to replace the spent electricity. Depending on where the electricity
originates, pollution, costs and efficiency problems are transferred from the batteries
location to the central generating plant.
Table 2.1: Advantages of Fuel Cells Vs. Batteries
Energy Source Comparison
Fuel Cell Battery
Efficiency 40 - 60% 35 - 85%
Emissions Water None
Fuel H2 or Hydrocarbons Electricity
Energy Output
Duration
Unlimited based on
Fuel Availability
Limited based on Size
of Battery
Hazardous
Disposables
None Acids and Corrosives
Noise Low Low
Life
Expectancy
5 - 10 Years 3 - 4 Years
Maintenance
Requirements
Low Moderate
Page 73 of 218
Basic Battery Information
Batteries are devices that translate chemical energy into electricity. But that simple
definition greatly understates the pervasive role of batteries in our life. Batteries are
an efficient way to make electricity portable. In addition, batteries provide power to
replace electricity from the utility electrical grid for a variety of critical functions. As
the world becomes increasingly addicted to electricity and mobility batteries play an
ever greater role in all aspects of our life.
Batteries are an integral part of any automotive, RV, marine or home power
electrical system. Since most people are fairly familiar with automotive batteries, we
will concentrate on deep-cycle power storage batteries used in home power, RV and
marine applications, with brief comparisons between deep-cycle and automotive
batteries.
Battery Capacity
Battery capacity is a primary concern in home power systems. The storage battery
bank must have enough storage capacity to meet power needs between charging
cycles. Making sure the battery storage capacity is about double the power that
would be used in a normal use day is a good minimum.
Home power (deep cycle) batteries are generally measured in "amp-hour" capacity.
One amp-hour is equal to one amp of power drawn for one hour of time. Amp-hour
capacity is generally given as the "20 hour rate" of the battery. Therefore, the number
given as the amp-hour capacity for a deep cycle battery will be the number of amp-
hours the battery can deliver over a 20 hour period at a constant draw. A 105 amp-
hour battery can deliver 5.25 amps constantly over a 20 hour period before its voltage
drops below 10.5 volts, at which point the battery is discharged.
Page 74 of 218
Types of Batteries
Lead Acid Automotive Batteries
Automotive batteries are designed to deliver a relatively high amount of current in
a short period of time, but should never be heavily discharged. An automotive
battery plate is very porous (like a slice of Swiss cheese), to maximize surface area
and enable the sudden high current output. Because home power systems require
repeated deep discharges of stored power, automotive batteries are largely useless
for these applications.
Lead Acid Deep Cycle Batteries
Deep cycle batteries are designed to have a large amount of their stored current
discharged between charging sessions, with very heavy non-porous battery plates to
withstand repeated major discharging and charging cycles (deep cycles). They are
generally useless for delivering the sudden surges of power needed from automotive
batteries.
1. RV/Marine Batteries are usually 12 volt, and available in a variety of
capacities up to 100 amp-hours. They can be found in "sealed" or standard
serviceable types, and are commonly used in small home power or portable
power applications. RV/Marine batteries are generally small, compact and
easy to handle and install. They are relatively inexpensive, and the sealed type
batteries are non-spillable and safer for indoor applications.
However these batteries are not designed for very heavy cycling (as is found
in a home power system), so their life-spans are often shorter than other types
of deep cycle batteries. Sealed batteries are also very sensitive to overcharging,

Page 75 of 218
which may further shorten their useful lifespan. Also, in order to obtain more
than 100 amp-hours of storage capacity, multiple batteries must be attached in
parallel, which is less efficient than using a single, higher capacity battery
2. Golf Cart Batteries have capacities in the 220-300 amp-hour range, and are
generally 6 volt. They are well suited to small to medium home power
systems. They are designed for deep discharge cycles, so they will tend to
have longer lifespan and better performance in a residential alternative energy
system. They are still relatively light weight, but are generally cheaper per
amp-hour than RV type batteries. They are also less sensitive to mild
overcharging.
However since most home power systems are 12 volt, two 6 volt batteries
must be connected in series, which is a bit more complicated than connecting a
single battery. Since golf cart batteries are unsealed, they need to be stored in a
well ventilated area and will require periodic water replacement. Their amp-
hour capacity is also too limited to be of use in a large power system.
3. Industrial/Stationary Batteries are normally manufactured as individual 2
volt units, which are then combined to create the necessary voltage for the
power system. (Six for 12 volt systems, twelve for 24 volt systems) They're
available in a wide variety of capacities, up to 3000 amp-hours. A very high
amp hour capacity can be obtained with a single six cell set, so charging
characteristics are very stable. Industrial batteries will have the longest

Page 76 of 218
average lifespan under deep cycling home power conditions.
However due to their extremely high amp-hour capacities, industrial battery
sets will have a significantly higher initial cost. These batteries can also weigh
up to 350 lbs. per two volt cell, so they will need to be stored in a well
supported area, contained in a rigid external box, and will likely require
special transporting assistance.
Nickel Alloy Batteries
Nickel Cadmium (NiCad) and Nickel Iron batteries, rather than consisting of lead
plates submerged in a sulphuric acid solution, feature nickel alloy plates in an
alkaline solution. They are also well suited for home power use, but are much less
common and much more expensive than lead acid types.
A nickel alloy battery can have up to 50 years of useful life, compared to 20 years
with a well-maintained lead acid battery. They can also sit for extended periods of
time partially or fully discharged without suffering damage, unlike lead acid types.
They are lower maintenance, and can be completely discharged repeatedly without
suffering damage. A lead acid battery should never be completely discharged,
meaning they need to be more closely monitored. Nickel alloy batteries operate
better at lower temperatures, and can discharge more of their total amp-hour
capacity as useful current.
Despite all these advantages, the higher initial cost of the batteries is prohibitive.
Also, nickel alloy batteries are harder to dispose of when they finally become
Page 77 of 218
unchangeable. Their unique charging voltage range can also create compatibility
problems with battery management and charging equipment.
How Batteries are used in Home Power
A storage battery bank is what enables a home power system to deliver a constant
level of power to the electrical system. Without storage batteries, the entire electrical
system would be limited by the immediate output of the alternative energy
generators. At night, a solar-run house would have no electrical power available to
turn on interior lights. A wind-powered system would be subject to constant power
fluctuations as the wind speed increased, dropped or disappeared entirely.
By running the output of renewable power generators through charge controllers
and into a battery bank, power can be available 24 hours a day, regardless of
weather. Solar panels or wind generators can deliver power to the battery bank
regardless of current power usage, so excess power can be stored during low use
times (generally the middle of the day and middle of the night) and be available
during high use times (usually morning and evening).
Batteries supply DC power, so if power is needed for an AC power system or a
mixed AC/DC system, the battery power will need to be run through an inverter to
change 12VDC or 24VDC power into 120VAC household current.
Basic Lead Acid Battery Function
Lead acid batteries are by far the most common type of power storage battery in
use today. A fully charged lead acid battery undergoes a chemical reaction when
attached to an electrical load, which releases stored energy from the battery. All lead
acid batteries consist of the following components:
Page 78 of 218
• A positive plate, composed of lead dioxide (PbO2)
• A negative plate, composed of "sponge" lead (Pb)
• An electrolyte solution of sulphuric acid (H2SO4) and distilled water (H2O)
When the battery discharges current, the sulphate (SO4) in the electrolyte
combines with lead from the plates to form lead sulphate deposits (PbSO4). After
repeated or extended discharge, the sulphate content of the electrolyte becomes
increasingly "bound" in the lead sulphate deposits and can no longer be used to
create electric current. The battery becomes discharged when too much of the
electrolyte sulphate is depleted.
Over time, in a non-sealed battery, the water content of the electrolyte solution will
drop due to evaporation during discharge. This leads to excessive acid concentration,
which raises the resistance of the battery. Periodic checking and refilling of the fluid
level in an unsealed battery is essential to its proper functioning.
When a discharged battery is recharged, the majority of the lead sulphate is broken
down and the sulphate returns to the electrolyte where it is once again available to
create electricity. However, over time a sulphate residue builds up on the battery
plates and begins to crystallize. As more of the sulphate becomes locked in the
crystallized residue, the battery capacity and ability to be recharged declines until the
battery finally "dies."
With deep cycle batteries, the sulphate crystals simply "insulate" the battery plates
from the remaining weakened electrolyte, preventing the chemical reactions needed
to produce current. In automotive batteries, with their thin, porous plates,
crystallization will actually cause the plates to break apart, permanently destroying
the battery.
Page 79 of 218
Battery Charging & Maintenance
In an alternative energy system, battery charging is usually accomplished through
charge controllers attached to the various power generators. A good quality charge
controller will use a three stage, pulse width modulated charging system. This allows
the battery to receive the highest charging current during the bulk stage of charging,
with a second lower absorption level to bring the charge to maximum voltage, and a
third "float" charging current to maintain the battery charge. A good quality charge
controller will maximize charging efficiency and minimize lead sulphate build up,
increasing the battery's useable lifespan.
Lead acid batteries will lose their charge if they are left unused for an extended
period of time. If an automotive or deep cycle battery goes unused for a month or
longer, it should be outfitted with a charge maintainer or "trickle charger" (if the
deep-cycle battery is not attached to a three-stage charge controller). Solar panels are
available for this purpose, and will deliver a low level of current to the battery while
exposed to sunlight. For batteries or vehicles stored indoors, plug-in charge
maintainers are also available.
Sulphate crystallization in batteries can be slowed or reversed by the use of battery
pulse conditioners. Lead sulphate can be more effectively removed, and negative
battery plates better maintained if battery voltage periodically reaches 2.5 volts per
cell. (15v for a 12v battery, 30v for a 24v, etc.) A pulse conditioner will deliver
periodic brief pulses of higher current to the battery, causing the sulphate residue to
be released back into the electrolyte and maximizing the lifespan and performance of
the battery.

Page 80 of 218
CHAPTER 3
House Energy Consumption
Before we start calculating the heat losses and the energy consumption of the
house we had first to decide the site that the house will be placed. By using NASAs
surface meteorology and solar energy data we wanted to find a place in UK that it
will have the highest solar insolation per month, the highest average monthly
temperature and the highest wind velocity per month. After careful consideration for
the desired parameters we conclude that the best site in UK that fulfils all the criteria
that we have settled was in the area of Cornwall. Cornwall is England's south-
westernmost county.
Figure 3.1: Chosen Place for Calculations
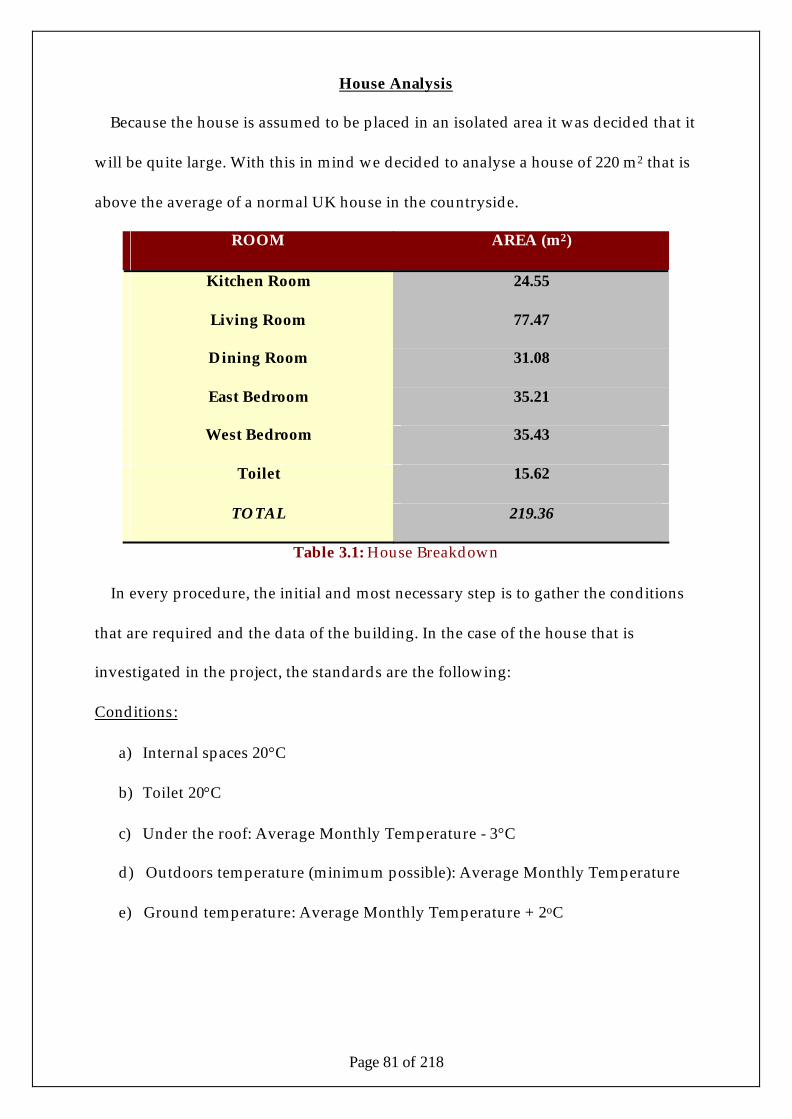
Page 81 of 218
House Analysis
Because the house is assumed to be placed in an isolated area it was decided that it
will be quite large. With this in mind we decided to analyse a house of 220 m2 that is
above the average of a normal UK house in the countryside.
ROOM AREA (m2)
Kitchen Room 24.55
Living Room 77.47
Dining Room 31.08
East Bedroom 35.21
West Bedroom 35.43
Toilet 15.62
TOTAL 219.36
Table 3.1: House Breakdown
In every procedure, the initial and most necessary step is to gather the conditions
that are required and the data of the building. In the case of the house that is
investigated in the project, the standards are the following:
Conditions:
a) Internal spaces 20°C
b) Toilet 20°C
c) Under the roof: Average Monthly Temperature - 3°C
d) Outdoors temperature (minimum possible): Average Monthly Temperature
e) Ground temperature: Average Monthly Temperature + 2oC

Page 82 of 218
Figure 3.2: Diagram of the House
Building elements
The main entrance is preferably made of wood material and its size is larger than
the internal doors (1m x 2.1m). There are a total of seven windows, six of the same
size and a smaller one (toilet), which is double-glassed with wooden frame (3.38m x
1.2m and 2.05m x 0.73m for the toilet).
The external surfaces of the house are extremely well thermo insulated, in order to
minimise the heat losses. These surfaces are the ceiling, the floor and the external
walls, which consist of more than one material. The final dimensions and the
material used for each of those cases are plotted in the table 1 of the appendix.

Page 83 of 218
Heat Losses
Heat loss from a building occurs by a number of mechanisms. Some important
factors which affect the rate at which this heat is lost are listed here and summarised
below:
• Insulation of building
• Area of the external shell
• Temperature difference
• Air change rate
• Exposure to climate
• Efficiency of services
• Use of building
Insulation of shell
The heat loss from a building decrease as the insulation of the external fabric of the
building is increased. The external parts of the structure surrounding occupied areas
need most consideration but all buildings which are heated, for whatever purpose,
should be well insulated in order to save energy. The thermal transmittance
coefficient, the U-value, of a construction is a commonly used measure of insulation.
Area of the shell
The greater the area of external surfaces the greater is the rate of heat loss from the
building. A terraced house loses less heat than a detached house of similar size. The
basic plan shape of a building is one of the first design decisions to be made,
although choices may be restricted by the nature of the site and by local regulations.

Page 84 of 218
Temperature difference
A large difference between the temperature inside and outside the building
increases the rate of heat lost by conduction and ventilation. This loss is affected by
the design temperature of the inside air, which depends upon the purpose of the
building.
Air change rate
Warm air leaving a building carries heat and is replaced by colder air. The air flow
occurs through windows, doors, gaps in construction, ventilators and flues. The rate
of air change is also affected by effects of wind upon the building.
Exposure to climate
When a wind blows across a wall or roof surface, the rate of heat transfer through
that element increases. This effect is included in the standard value of external
surface resistance used in calculating a U-value. Standard surface resistances are
available for three types of exposure listed below:
• Sheltered: buildings up to three storeys in city centres
• Normal: most suburban and country buildings
• Severe: buildings on exposed hills or coastal sites
Efficiency of services
There is usually some wastage of heat energy used for water heating and space
heating, and the design of the services can minimise or make use of this waste heat.
Use of building
The numbers of hours per day and the days per year that a building is used have a
large effect on the energy consumption of a building. Many buildings which are
unoccupied at times, such as nights, need to be pre-heated before occupancy each
morning.
Page 85 of 218
These patterns of building use and occupancy vary greatly, even for similar
buildings. When a building has separate areas with different patterns of occupancy,
each part needs to be considered as a separate building for heating calculations.
Calculation of heat loss
Various methods are available for calculating the rate at which heat flows out of a
building and the quantity of heat loss in a given time. It is relatively difficult to
calculate heat losses for unsteady or cyclic conditions where temperatures fluctuate
with time. However, certain simplified calculations can be used for predicting
heating requirements and the amount of energy required. The results obtained by
these calculations are found to give adequate agreement with the conditions that
actually exist.
With steady state conditions the temperatures inside and outside the building do
not change with time and the various flows of heat from the building occur at
constant rates. Assuming steady state conditions the heat losses from a building can
be classes as either a ‘fabric loss’ or a ‘ventilation loss’ and then calculated by the
methods described below.
Fabric heat loss
Fabric heat loss from a building is caused by the transmission of heat through the
materials of walls, roofs and floors. Assuming steady state conditions, the heat loss
for each element can be calculated by the following formula:
Pf = U*A*DT*(1 + ZD + ZΠ)
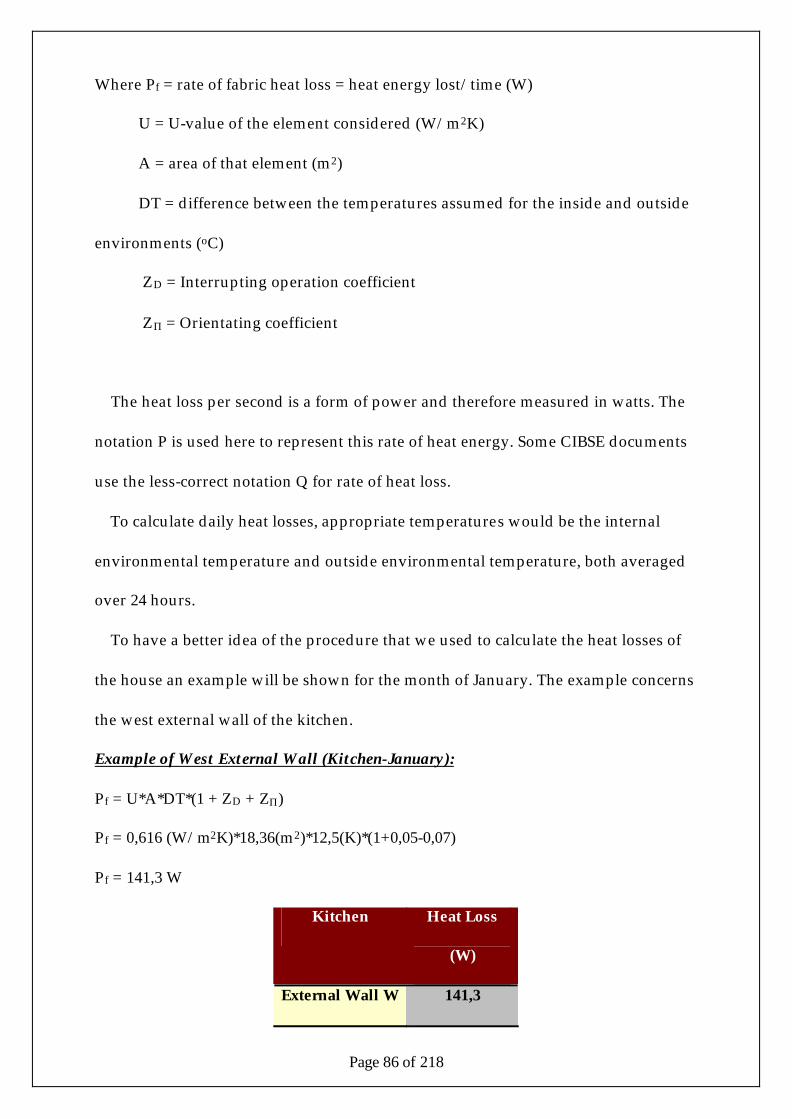
Page 86 of 218
Where Pf = rate of fabric heat loss = heat energy lost/time (W)
U = U-value of the element considered (W/m2K)
A = area of that element (m2)
DT = difference between the temperatures assumed for the inside and outside
environments (oC)
ZD = Interrupting operation coefficient
ZΠ = Orientating coefficient
The heat loss per second is a form of power and therefore measured in watts. The
notation P is used here to represent this rate of heat energy. Some CIBSE documents
use the less-correct notation Q for rate of heat loss.
To calculate daily heat losses, appropriate temperatures would be the internal
environmental temperature and outside environmental temperature, both averaged
over 24 hours.
To have a better idea of the procedure that we used to calculate the heat losses of
the house an example will be shown for the month of January. The example concerns
the west external wall of the kitchen.
Example of West External Wall (Kitchen-January):
Pf = U*A*DT*(1 + ZD + ZΠ)
Pf = 0,616 (W/m2K)*18,36(m2)*12,5(K)*(1+0,05-0,07)
Pf = 141,3 W
Kitchen Heat Loss
(W)
External Wall W 141,3

Page 87 of 218
Window S 164,8
External Wall S 204
Floor 128,9
Ceiling 123,7
TOTAL 777,9
Table 3.2: Heat Losses from Kitchen
ROOM Heat Loss
(W)
Kitchen 777,9
Living Room 1983,1
Dining Room 693,3
West Bedroom 1057,5
Toilet 289,9
East Bedroom 1033,6
TOTAL 5835,3
Table 3.3: Heat Losses from the House
Ventilation loss
Ventilation heat loss from a building is caused by the loss of warm air and its
replacement by air that is colder and has to be heated. The rate of heat loss by such
ventilation or infiltration is given by the following formula:
Pv = (cv*N*V*DT)/3600
Where Pv = rate of ventilation heat loss = heat energy/time (W)
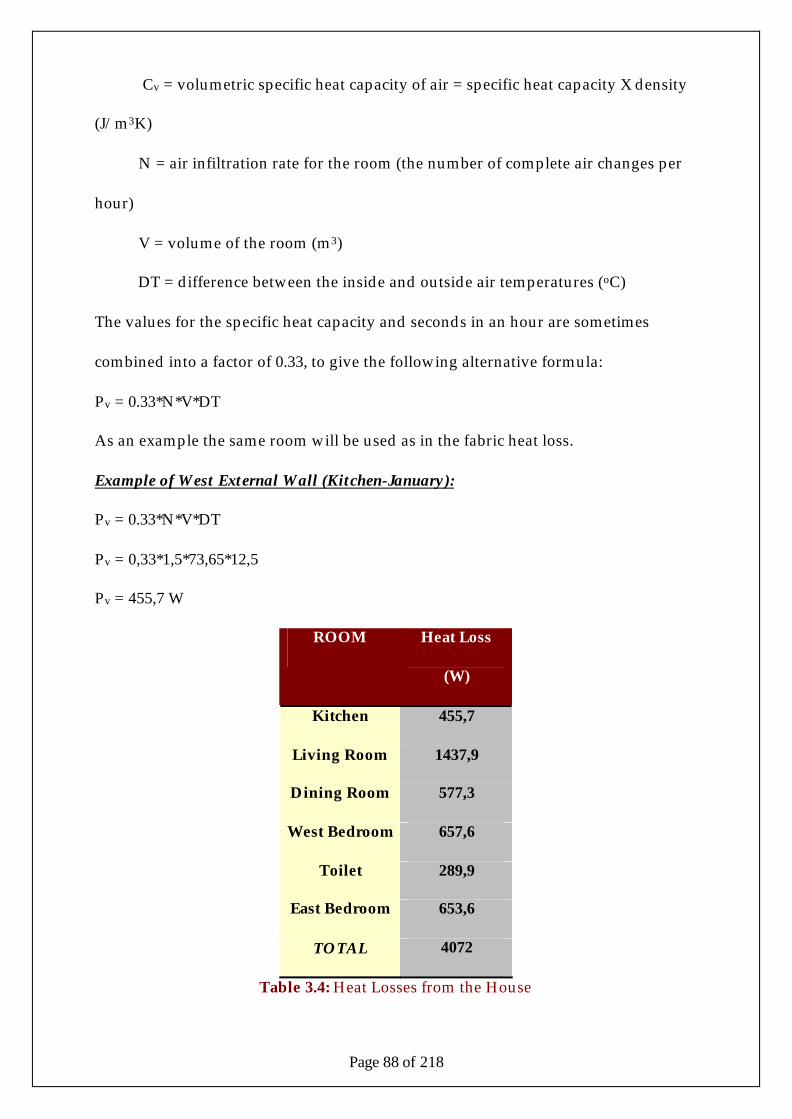
Page 88 of 218
Cv = volumetric specific heat capacity of air = specific heat capacity X density
(J/m3K)
N = air infiltration rate for the room (the number of complete air changes per
hour)
V = volume of the room (m3)
DT = difference between the inside and outside air temperatures (oC)
The values for the specific heat capacity and seconds in an hour are sometimes
combined into a factor of 0.33, to give the following alternative formula:
Pv = 0.33*N*V*DT
As an example the same room will be used as in the fabric heat loss.
Example of West External Wall (Kitchen-January):
Pv = 0.33*N*V*DT
Pv = 0,33*1,5*73,65*12,5
Pv = 455,7 W
ROOM Heat Loss
(W)
Kitchen 455,7
Living Room 1437,9
Dining Room 577,3
West Bedroom 657,6
Toilet 289,9
East Bedroom 653,6
TOTAL 4072
Table 3.4: Heat Losses from the House

Page 89 of 218
Total Heat Loss from Fabric + Ventilation (January)
House Heat Loss
(W)
Fabric Loss 5835,3
Ventilation Loss 4072,0
TOTAL 9977,4
Table 3.5: Total Losses from the House
As we can see the total energy that we have to supply to the house is 9,97 kW for
keeping it in a comfortable state. If we assume that we want to keep this state for
specific hours per day (assume 10h) then the total daily energy consumption should
be 99,77 kWh for the January. With the same way we have analysed the energy
consumption of the house for the whole year.
Average Daily Monthly
MONTHS Energy Consumption (kWh) Energy Consumption (kWh)
January 99,77 2993,1
February 99,77 2993,1
March 91,69 2750,7
April 83,71 2511,3
May 63,76 1912,8
June 47,95 1438,5
July 35,82 1074,6
August 35,82 1074,6
September 47,95 1438,5
October 63,76 1912,8

Page 90 of 218
November 83,71 2511,3
December 91,69 2750,7
Household Total kWh 25362,0
Total Cost per year (£) 1724,6
Total CO2 per year (kg) 11070,5
Table 3.6: Daily and Monthly Energy Consumption from the House

Page 91 of 218
Appliances consumption
Electrical Load Calculation
Before we start evaluating the components for a home power system, we need to
know how much power we use. By taking an inventory of all the electrical loads in
the house, and doing a basic electrical load evaluation, we can get a good idea how
much power the system needs to produce. If we are designing our power system
before building the home, we will need to carefully plan what appliances and
electrical systems will be using.
List All Electrical Appliances
First, we will need to make a list of everything in the home that uses electricity (or
every appliance we plan to have in your home). For the purposes of this evaluation,
all these items will be called appliances. Besides the obvious items like televisions,
refrigerators and microwaves, appliances we may not immediately think must also
be included.
Appliances that are only used occasionally, such as power tools, must be included
to correctly assess necessary system surge capacity (unless such items will be
powered directly off a generator).
Determine Power Draw for Each Item
For each appliance listed, the wattage should be noted, as well as whether it runs
on AC or DC current. If wattage information cannot be found on the product
labelling or in the manual, amperage and voltage should be noted instead. Most
household appliances will run on 115 volt AC power, but some major appliances
require 220 VAC instead. The voltage requirements of AC appliances should be
easily determined. For DC appliances, the voltage should match whatever DC

Page 92 of 218
system voltage is (or will be), whether 12V, 24V, or more rarely, 32 or 48V. For the
final load calculation, we should obtain specific information from appliance labels
and/or manuals wherever possible.
Estimate Appliance Usage Time
For each appliance, we should estimate how many hours per day the appliance is
used. A refrigerator may be used seven days a week, but on average the refrigerator
motor only runs up to 1/2 of the time, depending on the temperature settings and
how warm the house is kept. That would be 12 hours/day. For a clock radio, it
would be 24 hrs. A microwave may have a very large wattage rating, but may only
be used for 1/2 hour or less per day.
For appliances we only use occasionally (1/2 hour or less per week, total), use 0.1
as your hours per day. This may lead to a slightly high estimation, but when in
doubt, always estimate high. It's far better to have a slightly larger system than you
need, than to have a system that regularly shuts down due to overloads.
In the following table we can see the total energy consumption that each room
consumes in a period of one year. By taking into consideration that a kWh costs 0,068
pounds the total cost of energy will be 735,59 pounds per year.
Total Household Consumption
Room Total kWh per year
(from other tables)
Living Room 1057,07
Kitchen 5865,55
Main Bedroom or Office 975,40
Number of other bedrooms 2,00
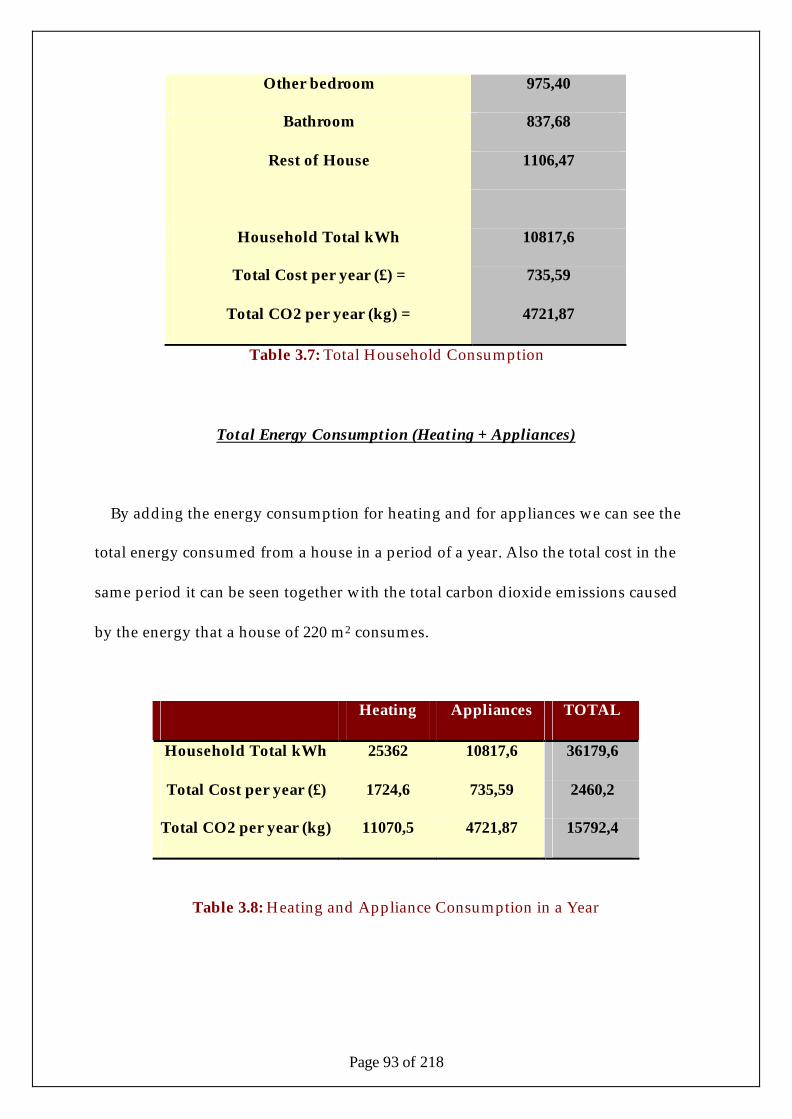
Page 93 of 218
Other bedroom 975,40
Bathroom 837,68
Rest of House 1106,47
Household Total kWh 10817,6
Total Cost per year (£) = 735,59
Total CO2 per year (kg) = 4721,87
Table 3.7: Total Household Consumption
Total Energy Consumption (Heating + Appliances)
By adding the energy consumption for heating and for appliances we can see the
total energy consumed from a house in a period of a year. Also the total cost in the
same period it can be seen together with the total carbon dioxide emissions caused
by the energy that a house of 220 m2 consumes.
Heating Appliances TOTAL
Household Total kWh 25362 10817,6 36179,6
Total Cost per year (£) 1724,6 735,59 2460,2
Total CO2 per year (kg) 11070,5 4721,87 15792,4
Table 3.8: Heating and Appliance Consumption in a Year
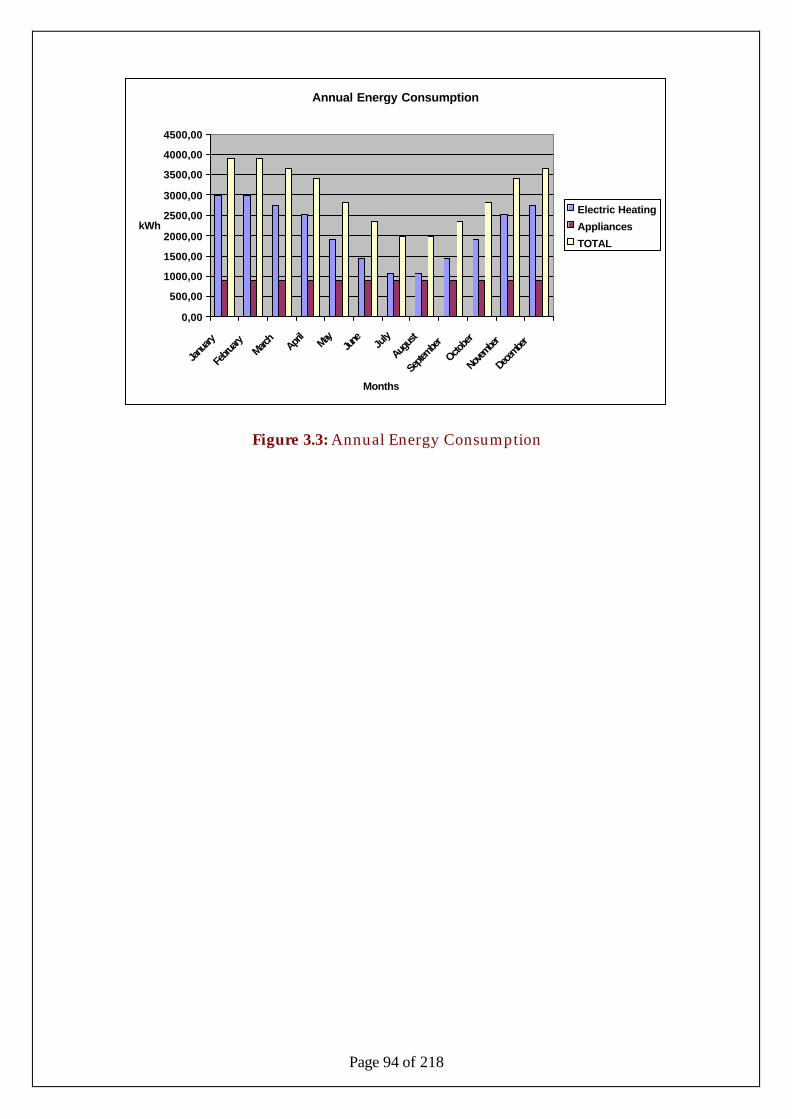
Page 94 of 218
Annual Energy Consumption
0,00
500,00
1000,00
1500,00
2000,00
2500,00
3000,00
3500,00
4000,00
4500,00
Janu
ary
Febru
ary
March
April
MayJu
ne July
Augus
t
Septe
mber
Octobe
r
Novem
ber
Decem
ber
Months
kWhElectric Heating
Appliances
TOTAL
Figure 3.3: Annual Energy Consumption
Page 95 of 218
CHAPTER 4
Site Analysis
Site analysis can come before or after our electrical load evaluation, but we'll need
both analyses done before we start sizing and designing our renewable energy
system.
Solar Site Analysis - Find Our Average Insolation
For a solar power system, the first question to ask is, "Do we have a place to install
our solar panels?" This isn't quite as obvious as it may seem. A solar panel's output
can be seriously reduced by even a single shadow from a single tree branch, and the
direction the panels face also affects their output. Ideally, we need to find an area to
install our solar panels where they can all face towards the equator ('solar south' for
the northern hemisphere, 'solar north' in the southern hemisphere), and be
completely unshaded at least from 9am to 3pm, if not for the entire day.
If we're lucky enough that our roof peak runs east-west, we can install the panels
directly on the equatorial side of our roof, with perhaps some compensating framing
to tilt them at the proper angle. If our roof won't cooperate, see if there's an area in
our yard that remains shade-free through the middle of the day. If not, are we able to
clear trees or obstructions to create a shade free mounting area? If we live in a snowy
region, and need to have power from our panels all year-round, we should also make
sure our panels will be located where we can easily clear snow from their surface
when needed.
After we find a good location for our solar panels, we'll need to determine how
much solar energy our location will gather on an average day, the "insolation" for our
location.

Page 96 of 218
If we're using our solar array to power a seasonal vacation home, we can
concentrate on the figures given for the season we spend at the home. If we plan on
using a solar-only power system all year-round, use the lowest insolation figures for
our location. If our system can support our needs during the least-sunny months, we
should be doing great the rest of the year, with a little power left over for house fans
during the sunniest months!
Wind Site Analysis - Average Wind Speed for Our Site
For a wind power installation, the basic considerations are the same as solar:
resource availability (wind speed instead of insolation of course) and the availability
of a good installation location. A wind turbine must be installed far enough from any
obstructions that it will a) not damage anything with its rotor blades, and b) receive
an unobstructed wind stream. This generally means we must be able to install a very
high tower on our property, or attach a tower to our house. If we don't have the
room on our property, or don't own our own home, it may be best to wait until we
can relocate to install a wind turbine system.
One major manufacturer recommends mounting our wind turbine at least 25' (8m)
taller than any obstacles (telephone poles, trees, buildings, etc.) within 500' (150m) of
the tower. The more clearance the turbine has, the less wind turbulence will interfere
with its power output. Depending on the type of tower we're installing our turbine
on, we may also need to determine clearance for tower support wires. Generally
speaking, the taller our turbine mounts the more wind our turbine will get. The
height of our tower is really only restricted by our available installation area.
Once we find a good location on our site, we'll need to find out how much wind
we can expect throughout the year. Whether we have frequent gusting winds or

Page 97 of 218
relatively constant but slow wind throughout the year will decide what style of
turbine you purchase. Many residential turbines are specifically designed to
maximize output in low-wind-speed conditions, while others are designed for
maximum durability in high speed conditions. The best way to find out average
wind speeds for your specific location is to purchase an anemometer, install it
approximately where our turbine would be, and keep a record of wind-speed
measurements for a year prior to installing our turbine.
If our area is rated a 1 or 2 for average wind speeds, we'll probably want to look at
low start-up speed turbines, which can start producing measurable power in winds
below 10mph. For those in regions ranking 3 or higher, a turbine designed for high
speed durability might be preferable.
Of course everyone, regardless of location, should use basic common sense when
predicting wind speed for their system. If our region is rated a "4" by NREL (or an
equivalent local authority), but our property is located on the sheltered side of a hill,
our specific location may call for a different turbine than our neighbors on the other
side of the hill.
What to do With the Data?
Once we have all the relevant site analysis figures for our location, and we've
completed our *load evaluation* to determine how much power we need, we can
proceed to the actual system sizing and design stage of the process. Using the figures
gathered in the first two steps, we can figure out how many solar panels, wind
turbines will supply our power needs, and what other system components will
ensure the most reliable, highest quality power for our installation.
For our site analysis the data from NASA was used in order to evaluate how many
Page 98 of 218
solar panels and wind turbines will be needed. To calculate the size of solar panels
that is needed we took the average monthly insolation of a ten year period in order to
have more accurate results. To calculate the size of turbines that is gone to be used
we took the average monthly speed of the wind and also the frequency of the wind
speed for each month.
Wind + PV + Batteries Size Analysis
Solar size analysis
Because the insolation in a country such as UK isn’t so high we decided to use the
panels for producing the energy that is gone to be used for the consumption of the
appliances.
As we know the monthly average consumption of energy from the appliances is
901,4 kWh. So this amount of energy should be extracted each month from the solar
panels. Because the efficiency of the panels was assumed to be 15% and because the
insolation in UK is very low this would cause a great demand in solar panels. So it
was decided to calculate each month separately and to find an average value of solar
panels that would give as the best supply for all the year.
The electricity supplied each month can be estimated as:
Electricity per month = I*A*Em*30 kWh
Where I = average annual irradiation in kWh/m2-day
A = array area in m2
Em = module efficiency (15%)
30 = number of days in a month
Example (January):
901.4 kWh = 0.75*A*0.15*30
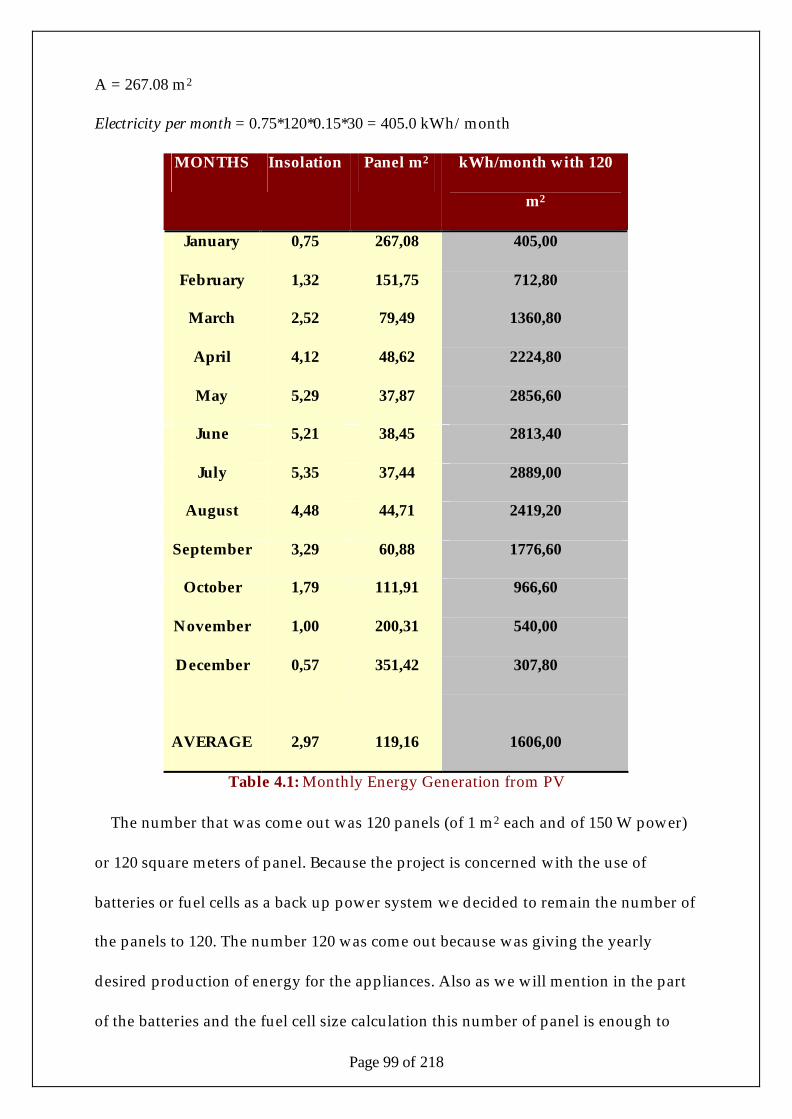
Page 99 of 218
A = 267.08 m2
Electricity per month = 0.75*120*0.15*30 = 405.0 kWh/month
MONTHS Insolation Panel m2 kWh/month with 120
m2
January 0,75 267,08 405,00
February 1,32 151,75 712,80
March 2,52 79,49 1360,80
April 4,12 48,62 2224,80
May 5,29 37,87 2856,60
June 5,21 38,45 2813,40
July 5,35 37,44 2889,00
August 4,48 44,71 2419,20
September 3,29 60,88 1776,60
October 1,79 111,91 966,60
November 1,00 200,31 540,00
December 0,57 351,42 307,80
AVERAGE 2,97 119,16 1606,00
Table 4.1: Monthly Energy Generation from PV
The number that was come out was 120 panels (of 1 m2 each and of 150 W power)
or 120 square meters of panel. Because the project is concerned with the use of
batteries or fuel cells as a back up power system we decided to remain the number of
the panels to 120. The number 120 was come out because was giving the yearly
desired production of energy for the appliances. Also as we will mention in the part
of the batteries and the fuel cell size calculation this number of panel is enough to
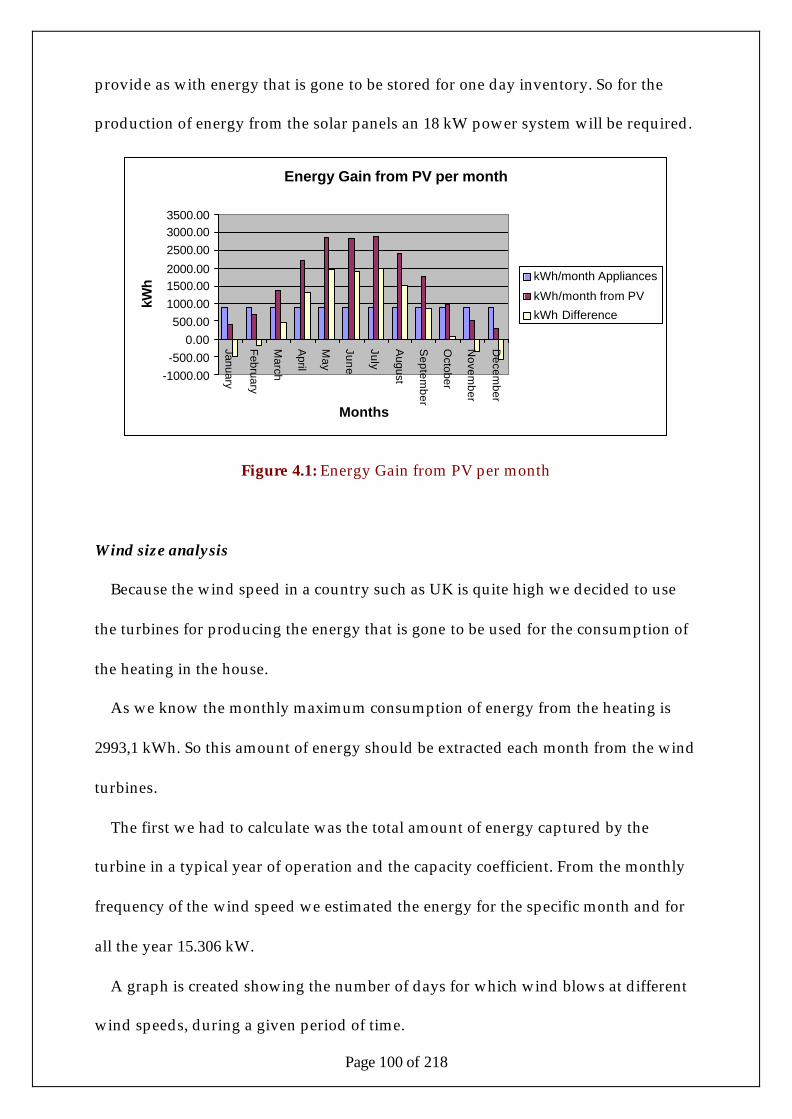
Page 100 of 218
provide as with energy that is gone to be stored for one day inventory. So for the
production of energy from the solar panels an 18 kW power system will be required.
Energy Gain from PV per month
-1000.00-500.00
0.00500.00
1000.001500.002000.00
2500.003000.003500.00
January
February
March
April
May
June
July
August
Septem
ber
October
Novem
ber
Decem
ber
Months
kWh kWh/month Appliances
kWh/month from PV
kWh Difference
Figure 4.1: Energy Gain from PV per month
Wind size analysis
Because the wind speed in a country such as UK is quite high we decided to use
the turbines for producing the energy that is gone to be used for the consumption of
the heating in the house.
As we know the monthly maximum consumption of energy from the heating is
2993,1 kWh. So this amount of energy should be extracted each month from the wind
turbines.
The first we had to calculate was the total amount of energy captured by the
turbine in a typical year of operation and the capacity coefficient. From the monthly
frequency of the wind speed we estimated the energy for the specific month and for
all the year 15.306 kW.
A graph is created showing the number of days for which wind blows at different
wind speeds, during a given period of time.
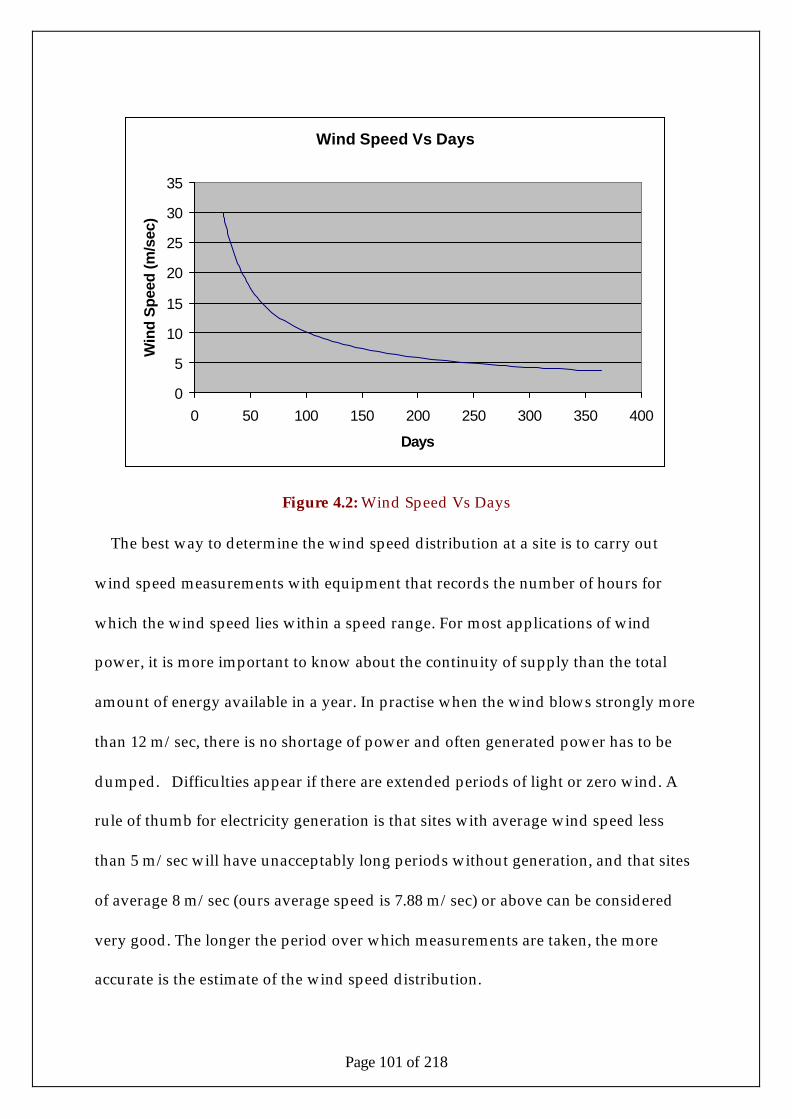
Page 101 of 218
Wind Speed Vs Days
0
5
10
15
20
25
30
35
0 50 100 150 200 250 300 350 400
Days
Win
d S
peed
(m/s
ec)
Figure 4.2: Wind Speed Vs Days
The best way to determine the wind speed distribution at a site is to carry out
wind speed measurements with equipment that records the number of hours for
which the wind speed lies within a speed range. For most applications of wind
power, it is more important to know about the continuity of supply than the total
amount of energy available in a year. In practise when the wind blows strongly more
than 12 m/sec, there is no shortage of power and often generated power has to be
dumped. Difficulties appear if there are extended periods of light or zero wind. A
rule of thumb for electricity generation is that sites with average wind speed less
than 5 m/sec will have unacceptably long periods without generation, and that sites
of average 8 m/sec (ours average speed is 7.88 m/sec) or above can be considered
very good. The longer the period over which measurements are taken, the more
accurate is the estimate of the wind speed distribution.
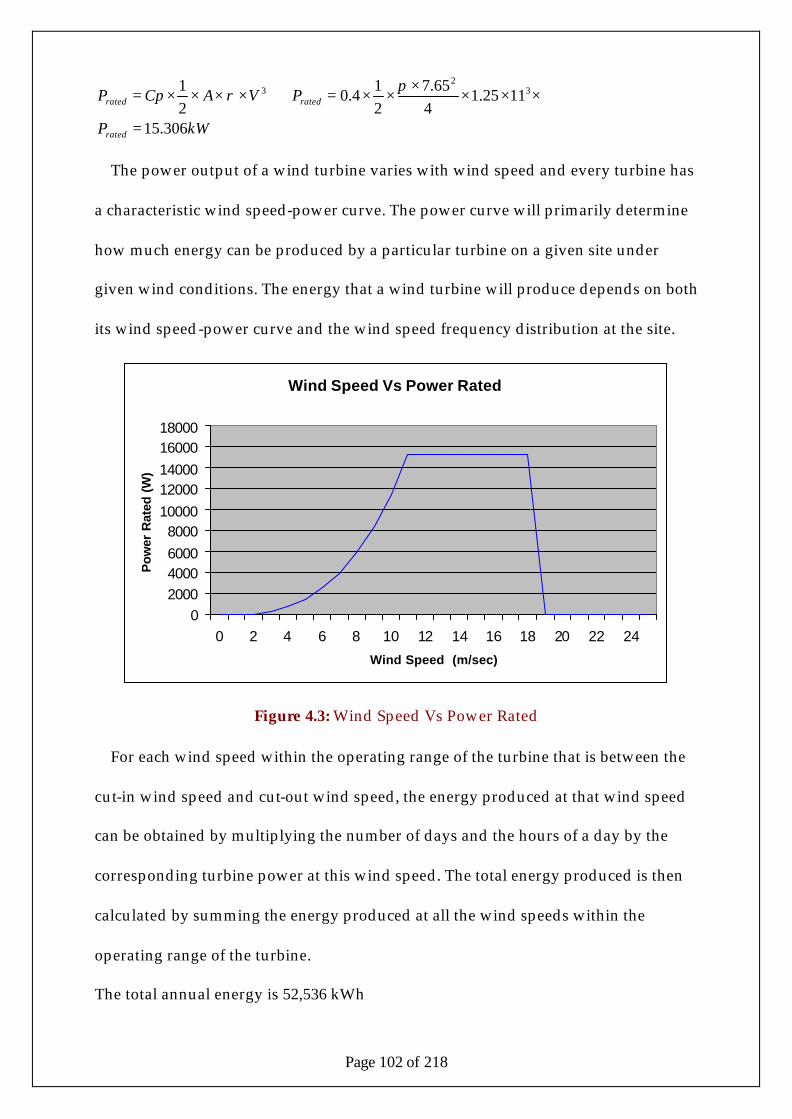
Page 102 of 218
kWP
PVACpP
rated
ratedrated
306.15
1125.14
65.721
4.021 3
23
=
⇒××××
××=⇒××××=π
ρ
The power output of a wind turbine varies with wind speed and every turbine has
a characteristic wind speed-power curve. The power curve will primarily determine
how much energy can be produced by a particular turbine on a given site under
given wind conditions. The energy that a wind turbine will produce depends on both
its wind speed-power curve and the wind speed frequency distribution at the site.
Wind Speed Vs Power Rated
02000400060008000
1000012000140001600018000
0 2 4 6 8 10 12 14 16 18 20 22 24
Wind Speed (m/sec)
Pow
er R
ated
(W
)
Figure 4.3: Wind Speed Vs Power Rated
For each wind speed within the operating range of the turbine that is between the
cut-in wind speed and cut-out wind speed, the energy produced at that wind speed
can be obtained by multiplying the number of days and the hours of a day by the
corresponding turbine power at this wind speed. The total energy produced is then
calculated by summing the energy produced at all the wind speeds within the
operating range of the turbine.
The total annual energy is 52,536 kWh
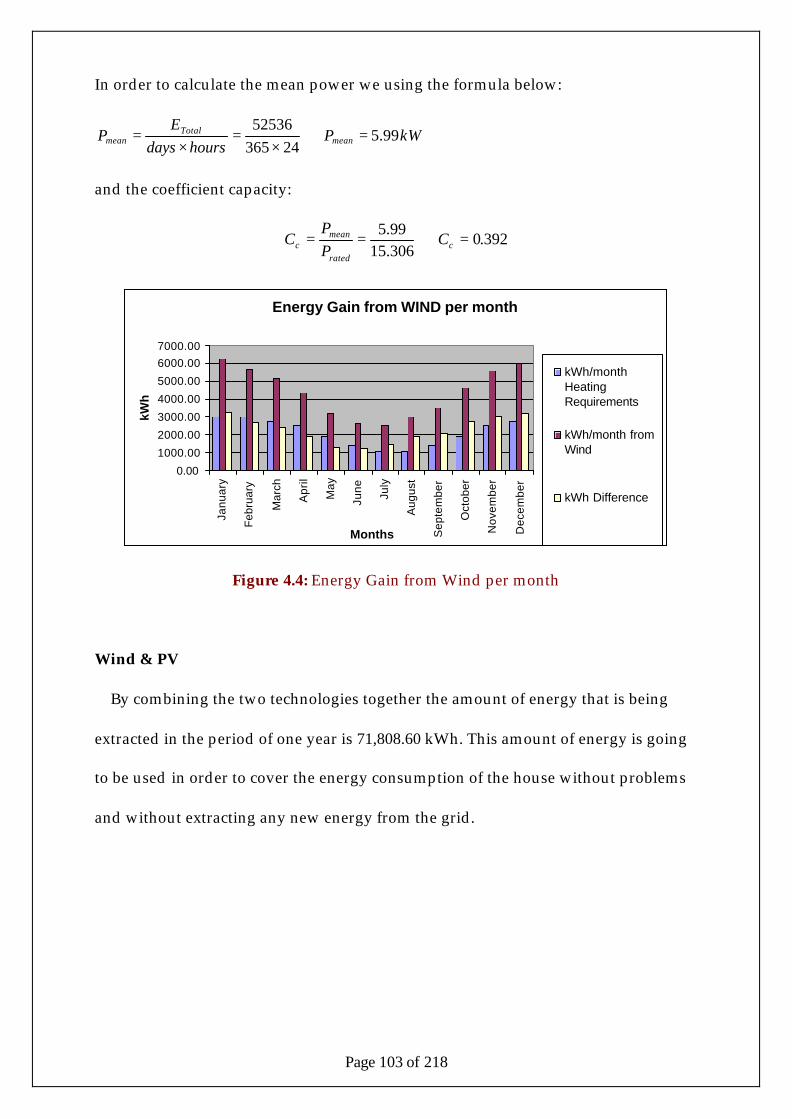
Page 103 of 218
In order to calculate the mean power we using the formula below:
kWPhoursdays
EP mean
Totalmean 99.5
2436552536
=⇒×
=×
=
and the coefficient capacity:
392.0306.1599.5
=⇒== crated
meanc C
PP
C
Energy Gain from WIND per month
0.00
1000.00
2000.00
3000.00
4000.00
5000.00
6000.007000.00
Janu
ary
Feb
ruar
y
Mar
ch
Apr
il
May
June July
Aug
ust
Sep
tem
ber
Oct
ober
Nov
embe
r
Dec
embe
rMonths
kWh
kWh/monthHeatingRequirements
kWh/month fromWind
kWh Difference
Figure 4.4: Energy Gain from Wind per month
Wind & PV
By combining the two technologies together the amount of energy that is being
extracted in the period of one year is 71,808.60 kWh. This amount of energy is going
to be used in order to cover the energy consumption of the house without problems
and without extracting any new energy from the grid.
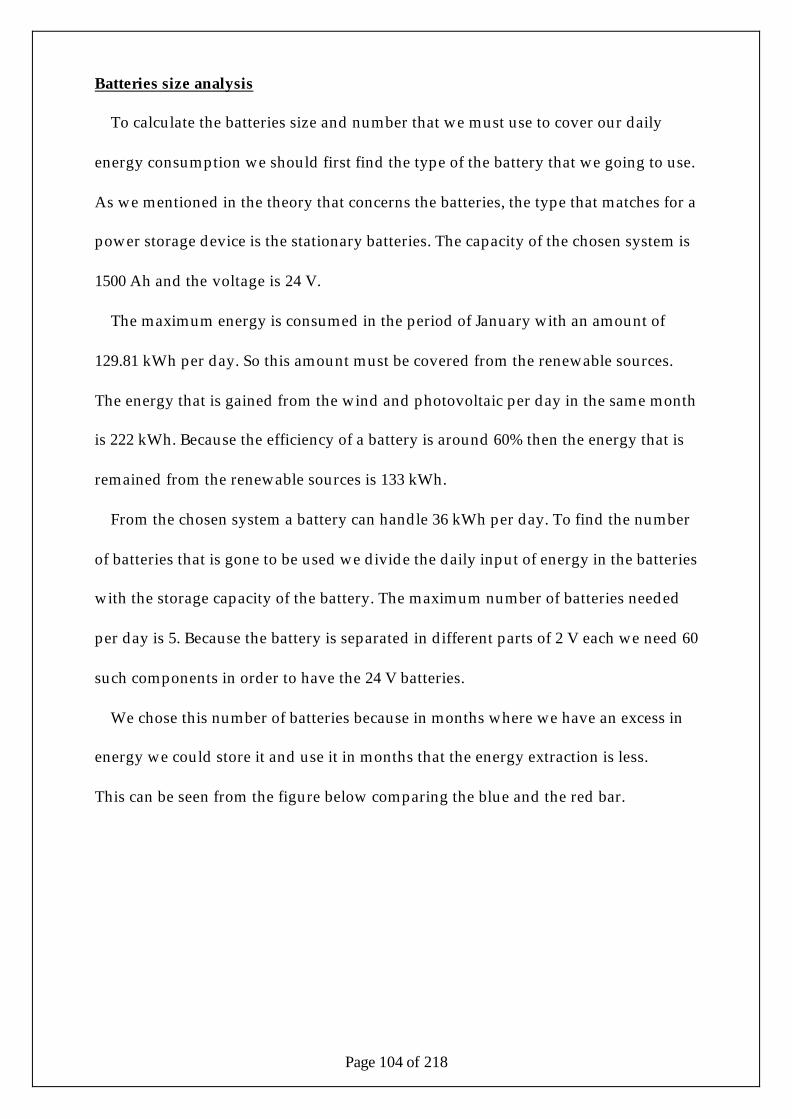
Page 104 of 218
Batteries size analysis
To calculate the batteries size and number that we must use to cover our daily
energy consumption we should first find the type of the battery that we going to use.
As we mentioned in the theory that concerns the batteries, the type that matches for a
power storage device is the stationary batteries. The capacity of the chosen system is
1500 Ah and the voltage is 24 V.
The maximum energy is consumed in the period of January with an amount of
129.81 kWh per day. So this amount must be covered from the renewable sources.
The energy that is gained from the wind and photovoltaic per day in the same month
is 222 kWh. Because the efficiency of a battery is around 60% then the energy that is
remained from the renewable sources is 133 kWh.
From the chosen system a battery can handle 36 kWh per day. To find the number
of batteries that is gone to be used we divide the daily input of energy in the batteries
with the storage capacity of the battery. The maximum number of batteries needed
per day is 5. Because the battery is separated in different parts of 2 V each we need 60
such components in order to have the 24 V batteries.
We chose this number of batteries because in months where we have an excess in
energy we could store it and use it in months that the energy extraction is less.
This can be seen from the figure below comparing the blue and the red bar.
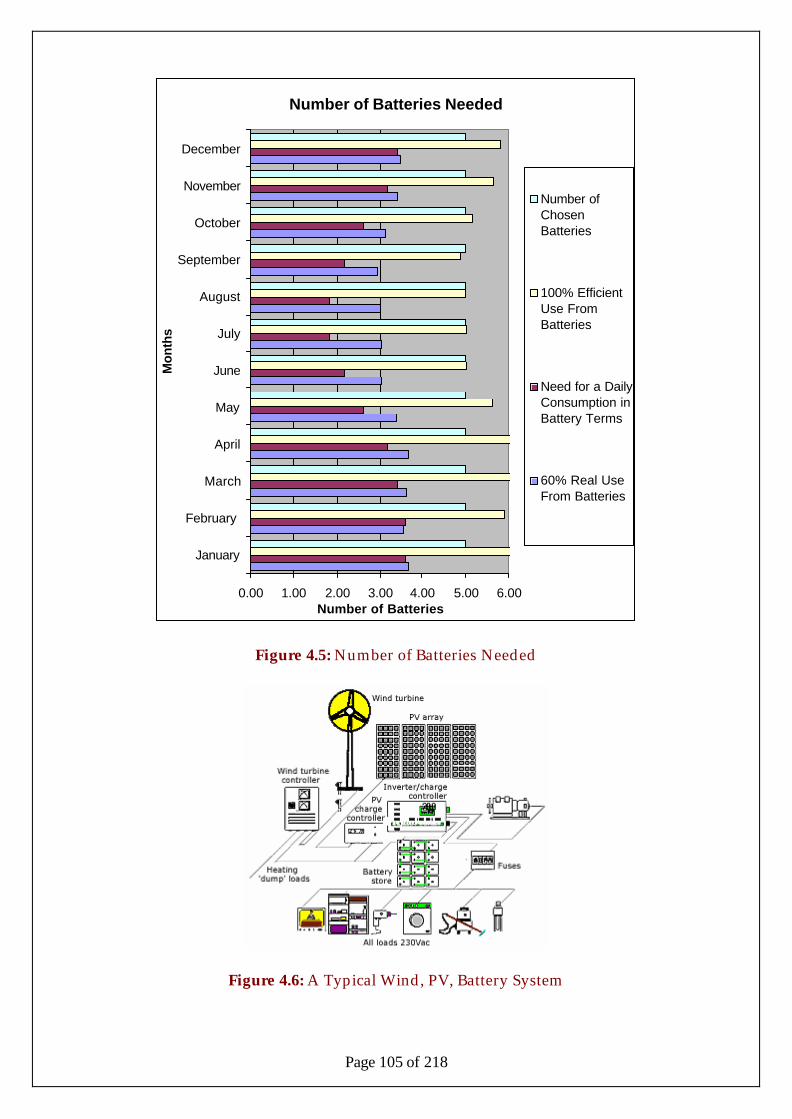
Page 105 of 218
Number of Batteries Needed
0.00 1.00 2.00 3.00 4.00 5.00 6.00
January
February
March
April
May
June
July
August
September
October
November
DecemberM
onth
s
Number of Batteries
Number ofChosenBatteries
100% EfficientUse FromBatteries
Need for a DailyConsumption inBattery Terms
60% Real UseFrom Batteries
Figure 4.5: Number of Batteries Needed
Figure 4.6: A Typical Wind, PV, Battery System
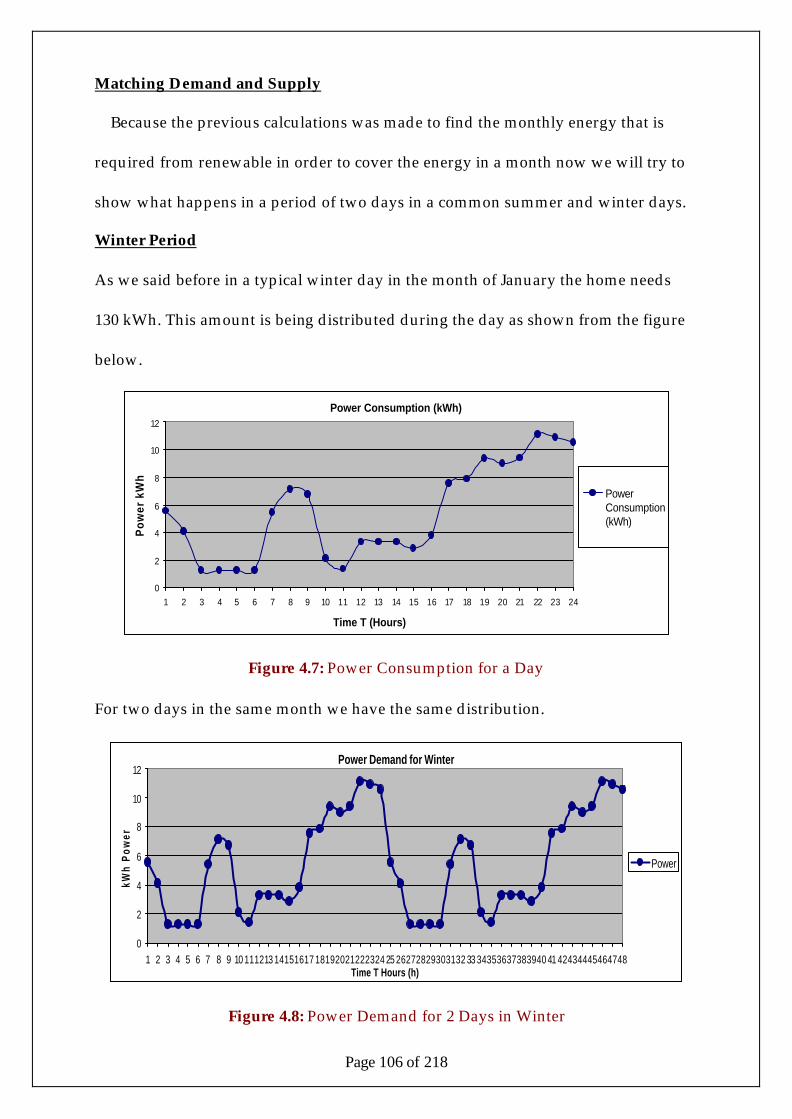
Page 106 of 218
Matching Demand and Supply
Because the previous calculations was made to find the monthly energy that is
required from renewable in order to cover the energy in a month now we will try to
show what happens in a period of two days in a common summer and winter days.
Winter Period
As we said before in a typical winter day in the month of January the home needs
130 kWh. This amount is being distributed during the day as shown from the figure
below.
Power Consumption (kWh)
0
2
4
6
8
10
12
1 2 3 4 5 6 7 8 9 10 11 12 13 14 15 16 17 18 19 20 21 22 23 24
Time T (Hours)
Po
wer
kW
h
PowerConsumption(kWh)
Figure 4.7: Power Consumption for a Day
For two days in the same month we have the same distribution.
Power Demand for Winter
0
2
4
6
8
10
12
1 2 3 4 5 6 7 8 9 10 111213 14151617 18192021222324 25 26272829303132 33 34353637383940 41 42434445464748Time T Hours (h)
kWh
Pow
er
Power
Figure 4.8: Power Demand for 2 Days in Winter
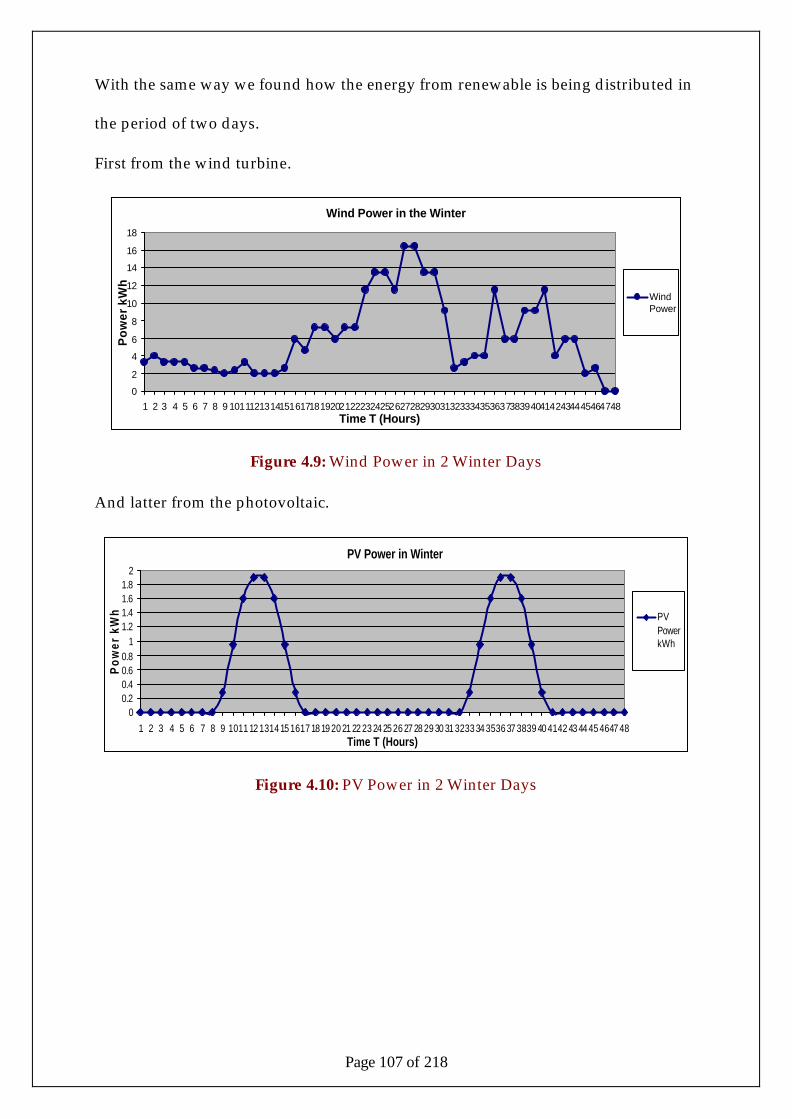
Page 107 of 218
With the same way we found how the energy from renewable is being distributed in
the period of two days.
First from the wind turbine.
Wind Power in the Winter
0
2
4
6
8
10
12
14
16
18
1 2 3 4 5 6 7 8 9 101112131415161718192021222324252627282930313233343536373839404142434445464748Time T (Hours)
Po
wer
kW
h
WindPower
Figure 4.9: Wind Power in 2 Winter Days
And latter from the photovoltaic.
PV Power in Winter
00.20.40.60.8
11.21.41.61.8
2
1 2 3 4 5 6 7 8 9 1011 12 1314 15 1617 18 19 20 21 22 23 24 25 26 27 28 29 30 31 3233 34 3536 37 3839 40 4142 43 44 45 4647 48Time T (Hours)
Po
wer
kW
h PVPowerkWh
Figure 4.10: PV Power in 2 Winter Days
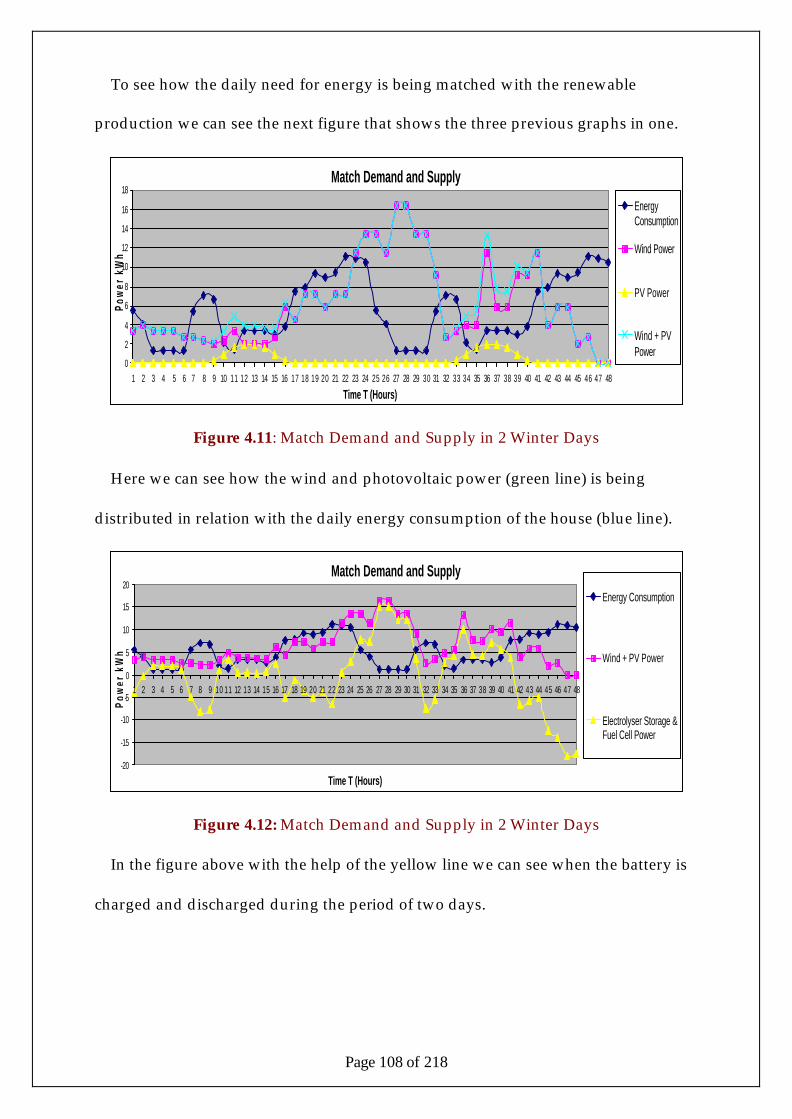
Page 108 of 218
To see how the daily need for energy is being matched with the renewable
production we can see the next figure that shows the three previous graphs in one.
Match Demand and Supply
0
2
4
6
8
10
12
14
16
18
1 2 3 4 5 6 7 8 9 10 11 12 13 14 15 16 17 18 19 20 21 22 23 24 25 26 27 28 29 30 31 32 33 34 35 36 37 38 39 40 41 42 43 44 45 46 47 48
Time T (Hours)
Pow
er k
Wh
EnergyConsumption
Wind Power
PV Power
Wind + PVPower
Figure 4.11: Match Demand and Supply in 2 Winter Days
Here we can see how the wind and photovoltaic power (green line) is being
distributed in relation with the daily energy consumption of the house (blue line).
Match Demand and Supply
-20
-15
-10
-5
0
5
10
15
20
1 2 3 4 5 6 7 8 9 10 11 12 13 14 15 16 17 18 19 20 21 22 23 24 25 26 27 28 29 30 31 32 33 34 35 36 37 38 39 40 41 42 43 44 45 46 47 48
Time T (Hours)
Pow
er k
Wh
Energy Consumption
Wind + PV Power
Electrolyser Storage &Fuel Cell Power
Figure 4.12: Match Demand and Supply in 2 Winter Days
In the figure above with the help of the yellow line we can see when the battery is
charged and discharged during the period of two days.
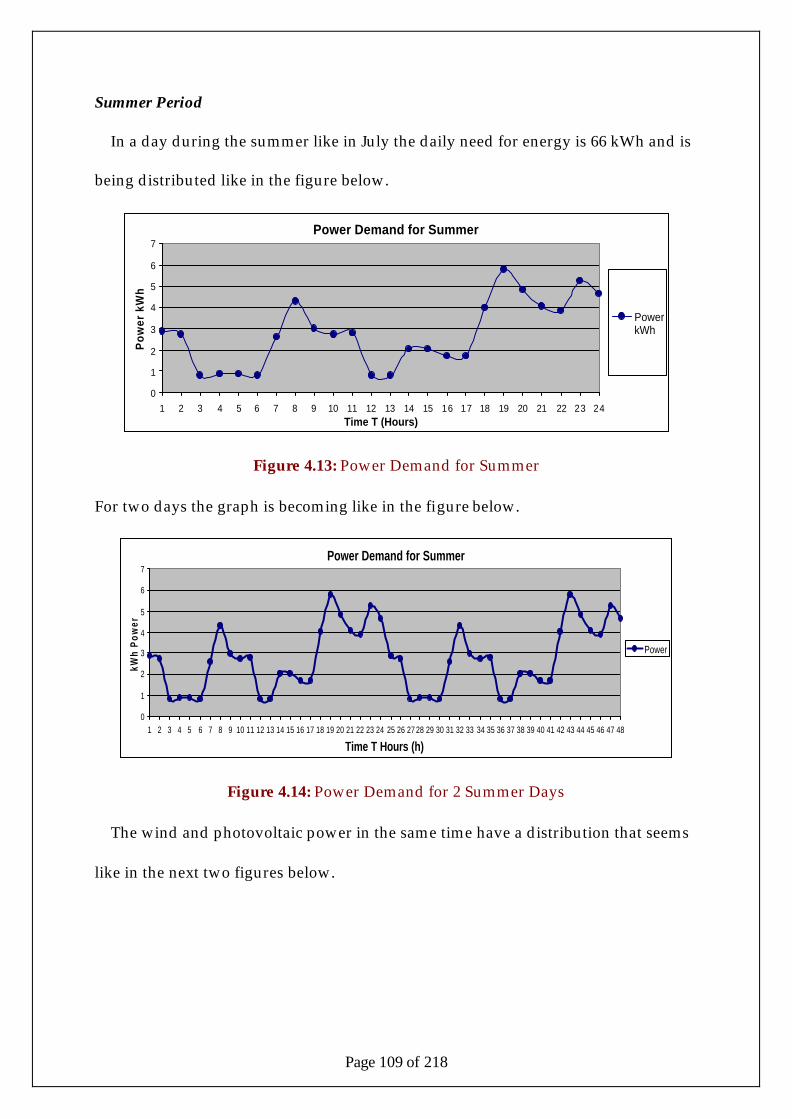
Page 109 of 218
Summer Period
In a day during the summer like in July the daily need for energy is 66 kWh and is
being distributed like in the figure below.
Power Demand for Summer
0
1
2
3
4
5
6
7
1 2 3 4 5 6 7 8 9 10 11 12 13 14 15 16 17 18 19 20 21 22 23 24Time T (Hours)
Po
wer
kW
h
PowerkWh
Figure 4.13: Power Demand for Summer
For two days the graph is becoming like in the figure below.
Power Demand for Summer
0
1
2
3
4
5
6
7
1 2 3 4 5 6 7 8 9 10 11 12 13 14 15 16 17 18 19 20 21 22 23 24 25 26 27 28 29 30 31 32 33 34 35 36 37 38 39 40 41 42 43 44 45 46 47 48
Time T Hours (h)
kWh
Pow
er
Power
Figure 4.14: Power Demand for 2 Summer Days
The wind and photovoltaic power in the same time have a distribution that seems
like in the next two figures below.
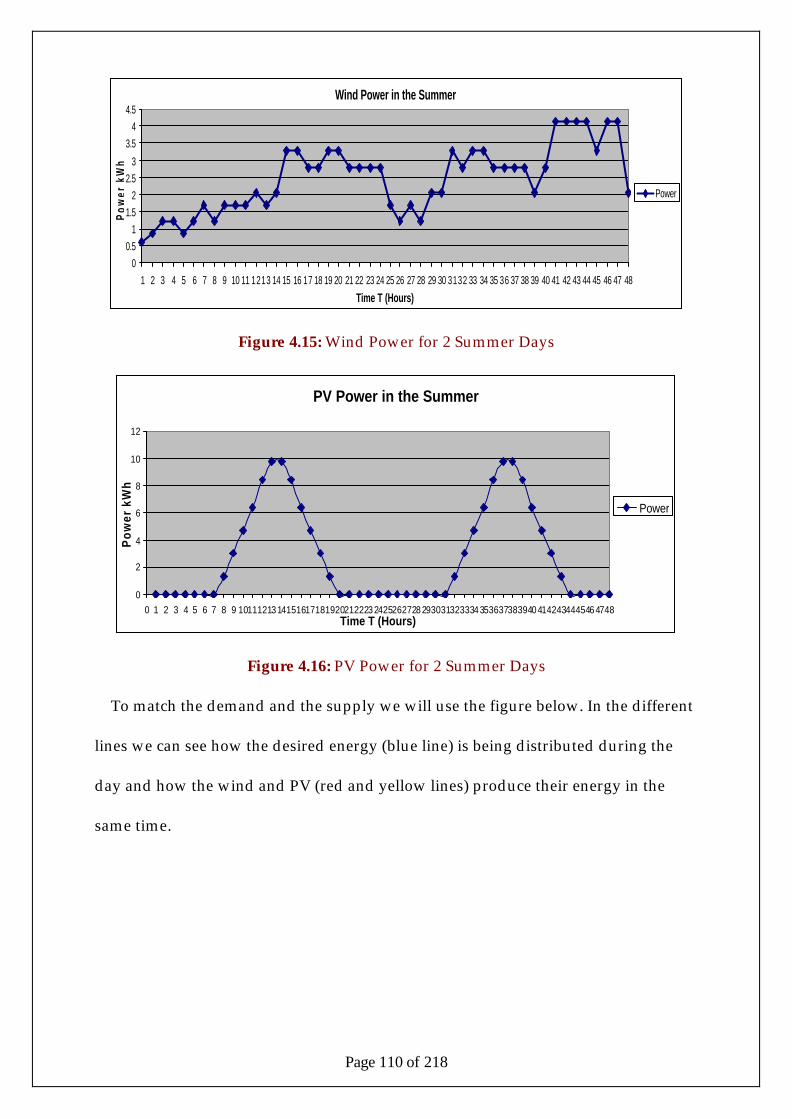
Page 110 of 218
Wind Power in the Summer
00.5
11.5
22.5
3
3.54
4.5
1 2 3 4 5 6 7 8 9 10 11 1213 14 15 16 17 18 19 20 21 22 23 24 25 26 27 28 29 30 3132 33 34 35 36 37 38 39 40 41 42 43 44 45 46 47 48
Time T (Hours)
Pow
er k
Wh
Power
Figure 4.15: Wind Power for 2 Summer Days
PV Power in the Summer
0
2
4
6
8
10
12
0 1 2 3 4 5 6 7 8 9 101112131415161718192021222324252627282930313233343536373839404142434445464748Time T (Hours)
Po
wer
kW
h
Power
Figure 4.16: PV Power for 2 Summer Days
To match the demand and the supply we will use the figure below. In the different
lines we can see how the desired energy (blue line) is being distributed during the
day and how the wind and PV (red and yellow lines) produce their energy in the
same time.
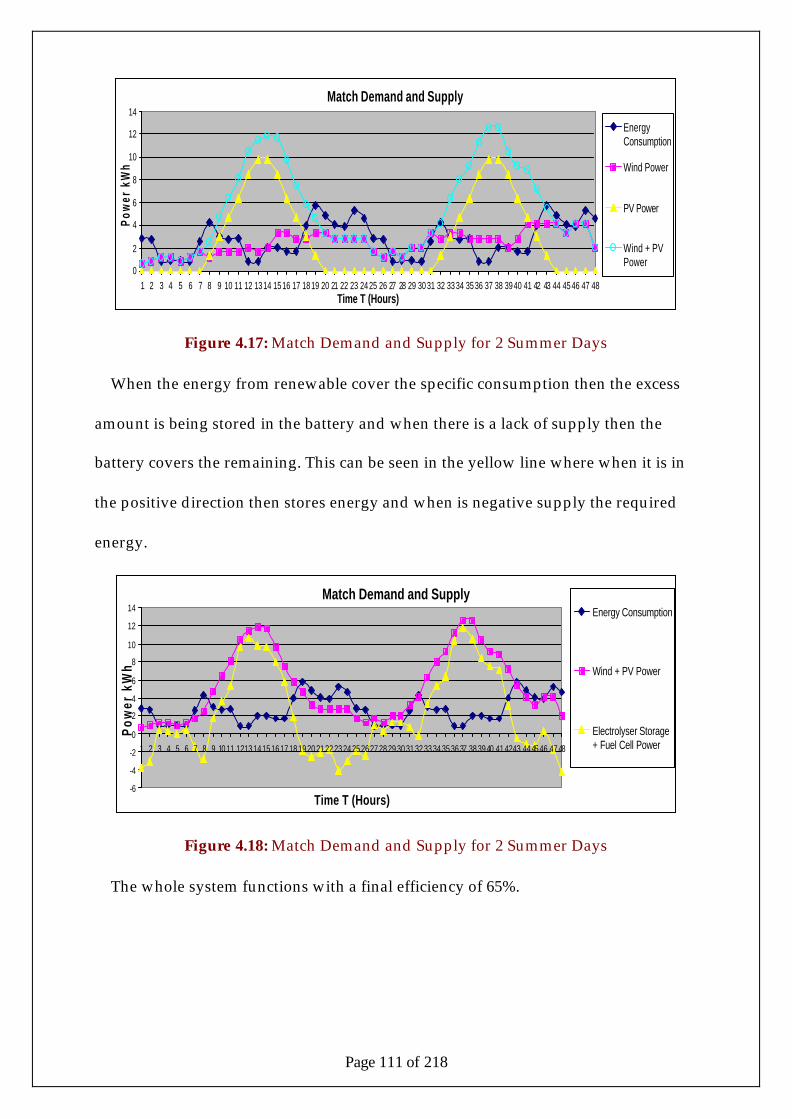
Page 111 of 218
Match Demand and Supply
0
2
4
6
8
10
12
14
1 2 3 4 5 6 7 8 9 10 11 12 13 14 15 16 17 18 19 20 21 22 23 24 25 26 27 28 29 30 31 32 33 34 35 36 37 38 39 40 41 42 43 44 45 46 47 48Time T (Hours)
Pow
er k
Wh
EnergyConsumption
Wind Power
PV Power
Wind + PVPower
Figure 4.17: Match Demand and Supply for 2 Summer Days
When the energy from renewable cover the specific consumption then the excess
amount is being stored in the battery and when there is a lack of supply then the
battery covers the remaining. This can be seen in the yellow line where when it is in
the positive direction then stores energy and when is negative supply the required
energy.
Match Demand and Supply
-6
-4
-2
0
2
4
6
8
10
12
14
1 2 3 4 5 6 7 8 9 10 11 1213 14 15 16 17 18 19 20 21 22 23 24 25 26 27 28 29 30 31 32 33 34 35 36 37 38 39 40 41 4243 44 45 46 47 48
Time T (Hours)
Pow
er k
Wh
Energy Consumption
Wind + PV Power
Electrolyser Storage+ Fuel Cell Power
Figure 4.18: Match Demand and Supply for 2 Summer Days
The whole system functions with a final efficiency of 65%.
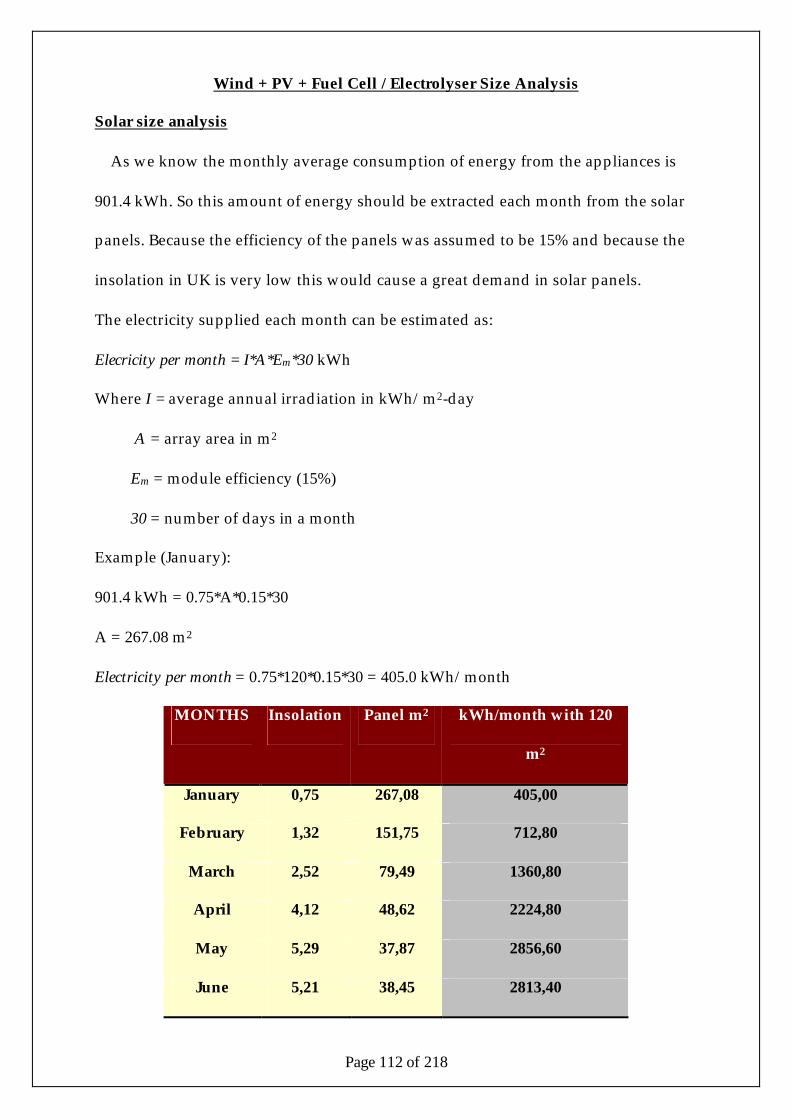
Page 112 of 218
Wind + PV + Fuel Cell / Electrolyser Size Analysis
Solar size analysis
As we know the monthly average consumption of energy from the appliances is
901.4 kWh. So this amount of energy should be extracted each month from the solar
panels. Because the efficiency of the panels was assumed to be 15% and because the
insolation in UK is very low this would cause a great demand in solar panels.
The electricity supplied each month can be estimated as:
Elecricity per month = I*A*Em*30 kWh
Where I = average annual irradiation in kWh/m2-day
A = array area in m2
Em = module efficiency (15%)
30 = number of days in a month
Example (January):
901.4 kWh = 0.75*A*0.15*30
A = 267.08 m2
Electricity per month = 0.75*120*0.15*30 = 405.0 kWh/month
MONTHS Insolation Panel m2 kWh/month with 120
m2
January 0,75 267,08 405,00
February 1,32 151,75 712,80
March 2,52 79,49 1360,80
April 4,12 48,62 2224,80
May 5,29 37,87 2856,60
June 5,21 38,45 2813,40
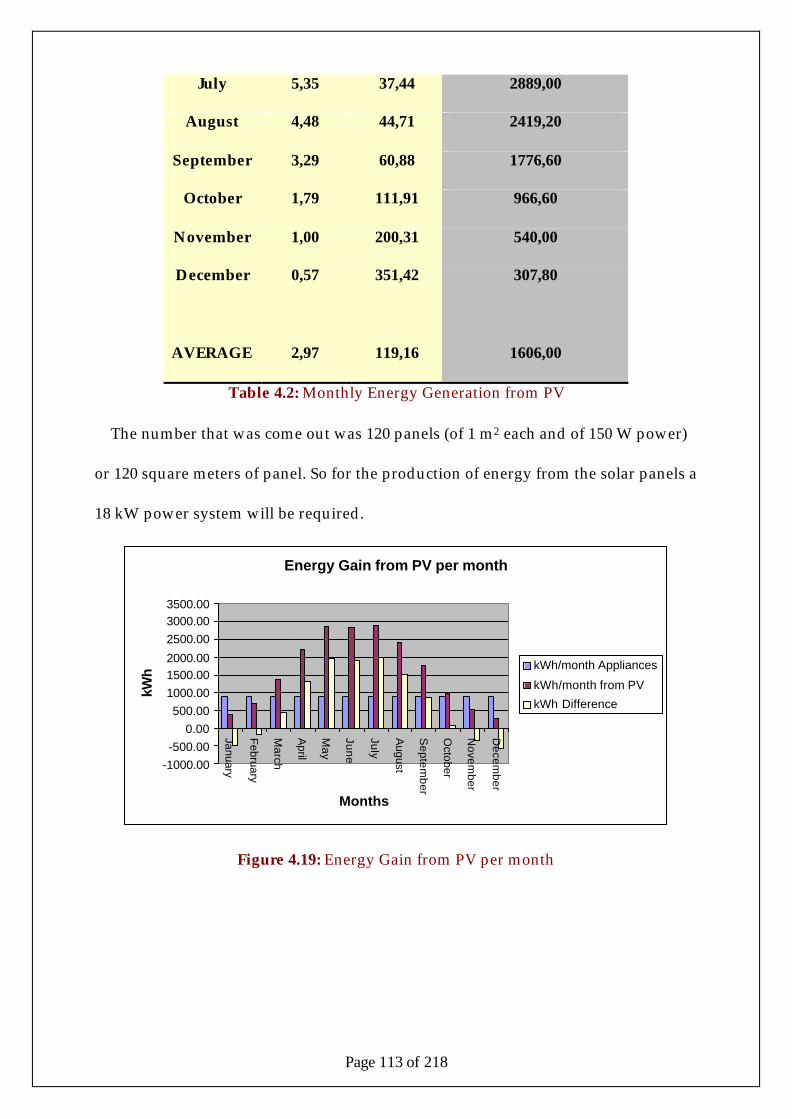
Page 113 of 218
July 5,35 37,44 2889,00
August 4,48 44,71 2419,20
September 3,29 60,88 1776,60
October 1,79 111,91 966,60
November 1,00 200,31 540,00
December 0,57 351,42 307,80
AVERAGE 2,97 119,16 1606,00
Table 4.2: Monthly Energy Generation from PV
The number that was come out was 120 panels (of 1 m2 each and of 150 W power)
or 120 square meters of panel. So for the production of energy from the solar panels a
18 kW power system will be required.
Energy Gain from PV per month
-1000.00-500.00
0.00500.00
1000.001500.002000.00
2500.003000.003500.00
January
February
March
April
May
June
July
August
Septem
ber
October
Novem
ber
Decem
ber
Months
kWh kWh/month Appliances
kWh/month from PV
kWh Difference
Figure 4.19: Energy Gain from PV per month
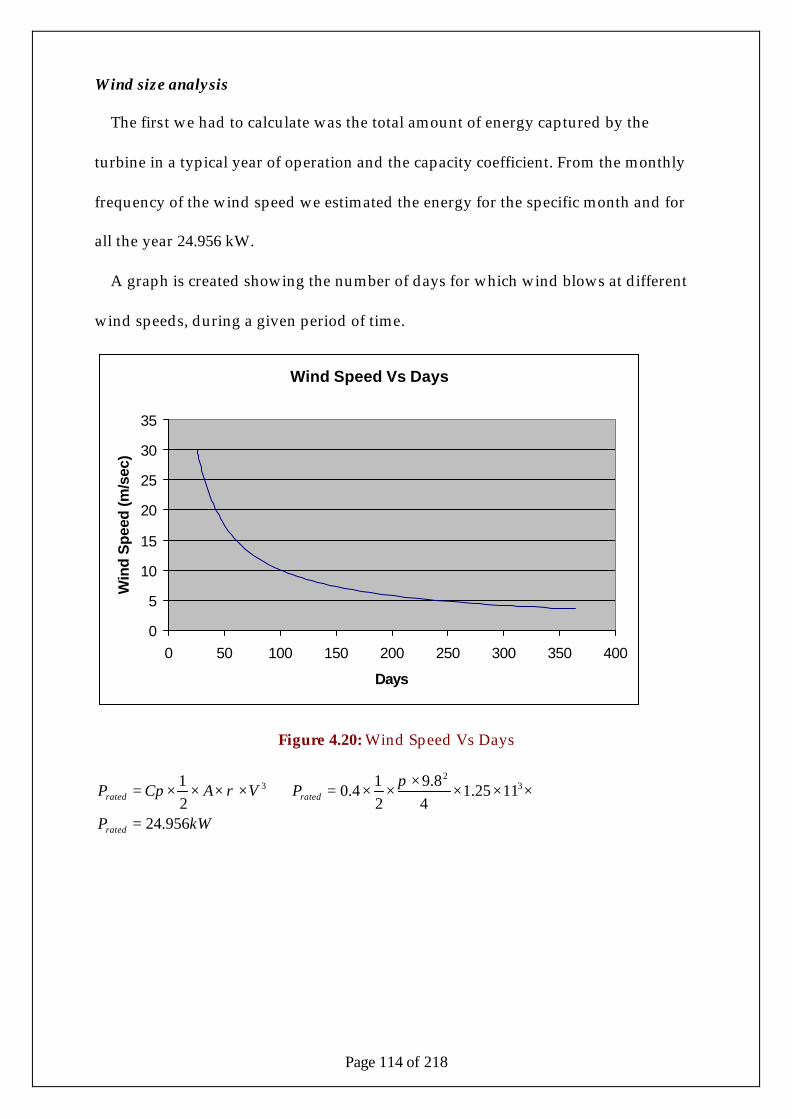
Page 114 of 218
Wind size analysis
The first we had to calculate was the total amount of energy captured by the
turbine in a typical year of operation and the capacity coefficient. From the monthly
frequency of the wind speed we estimated the energy for the specific month and for
all the year 24.956 kW.
A graph is created showing the number of days for which wind blows at different
wind speeds, during a given period of time.
Wind Speed Vs Days
0
5
10
15
20
25
30
35
0 50 100 150 200 250 300 350 400
Days
Win
d S
peed
(m/s
ec)
Figure 4.20: Wind Speed Vs Days
kWP
PVACpP
rated
ratedrated
956.24
1125.14
8.921
4.021 3
23
=
⇒××××
××=⇒××××=π
ρ

Page 115 of 218
Wind Speed vs Power Rated
0
5000
10000
15000
20000
25000
30000
0 1 2 3 4 5 6 7 8 9 10 11 12 13 14 15 16 17 18 19 20 21 22 23 24 25
Wind Speed (m/sec)
Po
wer
(W)
Figure 4.21: Wind Speed Vs Power Rated
The total annual energy is 85,657 kWh
In order to calculate the mean power we using the formula below:
kWPhoursdays
EP mean
Totalmean 78.9
2436585657
=⇒×
=×
=
and the coefficient capacity:
392.0956.2478.9
=⇒== crated
meanc C
PP
C
Energy Gain from WIND per month
0.00
2000.00
4000.00
6000.00
8000.00
10000.00
12000.00
Janu
ary
Feb
ruar
y
Mar
ch
Apr
il
May
June July
Aug
ust
Sep
tem
ber
Oct
ober
Nov
embe
r
Dec
embe
r
Months
kWh
kWh/monthHeatingRequirements
kWh/month fromWind
kWh Difference
Figure 4.22: Energy Gain from Wind per month
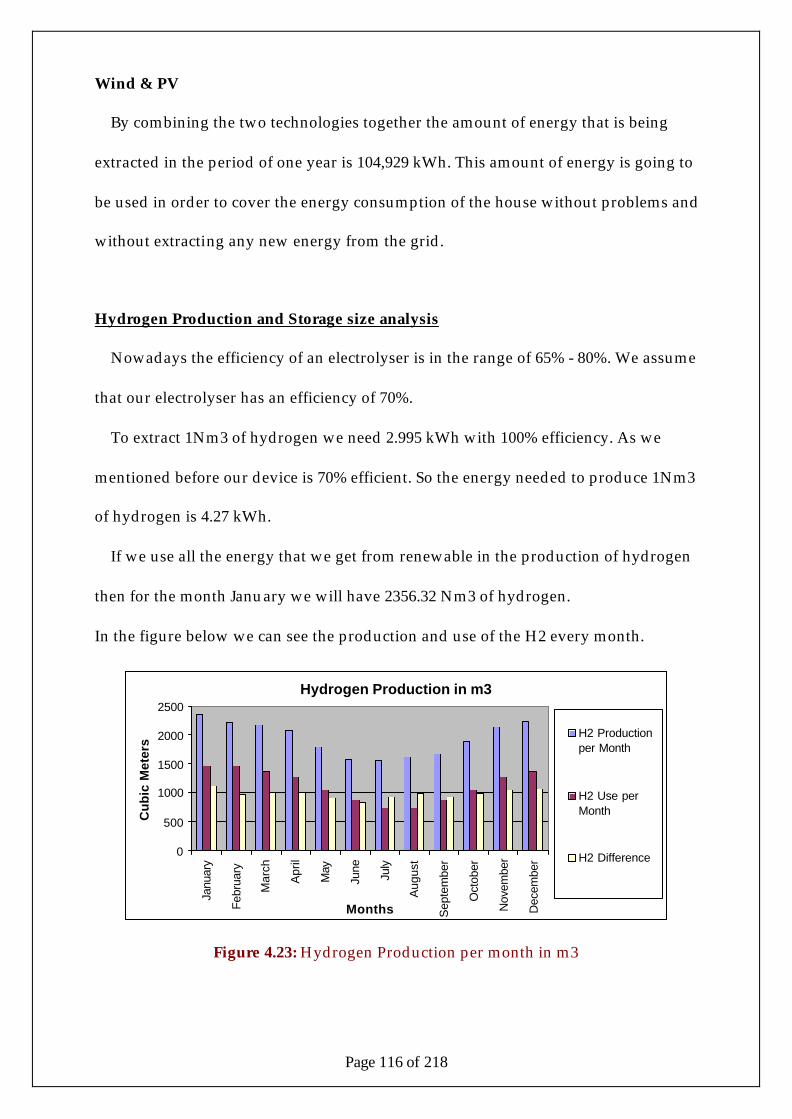
Page 116 of 218
Wind & PV
By combining the two technologies together the amount of energy that is being
extracted in the period of one year is 104,929 kWh. This amount of energy is going to
be used in order to cover the energy consumption of the house without problems and
without extracting any new energy from the grid.
Hydrogen Production and Storage size analysis
Nowadays the efficiency of an electrolyser is in the range of 65% - 80%. We assume
that our electrolyser has an efficiency of 70%.
To extract 1Nm3 of hydrogen we need 2.995 kWh with 100% efficiency. As we
mentioned before our device is 70% efficient. So the energy needed to produce 1Nm3
of hydrogen is 4.27 kWh.
If we use all the energy that we get from renewable in the production of hydrogen
then for the month January we will have 2356.32 Nm3 of hydrogen.
In the figure below we can see the production and use of the H2 every month.
Hydrogen Production in m3
0
500
1000
1500
2000
2500
Janu
ary
Febr
uary
Mar
ch
Apr
il
May
June
July
Aug
ust
Sep
tem
ber
Oct
ober
Nov
embe
r
Dec
embe
r
Months
Cu
bic
Met
ers
H2 Productionper Month
H2 Use perMonth
H2 Difference
Figure 4.23: Hydrogen Production per month in m3

Page 117 of 218
Figure 4.24: A Renewable Hydrogen Energy System
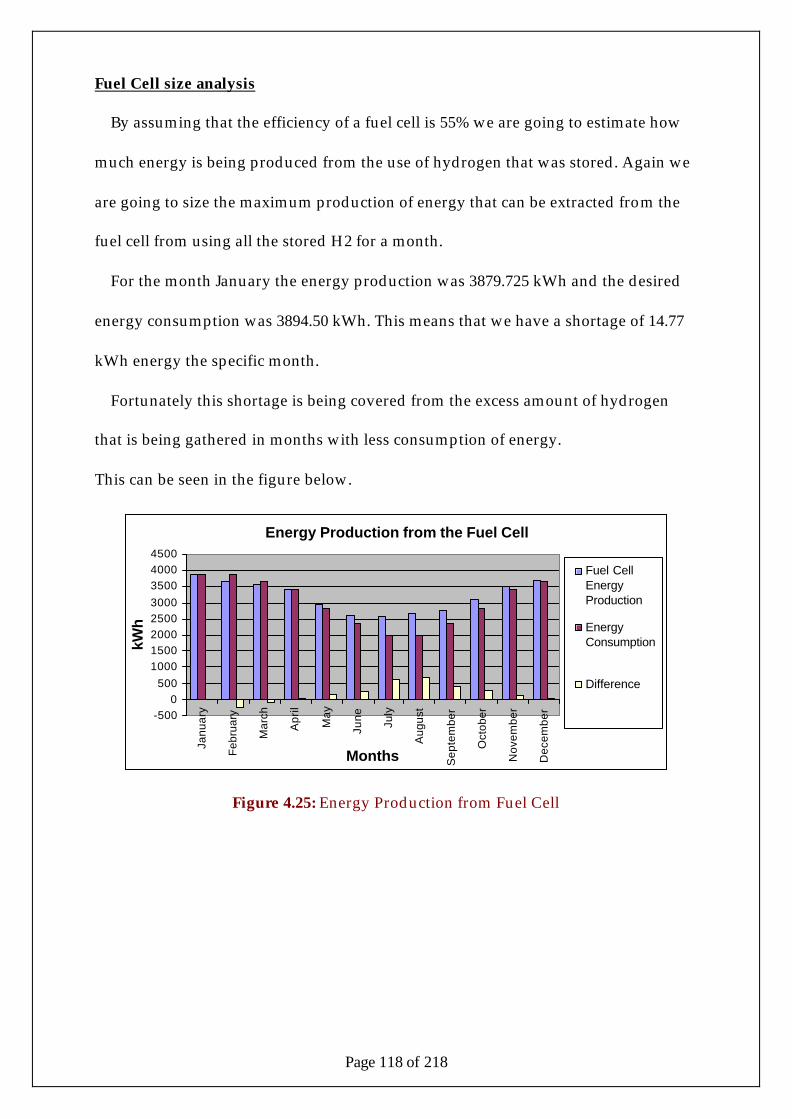
Page 118 of 218
Fuel Cell size analysis
By assuming that the efficiency of a fuel cell is 55% we are going to estimate how
much energy is being produced from the use of hydrogen that was stored. Again we
are going to size the maximum production of energy that can be extracted from the
fuel cell from using all the stored H2 for a month.
For the month January the energy production was 3879.725 kWh and the desired
energy consumption was 3894.50 kWh. This means that we have a shortage of 14.77
kWh energy the specific month.
Fortunately this shortage is being covered from the excess amount of hydrogen
that is being gathered in months with less consumption of energy.
This can be seen in the figure below.
Energy Production from the Fuel Cell
-5000
50010001500200025003000350040004500
Janu
ary
Feb
ruar
y
Mar
ch
Apr
il
May
June July
Aug
ust
Sep
tem
ber
Oct
ober
Nov
embe
r
Dec
embe
r
Months
kWh
Fuel CellEnergyProduction
EnergyConsumption
Difference
Figure 4.25: Energy Production from Fuel Cell
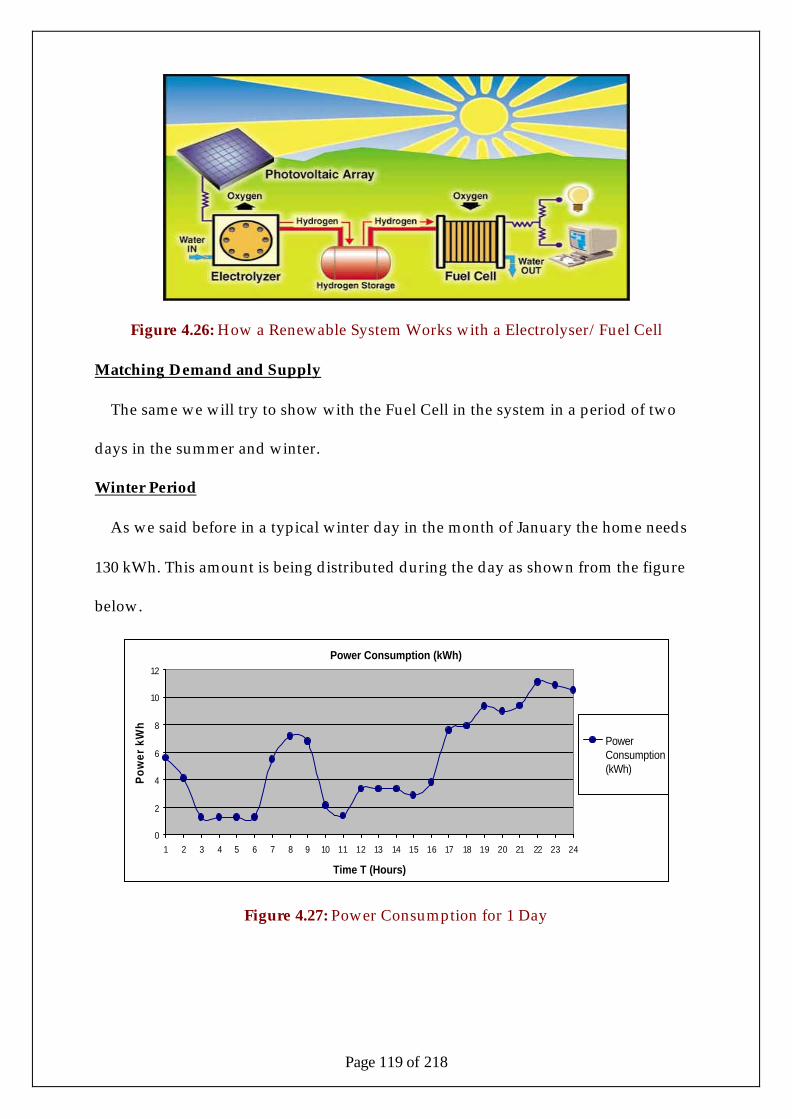
Page 119 of 218
Figure 4.26: How a Renewable System Works with a Electrolyser/Fuel Cell
Matching Demand and Supply
The same we will try to show with the Fuel Cell in the system in a period of two
days in the summer and winter.
Winter Period
As we said before in a typical winter day in the month of January the home needs
130 kWh. This amount is being distributed during the day as shown from the figure
below.
Power Consumption (kWh)
0
2
4
6
8
10
12
1 2 3 4 5 6 7 8 9 10 11 12 13 14 15 16 17 18 19 20 21 22 23 24
Time T (Hours)
Po
wer
kW
h
PowerConsumption(kWh)
Figure 4.27: Power Consumption for 1 Day
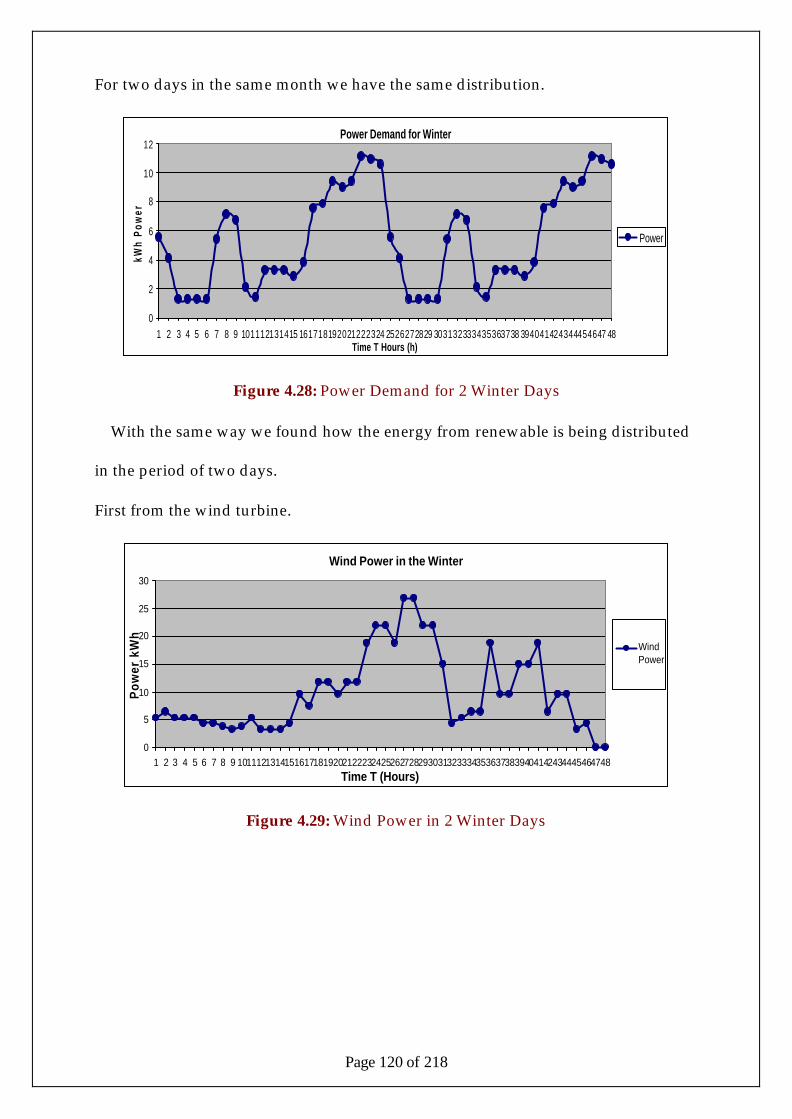
Page 120 of 218
For two days in the same month we have the same distribution.
Power Demand for Winter
0
2
4
6
8
10
12
1 2 3 4 5 6 7 8 9 101112131415 161718192021222324 2526272829 303132333435363738 394041424344454647 48Time T Hours (h)
kWh
Pow
er
Power
Figure 4.28: Power Demand for 2 Winter Days
With the same way we found how the energy from renewable is being distributed
in the period of two days.
First from the wind turbine.
Wind Power in the Winter
0
5
10
15
20
25
30
1 2 3 4 5 6 7 8 9 101112131415161718192021222324252627282930313233343536373839404142434445464748Time T (Hours)
Pow
er k
Wh
WindPower
Figure 4.29: Wind Power in 2 Winter Days
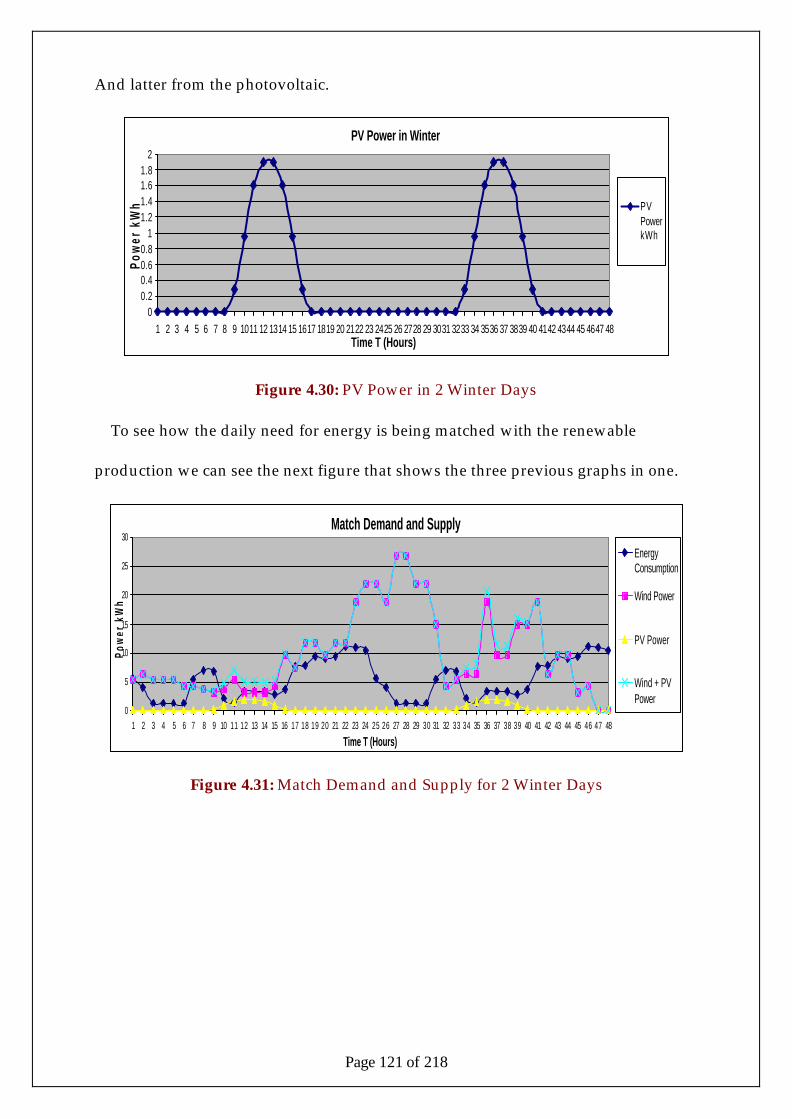
Page 121 of 218
And latter from the photovoltaic.
PV Power in Winter
00.20.40.60.8
11.21.41.61.8
2
1 2 3 4 5 6 7 8 9 1011 12 1314 15 1617 1819 20 2122 23 2425 26 2728 29 3031 3233 34 3536 37 3839 40 4142 4344 45 4647 48Time T (Hours)
Pow
er k
Wh PV
PowerkWh
Figure 4.30: PV Power in 2 Winter Days
To see how the daily need for energy is being matched with the renewable
production we can see the next figure that shows the three previous graphs in one.
Match Demand and Supply
0
5
10
15
20
25
30
1 2 3 4 5 6 7 8 9 10 11 12 13 14 15 16 17 18 19 20 21 22 23 24 25 26 27 28 29 30 31 32 33 34 35 36 37 38 39 40 41 42 43 44 45 46 47 48
Time T (Hours)
Pow
er k
Wh
EnergyConsumption
Wind Power
PV Power
Wind + PVPower
Figure 4.31: Match Demand and Supply for 2 Winter Days
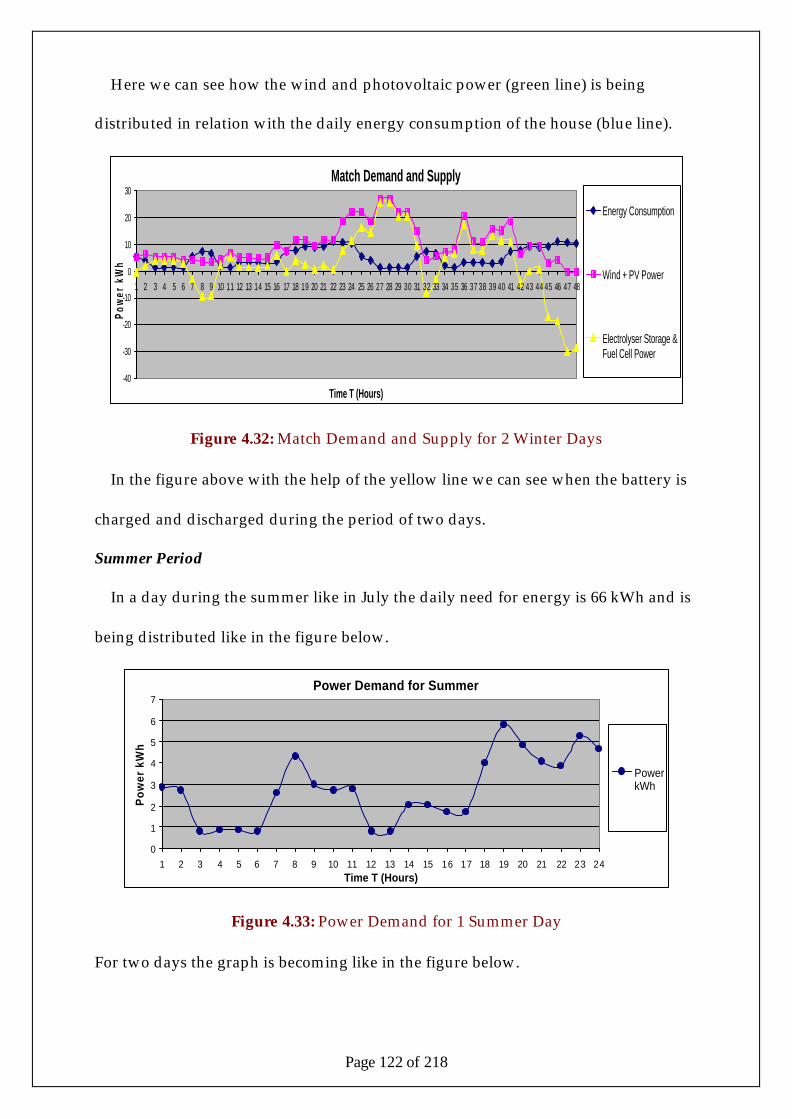
Page 122 of 218
Here we can see how the wind and photovoltaic power (green line) is being
distributed in relation with the daily energy consumption of the house (blue line).
Match Demand and Supply
-40
-30
-20
-10
0
10
20
30
1 2 3 4 5 6 7 8 9 10 11 12 13 14 15 16 17 18 19 20 21 22 23 24 25 26 27 28 29 30 31 32 33 34 35 36 37 38 39 40 41 42 43 44 45 46 47 48
Time T (Hours)
Pow
er k
Wh
Energy Consumption
Wind + PV Power
Electrolyser Storage &Fuel Cell Power
Figure 4.32: Match Demand and Supply for 2 Winter Days
In the figure above with the help of the yellow line we can see when the battery is
charged and discharged during the period of two days.
Summer Period
In a day during the summer like in July the daily need for energy is 66 kWh and is
being distributed like in the figure below.
Power Demand for Summer
0
1
2
3
4
5
6
7
1 2 3 4 5 6 7 8 9 10 11 12 13 14 15 16 17 18 19 20 21 22 23 24Time T (Hours)
Po
wer
kW
h
PowerkWh
Figure 4.33: Power Demand for 1 Summer Day
For two days the graph is becoming like in the figure below.
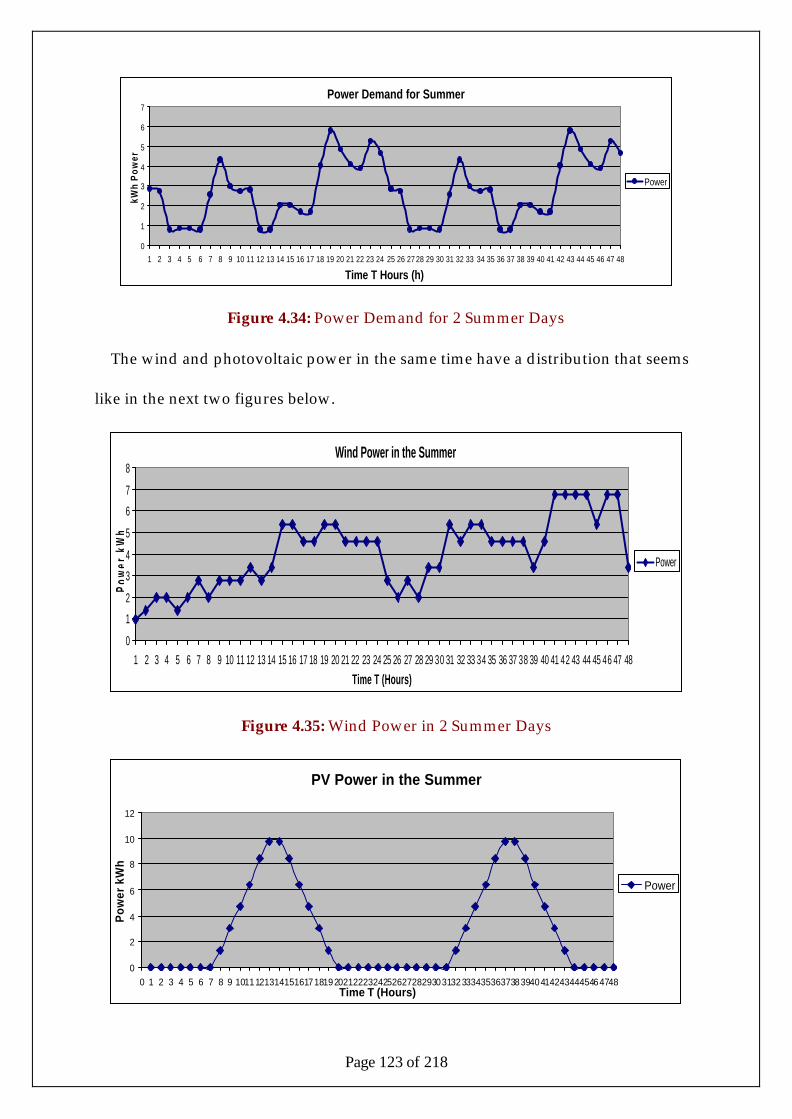
Page 123 of 218
Power Demand for Summer
0
1
2
3
4
5
6
7
1 2 3 4 5 6 7 8 9 10 11 12 13 14 15 16 17 18 19 20 21 22 23 24 25 26 27 28 29 30 31 32 33 34 35 36 37 38 39 40 41 42 43 44 45 46 47 48
Time T Hours (h)
kWh
Pow
er
Power
Figure 4.34: Power Demand for 2 Summer Days
The wind and photovoltaic power in the same time have a distribution that seems
like in the next two figures below.
Wind Power in the Summer
0
1
2
3
4
5
6
7
8
1 2 3 4 5 6 7 8 9 10 11 12 13 14 15 16 17 18 19 20 21 22 23 24 25 26 27 28 29 30 31 32 33 34 35 36 37 38 39 40 41 42 43 44 45 46 47 48
Time T (Hours)
Pow
er k
Wh
Power
Figure 4.35: Wind Power in 2 Summer Days
PV Power in the Summer
0
2
4
6
8
10
12
0 1 2 3 4 5 6 7 8 9 101112131415161718192021222324252627282930313233343536373839404142434445464748Time T (Hours)
Pow
er k
Wh
Power

Page 124 of 218
Figure 4.36: PV Power in 2 Summer Days
To match the demand and the supply we will use the figure below. In the different
lines we can see how the desired energy (blue line) is being distributed during the
day and how the wind and PV (red and yellow lines) produce their energy in the
same time.
Match Demand and Supply
0
2
4
6
8
10
12
14
16
1 2 3 4 5 6 7 8 9 10 1112 13 14 15 1617 18 19 20 21 22 23 2425 26 27 28 29 3031 3233 34 35 36 3738 39 40 41 42 4344 4546 47 48Time T (Hours)
Pow
er k
Wh
EnergyConsumption
Wind Power
PV Power
Wind + PVPower
Figure 4.37: Match Demand and Supply for 2 Summer Days
When the energy from renewable cover the specific consumption then the excess
amount is being passed in the electrolyser, where there produces the hydrogen and
then is being stored and when there is a lack of supply then the fuel cell uses
hydrogen and covers the remaining. This can be seen in the yellow line where when
it is in the positive direction then stores energy and when is negative supply the
required energy.
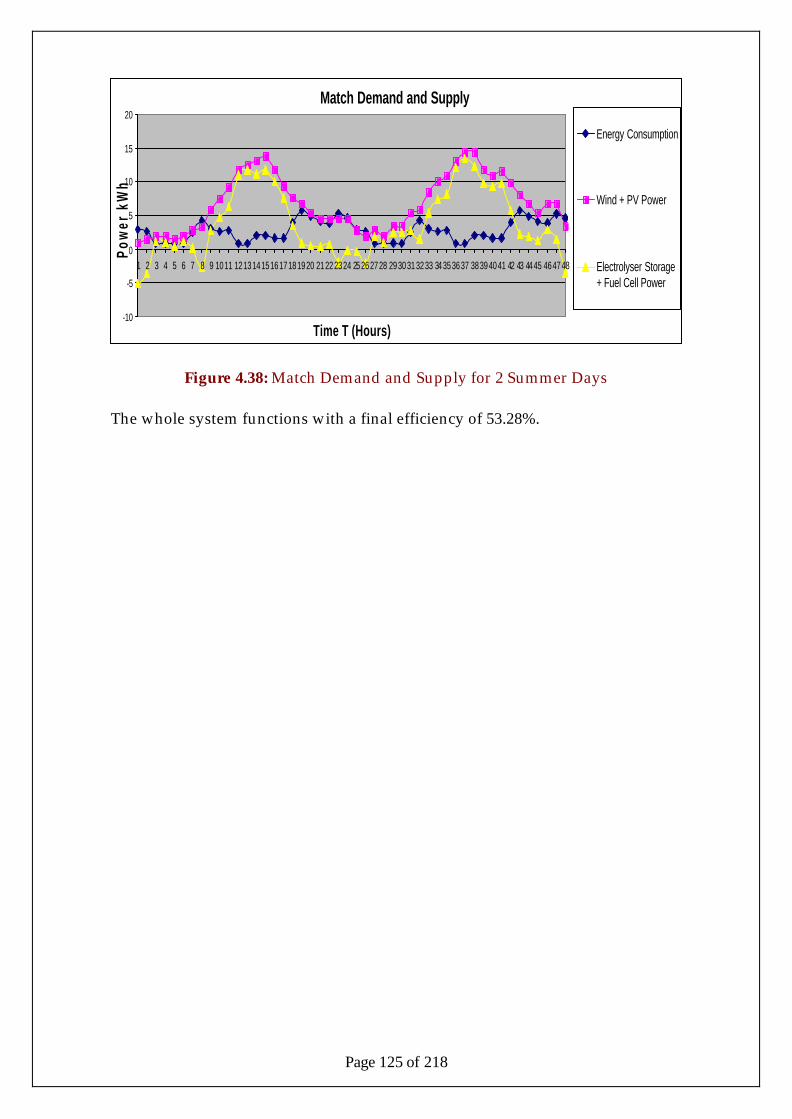
Page 125 of 218
Match Demand and Supply
-10
-5
0
5
10
15
20
1 2 3 4 5 6 7 8 9 1011 121314151617181920 21222324 25262728 2930313233 34353637 38394041 42 43 4445 464748
Time T (Hours)
Pow
er k
Wh
Energy Consumption
Wind + PV Power
Electrolyser Storage+ Fuel Cell Power
Figure 4.38: Match Demand and Supply for 2 Summer Days
The whole system functions with a final efficiency of 53.28%.

Page 126 of 218
How the Renewable System Works with Batteries and Fuel Cell
To see more clearly how such a system works we will try to present it in a
diagrammatic form in the next two figures.
With Batteries
Figure 4.39: A Wind, PV, Battery System
In this example we can see that in a specific time during the day how the home
needs are covered with this system.
When we need 10 kWh of energy in a specific time during the day and in the same
time we extract from renewable 23 kWh this is being distributed like in the figure
above.
The 10 kWh is being given directly for our needs but because this procedure has
70% efficiency we provide the system with 14.28 kWh. The remaining 8.7 kWh is
being stored in the batteries. When an excess amount is required for the house and
the renewable can’t afford to give it then the batteries provide the additional amount.
PV Power
Wind Power
Energy Needed
Batteries
Controller
8 kWh
15 kWh
10 kWh 14.3 kWh -70% - 10 kWh
8.7 kWh
60% - 5.2 kWh

Page 127 of 218
In this case the 8.7 kWh previously stored will give as in some time in the future the
amount of 5.2 kWh cause of the 60% efficiency of the batteries.
Figure 4.40: A Wind, PV, Battery System
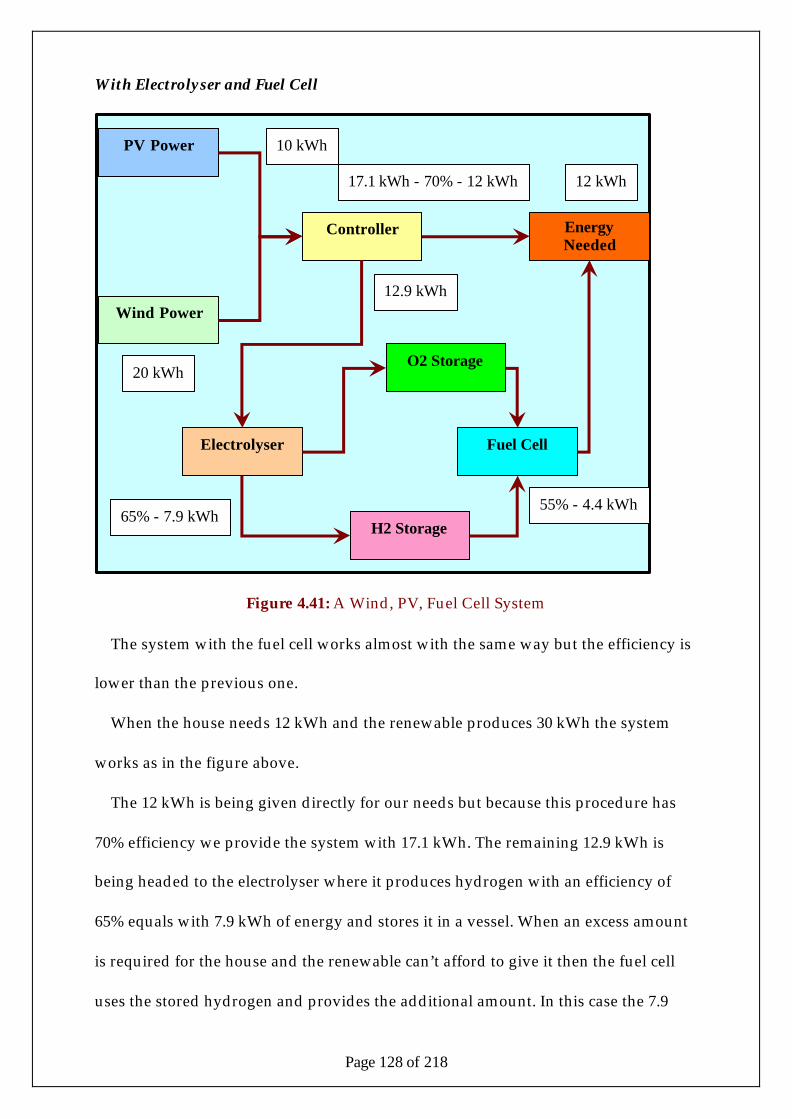
Page 128 of 218
With Electrolyser and Fuel Cell
Figure 4.41: A Wind, PV, Fuel Cell System
The system with the fuel cell works almost with the same way but the efficiency is
lower than the previous one.
When the house needs 12 kWh and the renewable produces 30 kWh the system
works as in the figure above.
The 12 kWh is being given directly for our needs but because this procedure has
70% efficiency we provide the system with 17.1 kWh. The remaining 12.9 kWh is
being headed to the electrolyser where it produces hydrogen with an efficiency of
65% equals with 7.9 kWh of energy and stores it in a vessel. When an excess amount
is required for the house and the renewable can’t afford to give it then the fuel cell
uses the stored hydrogen and provides the additional amount. In this case the 7.9
PV Power
Wind Power
Fuel Cell Electrolyser
Controller Energy Needed
O2 Storage
H2 Storage
10 kWh
20 kWh
12 kWh 17.1 kWh - 70% - 12 kWh
12.9 kWh
65% - 7.9 kWh 55% - 4.4 kWh

Page 129 of 218
kWh previously stored will give as in some time in the future the amount of 4.4 kWh
cause of the 55% efficiency of the fuel cell.
Page 130 of 218
CHAPTER 5
Unlike conventional fossil fuel technologies, renewable energy technologies (apart
from biomass) generally produce no greenhouse gases or other atmospheric
pollutants during their generation stage. However, emissions do arise from other
stages in their life cycle (i.e. during the chain of processes required to manufacture,
transport, construct and install the renewable energy plant and transmission
equipment). Emissions from these stages need to be evaluated if a fair comparison of
emissions is to be made.
LIFE CYCLE STAGES FOR RENEWABLE ENERGY TECHNOLOGIES
For each of the renewable energy technologies considered, life cycle emissions have
been calculated.
For non-biomass technologies, the typical stages of the life cycle are:
• · Resource extraction;
• · Resource transportation;
• · Materials processing;
• · Component manufacture;
• · Component transportation;
• · Plant construction;
• · Plant operation;
• · Decommissioning;
• · Product disposal.
Ideally, each of the life cycle stages listed above should be considered, in order to
evaluate the total emissions from the life cycle of the technology. However, an exact
Page 131 of 218
analysis of every stage is neither possible nor necessary. The emissions of most of the
major air pollutants (particularly carbon dioxide, sulphur dioxide, oxides of nitrogen
and particulates) are expected to be broadly proportional to energy use. Therefore,
the most important life cycle stages for atmospheric emissions are those with the
highest energy use.
This has shown that, for most renewable:
• The emissions released during the manufacture of the materials are the most
important;
• Energy use in all of the transportation stages is likely to be negligible;
• Energy use in the extraction of the primary materials used in construction
(e.g. limestone and aggregates) or in components (e.g. iron ore and copper
ore) is typically an order of magnitude lower than energy use in their primary
processing;
• Energy use in the construction, decommissioning and disposal processes is
also likely to be at least an order of magnitude lower than for material
manufacturing.
In assessing the energy use and emissions from the various technologies, data
relating to realistic sites and technologies have been used, in recognition of the fact
that these factors are important in determining the magnitude of some emissions.
Emissions associated with the manufacture of materials and components are
dependent (to some extent) on industrial practices, the generation mix and pollution
control regime in the country of manufacture. In most cases studied there was an
Page 132 of 218
indigenous industry, so manufacture in the country of location has been assumed; in
other cases, manufacture in an appropriate exporting country was assumed.
INTRODUCTION-Wind
Wind power has been used as a source of mechanical energy for many centuries
but it is now becoming a competitive electricity generation technology, with
widespread use in North America, Europe and the Indian sub-continent. Wind has a
very large potential global resource, yet generates few environmental impacts.
Indeed, wind turbine schemes are a clean source of energy in that they produce no
atmospheric emissions from electricity generation, because they harness a natural
resource and convert it into electrical power.
Although the technology does not produce any long-term damage, some potential
environmental impacts can arise from wind energy developments. These are usually
easily reversible and tend to affect human amenity. Therefore, they are dominated by
the conditions at each individual site and it is necessary for potential sites to be
sensitively selected.
This module describes the possible environmental impacts which can arise from
onshore wind power schemes and describes the common practices which are used to
ameliorate them.
ENVIRONMENTAL IMPACTS OF WIND POWER
In many part of the world, there is such a dearth of electricity generation that the
public welcomes wind turbines with open arms. Where there are alternative choices,
however, environmental impact is of major significance for development. Note that

Page 133 of 218
impacts may be judged as either beneficial or harmful. The impacts of wind turbines
and the factors influencing these are:
ACOUSTICS
Noise is mostly generated from blade tips (high frequencies), from blades passing
towers and perturbing the wind (low frequencies) and from machinery, especially
gearboxes. Since noise is essentially a sign of inefficiency and because of complaints,
manufacturers have reduced noise-generation intensities greatly over the last five
years.
The critical noise intensity is usually considered to be 40 dBA, or less, as judged
necessary for sleeping. This level of acceptance is usually attained at distances of
about 250 m or less. However, attitudes to noise are strongly psychological; the
owner of a machine probably welcomes the noise as a sign of prosperity; whilst
neighbours may be irritated by intrusion into “their space”.
LAND AREA AND USE
Turbines should be separated by at least five to ten tower heights; this allows the
wind strength to reform and the air turbulence created by one rotor not to harm
another turbine downwind. Consequently, only about 1 % of land area is taken out of
use by the towers and the access tracks. The taller and larger the turbines, the greater
the separation. Megawatt machines should be spaced between half and one
kilometre apart. Neither buildings nor commercial forestry can be established
between, so the land is thereafter safeguarded against such development and can be
used for agriculture, leisure or natural ecology.
VISUAL IMPACT
Wind turbines are always visible from places in clear line of sight. The larger the
machines, the greater the distance between them. The need for a long fetch of

Page 134 of 218
undisturbed wind, and the economic bias to large machines, means that machines
will potentially be visible from distances of tens of kilometres. However, at such
distances, the majority of the public will have their view obscured by hills, trees,
buildings etc. The most likely people to notice the machines on land are walkers and
pilots. For the former, beauty is in the eye of the beholder, and for the latter there is
danger for exceptionally low flying. For offshore machines, visual impact is largely,
as yet, unassessed.
BIRD STRIKE
Birds often collide with high voltage overhead lines, masts, poles, and windows of
buildings. They are also killed by cars in the traffic. Birds are seldom bothered by
wind turbines. Radar studies from Tjaereborg in the western part of Denmark, where
a 2 megawatt wind turbine with 60 metre rotor diameter is installed, show that birds
- by day or night - tend to change their flight route some 100-200 metres before the
turbine and pass above the turbine at a safe distance. In Denmark there are several
examples of birds (falcons) nesting in cages mounted on wind turbine towers. The
only known site with major bird collision problems is located in the Altamont Pass in
California. A "wind wall" of turbines on lattice towers is literally closing off the pass.
There, a few bird kills from collisions have been reported. A study from the Danish
Ministry of the Environment says that power lines, including power lines leading to
wind farms, are a much greater danger to birds than the wind turbines themselves.
Some birds get accustomed to wind turbines very quickly, others take a somewhat
longer time. The possibilities of erecting wind farms next to bird sanctuaries
therefore depend on the species in question. Migratory routes of birds will usually be
taken into account when sitting wind farms. Offshore wind turbines have no
Page 135 of 218
significant effect on water birds. That is the overall conclusion of a three year
offshore bird life study made at the Danish offshore wind farm Tunø Knob.
There have been many independent studies of birds killed by rotating blades. This
undoubtedly happens, but perhaps to a similar or lower frequency than strikes by a
car, against the windows of a building or: against grid transmission cables. Every
death is regretted. The counter argument, again attested by experts, is that land
around wind turbines may provide excellent breeding conditions. The exception to
this argument is the possibility of strikes by large migratory birds flying in the dark
and by raptors intent on their prey.
ELECTROMAGNETIC INTERFERENCE
TV, FM and radar waves are perturbed in line of sight by electrically conducting
materials. Therefore, the metallic parts of rotating blades can produce dynamic
interference in signals. It is easy, but not necessarily cheap; to install TV and FM
repeater stations to provide another direction of signal for receivers. Radar
interference is, as yet, a largely undocumented effect, of most concern to the military.
However, wind turbines are a fact of life that has to be accepted by the military on an
international scale. There are many sites of wind turbines close to airfields, and no
significant difficulties occur.
INTRODUCTION- PV
The underlying principle of generating an electric current directly from light has
been known for over a century. However, the development of practical applications
is much more recent, so photovoltaic (PV) technology is still at a relatively early stage
of development. It has been identified as a technology with considerable potential
Page 136 of 218
and the technology has undergone rapid development over the past decade,
resulting in efficiency improvements, development of thin film PV and production of
new PV materials.
At present, PV cells are used mainly in stand-alone systems to provide an
electricity supply in either remote rural locations or remote industrial applications
such as communications stations. Recently, modules have been integrated into
building facades to provide power for the building itself. Large-scale applications
such as the provision of power to the grid are still at the pilot stage. Worldwide the
potential solar resource is huge and, as developments in PV technology lead to
reductions in the cost of systems, the uses of PV are likely to expand to include the
provision of power for the grid.
PV systems generate few environmental impacts; indeed, they are a clean source of
energy in that they produce no atmospheric emissions from electricity generation,
because they harness a natural resource and convert it into electrical power.
Nonetheless, some potential environmental impacts can arise from PV systems.
These are confined mainly to large multi-megawatt systems and are due principally
to the large land area such systems require, which can cause visual intrusion and
have potential impacts on ecosystems. There are also a number of potential impacts
associated with the manufacture of PV cells, which is energy intensive and uses some
potentially toxic and hazardous materials.
Introduction – Fuel Cells
Fuel cells, when powered by pure clean hydrogen not acquired through the
reformation of fossil fuels, are totally emissions free. The only products of the cell,
Page 137 of 218
besides electric current, are heat and pure potable H2O. Through cogeneration of the
heat into steam and regeneration of the water using the process of electrolysation,
even these by-products are utilized. In the case that they are not utilized, there is still
no harm done to the surrounding environment.
The reality, however, is that pure hydrogen is rarely used except for in laboratory
studies. Steam reformers are often used to isolate the hydrogen out of hydrocarbon
fuels. Steam reformation is the process of combining steam with a hydrocarbon to
isolate the hydrogen. The resulting CO2 emissions are lower than those from a
combustion engine. Steam reformation emits zero to very small amounts of NOx and
SO2.
Even though the use of fossil fuels such as natural gas and propane is not totally
emissions free and not renewable, the use of these fuels to power fuel cells is cleaner
than the use of combustion engines and will allow for the continued improvement of
fuel cells. Fuel cells are more environmentally sound than conventional energy
technologies. Below is a comparison of the amount of pollution produced by fuel
cells versus conventional energy technologies.

Page 138 of 218
Page 139 of 218
Introduction to Life Cycle Assessment
Before we start calculating and analysing the emissions of the house together with
the renewable energy system emissions we must first know what is LCA, how is
being used, what results can give us, what steps to take for implementing such a tool.
As environmental awareness increases, industries and businesses have started to
assess how their activities affect the environment. Society has become concerned
about the issues of natural resource depletion and environmental degradation. Many
businesses have responded to this awareness by providing "greener" products and
using "greener" processes. The environmental performance of products and
processes has become a key issue, which is why some companies are investigating
ways to minimize their effects on the environment. Many companies have found it
advantageous to explore ways of moving beyond compliance using pollution
prevention strategies and environmental management systems to improve their
environmental performance. One such tool is called life cycle assessment (LCA). This
concept considers the entire life cycle of a product.
What is Life Cycle Assessment (LCA)?
Life cycle assessment is a "cradle-to-grave" approach for assessing industrial
systems. "Cradle-to-grave" begins with the gathering of raw materials from the earth
to create the product and ends at the point when all materials are returned to the
earth. LCA evaluates all stages of a product's life from the perspective that they are
interdependent, meaning that one operation leads to the next. LCA enables the
estimation of the cumulative environmental impacts resulting from all stages in the
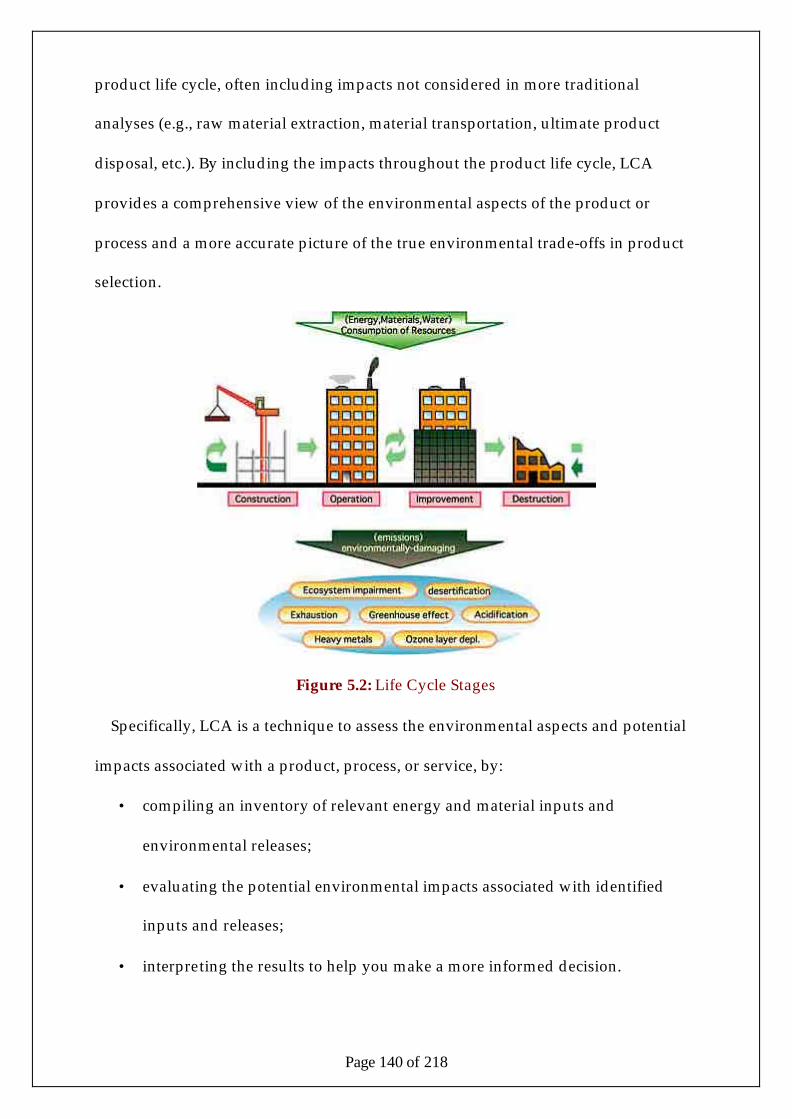
Page 140 of 218
product life cycle, often including impacts not considered in more traditional
analyses (e.g., raw material extraction, material transportation, ultimate product
disposal, etc.). By including the impacts throughout the product life cycle, LCA
provides a comprehensive view of the environmental aspects of the product or
process and a more accurate picture of the true environmental trade-offs in product
selection.
Figure 5.2: Life Cycle Stages
Specifically, LCA is a technique to assess the environmental aspects and potential
impacts associated with a product, process, or service, by:
• compiling an inventory of relevant energy and material inputs and
environmental releases;
• evaluating the potential environmental impacts associated with identified
inputs and releases;
• interpreting the results to help you make a more informed decision.
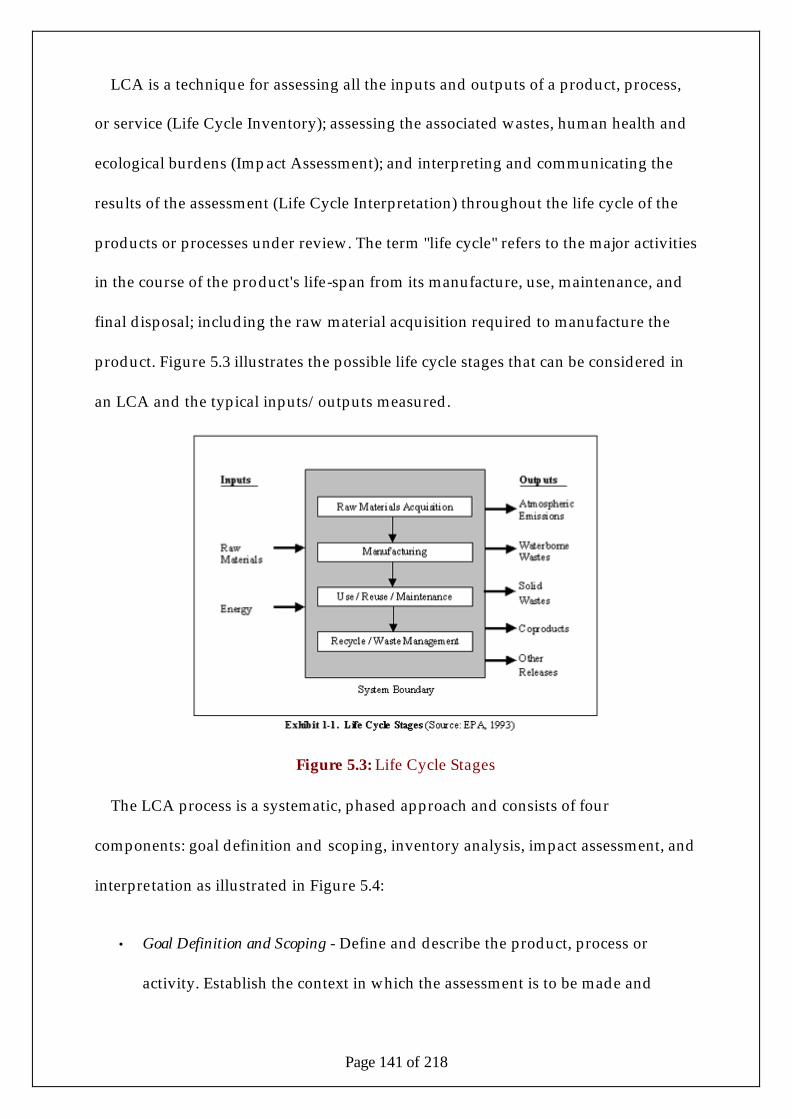
Page 141 of 218
LCA is a technique for assessing all the inputs and outputs of a product, process,
or service (Life Cycle Inventory); assessing the associated wastes, human health and
ecological burdens (Impact Assessment); and interpreting and communicating the
results of the assessment (Life Cycle Interpretation) throughout the life cycle of the
products or processes under review. The term "life cycle" refers to the major activities
in the course of the product's life-span from its manufacture, use, maintenance, and
final disposal; including the raw material acquisition required to manufacture the
product. Figure 5.3 illustrates the possible life cycle stages that can be considered in
an LCA and the typical inputs/outputs measured.
Figure 5.3: Life Cycle Stages
The LCA process is a systematic, phased approach and consists of four
components: goal definition and scoping, inventory analysis, impact assessment, and
interpretation as illustrated in Figure 5.4:
• Goal Definition and Scoping - Define and describe the product, process or
activity. Establish the context in which the assessment is to be made and

Page 142 of 218
identify the boundaries and environmental effects to be reviewed for the
assessment.
• Inventory Analysis - Identify and quantify energy, water and materials usage
and environmental releases (e.g., air emissions, solid waste disposal, and
wastewater discharge).
• Impact Assessment - Assess the human and ecological effects of energy, water,
and material usage and the environmental releases identified in the inventory
analysis.
• Interpretation - Evaluate the results of the inventory analysis and impact
assessment to select the preferred product, process or service with a clear
understanding of the uncertainty and the assumptions used to generate the
results.
Life cycle assessment is unique because it encompasses all processes and
environmental releases beginning with the extraction of raw materials and the
production of energy used to create the product through the use and final disposition
of the product. When deciding between two alternatives, LCA can help decision-
makers compare all major environmental impacts caused by products, processes, or
services.
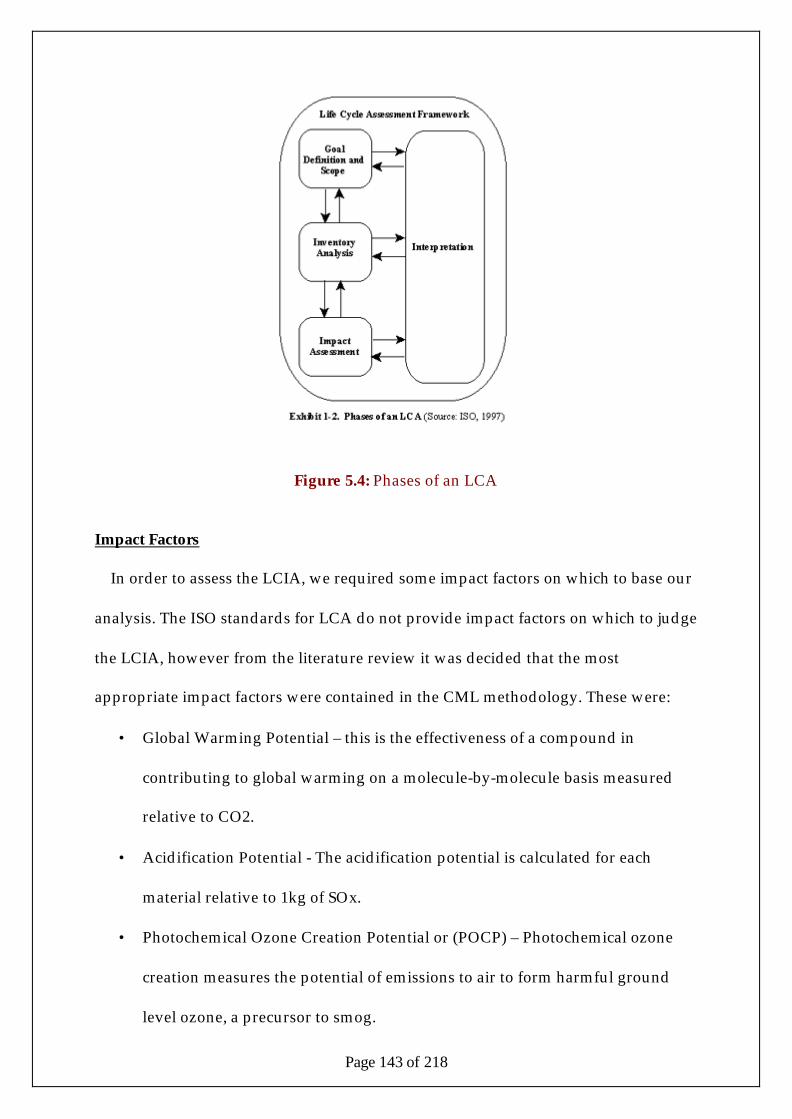
Page 143 of 218
Figure 5.4: Phases of an LCA
Impact Factors
In order to assess the LCIA, we required some impact factors on which to base our
analysis. The ISO standards for LCA do not provide impact factors on which to judge
the LCIA, however from the literature review it was decided that the most
appropriate impact factors were contained in the CML methodology. These were:
• Global Warming Potential – this is the effectiveness of a compound in
contributing to global warming on a molecule-by-molecule basis measured
relative to CO2.
• Acidification Potential - The acidification potential is calculated for each
material relative to 1kg of SOx.
• Photochemical Ozone Creation Potential or (POCP) – Photochemical ozone
creation measures the potential of emissions to air to form harmful ground
level ozone, a precursor to smog.
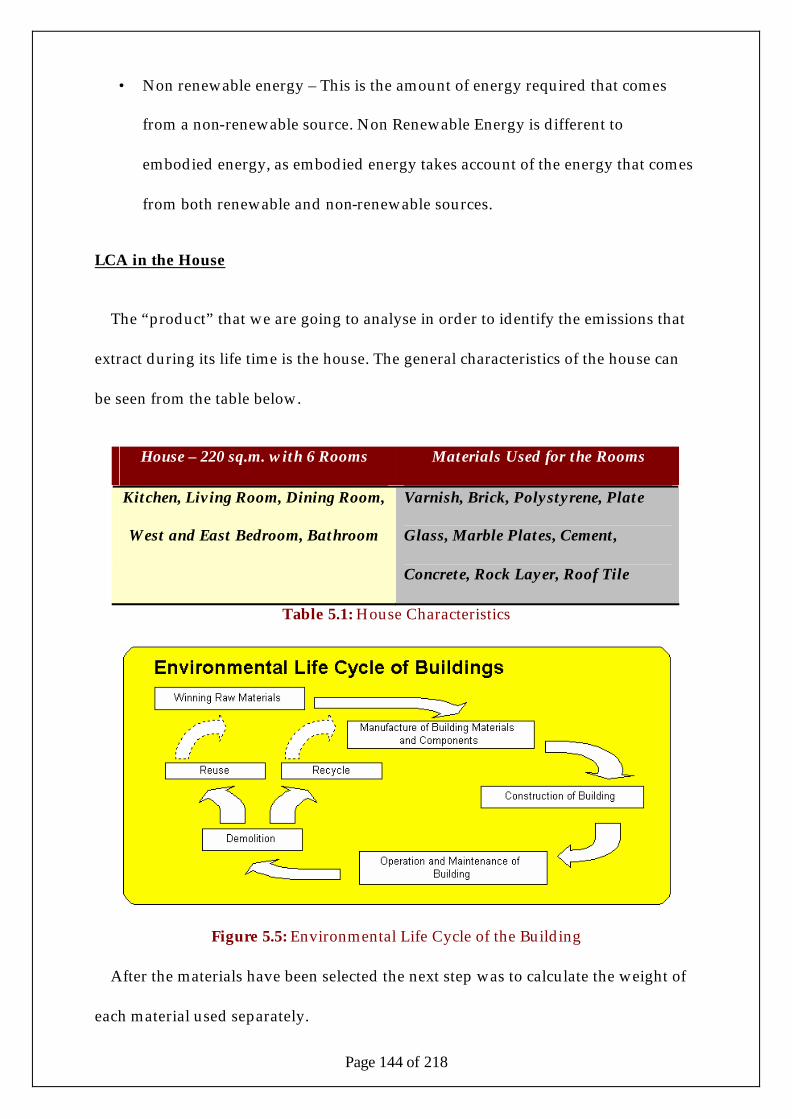
Page 144 of 218
• Non renewable energy – This is the amount of energy required that comes
from a non-renewable source. Non Renewable Energy is different to
embodied energy, as embodied energy takes account of the energy that comes
from both renewable and non-renewable sources.
LCA in the House
The “product” that we are going to analyse in order to identify the emissions that
extract during its life time is the house. The general characteristics of the house can
be seen from the table below.
House – 220 sq.m. with 6 Rooms Materials Used for the Rooms
Kitchen, Living Room, Dining Room,
West and East Bedroom, Bathroom
Varnish, Brick, Polystyrene, Plate
Glass, Marble Plates, Cement,
Concrete, Rock Layer, Roof Tile
Table 5.1: House Characteristics
Figure 5.5: Environmental Life Cycle of the Building
After the materials have been selected the next step was to calculate the weight of
each material used separately.

Page 145 of 218
In the table below we can see how we calculated the mass of Brick that needed for
the wall of the kitchen room.
Description Thickness
(m)
Surface
Area
(m2)
Volume
(m3)
Density
Mass
(kg/m3)
Mass
(kg)
Assembly
Loss (%)
Total
Mass
(kg)
Brick 0.09 18.36 1.6524 1200 1983 5 2082
Table 5.2: Calculation of Bricks Mass
The total estimated weight from all the materials was 407.1 tonnes.
The life expectancy of the house is estimated to be 45 years. The analysis of the
environmental impact of the house will start from the manufacture of the products,
the construction of the house, the use of the house for a period of 20 years and last
the elimination phase. In the analysis we also have included the transportation of the
products to the place of construction and the transportation to a landfill. This
representation it can be seen in the figure below.
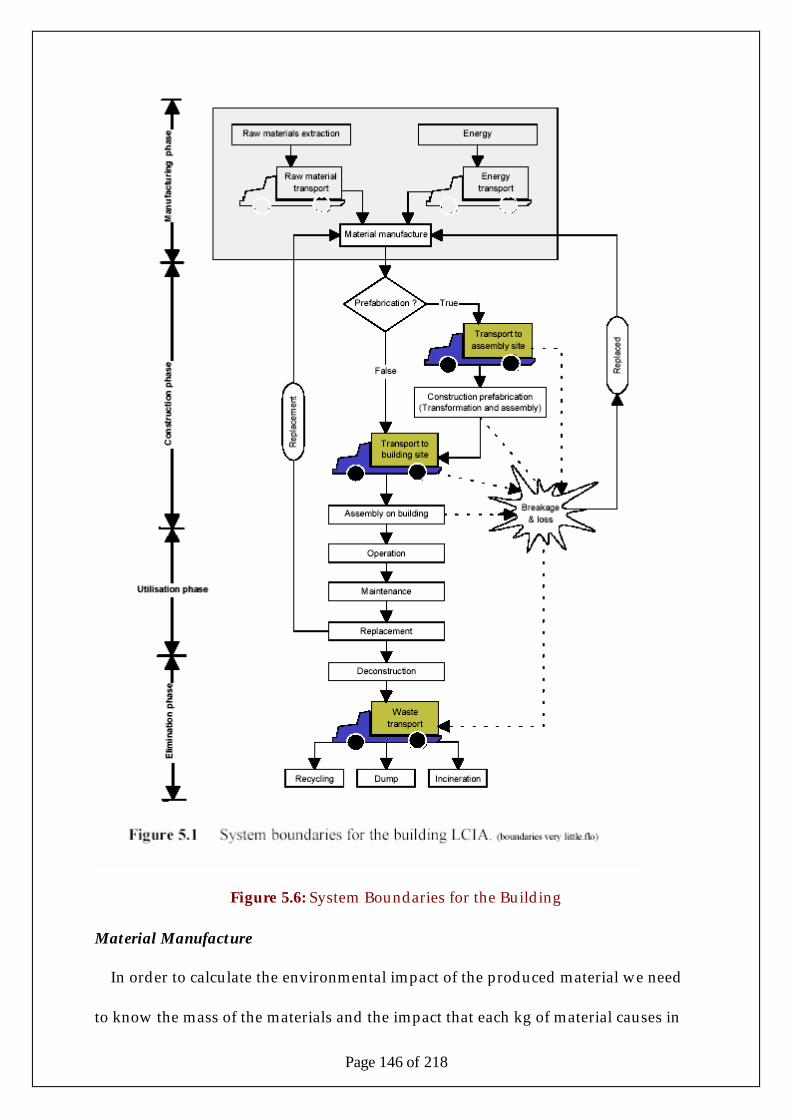
Page 146 of 218
Figure 5.6: System Boundaries for the Building
Material Manufacture
In order to calculate the environmental impact of the produced material we need
to know the mass of the materials and the impact that each kg of material causes in
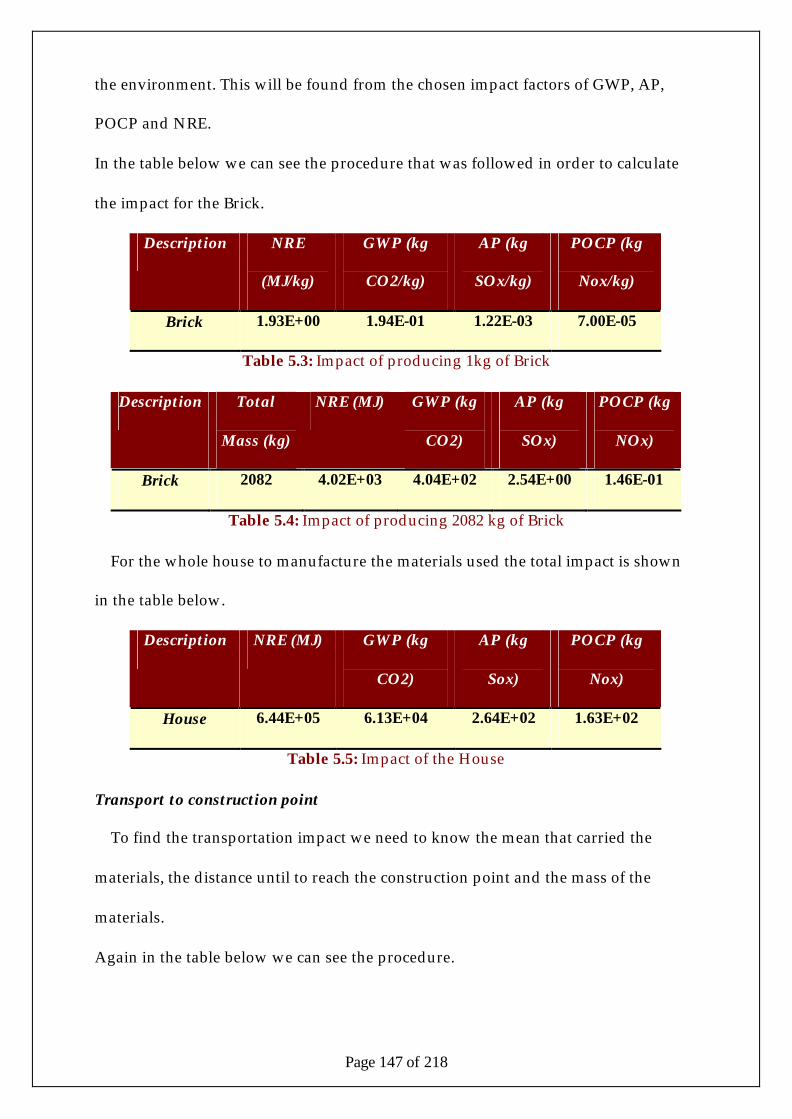
Page 147 of 218
the environment. This will be found from the chosen impact factors of GWP, AP,
POCP and NRE.
In the table below we can see the procedure that was followed in order to calculate
the impact for the Brick.
Description NRE
(MJ/kg)
GWP (kg
CO2/kg)
AP (kg
SOx/kg)
POCP (kg
Nox/kg)
Brick 1.93E+00 1.94E-01 1.22E-03 7.00E-05
Table 5.3: Impact of producing 1kg of Brick
Description Total
Mass (kg)
NRE (MJ) GWP (kg
CO2)
AP (kg
SOx)
POCP (kg
NOx)
Brick 2082 4.02E+03 4.04E+02 2.54E+00 1.46E-01
Table 5.4: Impact of producing 2082 kg of Brick
For the whole house to manufacture the materials used the total impact is shown
in the table below.
Description NRE (MJ) GWP (kg
CO2)
AP (kg
Sox)
POCP (kg
Nox)
House 6.44E+05 6.13E+04 2.64E+02 1.63E+02
Table 5.5: Impact of the House
Transport to construction point
To find the transportation impact we need to know the mean that carried the
materials, the distance until to reach the construction point and the mass of the
materials.
Again in the table below we can see the procedure.
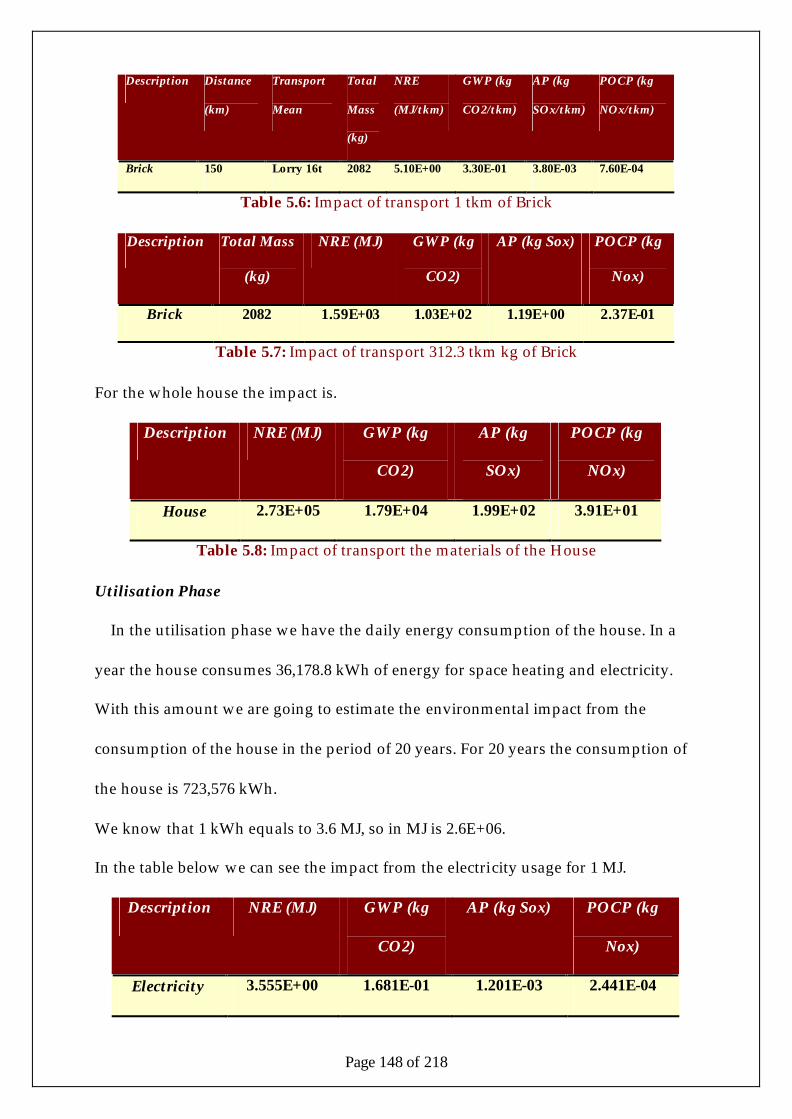
Page 148 of 218
Description Distance
(km)
Transport
Mean
Total
Mass
(kg)
NRE
(MJ/tkm)
GWP (kg
CO2/tkm)
AP (kg
SOx/tkm)
POCP (kg
NOx/tkm)
Brick 150 Lorry 16t 2082 5.10E+00 3.30E-01 3.80E-03 7.60E-04
Table 5.6: Impact of transport 1 tkm of Brick
Description Total Mass
(kg)
NRE (MJ) GWP (kg
CO2)
AP (kg Sox) POCP (kg
Nox)
Brick 2082 1.59E+03 1.03E+02 1.19E+00 2.37E-01
Table 5.7: Impact of transport 312.3 tkm kg of Brick
For the whole house the impact is.
Description NRE (MJ) GWP (kg
CO2)
AP (kg
SOx)
POCP (kg
NOx)
House 2.73E+05 1.79E+04 1.99E+02 3.91E+01
Table 5.8: Impact of transport the materials of the House
Utilisation Phase
In the utilisation phase we have the daily energy consumption of the house. In a
year the house consumes 36,178.8 kWh of energy for space heating and electricity.
With this amount we are going to estimate the environmental impact from the
consumption of the house in the period of 20 years. For 20 years the consumption of
the house is 723,576 kWh.
We know that 1 kWh equals to 3.6 MJ, so in MJ is 2.6E+06.
In the table below we can see the impact from the electricity usage for 1 MJ.
Description NRE (MJ) GWP (kg
CO2)
AP (kg Sox) POCP (kg
Nox)
Electricity 3.555E+00 1.681E-01 1.201E-03 2.441E-04
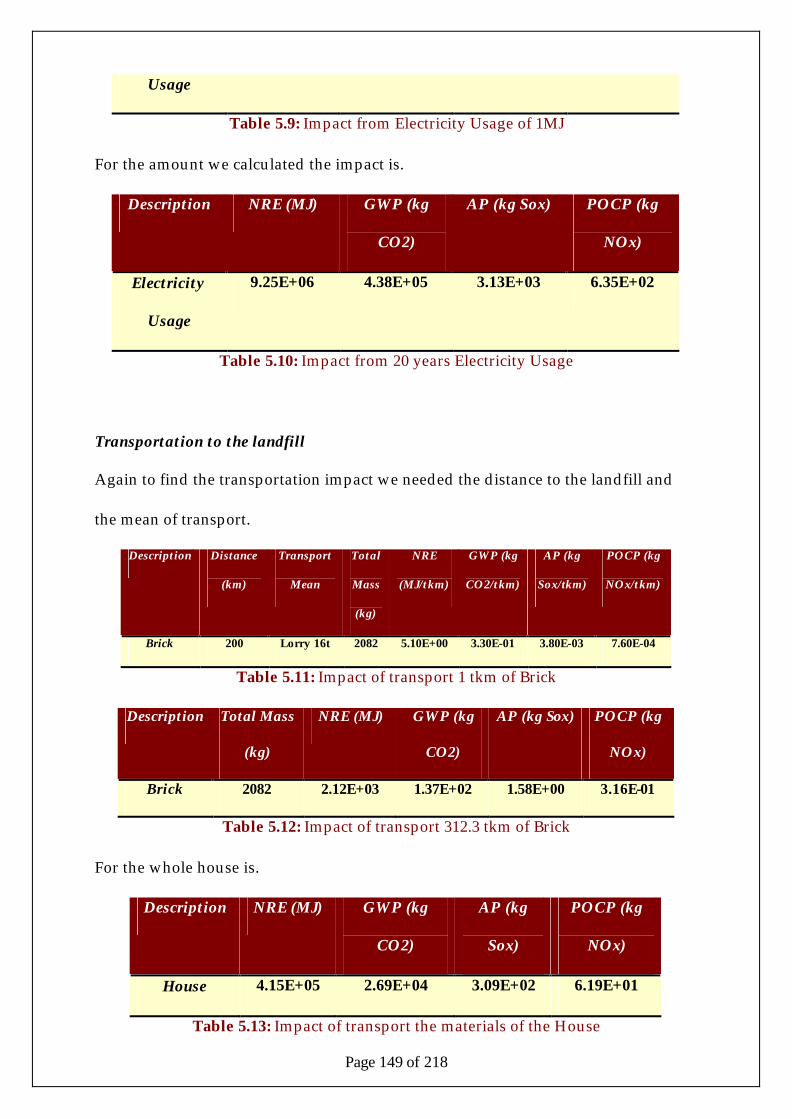
Page 149 of 218
Usage
Table 5.9: Impact from Electricity Usage of 1MJ
For the amount we calculated the impact is.
Description NRE (MJ) GWP (kg
CO2)
AP (kg Sox) POCP (kg
NOx)
Electricity
Usage
9.25E+06 4.38E+05 3.13E+03 6.35E+02
Table 5.10: Impact from 20 years Electricity Usage
Transportation to the landfill
Again to find the transportation impact we needed the distance to the landfill and
the mean of transport.
Description Distance
(km)
Transport
Mean
Total
Mass
(kg)
NRE
(MJ/tkm)
GWP (kg
CO2/tkm)
AP (kg
Sox/tkm)
POCP (kg
NOx/tkm)
Brick 200 Lorry 16t 2082 5.10E+00 3.30E-01 3.80E-03 7.60E-04
Table 5.11: Impact of transport 1 tkm of Brick
Description Total Mass
(kg)
NRE (MJ) GWP (kg
CO2)
AP (kg Sox) POCP (kg
NOx)
Brick 2082 2.12E+03 1.37E+02 1.58E+00 3.16E-01
Table 5.12: Impact of transport 312.3 tkm of Brick
For the whole house is.
Description NRE (MJ) GWP (kg
CO2)
AP (kg
Sox)
POCP (kg
NOx)
House 4.15E+05 2.69E+04 3.09E+02 6.19E+01
Table 5.13: Impact of transport the materials of the House
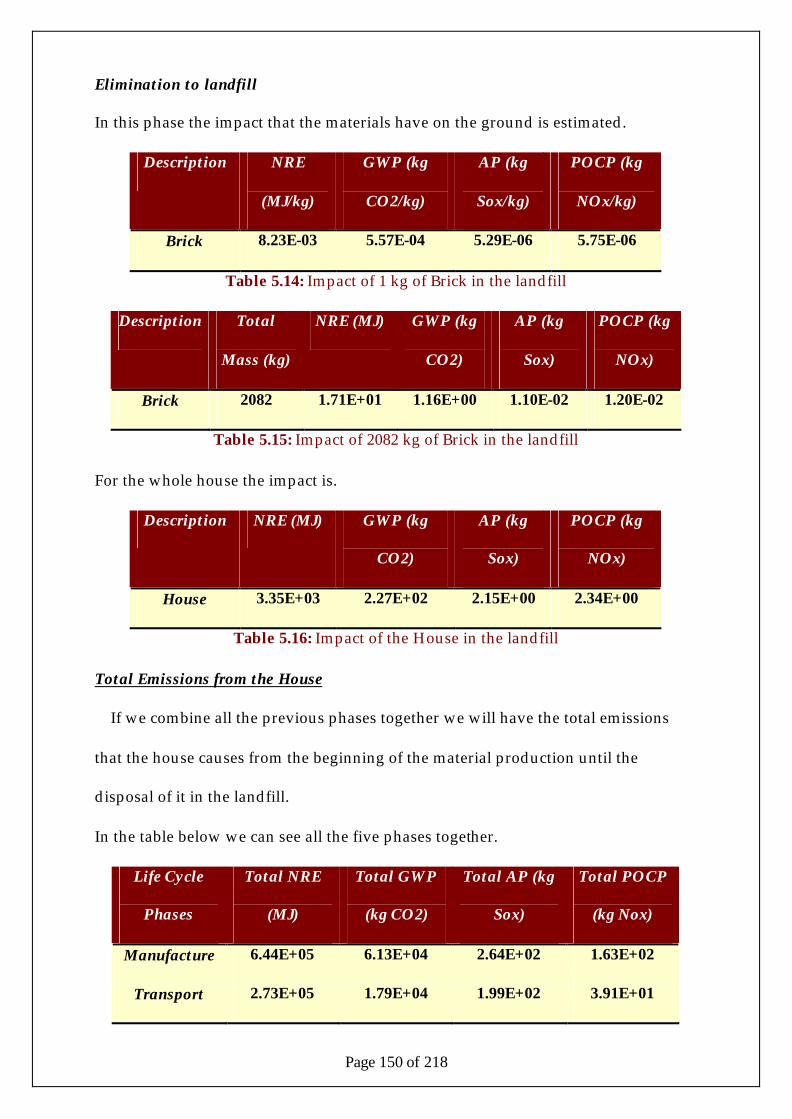
Page 150 of 218
Elimination to landfill
In this phase the impact that the materials have on the ground is estimated.
Description NRE
(MJ/kg)
GWP (kg
CO2/kg)
AP (kg
Sox/kg)
POCP (kg
NOx/kg)
Brick 8.23E-03 5.57E-04 5.29E-06 5.75E-06
Table 5.14: Impact of 1 kg of Brick in the landfill
Description Total
Mass (kg)
NRE (MJ) GWP (kg
CO2)
AP (kg
Sox)
POCP (kg
NOx)
Brick 2082 1.71E+01 1.16E+00 1.10E-02 1.20E-02
Table 5.15: Impact of 2082 kg of Brick in the landfill
For the whole house the impact is.
Description NRE (MJ) GWP (kg
CO2)
AP (kg
Sox)
POCP (kg
NOx)
House 3.35E+03 2.27E+02 2.15E+00 2.34E+00
Table 5.16: Impact of the House in the landfill
Total Emissions from the House
If we combine all the previous phases together we will have the total emissions
that the house causes from the beginning of the material production until the
disposal of it in the landfill.
In the table below we can see all the five phases together.
Life Cycle
Phases
Total NRE
(MJ)
Total GWP
(kg CO2)
Total AP (kg
Sox)
Total POCP
(kg Nox)
Manufacture 6.44E+05 6.13E+04 2.64E+02 1.63E+02
Transport 2.73E+05 1.79E+04 1.99E+02 3.91E+01
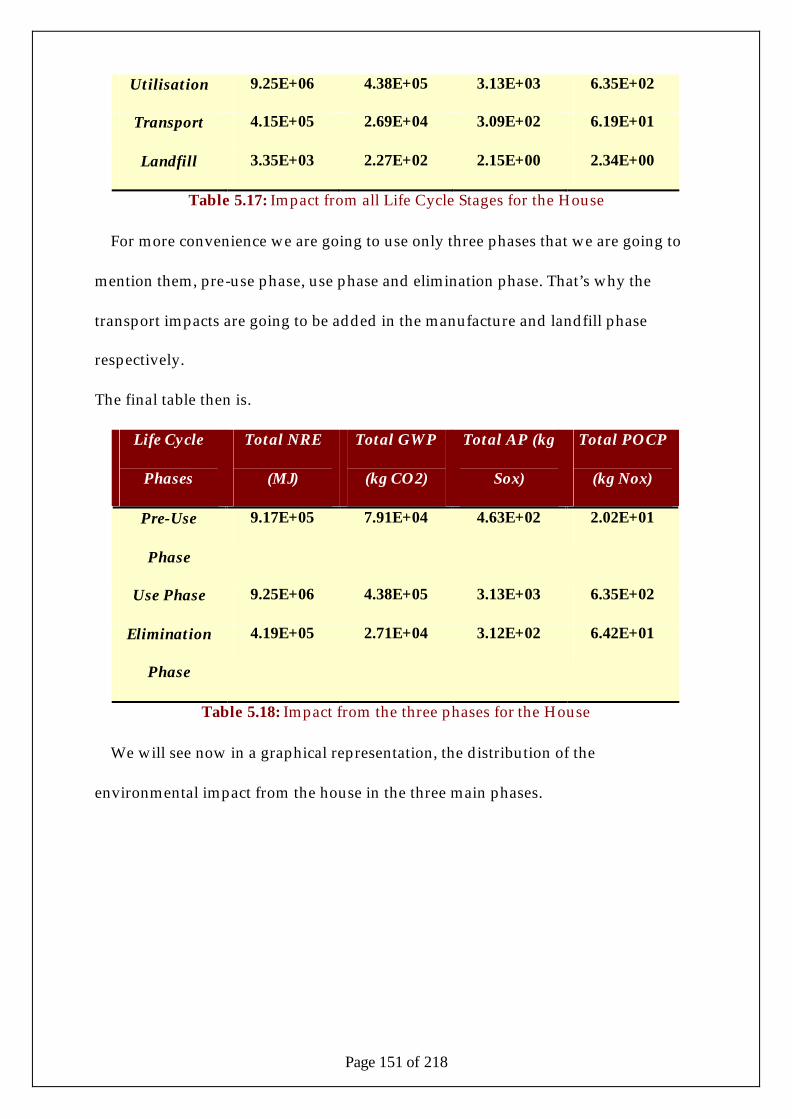
Page 151 of 218
Utilisation 9.25E+06 4.38E+05 3.13E+03 6.35E+02
Transport 4.15E+05 2.69E+04 3.09E+02 6.19E+01
Landfill 3.35E+03 2.27E+02 2.15E+00 2.34E+00
Table 5.17: Impact from all Life Cycle Stages for the House
For more convenience we are going to use only three phases that we are going to
mention them, pre-use phase, use phase and elimination phase. That’s why the
transport impacts are going to be added in the manufacture and landfill phase
respectively.
The final table then is.
Life Cycle
Phases
Total NRE
(MJ)
Total GWP
(kg CO2)
Total AP (kg
Sox)
Total POCP
(kg Nox)
Pre-Use
Phase
9.17E+05 7.91E+04 4.63E+02 2.02E+01
Use Phase 9.25E+06 4.38E+05 3.13E+03 6.35E+02
Elimination
Phase
4.19E+05 2.71E+04 3.12E+02 6.42E+01
Table 5.18: Impact from the three phases for the House
We will see now in a graphical representation, the distribution of the
environmental impact from the house in the three main phases.
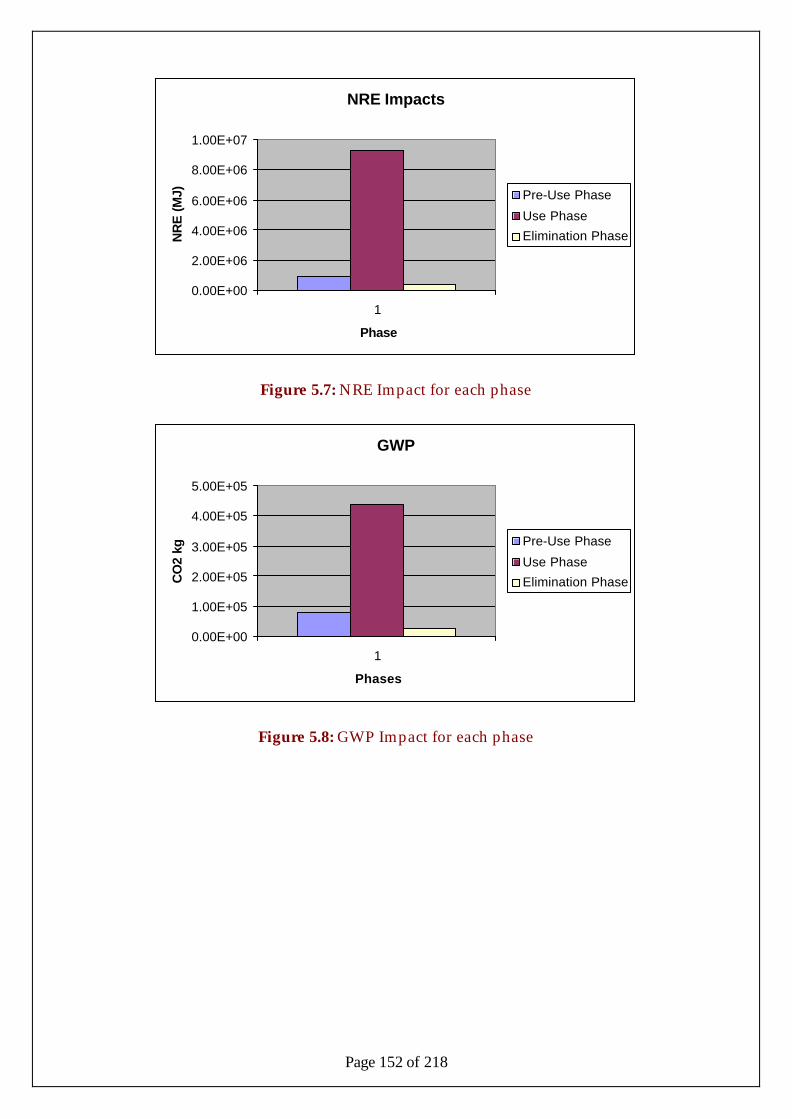
Page 152 of 218
NRE Impacts
0.00E+00
2.00E+06
4.00E+06
6.00E+06
8.00E+06
1.00E+07
1
Phase
NR
E (
MJ) Pre-Use Phase
Use Phase
Elimination Phase
Figure 5.7: NRE Impact for each phase
GWP
0.00E+00
1.00E+05
2.00E+05
3.00E+05
4.00E+05
5.00E+05
1
Phases
CO
2 kg
Pre-Use Phase
Use Phase
Elimination Phase
Figure 5.8: GWP Impact for each phase
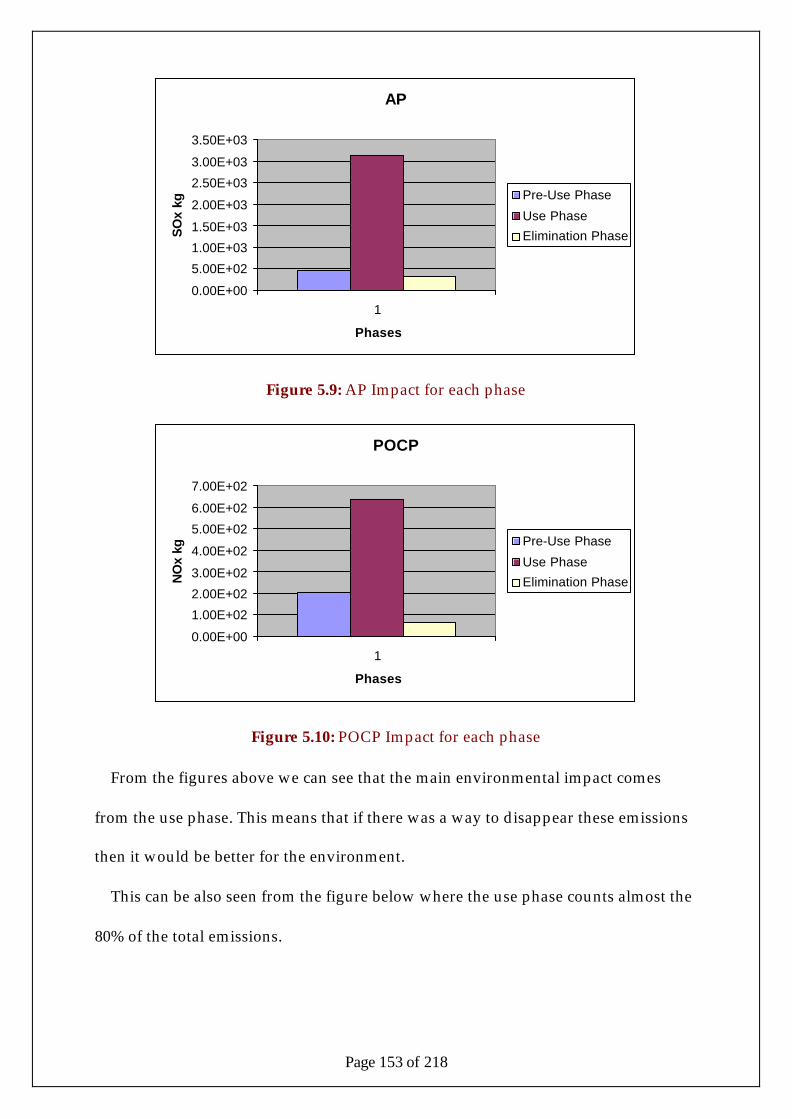
Page 153 of 218
AP
0.00E+00
5.00E+02
1.00E+03
1.50E+03
2.00E+03
2.50E+03
3.00E+03
3.50E+03
1
Phases
SO
x kg
Pre-Use Phase
Use Phase
Elimination Phase
Figure 5.9: AP Impact for each phase
POCP
0.00E+00
1.00E+02
2.00E+02
3.00E+02
4.00E+02
5.00E+02
6.00E+02
7.00E+02
1
Phases
NO
x kg
Pre-Use Phase
Use Phase
Elimination Phase
Figure 5.10: POCP Impact for each phase
From the figures above we can see that the main environmental impact comes
from the use phase. This means that if there was a way to disappear these emissions
then it would be better for the environment.
This can be also seen from the figure below where the use phase counts almost the
80% of the total emissions.
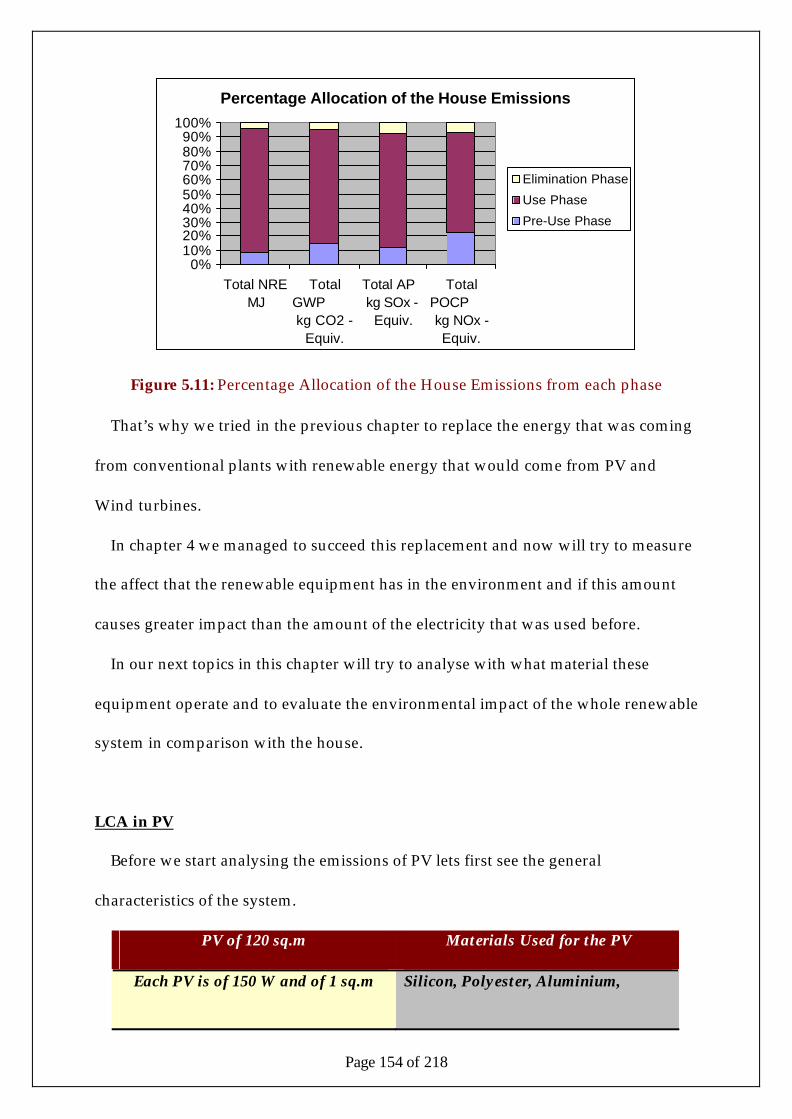
Page 154 of 218
Percentage Allocation of the House Emissions
0%10%20%30%40%50%60%70%80%90%
100%
Total NREMJ
TotalGWP kg CO2 -
Equiv.
Total AP kg SOx -
Equiv.
TotalPOCP kg NOx -Equiv.
Elimination Phase
Use Phase
Pre-Use Phase
Figure 5.11: Percentage Allocation of the House Emissions from each phase
That’s why we tried in the previous chapter to replace the energy that was coming
from conventional plants with renewable energy that would come from PV and
Wind turbines.
In chapter 4 we managed to succeed this replacement and now will try to measure
the affect that the renewable equipment has in the environment and if this amount
causes greater impact than the amount of the electricity that was used before.
In our next topics in this chapter will try to analyse with what material these
equipment operate and to evaluate the environmental impact of the whole renewable
system in comparison with the house.
LCA in PV
Before we start analysing the emissions of PV lets first see the general
characteristics of the system.
PV of 120 sq.m Materials Used for the PV
Each PV is of 150 W and of 1 sq.m Silicon, Polyester, Aluminium,
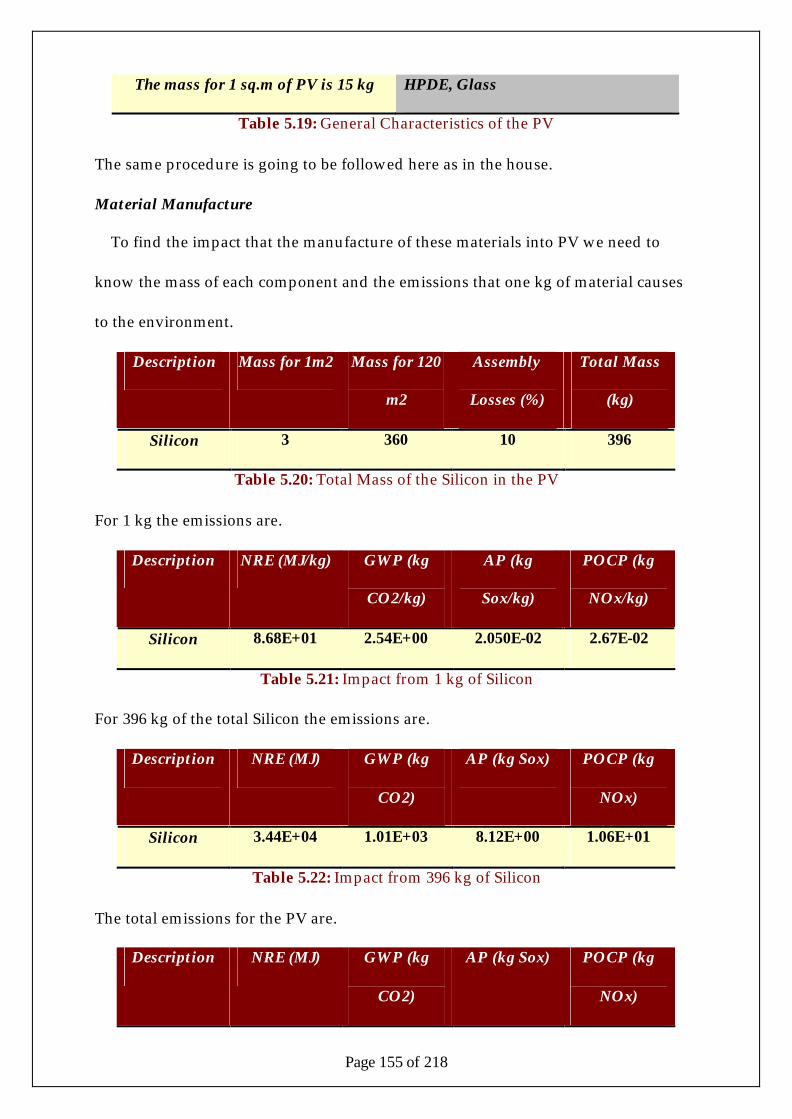
Page 155 of 218
The mass for 1 sq.m of PV is 15 kg HPDE, Glass
Table 5.19: General Characteristics of the PV
The same procedure is going to be followed here as in the house.
Material Manufacture
To find the impact that the manufacture of these materials into PV we need to
know the mass of each component and the emissions that one kg of material causes
to the environment.
Description Mass for 1m2 Mass for 120
m2
Assembly
Losses (%)
Total Mass
(kg)
Silicon 3 360 10 396
Table 5.20: Total Mass of the Silicon in the PV
For 1 kg the emissions are.
Description NRE (MJ/kg) GWP (kg
CO2/kg)
AP (kg
Sox/kg)
POCP (kg
NOx/kg)
Silicon 8.68E+01 2.54E+00 2.050E-02 2.67E-02
Table 5.21: Impact from 1 kg of Silicon
For 396 kg of the total Silicon the emissions are.
Description NRE (MJ) GWP (kg
CO2)
AP (kg Sox) POCP (kg
NOx)
Silicon 3.44E+04 1.01E+03 8.12E+00 1.06E+01
Table 5.22: Impact from 396 kg of Silicon
The total emissions for the PV are.
Description NRE (MJ) GWP (kg
CO2)
AP (kg Sox) POCP (kg
NOx)
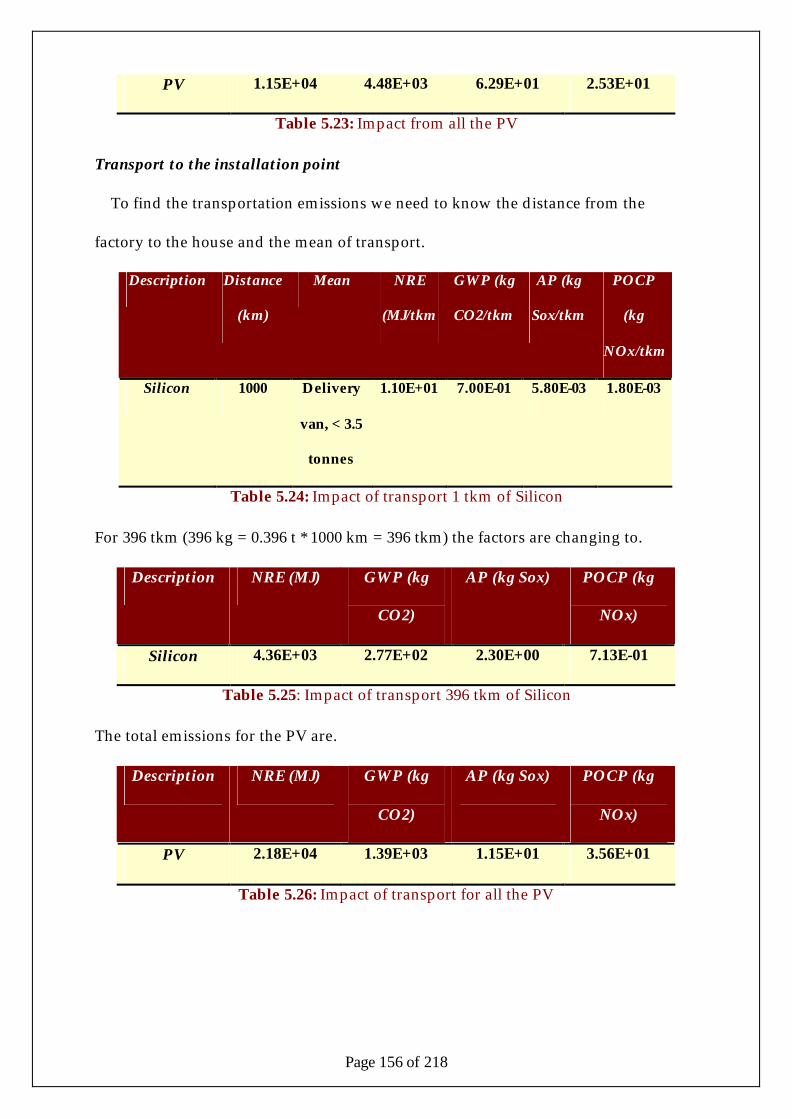
Page 156 of 218
PV 1.15E+04 4.48E+03 6.29E+01 2.53E+01
Table 5.23: Impact from all the PV
Transport to the installation point
To find the transportation emissions we need to know the distance from the
factory to the house and the mean of transport.
Description Distance
(km)
Mean NRE
(MJ/tkm
GWP (kg
CO2/tkm
AP (kg
Sox/tkm
POCP
(kg
NOx/tkm
Silicon 1000 Delivery
van, < 3.5
tonnes
1.10E+01 7.00E-01 5.80E-03 1.80E-03
Table 5.24: Impact of transport 1 tkm of Silicon
For 396 tkm (396 kg = 0.396 t * 1000 km = 396 tkm) the factors are changing to.
Description NRE (MJ) GWP (kg
CO2)
AP (kg Sox) POCP (kg
NOx)
Silicon 4.36E+03 2.77E+02 2.30E+00 7.13E-01
Table 5.25: Impact of transport 396 tkm of Silicon
The total emissions for the PV are.
Description NRE (MJ) GWP (kg
CO2)
AP (kg Sox) POCP (kg
NOx)
PV 2.18E+04 1.39E+03 1.15E+01 3.56E+01
Table 5.26: Impact of transport for all the PV

Page 157 of 218
Utilisation Phase
In the use phase we assume that the maintenance of a system like PV cause
negligible emissions compared with the other two phases.
An important advantage of PV systems is that they require little maintenance. The
arrays themselves are durable and reliable and need little attention.
Unless you live in an extremely dusty area or have severe problems with ice
storms, you need to inspect the wiring and general panel appearance only
occasionally. If your system has an adjustable mounting, you can carry out this
routine maintenance check at the same time as you adjust the tilt angle of the array.
When you adjust the angle of the array for winter operation, snow loading is not a
problem because the array is tilted steeply. If the array becomes dusty, clean it with a
mild soap or plain water and a soft cloth. Do not use solvents or strong detergents.
Periodic Inspection List
Collector Shading: The performance of solar collectors/panels can be greatly affected
by shading. Vegetation growth over time or new construction on your house or your
neighbour’s property may produce shading that did not occur when the
collectors/panels were installed. Even the shade from something as small as an
overhead wire can reduce the output of some types of PV panels. Shading of one part
of even one module in a PV array can reduce the array output significantly. Visually
check for shading of the collectors/panels during the day (mid-morning, noon, and
mid-afternoon) on an annual basis.
Collector Soiling: Dusty or soiled collectors/modules will perform poorly. Periodic
cleaning may be necessary in dry, dusty climates. Bird droppings on PV panels
should be cleaned off as soon as they are noticed.
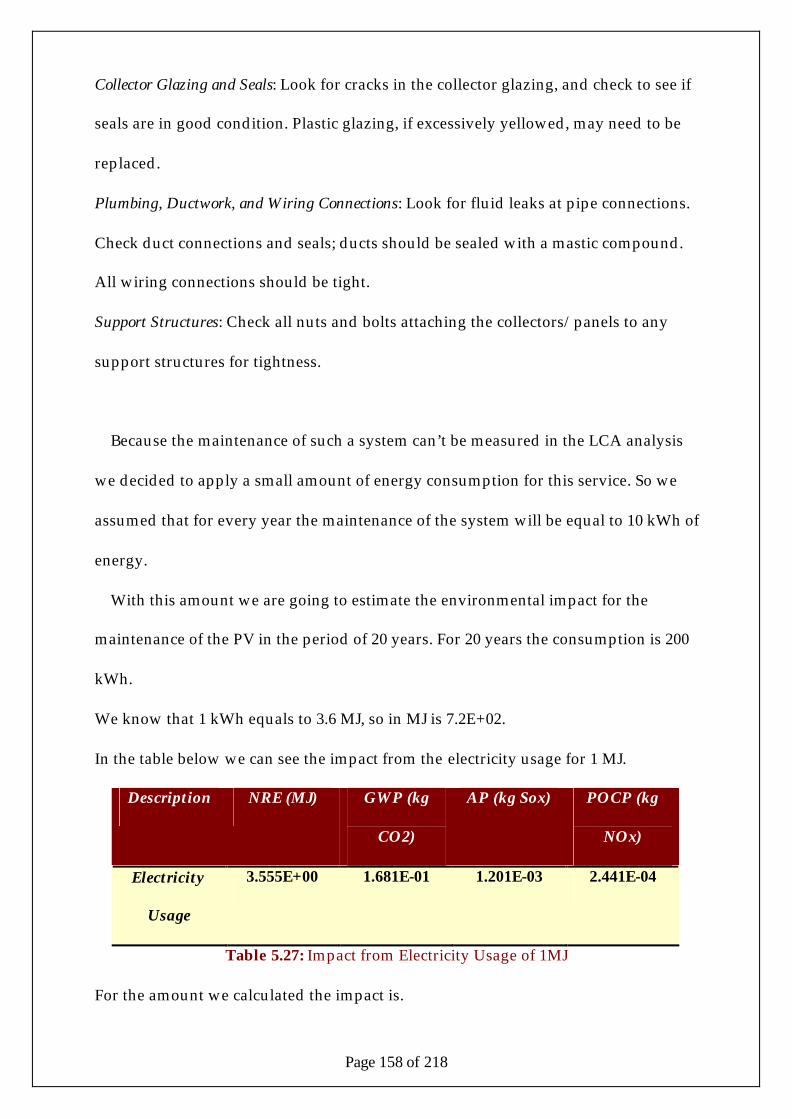
Page 158 of 218
Collector Glazing and Seals: Look for cracks in the collector glazing, and check to see if
seals are in good condition. Plastic glazing, if excessively yellowed, may need to be
replaced.
Plumbing, Ductwork, and Wiring Connections: Look for fluid leaks at pipe connections.
Check duct connections and seals; ducts should be sealed with a mastic compound.
All wiring connections should be tight.
Support Structures: Check all nuts and bolts attaching the collectors/panels to any
support structures for tightness.
Because the maintenance of such a system can’t be measured in the LCA analysis
we decided to apply a small amount of energy consumption for this service. So we
assumed that for every year the maintenance of the system will be equal to 10 kWh of
energy.
With this amount we are going to estimate the environmental impact for the
maintenance of the PV in the period of 20 years. For 20 years the consumption is 200
kWh.
We know that 1 kWh equals to 3.6 MJ, so in MJ is 7.2E+02.
In the table below we can see the impact from the electricity usage for 1 MJ.
Description NRE (MJ) GWP (kg
CO2)
AP (kg Sox) POCP (kg
NOx)
Electricity
Usage
3.555E+00 1.681E-01 1.201E-03 2.441E-04
Table 5.27: Impact from Electricity Usage of 1MJ
For the amount we calculated the impact is.
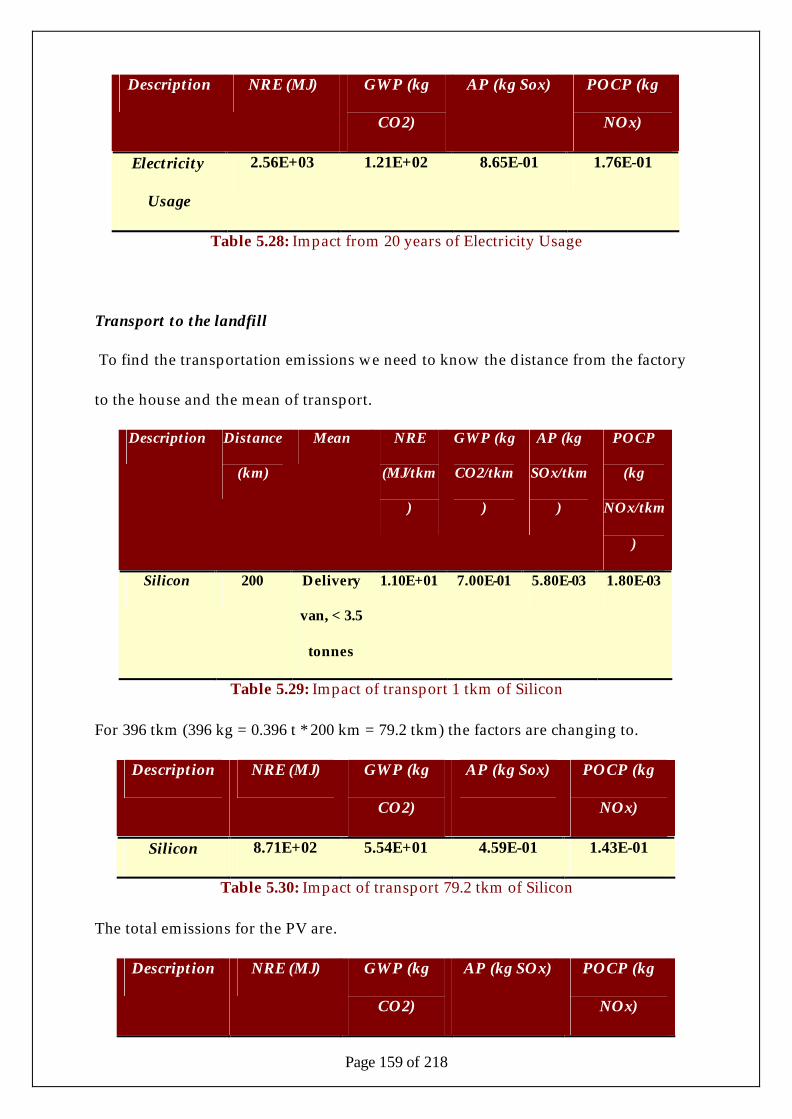
Page 159 of 218
Description NRE (MJ) GWP (kg
CO2)
AP (kg Sox) POCP (kg
NOx)
Electricity
Usage
2.56E+03 1.21E+02 8.65E-01 1.76E-01
Table 5.28: Impact from 20 years of Electricity Usage
Transport to the landfill
To find the transportation emissions we need to know the distance from the factory
to the house and the mean of transport.
Description Distance
(km)
Mean NRE
(MJ/tkm
)
GWP (kg
CO2/tkm
)
AP (kg
SOx/tkm
)
POCP
(kg
NOx/tkm
)
Silicon 200 Delivery
van, < 3.5
tonnes
1.10E+01 7.00E-01 5.80E-03 1.80E-03
Table 5.29: Impact of transport 1 tkm of Silicon
For 396 tkm (396 kg = 0.396 t * 200 km = 79.2 tkm) the factors are changing to.
Description NRE (MJ) GWP (kg
CO2)
AP (kg Sox) POCP (kg
NOx)
Silicon 8.71E+02 5.54E+01 4.59E-01 1.43E-01
Table 5.30: Impact of transport 79.2 tkm of Silicon
The total emissions for the PV are.
Description NRE (MJ) GWP (kg
CO2)
AP (kg SOx) POCP (kg
NOx)
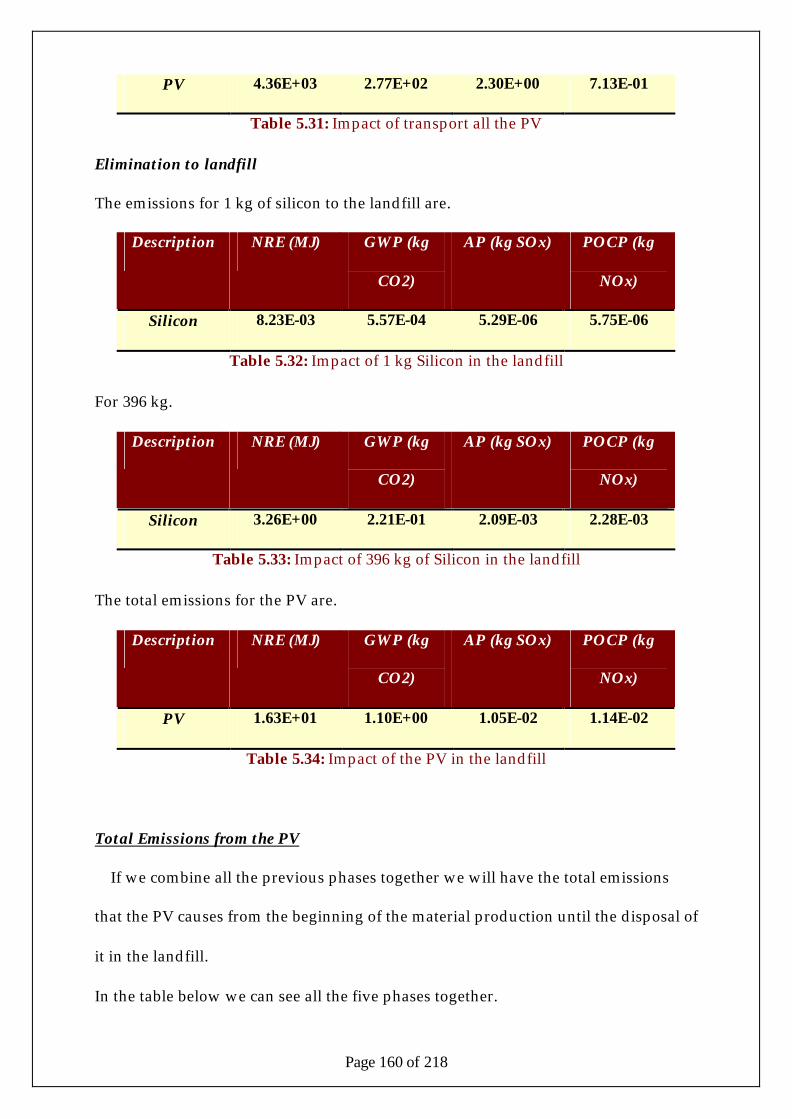
Page 160 of 218
PV 4.36E+03 2.77E+02 2.30E+00 7.13E-01
Table 5.31: Impact of transport all the PV
Elimination to landfill
The emissions for 1 kg of silicon to the landfill are.
Description NRE (MJ) GWP (kg
CO2)
AP (kg SOx) POCP (kg
NOx)
Silicon 8.23E-03 5.57E-04 5.29E-06 5.75E-06
Table 5.32: Impact of 1 kg Silicon in the landfill
For 396 kg.
Description NRE (MJ) GWP (kg
CO2)
AP (kg SOx) POCP (kg
NOx)
Silicon 3.26E+00 2.21E-01 2.09E-03 2.28E-03
Table 5.33: Impact of 396 kg of Silicon in the landfill
The total emissions for the PV are.
Description NRE (MJ) GWP (kg
CO2)
AP (kg SOx) POCP (kg
NOx)
PV 1.63E+01 1.10E+00 1.05E-02 1.14E-02
Table 5.34: Impact of the PV in the landfill
Total Emissions from the PV
If we combine all the previous phases together we will have the total emissions
that the PV causes from the beginning of the material production until the disposal of
it in the landfill.
In the table below we can see all the five phases together.
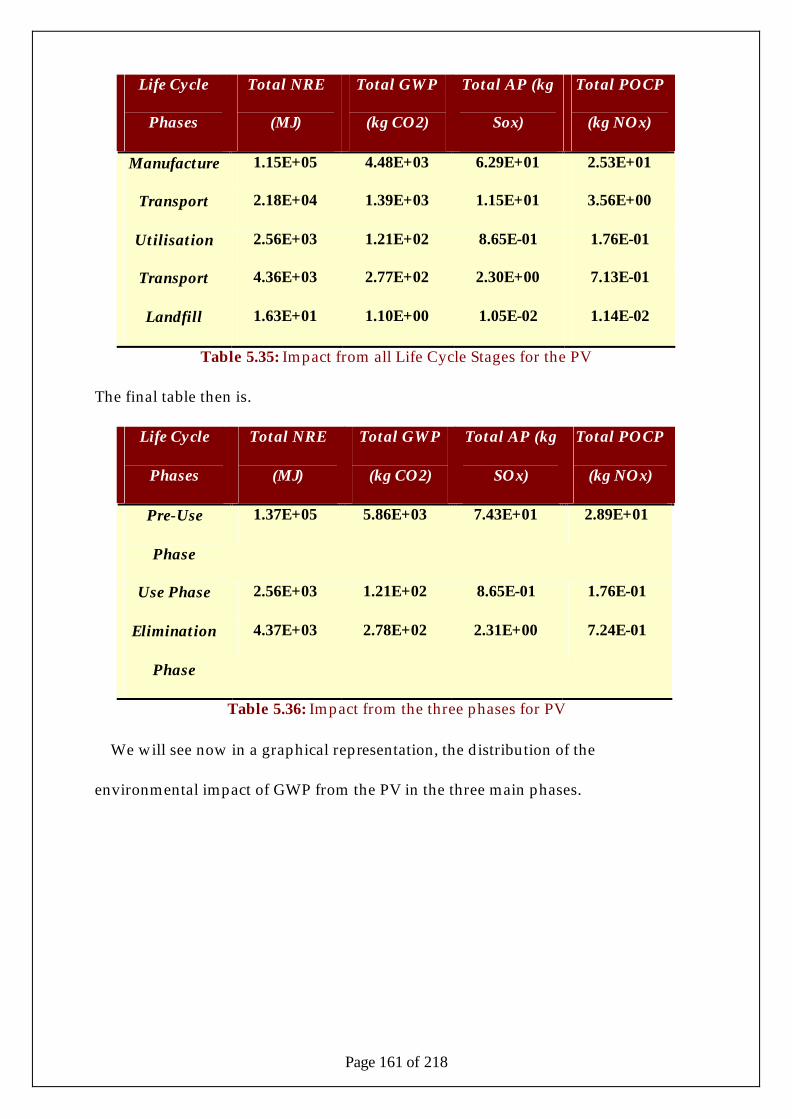
Page 161 of 218
Life Cycle
Phases
Total NRE
(MJ)
Total GWP
(kg CO2)
Total AP (kg
Sox)
Total POCP
(kg NOx)
Manufacture 1.15E+05 4.48E+03 6.29E+01 2.53E+01
Transport 2.18E+04 1.39E+03 1.15E+01 3.56E+00
Utilisation 2.56E+03 1.21E+02 8.65E-01 1.76E-01
Transport 4.36E+03 2.77E+02 2.30E+00 7.13E-01
Landfill 1.63E+01 1.10E+00 1.05E-02 1.14E-02
Table 5.35: Impact from all Life Cycle Stages for the PV
The final table then is.
Life Cycle
Phases
Total NRE
(MJ)
Total GWP
(kg CO2)
Total AP (kg
SOx)
Total POCP
(kg NOx)
Pre-Use
Phase
1.37E+05 5.86E+03 7.43E+01 2.89E+01
Use Phase 2.56E+03 1.21E+02 8.65E-01 1.76E-01
Elimination
Phase
4.37E+03 2.78E+02 2.31E+00 7.24E-01
Table 5.36: Impact from the three phases for PV
We will see now in a graphical representation, the distribution of the
environmental impact of GWP from the PV in the three main phases.
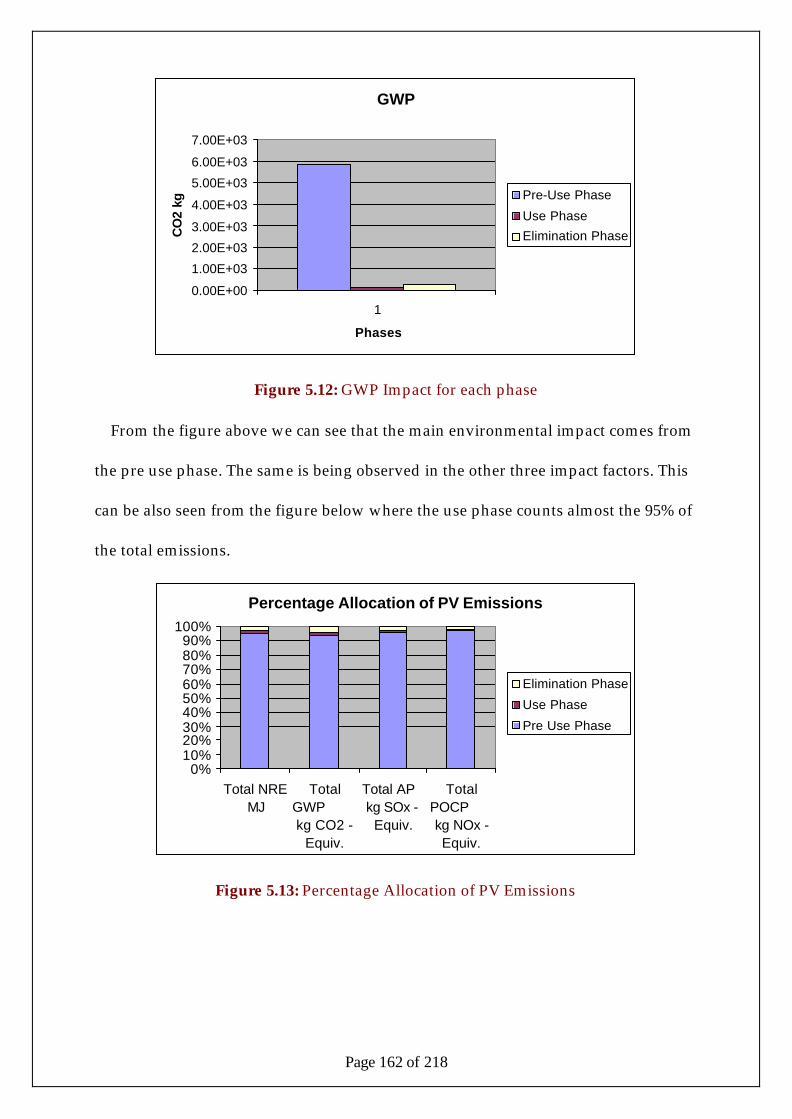
Page 162 of 218
GWP
0.00E+00
1.00E+03
2.00E+03
3.00E+03
4.00E+03
5.00E+03
6.00E+03
7.00E+03
1
Phases
CO
2 kg
Pre-Use Phase
Use Phase
Elimination Phase
Figure 5.12: GWP Impact for each phase
From the figure above we can see that the main environmental impact comes from
the pre use phase. The same is being observed in the other three impact factors. This
can be also seen from the figure below where the use phase counts almost the 95% of
the total emissions.
Percentage Allocation of PV Emissions
0%10%20%30%40%50%60%70%80%90%
100%
Total NREMJ
TotalGWP kg CO2 -
Equiv.
Total AP kg SOx -
Equiv.
TotalPOCP kg NOx -Equiv.
Elimination Phase
Use Phase
Pre Use Phase
Figure 5.13: Percentage Allocation of PV Emissions
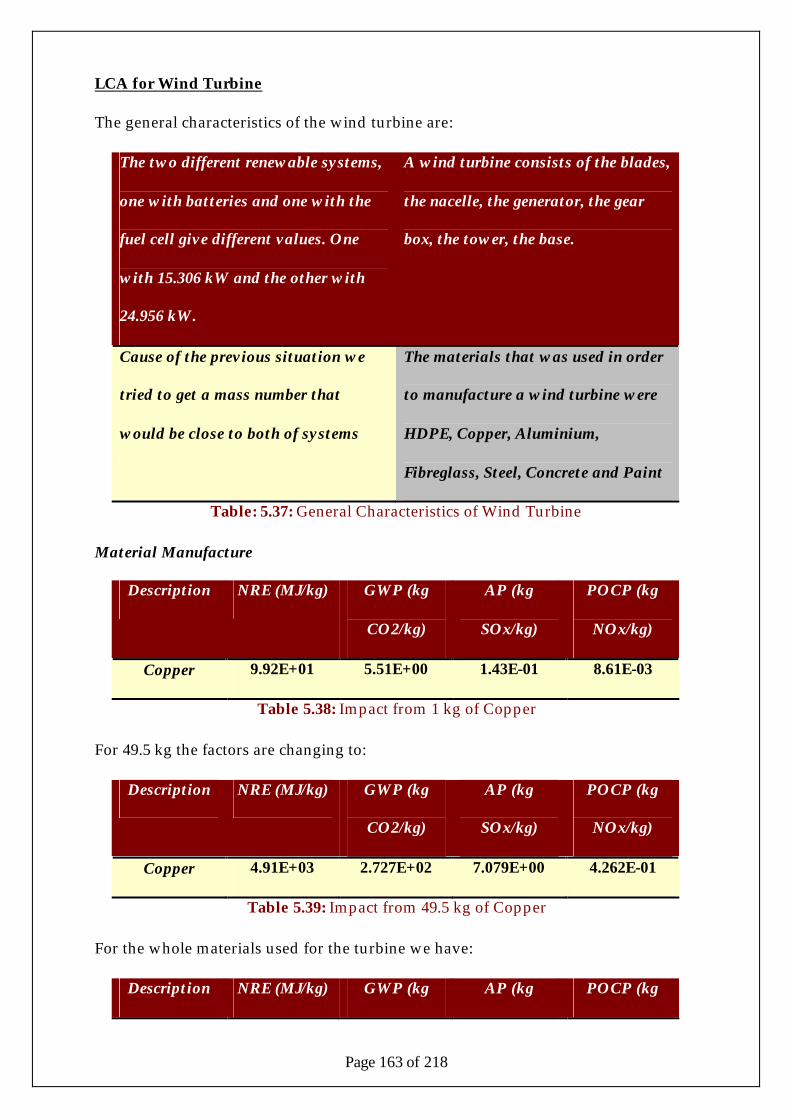
Page 163 of 218
LCA for Wind Turbine
The general characteristics of the wind turbine are:
The two different renewable systems,
one with batteries and one with the
fuel cell give different values. One
with 15.306 kW and the other with
24.956 kW.
A wind turbine consists of the blades,
the nacelle, the generator, the gear
box, the tower, the base.
Cause of the previous situation we
tried to get a mass number that
would be close to both of systems
The materials that was used in order
to manufacture a wind turbine were
HDPE, Copper, Aluminium,
Fibreglass, Steel, Concrete and Paint
Table: 5.37: General Characteristics of Wind Turbine
Material Manufacture
Description NRE (MJ/kg) GWP (kg
CO2/kg)
AP (kg
SOx/kg)
POCP (kg
NOx/kg)
Copper 9.92E+01 5.51E+00 1.43E-01 8.61E-03
Table 5.38: Impact from 1 kg of Copper
For 49.5 kg the factors are changing to:
Description NRE (MJ/kg) GWP (kg
CO2/kg)
AP (kg
SOx/kg)
POCP (kg
NOx/kg)
Copper 4.91E+03 2.727E+02 7.079E+00 4.262E-01
Table 5.39: Impact from 49.5 kg of Copper
For the whole materials used for the turbine we have:
Description NRE (MJ/kg) GWP (kg AP (kg POCP (kg
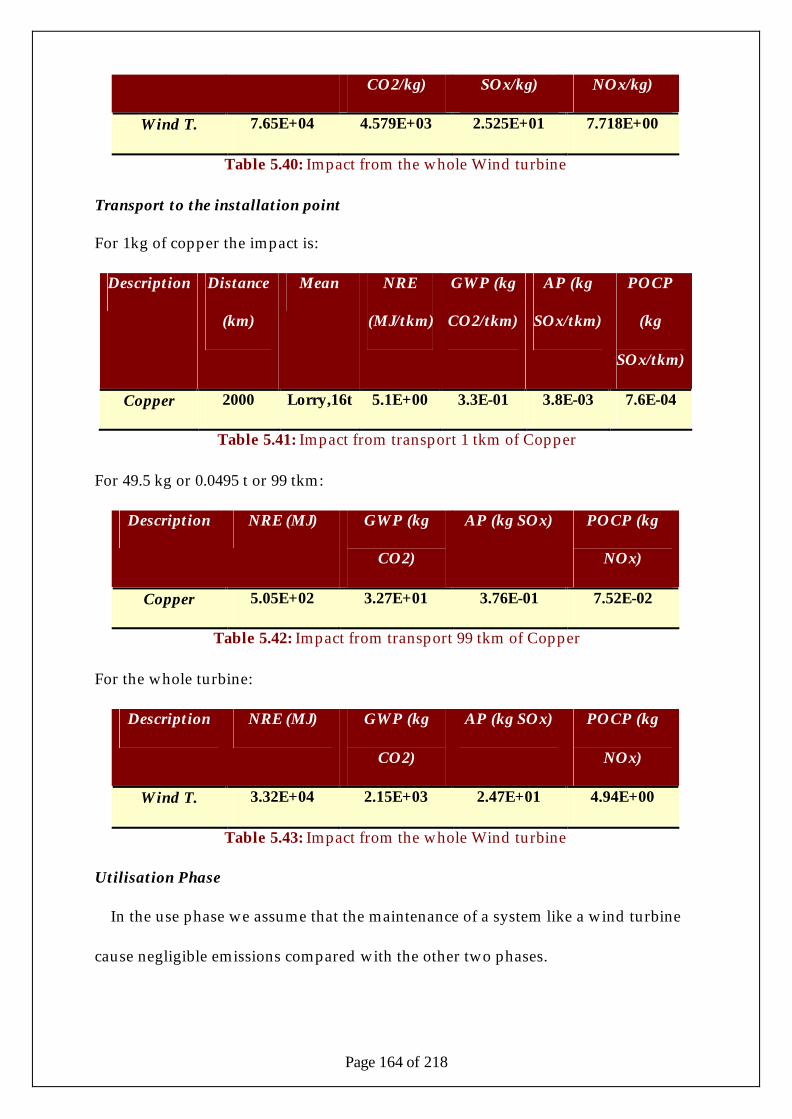
Page 164 of 218
CO2/kg) SOx/kg) NOx/kg)
Wind T. 7.65E+04 4.579E+03 2.525E+01 7.718E+00
Table 5.40: Impact from the whole Wind turbine
Transport to the installation point
For 1kg of copper the impact is:
Description Distance
(km)
Mean NRE
(MJ/tkm)
GWP (kg
CO2/tkm)
AP (kg
SOx/tkm)
POCP
(kg
SOx/tkm)
Copper 2000 Lorry,16t 5.1E+00 3.3E-01 3.8E-03 7.6E-04
Table 5.41: Impact from transport 1 tkm of Copper
For 49.5 kg or 0.0495 t or 99 tkm:
Description NRE (MJ) GWP (kg
CO2)
AP (kg SOx) POCP (kg
NOx)
Copper 5.05E+02 3.27E+01 3.76E-01 7.52E-02
Table 5.42: Impact from transport 99 tkm of Copper
For the whole turbine:
Description NRE (MJ) GWP (kg
CO2)
AP (kg SOx) POCP (kg
NOx)
Wind T. 3.32E+04 2.15E+03 2.47E+01 4.94E+00
Table 5.43: Impact from the whole Wind turbine
Utilisation Phase
In the use phase we assume that the maintenance of a system like a wind turbine
cause negligible emissions compared with the other two phases.
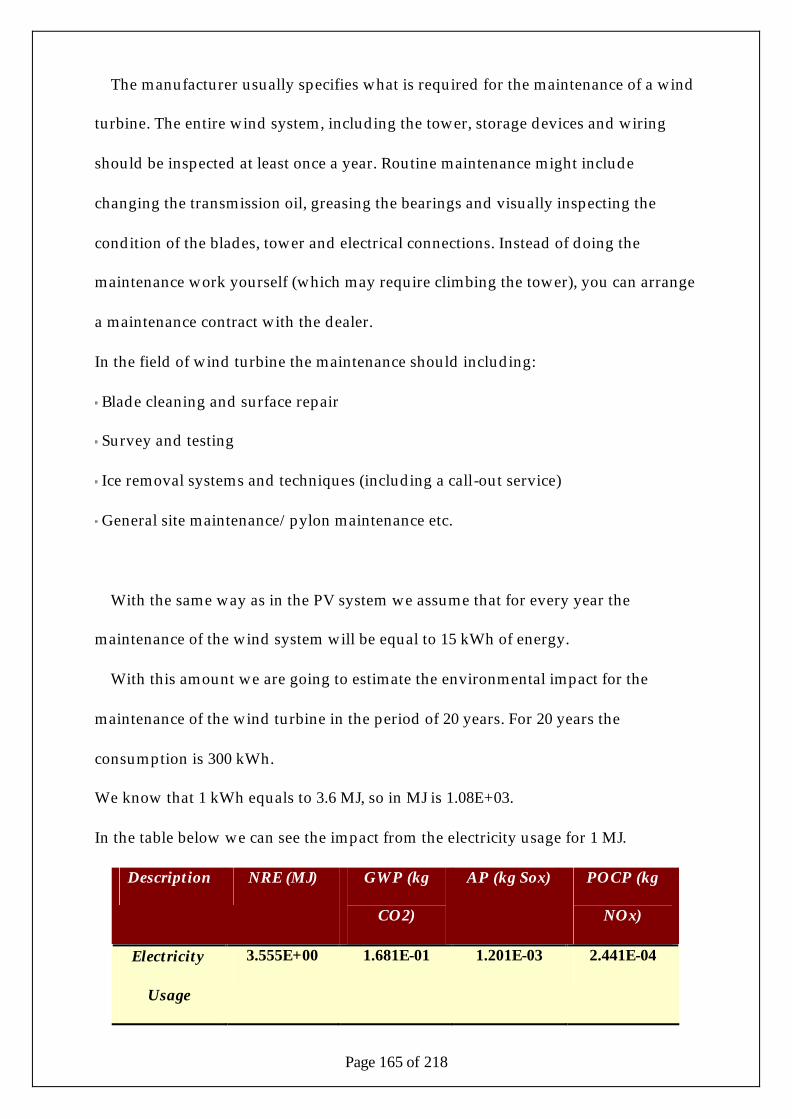
Page 165 of 218
The manufacturer usually specifies what is required for the maintenance of a wind
turbine. The entire wind system, including the tower, storage devices and wiring
should be inspected at least once a year. Routine maintenance might include
changing the transmission oil, greasing the bearings and visually inspecting the
condition of the blades, tower and electrical connections. Instead of doing the
maintenance work yourself (which may require climbing the tower), you can arrange
a maintenance contract with the dealer.
In the field of wind turbine the maintenance should including:
Blade cleaning and surface repair
Survey and testing
Ice removal systems and techniques (including a call-out service)
General site maintenance/pylon maintenance etc.
With the same way as in the PV system we assume that for every year the
maintenance of the wind system will be equal to 15 kWh of energy.
With this amount we are going to estimate the environmental impact for the
maintenance of the wind turbine in the period of 20 years. For 20 years the
consumption is 300 kWh.
We know that 1 kWh equals to 3.6 MJ, so in MJ is 1.08E+03.
In the table below we can see the impact from the electricity usage for 1 MJ.
Description NRE (MJ) GWP (kg
CO2)
AP (kg Sox) POCP (kg
NOx)
Electricity
Usage
3.555E+00 1.681E-01 1.201E-03 2.441E-04
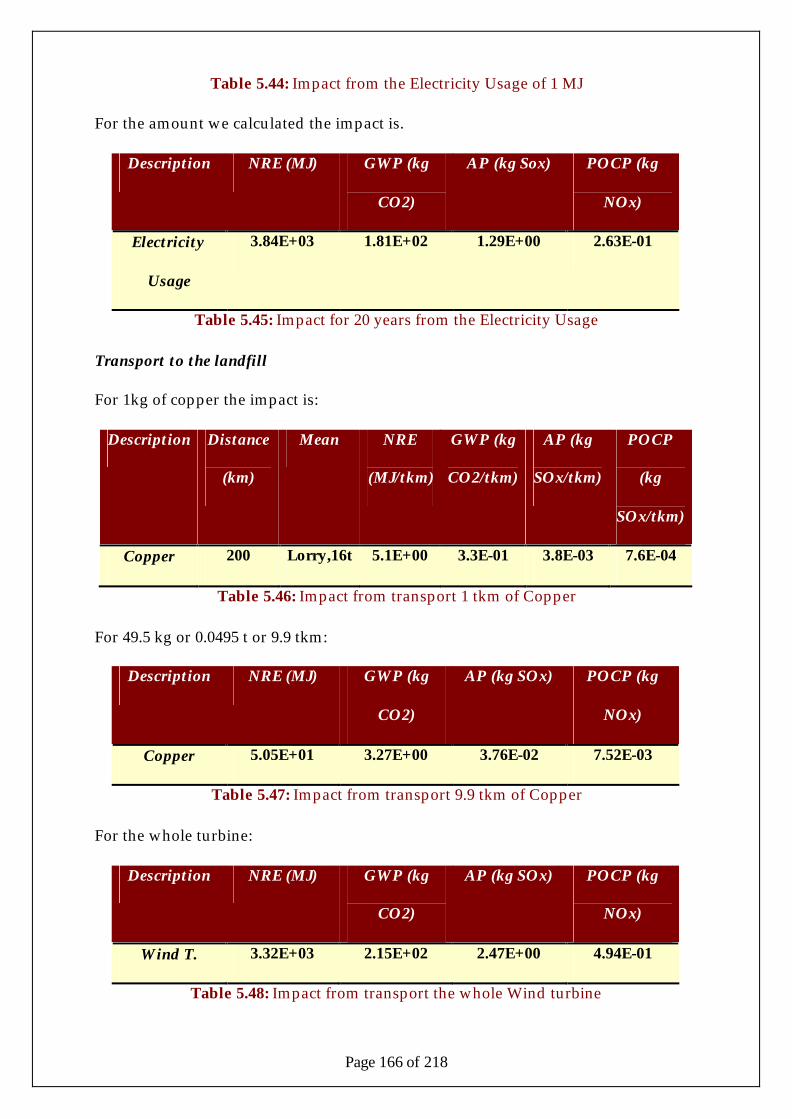
Page 166 of 218
Table 5.44: Impact from the Electricity Usage of 1 MJ
For the amount we calculated the impact is.
Description NRE (MJ) GWP (kg
CO2)
AP (kg Sox) POCP (kg
NOx)
Electricity
Usage
3.84E+03 1.81E+02 1.29E+00 2.63E-01
Table 5.45: Impact for 20 years from the Electricity Usage
Transport to the landfill
For 1kg of copper the impact is:
Description Distance
(km)
Mean NRE
(MJ/tkm)
GWP (kg
CO2/tkm)
AP (kg
SOx/tkm)
POCP
(kg
SOx/tkm)
Copper 200 Lorry,16t 5.1E+00 3.3E-01 3.8E-03 7.6E-04
Table 5.46: Impact from transport 1 tkm of Copper
For 49.5 kg or 0.0495 t or 9.9 tkm:
Description NRE (MJ) GWP (kg
CO2)
AP (kg SOx) POCP (kg
NOx)
Copper 5.05E+01 3.27E+00 3.76E-02 7.52E-03
Table 5.47: Impact from transport 9.9 tkm of Copper
For the whole turbine:
Description NRE (MJ) GWP (kg
CO2)
AP (kg SOx) POCP (kg
NOx)
Wind T. 3.32E+03 2.15E+02 2.47E+00 4.94E-01
Table 5.48: Impact from transport the whole Wind turbine

Page 167 of 218
Elimination to the landfill
The emissions for 1 kg of copper to the landfill are.
Description NRE (MJ) GWP (kg
CO2)
AP (kg SOx) POCP (kg
NOx)
Copper 8.23E-03 5.57E-04 5.29E-06 5.75E-06
Table 5.49: Impact from 1 kg of Copper in the landfill
For 49.5 kg.
Description NRE (MJ) GWP (kg
CO2)
AP (kg SOx) POCP (kg
NOx)
Copper 4.07E-01 2.76E-02 2.62E-04 2.85E-04
Table 5.50: Impact from 49.5 kg of Copper in the landfill
The total emissions for the wind turbine are.
Description NRE (MJ) GWP (kg
CO2)
AP (kg Sox) POCP (kg
NOx)
Wind T. 2.68E+01 1.81E+00 1.72E-02 1.87E-02
Table 5.51: Impact from the whole Wind turbine in the landfill
Total Emissions from the Wind Turbine
If we combine all the previous phases together we will have the total emissions
that the wind turbine causes from the beginning of the material production until the
disposal of it in the landfill.
In the table below we can see all the five phases together.
Life Cycle
Phases
Total NRE
(MJ)
Total GWP
(kg CO2)
Total AP (kg
Sox)
Total POCP
(kg NOx)
Manufacture 7.65E+04 4.579E+03 2.525E+01 7.718E+00

Page 168 of 218
Transport 3.32E+04 2.15E+03 2.47E+01 4.94E+00
Utilisation 3.84E+03 1.81E+02 1.29E+00 2.63E-01
Transport 3.32E+03 2.15E+02 2.47E+00 4.94E-01
Landfill 2.68E+01 1.81E+00 1.72E-02 1.87E-02
Table 5.52: Impact from all Life Cycle Stages for the Wind Turbine
The final table then is.
Life Cycle
Phases
Total NRE
(MJ)
Total GWP
(kg CO2)
Total AP (kg
SOx)
Total POCP
(kg NOx)
Pre-Use
Phase
1.097E+05 7.725E+03 4.996E+01 1.266E+01
Use Phase 3.84E+03 1.81E+02 1.29E+00 2.63E-01
Elimination
Phase
3.34E+03 2.16E+02 2.49E+00 5.13E-01
Table 5.53: Impact from the three phases for the Wind Turbine
We will see now in a graphical representation, the distribution of the
environmental impact of GWP from the wind turbine in the three main phases.
GWP
0.000E+001.000E+032.000E+033.000E+034.000E+035.000E+036.000E+037.000E+038.000E+03
1
Phases
CO
2 kg
Pre-Use Phase
Use Phase
Elimination Phase
Figure 5.14: GWP Impacts for each phase
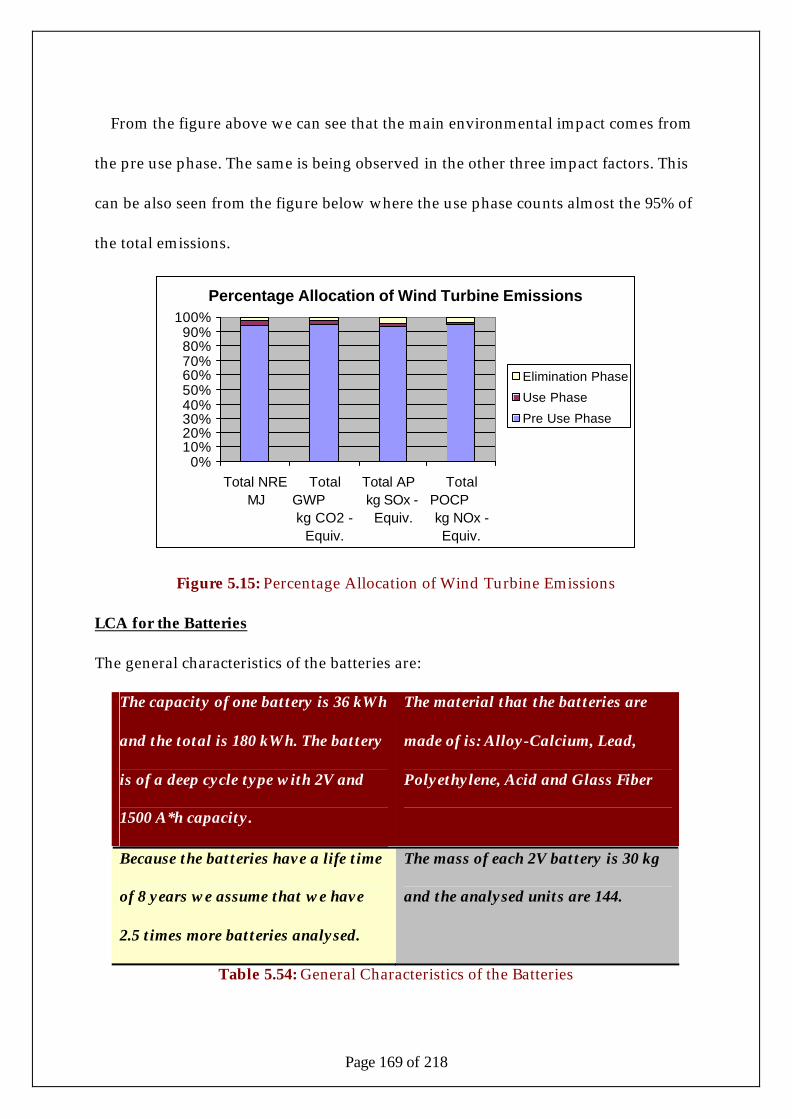
Page 169 of 218
From the figure above we can see that the main environmental impact comes from
the pre use phase. The same is being observed in the other three impact factors. This
can be also seen from the figure below where the use phase counts almost the 95% of
the total emissions.
Percentage Allocation of Wind Turbine Emissions
0%10%20%30%40%50%60%70%80%90%
100%
Total NREMJ
TotalGWP kg CO2 -
Equiv.
Total AP kg SOx -
Equiv.
TotalPOCP kg NOx -Equiv.
Elimination Phase
Use Phase
Pre Use Phase
Figure 5.15: Percentage Allocation of Wind Turbine Emissions
LCA for the Batteries
The general characteristics of the batteries are:
The capacity of one battery is 36 kWh
and the total is 180 kWh. The battery
is of a deep cycle type with 2V and
1500 A*h capacity.
The material that the batteries are
made of is: Alloy-Calcium, Lead,
Polyethylene, Acid and Glass Fiber
Because the batteries have a life time
of 8 years we assume that we have
2.5 times more batteries analysed.
The mass of each 2V battery is 30 kg
and the analysed units are 144.
Table 5.54: General Characteristics of the Batteries
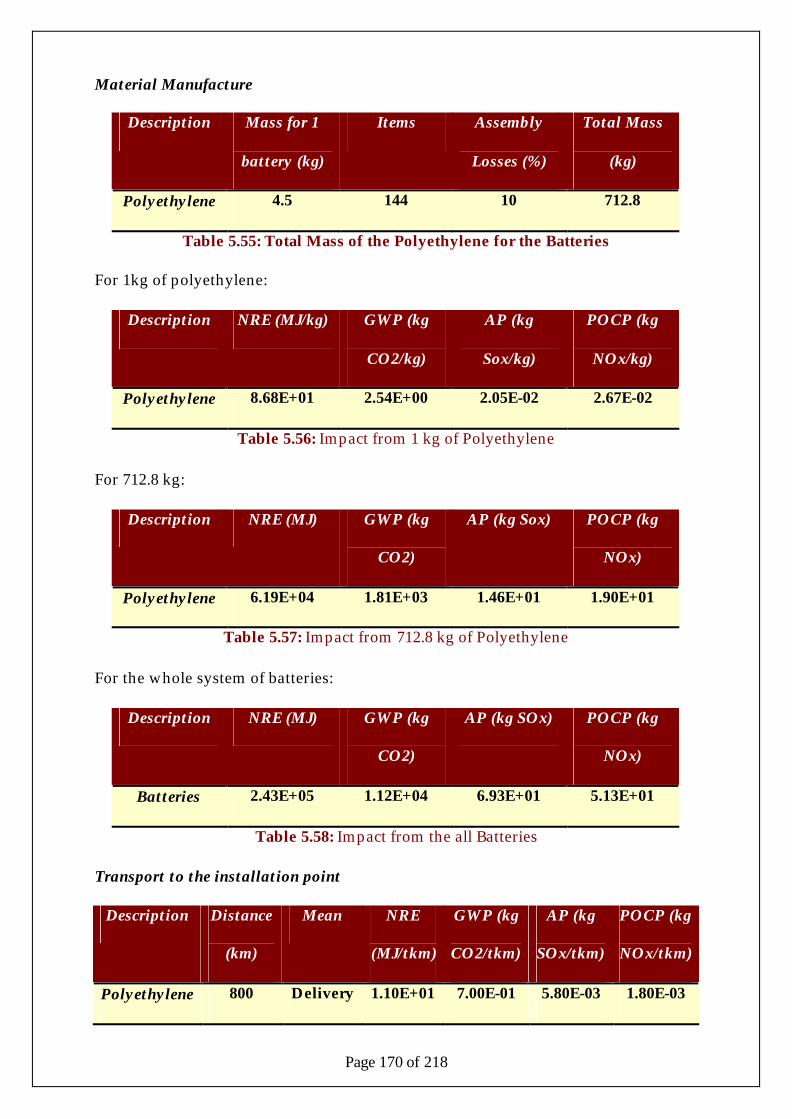
Page 170 of 218
Material Manufacture
Description Mass for 1
battery (kg)
Items Assembly
Losses (%)
Total Mass
(kg)
Polyethylene 4.5 144 10 712.8
Table 5.55: Total Mass of the Polyethylene for the Batteries
For 1kg of polyethylene:
Description NRE (MJ/kg) GWP (kg
CO2/kg)
AP (kg
Sox/kg)
POCP (kg
NOx/kg)
Polyethylene 8.68E+01 2.54E+00 2.05E-02 2.67E-02
Table 5.56: Impact from 1 kg of Polyethylene
For 712.8 kg:
Description NRE (MJ) GWP (kg
CO2)
AP (kg Sox) POCP (kg
NOx)
Polyethylene 6.19E+04 1.81E+03 1.46E+01 1.90E+01
Table 5.57: Impact from 712.8 kg of Polyethylene
For the whole system of batteries:
Description NRE (MJ) GWP (kg
CO2)
AP (kg SOx) POCP (kg
NOx)
Batteries 2.43E+05 1.12E+04 6.93E+01 5.13E+01
Table 5.58: Impact from the all Batteries
Transport to the installation point
Description Distance
(km)
Mean NRE
(MJ/tkm)
GWP (kg
CO2/tkm)
AP (kg
SOx/tkm)
POCP (kg
NOx/tkm)
Polyethylene 800 Delivery 1.10E+01 7.00E-01 5.80E-03 1.80E-03
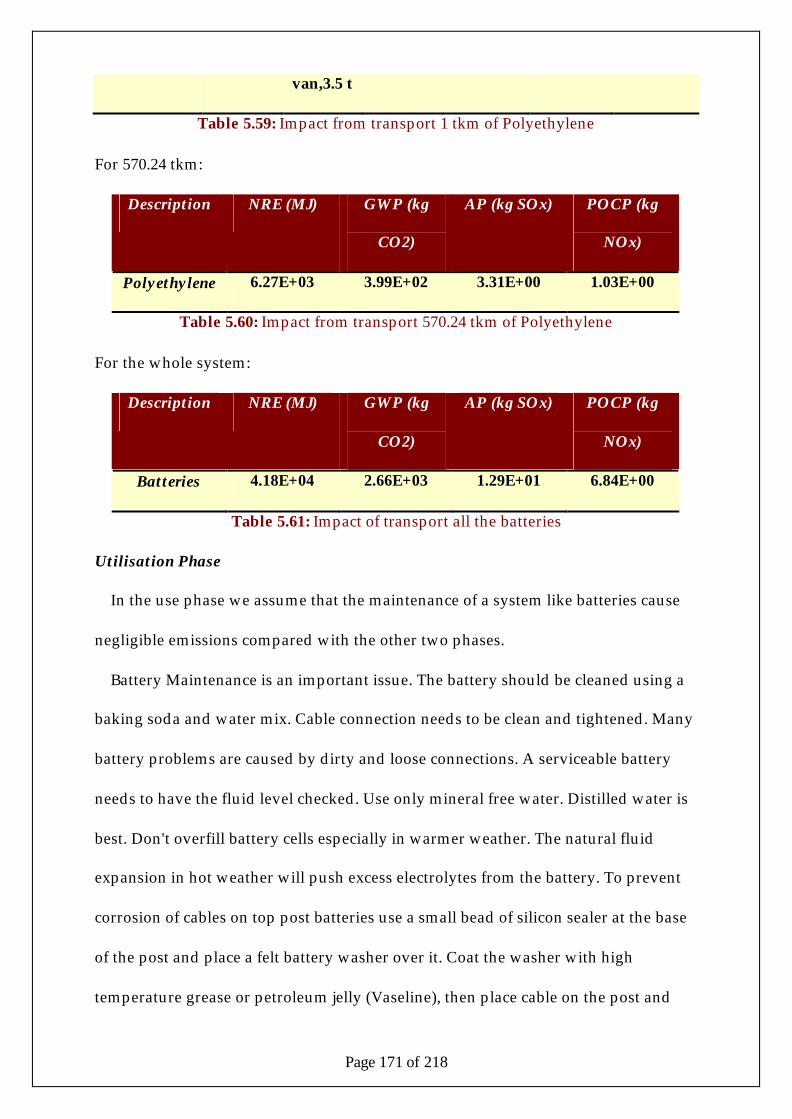
Page 171 of 218
van,3.5 t
Table 5.59: Impact from transport 1 tkm of Polyethylene
For 570.24 tkm:
Description NRE (MJ) GWP (kg
CO2)
AP (kg SOx) POCP (kg
NOx)
Polyethylene 6.27E+03 3.99E+02 3.31E+00 1.03E+00
Table 5.60: Impact from transport 570.24 tkm of Polyethylene
For the whole system:
Description NRE (MJ) GWP (kg
CO2)
AP (kg SOx) POCP (kg
NOx)
Batteries 4.18E+04 2.66E+03 1.29E+01 6.84E+00
Table 5.61: Impact of transport all the batteries
Utilisation Phase
In the use phase we assume that the maintenance of a system like batteries cause
negligible emissions compared with the other two phases.
Battery Maintenance is an important issue. The battery should be cleaned using a
baking soda and water mix. Cable connection needs to be clean and tightened. Many
battery problems are caused by dirty and loose connections. A serviceable battery
needs to have the fluid level checked. Use only mineral free water. Distilled water is
best. Don't overfill battery cells especially in warmer weather. The natural fluid
expansion in hot weather will push excess electrolytes from the battery. To prevent
corrosion of cables on top post batteries use a small bead of silicon sealer at the base
of the post and place a felt battery washer over it. Coat the washer with high
temperature grease or petroleum jelly (Vaseline), then place cable on the post and
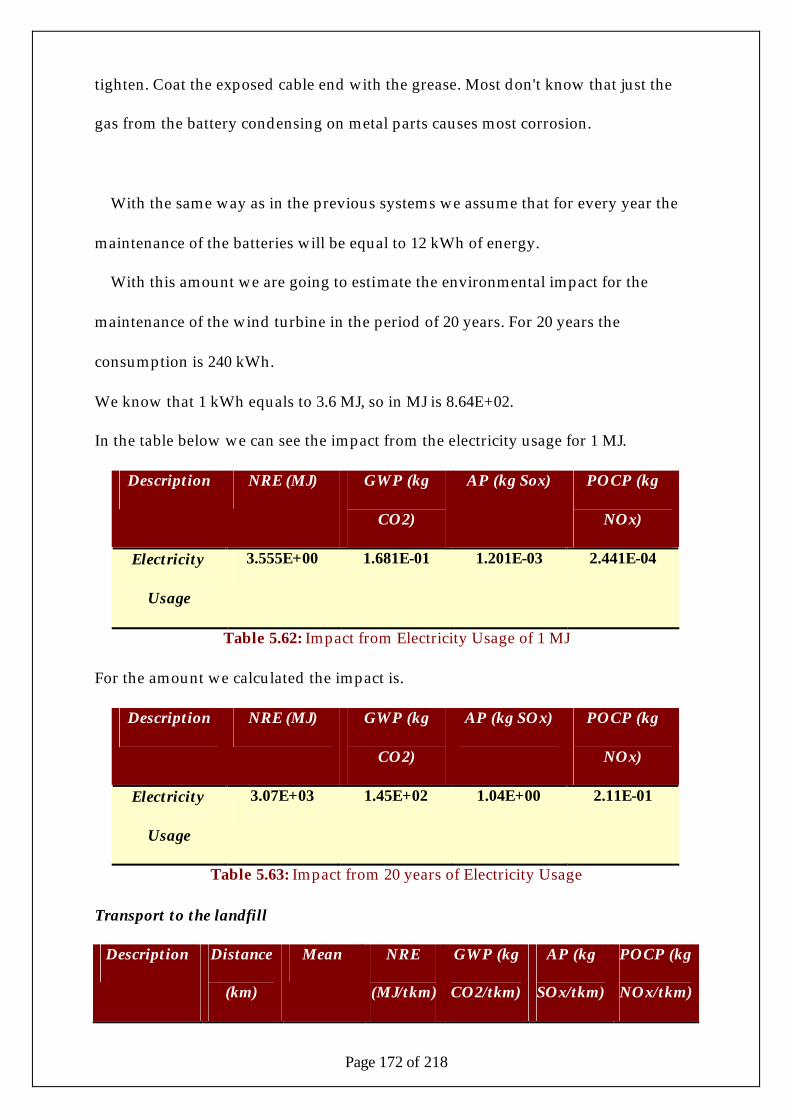
Page 172 of 218
tighten. Coat the exposed cable end with the grease. Most don't know that just the
gas from the battery condensing on metal parts causes most corrosion.
With the same way as in the previous systems we assume that for every year the
maintenance of the batteries will be equal to 12 kWh of energy.
With this amount we are going to estimate the environmental impact for the
maintenance of the wind turbine in the period of 20 years. For 20 years the
consumption is 240 kWh.
We know that 1 kWh equals to 3.6 MJ, so in MJ is 8.64E+02.
In the table below we can see the impact from the electricity usage for 1 MJ.
Description NRE (MJ) GWP (kg
CO2)
AP (kg Sox) POCP (kg
NOx)
Electricity
Usage
3.555E+00 1.681E-01 1.201E-03 2.441E-04
Table 5.62: Impact from Electricity Usage of 1 MJ
For the amount we calculated the impact is.
Description NRE (MJ) GWP (kg
CO2)
AP (kg SOx) POCP (kg
NOx)
Electricity
Usage
3.07E+03 1.45E+02 1.04E+00 2.11E-01
Table 5.63: Impact from 20 years of Electricity Usage
Transport to the landfill
Description Distance
(km)
Mean NRE
(MJ/tkm)
GWP (kg
CO2/tkm)
AP (kg
SOx/tkm)
POCP (kg
NOx/tkm)
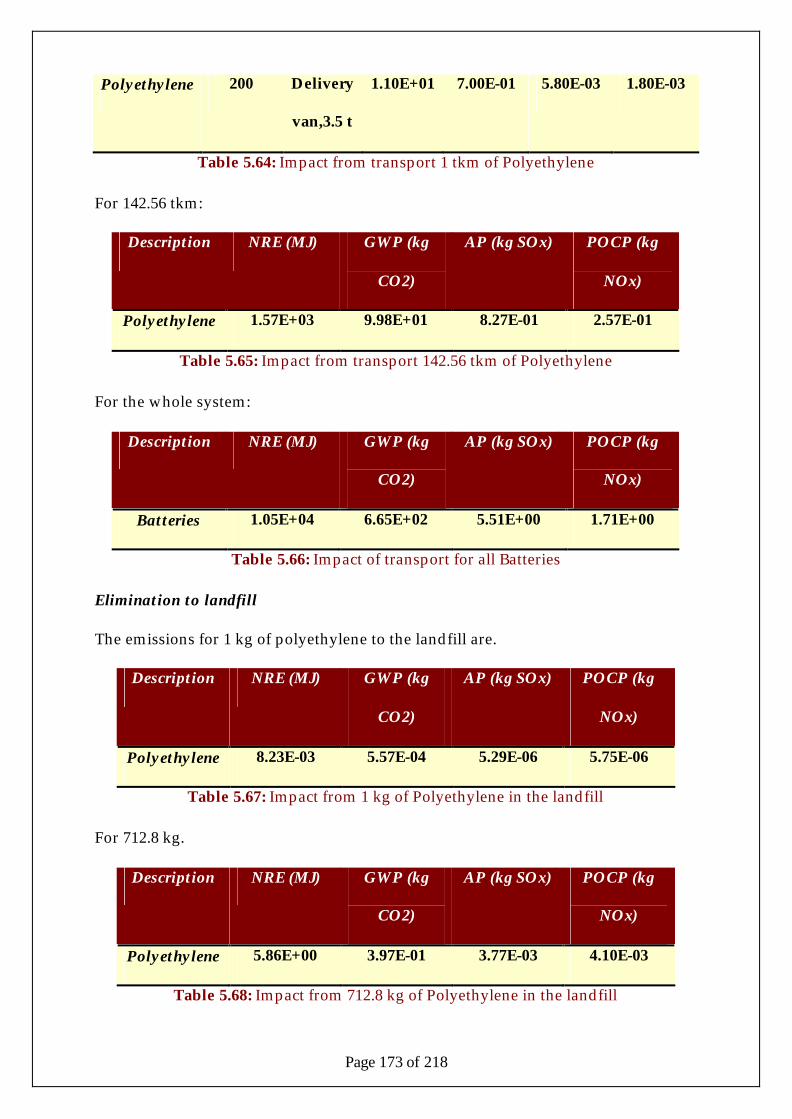
Page 173 of 218
Polyethylene 200 Delivery
van,3.5 t
1.10E+01 7.00E-01 5.80E-03 1.80E-03
Table 5.64: Impact from transport 1 tkm of Polyethylene
For 142.56 tkm:
Description NRE (MJ) GWP (kg
CO2)
AP (kg SOx) POCP (kg
NOx)
Polyethylene 1.57E+03 9.98E+01 8.27E-01 2.57E-01
Table 5.65: Impact from transport 142.56 tkm of Polyethylene
For the whole system:
Description NRE (MJ) GWP (kg
CO2)
AP (kg SOx) POCP (kg
NOx)
Batteries 1.05E+04 6.65E+02 5.51E+00 1.71E+00
Table 5.66: Impact of transport for all Batteries
Elimination to landfill
The emissions for 1 kg of polyethylene to the landfill are.
Description NRE (MJ) GWP (kg
CO2)
AP (kg SOx) POCP (kg
NOx)
Polyethylene 8.23E-03 5.57E-04 5.29E-06 5.75E-06
Table 5.67: Impact from 1 kg of Polyethylene in the landfill
For 712.8 kg.
Description NRE (MJ) GWP (kg
CO2)
AP (kg SOx) POCP (kg
NOx)
Polyethylene 5.86E+00 3.97E-01 3.77E-03 4.10E-03
Table 5.68: Impact from 712.8 kg of Polyethylene in the landfill
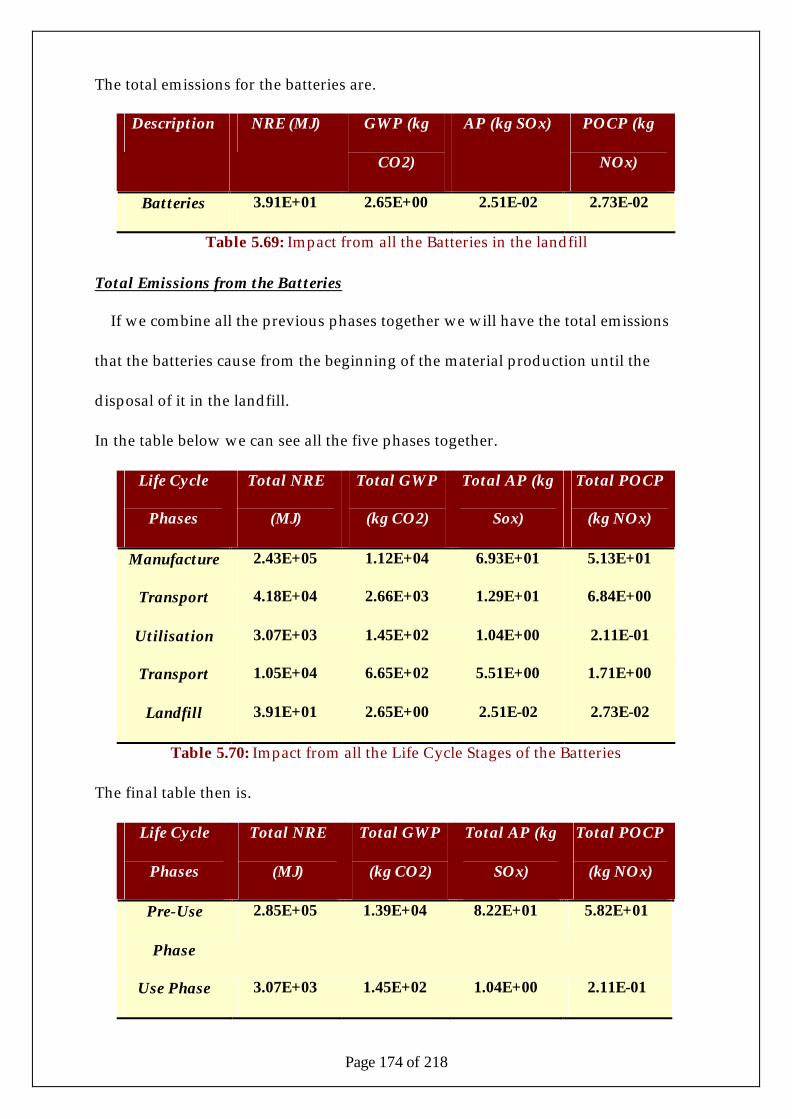
Page 174 of 218
The total emissions for the batteries are.
Description NRE (MJ) GWP (kg
CO2)
AP (kg SOx) POCP (kg
NOx)
Batteries 3.91E+01 2.65E+00 2.51E-02 2.73E-02
Table 5.69: Impact from all the Batteries in the landfill
Total Emissions from the Batteries
If we combine all the previous phases together we will have the total emissions
that the batteries cause from the beginning of the material production until the
disposal of it in the landfill.
In the table below we can see all the five phases together.
Life Cycle
Phases
Total NRE
(MJ)
Total GWP
(kg CO2)
Total AP (kg
Sox)
Total POCP
(kg NOx)
Manufacture 2.43E+05 1.12E+04 6.93E+01 5.13E+01
Transport 4.18E+04 2.66E+03 1.29E+01 6.84E+00
Utilisation 3.07E+03 1.45E+02 1.04E+00 2.11E-01
Transport 1.05E+04 6.65E+02 5.51E+00 1.71E+00
Landfill 3.91E+01 2.65E+00 2.51E-02 2.73E-02
Table 5.70: Impact from all the Life Cycle Stages of the Batteries
The final table then is.
Life Cycle
Phases
Total NRE
(MJ)
Total GWP
(kg CO2)
Total AP (kg
SOx)
Total POCP
(kg NOx)
Pre-Use
Phase
2.85E+05 1.39E+04 8.22E+01 5.82E+01
Use Phase 3.07E+03 1.45E+02 1.04E+00 2.11E-01

Page 175 of 218
Elimination
Phase
1.05E+04 6.68E+02 5.54E+00 1.74E+00
Table 5.71: Impact from the three phases for the Batteries
We will see now in a graphical representation, the distribution of the
environmental impact of GWP from the wind turbine in the three main phases.
GWP
0.00E+002.00E+034.00E+036.00E+038.00E+031.00E+041.20E+041.40E+041.60E+04
1
Phases
CO
2 kg
Pre-Use Phase
Use Phase
Elimination
Figure 5.16: GWP Impact for each phase
From the figure above we can see that the main environmental impact comes from
the pre use phase. The same is being observed in the other three impact factors. This
can be also seen from the figure below where the use phase counts almost the 95% of
the total emissions.
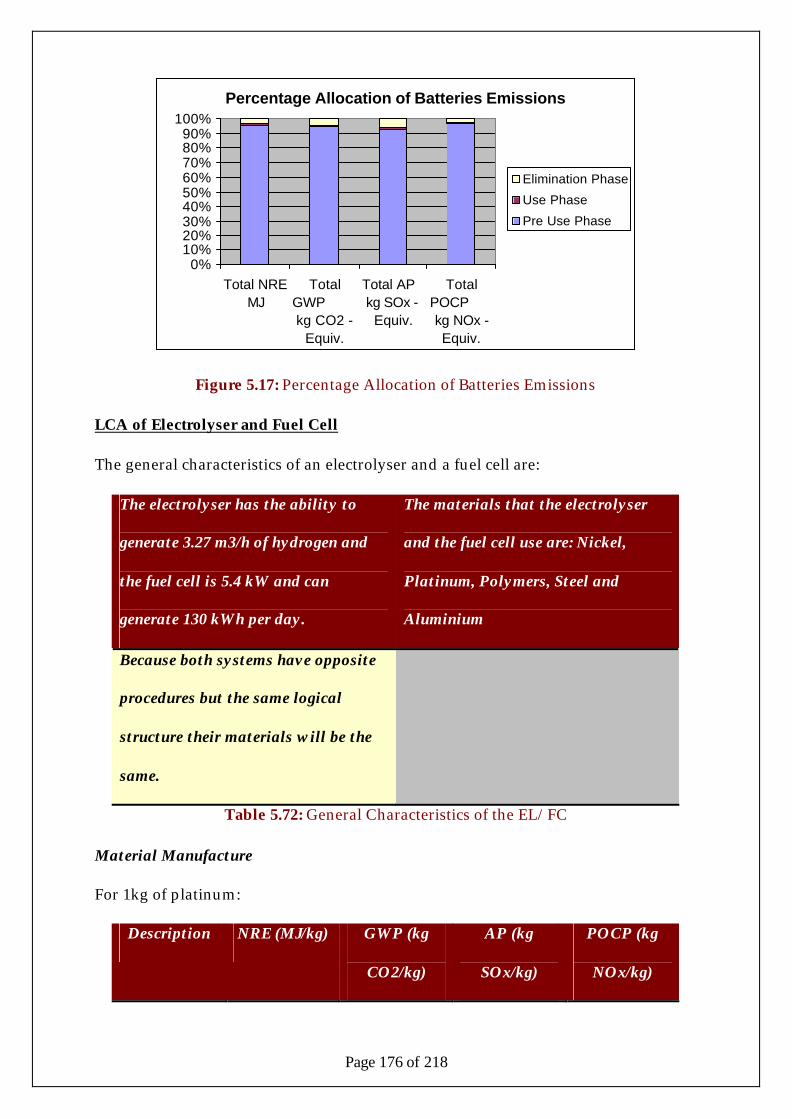
Page 176 of 218
Percentage Allocation of Batteries Emissions
0%10%20%30%40%50%60%70%80%90%
100%
Total NREMJ
TotalGWP kg CO2 -
Equiv.
Total AP kg SOx -
Equiv.
TotalPOCP kg NOx -Equiv.
Elimination Phase
Use Phase
Pre Use Phase
Figure 5.17: Percentage Allocation of Batteries Emissions
LCA of Electrolyser and Fuel Cell
The general characteristics of an electrolyser and a fuel cell are:
The electrolyser has the ability to
generate 3.27 m3/h of hydrogen and
the fuel cell is 5.4 kW and can
generate 130 kWh per day.
The materials that the electrolyser
and the fuel cell use are: Nickel,
Platinum, Polymers, Steel and
Aluminium
Because both systems have opposite
procedures but the same logical
structure their materials will be the
same.
Table 5.72: General Characteristics of the EL/FC
Material Manufacture
For 1kg of platinum:
Description NRE (MJ/kg) GWP (kg
CO2/kg)
AP (kg
SOx/kg)
POCP (kg
NOx/kg)
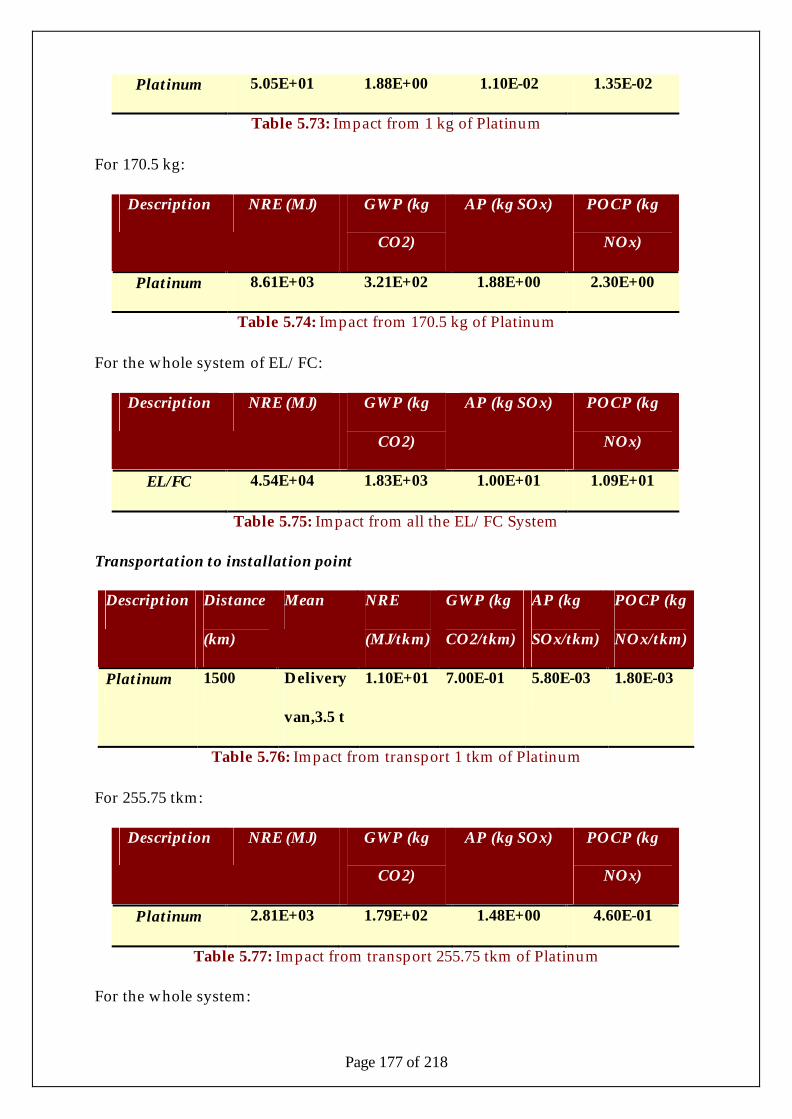
Page 177 of 218
Platinum 5.05E+01 1.88E+00 1.10E-02 1.35E-02
Table 5.73: Impact from 1 kg of Platinum
For 170.5 kg:
Description NRE (MJ) GWP (kg
CO2)
AP (kg SOx) POCP (kg
NOx)
Platinum 8.61E+03 3.21E+02 1.88E+00 2.30E+00
Table 5.74: Impact from 170.5 kg of Platinum
For the whole system of EL/FC:
Description NRE (MJ) GWP (kg
CO2)
AP (kg SOx) POCP (kg
NOx)
EL/FC 4.54E+04 1.83E+03 1.00E+01 1.09E+01
Table 5.75: Impact from all the EL/FC System
Transportation to installation point
Description Distance
(km)
Mean NRE
(MJ/tkm)
GWP (kg
CO2/tkm)
AP (kg
SOx/tkm)
POCP (kg
NOx/tkm)
Platinum 1500 Delivery
van,3.5 t
1.10E+01 7.00E-01 5.80E-03 1.80E-03
Table 5.76: Impact from transport 1 tkm of Platinum
For 255.75 tkm:
Description NRE (MJ) GWP (kg
CO2)
AP (kg SOx) POCP (kg
NOx)
Platinum 2.81E+03 1.79E+02 1.48E+00 4.60E-01
Table 5.77: Impact from transport 255.75 tkm of Platinum
For the whole system:
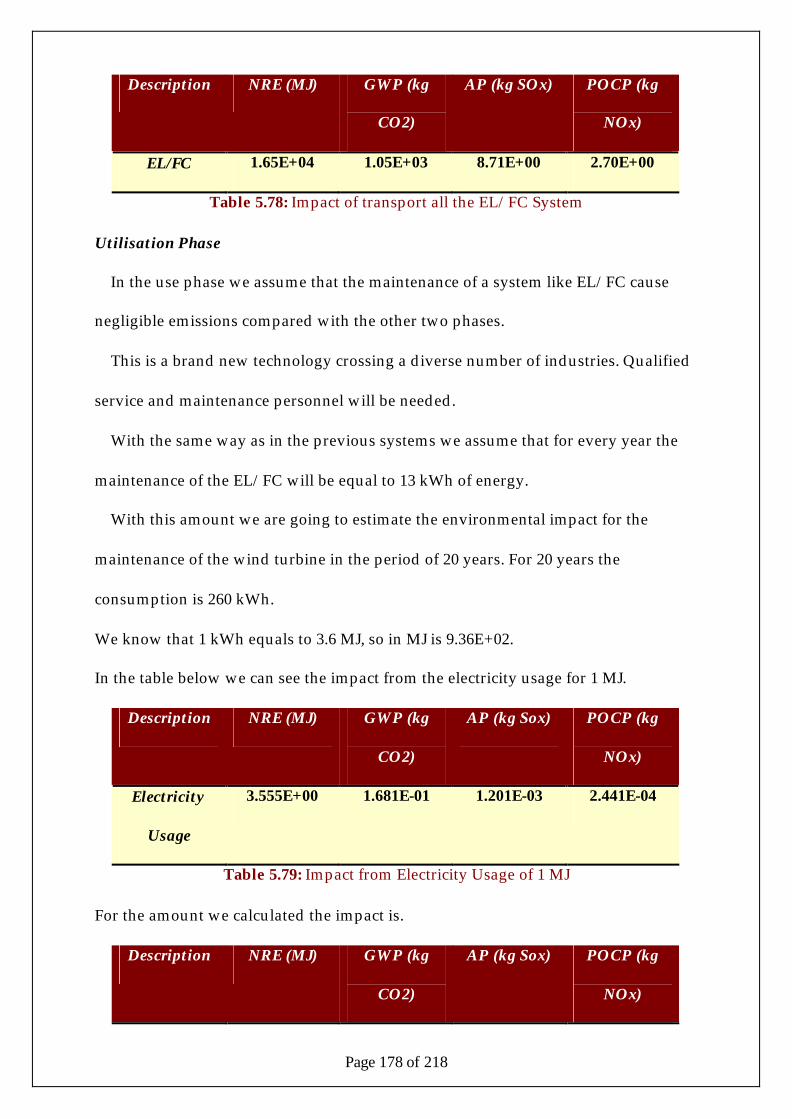
Page 178 of 218
Description NRE (MJ) GWP (kg
CO2)
AP (kg SOx) POCP (kg
NOx)
EL/FC 1.65E+04 1.05E+03 8.71E+00 2.70E+00
Table 5.78: Impact of transport all the EL/FC System
Utilisation Phase
In the use phase we assume that the maintenance of a system like EL/FC cause
negligible emissions compared with the other two phases.
This is a brand new technology crossing a diverse number of industries. Qualified
service and maintenance personnel will be needed.
With the same way as in the previous systems we assume that for every year the
maintenance of the EL/FC will be equal to 13 kWh of energy.
With this amount we are going to estimate the environmental impact for the
maintenance of the wind turbine in the period of 20 years. For 20 years the
consumption is 260 kWh.
We know that 1 kWh equals to 3.6 MJ, so in MJ is 9.36E+02.
In the table below we can see the impact from the electricity usage for 1 MJ.
Description NRE (MJ) GWP (kg
CO2)
AP (kg Sox) POCP (kg
NOx)
Electricity
Usage
3.555E+00 1.681E-01 1.201E-03 2.441E-04
Table 5.79: Impact from Electricity Usage of 1 MJ
For the amount we calculated the impact is.
Description NRE (MJ) GWP (kg
CO2)
AP (kg Sox) POCP (kg
NOx)
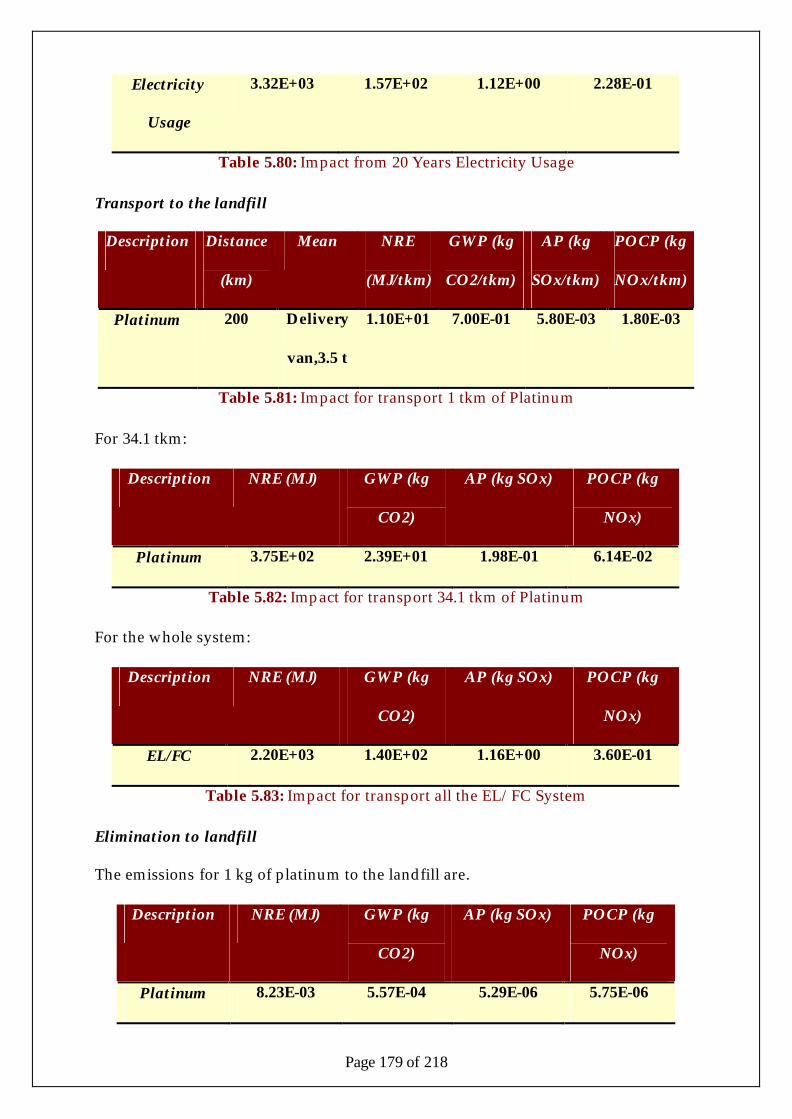
Page 179 of 218
Electricity
Usage
3.32E+03 1.57E+02 1.12E+00 2.28E-01
Table 5.80: Impact from 20 Years Electricity Usage
Transport to the landfill
Description Distance
(km)
Mean NRE
(MJ/tkm)
GWP (kg
CO2/tkm)
AP (kg
SOx/tkm)
POCP (kg
NOx/tkm)
Platinum 200 Delivery
van,3.5 t
1.10E+01 7.00E-01 5.80E-03 1.80E-03
Table 5.81: Impact for transport 1 tkm of Platinum
For 34.1 tkm:
Description NRE (MJ) GWP (kg
CO2)
AP (kg SOx) POCP (kg
NOx)
Platinum 3.75E+02 2.39E+01 1.98E-01 6.14E-02
Table 5.82: Impact for transport 34.1 tkm of Platinum
For the whole system:
Description NRE (MJ) GWP (kg
CO2)
AP (kg SOx) POCP (kg
NOx)
EL/FC 2.20E+03 1.40E+02 1.16E+00 3.60E-01
Table 5.83: Impact for transport all the EL/FC System
Elimination to landfill
The emissions for 1 kg of platinum to the landfill are.
Description NRE (MJ) GWP (kg
CO2)
AP (kg SOx) POCP (kg
NOx)
Platinum 8.23E-03 5.57E-04 5.29E-06 5.75E-06
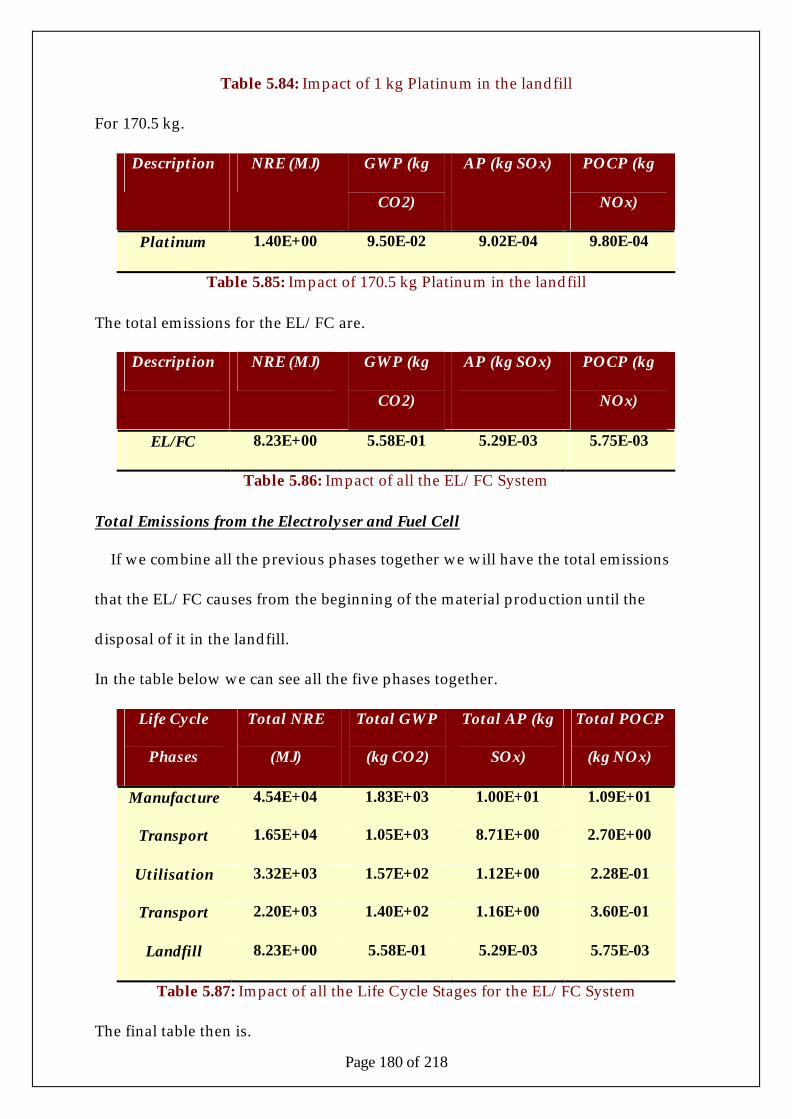
Page 180 of 218
Table 5.84: Impact of 1 kg Platinum in the landfill
For 170.5 kg.
Description NRE (MJ) GWP (kg
CO2)
AP (kg SOx) POCP (kg
NOx)
Platinum 1.40E+00 9.50E-02 9.02E-04 9.80E-04
Table 5.85: Impact of 170.5 kg Platinum in the landfill
The total emissions for the EL/FC are.
Description NRE (MJ) GWP (kg
CO2)
AP (kg SOx) POCP (kg
NOx)
EL/FC 8.23E+00 5.58E-01 5.29E-03 5.75E-03
Table 5.86: Impact of all the EL/FC System
Total Emissions from the Electrolyser and Fuel Cell
If we combine all the previous phases together we will have the total emissions
that the EL/FC causes from the beginning of the material production until the
disposal of it in the landfill.
In the table below we can see all the five phases together.
Life Cycle
Phases
Total NRE
(MJ)
Total GWP
(kg CO2)
Total AP (kg
SOx)
Total POCP
(kg NOx)
Manufacture 4.54E+04 1.83E+03 1.00E+01 1.09E+01
Transport 1.65E+04 1.05E+03 8.71E+00 2.70E+00
Utilisation 3.32E+03 1.57E+02 1.12E+00 2.28E-01
Transport 2.20E+03 1.40E+02 1.16E+00 3.60E-01
Landfill 8.23E+00 5.58E-01 5.29E-03 5.75E-03
Table 5.87: Impact of all the Life Cycle Stages for the EL/FC System
The final table then is.
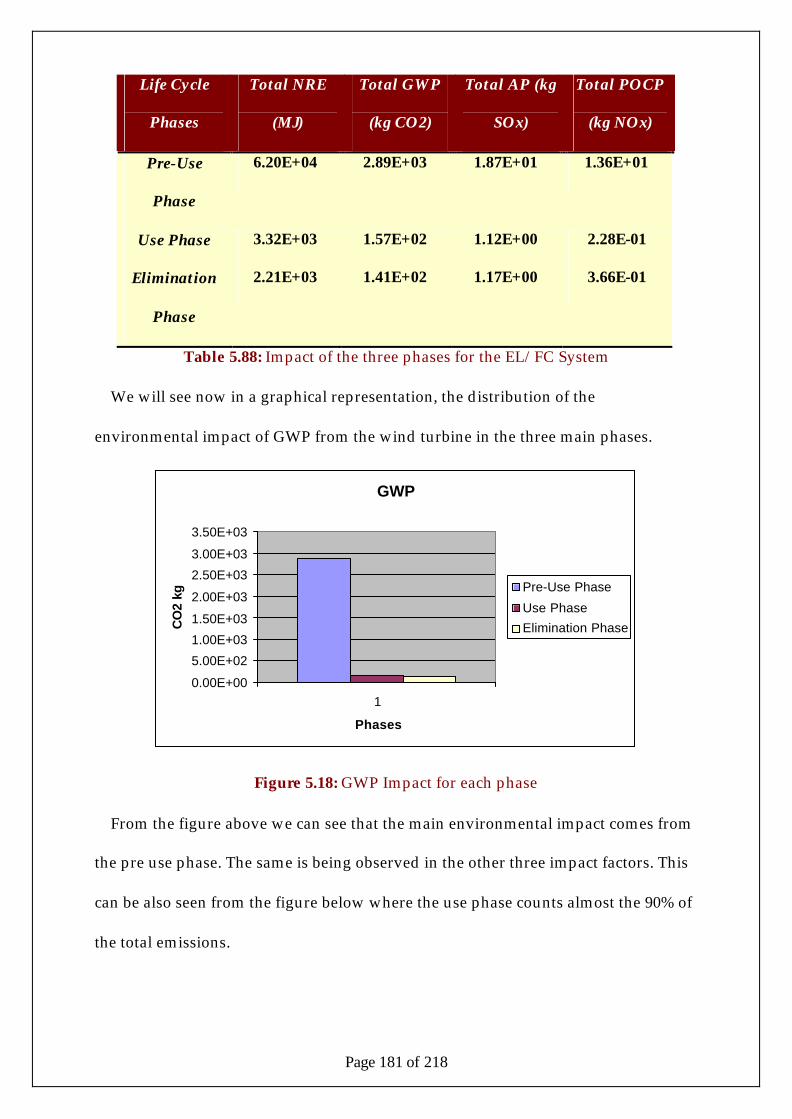
Page 181 of 218
Life Cycle
Phases
Total NRE
(MJ)
Total GWP
(kg CO2)
Total AP (kg
SOx)
Total POCP
(kg NOx)
Pre-Use
Phase
6.20E+04 2.89E+03 1.87E+01 1.36E+01
Use Phase 3.32E+03 1.57E+02 1.12E+00 2.28E-01
Elimination
Phase
2.21E+03 1.41E+02 1.17E+00 3.66E-01
Table 5.88: Impact of the three phases for the EL/FC System
We will see now in a graphical representation, the distribution of the
environmental impact of GWP from the wind turbine in the three main phases.
GWP
0.00E+00
5.00E+02
1.00E+03
1.50E+03
2.00E+03
2.50E+03
3.00E+03
3.50E+03
1
Phases
CO
2 kg
Pre-Use Phase
Use Phase
Elimination Phase
Figure 5.18: GWP Impact for each phase
From the figure above we can see that the main environmental impact comes from
the pre use phase. The same is being observed in the other three impact factors. This
can be also seen from the figure below where the use phase counts almost the 90% of
the total emissions.
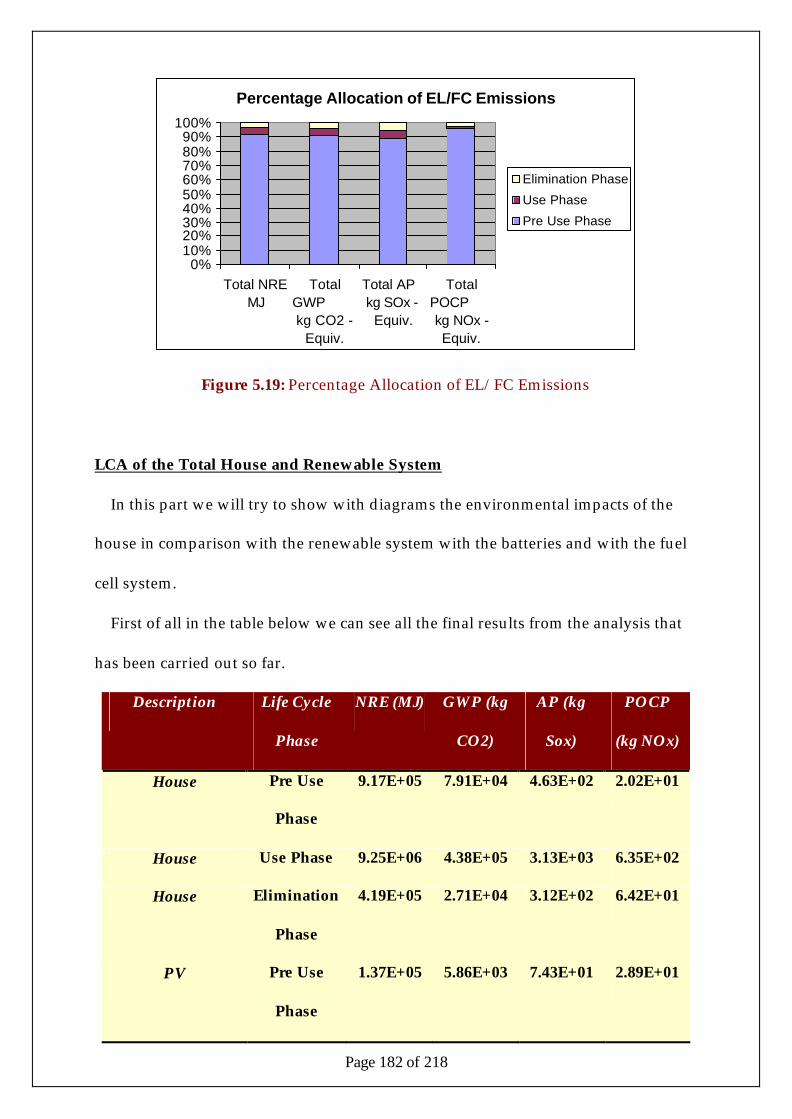
Page 182 of 218
Percentage Allocation of EL/FC Emissions
0%10%20%30%40%50%60%70%80%90%
100%
Total NREMJ
TotalGWP kg CO2 -
Equiv.
Total AP kg SOx -
Equiv.
TotalPOCP kg NOx -Equiv.
Elimination Phase
Use Phase
Pre Use Phase
Figure 5.19: Percentage Allocation of EL/FC Emissions
LCA of the Total House and Renewable System
In this part we will try to show with diagrams the environmental impacts of the
house in comparison with the renewable system with the batteries and with the fuel
cell system.
First of all in the table below we can see all the final results from the analysis that
has been carried out so far.
Description Life Cycle
Phase
NRE (MJ) GWP (kg
CO2)
AP (kg
Sox)
POCP
(kg NOx)
House Pre Use
Phase
9.17E+05 7.91E+04 4.63E+02 2.02E+01
House Use Phase 9.25E+06 4.38E+05 3.13E+03 6.35E+02
House Elimination
Phase
4.19E+05 2.71E+04 3.12E+02 6.42E+01
PV Pre Use
Phase
1.37E+05 5.86E+03 7.43E+01 2.89E+01
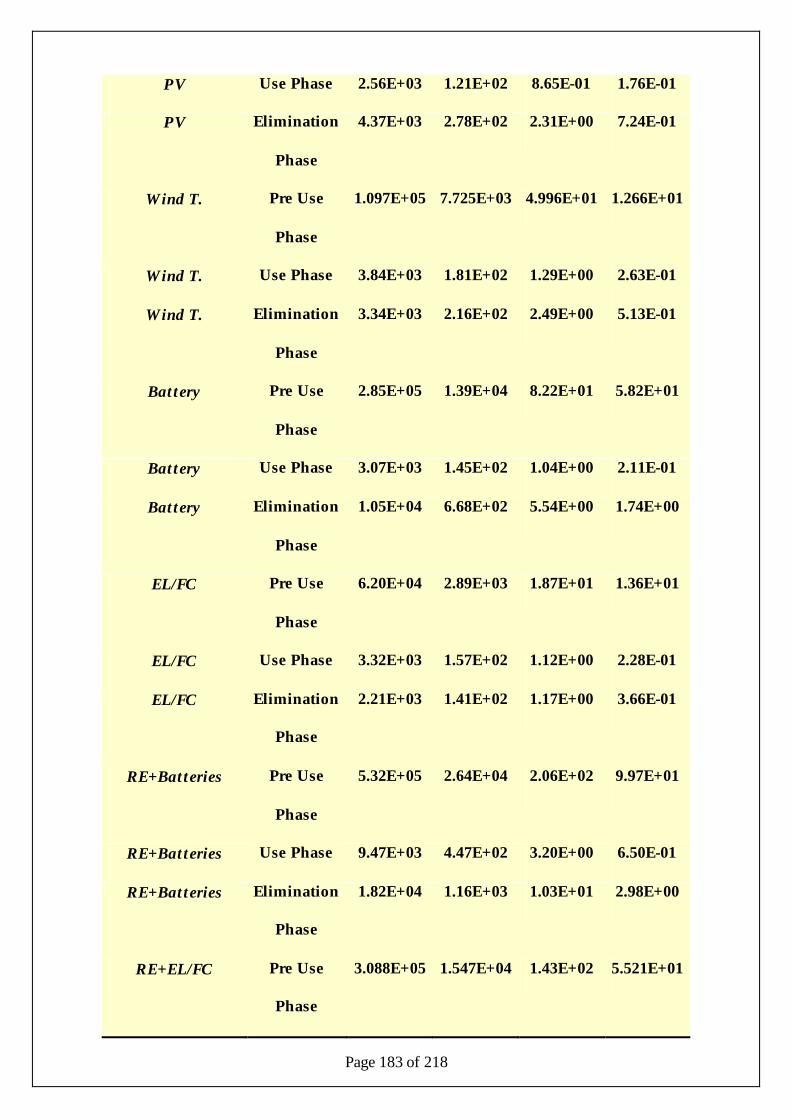
Page 183 of 218
PV Use Phase 2.56E+03 1.21E+02 8.65E-01 1.76E-01
PV Elimination
Phase
4.37E+03 2.78E+02 2.31E+00 7.24E-01
Wind T. Pre Use
Phase
1.097E+05 7.725E+03 4.996E+01 1.266E+01
Wind T. Use Phase 3.84E+03 1.81E+02 1.29E+00 2.63E-01
Wind T. Elimination
Phase
3.34E+03 2.16E+02 2.49E+00 5.13E-01
Battery Pre Use
Phase
2.85E+05 1.39E+04 8.22E+01 5.82E+01
Battery Use Phase 3.07E+03 1.45E+02 1.04E+00 2.11E-01
Battery Elimination
Phase
1.05E+04 6.68E+02 5.54E+00 1.74E+00
EL/FC Pre Use
Phase
6.20E+04 2.89E+03 1.87E+01 1.36E+01
EL/FC Use Phase 3.32E+03 1.57E+02 1.12E+00 2.28E-01
EL/FC Elimination
Phase
2.21E+03 1.41E+02 1.17E+00 3.66E-01
RE+Batteries Pre Use
Phase
5.32E+05 2.64E+04 2.06E+02 9.97E+01
RE+Batteries Use Phase 9.47E+03 4.47E+02 3.20E+00 6.50E-01
RE+Batteries Elimination
Phase
1.82E+04 1.16E+03 1.03E+01 2.98E+00
RE+EL/FC Pre Use
Phase
3.088E+05 1.547E+04 1.43E+02 5.521E+01
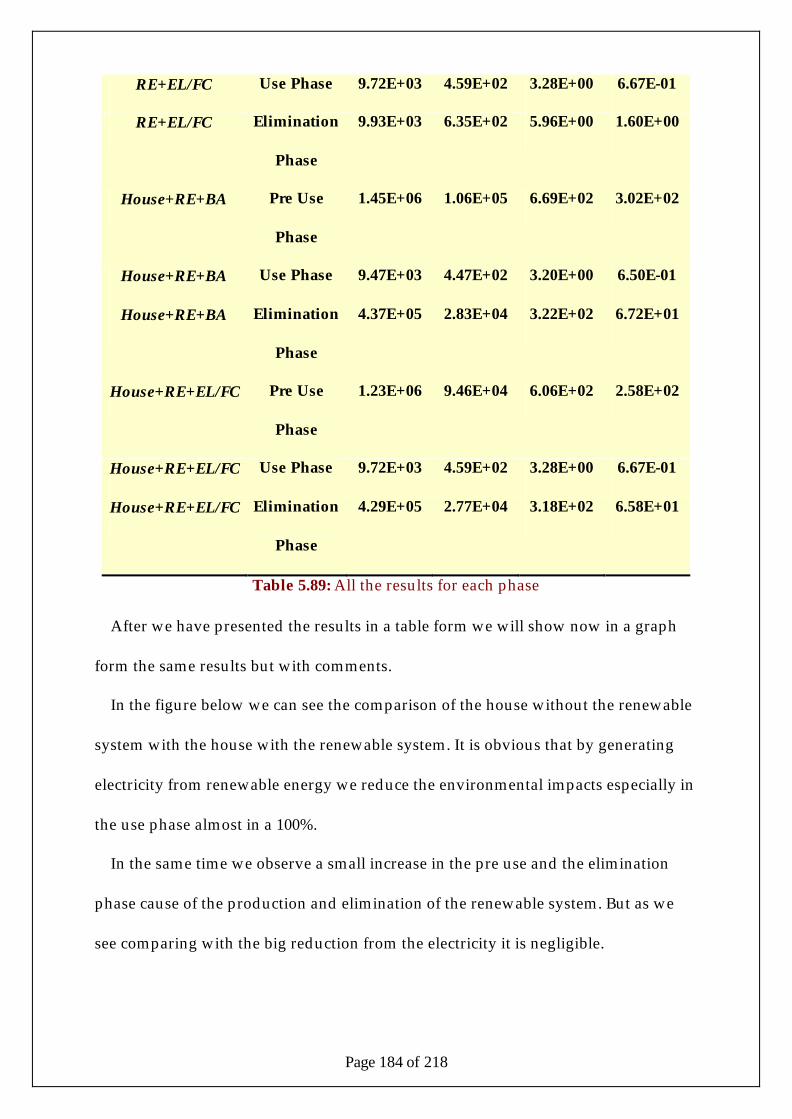
Page 184 of 218
RE+EL/FC Use Phase 9.72E+03 4.59E+02 3.28E+00 6.67E-01
RE+EL/FC Elimination
Phase
9.93E+03 6.35E+02 5.96E+00 1.60E+00
House+RE+BA Pre Use
Phase
1.45E+06 1.06E+05 6.69E+02 3.02E+02
House+RE+BA Use Phase 9.47E+03 4.47E+02 3.20E+00 6.50E-01
House+RE+BA Elimination
Phase
4.37E+05 2.83E+04 3.22E+02 6.72E+01
House+RE+EL/FC Pre Use
Phase
1.23E+06 9.46E+04 6.06E+02 2.58E+02
House+RE+EL/FC Use Phase 9.72E+03 4.59E+02 3.28E+00 6.67E-01
House+RE+EL/FC Elimination
Phase
4.29E+05 2.77E+04 3.18E+02 6.58E+01
Table 5.89: All the results for each phase
After we have presented the results in a table form we will show now in a graph
form the same results but with comments.
In the figure below we can see the comparison of the house without the renewable
system with the house with the renewable system. It is obvious that by generating
electricity from renewable energy we reduce the environmental impacts especially in
the use phase almost in a 100%.
In the same time we observe a small increase in the pre use and the elimination
phase cause of the production and elimination of the renewable system. But as we
see comparing with the big reduction from the electricity it is negligible.
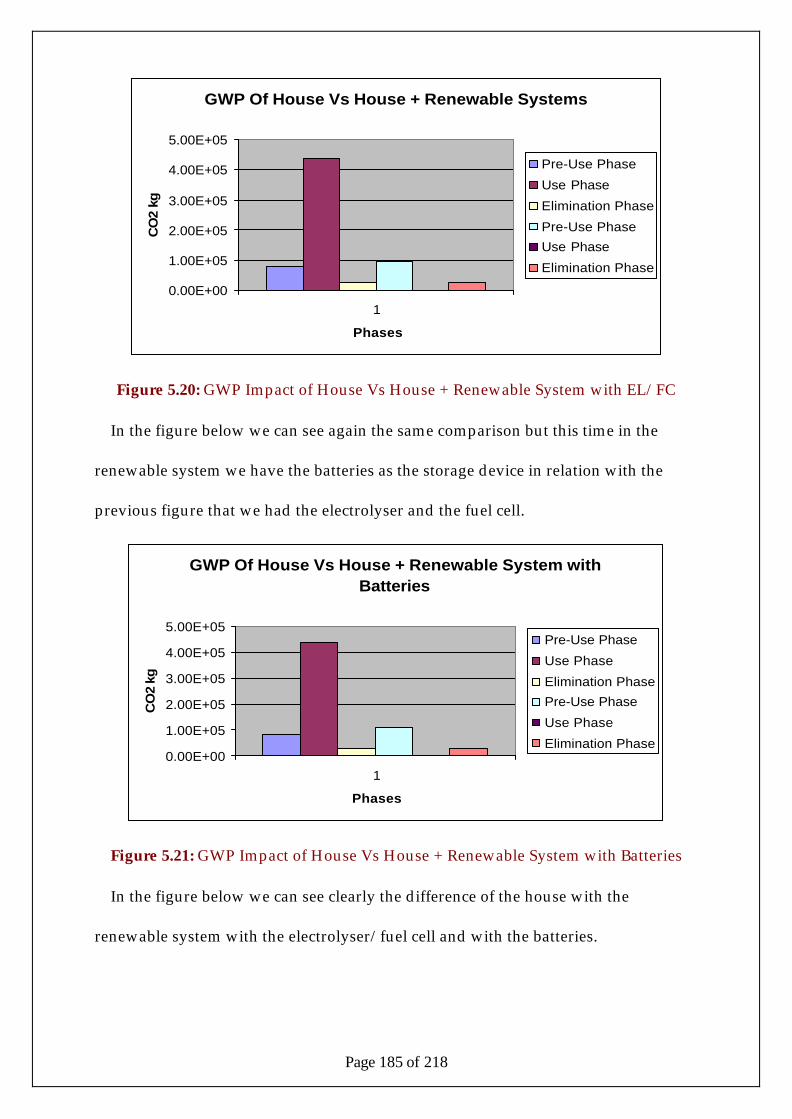
Page 185 of 218
GWP Of House Vs House + Renewable Systems
0.00E+00
1.00E+05
2.00E+05
3.00E+05
4.00E+05
5.00E+05
1
Phases
CO
2 kg
Pre-Use Phase
Use Phase
Elimination Phase
Pre-Use Phase
Use Phase
Elimination Phase
Figure 5.20: GWP Impact of House Vs House + Renewable System with EL/FC
In the figure below we can see again the same comparison but this time in the
renewable system we have the batteries as the storage device in relation with the
previous figure that we had the electrolyser and the fuel cell.
GWP Of House Vs House + Renewable System with Batteries
0.00E+00
1.00E+05
2.00E+05
3.00E+05
4.00E+05
5.00E+05
1
Phases
CO
2 kg
Pre-Use Phase
Use Phase
Elimination Phase
Pre-Use Phase
Use Phase
Elimination Phase
Figure 5.21: GWP Impact of House Vs House + Renewable System with Batteries
In the figure below we can see clearly the difference of the house with the
renewable system with the electrolyser/fuel cell and with the batteries.
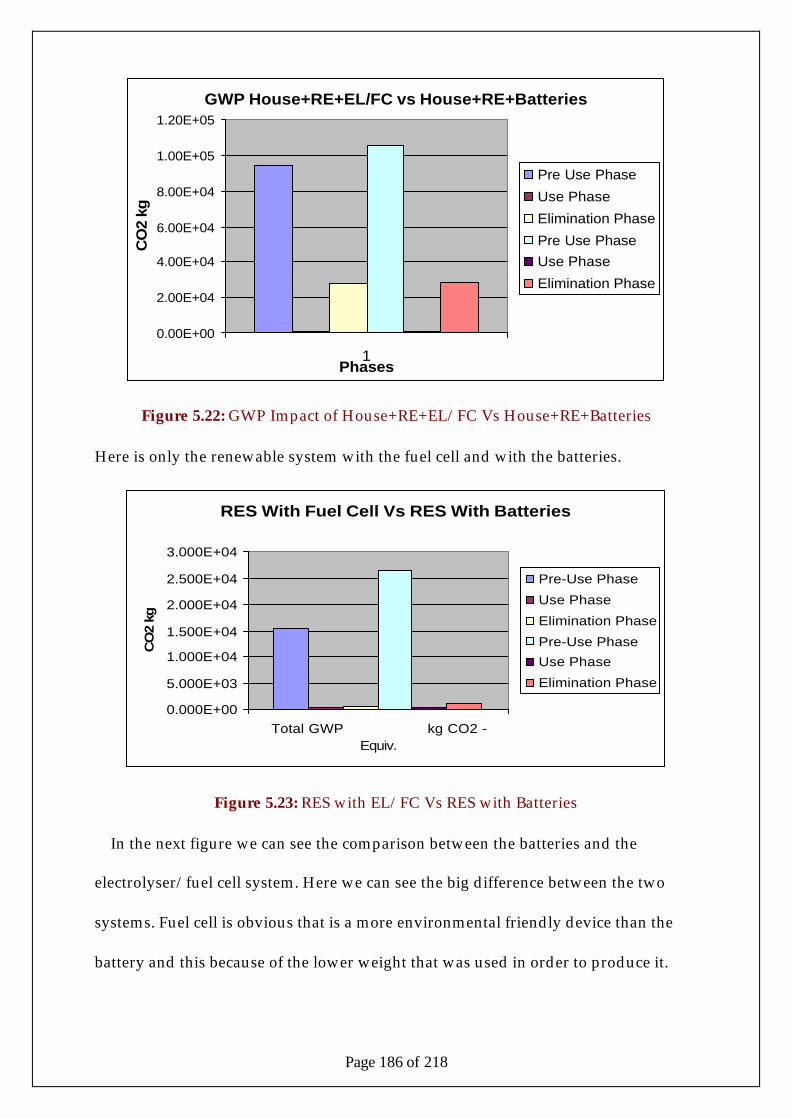
Page 186 of 218
GWP House+RE+EL/FC vs House+RE+Batteries
0.00E+00
2.00E+04
4.00E+04
6.00E+04
8.00E+04
1.00E+05
1.20E+05
1Phases
CO
2 kg
Pre Use Phase
Use Phase
Elimination Phase
Pre Use PhaseUse Phase
Elimination Phase
Figure 5.22: GWP Impact of House+RE+EL/FC Vs House+RE+Batteries
Here is only the renewable system with the fuel cell and with the batteries.
RES With Fuel Cell Vs RES With Batteries
0.000E+00
5.000E+03
1.000E+04
1.500E+04
2.000E+04
2.500E+04
3.000E+04
Total GWP kg CO2 -Equiv.
CO
2 kg
Pre-Use Phase
Use Phase
Elimination Phase
Pre-Use Phase
Use Phase
Elimination Phase
Figure 5.23: RES with EL/FC Vs RES with Batteries
In the next figure we can see the comparison between the batteries and the
electrolyser/fuel cell system. Here we can see the big difference between the two
systems. Fuel cell is obvious that is a more environmental friendly device than the
battery and this because of the lower weight that was used in order to produce it.
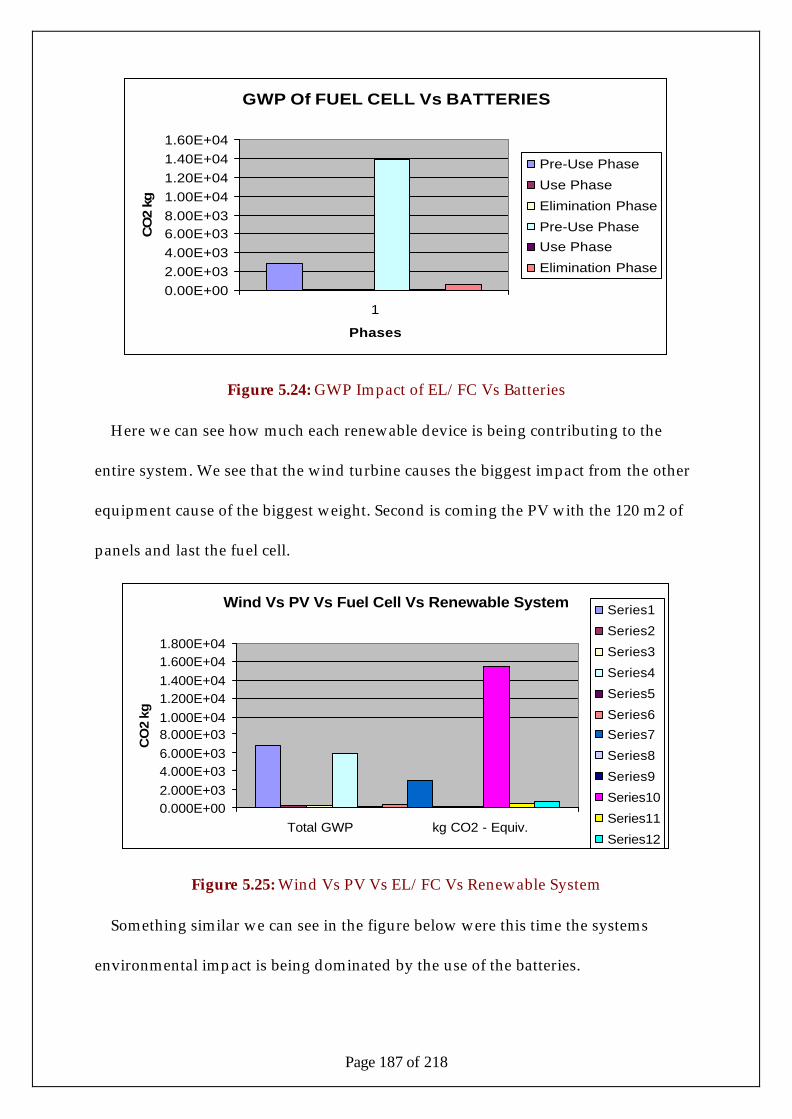
Page 187 of 218
GWP Of FUEL CELL Vs BATTERIES
0.00E+002.00E+034.00E+036.00E+038.00E+031.00E+041.20E+041.40E+041.60E+04
1
Phases
CO
2 kg
Pre-Use Phase
Use Phase
Elimination Phase
Pre-Use Phase
Use Phase
Elimination Phase
Figure 5.24: GWP Impact of EL/FC Vs Batteries
Here we can see how much each renewable device is being contributing to the
entire system. We see that the wind turbine causes the biggest impact from the other
equipment cause of the biggest weight. Second is coming the PV with the 120 m2 of
panels and last the fuel cell.
Wind Vs PV Vs Fuel Cell Vs Renewable System
0.000E+002.000E+034.000E+036.000E+038.000E+031.000E+041.200E+041.400E+041.600E+041.800E+04
Total GWP kg CO2 - Equiv.
CO
2 kg
Series1
Series2
Series3
Series4
Series5
Series6
Series7
Series8
Series9
Series10
Series11
Series12
Figure 5.25: Wind Vs PV Vs EL/FC Vs Renewable System
Something similar we can see in the figure below were this time the systems
environmental impact is being dominated by the use of the batteries.

Page 188 of 218
Wind Vs PV Vs Batteries Vs Renewable System
0.000E+00
5.000E+03
1.000E+04
1.500E+04
2.000E+04
2.500E+04
3.000E+04
Total GWP kg CO2 - Equiv.
CO
2 kg
Series1
Series2
Series3
Series4
Series5
Series6
Series7
Series8
Series9
Series10
Series11
Series12
Figure 5.26: Wind Vs PV Vs Batteries Vs Renewable System
In this figure again we can see all the equipment that was used and observe the
difference that the batteries have in relation with the other three systems. This is also
due to the fact that while the Wind, PV and Fuel Cell have a lifetime service of almost
20 years this is not the same with the batteries that is only 8. That’s why someone is
forced to buy almost three times the same amount of batteries in order to cover the 20
years of service.
WIND Vs PV Vs FUEL CELL Vs BATTERIES
0.00E+00
2.00E+03
4.00E+03
6.00E+03
8.00E+03
1.00E+04
1.20E+04
1.40E+04
1.60E+04
Total GWP kg CO2 - Equiv.
CO
2 kg
Series1
Series2
Series3
Series4
Series5
Series6
Series7
Series8
Series9
Series10
Series11
Series12
Figure 5.27: Wind Vs PV Vs EL/FC Vs Batteries
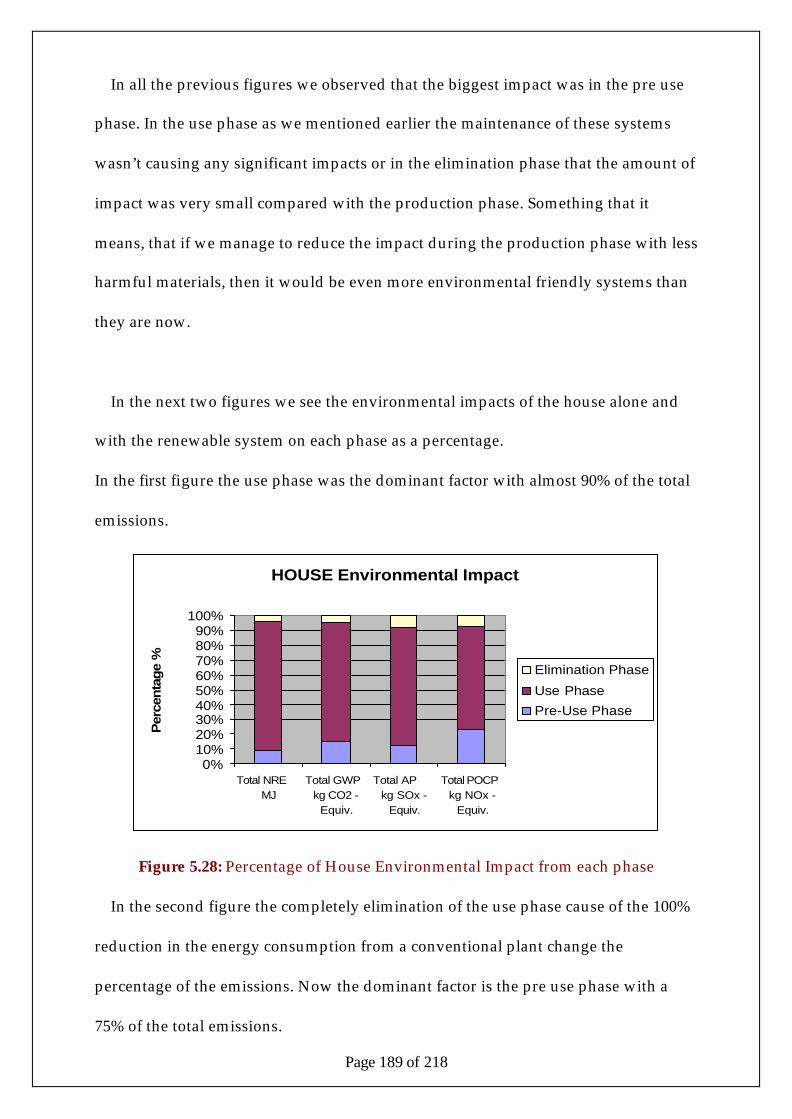
Page 189 of 218
In all the previous figures we observed that the biggest impact was in the pre use
phase. In the use phase as we mentioned earlier the maintenance of these systems
wasn’t causing any significant impacts or in the elimination phase that the amount of
impact was very small compared with the production phase. Something that it
means, that if we manage to reduce the impact during the production phase with less
harmful materials, then it would be even more environmental friendly systems than
they are now.
In the next two figures we see the environmental impacts of the house alone and
with the renewable system on each phase as a percentage.
In the first figure the use phase was the dominant factor with almost 90% of the total
emissions.
HOUSE Environmental Impact
0%10%20%30%40%50%60%70%80%90%
100%
Total NRE MJ
Total GWP kg CO2 -
Equiv.
Total AP kg SOx -
Equiv.
Total POCP kg NOx -
Equiv.
Per
cen
tag
e %
Elimination Phase
Use Phase
Pre-Use Phase
Figure 5.28: Percentage of House Environmental Impact from each phase
In the second figure the completely elimination of the use phase cause of the 100%
reduction in the energy consumption from a conventional plant change the
percentage of the emissions. Now the dominant factor is the pre use phase with a
75% of the total emissions.
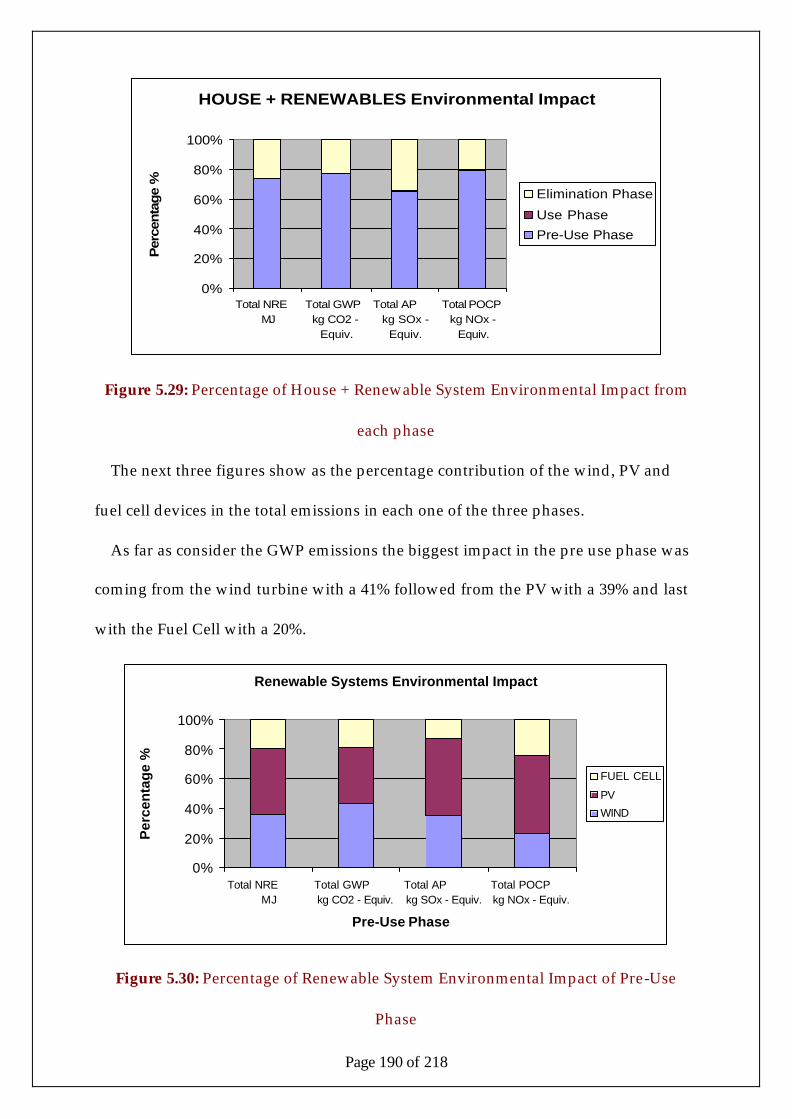
Page 190 of 218
HOUSE + RENEWABLES Environmental Impact
0%
20%
40%
60%
80%
100%
Total NRE MJ
Total GWP kg CO2 -
Equiv.
Total AP kg SOx -
Equiv.
Total POCP kg NOx -
Equiv.
Per
centa
ge
%
Elimination Phase
Use Phase
Pre-Use Phase
Figure 5.29: Percentage of House + Renewable System Environmental Impact from
each phase
The next three figures show as the percentage contribution of the wind, PV and
fuel cell devices in the total emissions in each one of the three phases.
As far as consider the GWP emissions the biggest impact in the pre use phase was
coming from the wind turbine with a 41% followed from the PV with a 39% and last
with the Fuel Cell with a 20%.
Renewable Systems Environmental Impact
0%
20%
40%
60%
80%
100%
Total NRE MJ
Total GWP kg CO2 - Equiv.
Total AP kg SOx - Equiv.
Total POCP kg NOx - Equiv.
Pre-Use Phase
Per
cen
tag
e %
FUEL CELL
PV
WIND
Figure 5.30: Percentage of Renewable System Environmental Impact of Pre-Use
Phase
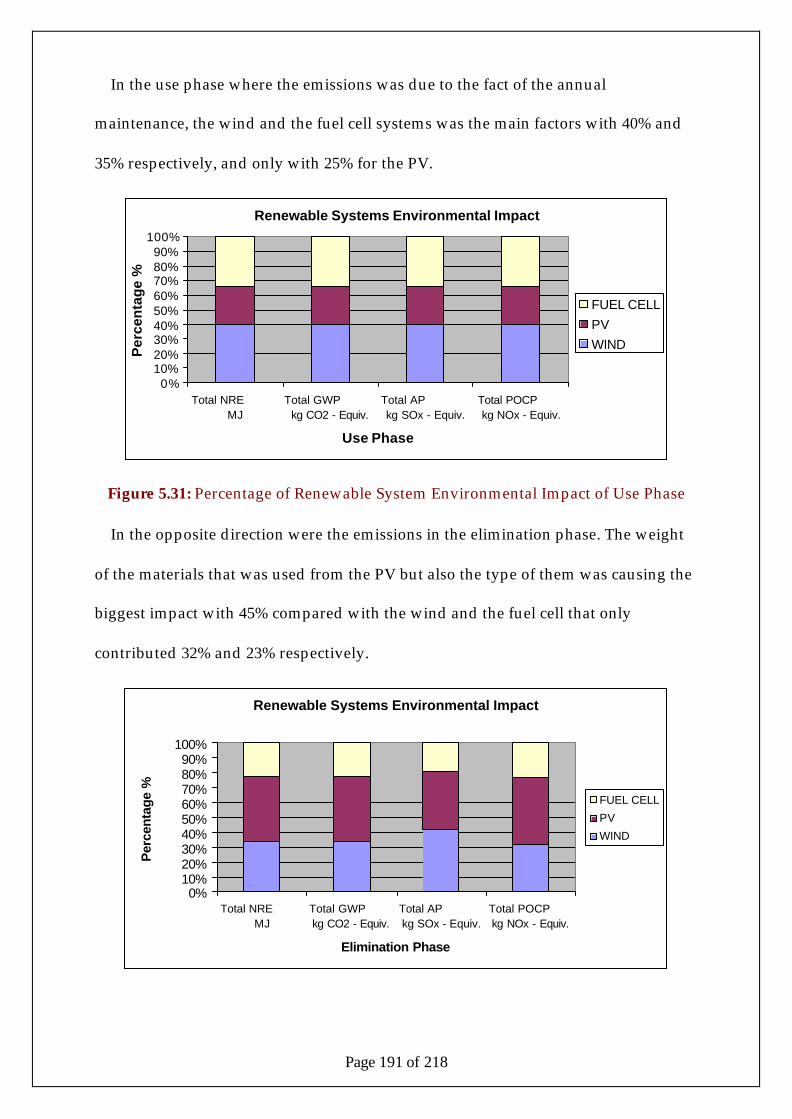
Page 191 of 218
In the use phase where the emissions was due to the fact of the annual
maintenance, the wind and the fuel cell systems was the main factors with 40% and
35% respectively, and only with 25% for the PV.
Renewable Systems Environmental Impact
0%10%20%30%40%50%60%70%80%90%
100%
Total NRE MJ
Total GWP kg CO2 - Equiv.
Total AP kg SOx - Equiv.
Total POCP kg NOx - Equiv.
Use Phase
Per
cen
tag
e %
FUEL CELL
PV
WIND
Figure 5.31: Percentage of Renewable System Environmental Impact of Use Phase
In the opposite direction were the emissions in the elimination phase. The weight
of the materials that was used from the PV but also the type of them was causing the
biggest impact with 45% compared with the wind and the fuel cell that only
contributed 32% and 23% respectively.
Renewable Systems Environmental Impact
0%10%20%30%40%50%60%70%80%90%
100%
Total NRE MJ
Total GWP kg CO2 - Equiv.
Total AP kg SOx - Equiv.
Total POCP kg NOx - Equiv.
Elimination Phase
Per
cent
age
%
FUEL CELL
PV
WIND
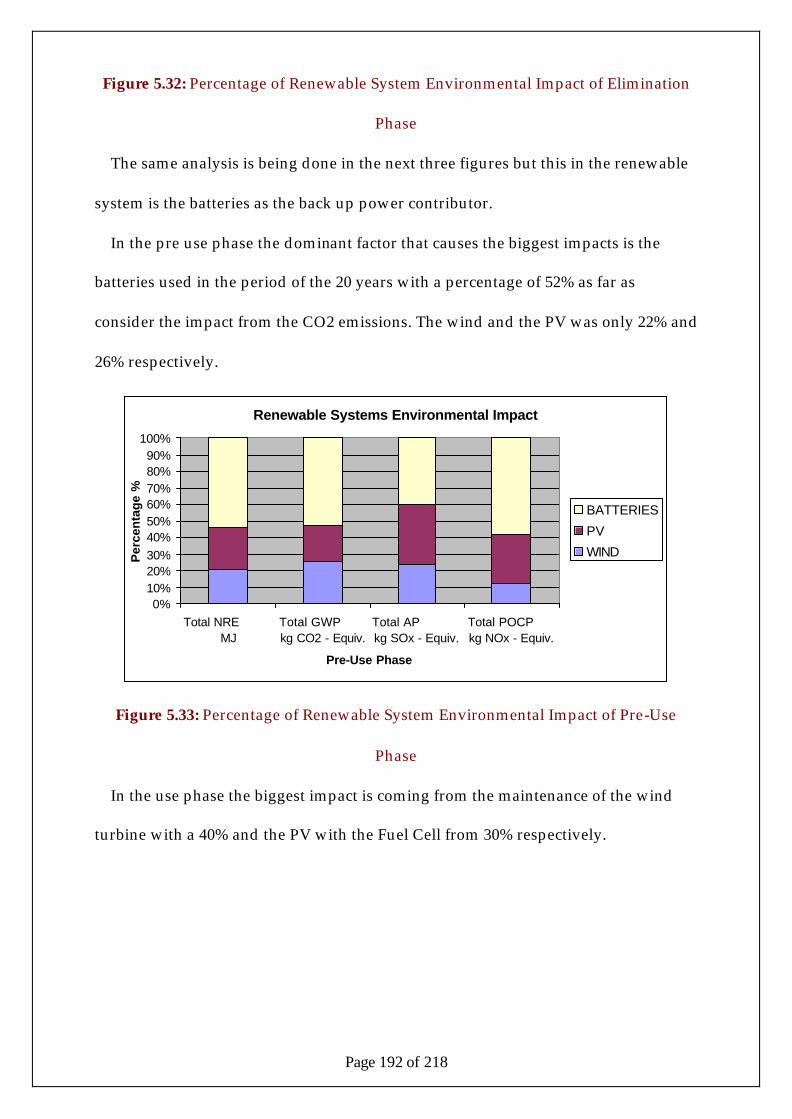
Page 192 of 218
Figure 5.32: Percentage of Renewable System Environmental Impact of Elimination
Phase
The same analysis is being done in the next three figures but this in the renewable
system is the batteries as the back up power contributor.
In the pre use phase the dominant factor that causes the biggest impacts is the
batteries used in the period of the 20 years with a percentage of 52% as far as
consider the impact from the CO2 emissions. The wind and the PV was only 22% and
26% respectively.
Renewable Systems Environmental Impact
0%10%20%30%40%50%60%70%80%90%
100%
Total NRE MJ
Total GWP kg CO2 - Equiv.
Total AP kg SOx - Equiv.
Total POCP kg NOx - Equiv.
Pre-Use Phase
Per
cen
tag
e %
BATTERIES
PV
WIND
Figure 5.33: Percentage of Renewable System Environmental Impact of Pre-Use
Phase
In the use phase the biggest impact is coming from the maintenance of the wind
turbine with a 40% and the PV with the Fuel Cell from 30% respectively.
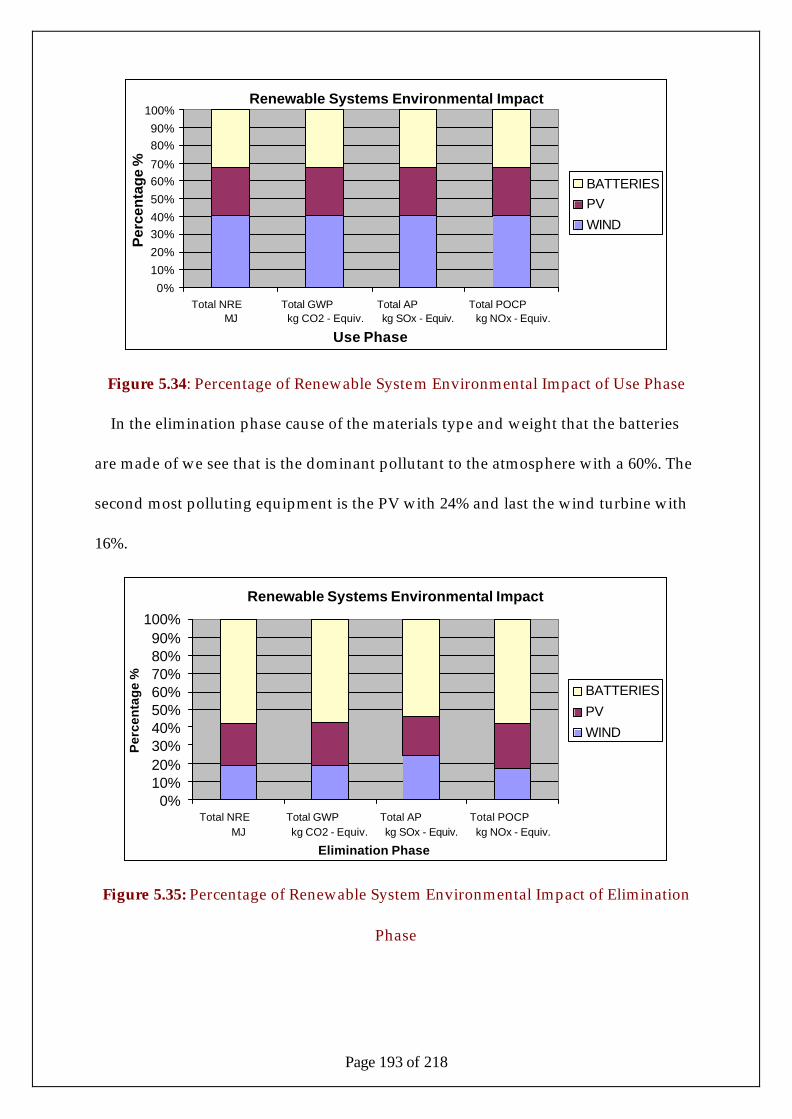
Page 193 of 218
Renewable Systems Environmental Impact
0%
10%
20%
30%40%
50%
60%70%
80%90%
100%
Total NRE MJ
Total GWP kg CO2 - Equiv.
Total AP kg SOx - Equiv.
Total POCP kg NOx - Equiv.
Use Phase
Per
cen
tag
e %
BATTERIESPV
WIND
Figure 5.34: Percentage of Renewable System Environmental Impact of Use Phase
In the elimination phase cause of the materials type and weight that the batteries
are made of we see that is the dominant pollutant to the atmosphere with a 60%. The
second most polluting equipment is the PV with 24% and last the wind turbine with
16%.
Renewable Systems Environmental Impact
0%10%20%30%40%50%60%70%80%90%
100%
Total NRE MJ
Total GWP kg CO2 - Equiv.
Total AP kg SOx - Equiv.
Total POCP kg NOx - Equiv.
Elimination Phase
Per
cen
tag
e %
BATTERIES
PV
WIND
Figure 5.35: Percentage of Renewable System Environmental Impact of Elimination
Phase

Page 194 of 218
From all the figures above we saw that the renewable system can contribute
positively in reducing the environmental impacts from the use of electricity with the
use of fossil fuels.
Despite the emissions that the renewable system extracted, wasn’t significant in
order to say that cause also the same impact to the environment.
As far as consider the fuel cell system with the batteries, we can say that the first
gives a more environmental friendly solution as the batteries.
What Are the Benefits of Conducting an LCA?
An LCA will help decision-makers select the product or process that result in the
least impact to the environment. This information can be used with other factors,
such as cost and performance data to select a product or process. LCA data identifies
the transfer of environmental impacts from one media to another (e.g., eliminating
air emissions by creating a wastewater effluent instead) and/or from one life cycle
stage to another (e.g., from use and reuse of the product to the raw material
acquisition phase). If an LCA was not performed, the transfer might not be
recognized and properly included in the analysis because it is outside of the typical
scope or focus of product selection processes.
This ability to track and document shifts in environmental impacts can help
decision makers and managers fully characterize the environmental trade-offs
associated with product or process alternatives. By performing an LCA, researchers
can:
• Develop a systematic evaluation of the environmental consequences
associated with a given product.

Page 195 of 218
• Analyze the environmental trade-offs associated with one or more specific
products/processes to help gain stakeholder (state, community, etc.)
acceptance for a planned action.
• Quantify environmental releases to air, water, and land in relation to each life
cycle stage and/or major contributing process.
• Assist in identifying significant shifts in environmental impacts between life
cycle stages and environmental media.
• Assess the human and ecological effects of material consumption and
environmental releases to the local community, region, and world.
• Compare the health and ecological impacts between two or more rival
products/processes or identify the impacts of a specific product or process.
• Identify impacts to one or more specific environmental areas of concern.
Limitations of Conducting an LCA
Performing an LCA can be resource and time intensive. Depending upon how
thorough an LCA the users wish to conduct, gathering the data can be problematic,
and the availability of data can greatly impact the accuracy of the final results.
Therefore, it is important to weigh the availability of data, the time necessary to
conduct the study, and the financial resources required against the projected benefits
of the LCA.
LCA will not determine which product or process is the most cost effective or
works the best. Therefore, the information developed in an LCA study should be
used as one component of a more comprehensive decision process assessing the
trade-offs with cost and performance.

Page 196 of 218
What are the Challenges?
LCA requires specific and well researched information to establish baseline
environmental impact data for even basic raw materials, and can thus be extremely
resource intensive. Also, the environmental impacts of raw material extraction and
production processes may vary from country to country, and even from region to
region. For example, the impacts of extracting one tonne of coal in Australia differ
from those in the USA, because of different mining and transport techniques and
technologies, and also a different environment. Indeed, the impacts differ depending
from which Australian State the coal is extracted.
Other problems with LCA include:
• the inherent subjectivity of assessments (e.g in determining relative weighting
for emissions);
• the lack of a widely accepted methodology for conducting LCA;
• difficulties on clearly defining the scope of and LCA;
• confidentiality issues that restrict the availability of data; and
• the cost, complexity and time consumed in undertaking a comprehensive
LCA.
A comprehensive LCA is unlikely to be relevant, or indeed, possible for smaller
organisations. However it is still possible to reap the benefits by adopting a 'life cycle'
approach. The LCA process can be streamlined with a company examining only
those parts or operations that have the most impact or potential for improvement.
This can maximise the benefits and minimise the cost of LCA.
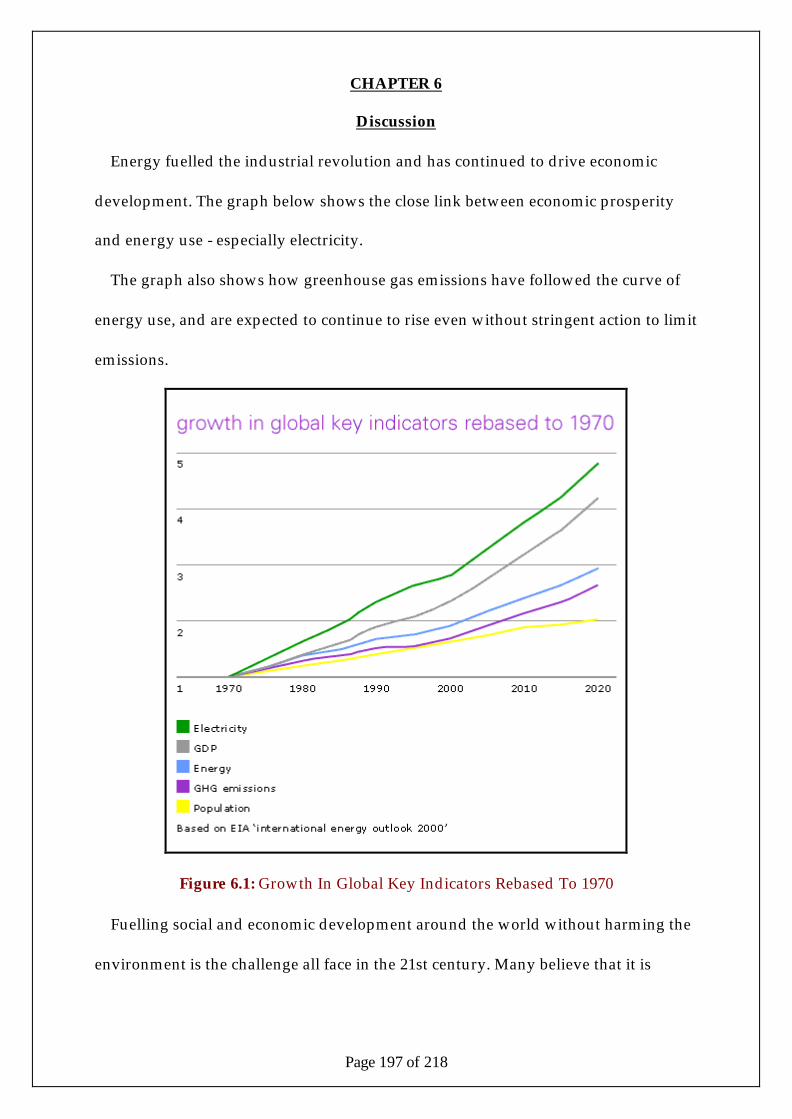
Page 197 of 218
CHAPTER 6
Discussion
Energy fuelled the industrial revolution and has continued to drive economic
development. The graph below shows the close link between economic prosperity
and energy use - especially electricity.
The graph also shows how greenhouse gas emissions have followed the curve of
energy use, and are expected to continue to rise even without stringent action to limit
emissions.
Figure 6.1: Growth In Global Key Indicators Rebased To 1970
Fuelling social and economic development around the world without harming the
environment is the challenge all face in the 21st century. Many believe that it is

Page 198 of 218
essential to stabilize the amount of greenhouse gases in the atmosphere while still
providing the energy that is needed for development.
Clean, renewable energy is the ultimate goal. But this is a long way off as the
graph below shows. Hydrocarbons are expected to remain as the dominant source of
energy for several decades.
Figure 6.2: World Primary Energy Mix
All the signs are that the world's demand for energy will continue to increase in
the future. As populations increase and living standards improve around the globe,
more and more energy will have to be generated unless substantial improvements in
energy efficiency are achieved.
As we see in the figure below renewable energy had the biggest growth in the last
decade.
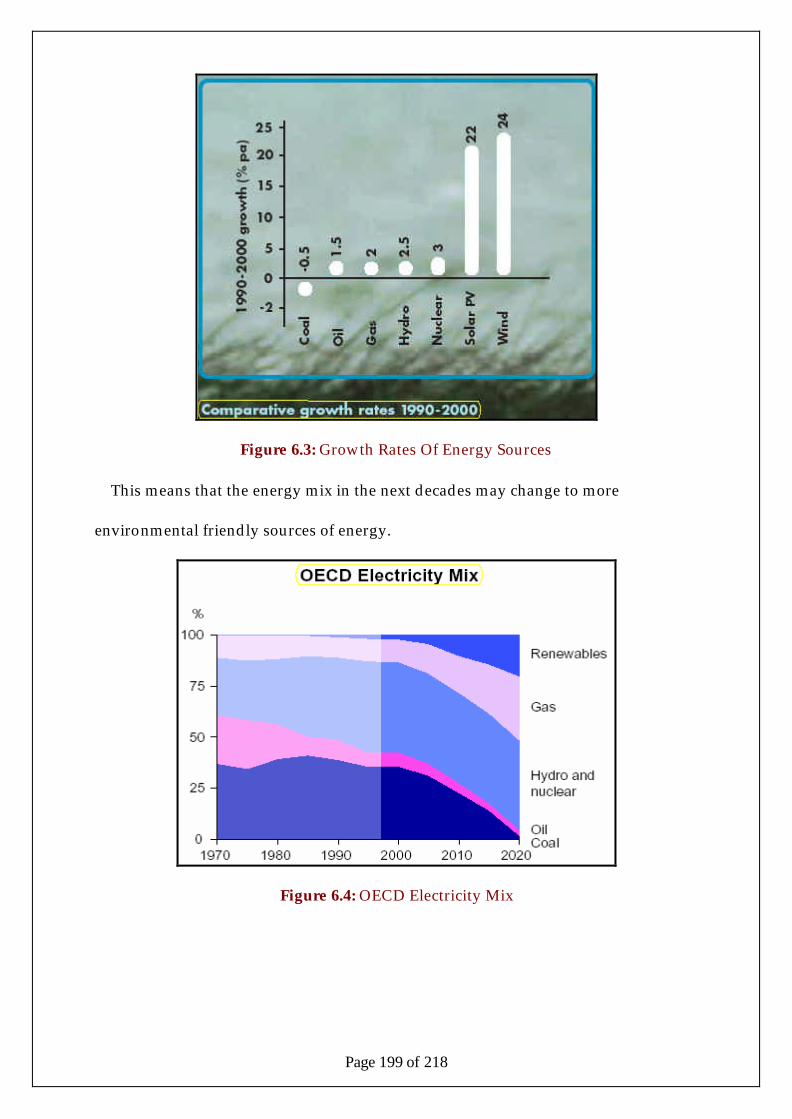
Page 199 of 218
Figure 6.3: Growth Rates Of Energy Sources
This means that the energy mix in the next decades may change to more
environmental friendly sources of energy.
Figure 6.4: OECD Electricity Mix
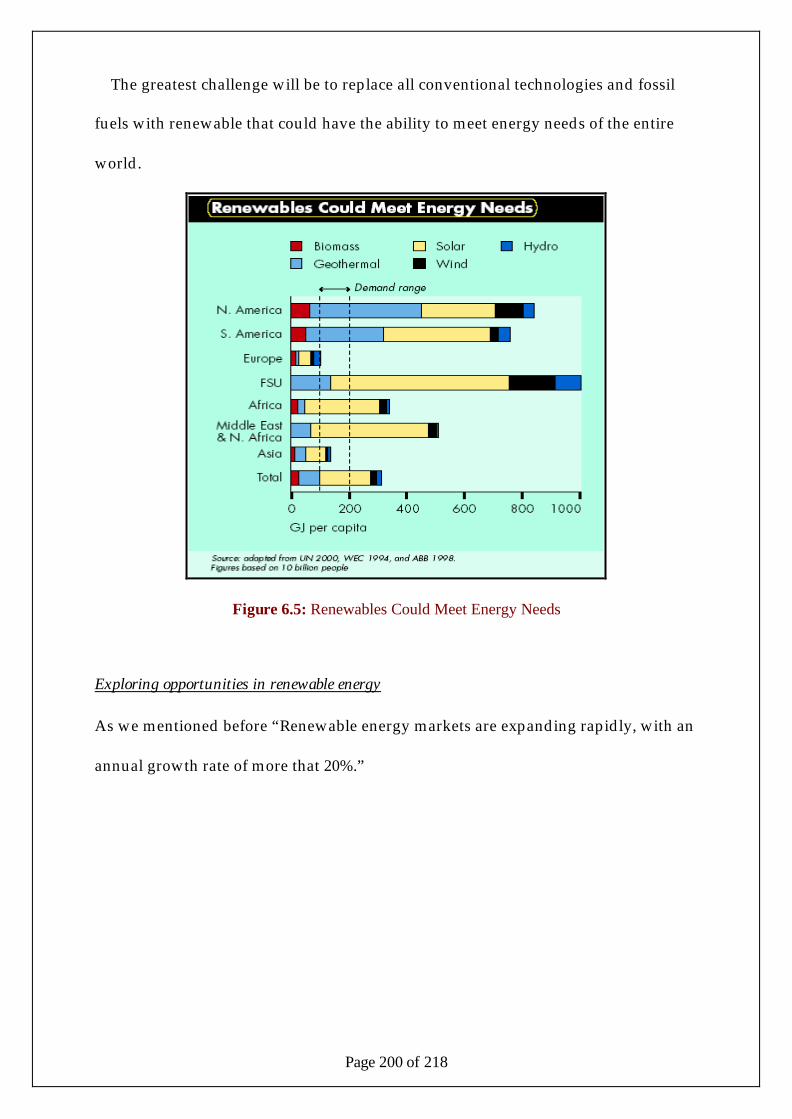
Page 200 of 218
The greatest challenge will be to replace all conventional technologies and fossil
fuels with renewable that could have the ability to meet energy needs of the entire
world.
Figure 6.5: Renewables Could Meet Energy Needs
Exploring opportunities in renewable energy
As we mentioned before “Renewable energy markets are expanding rapidly, with an
annual growth rate of more that 20%.”

Page 201 of 218
Figure 6.6: Growth Rate Of Renewable Energy Sources
It is always necessary to look in to the future. Therefore a major part of investment
should go in to developing other forms of energy.
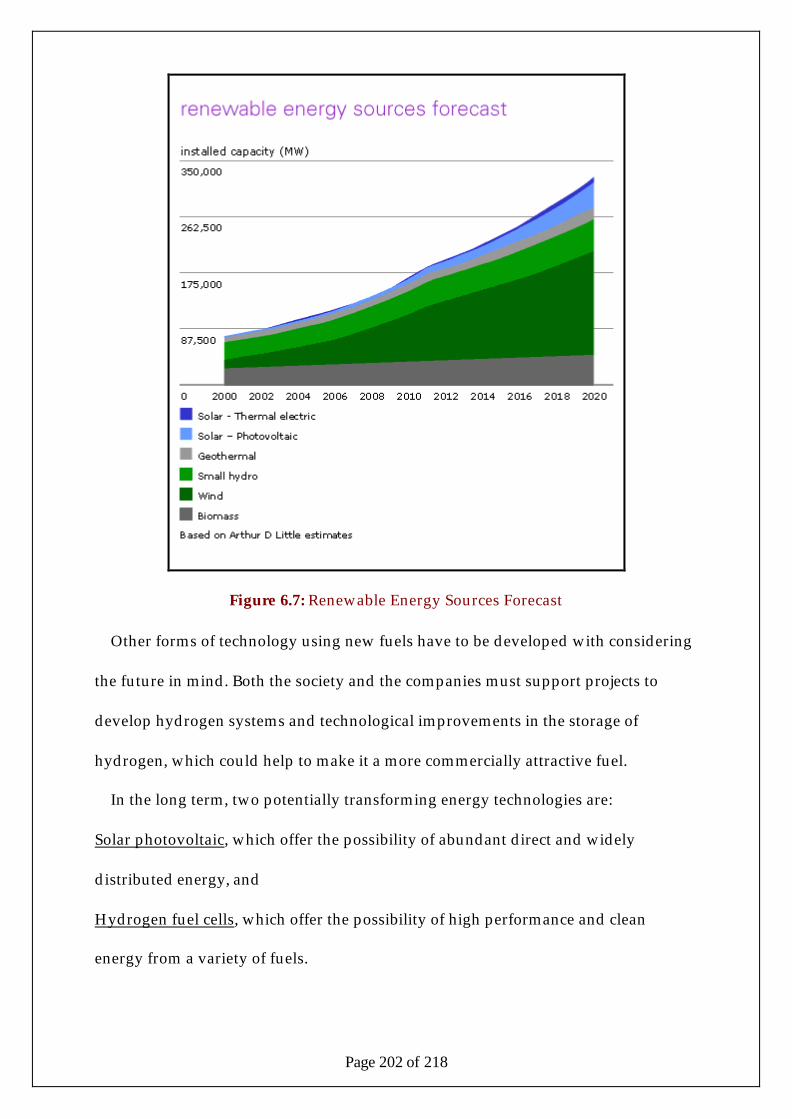
Page 202 of 218
Figure 6.7: Renewable Energy Sources Forecast
Other forms of technology using new fuels have to be developed with considering
the future in mind. Both the society and the companies must support projects to
develop hydrogen systems and technological improvements in the storage of
hydrogen, which could help to make it a more commercially attractive fuel.
In the long term, two potentially transforming energy technologies are:
Solar photovoltaic, which offer the possibility of abundant direct and widely
distributed energy, and
Hydrogen fuel cells, which offer the possibility of high performance and clean
energy from a variety of fuels.

Page 203 of 218
Figure 6.8: Production And Use Of Hydrogen
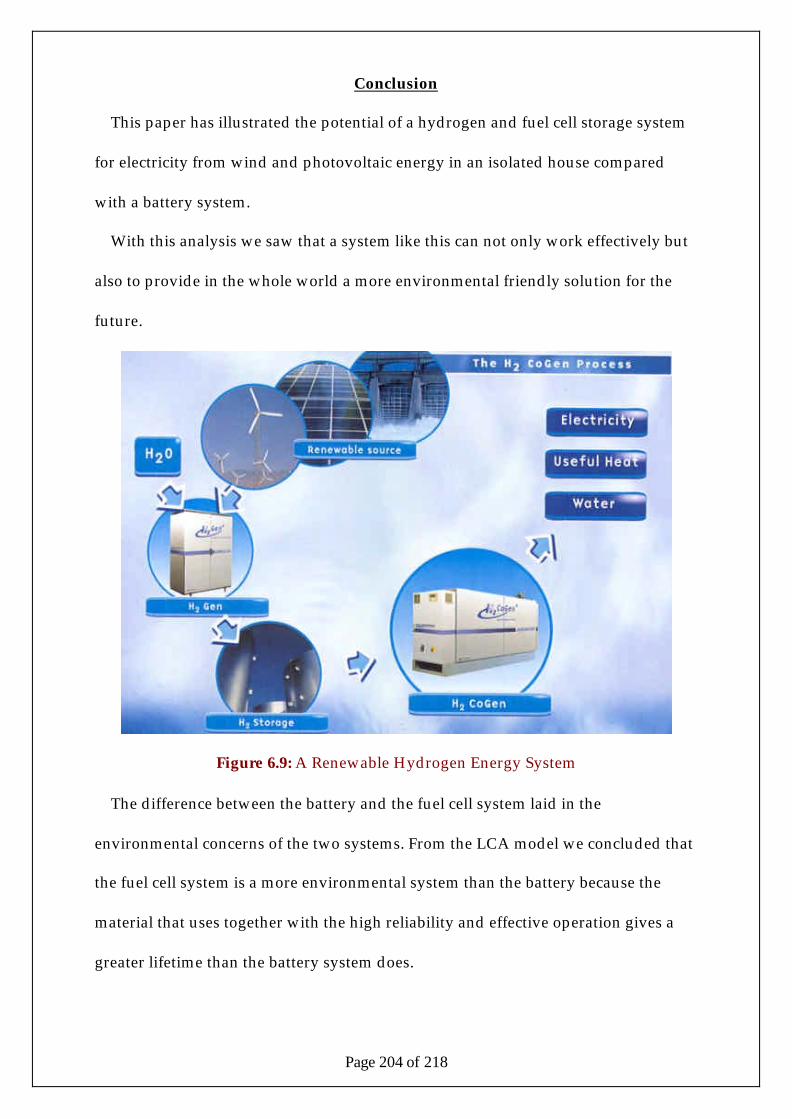
Page 204 of 218
Conclusion
This paper has illustrated the potential of a hydrogen and fuel cell storage system
for electricity from wind and photovoltaic energy in an isolated house compared
with a battery system.
With this analysis we saw that a system like this can not only work effectively but
also to provide in the whole world a more environmental friendly solution for the
future.
Figure 6.9: A Renewable Hydrogen Energy System
The difference between the battery and the fuel cell system laid in the
environmental concerns of the two systems. From the LCA model we concluded that
the fuel cell system is a more environmental system than the battery because the
material that uses together with the high reliability and effective operation gives a
greater lifetime than the battery system does.

Page 205 of 218
Figure 6.10: The Life Cycle Stage

Page 206 of 218
Recommendation for Future Work
Any further work would have to involve site specific wind and photovoltaic data
for the estimation of the annual energy that is needed for the consumption of the
house or for a remote community.
An economic analysis would also be required to assess the start up capital and the
cost of electricity from such a system.
Hydrogen production, storage and the energy produced from this is an important
issue for consideration and a more detailed investigation in terms of performance,
economics and practicality would be necessary.
As far as consider the LCA, we would for better analysis and estimation of the
environmental impact from such a system, to conduct the specific companies and ask
what materials and in what weight are being used for the production of renewable
equipment in order to have more accurate information.
Figure 6.11: Wind, PV, Hydrogen, Fuel Cell Power for a Remote Community
Page 207 of 218
References
1. “Renewable energy sources”, John Twiddle and Tony Weir, 2000
2. “Renewable energy”, Rozmeen Tambe, Hampton : Key Note Ltd, 2003
3. “Fuel Cells: Technology status and prospects for application”, Ewen Sweeney,
1999
4. “The future of energy use”, Robert Hill, Phil O'Keefe and Colin Snape,
Earthscan, London, 1995
5. “Alternative fuels and the environment”, by Frances S. Sterrett, Lewis Publishers:
Boca Raton, Fla. ; London, 1995
6. “Renewable energy-2000”,G. T. Wrixon, A.-M. E. Rooney, W. Palz, Berlin ; New
York : Springer-Verlag, 1993
7. “Energy options :an introduction to small-scale renewable energy technologies”,
Drummond Hislop, London : Intermediate Technology Publications, 1992
8. “The alternative energy handbook”, Rosenberg, Paul, Fairmont Press Lilburn,
Ga., 1992
9. “The hydrogen economy :the creation of the world-wide energy web and the
redistribution of power on earth”, Rifkin, Jeremy, Oxford : Polity, 2002
10. “Tomorrow's energy :hydrogen, fuel cells, and the prospects for a cleaner
planet”, Hoffmann, Peter, Cambridge, Mass. ; London : MIT Press, c2001
11. “Hydrogen power :theoretical and engineering solutions”, proceedings of the
HYPOTHESIS II Symposium held in Grimstad, Norway, 18-22 August 1997 ; edited
by T.O. Saetre
12. “Hydrogen and other alternative fuels for air and ground transportation”, H.W.
Pohl, Chichester : John Wiley & Sons, 1995
Page 208 of 218
13. “Liquid hydrogen :fuel of the future”, Edmund A. Wilhelm and Ulrike Wilhelm
14. “Solar hydrogen: moving beyond fossil fuels”, Joan M. Ogden, Robert H.
Williams
15. “Hydrogen and energy”,Charles A. McAuliffe, London : Macmillan, 1980
16. “Hydrogen power :an introduction to hydrogen energy and its applications”,
L.O. Williams
17. “Solar-hydrogen energy systems :an authoritative review of water-splitting
systems by solar beam and solar heat : hydrogen production, storage and
utilisation”, Tokio Ohta.
18. “Hydrogen : its technology and implications”, eds. Kenneth E. Cox and K.D.
Williamsonvol, Transmission and storage
19. “Introduction to hydrogen energy” T. Nejat Veziroglu
20. “Renewable energy sources”, Michael A. Laughton, London : Elsevier Applied
Science for The Watt Committee on Energy, 1990
21. “Fuel cell technology handbook”, Gregor Hoogers
22. “Fuel cell handbook”, A.J. Appleby [and] F.R. Foulkes
23. “Renewable energy :today's contribution, tomorrow's promise”, Shea, Cynthia
Pollock
24. “New and renewable sources of energy”, Essam El-Hinnawi, Margaret R.
Biswas, Asit K. Biswas, Dublin : Tycooly International, 1983
25 “Renewable energy : a clean technology :a review and strategy for SERC”,
N.Lipman
26. “Assessment of hydrogen fuelled proton exchange membrane fuel cells for
distributed generation and cogeneration”, US DOE, 2000

Page 209 of 218
27. “Analysis of residential fuel cell systems and PNGV fuel cell vehicles”, US
DOE 2000
28. “Technology status report: Hydrogen”, UK DTI, 2001
29. “Renewable Energy- Power for Sustainable Future” Godfrey Boyle (1996),
Oxford University Press.
www.fuelcells.com
www.h2fc.com
www.crest.org
http://www.iea.org/pubs/studies/files/benign/full/00-bene.htm
http://www.energyalternatives.ca/
http://dnr.metrokc.gov/WTD/fuelcell/details.htm
http://www.fuelcellproducts.com/FuelCellTechnology.htm
http://www.fuelcellstore.com/information/fuel_cell_information_index.html
http://www.canren.gc.ca/prod_serv/index.asp?CaId=101&PgId=578
http://www.nfcrc.uci.edu/fcresources/FCexplained/challenges.htm
http://www.vertigoabseiling.com/commercial/windturbine.html
http://www.energy.iastate.edu/renewable/wind/wem/wem-02_toc.html
http://www.3m.com/us/mfg_industrial/fuelcells/
http://fuelcells.si.edu/basics.htm
http://www.iahe.org/abouth.htm
http://www.napssystems.com/about_solar.html
http://www.aluminum-power.com/evolution.htm
http://www.ark-solar-power.com/trojan.html
http://www.automotivecompass.com/fuelcell.html

Page 210 of 218
http://www.ballard.com/tC.asp?pgid=18&dbid=0
http://www.hionsolar.com/n-heq1.html
http://www.iea.org/pubs/studies/files/benign/full/00-bene.htm
http://www.c2esc.com/fuelcell1.html
http://americanhistory.si.edu/csr/fuelcells/
http://www.windsun.com/Batteries/Deep_Cycle.htm
http://www.deloscomm.gr/grindex.htm
http://www.dodfuelcell.com/
http://fossil.energy.gov/coal_power/fuelcells/fuelcells_howitworks.shtml
http://www.eren.doe.gov/
http://www.independent-power.com/E-terms.html
http://www.hsssi.com/Applications/EChem/
http://www.ectechnic.co.uk/
http://www.pege.org/greenwinds/electrolyzer.htm
http://www.energotech.gr/index.htm
http://www.energy.com.au/ea/earetail.nsf/Content/Home
http://www.fao.org/DOCREP/004/Y3609E/y3609e00.htm#TopOfPage
http://www.environment.govt.nz/
http://www.ece.curtin.edu.au/cresta/_private/Dec00Paper7.htm
http://www.newenergy.org.cn/english/hydrogen/science/fuelcell.htm
http://www.sanewsletters.com/FCIR/index.asp
http://www.fuelcellmaterials.com/
http://www.ms.ornl.gov/htmlhome/mauc/fuelcell.htm
http://esa.www5.50megs.com/energy/fuelcell/fuelcell.html

Page 211 of 218
http://www.pace.edu/dyson/academics/chemistryplv/rahnidocs/law802/Fuel%2
0Cells%20Systems.htm
http://www.fuelcells.org/
http://web.grinnell.edu/individuals/simonson/fuelcells/index.htm
http://www.princeton.edu/~chm333/FuelCells/index.shtml
http://fuelcells.sae.org/
http://www.lanl.gov/worldview/science/features/fuelcell.html
http://fuelcellstore.com/
http://students.bath.ac.uk/en0wgam/lowzero_cars/futuretech/futuretechfc.htm
http://www.h2fc.com/defaultIE4.html
http://www.iea.org/index.html
http://www.howstuffworks.com/battery.htm
http://www.howstuffworks.com/fuel-cell.htm
http://www.hpower.com/
http://www.fuel-cell.com/english/
http://www.thirdorbitpower.com/#pages
http://www.hydrogennow.org/Facts/Hydrogen_Facts.htm
http://www.absak.com/basic/fuel_cells.html
http://www.hydrogensystems.com/index2.html
http://www.rcep.org.uk/studies/energy/98-6067/michaelis.html
http://www.nfcrc.uci.edu/fuelcellinfo_index.htm
http://www.nrel.gov/
http://books.nap.edu/books/0309054419/html/29.html
http://www.nextechmaterials.com/

Page 212 of 218
http://216.239.37.100/search?q=cache:u9ETtnGg6VAC:www.isl.ee.boun.edu.tr/peo
ple/hasan/me210/project.htm+electrolyser+materials&hl=el&ie=UTF-8&inlang=el
http://www.advancedenergyonline.com/catalog/solar/
http://www.plugpower.com/
http://www.protonenergy.com/index.php/html/energysystems/home/index.html
http://www.realgoods.com/renew/index.cfm
http://www.geocities.com/dieret/re/dieret.html
http://www.greenhouse.gov.au/renewable/index.html
http://lacec.agr.uth.gr/rescourses/RES_links_en.html
http://www.bergey.com/Products/Prices3.htm
http://www.solarelectric.com/products/level3_121.htm
http://www.nooutage.com/SolarPVMod.htm
http://www.jxj.com/magsandj/rew/2001_02/staying_in_charge.html
http://www.stuartenergy.com/
http://www.ifc.com/
http://europa.eu.int/comm/energy_transport/atlas/homeu.html
http://www.iahe.org/
http://www.powerscorecard.org/choice.cfm
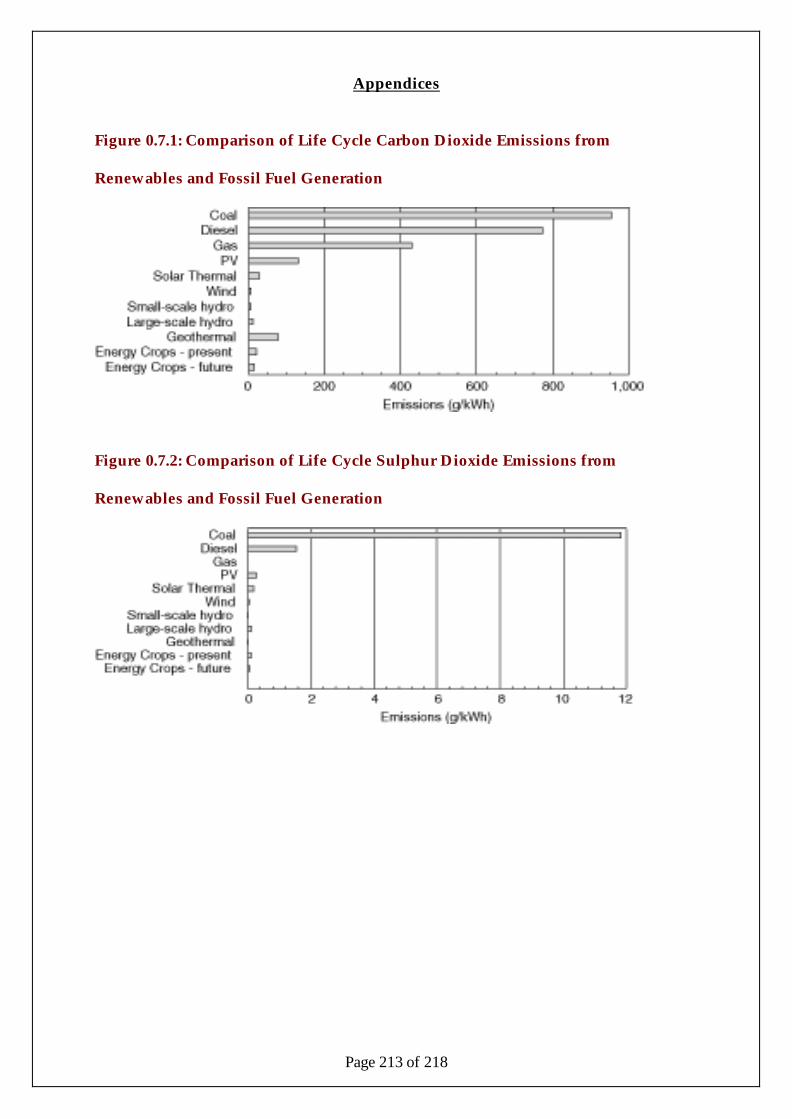
Page 213 of 218
Appendices
Figure 0.7.1: Comparison of Life Cycle Carbon Dioxide Emissions from
Renewables and Fossil Fuel Generation
Figure 0.7.2: Comparison of Life Cycle Sulphur Dioxide Emissions from
Renewables and Fossil Fuel Generation
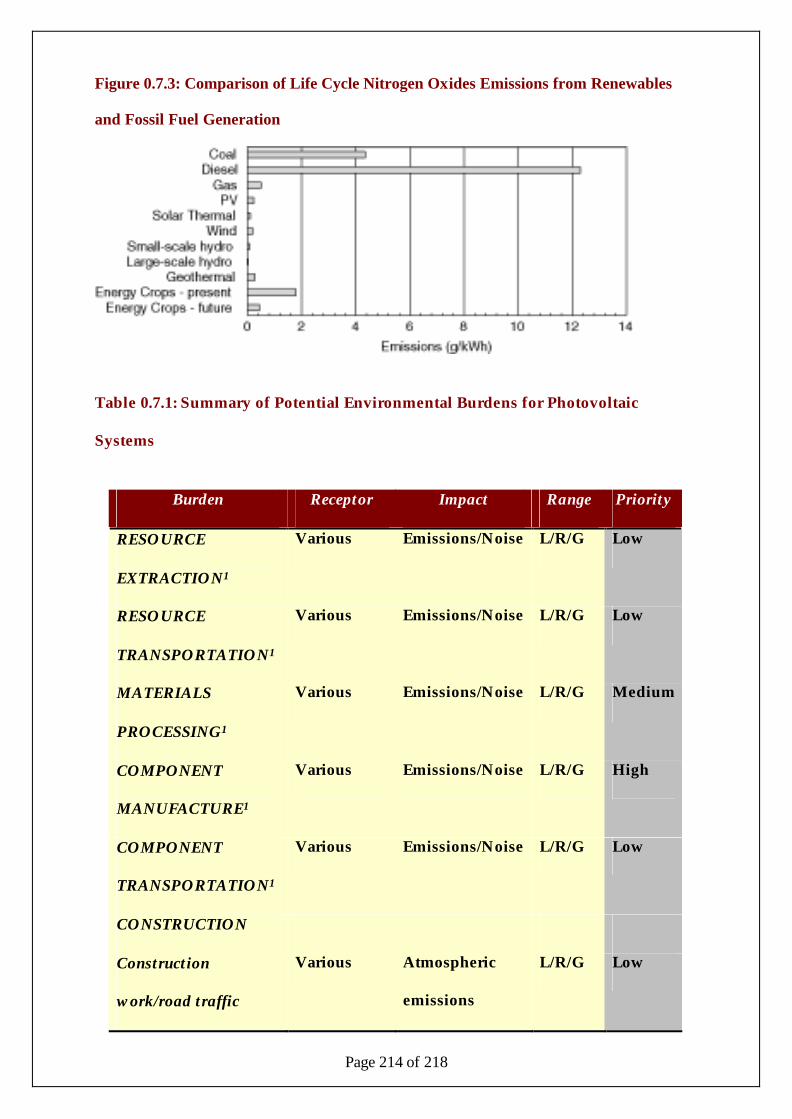
Page 214 of 218
Figure 0.7.3: Comparison of Life Cycle Nitrogen Oxides Emissions from Renewables
and Fossil Fuel Generation
Table 0.7.1: Summary of Potential Environmental Burdens for Photovoltaic
Systems
Burden Receptor Impact Range Priority
RESOURCE
EXTRACTION1
Various Emissions/Noise L/R/G Low
RESOURCE
TRANSPORTATION1
Various Emissions/Noise L/R/G Low
MATERIALS
PROCESSING1
Various Emissions/Noise L/R/G Medium
COMPONENT
MANUFACTURE1
Various Emissions/Noise L/R/G High
COMPONENT
TRANSPORTATION1
Various Emissions/Noise L/R/G Low
CONSTRUCTION
Construction
work/road traffic
Various Atmospheric
emissions
L/R/G Low

Page 215 of 218
Occupational
impacts
Employment
Workers
Increased
employment
Accidents
Loc/Reg
Local
Low
Low
Amenity
Noise (including road
traffic)
General
public
Noise amenity Local Low
Visual impact General
public
Visual amenity Local Low
Ecology
Land use Ecosystems Land use - loss
of habitat
Local Low-
High2
Noise/construction
activity
Ecosystems Disturbance Local Low
GENERATION
Emissions None
Amenity
Visual impact General
public
Visual amenity Local Low-
High2
Ecosystems Local Low
Public Health
Occupational health Workers Accidents Local Low
Employment Increased
employment
benefits
Local Low
DECOMMISSIONING Various Emissions/Noise Low
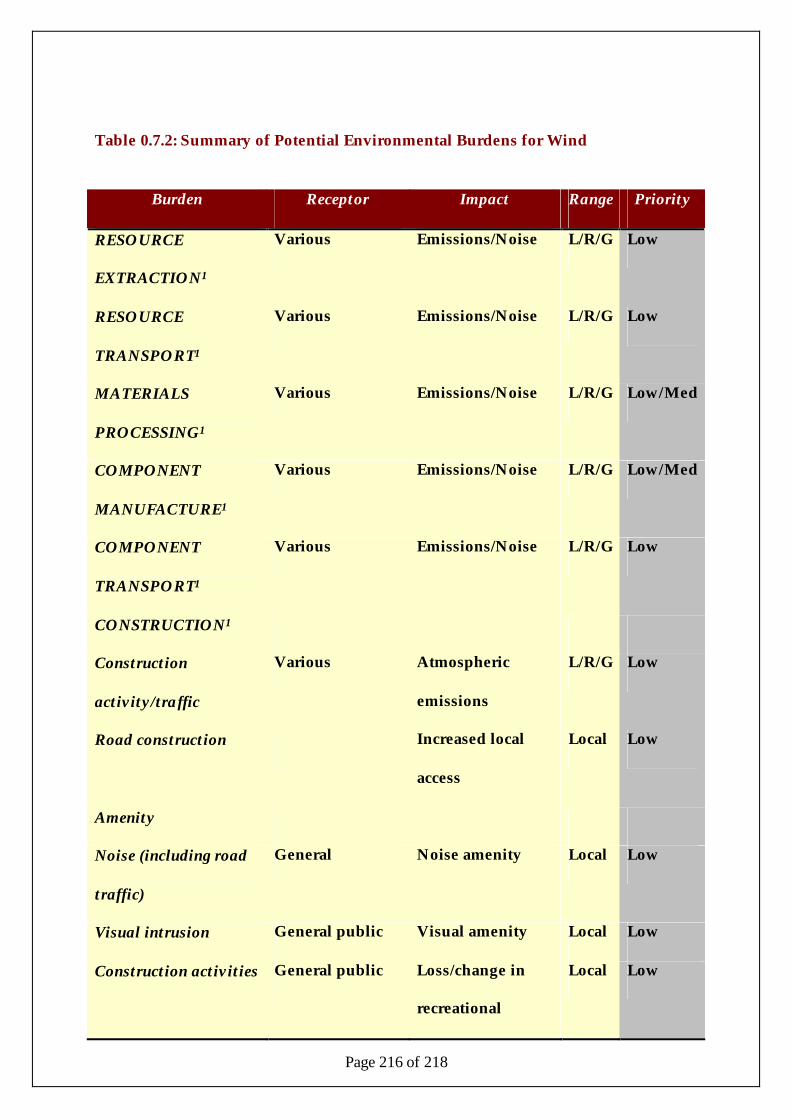
Page 216 of 218
Table 0.7.2: Summary of Potential Environmental Burdens for Wind
Burden Receptor Impact Range Priority
RESOURCE
EXTRACTION1
Various Emissions/Noise L/R/G Low
RESOURCE
TRANSPORT1
Various Emissions/Noise L/R/G Low
MATERIALS
PROCESSING1
Various Emissions/Noise L/R/G Low/Med
COMPONENT
MANUFACTURE1
Various Emissions/Noise L/R/G Low/Med
COMPONENT
TRANSPORT1
Various Emissions/Noise L/R/G Low
CONSTRUCTION1
Construction
activity/traffic
Various Atmospheric
emissions
L/R/G Low
Road construction Increased local
access
Local Low
Amenity
Noise (including road
traffic)
General Noise amenity Local Low
Visual intrusion General public Visual amenity Local Low
Construction activities General public Loss/change in
recreational
Local Low
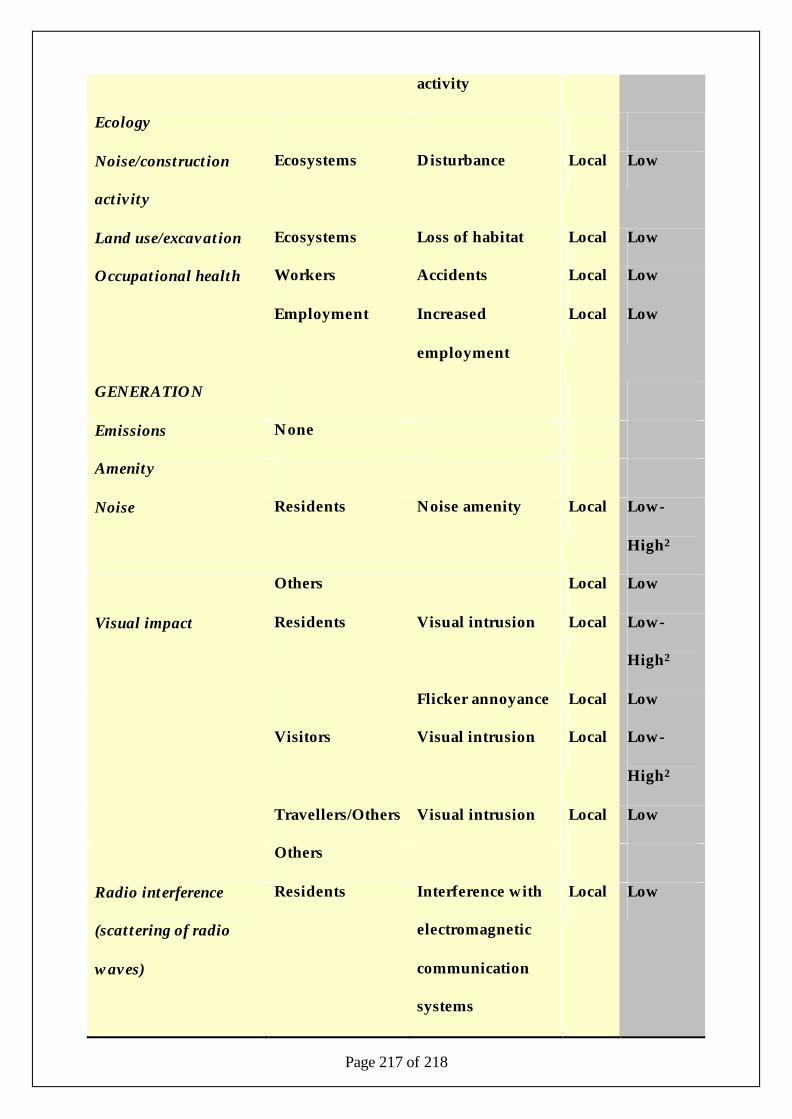
Page 217 of 218
activity
Ecology
Noise/construction
activity
Ecosystems Disturbance Local Low
Land use/excavation Ecosystems Loss of habitat Local Low
Occupational health Workers Accidents Local Low
Employment Increased
employment
Local Low
GENERATION
Emissions None
Amenity
Noise Residents Noise amenity Local Low-
High2
Others Local Low
Visual impact Residents Visual intrusion Local Low-
High2
Flicker annoyance Local Low
Visitors Visual intrusion Local Low-
High2
Travellers/Others Visual intrusion Local Low
Others
Radio interference
(scattering of radio
waves)
Residents Interference with
electromagnetic
communication
systems
Local Low

Page 218 of 218
GENERATION
Occupational health Workers Accidents Local Low
Employment Increased
employment
Local Low
Public Health
Accidents General public Turbine accidents Local Low
Road travellers Driver distraction Local Low
Epileptic fits Epileptics Attacks Local Low
Ecosystems
Turbine motion Birds Bird strike,
disturbance
Local Low
Land use Ecosystems Loss of habitat,
disturbance
Local Low
Agriculture Loss of land Local Low
DECOMMISSIONING Various Emissions/Noise L/R/G Low