Abstract - Yale Universityschepartzlab.yale.edu/intranet/theses/HodgesAM_Final thesis.pdf · 2.2.3...
127
Abstract Optimization and Applications of a Miniature Protein Scaffold Abby Maranda Hodges 2008 This dissertation describes the optimization of avian pancreatic polypeptide (aPP) for use as a protein scaffold and the further characterization of two sets of aPP-based miniature proteins with biological applications. Protein therapeutics have made significant strides in medicine in recent years, but challenges of cost, size, and formulation still impede the true potential of the industry. Miniaturization of large proteins while maintaining full function and specificity is one method successfully overcoming those challenges. The characteristics of a good scaffold include flexibility for many ligand •target complexes, predictable and stable folding characteristics, cell permeability, and adaptability to varied solution environments. aPP has many of these characteristics, but its utility as a protein scaffold has been hindered by a tendency to dimerize at biologically relevant concentrations. The first chapter outlines the engineering process used to remove a single tyrosine residue responsible for dimerization and the subsequent refolding of the protein through a simple “proline switch”. The second and third chapters discuss two examples of miniature proteins being used as tools to learn more about the biological systems of apoptosis and cell signaling. The PPBH3 series of miniature proteins were previously developed to bind preferentially to either of the anti-apoptotic proteins Bcl-2 or Bcl-X L . Through examination of the structures and subsequent amino acid substitutions within Bcl-X L , the elements necessary
Transcript of Abstract - Yale Universityschepartzlab.yale.edu/intranet/theses/HodgesAM_Final thesis.pdf · 2.2.3...

Abstract
Optimization and Applications of a Miniature Protein Scaffold
Abby Maranda Hodges
2008
This dissertation describes the optimization of avian pancreatic polypeptide (aPP)
for use as a protein scaffold and the further characterization of two sets of aPP-based
miniature proteins with biological applications. Protein therapeutics have made
significant strides in medicine in recent years, but challenges of cost, size, and
formulation still impede the true potential of the industry. Miniaturization of large
proteins while maintaining full function and specificity is one method successfully
overcoming those challenges. The characteristics of a good scaffold include flexibility
for many ligand •target complexes, predictable and stable folding characteristics, cell
permeability, and adaptability to varied solution environments. aPP has many of these
characteristics, but its utility as a protein scaffold has been hindered by a tendency to
dimerize at biologically relevant concentrations. The first chapter outlines the
engineering process used to remove a single tyrosine residue responsible for dimerization
and the subsequent refolding of the protein through a simple “proline switch”.
The second and third chapters discuss two examples of miniature proteins being
used as tools to learn more about the biological systems of apoptosis and cell signaling.
The PPBH3 series of miniature proteins were previously developed to bind preferentially
to either of the anti-apoptotic proteins Bcl-2 or Bcl-XL. Through examination of the
structures and subsequent amino acid substitutions within Bcl-XL, the elements necessary

II
for specificity in the natural and designed Bcl-2 ligands are elucidated. These results will
guide future design of specificity selections in the development of miniature protein
families. In the third chapter, the SH3 domain binding miniature proteins (PP1, YY1 and
others) are tested for their ability to activate the Src family kinases c-Src and Hck in a
mammalian cell.

III
Optimization and Applications of a Miniature Protein Scaffold
A dissertation
Presented to the Faculty of the Graduate School
of
Yale University
in Candidacy for the Degree of
Doctor of Philosophy
Abby Maranda Hodges
Dissertation Director: Dr. Alanna Schepartz
December 2008

IV
© 2009 by Abby Maranda Hodges
All rights reserved
V
Table of Contents
Abstract I
Title III
Copyright IV
Table of contents V
Figures and Tables IX
Introduction: Protein-based therapeutics: status and challenges 1
Introduction references 4
Chapter 1: Engineering a monomeric, well-folded miniature protein scaffold
1.1 The PP fold family of proteins as protein scaffolds 7
1.1.1 Members of the PP family of proteins 7
1.1.2 Structures of PP-fold family proteins 8
1.1.3 Characterizations of the self-association of aPP 11
1.1.4 Other relevant structural studies of PP family proteins 12
1.1.5 PP-family proteins as protein scaffolds 13
1.2 Design and characterization of a monomeric, folded aPP-based scaffold 15
1.2.1 Sequence analysis of natural and designed PP-fold proteins 15
1.2.2 Analysis of potential dimerization residues in aPP 16
1.2.3 Attempts to refold aPPY7A by helix-dipole stabilization 18
1.2.4 Introduction of a “proline switch” in aPPY7A 19
1.2.5 Final conclusions regarding dimerization and fold of aPP 22

VI
1.3 Experimental materials and methods 22
1.3.1 Peptide synthesis and purification. 23
1.3.2 Circular dichroism 24
1.3.3 Sedimentation equilibrium 25
1.3.4 Supplemental methods for data fitting using HeteroAnalysis 27
Chapter 1 references 44
Chapter 2: Origins of Specificity in Natural and Miniature Protein Ligands for Bcl-
2 Family Proteins
2.1 Miniature protein ligands for anti-apoptotic proteins 49
2.1.1 Roles and mechanism of Bcl-XL and Bcl-2 in apoptosis 49
2.1.2 Development of a miniature protein ligand for Bcl-XL and Bcl-2 51
2.1.3 Selection of paralog specific miniature proteins 52
2.2 Analysis of binding modes for Bcl-XL and Bcl-2 ligands 53
2.2.1 Structural analysis of Bcl-XL and Bcl-2 binding grooves 53
2.2.2 Design and cloning of Bcl-XL variants 55
2.2.3 Binding affinity of natural ligand Bak to Bcl-XL variants 56
2.2.4 Affinity of R8-PPBH3-1 for Bcl-XL, Bcl-XL variants, and Bcl-2 57
2.2.5 Affinity of PPBH3-5 and PPBH3-6 for Bcl-XL, Bcl-XL variants,
and Bcl-2 58
2.2.6 Binding mode comparisons of natural and designed ligands for
Bcl-2 and Bcl-XL 59
2.3 Experimental materials and methods 61

VII
2.3.1 Peptide synthesis and purification 61
2.3.2 Cloning of Bcl-XL and variants 62
2.3.3 Protein expression, purification, and characterization 62
2.3.4 Fluorescence polarization determination of binding affinity 63
Chapter 2 references 73
Chapter 3: In vivo activation of Src family kinases by encodable miniature proteins
3.1 Src family kinases and activating miniature protein ligands 76
3.1.1 Cellular roles of Src family kinases 76
3.1.2 Structure and regulation of Src family kinases 77
3.1.3 Miniature protein activators for Src family kinases 79
3.1.4 In vivo activation studies 81
3.2. In Vivo analysis of miniature protein activation potential for Src and
Hck Kinase 82
3.2.1 Selection of expression vector, cell lines and activation assay 83
3.2.2 Creation of an NIH-3T3 cell line stably expressing Hck kinase 84
3.2.3 In vivo activation of Hck by miniature protein ligands 85
3.2.4 Activation of Src by miniature protein ligands 87
3.2.5 Potential assay optimization strategies 89
3.3 Experimental Materials and Methods 91
3.3.1 Construction of Hck and Src expression plasmids 91
3.3.2 Construction of Activating Ligand expression plasmids 93
3.3.3 Stable transfection of NIH-3T3 cells with pCruz-09 Hck 94

VIII
3.3.4 Transient transfection and cell lysis 95
3.3.5 Direct western blot for Hck activation 96
3.3.6 Immunoprecipitation for activated Src 97
3.3.7 Analysis of Western Blots using Image J 98
Chapter 3 references 114

IX
Figures and Tables
Figure 1.1: Sequence comparison of natural and designed PP-fold proteins 29
Figure 1.2: Structures of PP-fold family of proteins 31
Figure 1.3: Views of the aPP dimer interface from the crystal structure 33
Figure 1.4: Sequences of aPP variants used in this study 34
Figure 1.5: CD wavelength scans at varying concentrations 35
Figure 1.6: Wavelength-dependent circular dichroism (CD) spectra of aPP
variants 36
Figure 1.7: Sedimentation equilibrium analysis of aPP, PYY and variants 37
Figure 1.8: Illustration of a proline shift impacting the packing interfaces of aPP
and PYY 39
Figure 1.9: Temperature-dependent CD analysis of aPPY7AP13SV14P 40
Figure 1.10: Temperature-dependent sedimentation equilibrium of aPPY7AP13SV14P 41
Table 1.1: Percent homologous primary structure among naturally occurring
PP-fold proteins 30
Table 1.2: Previously reported temperature and pH dependence of aPP
self-association constants 32
Table 1.3: Fitted Parameters from sedimentation equilibrium experiments of
aPP variants 38
Table 1.4: Fitted parameters from aPPY7AP13SV14P temperature-dependent
sedimentation equilibrium experiments 42

X
Table 1.5: Synthesized peptide sequences and mass spectrometry data 43
Figure 2.1: Overlay of Bcl-XL and Bcl-2 structures 65
Figure 2.2: Overlay of aPP on Bcl-XL • Bak complex 66
Figure 2.3: Sequence and library design for the development of miniature protein
ligands for Bcl-XL and Bcl-2 67
Figure 2.4: Selection strategy for paralog specific miniature proteins 68
Figure 2.5: Sequence alignments of Bcl-XL and Bcl-2 69
Figure 2.6: Circular dichroism of Bcl-XL variant proteins 70
Figure 2.7: Fluorescence polarization binding analysis of ligand binding to
Bcl-XL, Bcl-XL variants, and Bcl-2 71
Table 2.1: Equilibrium binding constants (nM) of ligands to Bcl-XL, Bcl-XL
variants, and Bcl-2 72
Figure 3.1: Biological roles of Src family kinases 100
Figure 3.2: Structure of Hck and Src kinase 101
Figure 3.3: Mechanism for the two modes of Src family kinase activation 102
Figure 3.4: Miniature protein ligands for SH3 domains of Src family kinases 103
Figure 3.5: Binding affinity of miniature proteins for Hck (A) and Src (B) SH3
domains 104
Figure 3.6: In vitro activation of Hck by miniature proteins 105

XI
Figure 3.7: Creation of NIH-3T3 fibroblast lines stably expressing Hck and Hck
variants 107
Figure 3.8: Western blot analysis of Hck activation by Nef and miniature
proteins 108
Figure 3.9: Quantification of Hck activity western blots 109
Figure 3.10: Immunoprecipitation and western blot analysis of Src activation 111
Figure 3.11: Activation of Src by miniature proteins 112
Table 3.1: Variants of Hck and Src used as positive and negative controls 106
Table 3.2: Average fold activation of Hck by miniature protein ligands 110
Table 3.3: Average fold activation of Src by miniature protein ligands 113

1
Introduction: Protein-based therapeutics: status and challenges
Historically, small-molecule drugs have been responsible for the greatest
advances in the drugs available to the medical field. However, over the past 30 years,
protein-based drugs have made significant strides in medical applications. (Hey, Fiedler
et al. 2005; Leader, Baca et al. 2008) Specifically, between 1980 and 2002, the average
time required for clinical development and FDA approval was more than 1 year faster for
the protein therapeutics than for the small-molecule drugs. Additionally, about 10% of
the total FDA approved drugs were protein-based (33 out of 227 total approved).
(Reichert 2003) Currently, 130 protein-based drugs have been approved by the FDA and
many more are in development. (Leader, Baca et al. 2008)
Protein therapeutics have been developed with a variety of functions including
enzymatic, specificity or targeting, regulation of pathways, vaccinations, and diagnostic.
(Leader, Baca et al. 2008) One of the well-known protein-therapeutic classes includes
proteins that supplement naturally-occuring enzymes that are dysfunctional or deficient.
These proteins can treat conditions ranging from the severe Gaucher’s disease (trade
names Cerezyme and Ceredase) (Whittington and Goa 1992) to the very common
inconvenience of lactose intolerance (Lactaid). (Rosado, Solomons et al. 1984) Other
well-known protein-based drugs include supplemental hormones (e.g. human growth
hormone, insulin, etc) and interferons to regulate the immune system. Another large
category of protein-based drugs includes antibodies that can bind with extremely high
specificity and interfere with many naturally occurring molecules and proteins involved
in disease regulation and pathogenicity. Antibodies have been developed to treat many

2
forms of cancer, immune diseases, infectious diseases, endocrine disorders and many
other disease states. (Leader, Baca et al. 2008) Increasingly, recombinant proteins are
being used in vaccines including the recently released Gardasil vaccine against the major
forms of HPV. (Shi, Sings et al. 2007) Finally, proteins are being used in both in vitro
and in vivo diagnostic tests as well as being used as imaging agents in diagnostic tests.
(Goldenberg, Abdel-Nabi et al. 2000)
Protein-based drugs lagged behind small-molecule use due to the many challenges
of developing, producing, and delivering the desired proteins. Recent advances in all of
these aspects of drug delivery has allowed for the significant growth in available protein
therapeutics. (Hey, Fiedler et al. 2005; Leader, Baca et al. 2008) The first major advance
was the introduction of recombinant proteins to replace proteins that were previously
harvested from the naturally occurring source. Insulin production using recombinant
technology was approved for human use by the FDA in 1982 and significantly increased
availability and decreased the cost required for production of protein drugs. (Goeddel,
Kleid et al. 1979) Further development of protein expressions systems outside of E. coli
expression including yeast, insect cells, mammalian cells, and recently transgenic animals
and plants have allowed for greater flexibility in the types of protein produced as well as
more control over post-translational modifications. (Mason, Warzecha et al. 2002)
Despite increases in availability at lower costs, the structure and size of protein-
based drugs makes delivery one of the most significant challenges to the industry.
Proteins are larger (sometimes much larger) than small molecule drugs and have both
hydrophobic and hydrophilic regions all of which make crossing the cell membrane
difficult. The use of appended tags the confer cell permeability has partially overcome

3
this problem, but frequently the tags are proteolyzed in the cellular environment or are
toxic to the cells at the desired dosage of the therapeutic. (Fuchs and Raines 2005; Jones,
Christison et al. 2005)
Additional challenges to the advancement of protein-based drugs include protein
solubility, stability, and immunogenicity. Foreign proteins introduced into a mammalian
cell at non-natural levels are frequently insoluble, quickly degraded, and often produce an
immune response all of which negate the intended therapeutic effects. (Leader, Baca et al.
2008) These challenges have been addressed in a number of ways, including the addition
of a large non-natural molecule attached to the protein (i.e. PEG (Manns, McHutchison et
al. 2001)) or through the use of non-natural peptidomimetics (β-peptides, peptoids, etc.)
(Bautista, Craig et al. 2007) that can adopt protein structures and features but are unable
to be degraded through normal cellular processes.
Ten years ago, the Schepartz lab initiated a research program to optimize a protein
grafting technique, which would allow for the miniaturization of a functional epitope for
biological systems. (Zondlo and Schepartz 1999; Chin and Schepartz 2001) Much of a
protein’s mass is required to pre-organize the overall fold so that the amino acids required
for the function, or the functional epitope, of the protein is presented in the proper
orientation. Protein grafting allows for the spatial display of the functional epitope to be
mimicked using an appropriate well-folded protein scaffold and strategic placement of
the experimentally determined functional epitope. (Cooper and Waters 2005; Gill and
Damle 2006; Hosse, Rothe et al. 2006) The Schepartz group has used aPP and recently
PYY as a well-folded scaffold for both α-helix and polyproline type II helix recognition
motifs.

4
Miniature proteins using the aPP and PYY scaffold have been developed for use
as inhibitors and activators both in vitro and in vivo in many important biological systems
including apoptosis and cell-signaling. (Chin and Schepartz 2001; Gemperli, Rutledge et
al. 2005; Zellefrow, Griffiths et al. 2006) Selection methods have been successfully
developed to impart high levels of specificity to miniature protein designs. Additionally,
recent work in the Schepartz lab has adapted the natural sequence of both the α-helix and
the polyproline type II helix to be cell permeable with only a few amino acid changes.
The cell-permeable scaffolds are well-folded and still have an entire face of the molecule
available for placement of a functional epitope. (Daniels and Schepartz 2007; Smith,
Daniels et al. 2008)
The utility of aPP as a scaffold for potential protein therapeutics has in the past
been limited by its tendency towards dimerization at biologically relevant concentrations.
This thesis details a protein engineering strategy to remove the dimerization elements
while maintaining the ability of aPP to scaffold the desired protein structures.
Additionally, two sets of miniature proteins developed in the Schepartz lab are used to
examine mechanisms of specificity and activity in a cellular environment.
References:
Bautista, A. D., C. J. Craig, et al. (2007). "Sophistication of foldamer form and function
in vitro and in vivo." Current Opinion in Chemical Biology 11: 685-692.Chin, J. W. and A. Schepartz (2001). "Concerted evolution of structure and function in a
miniature protein." Journal of the American Chemical Society 123(12): 2929-2930.
Chin, J. W. and A. Schepartz (2001). "Design and evolution of a miniature bcl-2 binding
protein." Angewandte Chemie-International Edition 40(20): 3806-+.

5
Cooper, W. J. and M. L. Waters (2005). "Molecular recognition with designed peptides
and proteins." Current Opinion in Chemical Biology 9(6): 627-631.Daniels, D. S. and A. Schepartz (2007). "Intrinsically cell-permeable miniature proteins
based on a minimal cationic PPII motif." Journal of the American ChemicalSociety 129(47): 14578-+.
Fuchs, S. M. and R. T. Raines (2005). "Polyarginine as a multifunctional fusion tag."
Protein Science 14(6): 1538-1544.Gemperli, A. C., S. E. Rutledge, et al. (2005). "Paralog-selective ligands for Bcl-2
proteins." Journal of the American Chemical Society 127(6): 1596-1597.Gill, D. S. and N. K. Damle (2006). "Biopharmaceutical drug discovery using novel
protein scaffolds." Current Opinion in Biotechnology 17(6): 653-658.
Goeddel, D. V., D. G. Kleid, et al. (1979). "Expression in Escherichia-Coli of ChemicallySynthesized Genes for Human Insulin." Proceedings of the National Academy of
Sciences of the United States of America 76(1): 106-110.
Goldenberg, D. M., H. Abdel-Nabi, et al. (2000). "Carcinoembryonic antigenimmunoscintigraphy complements mammography in the diagnosis of breast
carcinoma." Cancer 89(1): 104-115.Hey, T., E. Fiedler, et al. (2005). "Artificial, non-antibody binding proteins for
pharmaceutical and industrial applications." Trends in Biotechnology 23(10):
514-522.Hosse, R. J., A. Rothe, et al. (2006). "A new generation of protein display scaffolds for
molecular recognition." Protein Science 15(1): 14-27.Jones, S. W., R. Christison, et al. (2005). "Characterisation of cell-penetrating peptide-
mediated peptide delivery." British Journal of Pharmacology 145(8): 1093-1102.
Leader, B., Q. J. Baca, et al. (2008). "Protein therapeutics: A summary andpharmacological classification." Nature Reviews Drug Discovery 7: 21-39.
Manns, M. P., J. G. McHutchison, et al. (2001). "Peginterferon alfa-2b plus ribavirincompared with interferon alfa-2b plus ribavirin for initial treatment of chronic
hepatitis C: a randomised trial." Lancet 358(9286): 958-965.

6
Mason, H. S., H. Warzecha, et al. (2002). "Edible plant vaccines: applications for
prophylactic and therapeutic molecular medicine." Trends in Molecular Medicine8(7): 324-329.
Reichert, J. M. (2003). "Trends in development and approval times for new therapeuticsin the United States." Nature Reviews Drug Discovery 2(9): 695-702.
Rosado, J. L., N. W. Solomons, et al. (1984). "Enzyme Replacement Therapy for Primary
Adult Lactase Deficiency - Effective Reduction of Lactose-Malabsorption andMilk Intolerance by Direct Addition of Beta-Galactosidase to Milk at Mealtime."
Gastroenterology 87(5): 1072-1082.Shi, L., H. L. Sings, et al. (2007). "GARDASIL (R): Prophylactic human papillomavirus
vaccine development - From bench top to bed-side." Clinical Pharmacology &
Therapeutics 81(2): 259-264.Smith, B. A., D. S. Daniels, et al. (2008). "Minimally cationic cell-permeable miniature
proteins via alpha-helical arginine display." Journal of the American Chemical
Society 130(10): 2948-2949.Whittington, R. and K. L. Goa (1992). "Alglucerase - a Review of Its Therapeutic Use in
Gauchers-Disease." Drugs 44(1): 72-93.Zellefrow, C. D., J. S. Griffiths, et al. (2006). "Encodable activators of Src family
kinases." Journal of the American Chemical Society 128(51): 16506-16507.
Zondlo, N. J. and A. Schepartz (1999). "Highly specific DNA recognition by a designedminiature protein." Journal of the American Chemical Society 121(29): 6938-
6939.

7
Chapter 1: Engineering a monomeric, well-folded miniature protein scaffold
1.1 The PP fold family of proteins as protein scaffolds
Avian pancreatic polypeptide (aPP) and other related family members
have been used with great success as protein scaffolds. Like other protein scaffolds, aPP
is well-folded, thermally stable, tolerant of moderate changes in primary structure, and
displays two structural motifs observed in many biological interactions. Recently, other
members of the PP-fold family of proteins including bovine pancreatic polypeptide (bPP)
and peptide YY (PYY) have been used as protein scaffolds as well.
1.1.1 Members of the PP family of proteins
The PP-fold family of proteins are small (36 amino acid) N-terminally amidated
proteins with a relatively-high occurrence of proline and tyrosine residues (Figure 1.1.)
These proteins are naturally occurring in many species and are primarily involved in the
hormonal regulation of appetite and digestion. (Zerbe, Neumoin et al. 2006) These
proteins first gained attention as the smallest known protein with a well-defined, stable
tertiary structure with no disulfide bonds present to stabilize the structure. Since that
time the entire family of proteins have been studied as simple models for understanding
the dynamics of protein folding and for their utility as protein scaffolds.
The key members of this family of proteins fall into three distinct groups when
primary amino acid sequences are compared (Table 1.1.) (Glover, Barlow et al. 1984)
Alligator, turkey, and goose PP share only ~50% sequence identity with their mammalian
counterparts (bovine, ovine, porcine, and human PP) but are >70% identical with each
other. Additionally, PYY and neuropeptide Y (NPY) only share about ~50% sequence
8
identity with all of the PP homologues, while having ~70% identity with each other.
Despite these observations of similarities and differences from the primary structures,
many PP homologues and PYY appear to have similar tertiary structure, while NPY does
not maintain the same tertiary structure. Additional differences are observed when
quaternary structure is considered. Insights into the rules for tertiary and quaternary
structure in this family of protein will be guided by the primary sequence similarities and
differences.
1.1.2 Structures of PP-fold family proteins
The first structure determined for the PP-fold family of proteins was a crystal
structure of the aPP dimer. The 36 amino acid peptide was crystallized and the structure
was resolved at 1.4 (Blundell, Pitts et al. 1981) and subsequently 0.98 Å (Glover, Haneef
et al. 1983) by Blundell and co-workers (Figure 1.2A). The crystal structure revealed an
N-terminal polyproline type II helix connected by a β-turn to an α-helix The α-helix
appears backfolded onto the polyproline helix in an approximately anti-parallel
orientation. The stability of the peptide originates from a hydrophobic core that forms
when the α-helix folds back upon the polyproline helix. Specifically, the three prolines
on the N-terminal region interdigitate and form Van der Walls contacts with hydrophobic
residues on the α-helix face. (Blundell, Pitts et al. 1981) The crystal structure also
revealed aPP existing as a parallel dimer with this interaction also being governed by
hydrophobic patches on the surface of the molecules (Figure 1.3).
The solution structure of bPP, a mammalian homologue of aPP, was determined
by NMR in 1992 (Li, Sutcliffe et al. 1992) and confirmed in 2002 (Lerch, Gafner et al.
2002) (Figure 1.2B). Both structures confirmed a highly similar overall tertiary structure

9
for aPP and bPP despite limited sequence identity. Specifically, the C-terminal α-helix
and the backfolded overall structure with a hydrophobic core are quite similar to the aPP
scaffold. The N-terminal region of bPP shows similar overall structure to aPP though
residues 1-3 are rather flexible in the lowest energy NMR structures. Definitive evidence
for the formation of a dimer structure by bPP was not determined in either of the NMR
studies, however, Li et. al. detected unassigned NOEs in the potential dimerization region
(Li, Sutcliffe et al. 1992) and Lerch et. al. showed side chains in bPP near the potential
dimerization interface to be oriented in a similar way to those side chains in the aPP
dimer structure. (Lerch, Gafner et al. 2002) The structures of other mammalian PP
homologues have been less well-studied, but circular dichroism results (a strong minima
at 208 and 222) indicate that human PP (Griko and Kapanadze 1995) and ox PP (Glover,
Barlow et al. 1984) likely also maintain the characteristic PP back fold.
Another member of the PP-fold family of proteins that is both well-folded and
monomeric in the µM range is PYY. The NMR structures of PYY (Keire, Kobayashi et
al. 2000; Lerch, Mayrhofer et al. 2004; Nygaard, Nielbo et al. 2006) indicate that it
maintains the same overall backfolded tertiary structure with a type II polyproline helix
connected to an α-helix (Figure 1.2D). Minor differences between the structure of aPP
and PYY are observed approximately halfway through the α-helix. Different methods
have varied in the extent and exact location of the helix interruption (Keire, Kobayashi et
al. 2000), but it is clear that there is a discontinuous element in the α-helix around residue
25 resulting in the overall helix bending around the N-terminal polyproline helix in a way
not observed for aPP. (Lerch, Mayrhofer et al. 2004) The NMR studies show NOEs
between the two helices indicating the presence of a stable hydrophobic core (Nygaard,

10
Nielbo et al. 2006), but no NOEs were found indicating the presence of a dimer even at
NMR concentrations of 2mM (Lerch, Mayrhofer et al. 2004). Subsequent analytical
ultracentrifugation studies confirmed a 22 mM Kd. (Keire, Mannon et al. 2000)
The final known member of the PP-fold family of proteins is NPY. Unlike the
other members of the family, the solution structure of human NPY remains a highly
studied and controversial topic. (Bader, Bettio et al. 2001) NMR data has been used to
propose a full back-folded structure similar to aPP (Darbon, Bernassau et al. 1992; Khiat,
Labelle et al. 1998), while others have used NMR to observe a dimer structure in which
the monomers are not back-folded but instead associate at the α-helix faces with the N-
termini free in solution (Figure 1.2C). (Cowley, Hoflack et al. 1992; Monks, Karagianis
et al. 1996) An additional study using CD and NMR proposes a model in which at low
concentrations the protein exists as a back-folded monomer, but as the concentration
increases, the protein associates and unfolds. (Nordmann, Blommers et al. 1999)
Additional biophysical studies have provided insight into the role of key residues
conserved in the PP-fold family of proteins. Nordmann et. al. showed using
photochemically induced nuclear polarization experiments that Y21 is inaccessible to
solvent at a 2 mM concentration of NPY (Nordmann, Blommers et al. 1999), likely
indicating an extended conformation of oligomerized protein. An alanine scan of hNPY
indicated that the proline at position 13 when mutated to alanine increased helicity of the
protein by 100%. (Becksickinger, Wieland et al. 1994) While proline replacement with
alanine is expected to increase overall helicity, similar changes at positions 2, 5, and 8
showed ~50% increase in helicity over wild type NPY indicating that the proline residue
at position 13 may be further inhibiting overall stability of the protein fold.

11
1.1.3 Characterizations of the self-association of aPP
Further biophysical evaluations of aPP showed the dimerization to be both
temperature and pH dependent. Kimmel and co-workers showed through small-zone
analytical molecular sieve chromatography and analytical ultracentrifugation velocity
experiments that the Stoke’s radius (a measure of the hydrodynamic radius of a molecule)
decreased when the pH used for the measurements was changed from 8.0 to 4.0.
(Noelken, Chang et al. 1980) Additionally, analytical ultracentrifugation sedimentation
equilibrium experiments at pH 8.0 gave an apparent molecular weight of 8372 as
compared to the monomer molecular weight of 4238. Sedimentation experiments did not
reach equilibrium at pH 4.0 so molecular weight was not determined under these
conditions. (Noelken, Chang et al. 1980) Finally, Kimmel and co-workers showed that
aPP has similar characteristic CD signature at both pH 8.0 and 4.0 indicating a well-
folded protein. (Noelken, Chang et al. 1980) In a separate study, Kimmel et. al. calculated
dimerization constants (equilibrium constants for association) for aPP using molecular
sieve chromatography at various pH and temperature conditions (Table 1.2). (Chang,
Noelken et al. 1980) The concentration at which half of a solution of aPP is monomeric
varies from 300 pM to 5 µM and using the trends predicted by Kimmel’s data, aPP at pH
8.0 and 298 K has an approximate equilibrium dissociation constant (Kd) of 3 nM (Table
1.2).
The crystal structure of the aPP dimer allows for speculation regarding the driving
force of this dimerization interaction. Specifically, it is clear that the hydrophobic
dimerization face is focused around the aromatic residues Tyr7, Phe20, and Tyr21
(Figure 1.3). These aromatics form a tightly packed core with other nearby small
12
hydrophobic residues potentially contributing to the overall dimer stability. (Blundell,
Pitts et al. 1981) The Tyr7 residues form the most obvious intermolecular interaction with
the two aromatic rings of two Y7 residues stacking on each other. The tyrosine at
position 7 also interacts intramolecularly with the respective phenylalanine at position 20
through an edge-face interaction. This observed interaction between aromatic residues at
positions 7 and 20 is validated in the structurally similar bovine pancreatic polypeptide
(bPP) through NOEs in the published NMR solution structure. Finally, the tyrosines at
position 21 appear to also interact intermolecularly through hydrophobic stacking and
contribute to the stability of the aPP dimer.
1.1.4: Other relevant structural studies of PP family proteins
Additional biophysical studies have provided clues into the residues responsible
for both the dimerization and the stable fold of aPP. In an early study of the aPP
conformation and relative reactivity of various side chains, Taylor et. al. attempted to use
radiolabeled iodine to label the available tyrosines. Under conditions in which aPP exists
primarily as a monomer (pH 4) Y7 has the highest level of iodine incorporation (Taylor
and Kimmel 1987) indicating it is available to solution and not involved in other fold
stabilization interactions. However, at pH 7 when aPP is expected to be primarily in the
dimer form, Y21 incorporates more of the radiolabeled iodine (Taylor and Kimmel 1987)
indicating that despite its apparent involvement in the dimerization interface, it is still
solvent accessible and reactive towards nucleophilic attack.
Further indication of the residues primarily responsible for dimerization were
given in a study in 1990 by Minikata and co-workers. (Minakata and Iwashita 1990) By
simply replacing the first 7 residues of PYY with the corresponding residues in aPP, the

13
chimera showed grerater α-helicity than either aPP or PYY alone. (Minakata and
Iwashita 1990) The further stabilization of the PYY helical fold may be a result of an
increased tendency towards dimerization by gaining a tyrosine at position 7.
Just prior to the work presented in this study being published, another study came
out of the Zerbe group regarding the destabilization of the monomeric well-folded
structure of PYY. (Neumoin, Mares et al. 2007) Specifically, this group found that
replacement of alanine 7 in PYY with a tyrosine did increase the self-affinity of the
protein. Additionally, they found that shifting the proline found at residue 14 to position
13 significantly destabilized the over all fold of the molecule. Finally, through further
substitution at position 13 they found that a residue capable of hydrogen bonding (serine,
threonine, etc.) is required to maintain the well-folded structure of PYY. (Neumoin,
Mares et al. 2007) These results further confirm the rules presented in this study for the
stabilization of aPP.
1.1.5 PP-family proteins as protein scaffolds
The aPP scaffold has been successfully used to develop miniature proteins which
bind DNA (Zondlo and Schepartz 1999; Chin and Schepartz 2001; Montclare and
Schepartz 2003; Yang and Schepartz 2005) and proteins (Chin and Schepartz 2001;
Rutledge, Volkman et al. 2003; Cobos, Pisabarro et al. 2004; Golemi-Kotra, Mahaffy et
al. 2004; Shimba, Nomura et al. 2004; Gemperli, Rutledge et al. 2005; Schneider,
Mathew et al. 2005; Volkman, Rutledge et al. 2005; Kritzer, Zutshi et al. 2006,
Holtzman, 2007 #135; Zellefrow, Griffiths et al. 2006) and inhibit their interactions with
high affinity and specificity - both in vitro (Zondlo and Schepartz 1999; Chin and
Schepartz 2001; Chin and Schepartz 2001; Montclare and Schepartz 2003; Rutledge,

14
Volkman et al. 2003; Cobos, Pisabarro et al. 2004; Shimba, Nomura et al. 2004;
Gemperli, Rutledge et al. 2005; Schneider, Mathew et al. 2005; Yang and Schepartz
2005; Kritzer, Zutshi et al. 2006; Zellefrow, Griffiths et al. 2006; Holtzman, Woronowicz
et al. 2007) and in mammalian cells and extracts. (Golemi-Kotra, Mahaffy et al. 2004;
Volkman, Rutledge et al. 2005) Additionally, aPP has been used as a biophysical tool for
studying protein folding dynamics in two different contexts. First, aPP was converted
into a photoactivated switch between a well-folded protein to an unfolded protein. (Jurt,
Aemissegger et al. 2006) Additionally, Gellman and co-workers modified bPP to contain
a modified amino acid capable of dissociating into two unique peptide species. The
energetics involved in the association and folding of the two individual pieces can be
measured and compared to previously published data regarding the folding dynamics of
this small protein. (Woll and Gellman 2004)
Recently miniature proteins have been engineered to be cell permeable on either
face of the protein without extending the length of the protein and maintaining the overall
fold. (Daniels and Schepartz 2007; Smith, Daniels et al. 2008) Specifically, select
residues have been changed to arginine within either the polyproline or the alpha helix
face, leaving the alternate side available for epitope grafting. This advance in the overall
protein scaffold overcomes another challenge towards using aPP based miniature proteins
as protein-based drugs.
However, the utility of many miniature proteins has been hindered by the innate
tendency of aPP and bPP based molecules to dimerize. Structural circular dichroism
studies of reported miniature proteins indicate that few maintain the high level of helicity
and melting temperature as that of aPP. Additionally, among the miniature proteins

15
analyzed for dimerization at biologically relevant concentrations some were found to be
monomeric, while others were dimeric, higher-order multimers or larger, nonspecific
aggregates in solution (Figure 1.1). The problems resulting from the tendency of
miniature proteins to self-associate is exemplified in PPBH3-1 which was shown to have
a large apparent molecular weight (>37,000 Da or approximately 9x the monomer
molecular weight) and formed insoluble aggregates under many aqueous conditions. Due
to the poor solution behavior of this molecule, attempts to reproduce previous data, to
carry out an alanine mutagenesis scan, and to perform experiments in mammalian cells
were all complicated and ultimately unsuccessful.
1.2: Design and Characterization of a monomeric, folded aPP-based scaffold
Miniature proteins based on the aPP scaffold have proven to be useful tools for
studying biological systems both in vitro and in vivo. However, the natural tendency for
the aPP scaffold to self-associate often complicates development of appropriate
experimental conditions and data interpretation. In a continuing effort to develop an
optimal scaffold for protein display, experiments were carried out to isolate and remove
the elements primarily responsible for the dimerization of aPP. Additionally, further
engineering of the now monomeric aPP scaffold was required to restabilize the fold of the
protein.
1.2.1 Sequence analysis of natural and designed PP-fold proteins
The homologous proteins aPP and PYY present different solution properties with
aPP being well-folded but largely dimeric at µM concentrations while PYY is also well-
folded but mostly monomeric at µM concentrations. The primary sequences of these two
proteins are only 50% homologous, so isolating the residues responsible for the

16
dimerization of aPP using only these two sequences is difficult. Therefore, the sequences
from all naturally occurring proteins from the PP fold family as well as all sequences
from PP-family based miniature proteins were aligned and analyzed (Figure 1.1).
Based on the information gained from visual inspection of the aPP dimer structure
(Blundell, Pitts et al. 1981), tyrosine7 (Y7), phenylalanine 20 (F20), and tyrosine 21
(Y21) were the first residues examined for potential contribution to dimerization. Of
those proteins known to be monomeric in the µM range (NPY, PYY, pGolemi, and
p007), all contain a non-tyrosine residue at position 7 in contrast to those proteins, which
do tend to self-associate. The identities of the side chains at positions 20 and 21,
however, do not correlate with self-association; most miniature proteins (including
pGolemi) contain phenylalanine at position 20, and the residue at position 21 varies
widely across the PP family.
An additional interesting difference noted in the sequences of the naturally
occurring proteins is the location of the fourth proline. In bPP and PYY -- both well-
folded proteins -- it is in position 14. However, in NPY and aPP – both not back-folded
as monomers – the proline is in position 13. Based on the integral role the prolines play
in the overall fold of this family of proteins this was also considered in future
experiments.
1.2.2 Analysis of potential dimerization residues in aPP
Single-site variants of aPP were synthesized (sequences in Figure 1.4) with an N-
terminal amide cap and a free C-terminus, purified by HPLC, and then analyzed with
circular dichroism (CD) and analytical ultracentrifugation (AU) sedimentation
equilibrium experiments. Those residues potentially responsible for dimerization based

17
on the crystal structure of the dimerization interface (Y7, F20, and Y21) were all
individually changed to alanine and compared to aPP and PYY.
The CD signatures of the well-folded aPP and PYY are quite distinct and provide
a quick and accurate diagnostic to test the overall structure of aPP variants (Figure 1.6.)
Additionally, performing CD experiments at various concentrations can provide an initial
insight into the self-association behavior of the peptides. Specifically, aPP shows a
greater change in CD signal intensity at 208 and 222 nm than PYY (Figure 1.5A and
1.5B) indicating that in that concentration range, it is likely undergoing a change in
oligomerization state while the signal for PYY remains fairly constant across the 1-100
µM range.
The single site variants aPPY7A and aPPF20A both showed significant concentration
dependant signals by CD. Not only did the magnitude of the intensity at 208 and 222
change, the minima also shifted from 208 nm at high concentrations towards 205 nm at
lower concentrations (Figure 1.5C and 1.5D). The CD signal of both of these peptides at
low concentrations is indicative of an unfolded or random coil protein. Conversely,
aPPY21A shows less concentration dependence than aPP and also shows a strong minima at
208 and 222 nm indicating a well-folded protein with no change in oligomerization in the
dynamic range measured (Figure 1.5E).
Analytical ultracentrifugation sedimentation equilibrium experiments were carried
out at three concentrations and three speeds for each individual peptide. The equilibrium
data was fit using non-linear fitting software, Heteroanalysis (Figure 1.7.) aPPY7A and
aPPF20A both assemble into tetramers, with Kd values of 3.9 × 10⁻¹² M3 and 7.6 × 10⁻¹¹ M3,
respectively (Table 1.3). Self-association of aPPY7A and aPPF20A occurs only at high

18
concentration, however, at 30 µM more than 97% of the molecules remain monomeric.
By contrast, aPP, with Kd = 4.1 × 10⁻⁶ M, exists predominantly (>94%) in the dimer state
at 30 µM. By contrast, aPPY21A formed a modestly more stable dimer (Figure 1.7) than
did aPP, as judged by analytical ultracentrifugation (Kd = 1.3 × 10⁻⁶ M, Table 1.3).
These data suggest that Y7 and F20 of aPP contribute to both dimer stability and
maintenance of the characteristic aPP fold. (Woll and Gellman 2004) Y21, although
positioned at the dimer interface in the x-ray structure, contributes modestly to dimer
stability. The importance of Y7 and F20 to dimerization can only be further exploited
though if the alanine variant can be restabilized to maintain the signature PP back-fold.
1.2.3: Attempts to refold aPPY7A by helix-dipole stabilization
In an attempt to re-stabilize the PP back-fold in aPPY7A we explored the ability of
helix-dipole stabilization to gain the energy required for refolding. Bjornholm et al.
observed that PYY possesses a stronger dipole moment (449 D) and a larger electrostatic
stabilization energy (-10 kcal•mol-1) than does aPP (430 D and –7 kcal•mol-1,
respectively). (Bjornholm, Jorgensen et al. 1993) Specifically the primary sequences of
these two proteins indicated two significant amino acid differences that might contribute
to the overall electrostatic stabilization of the helix. In aPP, threonine 6 and glutamine 25
have different charge potentials than PYY’s glutamic acid 6 and arginine 25. (Bjornholm,
Jorgensen et al. 1993) By replacing the aPP residues with the PYY counterparts, the C-
terminus of the α-helix will contain an additional positively charged residue and the N-
terminus of the helix will be in a more negatively charged environment with the addition
of a glutamate near the turn region.

19
Sedimentation equilibrium experiments showed that neither aPPY7AT6E nor
aPPY7A,Q25R was appreciably monomeric at 30 µM, with 45% and 46% of the solution
forming tetramers respectively (Figure 1.7 and Table 1.3). The CD spectra of both
molecules show minima at 208 and 222 nm (Figure 1.6) that are likely due to the large
fraction of molecules assembled into well-folded tetramers at this concentration. These
results indicate that macrodipole stabilization alone is insufficient to refold aPPY7A and
may even further stabilize the association interface.
1.2.4: Introduction of a “proline switch” in aPPY7A
The other significant difference in the primary sequences of the PP-fold family of
proteins lies in the position of the fourth proline. The first three proline residues in each
of the naturally occurring family members are completely conserved in both identity and
location. The crystal structure of aPP show that these proline residues interdigitate with
the tyrosine and phenylalanine residues from the α-helix to form the compact
hydrophobic core that provides most of the folding energy for the PP-fold family of
proteins. Given the importance of these prolines in the overall fold of these proteins, the
variance of location of the fourth proline in either position 13 (aPP, NPY) or position 14
(bPP, PYY) was explored for insights into the different solution properties of these
proteins.
By simply examining the known structures of aPP and PYY intial observations
were made regarding the impact of this proline shift. Proline is a well-established helix
breaker (Scholtz and Baldwin 1992) and in the structures of aPP and PYY it appears to
act as an α-helix cap. The shift of this proline from position 14 in PYY to position 13 in
aPP means that the α-helix is essentially 1/3 of a turn longer than the α-helix in PYY.

20
Though a longer helix could potentially be more stable, in this instance, it also shifts the
register of the helix in its overall orientation relative to the polyproline helix. As best
observed in Figure 1.8, the hydrophobic packing face of the α-helix is on different sides
of the polyproline helix in aPP and PYY potentially leading to a more energetically
favorable packing surface in PYY than in aPP. It is important to note that at the time we
were preparing to publish the following findings, Zerbe and coworkers reported that
altering the residues at positions 13 and 14 in PYY dramatically destabilizes the PP-fold.
(Neumoin, Mares et al. 2007)
To determine whether this “proline switch” could improve the folding of poorly
folded but monomeric aPP variants, we synthesized two variants of aPPY7A containing the
sequences VP and SP at positions 13 and 14, in place of the natural PV sequence. It was
not known if the residue next to the proline would prove to be important, so both the
naturally occurring aPP residue was retained in aPPY7A,P13V,V14P and the PYY residue was
substituted in aPPY7AP13SV14P. The sequence containing the naturally-occuring aPP
sequence with simply positions 13 and 14 switch (aPPY7A,P13V,V14P) remained
predominantly monomeric (90%) at 30 µM concentration (Table 1.3) and lacked a well-
defined conformation, as judged by CD (Figure 1.6), indicating that simply changing the
location of the proline is not significant enough to refold a monomeric version of aPP.
Surprisingly however, aPPY7AP13SV14P, displayed significant minima at both 208
(12,400 deg•cm2•dmol-1) and 222 nm (9,700 deg•cm2•dmol-1) (Figure 1.6). Temperature-
dependent CD studies revealed that, like PYY, aPPY7A,P13S,V14P underwent a cooperative
unfolding transition. The thermal melt of aPPY7A,P13S,V14P gave a Tm of 20 °C (Figure 1.9)
which is significantly lower than the melting temperature of wild type aPP or PYY.

21
In order to account for the low melting temperature of this variant, we conducted
the AU experiments at temperatures from 5 °C to 30 °C (5 °C increments) to fully
characterize how the extent of self-association varies with temperature and percent folded
molecules in solution. At 5°C, the molecules in solution should be primarily folded
based on the CD data (Figure 1.9), and by AU the proteins fits to an n of 2.54 (Figure
1.10 and Table 1.4). At 30°C, over half of the molecules in solution will be unfolded and
by AU the protein fit to an n of 3.6. Based on previous AU results with the unfolded
aPPY7A associating as a tetramer at higher concentrations, it is not surprising that as
aPPY7AP13SV14P is folded it associates as a dimer, but as the molecule unfolds, it begins to
associate as tetramers. Therefore, a monomer:dimer:tetramer fitting model was used to
most accurately characterize the solution. At 25 °C, the data for aPPY7A,P13S,V14P fits to a
monomer/dimer/tetramer model with KD values of 5.3 × 10⁻⁴ M and 6.8 × 10⁻¹² M3
respectively, which corresponds to 90% monomer, 9% dimer, and 1% tetramer at 30 µM
(Figure 1.10 and Table 1.4.) Slight irregularities in the residual plots (Figure 1.10) are
minimal compared to residuals obtained using other potential fit models, however, the
trends do indicate that the data do not fit perfectly to an ideal monomer-dimer-tetramer
model under these conditions. These trends in the residuals could be a result of the
peptide having a higher order oligomer also present in low quantities in solution that were
not included in the model, or the calculated for use in the fit may not be ideal for the
varying aPP conformers present in solution at these temperatures (a fraction folded and a
fraction unfolded).

22
1.2.5: Final Conclusions Regarding Dimerization and Fold of aPP
The highly stable and compact structure resulting from the relatively small
number of amino acids present in aPP have provided scientists with great opportunities to
learn more about the process and rules required for protein folding. (Derreumaux 1998;
Palermo, Csontos et al. 2007; Palermo, Csontos et al. 2008) Early studies confirmed that
the primary contributor to the PP back-fold was the highly hydrophobic core of
interdigitating proline and tyrosine residues from the polyproline and α-helices
respectively. However, this assessment could not explain the differences observed in the
solution behavior of other members of the PP family proteins including the poorly folded
NPY and the non self-associating PYY. This study in concert with the study from
Neumoin et. al have isolated two other areas of these molecules that govern the tertiary
and quaternary folds. (Hodges and Schepartz 2007; Neumoin, Mares et al. 2007)
Specifically, the presence of aromatics at position 7 and 20 are the primary contributors
to dimerization and upon removal lead to a molecule that is monomeric well into the µM
range. Additionally, the presence of proline (Hodges and Schepartz 2007) or any other
residue incapable of hydrogen bonding (Neumoin, Mares et al. 2007) at position 13
destabilize the tertiary back-fold and subsequently the stability of the α-helix. By
shifting the proline to position 14 and placing a serine at position 13, the tertiary fold of
aPP can be recovered. (Hodges and Schepartz 2007) These discoveries further illustrate
that the global rules currently adopted for protein folding can provide a significant clue to
expected protein structure, but more subtle factors that vary for each protein are likely
responsible for the more refined elements of protein folding.
1.3: Experimental Materials and Methods

23
Much of the following text has been directly reprinted from Hodges, A.M.;
Schepartz, A. Journal of the American Chemical Society 2007, 129, 11024-11025.
Avian pancreatic polypeptide (aPP) was purchased from American Peptide
Company Inc. (cat #46-8-25) as a purified lyophilized powder. All other peptides were
synthesized on a Symphony® multi-channel solid phase synthesizer (Protein
Technologies, Inc., Tucson, AZ) using Fmoc-protected amino acid monomers and
NovaSyn TGR resin (cat. 01-64-0060) from Novabiochem (San Diego, CA). N,N-
Dimethylformamide, N-methyl morpholine, piperidine, and trifluoroacetic acid were
purchased from American Bioanalytical (Natick, MA). Mass spectra were acquired with
an Applied Biosystems Voyager-DE-Pro matrix-assisted laser desorption/ionization time-
of-flight (MALDI-TOF) mass spectrometer (Foster City, CA). Reverse-phase HPLC was
performed using a Rainin Dynamax HPLC with a Vydac analytical C8 column (300 Å
silica, 5 µM particle size, 4.6 mm 150 mm) and a Grace Vydac C8 preparative scale
column (300 Å silica, 5 µM particle size, 22 mm 150 mm), and water/acetonitrile
gradients containing 0.1% TFA. Circular dichroism (CD) spectra were acquired with a
Jasco J-810 Spectropolarimeter (Jasco, Tokyo, Japan) equipped with a Peltier
temperature control module. Analytical ultracentrifugation experiments were performed
using a Beckman Coulter Proteome Lab XL-I Protein Characterization System equipped
with an AN 60-Ti 4-hole rotor and six-channel carbon-epoxy composite centerpieces
(Beckman, Fullerton, CA).
1.3.1 Peptide synthesis and purification.
All peptides were synthesized using standard solid-phase Fmoc chemistry (25
µmol scale) on an automated peptide synthesizer and contained a free amine at the N-

24
terminus and a carboxamide at the C-terminus. Crude peptides were purified by reverse
phase HPLC and identified by MALDI-TOF mass spectrometry. MALDI mass spectra
were obtained using a 1:1 ratio of peptide to α-cyano-4-hydroxycinnaminic acid matrix
(Table 1.5). Peptide purity was verified by reinjection of a small aliquot of the purified
sample on an analytical C8 column. Following purification, the peptide was lyophilized,
resuspended in water, and dialyzed against Millipore water to remove residual TFA salts
using Floatalyzers® (Spectrum Labs, cat #235026) with a 500 Da MWCO. Peptide
solutions were then divided into aliquots and stored at –20 °C.
1.3.2 Circular dichroism
Wavelength-dependent circular dichroism
CD spectra of each peptide (30 µM) were acquired in Tris buffer (25 mM Tris
base, 50 mM NaCl, (pH 8.0)) at 25 °C in a 2 mm cell. Samples were scanned between
200 and 260 nm, with signal sampling every 0.5 nm, and three successive scans were
averaged. Molar residue ellipticity values were calculated from the equation MRE =
(Θsample - Θbuffer)/(L × c × n × 1000), where Θ is the observed signal in millidegrees, L is
the length of the cuvette in cm, c is the concentration of peptide in dmol•cm-3 and n is the
number of amino acids in the molecule.
Temperature-dependent circular dichroism
Temperature-dependent CD spectra of aPPY7AP13SV14P (30 µM) were acquired in
Dulbecco’s PBS (1 mM KH2PO4, 155 mM NaCl, 3 mM Na2HPO4, (pH 7.4)) in a 2 mm
cell. The signal at 222 nm (MRE222) was monitored between 1 °C and 80 °C using the
variable temperature module provided with the instrument. Data were collected with a
0.5 °C data pitch, 5 s delay time, 20 °C/hour temperature slope, 4 s response, and 1 nm

25
bandwidth. CD spectra were obtained as the temperature was raised and when the
temperature was lowered to establish the reversibility of the folding transition.
Additionally, a full wavelength scan was obtained before and after the thermal melt; an
overlay of the two spectra is shown in Figure 1.9. Mean residue ellipticity values for the
temperature dependent CD spectrum were calculated from the equation MRE = Θ222 nm /
(L × c × n × 1000), where Θ is observed signal at 222 nm (mdeg), L is the length of the
cuvette (cm), c is the concentration of peptide (dmol/cm3) and n is the number of amino
acids in the molecule. The first derivatives of the temperature-dependent CD spectra are
shown in Figure 1.9C. The Tm value reported in the main text corresponds to the
temperature at which ∂MRE222/∂T is a maximum.
1.3.3 Sedimentation Equilibrium
Analytical ultracentrifugation experiments were performed using peptide
solutions prepared in Tris•Cl buffer (25 mM Tris base, 50 mM NaCl, (pH 8.0)) at the
appropriate concentrations (5 µM - 200 µM). Samples were then centrifuged to
equilibrium at 25 °C at 42,000, 50,000, and 60,000 rpm. Data were collected with a
0.001 cm step size and successive scans were initiated at 2 h intervals. Samples were
judged to have reached equilibrium when the radial concentration gradient remained
unchanged over three successive scans using the Match module of Heteroanalysis
software v1.1.19. The solvent density (ρ) and partial specific volume ( ) were calculated
using the Sedimentation Interpretation Program “Sednterp” software v1.08.
The data for each peptide (multiple concentrations at three speeds) was first fit
globally to an equation describing the sedimentation of an ideal species of molecular
weight Mn (equation 1) using Heteroanalysis software v1.1.19:
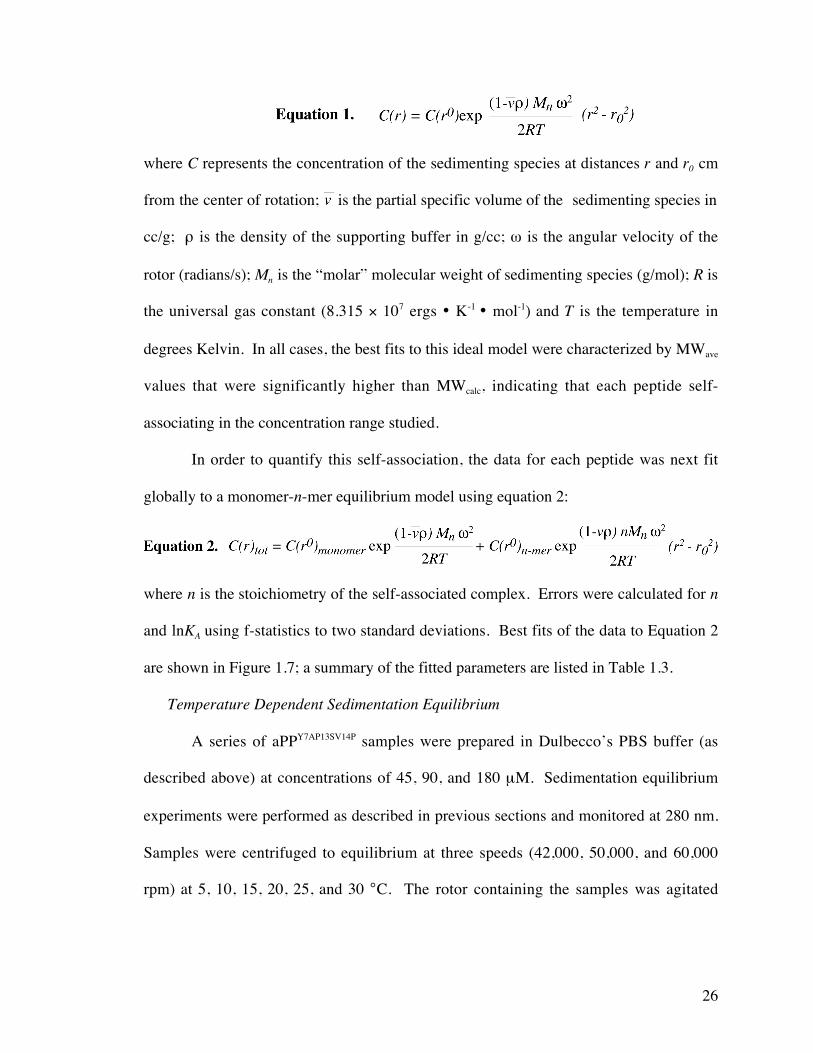
26
where C represents the concentration of the sedimenting species at distances r and r0 cm
from the center of rotation; is the partial specific volume of the sedimenting species in
cc/g; ρ is the density of the supporting buffer in g/cc; ω is the angular velocity of the
rotor (radians/s); Mn is the “molar” molecular weight of sedimenting species (g/mol); R is
the universal gas constant (8.315 × 10⁷ ergs • K-1 • mol-1) and T is the temperature in
degrees Kelvin. In all cases, the best fits to this ideal model were characterized by MWave
values that were significantly higher than MWcalc, indicating that each peptide self-
associating in the concentration range studied.
In order to quantify this self-association, the data for each peptide was next fit
globally to a monomer-n-mer equilibrium model using equation 2:
where n is the stoichiometry of the self-associated complex. Errors were calculated for n
and lnKA using f-statistics to two standard deviations. Best fits of the data to Equation 2
are shown in Figure 1.7; a summary of the fitted parameters are listed in Table 1.3.
Temperature Dependent Sedimentation Equilibrium
A series of aPPY7AP13SV14P samples were prepared in Dulbecco’s PBS buffer (as
described above) at concentrations of 45, 90, and 180 µM. Sedimentation equilibrium
experiments were performed as described in previous sections and monitored at 280 nm.
Samples were centrifuged to equilibrium at three speeds (42,000, 50,000, and 60,000
rpm) at 5, 10, 15, 20, 25, and 30 °C. The rotor containing the samples was agitated

27
manually between temperature runs to redistribute the sample along the length of the cell
and checked by an initial scan.
The sedimentation data obtained for aPPY7AP13SV14P at each temperature was
globally fit to Equation 2 as described above. Not surprisingly, n varied with
temperature, increasing from 2.5 at 5 °C to 3.6 at 30 °C. Therefore, the data from within
each temperature set was then globally fit to a monomer-n-mer-m-mer model. Based on
the self-association trends of the other aPP variants, in which the folded peptides best fit
to a monomer-dimer model and the unfolded peptides fit to a monomer-tetramer model,
the values for n and m were fixed to 2 and 4 respectively. Data fit with these parameters
and the resulting residuals are presented in Figure 1.10 and a summary of the fitted
parameter results are given in Table 1.4.
1.3.4 Supplemental Methods for Data fitting using HeteroAnalysis
All data files for one peptide at each speed were analyzed using the Match module
for each concentration to confirm the samples had come to equilibrium at the final time
point for that speed. Specifically, three successive scans with no change in the
absorbance using the graph with no X or Y-offsets were required to confirm equilibrium.
Assuming no irregularities were observed in the scan from the latest time point, these sets
of data were used in all further data analysis.
Once the data file had been selected for analysis, it was loaded into
Heteroanalysis and divided into three different data sets by concentration. The data for
each was then cropped to exclude the noise from the meniscus and the base of the cell.
Additionally, any data over 1.2 absorbance units was excluded to eliminate potential non-

28
linear readings. The partial specific volume ( ) and density values were also entered into
the software at this time.
All of the cropped data for each peptide was first globally analyzed using the
single ideal species option. The expected monomeric molecular weight, the median
concentration, and the calculated extinction coefficient for a 1.2 cm pathlength cell were
all entered into the software. Finally, the baseline values were set to zero and held
constant, while the concentrations and the MW were allowed to vary during the fitting
process.
When the monomer-n-mer mode was used for fitting the data, the known
monomer molecular weight was entered and held constant for all steps. Additionally, the
values for concentration, extinction coefficient, expected n and a reasonable
corresponding lnK were entered into the respective boxes. During the first round of
fitting, the MW and baseline values are held constant while the values for n, lnK, and
concentration were allowed to vary. The resulting data analysis was analyzed for
goodness of fit by a lack of systematic variation in the residual plots and the
reasonableness of the fitted n and lnK values. In order to improve the fit, the data was
then refit using the new n and lnK values and by allowing these values and the baseline
values to vary. The output from this fitting, was compared to the fit obtained previously
with no baseline variation and accepted if the values obtained for baseline correction
were small (10-3-10-2) and the newest n and lnK values were similar to values obtained
from the previous fit. Another fit was carried out with the n and lnK values allowed to
vary. Based on this final fitting the f-statistic errors are calculated for n and lnK.

29
Figure 1.1: Sequence comparison of natural and designed PP-fold proteins (Hodges
and Schepartz 2007). Residues in the dimer interface (7, 20, and 21 in the natural
sequence) are marked. aPP and all proteins in green are known dimmers at µM
concentrations. PYY, pGolemi, and p007 (in red) are known monomers at µM
concentrations.

30
Table 1.1: Percent homologous primary structure among naturally occurring PP-
fold proteins (Glover, Barlow et al. 1984). Non-mammalian PP (red), mammalian PP
(green), and other homologous family members (blue) show high levels of sequence
homology within each group, but poor sequence homology across groups.
AlligatorChicken/
TurkeyGoose Bovine Ovine Porcine Human PYY NPY
Alligator 100 78 72 47 44 47 50 44 44
Chicken/
Turkey100 88 42 38 42 42 53 55
Goose 100 36 33 36 36 47 53
Bovine 100 97 94 94 50 47
Ovine 100 92 92 47 44
Porcine 100 94 50 50
Human 100 47 47
PYY 100 69
NPY 100

31
Figure 1.2: Structures of PP-fold family of proteins. A) aPP from the crystal
structure (Blundell, Pitts et al. 1981). B) bPP from an NMR structure (Li, Sutcliffe et al.
1992). C) One of the proposed NPY NMR structures (Monks, Karagianis et al. 1996).
D) PYY lowest energy structure by NMR (Lerch, Mayrhofer et al. 2004).
A B
C D
32
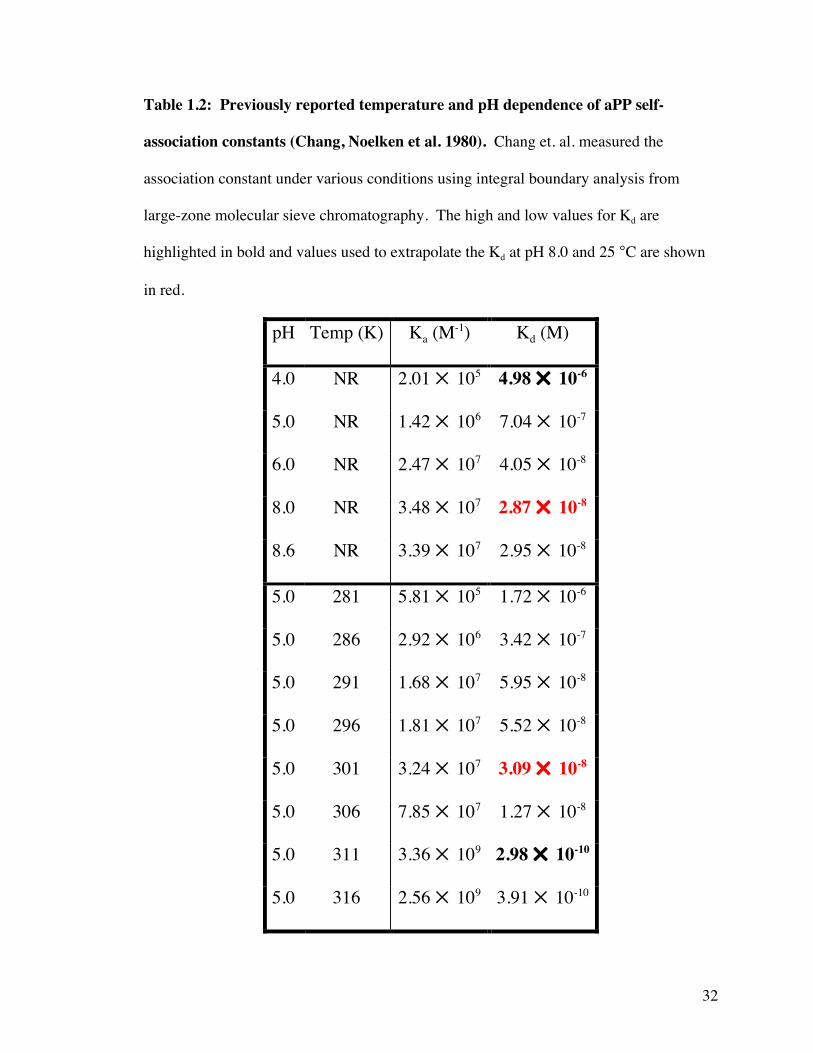
Table 1.2: Previously reported temperature and pH dependence of aPP self-
association constants (Chang, Noelken et al. 1980). Chang et. al. measured the
association constant under various conditions using integral boundary analysis from
large-zone molecular sieve chromatography. The high and low values for Kd are
highlighted in bold and values used to extrapolate the Kd at pH 8.0 and 25 °C are shown
in red.
pH Temp (K) Ka (M-1) Kd (M)
4.0 NR 2.01 105 4.98 10-6
5.0 NR 1.42 106 7.04 10-7
6.0 NR 2.47 107 4.05 10-8
8.0 NR 3.48 107 2.87 10-8
8.6 NR 3.39 107 2.95 10-8
5.0 281 5.81 105 1.72 10-6
5.0 286 2.92 106 3.42 10-7
5.0 291 1.68 107 5.95 10-8
5.0 296 1.81 107 5.52 10-8
5.0 301 3.24 107 3.09 10-8
5.0 306 7.85 107 1.27 10-8
5.0 311 3.36 109 2.98 10-10
5.0 316 2.56 109 3.91 10-10
33
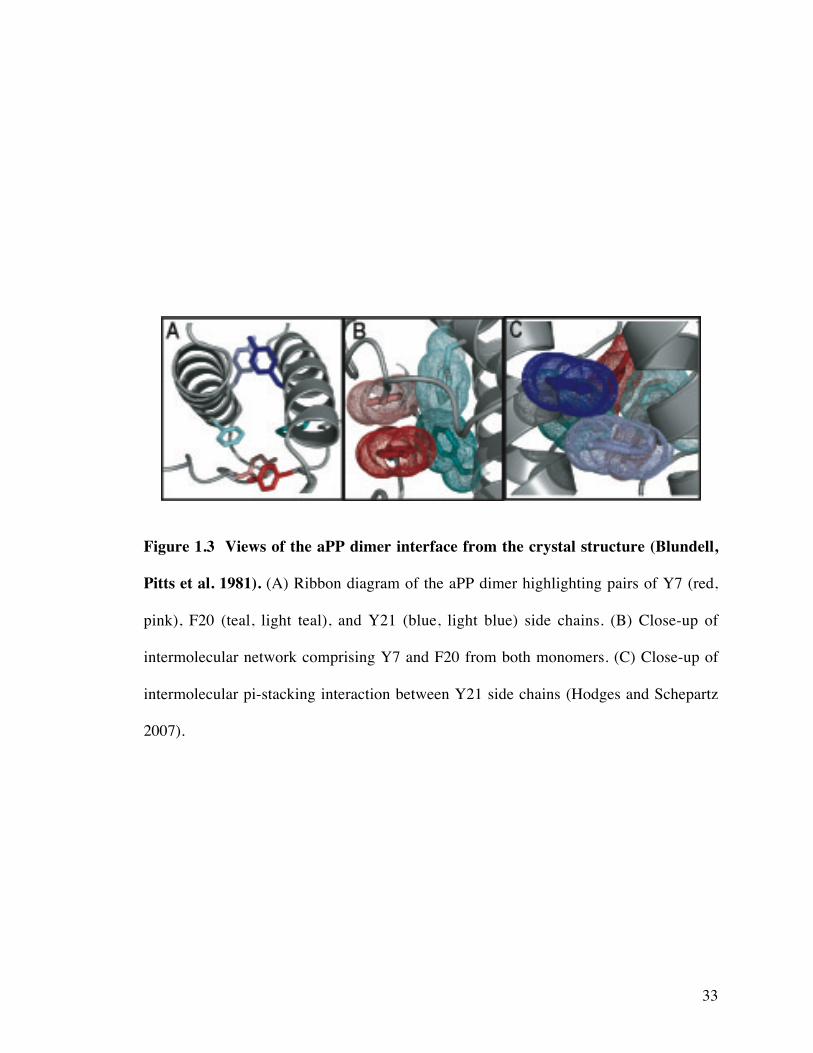
Figure 1.3 Views of the aPP dimer interface from the crystal structure (Blundell,
Pitts et al. 1981). (A) Ribbon diagram of the aPP dimer highlighting pairs of Y7 (red,
pink), F20 (teal, light teal), and Y21 (blue, light blue) side chains. (B) Close-up of
intermolecular network comprising Y7 and F20 from both monomers. (C) Close-up of
intermolecular pi-stacking interaction between Y21 side chains (Hodges and Schepartz
2007).

34
Figure 1.4: Sequences of aPP variants used in this study (Hodges and Schepartz
2007). All peptides were synthesized with an N-terminal amide cap and a free C-
terminus.

35
Figure 1.5: CD wavelength scans at varying concentrations. Each peptide was
measured at a high concentration (pink/purple) and serially diluted to a final low
concentration (red/brown) A) aPP 10-100 µM, B) PYY 1-126 µM, C) aPPY7A 8-100 µM,
D), aPPF20A 8-100 µM, E) aPPY21A 1.9-120 µM.
36
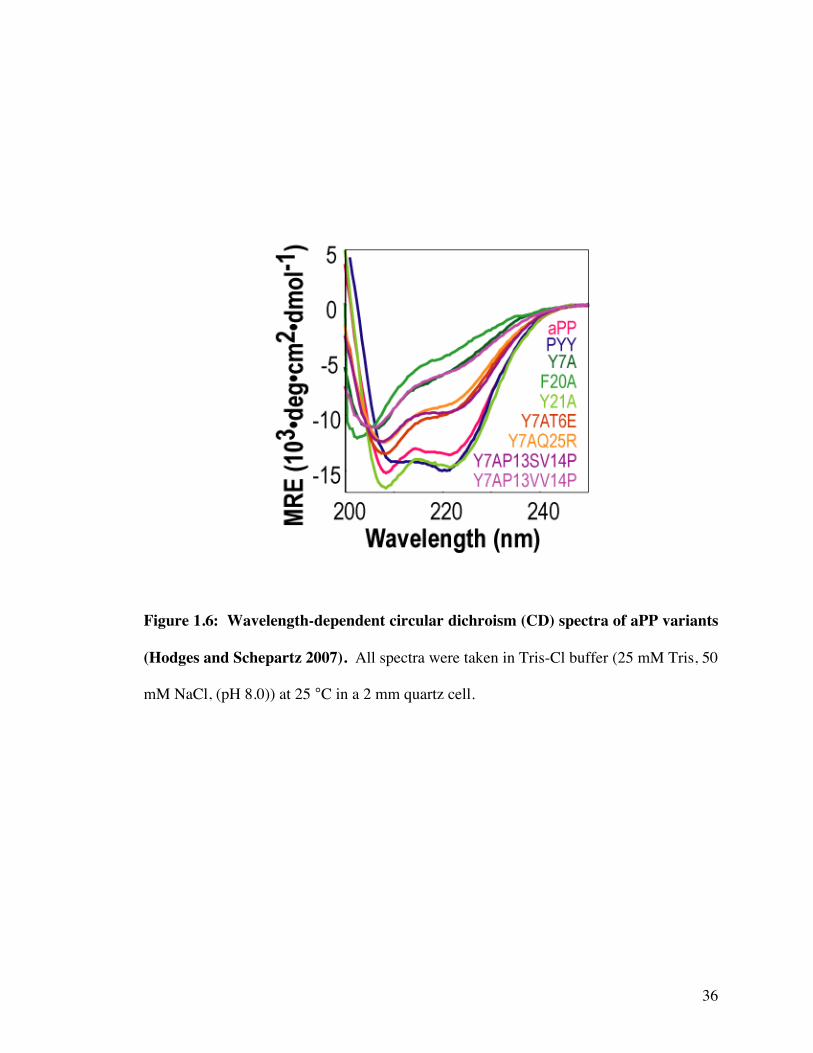
Figure 1.6: Wavelength-dependent circular dichroism (CD) spectra of aPP variants
(Hodges and Schepartz 2007). All spectra were taken in Tris-Cl buffer (25 mM Tris, 50
mM NaCl, (pH 8.0)) at 25 °C in a 2 mm quartz cell.
37
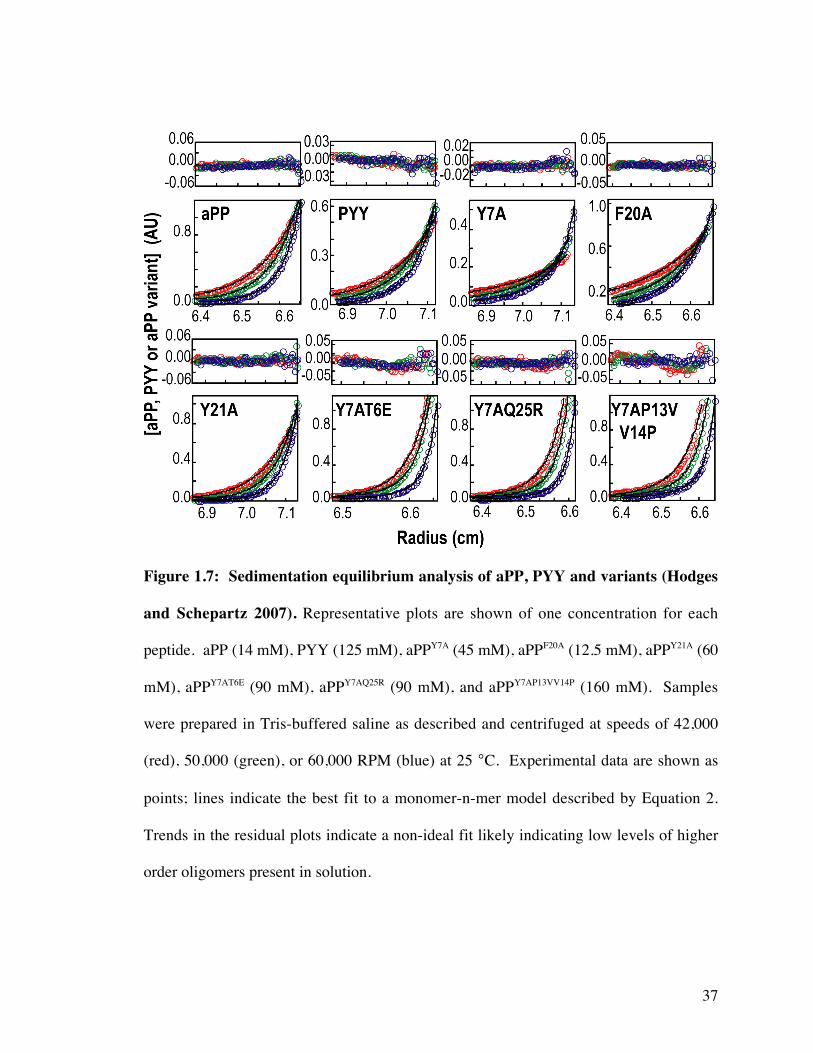
Figure 1.7: Sedimentation equilibrium analysis of aPP, PYY and variants (Hodges
and Schepartz 2007). Representative plots are shown of one concentration for each
peptide. aPP (14 mM), PYY (125 mM), aPPY7A (45 mM), aPPF20A (12.5 mM), aPPY21A (60
mM), aPPY7AT6E (90 mM), aPPY7AQ25R (90 mM), and aPPY7AP13VV14P (160 mM). Samples
were prepared in Tris-buffered saline as described and centrifuged at speeds of 42,000
(red), 50,000 (green), or 60,000 RPM (blue) at 25 °C. Experimental data are shown as
points; lines indicate the best fit to a monomer-n-mer model described by Equation 2.
Trends in the residual plots indicate a non-ideal fit likely indicating low levels of higher
order oligomers present in solution.

38
Table 1.3: Fitted Parameters from sedimentation equilibrium experiments of aPP
variants (Hodges and Schepartz 2007). Parameters derived from best global fit of all
sedimentation data to Equation 2 for each peptide.
PeptideMWave
(Da)na lnKA
a Kdb
% monomer at
30 µM
aPP 66191.92 (1.79,
2.06)
when n=2 12.41
(12.16, 12.68)
4.1×10⁻⁶
M23
PYY 57572.51 (2.28,
2.76)
when n=2 7.09
(6.95, 7.23)
8.3×10⁻⁴
M94
aPPY7A 48183.77 (3.62,
3.93)
when n=4 26.28
(26.13, 26.42)
3.9×10⁻¹²
M398
aPPF20A 43513.87 (3.85,
3.88)when n=4 23.29
(23.16, 23.42)
7.6×10⁻¹¹
M3100
aPPY21A 76761.86 (1.84,
1.88)
when n=2 13.57
(12.95. 14.16)
1.3×10⁻⁶
M14
aPPY7AT6E 104803.88 (3.68,
4.09)when n=4 29.26
(29.04, 29.49)
2.0×10⁻¹³
M379
aPPY7AQ25R 108444.06 (3.88,
4.24)when n=4 29.34
(29.15, 29.53)
1.8×10⁻¹³
M378
aPPY7AP13VV14P 99614.48 (4.21,
4.76)
when n=4 27.92
(27.68, 28.16)
7.5×10⁻¹³
M390
a Lower and upper error values calculated using f-statistics are shown in parentheses.
b KD values calculated from ln KA.

39
Figure 1.8: Illustration of a proline shift impacting the packing interfaces of aPP
and PYY. The primary sequences for aPP (red) and PYY (blue) were aligned and the
overlayed structures (Blundell, Pitts et al. 1981; Lerch, Mayrhofer et al. 2004) were
represented as cartoons. Proline 13 (aPP) and proline 14 (PYY) and the residues at
position 20 and 28 are shown to highlight the shift in register caused by the different
proline locations.

40
Figure 1.9: Temperature-dependent CD analysis of aPPY7AP13SV14P (Hodges and
Schepartz 2007) (A) Wavelength-dependent CD spectra acquired at 5 °C in PBS buffer
and 30 µM peptide either immediately prior to (red) or following (blue) temperature-
dependent CD scans. (B) The mean residue ellipticity at 222 nm of aPPY7A,P13S,V14P as the
temperature is raised (red) and then lowered (blue). (C) Plot of δMRE222/δT (units of
deg•cm2•dmol-1•K-1).

41
Figure 1.10: Temperature-dependent sedimentation equilibrium of aPPY7AP13SV14P
(Hodges and Schepartz 2007). Samples were prepared in PBS buffer (90 µM) and
centrifuged to equilibrium at speeds of 42,000 (red), 50,000 (green), and 60,000 (blue)
rpm. Experimental data are shown as points; lines indicate a fit to a monomer-dimer-
tetramer model as described with resulting residuals displayed as well. Trends in the
residual plots are discussed in section 1.2.4.

42
Table 1.4: Fitted parameters from aPPY7AP13SV14P temperature-dependent
sedimentation equilibrium experiments (Hodges and Schepartz 2007). All data was
fit to a monomer-dimer-tetramer model using Heteroanalysis.
Temperature ln KA (n) ln KA (m) % monomera
5 °C 8.9 (8.4, 9.3)b 25.7 (25.3, 26.0) 74
10 °C 8.4 (7.9, 8.8) 25.3 (25.0, 25.5) 82
15 °C 8.2 (7.7, 8.6) 25.6 (25.4, 25.8) 84
20 °C 7.5 (6.4, 8.2) 25.0 (24.8, 25.2) 90
25 °C 7.5 (6.4, 8.2) 25.7 (25.4, 26.0) 90
30 °C 5.6 (ND) 24.4 (24.2, 24.5) 98
a At 30 µM total peptide concentration
b Lower and upper error values calculated using f-statistics are shown in parentheses.
43
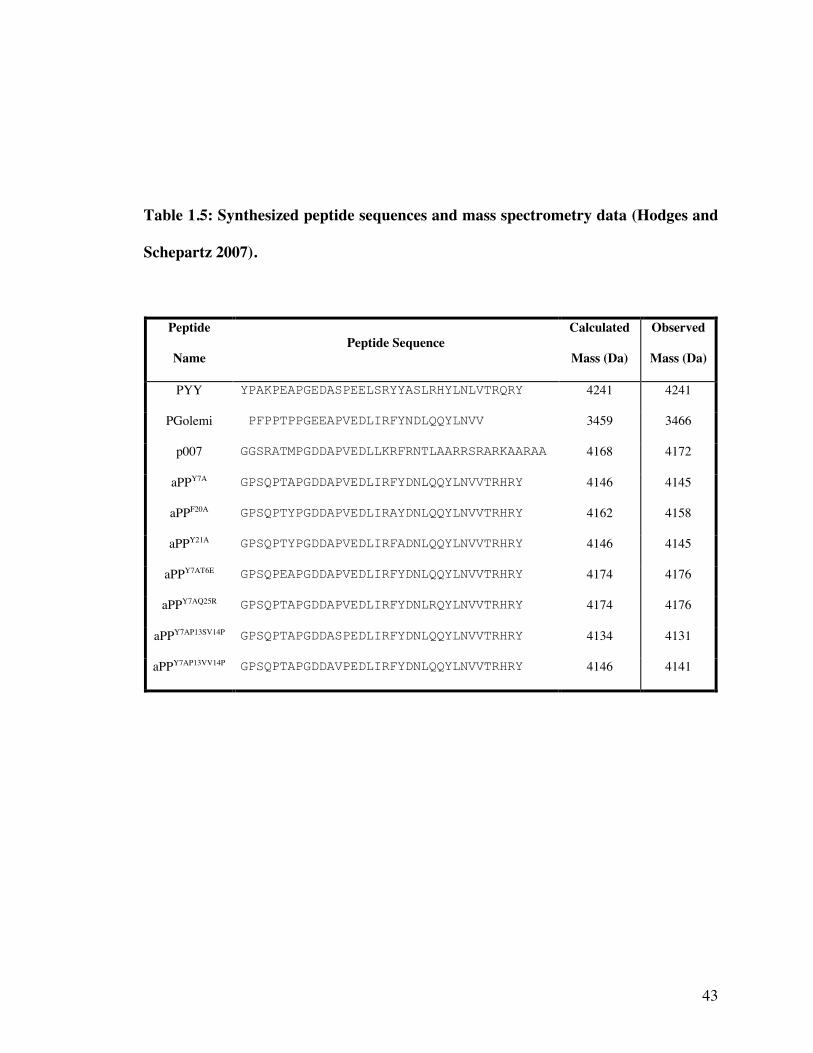
Table 1.5: Synthesized peptide sequences and mass spectrometry data (Hodges and
Schepartz 2007).
Peptide
NamePeptide Sequence
Calculated
Mass (Da)
Observed
Mass (Da)
PYY YPAKPEAPGEDASPEELSRYYASLRHYLNLVTRQRY 4241 4241
PGolemi PFPPTPPGEEAPVEDLIRFYNDLQQYLNVV 3459 3466
p007 GGSRATMPGDDAPVEDLLKRFRNTLAARRSRARKAARAA 4168 4172
aPPY7A GPSQPTAPGDDAPVEDLIRFYDNLQQYLNVVTRHRY 4146 4145
aPPF20A GPSQPTYPGDDAPVEDLIRAYDNLQQYLNVVTRHRY 4162 4158
aPPY21A GPSQPTYPGDDAPVEDLIRFADNLQQYLNVVTRHRY 4146 4145
aPPY7AT6E GPSQPEAPGDDAPVEDLIRFYDNLQQYLNVVTRHRY 4174 4176
aPPY7AQ25R GPSQPTAPGDDAPVEDLIRFYDNLRQYLNVVTRHRY 4174 4176
aPPY7AP13SV14P GPSQPTAPGDDASPEDLIRFYDNLQQYLNVVTRHRY 4134 4131
aPPY7AP13VV14P GPSQPTAPGDDAVPEDLIRFYDNLQQYLNVVTRHRY 4146 4141
44
References:
Bader, R., A. Bettio, et al. (2001). "Structure and dynamics of micelle-bound
neuropeptide Y: Comparison with unligated NPY and implications for receptor
selection." Journal of Molecular Biology 305(2): 307-329.Becksickinger, A. G., H. A. Wieland, et al. (1994). "Complete L-Alanine Scan of
Neuropeptide-Y Reveals Ligands Binding to Y-1 and Y-2 Receptors with
Distinguished Conformations." European Journal of Biochemistry 225(3): 947-958.
Bjornholm, B., F. S. Jorgensen, et al. (1993). "Conservation of a Helix-StabilizingDipole-Moment in the Pp-Fold Family of Regulatory Peptides." Biochemistry
32(12): 2954-2959.
Blundell, T. L., J. E. Pitts, et al. (1981). "X-Ray-Analysis (1.4-a Resolution) of AvianPancreatic-Polypeptide - Small Globular Protein Hormone." Proceedings of the
National Academy of Sciences of the United States of America-BiologicalSciences 78(7): 4175-4179.
Chang, P. J., M. E. Noelken, et al. (1980). "Reversible Dimerization of Avian Pancreatic-
Polypeptide." Biochemistry 19(9): 1844-1849.Chin, J. W. and A. Schepartz (2001). "Concerted evolution of structure and function in a
miniature protein." Journal of the American Chemical Society 123(12): 2929-2930.
Chin, J. W. and A. Schepartz (2001). "Design and evolution of a miniature bcl-2 binding
protein." Angewandte Chemie-International Edition 40(20): 3806-+.Cobos, E. S., M. T. Pisabarro, et al. (2004). "A miniprotein scaffold used to assemble the
polyproline II binding epitope recognized by SH3 domains." Journal of MolecularBiology 342(1): 355-365.
Cowley, D. J., J. M. Hoflack, et al. (1992). "Structure of Neuropeptide-Y Dimer in
Solution." European Journal of Biochemistry 205(3): 1099-1106.Daniels, D. S. and A. Schepartz (2007). "Intrinsically cell-permeable miniature proteins
based on a minimal cationic PPII motif." Journal of the American Chemical
Society 129(47): 14578-+.

45
Darbon, H., J. M. Bernassau, et al. (1992). "Solution Conformation of Human
Neuropeptide-Y by H-1 Nuclear-Magnetic-Resonance and Restrained Molecular-Dynamics." European Journal of Biochemistry 209(2): 765-771.
Derreumaux, P. (1998). "Finding the low-energy forms of avian pancreatic polypeptidewith the diffusion-process-controlled Monte Carlo method." Journal of Chemical
Physics 109(4): 1567-1574.
Gemperli, A. C., S. E. Rutledge, et al. (2005). "Paralog-selective ligands for Bcl-2proteins." Journal of the American Chemical Society 127(6): 1596-1597.
Glover, I., I. Haneef, et al. (1983). "Conformational Flexibility in a Small GlobularHormone - X-Ray-Analysis of Avian Pancreatic-Polypeptide at 0.98-a
Resolution." Biopolymers 22(1): 293-304.
Glover, I. D., D. J. Barlow, et al. (1984). "Conformational Studies on the Pancreatic-Polypeptide Hormone Family." European Journal of Biochemistry 142(2): 379-
385.
Golemi-Kotra, D., R. Mahaffy, et al. (2004). "High affinity, paralog-specific recognitionof the Mena EVH1 domain by a miniature protein." Journal of the American
Chemical Society 126(1): 4-5.Griko, Y. V. and M. D. Kapanadze (1995). "Purification and Characterization of Human
Pancreatic-Polypeptide Expressed in Escherichia-Coli." Biochemical and
Biophysical Research Communications 213(1): 239-248.Hodges, A. M. and A. Schepartz (2007). "Engineering a monomeric miniature protein."
Journal of the American Chemical Society 129(36): 11024-+.Holtzman, J. H., K. Woronowicz, et al. (2007). "Miniature protein ligands for EVH1
domains: Interplay between affinity, specificity, and cell motility." Biochemistry
46: 13541-13553.Jurt, S., A. Aemissegger, et al. (2006). "A Photoswitchable Miniprotein Based on the
Sequence of Avian Pancreatic Polypeptide." Angewandte Chemie 118(38): 6445-6448.
Keire, D. A., M. Kobayashi, et al. (2000). "Solution structure of monomeric peptide YY
supports the functional significance of the PP-fold." Biochemistry 39(32): 9935-9942.

46
Keire, D. A., P. Mannon, et al. (2000). "Primary structures of PYY, [Pro(34)]PYY, and
PYY-(3-36) confer different conformations and receptor selectivity." AmericanJournal of Physiology-Gastrointestinal and Liver Physiology 279(1): G126-G131.
Khiat, A., M. Labelle, et al. (1998). "Three-dimensional structure of the Y1 receptoragonist [Leu(31), Pro(34)]NPY as determined by NMR and molecular modeling."
Journal of Peptide Research 51(4): 317-322.
Kritzer, J. A., R. Zutshi, et al. (2006). "Miniature protein inhibitors of the p53-hDM2interaction." Chembiochem 7(1): 29-31.
Lerch, M., V. Gafner, et al. (2002). "Bovine pancreatic polypeptide (bPP) undergoessignificant changes in conformation and dynamics upon binding to DPC
micelles." Journal of Molecular Biology 322(5): 1117-1133.
Lerch, M., M. Mayrhofer, et al. (2004). "Structural similarities of micelle-bound peptideYY (PYY) and neuropeptide Y (NPY) are related to their affinity profiles at the Y
receptors." Journal of Molecular Biology 339(5): 1153-1168.
Li, X., M. J. Sutcliffe, et al. (1992). "Sequence-Specific H-1-Nmr Assignments andSolution Structure of Bovine Pancreatic-Polypeptide." Biochemistry 31(4): 1245-
1253.Minakata, H. and T. Iwashita (1990). "Synthesis of Analogs of Peptide-Yy with Modified
N-Terminal Regions - Relationships of Amphiphilic Secondary Structures and
Activity in Rat Vas-Deferens." Biopolymers 29(1): 61-67.Monks, S. A., G. Karagianis, et al. (1996). "Solution structure of human neuropeptide Y."
Journal of Biomolecular Nmr 8(4): 379-390.Montclare, J. K. and A. Schepartz (2003). "Miniature homeodomains: High specificity
without an N-terminal arm." Journal of the American Chemical Society 125(12):
3416-3417.Neumoin, A., J. Mares, et al. (2007). "Probing the Formation of Stable Tertiary Structure
in a Model Miniprotein at Atomic Resolution: Determinants of Stability of aHelical Hairpin." J. Am. Chem. Soc.
Noelken, M. E., P. J. Chang, et al. (1980). "Conformation and Association of Pancreatic-
Polypeptide from 3 Species." Biochemistry 19(9): 1838-1843.

47
Nordmann, A., M. J. J. Blommers, et al. (1999). "Aspects of the molecular structure and
dynamics of neuropeptide Y." European Journal of Biochemistry 261(1): 216-226.
Nygaard, R., S. Nielbo, et al. (2006). "The PP-fold solution structure of humanpolypeptide YY and human PYY3-36 as determined by NMR." Biochemistry
45(27): 8350-8357.
Palermo, N. Y., J. Csontos, et al. (2008). "Role of aromatic residues in stabilizing thesecondary and tertiary structure of avian pancreatic polypeptide." International
Journal of Quantum Chemistry 108(4): 814-819.Palermo, N. Y., J. Csontos, et al. (2007). "Aromatic-backbone interactions in model
alpha-helical peptides." Journal of Computational Chemistry 28(7): 1208-1214.
Rutledge, S. E., H. M. Volkman, et al. (2003). "Molecular recognition of proteinsurfaces: High affinity ligands for the CBPKIX domain." Journal of the American
Chemical Society 125(47): 14336-14347.
Schneider, T. L., R. S. Mathew, et al. (2005). "Increasing the kinase specificity of K252aby protein surface recognition." Organic Letters 7(9): 1695-1698.
Scholtz, J. M. and R. L. Baldwin (1992). "The Mechanism of Alpha-Helix Formation byPeptides." Annual Review of Biophysics and Biomolecular Structure 21: 95-118.
Shimba, N., A. M. Nomura, et al. (2004). "Herpesvirus protease inhibition by dimer
disruption." Journal of Virology 78(12): 6657-6665.Smith, B. A., D. S. Daniels, et al. (2008). "Minimally cationic cell-permeable miniature
proteins via alpha-helical arginine display." Journal of the American ChemicalSociety 130(10): 2948-2949.
Taylor, T. C. and J. R. Kimmel (1987). "Iodinated Derivatives of the Hormone Avian
Pancreatic-Polypeptide." Analytical Biochemistry 166(1): 194-203.Volkman, H. M., S. E. Rutledge, et al. (2005). "Binding mode and transcriptional
activation potential of high affinity ligands for the CBPKIX domain." Journal ofthe American Chemical Society 127(13): 4649-4658.
Woll, M. G. and S. H. Gellman (2004). "Backbone thioester exchange: A new approach
to evaluating higher order structural stability in polypeptides." Journal of theAmerican Chemical Society 126(36): 11172-11174.

48
Yang, L. and A. Schepartz (2005). "Relationship between folding and function in a
sequence-specific miniature DNA-binding protein." Biochemistry 44(20): 7469-7478.
Zellefrow, C. D., J. S. Griffiths, et al. (2006). "Encodable activators of Src familykinases." Journal of the American Chemical Society 128(51): 16506-16507.
Zerbe, O., A. Neumoin, et al. (2006). "Review - Recognition of neurohormones of the
NPY family by their receptors." Journal of Receptors and Signal Transduction26(5-6): 487-504.
Zondlo, N. J. and A. Schepartz (1999). "Highly specific DNA recognition by a designedminiature protein." Journal of the American Chemical Society 121(29): 6938-
6939.

49
Chapter 2: Origins of Specificity in Natural and Miniature Protein Ligands for Bcl-
2 Family Proteins
2.1 Miniature protein ligands for anti-apoptotic proteins
Apoptosis, or programmed cell death, is a necessary cellular function for
development and maintenance of healthy tissues and organisms. Aberrations in apoptotic
pathways lead to many disease states including cancers of all kinds. In this report, pro-
apoptotic miniature proteins are used to examine the subtle structural differences of anti-
apoptosis proteins Bcl-2 and Bcl-XL and how those differences can be used to develop
high-specificity ligands.
2.1.1 Roles and mechanisms of Bcl-XL and Bcl-2 in apoptosis
Cell death is observed in all levels and phases of cell development and growth.
The two modes of cell death necrosis and apoptosis are quite different both in intitiation
pathways and biological results. Apoptosis is a controlled cell death the results from
specific initiating signals including cell stress from DNA damage, loss of nutrients, or
presence of toxins, developmental signals, and immunological signals. (Spierings,
McStay et al. 2005) One of the apoptosis pathways proceeds through the mitochondrial
pathway in which ultimately the mitochondrial membranes are compromised and
cytochrome C is released into the cellular environment. (Jiang and Wang 2004) The
release of cytochrome c initiates a cascade of events resulting in cell death.
The integrity of the mitochondrial membrane is maintained through a delicate
balance of active and inactive pro-apoptotic and anti-apoptotic Bcl-2 family members.
(Rutledge, Chin et al. 2002) The Bcl-2 family of proteins are divided into three classes

50
based on function and four regions of Bcl-2 structural homology (BH domains) – the
anti-apoptotic proteins, the BH3 only proteins, and the multi-BH domain pro-apoptotic
proteins. The anti-apoptotic proteins including Bcl-2 and Bcl-XL typically contain all
four BH domains and are primarily responsible for the maintenance of mitochondrial
integrity. The multi-BH domain pro-apoptotic proteins (Bax, Bak, Bad, etc.) as their
name implies typically contain three of the homology domains and are capable of
inducing apoptosis through permeation of the mitochondria and/or through interactions
with anti-apoptotic proteins. Finally, the BH3-only proteins (Bid) contain only the BH3
domain, usually are contained within the cell in their inactive form, and are primarily
responsible for activating the multi-BH domain pro-apoptotic proteins. (Rutledge, Chin et
al. 2002)
The role of Bcl-2 and Bcl-XL in protecting a cell from unregulated apoptosis is a
benefit in most healthy cells. However, chemoresistant cancer cells have exploited this
protective role through overexpression of these two proteins. Multiple studies have
directly linked the overexpression of Bcl-2 and Bcl-XL to the multi-drug resistance of
solid tumors in mice. (Liu, Page et al. 1999; Schmitt, Rosenthal et al. 2000) Additionally,
Oltersdorf et. al showed that a small molecule inhibitor of the Bcl-2 family of proteins
can induce a shrinking of solid tumors. (Oltersdorf, Elmore et al. 2005)
Though small-molecule inhibitors have the focus in developing ligands for the
BH3 domain of Bcl-XL and Bcl-2, (Degterev, Lugovskoy et al. 2001; Petros, Dinges et al.
2006; Wang, Nikolovska-Coleska et al. 2006; Wendt, Shen et al. 2006) protein based
ligands have made great strides in recent years. Chimeric large proteins as well as
smaller unstructured peptides have been used to increase ligand specificity and cellular

51
targeting and permeability. (Shangary and Johnson 2002; Antignani and Youle 2005)
Peptides that use natural and non-natural amino acids to mimic the α-helix binding motif
of the BH3 domains have been developed in a number of labs. (Walensky, Kung et al.
2004; Sadowsky, Schmitt et al. 2005; Wang, Liao et al. 2005; Walensky, Pitter et al.
2006; Walensky, Pitter et al. 2006) Additionally, a small molecule scaffold that mimics
the alpha-helix display has also been used to target Bcl-XL. (Yin, Lee et al. 2005) This
report looks at the development and characterization of miniature protein ligands with
specificity for Bcl-2 or Bcl-XL using the aPP scaffold to mimic the α-helix binding motif.
(Chin and Schepartz 2001; Gemperli, Rutledge et al. 2005)
2.1.2 Development of a miniature protein ligand for Bcl-XL and Bcl-2
One of the first direct observations of Bcl-2 family members interacting came
with the NMR structure of Bcl-XL bound to a short fraction of the Bak protein –
specifically Bak72-87. (Chittenden, Flemington et al. 1995; Sattler, Liang et al. 1997) The
binding interface consisted of a helix in the BH3 domain of Bak bound in a hydrophobic
groove on the surface of Bcl-XL (figure 2.1). The presence of an α-helix as the binding
recognition domain provided a good model system for the initial use of the protein
grafting strategy to create a miniature protein capable of recognizing a protein surface.
(Chin and Schepartz 2001) The protein grafting strategy centers around the use of avian
pancreatic polypeptide (aPP) as a well-folded, preorganized protein recognition scaffold.
The protein aPP is a member of the family of the smallest known naturally occurring
well-folded globular proteins. Using aPP as a scaffold, the residues on the surface of the
Bak helix that are important for binding to Bcl-XL, or the binding epitope, were grafted
onto the solvent accessible face of the α-helix of aPP (figure 2.2). Diversity was then

52
introduced at some of the residues using phage display and ultimately one well-folded
miniature protein, PPBH3-1, with a high binding affinity for Bcl-XL and Bcl-2 was
isolated from the library (figure 2.3). (Chin and Schepartz 2001)
2.1.3 Selection of paralog specific miniature proteins
Due to the significantly higher binding affinity of PPBH3-1 than Bak for Bcl-2
and Bcl-XL, PPBH3-1 provides a great starting point for studying Bcl-2 mediated
apoptosis. However, the distinct roles of Bcl-2 and Bcl-XL are known to be slightly
different in vivo. Cell lines that over-express Bcl-2 and Bcl-XL possess different
chemosensitivities and mice that lack the genes for Bcl-2 and Bcl-XL possess distinct
phenotypes. (Veis, Sorenson et al. 1993; Motoyama, Wang et al. 1995; Simonian, Grillot
et al. 1997; Amundson, Myers et al. 2000) Additionally, Bcl-2 and Bcl-XL frequently
differ in their cellular localization. (Kaufmann, Schlipf et al. 2003) These physiological
differences can only be studied by a molecule that selectively binds to one paralog and
not the other. The ability to develop miniature proteins that are paralog specific is
dependant on an understanding of the structural differences between the two proteins.
A specificity library was designed to select for Bcl-2 specific PPBH3-1 variants
by varying the residues of PPBH3-1 that are close in proximity to regions that differ
between Bcl-XL and Bcl-2. (Gemperli, Rutledge et al. 2005) The library was panned
using alternating rounds of positive (Bcl-2) and negative (Bcl-XL) selection (Figure 2.4).
Two sequences were isolated multiple times from the library in rounds 4-7. The two
sequences were shown to indeed bind preferentially to Bcl-2 over Bcl-XL with PPBH3-5
and PPBH3-6 (figure 2.3) having Bcl-2 binding affinities 6x and 14x stronger than Bcl-
XL respectively (Table 2.1). Analysis of the sequences isolated from the specificity

53
library and the subsequent interactions with Bcl-XL and Bcl-2 would provide important
information regarding the contribution of the residues involved in paralog specificity.
2.2 Analysis of binding modes for Bcl-XL and Bcl-2 ligands
The binding mode and the determinants for Bcl-XL and Bcl-2 ligand specificity
were further explored through Bcl-XL variants. Specifically, the residues capable of
conferring specificity within the BH3 binding groove were varied to more closely
resemble the residues found in the binding groove of Bcl-2. By analyzing the impact
these changes had on binding affinity for Bcl-XL preferring (Bak72-87 and PPBH3-1) and
for Bcl-2 preferring (PPBH3-5 and PPBH3-6) miniature proteins the binding mode and
the success of the paralog specificity library were determined.
2.2.1 Structural analysis of Bcl-XL and Bcl-2 binding grooves
Bcl-XL and Bcl-2 have a sequence identity of only 39% with one of the largest
differences between the sequences of the two proteins being a long unstructured loop
region between helices 1 and 2 (figure 2.5 blue) which is highly variable in Bcl-2 family
proteins. (Petros, Medek et al. 2001) When this loop region is removed from Bcl-XL and
Bcl-2 the sequence identity increases to 62%. The primary sequences for Bcl-XL and
Bcl-2 were aligned and differing residues were assessed (Figure 2.5) Of these residues,
though, only those within the BH3 binding groove are capable of conferring ligand
specificity. The NMR structure of the Bak72-87 peptide bound to the BH3 binding groove
of Bcl-XL was used to construct a map of the residues directly involved in the binding
event of interest. (Sattler, Liang et al. 1997) Specifically, Insight 2000 was used to
measure and tabulate the amino acids of Bcl-XL that are within 5 Å of the bound Bak72-87
peptide in the NMR structure. (Sattler, Liang et al. 1997) Of those residues that have the

54
potential to be involved in the binding event, only six differ in the primary sequence of
Bcl-2 (figure 2.5 red). The pairs at Bcl-XL position 96 and 107 are only conservatively
different (aspartic acid and glutamic acid) leaving only four positions that comprise
significant residue differences between the BH3 binding grooves of Bcl-XL and Bcl-2.
Three of these pairs (A104, L108, and S122 in Bcl-XL compared to D111, M115, and
R129 in Bcl-2) had been previously isolated as potentially important in the binding
specificity of Bcl-XL and Bcl-2 (Petros, Medek et al. 2001), however the pair at position
125 (Q in Bcl-XL compared to T in Bcl-2) had not been previously reported in the
literature.
The potential ability of the residues at these four positions to confer the binding
specificity of the Bcl-XL and Bcl-2 BH3 binding grooves was made even more evident
when the solvent accessible surfaces of the two binding grooves were visually compared.
Though the overall backbone RMSD of Bcl-XL and Bcl-2 is ~1.85 Å (excluding the loop
between helix 1 and 2) there are a couple of notable structural differences in the binding
grooves. The structure of helix 3 in the binding groove differs slightly in the two
proteins– a regular α-helix in Bcl-XL and a 310 helix in Bcl-2. (Petros, Medek et al. 2001)
The differing helix structure in combination with a couple of residual contacts outside of
the binding groove cause the BH3 groove of Bcl-2 to be slightly wider than that of Bcl-
XL (figure 2.1B and 2.5). (Petros, Medek et al. 2001) These topological differences cause
the residues at Bcl-XL positions 104 and 108 to be slightly spatially offset in Bcl-2 (figure
2.5). Additionally, the residual differences create a significantly different electrostatic
distribution on the surfaces of the proteins. Bcl-XL has a significantly larger negative
electrostatic potential at the end of the BH3 domain that interacts with the N-termini of

55
Bad and Bak. It has been hypothesized that these electronic interactions are the main
source of the specificity Bad and Bak show for Bcl-XL over Bcl-2. (Petros, Medek et al.
2001) Finally, the residues present at positions 111, 115, and 129 in Bcl-2 are sterically
bulky as compared to the corresponding residues in Bcl-XL causing the binding groove of
Bcl-2 to be more crowded than that of Bcl-XL (figure 2.5)
2.2.2 Design and cloning of Bcl-XL variants
To determine the extent to which the four differences in primary sequence and
subsequent groove topology contribute to the binding specificity of the Bak BH3 domain
as well as the Bcl-XL and Bcl-2 selective miniature proteins PPBH3-1, PPBH3-5, and
PPBH3-6, we constructed a set of four Bcl-XL variants in which a single residue from
Bcl-2 was substituted in the corresponding position in Bcl-XL. Specifically, A104 was
replaced by D (Bcl-XLA104D), L108 was replaced by M (Bcl-XL
L108M), S122 was replaced
by R (Bcl-XLS122R), and Q125 was replaced by T (Bcl-XL
Q125T). The variants were
generated as fusions of GST to aid in purification and fluorescence polarization analysis.
None of the ligands showed a significant binding affinity for GST (KD > 30 µM, data not
shown). Due to difficulties encountered in expressing Bcl-2, the analogous experiment in
which residues from Bcl-XL are substituted in the corresponding positions in Bcl-2 was
not performed.
The variants were constructed through site-directed mutagenesis of a plasmid
encoding GST-Bcl-XL and were then overexpressed in E. coli and purified through
affinity chromatography. Circular dichroism was used to verify that the mutations
introduced in the Bcl-XL variants did not destroy the overall fold of the protein. The CD

56
of GST-Bcl-XL showed 33% helicity, while the variants showed 31-36% helicity
indicating that the variants maintained the overall level of helical structure (Figure 2.6).
2.2.3 Binding affinity of natural ligand Bak to Bcl-XL variants
Equilibrium dissociation constants were determined by fluorescence polarization
using standard methods. Briefly, each experiment was performed by incubating Bak72-
87Flu (25 nM) with serial dilutions of the GST fusion protein (ranging from 40 µM to 305
pM) in PBS with 0.05% Tween-20 in 384 well plates for 1 h at 4 °C. The experiments
were all performed in triplicate and read using an Analyst plate reader. The KD was
determined by plotting the concentration of the fusion protein versus the fraction of
peptide bound using the procedures outlined in the Materials and Methods section.
The results of the equilibrium fluorescence polarization experiments with Bak72-87Flu are
shown in Figure 2.7 and Table 2.1. Bak72-87 binds GST-Bcl-XL and GST-Bcl-2 with a
binding affinity of 340 ± 40 nM and 8000 ± 7000 nM respectively using the assay
conditions reported. Previously reported KD values for the Bak72-87•Bcl-XL and Bak•Bcl-2
complexes are consistant with these values. (Chittenden, Flemington et al. 1995; Sattler,
Liang et al. 1997) The large error on the binding constant for Bak•Bcl-2 is a result of the
protein not being stable at high enough concentrations to span the full binding range.
Based on the ability of natural ligand Bak72-87 to bind Bcl-XL with a >10 fold
higher affinity than Bcl-2, it was expected that Bak72-87 would bind variants of Bcl-XL
(which now resemble Bcl-2 at one position that is presumed to be important in binding
events) with a decreased affinity compared to Bcl-XL. Bak72-87Flu did have a decreased
affinity for Bcl-XLA104D (600 ± 120 nM), Bcl-XL
L108M (530 ± 50 nM) and Bcl-XLS122R (620
± 40 nM) signifying a positive contribution at each of these positions for Bcl-XL

57
specificity. A minor increase in binding affinity was observed for the Bak72-87Flu•GST-
Bcl-XLQ125T complex (84 ± 11 nM) indicating that the glutamine present in Bcl-XL at
position 125 is not involved in conferring the specificity of Bak72-87 for Bcl-XL over Bcl-
2.
The energetics governing the binding mode of Bak72-87 for Bcl-XL can be seen by
calculating the ΔΔG values of Bak72-87 binding to Bcl-XL variants (Bcl-XLA104D 0.7
kcal•mol-1 , Bcl-XLL108M 0.6 kcal•mol-1, Bcl-XL
S122R 0.7 kcal•mol-1). The overall increase
in energy necessary for Bak72-87 to bind to Bcl-2 as opposed to Bcl-XL is equal to a ΔΔG
of 2.2 kcal•mol-1 and the residues studied contribute a sum total ΔΔG that is slightly less
than 2.2 kcal•mol-1 (2.1 kcal•mol-1). This result implies that the specificity of Bak72-87 for
Bcl-XL is a direct consequence of three of the four residues, however initial studies
performed using double and triple site variants of Bcl-XL (data not shown) indicate the
interactions may be cooperative and not simply additive. The conservative changes in the
equilibrium binding affinities observed for Bak72-87 with Bcl-XL, Bcl-XL variants, and Bcl-
2 will serve as a model for comparing the binding mode of Bak72-87 to that of R8-PPBH3-
1, PPBH3-5, and PPBH3-6.
2.2.4 Affinity of R8-PPBH3-1 for Bcl-XL, Bcl-XL variants, and Bcl-2
Previous work has shown that PPBH3-1 competes with Bak72-87 for binding the
BH3 recognition groove on Bcl-XL and that PPBH3-1, like Bak72-87, shows preference for
binding Bcl-XL over Bcl-2(Chin and Schepartz 2001). To verify that PPBH3-1 has the
same binding mode as Bak72-87 and to evaluate the extent to which the Bcl-XL specificity
originates from residual differences in the binding groove, we analyzed the binding
affinity of PPBH3-1 for a set of Bcl-XL single site variants using the same experimental

58
scheme outlined for determining Bak72-87 binding affinity. Due to the poor solution
behavior of PPBH3-1, the R8 version of the peptide (R8-PPBH3-1) was used instead.
R8-PPBH3-1Flu was found to have a similar binding affinity (figure 2.7 and table
2.1) for all four Bcl-XL variants (Bcl-XLA104D 43±11 nM, Bcl-XL
L108M 57±14 nM, Bcl-
XLS122R 59 ± 11 nM, and Bcl-XL
Q125T 310 ± 60 nM). The only variant that shows a
significant decrease in binding affinity with R8-PPBH3-1 is Bcl-XLQ125T. These results
indicate that PPBH3-1 relies less on residues 104, 108, and 122 to achieve high affinity
for Bcl-XL, but likely does rely on Q125 indicating it may be a region to target for Bcl-2
specificity. In order to truly compare the results observed with R8-PPBH3-1 to the other
ligands measured, binding experiments to Bcl-XL and Bcl-2 must be carried out under
identical conditions. The poor solution behavior of PPBH3-1 prohibited these
experiments from being performed successfully.
2.2.5 Affinity of PPBH3-5 and PPBH3-6 for Bcl-XL, Bcl-XL variants, and Bcl-2
PPBH3-5 and PPBH3-6 are miniature protein variants of PPBH3-1 isolated from
a library designed to select for ligands that prefer Bcl-2 over Bcl-XL. The library was
designed such that the source of specificity for the resulting molecules would primarily
involve the residue differences in the BH3 binding grooves of Bcl-XL and Bcl-2. The
residues of PPBH3-1 (positions 14, 15, 19, 21, 24, and 28) that are capable of exploiting
the subtle structural and electronic differences of the Bcl-XL and Bcl-2 binding grooves
were varied and the library was panned using phage display. Two miniature proteins,
PPBH3-5 and PPBH3-6, isolated from the library bind Bcl-2 (500 ± 50 nM and 540 ± 60
nM respectively) with an approximately 10-fold higher affinity than Bcl-XL (2700 ± 500
nM and 5400 ± 700 nM respectively). (Gemperli, Rutledge et al. 2005)

59
PPBH3-5 bound each of the Bcl-XL variants with significant differences (figure
2.7 and Table 2.1). The 104 and 122 variants bound with higher affinity (77 ± 19 and
390 ± 50 nM respectively) than PPBH3-5 bound to Bcl-2. These strong binding
constants indicate that these residues are primarily responsible for the preference PPBH3-
5 has for Bcl-2 over Bcl-XL. In contrast, PPBH3-5 shows very poor affinity for the Bcl-
XL variants L108M and Q125T (4800 ± 1300 nM and > 9.5 mM) indicating that neither
of these residues confer the specificity observed. Additionally, the location of these
residues through the BH3 binding groove implies that PPBH3-5 is likely binding in the
groove in a similar manner to Bak72-87.
The binding of PPBH3-6 to the Bcl-XL variants showed very different results
from those observed with PPBH3-5 (figure 2.7 and table 2.1). This miniature protein
bound to the Bcl-XL variants with comparable affinities to that observed with Bcl-XL
(Bcl-XLA104D 6600 ± 600 nM, Bcl-XL
L108M 10,000 ± 1400 nM, Bcl-XLS122R 2900 ± 200 nM,
and Bcl-XLQ125T 12,000 ± 2000 nM). The lack of change in binding affinities despite
significant residue changes in the designed binding groove implies that PPBH3-6 is likely
not binding in the expected location. PPBH3-6 is also less well-folded into an α-helix
than PPBH3-5 which also supports an alternative binding location on Bcl-XL and Bcl-2.
(Gemperli, Rutledge et al. 2005)
2.2.6 Binding mode comparisons of natural and designed ligands for Bcl-2 and
Bcl-XL
The design and selection of paralog specific proteins is one of the key challenges
facing the field of protein therapeutics. Proteins in nature typically use large protein
surfaces to control and finely tune the selectivity of interactions. Through the

60
miniaturization of a binding epitope, potential sources of specificity may be removed
from the larger protein and its interactions. This study has analyzed the source of
specificity within a naturally occurring system and then analyzed the origins of
specificity resulting from a positive and negative in vitro selection.
Bak72-87, a naturally occurring ligand with a higher affinity for Bcl-XL over Bcl-2,
bound to three of the four variants of Bcl-XL with decreased affinity. The residues A104,
L108, and S122 in the BH3 binding groove of Bcl-XL all contribute in an additive way to
the binding specificity of Bak72-87 for Bcl-XL over Bcl-2. PPBH3-1, the designed
miniature protein ligand with a higher affinity for Bcl-XL than Bcl-2 was unable to be
fully characterized due to its poor solution behavior under assay conditions. However,
the initial experiments indicate that it likely does not use the residues involved in
conferring specificity for Bak72-87, but instead amino acid Q125 has the greatest observed
impact on specificity.
PPBH3-5 and PPBH3-6 are both designed miniature proteins, which were
actively selected for higher binding affinity for Bcl-2 using the amino acid differences in
the BH3 binding groove that are presented here. PPBH3-5 showed the same affinity for
two of the single variants of Bcl-XL (104 and 122) as it has for Bcl-2, indicating that
these two residues have a significant impact on the specificity of the miniature protein.
Conversely, the residues at position 108 and 125 do not contribute to the specificity of
PPBH3-5. These results confirm PPBH3-5 binds in the designed orientation and the
negative selection for specificity was successful. Alternatively, PPBH3-6 showed no
significant differences in binding affinity for any of the Bcl-XL variants over wt Bcl-XL
indicating that it likely does not bind in the same orientation as the natural ligand Bak72-87.

61
The panel of miniature proteins ligands for Bcl-XL and Bcl-2 are a good model of
the power available when miniaturizing a binding epitope onto a protein scaffold. The
miniature proteins have as strong or stronger affinity than the natural ligand for the target
proteins. Additionally, through careful evaluation of the differences between the two
very similar paralogs Bcl-XL and Bcl-2, a successful selection method was employed to
impart specificity to each of the target proteins despite the small size of the miniature
proteins.
2.3 Experimental Materials and Methods
2.3.1 Peptide Synthesis and Purification
Peptides were synthesized using a Symphony automated solid phase peptide
synthesizer (Protein Technologies Inc.) on a rink amide resin using standard Fmoc
chemistry. The peptides were synthesized on a 25 umol scale with a free amine at the N-
terminus and and an amide at the C-terminus. Crude peptides were purified by reverse
phase HPLC on a Vydac semi-preparative C4 or C8 column. Matrix-assisted laser
desorption-ionization time-of-flight (MALDI-TOF) mass spectrometry were used to
confirm the identity of the peptides before labeling. Some peptides required further
purification at this step using reverse phase HPLC and an analytical phenyl column.
After peptides were purified to >90%, they were fluorescently labeled at the C-terminal
cysteine using a 20-fold molar excess of 5-iodoacetamidofluorescein (Molecular Probes)
in a PBS solution with <20% dimethylformamide. Labeling reactions were incubated at
room temperature for 2 h and then purified by reverse-phase HPLC as described above.
MALDI-TOF mass spectrometry and amino acid analysis (Keck Facility) were used to
confirm the identity and concentration of the peptides.

62
2.3.2 Cloning of Bcl-XL and variants
The plasmid encoding GST-Bcl-XL was purchased from Science Reagents. The
Bcl-XL variants A104D, L108M, S122R, and Q125T were created using the site directed
mutagenesis kit (Stratagene, 200516) Primers with the following sequences and their
complements were synthesized at the Keck facility: A104D 5’-
GCGGTACCGGCGGGACTTCAGTGACCTGACATCCC-3’; L108M 5’-
CGGGCATTCAGTGACATGACATCCCAGCTCCACATCACCC-3’, S122R 5’-
CCCCAGGGACAGCATATCAGCGTTTTGAACAGGTAGTGAATGAACTC-3’,
Q125T 5’-GCATATCAGAGCTTTGAAACCGTAGTGAATGAACTCTTCCGGG-3’.
The resulting mutated plasmids were transformed into DH5α E. coli cells by
electroporation and plated on LB-amp agar plates. The plasmids from five single
colonies for each variant were isolated using the Plasmid Miniprep Kit and submitted to
the Keck facility for DNA sequencing.
2.3.3 Protein expression, purification, and characterization
The plasmids encoding for GST-Bcl-XL, and the four single mutants were
transformed using heat-shock into BL21(DE3) E. coli cells for protein expression. A
single colony was picked and incubated overnight in 10 mL of LB media with ampicillin
at 37 °C. The culture was added to 1 L of LB with ampicillin an incubated at 37 °C until
the OD600= 0.6-0.8. The cultures were then cooled to 20 °C and induced using isopropyl-
β-D-thiogalactopyranoside at a final concentration of 0.5 mM for 16-20 h. The cells
were then harvested by centrifugation at 4000x g for 20 minutes at 4 °C and resuspended
in 40 mL of lysis buffer (50 mM Tris, 150 mM NaCl, 1% Tween-20, 5 mM EDTA and 1
mM DTT). Immediately prior to lysis, 5 µg of RNAse, 100 µL of PMSF (200 mM) , and

63
60 µL of MgCl2 ( mM) were added. The cells were lysed by three passes over a French
Press and the lysate was then centrifuged at 20,000x g for 20 minutes at 4 °C. The fusion
protein was then purified from the soluble fraction by glutathione-affinity
chromatography. Proteins requiring further purification were passed over a QXL anion
exchange column (Amersham Biosciences). Proteins were buffer exchanged using
Nap25 columns (Amersham Biosciences) into protein storage buffer (50 mM Tris, 100
mM KCl, 12.4 mM MgCl2, 1 mM EDTA, 0.1% Tween-20, 1 mM DTT, pH 8.0) and
either lyophilized, or stored at -20°C with 20% glycerol. Protein identity and
concentration were determined by amino acid analysis performed by the Keck center.
2.3.4 Fluorescence polarization determination of binding affinity
Fluorescence polarization experiments were conducted using an AnalystTM AD
automated fluorescence-plate reader (LJL Biosystems, Inc., Sunnyvale CA) and 384-well
plates (Corning Costar® 384 Flat Bottom Black, Corning Inc., Big Flats NY). All
fluorescence polarization experiments were carried out in triplicate in phosphate buffered
saline (PBS) (pH 7.4) with 0.05% Tween-20. Direct binding experiments were
performed using serial dilutions of GST-fusion proteins starting at a concentration of 10-
40 µM. Aliquots of fluorescein labeled peptide were added to a final concentration of 25
nM and the plate was incubated at 4 °C for 1 h. Competition experiments were carried
out by incubating a fixed concentration of GST fusion protein with fluorescein labeled
peptide (25 nM) at room temperature for 30 minutes. Serial dilutions of unlabeled
miniature peptides were then added and incubated again for 30 minutes at room
temperature.

64
Polarization was measured by excitation with vertically polarized light (492 nm)
and measurement of fluorescence emission at 515 nm. The polarization data for direct
binding experiments were fit using Kaleidagraph v3.6 software to the equilibrium binding
equation1, derived from first principles.
Pobs = Pmin + ((Pmax – Pmin) / (2[peptideFlu]))([peptideFlu] + [target protein] + KD –
(([peptideFlu] + [target protein] + KD)2 – 4[peptideFlu][target protein])0.5) (1)
In this equation, Pobs is the observed polarization at any target protein (GST
fusion) concentration, Pmax is the maximum possible polarization value, Pmin is the
minimum observed polarization value, and KD is the equilibrium dissociation constant.
Measurements from three independent sets of samples were averaged for each KD
determination. To plot concentration of target protein versus the fraction of peptide
bound, polarization values were converted to fraction of peptideFlu bound using the Pmax
and Pmin values derived from equation 1. The fraction of peptideFlu bound data were then
fit to the equilibrium binding equation 2.
θobs = ((1 / (2[peptideFlu]))([peptideFlu] + [target protein] + KD – (([peptideFlu] +
[target protein] + KD)2 – 4[peptideFlu][target protein])0.5) (2)
In this equation, θobs is the observed fraction of peptideFlu bound at any target
protein concentration and KD is the equilibrium dissociation constant.

65
Figure 2.1: Overlay of Bcl-XL (Sattler, Liang et al. 1997) and Bcl-2 structures.
(Petros, Medek et al. 2001) Bcl-XL (teal) bound to Bak72-87 (red) and Bcl-2 (blue) were
aligned by the backbone using Insight 2000. The figure shows significant similarity in
the helix and loop placement. The backbone alignment gave an RMSD of 1.85 Å.
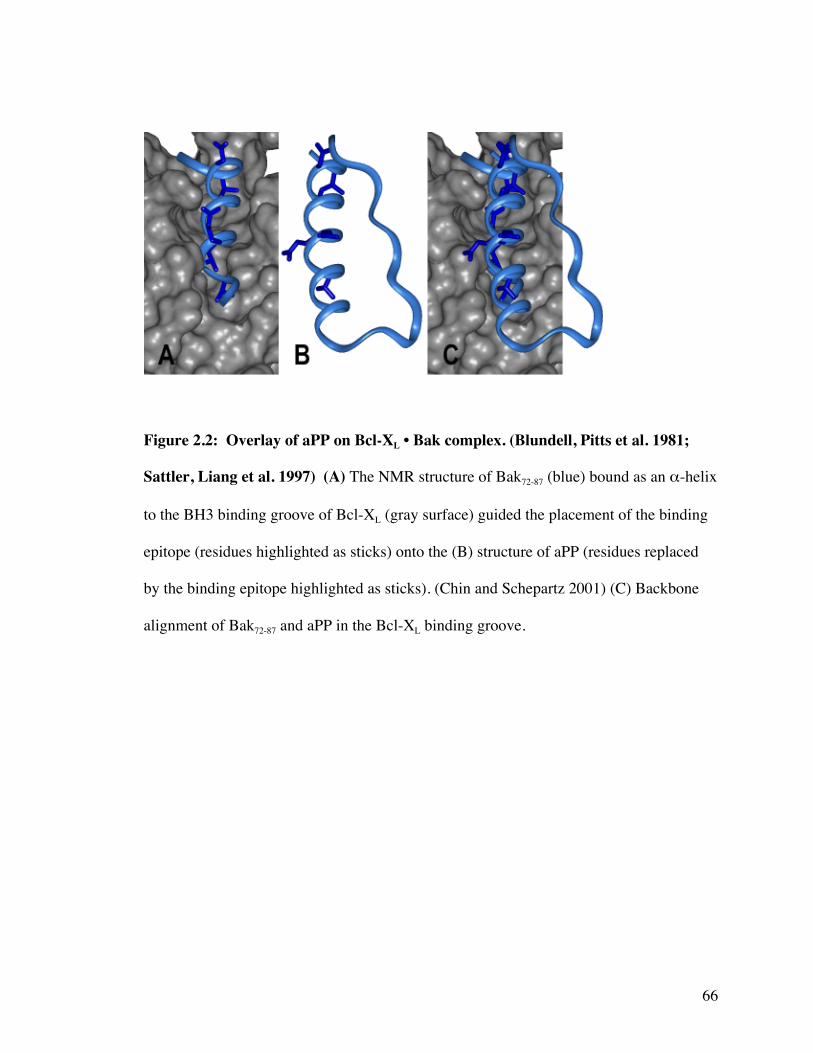
66
Figure 2.2: Overlay of aPP on Bcl-XL • Bak complex. (Blundell, Pitts et al. 1981;
Sattler, Liang et al. 1997) (A) The NMR structure of Bak72-87 (blue) bound as an α-helix
to the BH3 binding groove of Bcl-XL (gray surface) guided the placement of the binding
epitope (residues highlighted as sticks) onto the (B) structure of aPP (residues replaced
by the binding epitope highlighted as sticks). (Chin and Schepartz 2001) (C) Backbone
alignment of Bak72-87 and aPP in the Bcl-XL binding groove.

67
Figure 2.3: Sequence and library design for the development of miniature protein
ligands for Bcl-XL and Bcl-2. aPP was used as a scaffold for displaying the α-helix
binding epitope of Bak72-87 (blue residues). PPBH3Lib varied four residues (red) not
involved in binding or folding (green). The PPBH3Lib2 varied five additional residues
(purple) in areas potentially capable of imparting specificity based on binding location of
the Bcl-XL groove. (Chin and Schepartz 2001; Gemperli, Rutledge et al. 2005)

68
Figure 2.4: Selection strategy for paralog specific miniature proteins. (Gemperli,
Rutledge et al. 2005)

69
Figure 2.5: Sequence alignments of Bcl-XL and Bcl-2. (Petros, Medek et al. 2001)
(A) Residues in the non-conserved loop region are highlighted in blue. Residues that
differ between Bcl-XL and Bcl-2 and are within 5Å of Bak72-87 are highlighted in red and
those varied in following experiments are numbered. (B) Bcl-XL surface (grey) bound to
the α-helix of Bak72-87 with residues Ala104 (red), L108 (green), Ser122 (blue), and
Gln125 (orange). (C) Surface of Bcl-2 with Asp111 (red), Met115 (green), Arg129
(blue) and Thr132 (orange).

70
Figure 2.6: Circular dichroism of Bcl-XL variant proteins.. CD wavelength
dependent scans were taken of each GST-Bcl-XL variant and compared to the overall
helicity of wt Bcl-XL (black). Bcl-XLA104D (red), Bcl-XL
L108M (green), Bcl-XLS122R (blue),
Bcl-XLQ125T (orange).
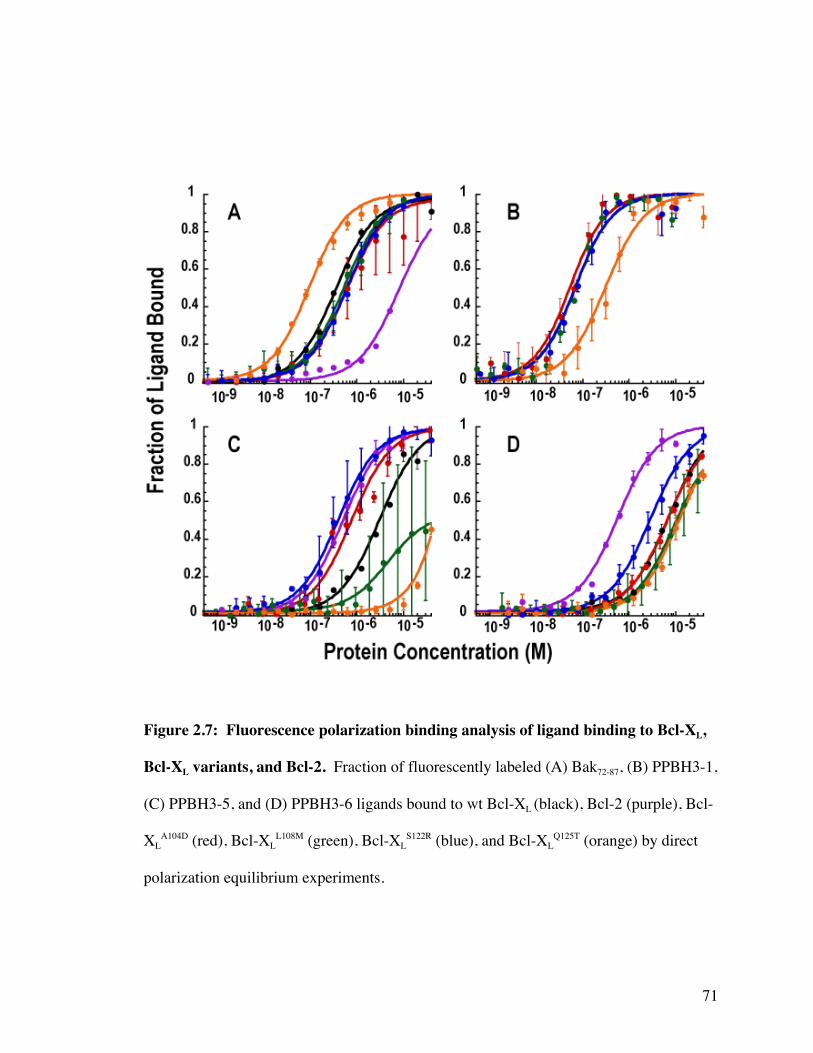
71
Figure 2.7: Fluorescence polarization binding analysis of ligand binding to Bcl-XL,
Bcl-XL variants, and Bcl-2. Fraction of fluorescently labeled (A) Bak72-87, (B) PPBH3-1,
(C) PPBH3-5, and (D) PPBH3-6 ligands bound to wt Bcl-XL (black), Bcl-2 (purple), Bcl-
XLA104D (red), Bcl-XL
L108M (green), Bcl-XLS122R (blue), and Bcl-XL
Q125T (orange) by direct
polarization equilibrium experiments.

72
Table 2.1: Equilibrium binding constants (nM) of ligands to Bcl-XL, Bcl-XL
variants, and Bcl-2.
Bak72-87 R8-PPBH3-1 PPBH3-5 PPBH3-6
Bcl-XL 340 ± 40 7 ± 2 3200 ± 600 7400 ± 900
Bcl-2 8000 ± 7000 52 ± 5 510 ± 50 560 ± 70
Bcl-XL A104D 600 ± 120 43 ± 11 77 ± 19 6600 ± 600
Bcl-XL L108M 530 ± 50 58 ± 14 4800 ± 1300 10,000 ± 1400
Bcl-XL S122R 620 ± 40 59 ± 11 390 ± 50 2900 ± 200
Bcl-XL Q125T 84 ± 11 310 ± 6- > 9.5 mM 12000 ± 2000
73
References:
Amundson, S. A., T. G. Myers, et al. (2000). "An informatics approach identifying
markers of chemosensitivity in human cancer cell lines." Cancer Research 60(21):
6101-6110.Antignani, A. and R. J. Youle (2005). "A chimeric protein induces tumor cell apoptosis
by delivering the human Bcl-2 family BH3-only protein bad." Biochemistry
44(10): 4074-4082.Blundell, T. L., J. E. Pitts, et al. (1981). "X-Ray-Analysis (1.4-a Resolution) of Avian
Pancreatic-Polypeptide - Small Globular Protein Hormone." Proceedings of theNational Academy of Sciences of the United States of America-Biological
Sciences 78(7): 4175-4179.
Chin, J. W. and A. Schepartz (2001). "Design and evolution of a miniature bcl-2 bindingprotein." Angewandte Chemie-International Edition 40(20): 3806-+.
Chittenden, T., C. Flemington, et al. (1995). "A Conserved Domain in Bak, Distinct fromBh1 and Bh2, Mediates Cell-Death and Protein-Binding Functions." Embo
Journal 14(22): 5589-5596.
Degterev, A., A. Lugovskoy, et al. (2001). "Identification of small-molecule inhibitors ofinteraction between the BH3 domain and Bcl-x(L)." Nature Cell Biology 3(2):
173-182.Gemperli, A. C., S. E. Rutledge, et al. (2005). "Paralog-selective ligands for Bcl-2
proteins." Journal of the American Chemical Society 127(6): 1596-1597.
Jiang, X. J. and X. D. Wang (2004). "Cytochrome C-mediated apoptosis." AnnualReview of Biochemistry 73: 87-106.
Kaufmann, T., S. Schlipf, et al. (2003). "Characterization of the signal that directs Bcl-x(L), but not Bcl-2, to the mitochondrial outer membrane." Journal of Cell
Biology 160(1): 53-64.
Liu, R., C. Page, et al. (1999). "Overexpression of Bcl-x(L) promotes chemotherapyresistance of mammary tumors in a syngeneic mouse model." American Journal
of Pathology 155(6): 1861-1867.

74
Motoyama, N., F. P. Wang, et al. (1995). "Massive Cell-Death of Immature
Hematopoietic-Cells and Neurons in Bcl-X-Deficient Mice." Science 267(5203):1506-1510.
Oltersdorf, T., S. W. Elmore, et al. (2005). "An inhibitor of Bcl-2 family proteins inducesregression of solid tumours." Nature 435(7042): 677-681.
Petros, A. M., J. Dinges, et al. (2006). "Discovery of a potent inhibitor of the
antiapoptotic protein Bcl-x(L) from NMR and parallel synthesis." Journal ofMedicinal Chemistry 49(2): 656-663.
Petros, A. M., A. Medek, et al. (2001). "Solution structure of the antiapoptotic proteinbcl-2." Proceedings of the National Academy of Sciences of the United States of
America 98(6): 3012-3017.
Rutledge, S. E., J. W. Chin, et al. (2002). "A view to a kill: ligands for Bcl-2 familyproteins." Current Opinion in Chemical Biology 6(4): 479-485.
Sadowsky, J. D., M. A. Schmitt, et al. (2005). "Chimeric (alpha/beta plus alpha)-peptide
ligands for the BH3-recognition cleft of Bcl-x(L): Critical role of the molecularscaffold in protein surface recognition." Journal of the American Chemical
Society 127(34): 11966-11968.Sattler, M., H. Liang, et al. (1997). "Structure of Bcl-x(L)-Bak peptide complex:
Recognition between regulators of apoptosis." Science 275(5302): 983-986.
Schmitt, C. A., C. T. Rosenthal, et al. (2000). "Genetic analysis of chemoresistance inprimary murine lymphomas." Nature Medicine 6(9): 1029-1035.
Shangary, S. and D. E. Johnson (2002). "Peptides derived from BH3 domains of Bcl-2family members: A comparative analysis of inhibition of Bcl-2, Bcl-x(L) and Bax
oligomerization, induction of cytochrome c release, and activation of cell death."
Biochemistry 41(30): 9485-9495.Simonian, P. L., D. A. M. Grillot, et al. (1997). "Bcl-2 and Bcl-XL can differentially
block chemotherapy-induced cell death." Blood 90(3): 1208-1216.Spierings, D., G. McStay, et al. (2005). "Connected to death: The (unexpurgated)
mitochondrial pathway of apoptosis." Science 310(5745): 66-67.

75
Veis, D. J., C. M. Sorenson, et al. (1993). "Bcl-2-Deficient Mice Demonstrate Fulminant
Lymphoid Apoptosis, Polycystic Kidneys, and Hypopigmented Hair." Cell 75(2):229-240.
Walensky, L. D., A. L. Kung, et al. (2004). "Activation of apoptosis in vivo by ahydrocarbon-stapled BH3 helix." Science 305(5689): 1466-1470.
Walensky, L. D., K. Pitter, et al. (2006). "A stapled BID BH3 helix directly binds and
activates BAX." Molecular Cell 24(2): 199-210.Walensky, L. D., K. Pitter, et al. (2006). "Anti-leukemic potency of stapled BH3 helices
correlates with their capacity for bifunctional activation of apoptotic pathways."Blood 108(11): 213A-214A.
Wang, D. Y., W. Liao, et al. (2005). "Binding properties of artificial a helices derived
from a hydrogen-bond surrogate: Application to Bcl-xL." Angewandte Chemie-International Edition 44(40): 6525-6529.
Wang, G. P., Z. Nikolovska-Coleska, et al. (2006). "Structure-based design of potent
small-molecule inhibitors of anti-apoptotic Bcl-2 proteins." Journal of MedicinalChemistry 49(21): 6139-6142.
Wendt, M. D., W. Shen, et al. (2006). "Discovery and structure-activity relationship ofantagonists of B-cell lymphoma 2 family proteins with chemopotentiation activity
in vitro and in vivo." Journal of Medicinal Chemistry 49(3): 1165-1181.
Yin, H., G. I. Lee, et al. (2005). "Terphenyl-based bak BH3 alpha-helical proteomimeticsas low-molecular-weight antagonists of Bcl-X-L." Journal of the American
Chemical Society 127(29): 10191-10196.
76
Chapter 3: In vivo activation of Src family kinases by encodable miniature proteins
3.1 Src family kinases and activating miniature protein ligands
The polyproline type II helix structure that comprises the N-terminus of aPP and
PYY is a widely observed structural motif in biological systems. One system that is
regulated through the binding of a PPII helix is the Src family of kinases. The kinases are
cell signaling proteins that are tightly regulated in part through the intramolecular binding
of a polyproline helix to a nearby domain. The binding motif was grafted onto the aPP
and PYY scaffold and the resulting miniature proteins were shown to bind to the kinases
and even showed in vitro activity(Zellefrow, Griffiths et al. 2006). This study examines
the ability of these miniature proteins to activate the kinases in a mammalian cell.
3.1.1 Cellular roles of Src family kinases
Protein tyrosine kinases are responsible for the tight regulation of intracellular
signaling. The proteins are involved in the reception of extracellular signals and the
subsequent initiation of downstream signaling pathways inside of the cell by simply
transferring a phosphate group from ATP to tyrosine amino acid side chains. (Alvarez,
Kantarjian et al. 2006) The Src family kinases are non-receptor tyrosine kinases (Cowan-
Jacob 2006) that regulate some of the most basic cellular functions including growth,
proliferation motility, and survival (figure 3.1). (Frame 2002) Aberrations in these
pathways are common hallmarks of cancerous cells and many Src family kinases are
overexpressed in cancerous cells leading to intense interest in the roles these kinases play.
(Yeatman 2004; Alvarez, Kantarjian et al. 2006; Li 2007)

77
The roles of each of the individual members of the Src family of kinases has been
the topic of much recent study. Src Yes and Fyn are ubiquitiously expressed and appear
to have largely redundant function. The other members of the family are expressed in
different cell types and expression levels vary depending on the cell cycle. One recent
study by Meyn et. al. highlighted the importance and the difficulties of unraveling the
individual functions of each of the kinases present in cells.(Meyn, Schreiner et al. 2005)
Embryonic stem cells were shown to express Hck, Src, Fyn, Lck, Lyn, Fgr, and Yes,
though only Hck, Src, and Fyn were constitutively expressed in self-renewing cells and
differentiation is marked by a sudden lack of transcription of Hck and Lck. Additionally,
complete inhibition of the Src family kinases by broad-spectrum small molecule
inhibitors prevents differentiation completely.(Meyn, Schreiner et al. 2005) The ability
to more specifically probe each of the individual kinases through inhibitors and activators
will allow for a more complete understanding of how these signaling molecules function
in cell differentiation as well as many other cellular activities.
3.1.2 Structure and regulation of Src family kinases
The Src family kinases all contain the conserved SH1 (or kinase domain), SH2,
and SH3 domains. Additionally, each of the kinases has an SH4 domain, which targets
the protein to the membrane and finally they each have a unique region that characterizes
each of the kinases.(Boggon and Eck 2004) The membrane-targeting region is at the N-
terminus followed by the unique region, the SH3 domain, SH2 domain, and finally the
kinase catalytic domain (figure 3.2A and B). These individual domains are involved in
the modular regulation of the kinase activity. Specifically, the SH3 and SH2 domains

78
both interact with other areas of the protein to hold the kinase in an inactive, closed state.
(Sicheri, Moarefi et al. 1997; Xu, Doshi et al. 1999)
The first mode of intramolecular regulation involves the SH2 domain binding to a
phopsphorylated tyrosine in the C-terminal tail of the protein (figure 3.2D). This tyrosine
is phosphorylated resulting in a closed inactive form of the kinase by the C-terminal Src
kinase protein (Csk)(Sondhi, Xu et al. 1998). Mechanisms of activation through the SH2
domain involve relocation of Csk (Fuss, Dubitzky et al. 2008), weakening of the affinity
of the SH2 domain for the tail (Nika, Tautz et al. 2007), or more likely a combination of
both of these mechanisms (figure 3.3).(Nika, Tautz et al. 2007)
The second mode of Src family kinase regulation relies on the intramolecular
interaction of the SH3 domain with the SH2-kinase domain linker (figure 3.2C). This
linker contains the general recognition sequence PXXP and is bound to the SH3 domain
as a polyproline type II helix.(Sicheri, Moarefi et al. 1997; Xu, Doshi et al. 1999)
Though this regulation motif is maintained across all members of the Src family kinases,
only the first proline is highly conserved and the SH3 domains of the different proteins
have varying affinities for the individual linker sequence.(Sicheri, Moarefi et al. 1997)
This difference in specificity of the SH3 domains for the linker sequences also extends to
other intermolecular targets and ligands. For instance, Nef differentially activates Hck in
vivo while showing no impact on the activity of Src, Fyn, Lyn, or Lck. (Briggs, Lerner et
al. 2000) Activation through the SH3 domain results from displacement of the SH2-linker
region by an external molecule which frequently also contains a proline rich region
(figure 3.3). (Lee, Leung et al. 1995)

79
Much study has been undertaken to elucidate the differences in relative activation
and overall outcome that results from the release of the SH3 or the SH2 interactions.
(Brabek, Mojzita et al. 2002; Lerner and Smithgall 2002; Lerner, Trible et al. 2005;
Yadav and Miller 2007)Using optimized high affinity artificial sequences for the tail or
the linker, researchers have shown that Src can be activated through only the SH3 (Lerner
and Smithgall 2002) or only the SH2 domain. (Brabek, Mojzita et al. 2002; Lerner, Trible
et al. 2005) Recent studies by Yadav et. al. have shown that the activation of Hck through
either of these intramolecular interaction has a cooperative effect on the activation
through the second domain. Additionally, many of the natural ligands for the Src family
kinases have activating regoins for both domains, likely leading to the full activation of
the kinase. (Yadav and Miller 2007) It has been speculated that potentially activation
through the SH3 or the SH2 domain may lead to different downstream biological
responses. (Stauffer, Martenson et al. 1997)
3.1.3 Miniature protein activators for Src family kinases
Though many small molecule inhibitors exist with varying levels of potency and
specificity (Alvarez, Kantarjian et al. 2006), few non-natural activators are available as
biological tools to study the Src family kinases. The aPP and PYY proteins are
particularly well-suited to serve as scaffolds for protein-based ligands for Src family
kinases due to their N-terminal polyproline type II helices (Figure 3.4A). (Blundell, Pitts
et al. 1981; Lerch, Mayrhofer et al. 2004) The SH2-kinase linker binds to the SH3
domain through the PXXP motif that is also present in aPP and PYY, which allowed
Zellefrow et. al. to simply optimize the already available polyproline helix sequence for
binding to the SH3 domains of various Src family kinases. (Zellefrow, Griffiths et al.

80
2006) Additionally, because the SH2-kinase linker sequence varies among the Src family,
the set of miniature proteins had the potential to show specificity in the binding affinity
and activation of the Src family kinases. (Briggs, Lerner et al. 2000)
An SH3 binding peptide developed by Schreiber and co-workers (Feng, Kasahara
et al. 1995) through a phage-display selection (hereafter referred to as Peptide 1) was
grafted onto the N-terminus of aPP and PYY in various registers (figure 3.4B). The
resulting family of peptides was tested for binding affinity to the purified SH3 domains of
five Src family kinases (Src, Hck, Fyn, Lck, and Lyn). All of the miniature proteins
bound with similar affinity to the SH3 domains as did the precursor sequence Peptide 1
(Figure 3.5). However, the miniature proteins showed greater differences in affinity
between different Src family kinases than did peptide 1, which bound to each of the
kinases tested equally except for a significantly decreased affinity for Lck. (Zellefrow,
Griffiths et al. 2006)
The miniature proteins were also tested for their ability to activate full length Hck
kinase in vitro. (Zellefrow, Griffiths et al. 2006) Using a fluorescence coupled enzymatic
assay, it was shown that both PP2 and YY2 were able to activate Hck with about half of
the potency of the naturally occurring activator Nef (figure 3.6). It is also interesting that
YY1 was actually a very poor activator of Nef in vitro indicating again that the set of
miniature protein ligands for Src family kinases may be useful probes for differentiating
the specific activity of the different kinases. (Zellefrow, Griffiths et al. 2006)
Though the miniature proteins were shown to be in vitro activators of Hck, their
relative potency for activation did not correspond to their relative affinity for the isolated
SH3 domains. This inconsistency may be due to a number of factors including artifacts

81
from the in vitro assay or differences in the affinity or binding mode for the SH3 domain
as compared to the full-length kinase. Crystal Zellefrow explored the affinity of the
miniature proteins for the full-length kinase, while this study examines the ability of the
miniature proteins to activate the kinases in the more realistic environment of a
mammalian cell.
3.1.4 In vivo activation studies
The most well-studied non-substrate activator of a Src family kinase is the HIV
protein Nef and its interaction with Hck. Nef contains a PXXP motif through which it
binds to the SH3 domain of Hck and displaces the SH2-kinase linker region resulting in
an activated form of Hck(Moarefi, LaFevreBernt et al. 1997). The discovery of the Nef
protein as a non-substrate Hck SH3-activator has allowed for more targeted studies to
understand the role and mechanism of SH3-activation of the Src family of kinases.
(Briggs, Lerner et al. 2000; Lerner, Trible et al. 2005)
Activation of the Src family kinases through either the SH2 or the SH3 domain
results first in the autophosphorylation of tyrosine (Y416 in Src) on the activation loop
(figure 3.3). (Yamaguchi and Hendrickson 1996) This autophosphorylation opens up the
catalytic site allowing for binding of the substrate and ATP. Detection of the
phosphorylated activation loop tyrosine has proven to be a simple and straightforward
method for measuring activated kinase. Lerner et. al. showed that phosphorylation of
the activation loop (Y416 using human Src numbering) can be differentiated from the
phosphorylated tail tyrosine by using an antibody specific for the activation loop. The
specificity of the loop antibody was confirmed using standard [γ-P32]ATP incorporation
and tryptic phosphopeptide mapping. Additionally, they were able to use a non-specific

82
pTyr antibody and detect both overall increases in phosphorylation of cellular proteins
and an increased phosphorylation signal for the kinase. (Lerner and Smithgall 2002)
Additional downstream events resulting from activated kinase have been
monitored in other in vivo assays of Src family kinase activation and may provide
additional routes to measuring in vivo activation of Src family kinases by miniature
proteins. Specifically, the role of the kinases in cellular motility and the cytoskeleton was
exploited by Sharma et. al. to determine the activation potential of the Tau protein.
Fibroblasts stimulated by PDGF show a loss of actin stress fibers, which return 5-7h after
stimulation. However, in the presence of either constitutively active Src or Tau, the actin
stress fibers do not return. (Sharma, Litersky et al. 2007) Activation of Hck by Nef has
recently been shown to interfere with cell proliferation and macrophage differentiation
through the macrophage colony-stimulating factor signaling pathway. Significant
changes in cell morphology, adherence, and phgocyticnature were all used to indicate
increased levels of Hck activity in the presence of Nef. (Suzu, Hiyoshi et al. 2006) Src’s
role in cellular proliferation allowed Fresno-Vara et. al. to monitor Src activation simply
through increased levels of transcription via [3H]Thymidine and BrdU incorporation.
(Vara, Caceres et al. 2001)
3.2. In Vivo analysis of miniature protein activation potential for Src and Hck
Kinase
The previously published in vitro findings indicated that binding affinity of the
miniature protein ligands to the isolated Hck SH3 domain does not correspond with the in
vitro activation of the full-length Hck kinase. (Zellefrow, Griffiths et al. 2006) Two
potential explanations for this observation were explored in further studies. Crystal

83
Zellefrow was able to correlate the binding affinity of the miniature proteins to the SH3
domains of Hck and Src and the binding affinities of the miniature proteins for the
respective full-length kinases. This study explores the ability of those miniature proteins
to activate the kinases in the more realistic environment of a mammalian cell as opposed
to the previously published in vitro activation assay, which used purified Hck kinase.
3.2.1 Selection of expression vector, cell lines and activation assay
Previous studies exploring the activation of Hck by the Nef protein were primarily
carried out in mouse or rat fibroblasts (Briggs, Sharkey et al. 1997; Lerner and Smithgall
2002; Choi and Smithgall 2004), which contain no endogenous Hck kinase. (Choi and
Smithgall 2004) Additionally, a mouse fibroblast line that is a knockout for Src, Yes, and
Fyn (SYF fibroblasts) was commercially available along with the same knockout cell line
stably transfected with the Src gene. (Klinghoffer, Sachsenmaier et al. 1999) Therefore,
the SYF-cSrc commercially available cells were used for the Src activation and NIH-3T3
mouse fibroblasts were used for the Hck activation experiments. Additionally, a stable
transfection of the NIH-3T3 cells expressing 09-Hck was created for use in the Hck
activation experiments as well.
In order to take advantage of the encodable nature of the miniature proteins, a
mammalian expression vector was selected for cloning of both Hck and the activating
ligands. The pCruz09 expression vector selected contains a CMV promoter (constitutive
overexpression of the gene), a neomycin resistance gene, a kanamycin resistance gene, a
prokaryotic origin of replication, and a small peptide epitope tag (09 =
MKAEFRRQESDR). The vector was used in both transient and stable transfections and
was also cloned and amplified in E. coli. Additionally, both monoclonal and polyclonal

84
antibodies for the epitope tag (anti-09) were purchased for western blots,
immunoprecipitation, and immunohistochemistry.
Previous experiments measuring the activation of Hck by Nef used transient
transfections of both Hck and Nef and measured activity of the Hck kinase through
increases in phosphorylation. (Murakami, Fukazawa et al. 2002) Activation of Src
through either SH2 or SH3 domains results first in the autophosphorylation of tyrosine
416 and then subsequently the phophorylation of other downstream proteins. These
phosphorylation events are the most direct read-out for increased Src activity, are widely
used in the Src family kinase field, and were therefore used for the initial activation
assays presented herin. Antibodies specific for phosphorylated Y416 on the Src
activation loop are commercially available and are known to cross-react with other
activated Src family kinases. Additionally, non-specific pTyr antibodies have been used
to detect increases in overall phosphorylation levels as well as increases in the
phosphorylation levels of the kinase. Positive and negative controls for Src and Hck
were used to optimize experimental conditions and to confirm the phosphorylation read-
out by western blot (Table 3.1). Specifically, a kinase dead variant (Src K296R and
K296 E, Hck K295D), a variant with a loop that can’t be phosphorylated (Src Y416F,
Hck Y411F), an SH2-activated variant (Src Y528F, Hck Y522F), an SH3 mutated variant
that can’t bind to polyproline type II helices (Src P133L), and SH3-activated variants (Src
P246AP250A, Src P263A). (Lerner and Smithgall 2002; Peng and Schoenberg 2007)
3.2.2 Creation of an NIH-3T3 cell line stably expressing Hck kinase
Preliminary experiments using a transient transfection of pCruz09-Hck showed
varying levels of Hck expression between different trials and between Hck mutants. In
order to more easily standardize the activation results across multiple day and trials, a
stable transfection with the Hck and Hck mutants was attempted. A stable transfection
through antibiotic selesction was initiatied with pCruz09-Hck, pCruz09-HckK256D-,
85
pCruz09-HckY411F, pCruz09-HckY522F, and pCruz09-Nef. The cells were transfected using
Lipofectamine 2000 and then allowed to grow for 72h. Based on previous experiments
using a pCruz09-lacZ reporter, significant protein expression occurs within 72 hours, so it
was expected that cells containing the pCruz09-Hck plasmids would be expressing the
neomycin resistance proteins within that time frame. Two different concentrations of
Neomycin (1 mg/mL and 0.5 mg/mL) were added to identical wells at this time to
identify the most effective antibiotic concentration for future experiments.
Significant cell death was observed in all wells within two weeks post-antibiotic
for the cells at the higher concentration of neomycin. The cells grown in the lower
neomycin levels had a much lower death rate and took almost three weeks until all of the
cells in the untransfected wells finally died. The cells were redistributed across the
surface of the plate or passaged as needed depending on growth rates. After 4 weeks of
growth, a sample from each transfection and each concentration of neomycin was tested
by Western blot for exression of the 09-tagged Hck kinase (figure 3.7). Based on the
western blot, the cells grown in the presence of 1 mg / mL of neomycin had higher levels
of kinase expression than those grown at the lower concentration. Additionally, even
variants of Hck that had been difficult to express using transient transfections (09-
HckK256D) showed strong expression in the stable transfections. However, the 09-HckY411F
showed very little protein expression and was not used in future experiments. The cells
with a positive protein expression result (09-Hck, 09-HckK256D, 09-HckY522F, 09-Nef) were
cryopreserved for future experiments.
3.2.3 In vivo activation of Hck by miniature protein ligands

86
Activation of Hck in a cellular environment was monitored through the increase
in phosphorylation of the Hck kinase using a non-specific pTyr antibody. The levels of
overall 09-Hck protein expressed were held consistent by starting the experiments with
cells from the same population of NIH-3T3-09-Hck cells. These cells were transiently
transfected with plasmids containing the activating ligands (09-Nef, 09-PP1, 09-PP2, 09-
PP3, 09-YY1, 09-YY2, 09-YY3) and allowed to grow for 96 hours post-transfection.
Lysates from these cells were analyzed by Western Blot and probed with a combination
of anti-09, anti-actin, and anti-pTyr (4G10 clone). The membranes probed with both
anti-actin and anti-pTyr were analyzed with Image J software by measuring the integrated
pixel density of the actin band for protein loading normalization and the integrated pixel
density of the phosphorylated Hck band was used to report the activation signal. These
experiments were repeated four times and the results are presented in figure 3.8 and 3.9
and table 3.2.
The activation potency of each miniature protein was measured as a fold increase
in phosphorylation of Hck over cells with no activating ligand. Nef served as a useful
known Hck SH3 ligand activator in each of these experiments. The Hck phosphorylation
levels when activated with Nef are above those of Hck alone in trials 1, 2, and 4, with an
average of 1.41 fold increase ± 0.30 over the four trials. The Nef2PA variant contains two
point mutations of proline to alanine in the SH3 binding region of Nef and decreases the
activity of Nef significantly in vivo. (Briggs, Sharkey et al. 1997) In each of the trials
presented below except for trial 2, Nef2PA did show less activity than wild type Nef and
has an overall average activation of 1.17 fold ± 0.18 (Figure 3.9 and table 3.2).

87
Inconsistent trends and different relative levels of activation among the trials with the
positive and negative controls were early indicators of a non-optimal assay (figure 3.8).
The variation among trials for the activation of Hck is even more apparent with
the miniature protein activators. Potential trends appear to indicate that YY2 may be a
successful activator of Hck (mean 1.29 ± 0.21 fold activation). Additionally, PP1 and
PP2 show promise in two of the four studies as potential activators of Hck, although the
mean activation levels (1.16 ± 0.17 and 1.19 ± 0.17 respectively) are comparable only to
Nef2PA. The mean activation levels for PP3 and YY3 (1.03 ± 0.22 and 1.07 ± 0.22
respectively) indicate that the ability of these two molecules to activate Hck is low (figure
3.9 and table 3.2). The difference in trends and overall activation levels between trials
again confirms that this assay is not ideal for measuring activation of Hck using either the
positive control Nef or the miniature proteins. The overall ability of the miniature
proteins to activate Hck appears to be above baseline and indicates that further study with
optimized assays may confirm the potential of miniature proteins as selective in vivo Hck
activators.
3.2.4 Activation of Src by miniature protein ligands
In order to measure the activation of Src alone, it was necessary to use a cell line
with little or no basal levels of Src kinase. A commercially available mouse fibroblast
knockout for Src, Yes, and Fyn (SYF cell line) was used for all Src activity studies. For
initial studies using the positive and negative control Src variants, the SYF cells were
transiently transfected with the Src mammalian expression plasmid. However, again
differences in protein expression levels for different Src variants and different
transfection trials were observed. In order to more accurately control the amount of Src

88
present in each cell for the activation studies, a commercially available SYF cell line in
which Src has been reintroduced as a stable transfection was used. (Klinghoffer,
Sachsenmaier et al. 1999)
Initial Src activation experiments using the experimental scheme outlined for Hck
activation (detection of increases in activity via increased phosphorylation of the kinase)
showed inconsistent and low signal for all ligand activators with Src.
Immunoprecipittation experiments were explored for the ability to increase the specificity
and intensity of the signal observed by Western blots. A panel of immunoprecipitations
followed with detection by Western Blot was carried out using a panel of antibodies
including anti-Src, anti-09 (the epitope on the activating ligand), and anti-SrcpY411. The
only combination that showed significant signal with distinguishable differences in the
levels observed for Src alone and Src with activators were the immunoprecipitations with
the anti-SrcpY411 followed by Western blot and detection with the anti-Src antibody.
Additional optimization of the assay led to an ideal ratio of 300:3 for µg of total protein
lysate to µL of anti-SrcpY411. The final experiments were repeated four times,
quantified using Image J, and the results are presented and summarized in Figure 3.10,
3.11, and table 3.3.
No external positive control activator for Src was used in these experiments as no
non-substrate activators specific for Src have a literature precedent. Nef has been shown
to have significant binding affinity in vitro for the Src SH3 domain, but Smithgall and co-
workers did not see any significant activation of Src by Nef in vivo. (Briggs, Lerner et al.
2000) Nef was included in the following Src activation experiments, but was not
expected to show significant activity.

89
The results from the active Src immunoprecipitation, much like the results
observe in the Hck activity assays, show significant variation among trials with no
obvious reproducible trends or activity levels (Figure 3.10). Upon averaging the four
trials, it does appear that PP1, PP2, PP3, YY1, and Nef activate Src above the basal level
of activity observed (1.29 ± 0.28, 1.31 ± 0.20, 1.62 ± 0.56, 1.35 ± 0.11, and 1.23 ± 0.22
respectively). However, even for these observations, the error is quite large and does not
allow for definitive conclusions. The high apparent activation of Src by PP3 (1.62 ±
0.56) is promising as it also has the greatest in vitro affinity for Src, however the
individual trials show significant activation by PP3 in two trials and then actually a
lowering of activity in the other two trials again limiting the ability to draw significant
conclusions from these experiments (figure 3.11 and table 3.3). Further assay
development may allow for the true activation ability of these miniature proteins for Src
to be measured with greater accuracy and reproducibility.
3.2.5 Potential assay optimization strategies
The western blots presented in Figures 3.8 and 3.10 both show high background
levels of Src and Hck activity even in cells with no additional activating ligands added.
This high background changes between trials and decreases the dynamic range of
phosphorylation levels able to be observed using the methods presented in this study.
Therefore, further assays need to either reduce the background signal by inhibiting basal
Src activity or using a different readout for Src activity than the autophosphorylation of
the tyrosine in the activation loop.
Most small molecule inhibitors and activators have been assayed by increased
phosphorylation levels using similar methods to those presented in this study. (Lerner and

90
Smithgall 2002; Meyn, Schreiner et al. 2005; Sharma, Litersky et al. 2007) However,
these studies benefit from being able to keep the cells in a serum-starved state with Src
family kinase inhibitors until the small molecules are added to the cellular environment.
Due to the rapid internalization of these molecules, changes in Src activity can be
observed in as little as 20 minutes after addition of the ligands. (Suzu, Hiyoshi et al.
2006; Peng and Schoenberg 2007) By relying on encodable methods for introducing the
miniature proteins to the cells, the timing of the activation and the subsequent signal
read-out is limited and is likely being averaged by the growing cells normal processes.
There is a literature precedent in the Nef literature for the use of an encodable activator
being added through a transient transfection and then being read through increases in
phosphorylation levels, but so far has not been reproducible in the experiments presented
here. (Murakami, Fukazawa et al. 2002) Potential solutions to decreasing the background
activity of Src include serum starvation post-transfection or addition of a Src family
kinase small molecule inhibitor during translation of the SH3-ligand activators.
Additionally, using a cell-permeable version of the miniature protein or other cell-
internalization mechanism would allow for a sudden and controlled addition of the
activators to the cellular environment and potentially provide a greater range for
differentiation between cells with and without activators.
Recent studies have made use of downstream Src activity read-outs as methods
for measuring the potency of Src family activators and inhibitors. Specifically, the
involvement of Src family kinases in cell growth, differentiation, and rearrangement of
the cytoskeleton each have been analyzed in the presence of known activators. (Vara,
Caceres et al. 2001; Suzu, Hiyoshi et al. 2006; Sharma, Litersky et al. 2007) Potentially,
91
the kinase activation resulting from the miniature protein ligands may be further
amplified in a down-stream physiological response and therefore decreasing the
ambiguity observed in the direct autophosphorylation western blot assays.
3.3 Experimental Materials and Methods
Antibodies purchased from Santa Cruz Biotechnology, Inc. (Santa Cruz, CA) include
anti-Cruz Tag 09 (A-12, sc-8600), anti-actin (rabbit I-19 monoclonal, sc-1616R), anti-c-
Src (mouse monoclonal B-12, sc-8056), mouse anti-goat-HRP conjugate (sc-2354),
mouse anti-rabbit-HRP (sc-2357), From Millipore mouse anti-pTyrosine (4G10,
05321MI) was purchased. Invitrogen supplied rabbit anti-Src(pY418) (cat #44660-G)
The rabbit anti-mouse-HRP conjugate antibody was purchased from Sigma (cat #A9044).
The pCruz-09 mammalian expression vector (sc-5040) and Protein A/G Plus Agarose
(sc-2003) were purchased from Santa Cruz biotechnologies. The plasmid containing the
c-Src gene was obtained from Dave Austin (while at Yale University). The Hck gene
was extracted from a pFastBac vector and the Nef gene was extracted from a pGex vector
both obtained from Dr. W. Todd Miller (SUNY-Stonybrook). All DNA sequencing and
oligonucleotide synthesis was performed at the W.M. Keck Foundation Biotechnology
Resourse Laboratory at Yale University School of Medicine.
3.3.1 Construction of Hck and Src expression plasmids
Oligonucleotide primers were ordered from the W.M. Keck facility at Yale
University to amplify and extend the Hck gene with a 5’ EcoR1 and a 3’ Not 1 restriction
site. The amplified gene product was confirmed and purified by agarose gel
electrophoresis. The Hck gene and the pCruz09 plasmid were digest using the restriction
enzymes EcoR 1 (New England Biolabs, cat # R0101S) and Not 1 (NEB, cat #R0189M)

92
simultaneously in the supplied Ecor 1 buffer supplemented with BSA at 37 °C for 4h.
The digested products were purified by gel electrophoresis. The Hck gene insert and the
digested linear pCruz09 were combined in a 2:1 molar ratio with 1 µL of T4 DNA ligase
(NEB, #M0202), placed on ice, and allowed to come to room temperature over 12h. Half
of the reaction mixture was transformed into chemically competent XL-10 Gold
Ultracompetant cells (Stratagene, #200315) and successful ligations were selected using
Kanamycin resistance. Resulting colonies were characterized for complete ligation of the
Hck gene in pCruz09 by DNA sequencing carried out by the Keck facility. The correct
plasmid sequence was further amplified using the QiaFilter Plasmid Maxi kit (Qiagen,
#12262), The resulting plasmid stock was confirmed again by sequencing, the
concentration was determined by UV spectroscopy, and the stock was stored at –20 °C.
The Hck mutants (K295D, Y411F, Y527F) were made using the pCruz09-Hck
plasmid and site directed mutagenesis. The oligonucleotide primers containing the
desired mutations were purchased from the W.M. Keck facility at Yale and dissolved to a
final concentration of 1 mM. The site-directed mutagenesis reactions were carried out
according to the Quikchange ® manufacturers directions (Stratagene, #200516). Eight
microliters of the mutation reactions were transformed into XL-10 Gold Ultracompetant
cells and Kanamycin resistance was used to select for transformed cells. Cells
containing the desired mutations were selected after DNA sequencing at the Keck
facility. The correct plasmid sequence was further amplified using the QiaFilter Plasmid
Maxi kit. The resulting plasmid stock was confirmed again by sequencing, the
concentration was determined by UV spectroscopy, and the stock was stored at –20 °C.

93
The Src vector used was originally from Upstate Biotechnology and contained the
mutation Y529F. The Austin group removed that mutation and gave it to us. Further
point mutations (K296R, K296E, Y418F, Y528F, P133L, P246AP250A, and P263A)
were made using the same site-directed mutagenesis procedure out lined above for
making the Hck mutants. The final plasmid stocks were sequenced by the Keck facility
followed by UV concentration determination and storage at –20 °C.
3.3.2 Construction of Activating Ligand expression plasmids
The activating ligands (Nef, Nef2PA, PP1, PP2, PP3, YY1, YY2, YY3) were also
cloned into the pCruz09 expression vector using the same EcoR1 and Not1 sites used to
clone Hck into the vector. The gene for Nef was removed from a pGex bacterial
expression vector using already present EcoR1 (5’) and Not1 (3’) restriction sites,
agarose-gel purified and inserted into the pre-cut pCruz09 mammalian expression vector
using the same procedures outlined in the preceding section. The less active Nef mutant
Nef2PA was made using site-directed mutagenesis to change the proline72 and proline75
to alanine.
The sequences for the miniature protein activators were derived from the
sequence of PP1 and YY1 in the pCANTAB vector obtained from Crystal Zellefrow.
The sequences had a 3’ Not1 site, but the 5’ EcoR1 restriction site had to be inserted
using site-directed mutagenesis. The sequences for PP1 and YY1 were cut out of the
pCANTAB vector, gel purified, and ligated into the cut pCruz09 vector. The PP1 and
YY1 sequences had been optimized for expression in phage so some of the codons were
non-optimal for a mammalian expression system. Optimal mammalian codons were
added using two rounds of site-directed mutagenesis and simultaneously a stop codon

94
was added to the 3’ end of the miniature protein sequence. Finally, PP2, PP3, YY2, and
YY3 were generated from PP1 and YY1 respectively using a final round of site-directed
mutagenesis. All rounds of mutagenesis were analyzed by DNA sequencing and the final
miniature protein containing plasmids were further amplified using the QiaFilter Plasmid
Maxi kit. The resulting plasmid stocks were confirmed again by sequencing, the
concentration was determined by UV spectroscopy, and the stock was stored at –20 °C.
3.3.3 Stable transfection of NIH-3T3 cells with pCruz-09 Hck and mutants
NIH-3T3 cells (ATCC, #1658) were seeded at 1 x 10⁻⁵- cells per well in a six well
plate and allowed to adhere for 24 hours. The cells were then transfected with 1 µg of
pCruz09-Hck (or a mutant of pCruz09-Hck). The DNA is combined with 100 µL of
serum-free DMEM (ATCC, #30-2002) while simultaneously, 2 µL of Lipofectamine
2000 ® (Invitrogen, #11668-019) was incubated at room temperature for 5 minutes in an
additional 100 µL of serum free DMEM. The DNA solution and Lipofectamine solution
were combined and incubated at room temperature for 20-25 minutes. The cells were
prepared by replacing the growth media with 800 µL of fresh serum containing DMEM
and the DNA:lipofectamine mixture was added to the well. The cells were incubated at
37 °C and 5% CO2 for 3-5 hours, at which time, the mixture was replaced with 5 mL of
complete DMEM. A mock transfection (Lipofectamine with no DNA) was prepared in
addition to transfections with pCruz09-Hck, HckK256D, HckY411F, HckY522F, and Nef. The
transfected cells were then allowed to grow for three days in complete medium under
normal growth conditions. Three-days post-transfection the cells were treated with
1mg/mL of Neomycin (G418, Roche, # 04727878001).

95
Each well in the plate experienced rapid, and extensive cell death within 3 days.
The media (with antibiotic) was changed every 3-4 days to remove dead cells and two-
weeks post-transfection, colonies of healthy, adherent cells began to appear. Cells were
trypsinized and resuspended as needed to evenly distribute the cells across the surface of
the plate. Ultimately, the cells were transferred to larger flasks until enough cells were
obtained for analysis and cryo-preservation.
Analysis of the cell populations was carried out using the standard protocol
outlined below for a direct western blot. The cells transfected with pCruz09-Hck,
HckK256D, HckY522F, and Nef were frozen down at a concentration of 3 x 10⁻⁵ cells/mL in
complete growth medium supplemented with 5% DMSO. The cells were grown without
the presence of Neomycin for 2 days before cryopreservation and were also resuscitated
without any antibiotics. The cell cultures were checked for continued neomycin
resistance approximately once a week by adding 1 mg/mL antibiotic for 2 days.
3.3.4 Transient transfection and cell lysis.
Cells were seeded at 5 x 10⁴ cells per well in a six well plate followed by
incubation for 18-24 hours. Cells expressing c-Src or 09-Hck were transfected with 1 µg
of an activating ligand plasmid. The DNA was diluted in serum-free DMEM (100 µL)
while simultaneously, Lipofectamine 2000® (2 µL) was incubated in an additional 100
µL of serum free DMEM (room temperature for 5 min). The DNA solution and
Lipofectamine solution were combined and incubated (room temperature, 20-25 min.)
The cells were prepared by replacing the growth media with fresh serum-containing
DMEM (800 µL) and the DNA:lipofectamine mixture was added to the well. The cells
were incubated for 3-5 hours (37 °C, 5% CO2) followed by replacement of the

96
transfection solution with 5 mL of complete DMEM. The cells were then grown under
normal growth conditions for an additional 96 hours.
The cells were harvested by washing each well with PBS (2x, 2mL) followed by
incubation with 0.25% trypsin (0.5 mL, room temperature, 5 min). The cells were then
supplemented with complete media (5 mL), transferred to a conical tube, centrifuged
(500g, 5 min, 4 °C) and washed with cold PBS (1x, 5 mL). The cells were lysed by
resuspending the washed cell pellet in Phosphosafe cell lysis buffer (100 µL, Novagen,
#71296-4) supplemented with a Roche complete protease tablet (1/4 of a mini tablet per
1.8 mL of lysis buffer, #11873580001) and incubated for 15-120 minutes at 4 °C. The
cell debris was removed by centrifugation (16k x g, 5 min) and the clarified cell lysates
were removed. The lysates were either used immediately or flash frozen and stored at -
20°C until future use.
3.3.5 Direct western blot for Hck activation
Cell lysates were stored (or thawed) on ice and total protein concentrations were
determined using the BCA assay (Biorad, #500-0113) with BSA for the standard curve.
Samples were diluted with lysis buffer if required to a final concentration of 20 µg total
protein in 20 µL of lysis buffer. Denaturing loading buffer (a 4x concentration, 400mM
Tris-HCl pH 6.8, 8% SDS, 0.4% bromophenol blue, 40% glycerol, 400mM β-
mercaptoethanol) was added to each sample and they were then heated (95 °C, 5 min.)
The lysates were then resolved by electrohporesis using polyacrylamide pre-cast mini-
gels (10-20% gradient). The gels were Western Blotted using PVDF membranes
(Hybond P, GE Healthcare, RPN303F) in pre-chilled Towbin transfer buffer (25mM Tris,
97
192mM glycine, 15% methanol) at 37V for 1.5 h. After transfer, the membranes were
either used immediately or dried in methanol and stored dry at 4 °C.
Dried membranes were re-wetted for in methanol (30 s), quickly washed with
Millipore water, and then washed in TBS-T (10mM Tris pH 8, mM NaCl, and 0.05%
Tween-20, 50 mL) for 10 minutes. The membranes were blocked in a 3% milk-TBST
solution (30 mL, 1h) at room temperature. The primary antibodies were added to the
blocked membranes (1:500 antibody in 4 mL of 3% milk-TBST) and incubated with
agitation (1h, room temperature.) The primary antibodies used in these experiments were
goat polyclonal anti-09 with rabbit anti-actin and mouse anti-pTyr, with mouse anti-actin.
After the primary antibody incubation, the membrane was washed quickly with TBS-T
(2x, 10 mL) followed by a 15 min wash (1x, 100 mL). Appropriate secondary antibodies
(1:30,000) were added in 3% milk-TBST (15 mL) for 1h with agitation at room
temperature. The membranes were washed quickly in TBS-T (2x, 10mL), followed by a
longer wash (15 min, 100 mL), and finally, four quick washes with Millipore water (50
mL).
The membranes were developed using the ECL Plus Western Blotting Detection
Reagents (GE Healthcare, #RPN2132). The mixed detection reagents were pipetted onto
the surface of the membranes (2 mL per membrane) and incubated at room temperature
(5 min). Excess reagent was drained, the blots were allowed to dry completely, and then
were imaged using the Storm (blue fluorescence/chemifluorescence, 1000 PMT volts,
100 microns, pressed).
3.3.6 Immunoprecipitation for activated Src
98
Cell lysates were stored (or thawed) on ice and total protein concentrations were
determined using the BCA assay with BSA for the standard curve. Samples were diluted
with lysis buffer if required to a final concentration of 300 µg total protein in at least 200
µL of total volume. The Src pY418 antibody (3 µL, Invitrogen, #44660G) was added to
each immunoprecipitation and incubated with end-over-end agitation (4 °C, overnight).
Protein A/G Plus agarose beads (40 µL) were added to each sample and incubated again
with light agitation (4 °C, 4h). Samples were then transferred to spin columns (#),
washed (4x, 400 µL each) with cold lysis buffer (50mM Tris pH 8, 150mM NaCl, 0.5%
NP-40, 5mM EDTA). Samples were then eluted in boiling 2x SDS loading buffer (80
µL).
Immunoprecipitations were analyzed by Western blot using the protocol outlined
in the previous section. Initial western blots were run using 20 µL of the elution,
however, additional blots using only 10 µL of elution were run if the signal from the
higher concentration gave incomplete resolution of the light chain antibody band used for
loading normalization. Blots were probed with a monoclonal anti-Src antibody (1:500) in
TBS-T with 3% milk as a blocking agent. The secondary antibody (anti-mouse-HRP)
was used in a 1:30,000 dilution. Detection was carried out using the procedure outlined
above.
3.3.7 Analysis of Western Blots using Image J
The file generated from the Imagequant software (file extension .gel) was opened
directly in Image J. The image was then cropped to include only the membrane of
interest, and the background was subtracted using the rolling ball (75 pixel radius) giving
a light background (white area given an assigned pixel value of 0.) Then the

99
measurements menu was opened and area, mean grey value, and integrated density were
selected to be shown for each measurement taken. The ROI manager was used to gather
the coordinates of all of the bands of interest. Each band was outlined using the polygon
draw tool and the shape drawn was copied and used for other bands if the bands were the
same overall shape. All of the bands of interest (Hck and actin for the Hck assay and Src
and the antibody light chain for the Src assay.) are outlined, measured, and the data was
exported to excel for further manipulation. All quantification values were compared
visually to the original blots to ensure the band selection, measurement and data transfer
were performed correctly.
The integrated density for each band was used for all further measurements. The
density of the kinase band was divided by the corresponding density of the loading
control band (actin for Hck and antibody light chain for Src). Then the concentration
corrected density value for each activator was divided by the concentration corrected
density of Hck or Src alone with no activators. This corresponds to a relative fold
activation of kinase with the baseline being Hck or Src alone (value = 1). Four trials
were averaged and the standard error was calculated as the standard deviation divided by
the square root of the number of trials (4 for this study). For the bar graphs in Figure 3.9
and 3.11 all values were decreased by one to shift the y-axis baseline to 0 for visual
clarity.

100
Figure 3.1: Biological roles of Src family kinases. Src family kinases are involved in
regulating intracellular signaling through growth factors (GF) and growth factor receptors
(GFR). Activation of the Src family kinases initiates downstream signaling pathways
that regulate cellular proliferation, growth, survival, and migration. Adapted from (Frame
2002)

101
Figure 3.2: Structure of Hck (Sicheri, Moarefi et al. 1997) and Src (Xu, Harrison et
al. 1997) kinase. The structures of Hck (A) and Src (B) kinase in the closed, inactive
conformation. Te kinases are composed of the SH1 or kinase domain (gold), SH2
domain (green), and the SH3 domain (blue.) (C) THhe SH3 domain of Src binds to the
SH2-kinase linker (black) through a polyproline type II helix motif. (D) A
phosphorylated tyrosine on the C-terminal tail (black) of Src binds to the SH2 domain.

102
Figure 3.3 Mechanism for the two modes of Src family kinase activation .
The Src family kinases are held in the inactive confirmation through two separate
intramolecular interactions which can be disrupted to lead to an activated kinase. The
SH2-kinase linker binding to the SH3 domain can be interrupted by a protein with a
polyproline type II helix (i.e. Nef or a miniature protein) resulting in SH3 activation. The
kinase can be SH2 activated either through dephosphorylation of the tail or through a
higher affinity peptide sequence displacing the phosphorylated tail. Adapted from
(Zellefrow, Griffiths et al. 2006)

103
Figure 3.4: Miniature protein ligands for SH3 domains of Src family kinases. (A)
The crystal structure of a high affinity peptide (1, in green) bound to the SH3 domain of
c-Src (orange surface). (Feng, Kasahara et al. 1995) The structure of PYY (blue) (Lerch,
Mayrhofer et al. 2004) and aPP (pink) (Blundell, Pitts et al. 1981) were aligned with
peptide 1 to guide sequence design of SH3 binding miniature proteins. (B) Sequences of
the designed miniature proteins with their naturally occurring scaffolds. The residues
required for scaffold folding are highlighted in blue and residues required for SH3
domain binding are highlighted in green. adapted from (Zellefrow, Griffiths et al. 2006)

104
Figure 3.5: Binding affinity of miniature proteins for Hck (A) and Src (B) SH3
domains. (Zellefrow, Griffiths et al. 2006) Fluorescene polarization was used to assess
the binding affinity of Peptide 1 and the designed miniature proteins. The affinities are
plotted as binding free energies of the complexes. The affinity data for Nef were
obtained from Arold et. al. (Arold, O'Brien et al. 1998)

105
Figure 3.6 In vitro activation of Hck by miniature proteins. (Zellefrow, Griffiths et
al. 2006) Activities of Hck kinase were analyzed in the presence of 50 µM activating
ligand. APP12 is the same as peptide 1.

106
Table 3.1: Variants of Hck and Src used as positive and negative controls. The
point mutations used to make the positive and negative controls for Src (Peng and
Schoenberg 2007) and Hck (Lerner and Smithgall 2002) activity are listed below. The
variants were made through Quikchange site-directed mutagenesis (Stratagene). Not all
were successfully assayed so data for all are not contained in this report
Kinase Mutation Function of mutation
Src K296R Kinase dead
K296E Kinase dead
Y418F Non-phosphorylated activation loop
P133L SH3 mutation to destroy binding to PPII helices
P246AP250A SH3 activated
P263A SH3 activated
Y527F SH2/tail activated
Hck K295D Kinase dead
Y411F Non-phosphorylated activation loop
Y522F SH2/tail activated

107
Figure 3.7: Creation of NIH-3T3 fibroblast lines stably expressing Hck and Hck
variants. Transient transfections followed by a neomycin selection (low = 0.5 mg/mL,
high = 1.0 mg/ml) over approximately four weeks. Cell lysates from each set of
transfection and selection conditions were analyzed for Hck expression by western blot.
Successful stable transfections were cryopreserved for future experiments.

108
Figure 3.8: Western blot analysis of Hck activation by Nef and miniature proteins.
NIH-3T3-09Hck cells were transiently transfected with Nef and miniature protein ligands
and grown for 96 h. Cells were lysed and western blotted using anti-pTyr and anti-actin
simultaneously. Four individual trials are shown.

109
Figure 3.9: Quantification of Hck activity western blots. Image J was used to quantify
band density from Western Blots. Each lane was normalized for protein loading using
the density of the actin band. The normalized density values were compared to the
normalized band from Hck alone to calculate a fold activation. The numbers plotted
represent the values from individual trials (A) and the average activation values (B) for
the four trials with the standard error.

110
Table 3.2 Average fold activation of Hck by miniature protein ligands. Western blot
images from figure 3.8 were quantified using Image J software and resulting averages of
four trials are presented below with the standard error. All cells were Hck expressing
cells with varying activating ligands transiently expressed as noted below.
Activating ligandAverage fold activation over
Hck with no activating ligand
Standard
error
None 1.00 0.00
PP1 1.16 0.17
PP2 1.19 0.17
PP3 1.03 0.22
YY1 1.20 0.25
YY2 1.29 0.21
YY3 1.07 0.23
Nef 1.41 0.31
Nef-2PA 1.17 0.18

111
Figure 3.10 Immunoprecipitation and western blot analysis of Src activation. SYF-
cSrc cells were transiently transfected with Nef and miniature protein ligands and grown
for 96 h. Cells were lysed, immunprecipitated with anti-SrcpY416, and western blotted
using anti-Src. Four individual trials are shown.

112
Figure 3.11 Activation of Src by miniature proteins. Image J was used to quantify
band density from immunoprecipitation Western Blots. Each lane was normalized for
protein loading using the density of the light chain antibody band. The normalized
density values were compared to the normalized band from Src alone to calculate a fold
activation. The numbers plotted represent the values from individual trials (A) and the
average activation values (B) for the four trials with the standard error.

113
Table 3.3 Average fold activation of Src by miniature protein ligands. Western blot
images from figure 3.10 were quantified using Image J software and resulting averages of
four trials are presented below with the standard error. All cells were Src expressing cells
with varying activating ligands transiently expressed as noted below.
Activating ligandAverage fold activation over
Src with no activating ligand
Standard
error
None 1.00 0.00
PP1 1.29 0.28
PP2 1.31 0.20
PP3 1.62 0.56
YY1 1.35 0.11
YY2 1.13 0.23
YY3 0.93 0.08
Nef 1.23 0.22

114
References:
Alvarez, R. H., H. M. Kantarjian, et al. (2006). "The role of Src in solid and hematologic
malignancies - Development of new-generation Src inhibitors." Cancer 107(8):
1918-1929.Arold, S., R. O'Brien, et al. (1998). "RT loop flexibility enhances the specificity of Src
family SH3 domains for HIV-1 Nef." Biochemistry 37(42): 14683-14691.
Blundell, T. L., J. E. Pitts, et al. (1981). "X-Ray-Analysis (1.4-a Resolution) of AvianPancreatic-Polypeptide - Small Globular Protein Hormone." Proceedings of the
National Academy of Sciences of the United States of America-BiologicalSciences 78(7): 4175-4179.
Boggon, T. J. and M. J. Eck (2004). "Structure and regulation of Src family kinases."
Oncogene 23(48): 7918-7927.Brabek, J., D. Mojzita, et al. (2002). "The SH3 domain of Src can downregulate its kinase
activity in the absence of the SH2 domain-pY527 interaction." Biochemical andBiophysical Research Communications 296(3): 664-670.
Briggs, S. D., E. C. Lerner, et al. (2000). "Affinity of Src family kinase SH3 domains for
HIV Nef in vitro does not predict kinase activation by Nef in vivo." Biochemistry39(3): 489-495.
Briggs, S. D., M. Sharkey, et al. (1997). "SH3-mediated Hck tyrosine kinase activationand fibroblast transformation by the Nef protein of HIV-1." Journal of Biological
Chemistry 272(29): 17899-17902.
Choi, H. J. and T. E. Smithgall (2004). "Conserved residues in the HIV-1 Nefhydrophobic pocket are essential for recruitment and activation of the Hck
tyrosine kinase." Journal of Molecular Biology 343: 1255-1268.Cowan-Jacob, S. W. (2006). "Structural biology of protein tyrosine kinases." Cellular and
Molecular Life Sciences 63(22): 2608-2625.
Feng, S. B., C. Kasahara, et al. (1995). "Specific interactions outside the proline-rich coreof two classes of Src homology 3 ligands." Proceedings of the National Academy
of Sciences of the United States of America 92(26): 12408-12415.
Frame, M. C. (2002). "Src in cancer: deregulation and consequences for cell behaviour."Biochimica Et Biophysica Acta-Reviews on Cancer 1602(2): 114-130.

115
Fuss, H., W. Dubitzky, et al. (2008). "Src family kinases and receptors: Analysis of three
activation mechanisms by dynamic systems modeling." Biophysical Journal 94:1995-2006.
Klinghoffer, R. A., C. Sachsenmaier, et al. (1999). "Src family kinases are required forintegrin but not PDGFR signal transduction." Embo Journal 18(9): 2459-2471.
Lee, C. H., B. Leung, et al. (1995). "A Single Amino-Acid in the Sh3 Domain of Hck
Determines Its High-Affinity and Specificity in Binding to Hiv-1 Nef Protein."Embo Journal 14(20): 5006-5015.
Lerch, M., M. Mayrhofer, et al. (2004). "Structural similarities of micelle-bound peptideYY (PYY) and neuropeptide Y (NPY) are related to their affinity profiles at the Y
receptors." Journal of Molecular Biology 339(5): 1153-1168.
Lerner, E. C. and T. E. Smithgall (2002). "SH3-dependent stimulation of Src-familykinase autophosphorylation without tail release from the SH2 domain in vivo."
Nature Structural Biology 9(5): 365-369.
Lerner, E. C., R. P. Trible, et al. (2005). "Activation of the Src family kinase Hck withoutSH3-linker release." Journal of Biological Chemistry 280(49): 40832-40837.
Li, S. G. (2007). "Src kinase signaling in leukaemia." International Journal ofBiochemistry & Cell Biology 39(7-8): 1483-1488.
Meyn, M. A., S. J. Schreiner, et al. (2005). "Src family kinase activity is required for
murine embryonic stem cell growth and differentiation." Molecular Pharmacology68(5): 1320-1330.
Moarefi, I., M. LaFevreBernt, et al. (1997). "Activation of the Src-family tyrosine kinaseHck by SH3 domain displacement." Nature 385(6617): 650-653.
Murakami, Y., H. Fukazawa, et al. (2002). "A mammalian two-hybrid screening system
for inhibitors of interaction between HIV Nef and the cellular tyrosine kinaseHck." Antiviral Research 55(1): 161-168.
Nika, K., L. Tautz, et al. (2007). "A weak Lck tail bite is necessary for Lck function in Tcell antigen receptor signaling." Journal of Biological Chemistry 282: 36000-
36009.
Peng, Y. and D. R. Schoenberg (2007). "c-Src activates endonuclease-mediated mRNAdecay." Molecular Cell 25(5): 779-787.

116
Sharma, V. M., J. M. Litersky, et al. (2007). "Tau impacts on growth-factor-stimulated
actin remodeling." Journal of Cell Science 120(5): 748-757.Sicheri, F., I. Moarefi, et al. (1997). "Crystal structure of the Src family tyrosine kinase
Hck." Nature 385(6617): 602-609.Sondhi, D., W. Q. Xu, et al. (1998). "Peptide and protein phosphorylation by protein
tyrosine kinase Csk: Insights into specificity and mechanism." Biochemistry
37(1): 165-172.Stauffer, T. P., C. H. Martenson, et al. (1997). "Inhibition of Lyn function in mast cell
activation by SH3 domain binding peptides." Biochemistry 36(31): 9388-9394.Suzu, S., M. Hiyoshi, et al. (2006). "HIV-1 Nef inhibits M-CSF signals by down-
regulating its receptor Fms through Hck." Blood 108(11): 368A-368A.
Vara, J. A. F., A. D. Caceres, et al. (2001). "Src family kinases are required for prolactininduction of cell proliferation." Molecular Biology of the Cell 12(7): 2171-2183.
Xu, W. Q., A. Doshi, et al. (1999). "Crystal structures of c-Src reveal features of its
autoinhibitory mechanism." Molecular Cell 3(5): 629-638.Xu, W. Q., S. C. Harrison, et al. (1997). "Three-dimensional structure of the tyrosine
kinase c-Src." Nature 385(6617): 595-602.Yadav, S. S. and W. T. Miller (2007). "Cooperative activation of Src family kinases by
SH3 and SH2 ligands." Cancer Letters 257: 116-123.
Yamaguchi, H. and W. A. Hendrickson (1996). "Structural basis for activation of humanlymphocyte kinase Lck upon tyrosine phosphorylation." Nature 384(6608): 484-
489.Yeatman, T. J. (2004). "A renaissance for SRC." Nature Reviews Cancer 4(6): 470-480.
Zellefrow, C. D., J. S. Griffiths, et al. (2006). "Encodable activators of Src family
kinases." Journal of the American Chemical Society 128(51): 16506-16507.