University of Malayastudentsrepo.um.edu.my/11337/1/Ahmad_Amiri.pdfpurata haba bagi radiator kereta...
392
FUNCTIONALIZATION AND EXFOLIATION OF BULK GRAPHITE INTO FEW-LAYER GRAPHENE SHEETS FOR IMPROVED HEAT DISSIPATION AHMAD AMIRI FACULTY OF ENGINEERING UNIVERSITY OF MALAYA KUALA LUMPUR 2017 University of Malaya
Transcript of University of Malayastudentsrepo.um.edu.my/11337/1/Ahmad_Amiri.pdfpurata haba bagi radiator kereta...
FUNCTIONALIZATION AND EXFOLIATION OF BULK GRAPHITE INTO FEW-LAYER GRAPHENE SHEETS FOR IMPROVED HEAT
DISSIPATION
AHMAD AMIRI
FACULTY OF ENGINEERING
UNIVERSITY OF MALAYA KUALA LUMPUR
2017
Univers
ity of
Mala
ya

FUNCTIONALIZATION AND EXFOLIATION OF BULK GRAPHITE INTO FEW-LAYER GRAPHENE SHEETS
FOR IMPROVED HEAT DISSIPATION
AHMAD AMIRI
THESIS SUBMITTED IN FULFILMENT OF THE REQUIREMENTS FOR THE DEGREE OF DOCTOR OF
PHILOSOPHY
FACULTY OF ENGINEERING UNIVERSITY OF MALAYA
KUALA LUMPUR
2017
Univers
ity of
Mala
ya

UNIVERSITI MALAYA
ORIGINAL LITERARY WORK DECLARATION
Name of Candidate: AHMAD AMIRI
Registration/Matric No: KHA140006
Name of Degree: DOCTOR OF PHILOSOPHY
Title of Project Paper/Research Report/Dissertation/Thesis (“this Work”):
FUNCTIONALIZATION AND EXFOLIATION OF BULK GRAPHITE INTO FEW-LAYER GRAPHENE SHEETS FOR IMPROVED HEAT
DISSIPATION
Field of Study: HEAT TRANSFER
I do solemnly and sincerely declare that: 1. I am the sole author/writer of this Work;2. This Work is original;3. Any use of any work in which copyright exists was done by way of fair dealing
and for permitted purposes and any excerpt or extract from, or reference to orreproduction of any copyright work has been disclosed expressly and sufficientlyand the title of the Work and its authorship have been acknowledged in this Work;
4. I do not have any actual knowledge nor do I ought reasonably to know that themaking of this work constitutes an infringement of any copyright work;
5. I hereby assign all and every rights in the copyright to this Work to the Universityof Malaya (“UM”), who henceforth shall be owner of the copyright in this Workand that any reproduction or use in any form or by any means whatsoever isprohibited without the written consent of UM having been first had and obtained;
6. I am fully aware that if in the course of making this Work I have infringed anycopyright whether intentionally or otherwise, I may be subject to legal action orany other action as may be determined by UM.
Candidate’s Signature Date
Subscribed and solemnly declared before,
Witness’s Signature Date
Name:
Designation:
Univers
ity of
Mala
ya

i
ABSTRACT
It is evident that the studies on exfoliation of graphite into graphene for preparing
stable colloidal samples have been a major subject of interest among researchers both in
academia and industry. Thus, the present research had been directed towards
understanding the mechanisms of exfoliation and covalent functionalization, and
exploring of viable, scalable and efficient techniques to improve the stability of graphene
sheets and ultimately paving routes for applying the concept into real engineering
applications. Three major topics were pursued within the current research perspective.
The first topic emphasizes on the exploration of facile and economical exfoliation
methods for the scalable synthesis of few-layered graphene sheets. To this end, in situ
liquid phase exfoliation and functionalization was employed. Surprisingly, the
morphological and statistical studies showed that more than 90% of the flakes had less
than two layers and about 84% of graphene sheets were single-layered in one of the
procedures. Also, the BET analysis indicated that the SSA of different graphene sheets
prepared in this study was up to 1559 m2/g. The second topic focuses on the benign and
facile preparation of water-based highly stable functionalized graphene nanofluids and its
role on enhancing the thermo-physical properties. Water-based highly porous single layer
graphene (SGr), water-based crumpled few-layer graphene (HCFLG), and water-based
functionalized graphene nanoplatelets dispersions were prepared. Further, the maximum
sediments of less than 2% and 13 % were obtained for water-based HCFLG and water-
based SGr dispersions, respectively, which are quite impressive. Also, the addition of
HCFLG and SGr into the basefluids produced noticeable increases in the thermal
conductivity, up to 42.5% and 26%, respectively. Insignificant average drops of <1% in
Cp were observed after addition of SGr or HCFLG into the water at the weight
concentration of 0.001–0.01 wt%. Also, the density of the water-based HCFLG
Univers
ity of
Mala
ya
ii
nanofluids, water-based SGr nanofluids, and water/ethylene glycol-based EG-GNP
nanofluids at weight concentration of 0.01% decreases by 1.01 and 0.99%, 0.87 and
0.88%, and 0.01 and 0.1%, when the temperature increases from 20 to 50 °C, respectively.
The final topic deals with the field testing of various colloidal dispersions with improved
stability within energy transport system. A duct with a backward-facing step experimental
set-up working in transition and turbulent modes and subjected to constant heat flux was
established. As compared to the base fluid, the maximum enhancement in average heat
transfer coefficient for transitional and turbulent flow regimes was 271% and 177% in
the presence of water-based SGr nanofluid at 0.01 wt%, respectively. The amount of
enhancement was 233.5% and 199% for water-based HCFLG nanofluids, respectively.
Also, the average thermal performance of car radiator in the presence of water/EG-based
ethylene glycol-treated GNP nanofluids increased by 99.9%, 102.2% and 115.3% for inlet
temperature of 35, 45 and 55 °C, respectively. Other characteristics of the new coolants
such as weak increase in the pressure drop and required pumping power (less than 2%),
low friction factor, lack of corrosive agent, and appropriate performance index (PI> 1)
are all highly favorable for introducing new fluids for wide industrial applications.
Univers
ity of
Mala
ya

iii
ABSTRAK
Adalah jelas bahawa kajian mengenai pengelupasan grafit kepada graphene untuk
menyediakan sampel koloid yang stabil telah menjadi subjek utama yang menarik minat
di kalangan penyelidik dalam bidang akademik dan industri. Oleh itu, kajian semasa telah
diarahkan ke arah memahami mekanisme pengelupasan dan pemungsian kovalen, serta
meneroka teknik yang berdaya maju, berskala dan berkesan untuk menambah baik
kestabilan lapisan graphene dan seterusnya membuka laluan bagi mengaplikasikan
konsep ke dalam aplikasi kejuruteraan sebenar. Tiga topik utama telah diteruskan dalam
perspektif penyelidikan semasa. Topik pertama menekankan penerokaan kaedah
pengelupasan yang mudah dan penggelupasan yang ekonomi untuk sintesis berskala
beberapa lapisan graphene. Bagi mencapai objektif ini, pengelupasan dan pemungsian
fasa cecair in situ telah dilaksanakan. Mengejutkan, morfologi dan kajian statistik
menunjukkan lebih dari 90% serpih mempunyai kurang dari dua lapisan dan kira-kira
84% lapisan graphene adalah lapisan-tunggal di dalam salah satu prosedur. Juga, analisis
BET memberi indikasi bahawa SSA bagi berlainan lapisan graphene yang disediakan
dalam kajian ini adalah sehingga 1559 m2/g. Topik kedua fokus kepada penyediaan yang
mudah dan menggalakkan bagi cecair-nano graphene yang diubahsuai fungi berasaskan
air yang sangat stabil dan peranannya ke atas mempertingkatkan ciri-ciri termofizikal.
Penyebaran bagi lapisan-tunggal graphene yang sangat berliang berasaskan air (SGr),
renyukan beberapa lapisan graphene berasaskan air (HCFLG) dan graphene nanoplatelet
yang diubah suai fungsi berasaskan air telah disediakan. Selanjutnya, mendapan maksima
kurang dari 2% dan 13% telah diperolehi bagi penyebaran renyukan beberapa lapisan
graphene berasaskan air (HCFLG) dan lapisan-tunggal graphene yang sangat berliang
berasaskan air (SGr), masing-masing, adalah agak menarik perhatian. Juga, dengan
penambahan HCFLG dan SGr ke dalam cecair asas menghasilkan peningkatan yang
ketara dalam konduktiviti haba, sehingga 42.5% dan 26% masing-masing. Purata jatuh
Univers
ity of
Mala
ya

iv
yang tidak ketara <1% dalam Cp telah diperhatikan selepas penambahan SGr atau
HCFLG ke dalam air pada berat kepekatan sebanyak 0.001-0.01 wt%. Juga, ketumpatan
cecair-nano HCFLG berasaskan air, cecair-nano SGr berasaskan air dan EG-GNP
berasaskan air/etilena glikol pada berat kepekatan 0.01% masing-masing menurun
sebanyak 1.01 dan 0.99%, 0.87 dan 0.88%, dan 0.01 dan 0.1%, apabila suhu meningkat
dari 20 sehingga 50 o C. Topik akhir berurusan dengan bidang ujikaji pelbagai penyebaran
koloidal dengan kestabilan yang telah bertambah baik dalam sistem pengangkutan haba.
Set eksperimen dengan langkah saluran menghadap-kebelakang dalam mod peralihan dan
gelora dan tertakluk kepada fluks haba yang berterusan telah didirikan. Berbanding
dengan cecair asas, peningkatan maksima dalam purata pekali pemindahan haba bagi
peralihan dan rejim aliran gelora masing-masing adalah 271% dan 177% dengan
kehadiran cecair-nano SGr berasaskan air pada 0.01 wt%. Jumlah peningkatan masing-
masing adalah 233.5% dan 199% bagi cecair-nano HCFLG berasaskan air. Juga, prestasi
purata haba bagi radiator kereta dengan kehadiran cecair-nano etilina glikol-GNP
berasaskan air/EG yang dirawat masing-masing meningkat sebanyak 99.9%, 102.2% dan
115.3% bagi suhu inlet untuk 35, 45 dan 55 ᵒC. Ciri-ciri penyejuk yang lain seperti
kelemahan meningkat dalam kejatuhan tekanan dan memerlukan kuasa mengepam
(kurang dari 2%), faktor geseran yang rendah, kekurangan agen menghakis dan prestasi
indeks yang sesuai (PI> 1) semuanya sangat diingini bagi memperkenalkan cecair baru
untuk aplikasi industri meluas.
Univers
ity of
Mala
ya
v
ACKNOWLEDGMENTS
“Dedication to my beloved wife, mother and father”
First and foremost, In essence, I wish to pay my uttermost tribute to Prof. Kazi
Md Salim Newaz and Dr. Chew Bee Teng for their persistent guidance and supervision.
The research has been made possible due to the financial aid from UMRG Grant RP012B-
13AET, ministry of Higher Education High Impact Research
(UM.C/625/1/HIR/MOHE/ENG/45) grants and Bright Sparks Unit which I highly
indebted. I would also like to thank Dr. Mehdi Shanbedi, Prof. Zeinali Heris, Prof. Eshghi,
Prof. Goodarz Ahmadi, Dr. M.N.M. Zubir and Prof. Rashidi for their helps, supports in
pursuing different parts of the thesis. I would also wish to endow my deepest gratitude to
my beloved wife for her enduring patience and persistence in supporting me during my
emotional journey towards climbing higher academic strata. In addition, I would like to
express my sincere thanks to my close associates: Dr. Houman Yarmand, Mr. Wail Sami
Sarsam, and Mr. Teng Kah Hou for the series of thoughtful discussions and brainstorming
sessions. My heartiest thanks are extended to my colleagues and friends who I benefited
from in terms of valuable technical and academic assistances through-out the demanding
research period. Finally, I wish to thank Mr. Bakri and his staffs from Garuda Mekar Sdn
Bhd for their professional support in making my experimental test rig a reality. I would
treasure this memorable journey as a milestone to spearhead my challenging academic
carrier.
Univers
ity of
Mala
ya
vi
TABLE OF CONTENTS
ABSTRACT ...................................................................................................................... i
ABSTRAK ...................................................................................................................... iii
ACKNOWLEDGMENTS .............................................................................................. v
LIST OF FIGURES ...................................................................................................... xii
LIST OF TABLES ..................................................................................................... xxiii
NOMENCLATURE ................................................................................................... xxiii
LIST OF APPENDICES .......................................................................................... xxvii
CHAPTER 1 : INTRODUCTION ................................................................................. 1
1.1 Background ....................................................................................................... 1
1.1.1 Water-based carbon nanostructures dispersions ........................................... 1
1.1.2 Mass-production of graphene ........................................................................ 3
1.2 Objectives of present research .......................................................................... 7
1.3 Motivation of Research ..................................................................................... 8
1.4 Thesis Overview ............................................................................................... 8
CHAPTER 2 : LITERATURE REVIEW ................................................................... 10
2.1 Introduction ..................................................................................................... 10
2.2 Direct Ultrasonic Exfoliation .......................................................................... 13
2.2.1 Exfoliation in Organic Solvents .................................................................. 13
2.2.2 Exfoliation with Low Boiling Point Solvents ............................................. 17
2.3 Stabilizer-Based Exfoliation ........................................................................... 18
2.3.1 Ionic Surfactants.......................................................................................... 19
2.3.2 Nonionic Surfactants ................................................................................... 21
2.3.3 Polymers ...................................................................................................... 23
2.3.4 Pyrene Derivatives ...................................................................................... 24
2.3.5 Aromatic Stabilizers .................................................................................... 28
2.4 Exfoliation with Ionic Solvents....................................................................... 28
Univers
ity of
Mala
ya

vii
2.5 Functionalization-Assisted Exfoliation ........................................................... 29
2.6 Thermal Exfoliation Techniques ..................................................................... 34
2.6.1 Thermal Exfoliation of Graphite Oxide ...................................................... 35
2.6.2 Thermal Exfoliation of Bulk Graphite ........................................................ 39
2.7 Shear Exfoliation............................................................................................. 43
2.8 Electrochemical Exfoliation ............................................................................ 45
2.9 Exfoliation Summary and Conclusion ............................................................ 50
2.10 Functionalization by Covalent Bonding ......................................................... 51
2.10.1 Covalent Attachment of Organic Functionalities ...................................... 51
2.10.1.1 Functionalization by Free Radicals.................................................... 52
2.10.1.2 Functionalization by Dienophiles ...................................................... 56
2.11 Covalent Attachment of Functionalities to Graphene Oxides ........................ 62
2.12 Noncovalent Functionalization of Graphene sheets........................................ 63
2.13 In Situ Exfoliation and Functionalization for Applications ............................ 73
2.13.1 Nanofluid as a New Class of Material to Enhance Heat Transfer Performance ............................................................................................................ 74
2.13.2 Using Graphene Based Nanofluids as Promising Candidate for Improving Convective Heat Transfer ....................................................................................... 76
2.14 The challenge of graphene stabilization in solvents ....................................... 85
CHAPTER 3 : METHODOLOGY .............................................................................. 89
3.1 Characterization Methods and Instruments..................................................... 89
3.1.1 Preparation of samples for characterization instruments ............................ 89
3.1.1.1 Field Emission Scanning Electron Microscopy ................................. 89
3.1.1.2 Transmission Electron Microscopy ................................................... 89
3.1.1.3 Atomic Force Microscopy ................................................................. 90
3.1.2 Functionality and Elemental Analysis ........................................................ 90
3.1.2.1 Fourier Transform Infrared Spectroscopy (FTIR) ............................. 90
3.1.2.2 X-ray Photoelectron Spectroscopy .................................................... 90
3.1.2.3 Energy Dispersive X-Ray Spectroscopy............................................ 91
Univers
ity of
Mala
ya

viii
3.1.2.4 Raman Spectroscopy.......................................................................... 91
3.1.2.5 Thermogravimetric Analysis ............................................................. 91
3.1.2.6 Selected Area (Electron) Diffraction ................................................. 92
3.1.3 Specific Surface Area .................................................................................. 92
3.1.4 Thermo-physical Analysis .......................................................................... 93
3.1.4.1 Thermal Conductivity ........................................................................ 93
3.1.4.2 Differential Scanning Calorimetry..................................................... 96
3.1.4.3 Rheometer .......................................................................................... 97
3.1.4.4 Densitometer ...................................................................................... 97
3.1.5 Stability Analysis ........................................................................................ 98
3.1.5.1 UV–Vis Spectroscopy........................................................................ 98
3.1.5.2 Zeta-Potential and Particle Size Distribution..................................... 99
3.1.6 Experimental system ................................................................................... 99
3.1.6.1 Duct with a Backward-facing Step .................................................... 99
3.1.6.2 Design and Construction .................................................................. 103
3.1.6.3 Car Radiator ..................................................................................... 113
3.1.6.4 Two Phase Closed Thermosyphon .................................................. 117
3.1.6.5 Flowchart of study ........................................................................... 118
CHAPTER 4 : RESULTS AND DISCUSSION ....................................................... 120
4.1 Introduction ................................................................................................... 120
4.2 Exfoliation, Functionalization and Characterization .................................... 121
4.2.1 Preparation of Chemically-Assisted Exfoliated, Highly-Porous, Graphene (CE-GR) and Thermally-Treated Graphene (T-GR) ............................................. 121
4.2.1.1 Chemicals......................................................................................... 121
4.2.1.2 In Situ Functionalization and Exfoliation Procedure ....................... 121
4.2.1.3 Characterizations, Results and Discussion ...................................... 125
4.2.1.4 Functionality and Quality of Graphene ........................................... 125
4.2.1.5 Morphological Study ....................................................................... 132
4.2.1.6 Summary of in Situ Functionalization and Exfoliation ................... 140
Univers
ity of
Mala
ya

ix
4.2.2 Preparation of Highly-Crumpled, Few-Layered Graphene (HCG) and Highly-Crumpled Nitrogen-Doped Graphene (HCNDG) ..................................... 140
4.2.2.1 Chemicals......................................................................................... 140
4.2.2.2 Exfoliation and Functionalization .................................................... 141
4.2.2.3 Results and Discussion .................................................................... 142
4.2.2.4 Functionality .................................................................................... 142
4.2.2.5 Morphological Study ....................................................................... 146
4.2.3 Preparation of Crumpled Nitrogen-Doped Graphene (CNDG) ................ 154
4.2.3.1 Material and Methods ...................................................................... 154
4.2.3.2 Functionalization Analysis .............................................................. 154
4.2.3.3 Morphological Study ....................................................................... 157
4.2.4 Synthesis of Ethylene Glycol-Treated Graphene Nanoplatelets ............... 158
4.2.4.1 Functionalization Procedure ............................................................ 158
4.2.4.2 Functionalization Analysis .............................................................. 160
4.2.4.3 Morphological Study ....................................................................... 162
4.2.5 Direct Coupling of Graphene Nanoplatelets with Poly Ethylene Glycol and 4-Phenylazophenol Molecules .............................................................................. 164
4.2.5.1 Microwave-assisted functionalization ............................................. 164
4.2.5.2 Functionalization Analysis .............................................................. 165
4.2.5.2.1 FTIR ............................................................................................ 166
4.2.5.2.2 Raman spectroscopy .................................................................... 169
4.2.5.2.3 TGA ............................................................................................. 171
4.2.5.3 Morphology studies ......................................................................... 174
4.2.6 Preparation of GNP-COOH ...................................................................... 175
4.2.6.1 Covalent functionalization of GNP.................................................. 175
4.2.6.2 Morphological and functionalization studies ................................... 176
4.3 Colloidal stability and Thermo-physical properties ...................................... 177
4.3.1 Water-based highly crumpled few layered graphene nanofluids .............. 177
4.3.1.1 Preparation ....................................................................................... 177
Univers
ity of
Mala
ya

x
4.3.1.2 Colloidal Stability ............................................................................ 178
4.3.1.3 Thermo-physical properties ............................................................. 179
4.3.2 Water-based chemically-assisted exfoliated single-layered graphene (SGr) nanofluids .............................................................................................................. 184
4.3.2.1 Preparation ....................................................................................... 184
4.3.2.2 Colloidal Stability ............................................................................ 185
4.3.2.3 Thermo-physical properties ............................................................. 187
4.3.3 Water/ethylene glycol-based crumpled nitrogen-doped graphene nanosheets nanofluids (CNDG-WEG) .................................................................................... 192
4.3.3.1 Preparation ....................................................................................... 192
4.3.3.2 Colloidal Stability ............................................................................ 192
4.3.3.3 Thermo-physical properties ............................................................. 197
4.3.4 Water/ethylene glycol-based EG-treated graphene nanosheets nanofluids 205
4.3.4.1 Preparation ....................................................................................... 205
4.3.4.2 Thermo-physical properties ............................................................. 206
4.3.5 Water-based carboxylated GNP nanofluids .............................................. 210
4.3.5.1 Preparation of nanofluids ................................................................. 210
4.3.5.2 Thermo-physical properties ............................................................. 211
4.3.6 Water-based PEG-treated GNP and acetone-based Azo-treated GNP acetone nanofluids .............................................................................................................. 214
4.3.6.1 Preparation of nanofluids ................................................................. 214
4.3.6.2 Colloidal Stability ............................................................................ 214
4.4 Experimental Heat Transfer Performance of Different Thermal Equipment 217
4.4.1 Car Radiators ............................................................................................. 217
4.4.1.1 Introduction ...................................................................................... 217
4.4.1.2 Data Processing................................................................................ 220
4.4.1.3 Thermal performance studies........................................................... 222
4.4.1.3.1 GNP-WEG................................................................................... 224
4.4.1.3.2 CNDG-WEG ............................................................................... 240
Univers
ity of
Mala
ya

xi
4.4.2 Ducts and channels with abrupt expansion ............................................... 255
4.4.2.1 Introduction ...................................................................................... 255
4.4.2.2 Data Processing................................................................................ 258
4.4.2.3 Heat transfer Over a Backward Facing Step Flow .......................... 261
4.4.2.3.1 Water-Based HCFLG Nanofluids ............................................... 261
4.4.2.3.2 Water-Based SGr Nanofluids ...................................................... 276
4.4.3 Two-phase closed thermosyphon .............................................................. 288
4.4.3.1 Introduction ...................................................................................... 288
4.4.3.2 Data Processing................................................................................ 291
4.4.3.3 Heat Transfer Rate ........................................................................... 293
4.5 Numerical Study on the Convective Heat Transfer Over a Backward-Facing Step 303
4.5.1 Introduction ............................................................................................... 303
4.5.2 Numerical implementation ........................................................................ 307
4.5.3 Governing equations ................................................................................. 307
4.5.4 Physical model and assumptions ............................................................... 308
4.5.5 Grid study .................................................................................................. 309
4.5.6 Result and discussion ................................................................................ 310
CHAPTER 5 : CONCLUSIONS AND RECOMMENDATIONS .......................... 318
5.1 Conclusions ................................................................................................... 318
5.2 Recommendations for Future Work .............................................................. 323
REFERENCES .............................................................................................................. 324
List of Publications and Awards ................................................................................... 357
Univers
ity of
Mala
ya

xii
LIST OF FIGURES
Figure 2.1: a) Graphite concentration measured after centrifugation for a range of solvents plotted versus solvent surface tension, b) Raman spectra of the graphite and few-layered graphene c) and d) TEM images of graphene (Hernandez et al., 2008). ........................................................................................................................ 15
Figure 2.2: a) Concentration of graphene dispersion versus sonication time. The inset illustrates solutions including graphene after 6 h and 180 h. b) Mean layer number, length, and width of flakes as a function of sonication time (Khan, O'Neill, et al., 2010). ........................................................................................................................ 17
Figure 2.3: (A) Topographic view of the graphene layers, (B) AFM image of a single flake. (C) Height profile of the image 2.3B. Statistical analysis of the AFM images of 60 flakes: (D) thickness, (E) length and (F) width of the flakes (Vadukumpully et al., 2009). ........................................................................................................................ 21
Figure 2.4: Concentration of graphene dispersions obtained by various types of surfactants (Guardia et al., 2011). ............................................................................. 23
Figure 2.5: Molecular structures of pyrene derivatives with their names and corresponding acronyms for stabilizing graphene in the liquid media. (Niu et al., 2016) ......................................................................................................................... 25
Figure 2.6: (a) A typical AFM image of graphene flakes dispersed in TPA/D2O solution. (b) The thickness distribution of all the graphene flakes observed in panel (a). (c) AFM image of a mechanically exfoliated monolayer graphene (X. Dong et al., 2009).. ....................................................................................................................... 26
Figure 2.7: Scheme for the production of water-based graphene oxide suspension from graphite (a) a photo of bulk graphite powder, (b) a SEM image of the layer structure of graphite oxide, (c) a water-based graphene oxide suspension, (d) a AFM image of graphene oxide placed on a mica substrate, and (e) chemical structure of graphene oxide with different functional groups (S. Park & Ruoff, 2015)............... 31
Figure 2.8: The procedure of preparing homogeneous colloidal suspensions of RGO (S. Park & Ruoff, 2015). ........................................................................................... 32
Figure 2.9: (a) Histogram of number of layers per graphene flakes, (b) SEM image of graphene flake, (c & d) AFM of graphene on mica and (e and f) the height profiles along the black imaged lines above in panels c and d, respectively (Zhengzong Sun et al. (2010)). ................................................................................................................. 34
Figure 2.10: Thermally exfoliated graphene. (a) Tapping-mode AFM topography image of thermal exfoliation of GO. (b) A wrinkled graphene sheet with rough surface structure. (c) Contact-mode AFM image of a flake. (d) The cross-section through the line in the sheet shown in panel (c) (M. Cai et al., 2012). ........................................ 36
Univers
ity of
Mala
ya
xiii
Figure 2.11: High temperature exfoliation of graphite oxide under atmospheric pressure (top) and low-temperature exfoliation of graphite oxide (as low as 200 °C) under high vacuum (bottom) (Lv et al., 2009). ......................................................... 39
Figure 2.12: (a) Graphite exfoliation after re-intercalation with sulphuric acid molecules and insertion of tetrabutylammonium hydroxide. Graphene sheets’ structure after thermal exfoliation of bulk graphite (b) and graphite oxide (c) (X. Li, G. Zhang, et al., 2008)............................................................................................... 40
Figure 2.13: (a) and (b) SEM images of expanded graphite after inductively coupled thermal plasma treatment. (c) Raman spectra of four graphene sheets obtained with inductively coupled thermal plasma treatment method (S. Y. Choi et al., 2011). .... 41
Figure 2.14: (a, b, c) Set-up of high shear mixer with close-up view of rotor and stator. (d), Mass-produced graphene–NMP dispersions via shear exfoliation. (e, f, g h) TEM images of graphene nanosheets produced by shear exfoliation. (i), Histogram of graphene thickness and Raman spectrum (inset). (k) Diagram of rotor speed, N versus diameter, D (the red line shows a minimum shear rate of 104 S-1). (f) TEM image of exfoliated BN flake. (Paton et al., 2014).................................................... 44
Figure 2.15: (a) Electrochemical exfoliation of bulk graphite in the presence of acids. (b) Suggested mechanism for electrochemical Exfoliation (Parvez et al., 2013). .... 47
Figure 2.16: N1s and C1s XPS spectra of the functionalized GNR and GNRs (Niyogi et al., 2010). ............................................................................................................... 53
Figure 2.17: The functionalization procedure of graphene nanosheets by polystyrene (Fang et al., 2009). .................................................................................................... 54
Figure 2.18: Radical addition reaction mechanism. (a) Raman spectra of a mono layer graphene after and before functionalization and (b) optical image of a functionalized mono layer graphene with some holes or defects (Haitao Liu et al., 2009). ............. 54
Figure 2.19: (a) Schematic of Electrophilic addition reaction. (b) FTIR spectra (c) Raman spectra, and (d) energy dispersive X-ray spectroscopy traces of the triethanolamine-treated graphene nanoplatelets (EDS traces are presented for different specific surface areas). ............................................................................... 55
Figure 2.20: The 1,3 dipolar cycloaddition reaction for decorating the surface of graphene with azomethine ylide (left). Ethanol-based Functionalized graphene nanoplatelets dispersion (top, right). Raman spectra of (a) pristine graphene and (b) pyrrolidine functionalized graphene (bottom, right) (Georgakilas et al., 2010). ...... 57
Figure 2.21: (a, b, c) TEM images and (d, e) AFM images of the functionalized graphene sheets (S. Park & Ruoff, 2009). ................................................................. 58
Figure 2.22: Edge-functionalization of pristine graphene with perfluorophenylazides (L.-H. Liu et al., 2010). ............................................................................................. 59
Figure 2.23: (a) Functionalization of graphene sheets with alkyl nitrenes. (b) Raman spectra of graphene sheet before (1) and after functionalization of graphene sheets with 11-azidoundecanoic acid in 1:1 (2) and 10:1 (3) ratios (Vadukumpully et al., 2011). ........................................................................................................................ 60
Univers
ity of
Mala
ya

xiv
Figure 2.24: The photographs of functionalized graphene nanosheets dispersion in solvents after sonication: hydroxyl-functionalized graphene in water (1) and DMF (2), carboxyl-functionalized graphene in water (3) and DMF (4), poly(ethylene glycol)-functionalized graphene in water (5) and DMF (6), long alkyl chain-functionalized graphene in chloroform (7) and toluene (8), polystyrene-functionalized graphene in chloroform (9) and toluene (10), amino-functionalized graphene in water/chloroform (12), graphene oxide in chloroform (13), and reduced graphene oxide in DMF (14) (Hongkun He & Gao, 2010). ..................................................................................... 61
Figure 2.25: (top) The schematic of chemical functionalization of graphene sheets via aryne cycloaddition. (Bottom left) Photographs of graphene sheets and aryne-modified graphene sheets dispersions in DMF: (a) graphene sheets, (b) F- aryne-modified graphene sheets, (c) Me- aryne-modified graphene sheets and (d) H- aryne-modified graphene sheets. (Bottom right) (B) UV–vis absorption spectra of Me- aryne-modified graphene sheets dispersed in ethanol with different concentrations (J. Choi et al., 2009). ...................................................................................................... 62
Figure 2.26: (left) AFM images of graphene oxide and (right) pyrenebutyric-treated graphene nanoplatelets on mica (Y. Xu et al., 2008). ............................................... 64
Figure 2.27: DNA coating, metal coating and aqueous dispersion of graphene oxide and Reduced graphene oxide (Jinbin Liu et al., 2010). ............................................. 66
Figure 2.28: TEM images of (left) 5,10,15,20-tetrakis α-2-trismethylammoniome thylphenyl] porphyrin iron (III) pentachloride/Reduced graphene oxide; and (right) photographs of a) Reduced graphene oxide, b) 5,10,15,20-tetrakis [αααα-2-trismethylammoniome thylphenyl] porphyrin iron (III) pentachloride, and c) 5,10,15,20-tetrakis [α-2-trismethylammoniome thylphenyl] porphyrin iron (III) pentachloride (0.1 mg mL-1) dispensed in water (Tu et al., 2010). .......................... 67
Figure 2.29: Solubility photographs of congo red-treated graphene nanoplatelets nanocomposites in (a) toluene, (b) benzene, (c) tetrahydrofuran, (d) ethyl acetate, (e) isopropanol, (f) chloroform, (g) acetone, (h) acetonitrile, (i) dimethylformamide, (j) methanol, (k) dimethyl sulfoxide, (l) water, (m) N-Methyl-2-pyrrolidone, (n) ethanol, (o) isoamyl alcohol, (p) m-cresol, (q) pyridine, and (r) 1,4-dioxane (F. Li et al., 2010). .................................................................................................................. 68
Figure 2.30: (a) Photographs of reduced graphene dispersed in water and 16 different organic solvents via 5 h sonication. The photographs were taken 1 month after the preparation of the reduced graphene dispersion. (b) UV-Vis absorption spectra of reduced graphene dispersed in good solvents (E.-Y. Choi et al., 2010). ................ 72
Figure 2.31: (a) The main chemical structure of poly ethylene glycol- oligomer phenylene–ethynylene (PEG-OPE). (b) The synthesis procedure of PEG-OPE–treated Reduced graphene oxide in H2O. (c) Photograph of (A) graphene oxide and (B) Reduced graphene oxide in water and (C) PEG-OPE–treated Reduced graphene oxide and (D) PEG-OPE in methanol (Qi et al., 2010)....................................................... 73
Figure 2.32: Thermal conductivity ratio of graphene-based nanofluids in the presence of different basefluids (Distillated water (DW) and ethylene glycol (EG)) (Kole & Dey, 2013). ................................................................................................................ 83
Univers
ity of
Mala
ya
xv
Figure 2.33: Thermal conductivity of water-based nanofluids in the presence of different additives e.g. metals, metal oxide, carbon nanotubes (CNT) and graphene (Gupta et al., 2011).................................................................................................... 84
Figure 2.34: Thermal conductivity of graphene, graphene/SiO2, and graphene/SiO2-SDBS (X, Li. et al.) ................................................................................................... 84
Figure 3.1: Schematic setup of KD2 thermal properties analyzer. .......................... 94
Figure 3.2: Photographs of the KS-1 probe without (a–c) and with (d–f) the probe holder......................................................................................................................... 95
Figure 3.3: Comparison between distilled water and previous data ........................ 96
Figure 3.4: Comparison between the measured viscosity with the standard values reported by Arnold (1970) for distilled water at 200 1/s shear rate. ......................... 97
Figure 3.5: (Up) Photograph, schematic and (down) 2D diagram of the duct with a backward-facing step. ............................................................................................. 101
Figure 3.6: Schematic view of the test section and the positioning of the thermocouples on the outer surface of the cylindrical tube. ................................... 102
Figure 3.7: Photograph of the Reservoir Tank. ...................................................... 104
Figure 3.8: Photograph of the Magnetic gear pump. ............................................. 104
Figure 3.9: Photograph of the Hoffman Muller inverter. ....................................... 105
Figure 3.10: Photograph of the Electromagnetic flow meter. ................................ 106
Figure 3.11: Photograph of the Differential Pressure Transducers. ....................... 106
Figure 3.12: Photograph of the refrigerated bath circulators. ................................ 107
Figure 3.13: Photograph of the N8731A DC-power supplies. ............................... 108
Figure 3.14: Photograph of the Thermocouple calibrator. ..................................... 109
Figure 3.15: Thermocouple testing. ....................................................................... 110
Figure 3.16: Photograph of the Data acquisition instruments. ............................... 110
Figure 3.17: Photograph of the controlling unit that attached with SCADA system. ..................................................................................................................... 111
Figure 3.18: Thermocouple installation. ................................................................ 112
Figure 3.19: Photograph of the heat transfer test rig. ............................................ 113
Figure 3.20: Photographs of the experimental system. .......................................... 115
Figure 3.21: Schematic of the experimental system .............................................. 116
Univers
ity of
Mala
ya
xvi
Figure 3.22: (left and middle) Schematic and (right) photograph of the experimental apparatus. ................................................................................................................ 118
Figure 3.23: Flowchart of phases of this study. ..................................................... 119
Figure 4.1: The experimental procedure for functionalization as well as exfoliation of graphite and synthesizing of CE-GR and T-GR. ................................................ 124
Figure 4.2: (1) Photographs of functionalized and expanded graphite dispersed in (a) DMF, (b) DMA, (c) g-butyrolactone and (d) EG. (2) The extracted black pure graphene powder (T-GR). ....................................................................................... 125
Figure 4.3: (a) FTIR spectra of pristine graphite, CE-GR and T-GR, TGA and DTG curves of (b) pristine graphite, (c) CE-GR, (d) T-GR and (e) Raman spectra of pristine graphite, CE-GR and T-GR..................................................................................... 127
Figure 4.4: TGA and DTG curves of pure PEG. ................................................... 127
Figure 4.5: (a) XPS survey spectra of CE-GR and T-GR. High-resolution C 1 s spectra of (b) pristine graphite, (c) CE-GR and (d) T-GR. ..................................... 131
Figure 4.6: FESEM images of the CE-GR (3a-h) and T-GR (3i-l)........................ 133
Figure 4.7: a-h, High-resolution TEM images of CE-GR (a-c) and T-GR (d-g) graphene. h, i, Electron diffraction patterns taken from the positions of the red (h) and white spots (i), respectively, of the sheet shown in d, with the peaks labelled by Miller–Bravais indices. The graphene is clearly one layer thick in (h) and two layers thick in (i). j, k, Diffracted intensity taken along the 1–210 to –2110 axis for the patterns shown in h and i, respectively. l, Histogram of the ratios of the intensity of the {1100} and {2110} diffraction peaks for all the diffraction patterns collected. ................................................................................................................. 134
Figure 4.8: TEM images of the CE-GR. ................................................................ 135
Figure 4.9: AFM ichnography and cross-section contour of (a, c, d and e) CE-GR and (b, f, g and h) T-GR. ................................................................................................ 138
Figure 4.10: AFM ichnography and cross-section contour of (a1&a2) CE-GR and (b) T-GR. ...................................................................................................................... 138
Figure 4.11: N2-adsorption/desorption of the CE-GR and T-GR. ......................... 139
Figure 4.12: The experimental procedure for exfoliation of graphite and synthesizing HCG and HCNDG. ................................................................................................. 142
Figure 4.13: (a) FTIR and (b) Raman spectra of the pristine graphite, HCG and HCNDG. ................................................................................................................. 144
Figure 4.14: (a) XPS survey spectra of pristine graphite, HCG and HCNDG, High-resolution C 1s spectra of (b) HCG and (c) HCNDG, N1s spectra of (d) HCG and (e) HCNDG. ................................................................................................................. 146
Figure 4.15: SEM images of (a-d) HCG and (e-h) HCNDG. ................................ 147
Univers
ity of
Mala
ya
xvii
Figure 4.16: TEM images of (a and b) HCG, (c-e) HCNDG and selected area electron diffraction (SAED) patterns of (f) panel a and (g) panel c. .................................... 148
Figure 4.17: (a-c) FESEM images and (d-g) TEM images of HCG; (h and i) selected area electron diffraction (SAED) patterns of white point in panel (f) and red point in panel (g). ................................................................................................................. 149
Figure 4.18: AFM ichnography and cross-section contour of (a) HCNDG and (b and c) HCG. ................................................................................................................... 151
Figure 4.19: N2-adsorption/desorption of (a) the pristine graphite, (b) HCG and (c) HCNDG. ................................................................................................................. 153
Figure 4.20: (a) Raman spectrum (b) XPS spectrum of and (c) high-resolution N 1s Spectra of CNDG. ................................................................................................... 156
Figure 4.21: TEM image of (a) forming C3N4 polymer layers on the surface of the GO (b) CNDG. ........................................................................................................ 157
Figure 4.22: N2 sorption isotherms, (insert figure) pore size distribution of the CNDG nanosheets. .............................................................................................................. 158
Figure 4.23: The experimental procedure for chemical-assisted functionalization of GNP with EG. ......................................................................................................... 159
Figure 4.24: (A) FTIR spectra, (B) Raman spectra, (C) thermogravimetric analysis of the pristine and EG-treated GNP and (D) photographs of EG-treated GNP dispersed in water-EG after 1 month....................................................................................... 162
Figure 4.25: TEM images of the (A & A1) pristine and EG-treated GNP (B, B1, B2 & B3). ...................................................................................................................... 163
Figure 4.26: The experimental procedure for chemical-assisted functionalization of GNP with PEG and Azo. ......................................................................................... 164
Figure 4.27: FTIR spectra of the pristine GNP as well as PEG- and Azo-treated GNP in the presence of ZnCl2. ......................................................................................... 166
Figure 4.28: FTIR spectra of (a) PEG-treated GNP and (b) Azo-treated GNP without using catalysts. ........................................................................................................ 168
Figure 4.29: Raman spectra of the (a) Azo-treated GNP and (b) PEG-treated GNP in comparison with pristine sample in the presence of different Lewis acids. ............ 170
Figure 4.30: Thermogravimetric analysis of the (a) Azo-treated GNP and (b) PEG-treated GNP in comparison with pristine sample in the presence of different Lewis acids......................................................................................................................... 172
Figure 4.31: TEM images of (a–c) pristine sample, (d) PEG-treated GNP and (e) Azo-treated GNP. .................................................................................................... 175
Figure 4.32: FTIR spectra of pristine and acid treated GNP. ................................ 176
Figure 4.33: TEM images of (A) pristine, (B and C) acid-treated GNP. ............... 177
Univers
ity of
Mala
ya

xviii
Figure 4.34: The colloidal stability of HCFLG in distillated water as a function of time and weight concentration. ............................................................................... 179
Figure 4.35: (a) Thermal conductivity and (b) specific heat capacity plots of water-based HCFLG nanofluids at different weight concentrations as well as distillated water. ....................................................................................................................... 181
Figure 4.36: Plots of the measured values of viscosity versus shear rate for water-based HCFLG nanofluids at different temperatures and weight concentrations. ... 183
Figure 4.37: Photographs of functionalized and expanded graphite dispersed in (a) DMF, (b) DMA, (c) g-butyrolactone and (d) EG.................................................... 185
Figure 4.38: (a) UV–Vis spectra of water-based SGr nanofluids at different concentrations and (b) the colloidal stability of SGr in distillated water as a function of time and weight concentration. ........................................................................... 186
Figure 4.39: (a) Thermal conductivity and (b) specific heat capacity plots of water-based SGr nanofluids at different weight concentrations as well as distillated water. ....................................................................................................................... 189
Figure 4.40: Plots of the measured values of viscosity versus shear rate for water-based SGr nanofluids at different temperatures and weight concentrations. .......... 191
Figure 4.41: (a) UV–Vis spectrum of CNDG-WEG at different concentrations and (b) the colloidal stability of CNDG in water-EG mixture as a function of time and weight concentration. .............................................................................................. 194
Figure 4.42: The colloidal stability of the HCND-WEG for weight concentration of 0.01 wt.% obtained by performing UV measurements for 20 days on suspensions mechanically stirred with speed range ~ 1000 rpm every day. ............................... 195
Figure 4.43: Zeta-potential and electrical conductivity of CNDG-WEG at 25 °C. ........................................................................................................................... 196
Figure 4.44: Zeta-potential of CNDG-WEG at weight concentrations of (a) 0.001, (b) 0.005 and (c) 0.01 wt.%. ......................................................................................... 197
Figure 4.45: Thermal conductivity plot of CNDG-WEG at different weight concentrations and pure water–EG mixture. ........................................................... 199
Figure 4.46: The effects of inlet temperature and weight concentration of CNDG-WEG on the specific heat capacities of coolant. ..................................................... 204
Figure 4.47: The relative Mo numbers of CNDG-WEG for turbulent flow conditions. ................................................................................................................................. 205
Figure 4.48: Photographs of EG-treated GNP dispersed in water–EG (after 1 month). ................................................................................................................................. 206
Figure 4.49: Thermal conductivity plot of GNP-WEG and pure water-EG mixture. ................................................................................................................... 209
Univers
ity of
Mala
ya

xix
Figure 4.50: The effects of temperature and weight concentrations of EG-treated GNP on the specific heat capacity of GNP-WEG coolant. ..................................... 210
Figure 4.51: Thermal conductivity of GNP-based water nanofluids at different temperatures and weight concentrations. ................................................................ 211
Figure 4.52: Viscosity of the GNP-based water nanofluids as a function of temperature and concentration for a shear rate of 300 s−1. ..................................... 213
Figure 4.53: Plot of absorbance versus wavelength for (1) pure PEG and PEG-treated GNP, (2) pure Azo and Azo-treated GNP, (3) photographs of (a) the pristine GNP/water and PEG-treated GNP/water catalyzed by (b) AlCl3, (c) FeCl2, (d) TiCl4, (e) ZnCl2, (4) (4) photographs of (f) the pristine GNP/acetone and Azo-treated GNP/acetone catalyzed by (g) AlCl3, (h) FeCl2, (i) TiCl4 and (j) ZnCl2................. 215
Figure 4.54: Plot of colloidal stability of PEG-treated GNP in Di-water and Azo-treated GNP in acetone in the presence of different catalysts. ................................ 217
Figure 4.55: A comparison of the data obtained from the Gnielinsky and Dittus-Boelter correlations and the experimental data for the Water-EG mixture at the inlet temperature of 45 °C. .............................................................................................. 224
Figure 4.56: The average outlet temperature (Tout) as a function of flow rate for the car radiator in the presence of GNP-WEG as well as pure basefluid at inlet temperatures of (a) 35, (b) 45 and (c) 55 °C. .......................................................... 226
Figure 4.57: The effects of Reynolds number and concentration of EG-treated GNP on the convective heat transfer coefficient at the inlet temperatures of (a) 35 °C, (b) 45 ºC and (c) 55 °C. ................................................................................................ 228
Figure 4.58: The average Nusselt numbers of GNP-WEG at different concentrations and volume flow rates for (a) 35 °C, (b) 45 ºC and (c) 55 °C. ................................ 230
Figure 4.59: Pressure drop of the car radiator for different flow rates and weight concentrations of GNP-WEG as well as deionized water at Tin of 55 °C. .............. 231
Figure 4.60: Effect of Inlet temperature of working fluid on the pressure drop at concentration of 0.1 wt%. ....................................................................................... 232
Figure 4.61: Effect of volume flow rate and concentration of EG-treated GNP on the friction factor at inlet temperature of 55 °C. ........................................................... 233
Figure 4.62: Effect of volume flow rate and inlet temperature of working fluid on the friction factor at concentration of 0.1 wt%. ............................................................ 234
Figure 4.63: The performance index of the synthesized coolant versus flow rate at different concentrations of EG-treated GNP. .......................................................... 235
Figure 4.64: The performance index of the synthesized coolant versus flow rate at different temperatures and concentration of 0.1 wt%. ............................................ 236
Figure 4.65: Pumping power of GNP-WEG for different concentrations and temperatures. ........................................................................................................... 237
Univers
ity of
Mala
ya

xx
Figure 4.66: Radiator Efficiency of GNP-WEG at different concentrations and volume flow rates for different inlet temperatures of (a) 35 °C, (b) 45 ºC and (c) 55 °C. ........................................................................................................................... 239
Figure 4.67: The average outlet temperature (Tout) of car radiator in the presence of CNDG-WEG as well as Water-EG mixture at different inlet temperatures. .......... 242
Figure 4.68: The effects of Reynolds numbers and weight concentrations of CNDG on the forced convective heat transfer coefficient at different inlet temperatures. . 245
Figure 4.69: The Nusselt number enhancement of CNDG-WEG at different concentrations, inlet temperatures and volume flow rates. ..................................... 247
Figure 4.70: Pressure drop of the car radiator at different flow rates and weight concentrations of GNP-WEG and inlet temperatures. ............................................ 249
Figure 4.71: The pressure drop of the car radiator for different Tf (the average temperature between inlet and outlet) and weight concentrations of CNDG-WEG at volume flow rate of 7 lit/min. ................................................................................. 250
Figure 4.72: The performance index of the CNDG-WEG coolants at different flow rates, inlet temperatures and weight concentrations. .............................................. 252
Figure 4.73: (a) Electrical conductivity and (b) enhancement in electrical conductivity of CNDG-WEG at different weight concentrations and temperatures (c) the ratio of the thermal conductivity (κ) to the electrical conductivity (σ) of CNDG-WEG for different weight percentages ................................................................... 254
Figure 4.74: Measured temperature of the heated wall (TS), the temperature difference between the wall and the fluid bulk (TS-Tb), local convective heat transfer coefficient (h) and Nusselt number (Nu) versus X/D for distillated water at different Reynolds numbers (Re). .......................................................................................... 263
Figure 4.75: Measured temperature of the heated wall (TS), the temperature difference between the wall and the fluid bulk (TS-Tb), local convective heat transfer coefficient (h) and Nusselt number (Nu) versus X/D for water-based HCFLG nanofluid at 0.001 wt%. .......................................................................................... 265
Figure 4.76: Measured temperature of the heated wall (TS), the temperature difference between the wall and the fluid bulk (TS-Tb), local convective heat transfer coefficient (h) and Nusselt number (Nu) versus X/D for water-based HCFLG nanofluid at 0.005 wt%. .......................................................................................... 266
Figure 4.77: Measured temperature of the heated wall (TS), the temperature difference between the wall and the fluid bulk (TS-Tb), local convective heat transfer coefficient (h) and Nusselt number (Nu) versus X/D for water-based HCFLG nanofluids at 0.01wt%. ............................................................................................ 267
Figure 4.78: Average heat transfer coefficient of distillated water and water-based HCFLG nanofluids over a backward-facing step.................................................... 268
Figure 4.79: The effects of Reynolds numbers and weight concentrations of HCFLG on the Nusselt numbers at different axial ratios. ..................................................... 270
Univers
ity of
Mala
ya

xxi
Figure 4.80: The effects of Reynolds numbers and weight concentrations of HCFLG on the position of maximum Nusselt numbers. ....................................................... 271
Figure 4.81: (a) The measured values of pressure drop in the set-up at different Re numbers for distillated water and water-based HCFLG nanofluids with different weight concentrations. (b) Experimental friction factor for distillated water and water-based HCFLG nanofluids with different weight concentrations at different Re numbers. .................................................................................................................. 273
Figure 4.82: (a) Performance evaluation criterion (PEC) and performance index (PI) of water-based HCFLG nanofluid; (b) pumping power ratio for the backward-facing step in the presence of distillated water and water-based SGr nanofluids with different weight concentrations.............................................................................................. 275
Figure 4.83: The temperature of the heated wall (TS) and the temperature difference between the wall and the fluid bulk (TS-Tb) for water and water-based SGr nanofluids. ............................................................................................................... 277
Figure 4.84: Experimental Nusselt number of distillated water and water-based SGr nanofluids at weight concentrations of 0.001, 0.005 and 0.01% for different Re numbers. .................................................................................................................. 279
Figure 4.85: Average heat transfer coefficient of distillated water and water-based SGr nanofluids over a backward-facing step. ......................................................... 280
Figure 4.86: The effects of Reynolds number and weight concentration of SGr on the local heat transfer coefficient at different axial ratios. ............................................ 282
Figure 4.87: The effects of Reynolds number and weight concentration of SGr on the position of maximum local heat transfer coefficient............................................... 283
Figure 4.88: (a) The measured value of pressure drop of the set-up at different Re numbers for distillated water and water-based SGr nanofluids with different weight concentrations. (b) Experimental friction factor for distillated water and water-based SGr nanofluids with different weight concentrations at different Re numbers. ..... 285
Figure 4.89: (a) Performance evaluation criterion (PEC) and performance index (PI) and (b) pumping power for the backward-facing step in the presence of distillated water and water-based SGr nanofluids with different weight concentrations. ....... 287
Figure 4.90: Efficiency of thermosyphon in the presence of GNP-based water nanofluids at various concentrations. ...................................................................... 294
Figure 4.91: Effect of input power and concentration of GNP-based water nanofluids on the average temperature difference (ΔT) between the evaporator and the condenser. ................................................................................................................................. 296
Figure 4.92: Effect of input power and concentration of GNP-based water nanofluids on the average temperature of the evaporator section. ............................................ 297
Figure 4.93: Effect of input power and concentration of GNP-based water nanofluids on the thermal resistance of thermosyphon. ............................................................ 298
Univers
ity of
Mala
ya

xxii
Figure 4.94: Effect of input power and concentration of GNP-based water nanofluids on the overall heat transfer coefficient of thermosyphon........................................ 299
Figure 4.95: Effect of input power and concentration of GNP-based water nanofluids on the entropy of the thermosyphon. ...................................................................... 300
Figure 4.96: Effect of input power and concentration of GNP-based water nanofluids on the vacuum pressure drop of thermosyphon. ..................................................... 302
Figure 4.97: 2D geometrical configuration of backward-facing step. ................... 308
Figure 4.98: Local Nusselt numbers for Re = 5000 and pure water at three different grid distributions. .................................................................................................... 309
Figure 4.99: Mesh configuration of backward facing step. ................................... 310
Figure 4.100: Streamline of velocity with weight fraction of 0.2% (a) Re = 5000, (b) Re = 10,000, (c) Re = 15,000, isothermal streamline with weight fraction of 0.2% (d) Re = 5000, (e) Re = 10,000, (f) Re = 15,000. ......................................................... 312
Figure 4.101: Convective heat transfer coefficient as a function of different weight concentrations at different Reynolds numbers of (a) 5000, (b) 10,000, and (c) 15,000 and the local Nusselt number as a function of different concentrations at (d) Re = 5000, (e) Re = 10,000, and (f) Re = 15,000. ........................................................... 314
Figure 4.102: (a) Prediction of skin friction factor, (b) the ratio of skin friction factors of EGNP to basefluid, and (c) the performance index of the synthesized coolant versus weight concentrations of EGNP for various Reynolds numbers. ........................... 317
Univers
ity of
Mala
ya

xxiii
LIST OF TABLES
Table 2.1: Summary of experiments on convective heat transfer of graphene-based nanofluids. ................................................................................................................. 79
Table 2.2: Summary of experimental results on thermal conductivity of graphene-based nanofluids. ....................................................................................................... 81
Table 3.1: Zeta potential and associated suspension stability (Vandsberger, 2009) 99
Table 3.2: Specifications and errors of the measuring instruments and sensors used in the present experiment. ....................................................................................... 103
Table 3.3: Technical specifications for V8 series inverters. .................................. 105
Table 3.4: Specifications of the refrigerated bath. ................................................. 107
Table 3.5: Dimensions of the test section .............................................................. 111
Table 3.6: Test condition during the experiments. ................................................. 116
Table 4.1: Peak positions of various groups in C1s Spectra of pristine graphite, CE-GR and thermally-treated graphene. ....................................................................... 132
Table 4.2: Pore structure of the CE-GR and T-GR ................................................ 139
Table 4.3: The content distributions of N species in HCG and HCNDG. ............. 146
Table 4.4: Pore structure of the HCG and HCNDG. .............................................. 153
Table 4.5: Identification of catalysts for formation of the electrophilic addition reactions. ................................................................................................................. 171
Table 4.6: Comparative study of the functionalization of compounds in the presence of different catalysts ................................................................................................ 174
Table 4.7: Densities of the Di-water and water-based HCFLG nanofluids for different concentrations. ........................................................................................................ 184
Table 4.8: Densities of the water and water-based SGr nanofluids for different concentrations. ........................................................................................................ 192
Table 4.9: Dynamic viscosity of the CNDG-WEG as a function of temperature and weight concentration at shear rate of 140 s-1. .......................................................... 198
Table 4.10: Dynamic viscosity of the GNP-WEG as a function of temperature and weight concentration at shear rate of 140 s-1. .......................................................... 207
Table 4.11: Densities of the water-EG mixture and GNP-WEG at different concentrations. ........................................................................................................ 207
Univers
ity of
Mala
ya

xxiv
Table 4.12: The average increase in the viscosity of nanofluids compared with deionized water. ...................................................................................................... 214
Table 4.13: Measurement uncertainties. ................................................................ 261
Univers
ity of
Mala
ya

xxiii
NOMENCLATURE
A absorbency
AFM Atomic force microscopy
B Optical path (cm)
BET Brunauer–Emmett–Teller
c Molar concentration (mol/dm3)
Cp Specific heat capacity, J/g K
CTAB Cetyltrimethylammonium bromide
CHF Critical heat flux
CE-Gr Chemically-exfoliated Graphene
CNT Carbon nanotube
CNDG Crumpled nitrogen doped graphene
CVD Chemical vapor deposition method
D Diameter, m
DGU Density gradient ultracentrifugation
DSC Differential scanning calorimetry
DW Distilled water
f Friction factor
FT-IR Fourier transform infrared spectroscopy
GA Gum Arabic
GO Graphene oxide
GNP Graphene nanoplatelets
h Convective heat transfer coefficient
HC Hamilton-Crosser
I Electrical current, A
Univers
ity of
Mala
ya

xxiv
k Thermal conductivity, W/m.K
L Tube length, m
MWCNT Multi-walled carbon nanotube
HCG Highly crumpled graphene
HCFLG Highly crumpled few-layer graphene
HCNDG Highly crumpled nitrogen-doped graphene
NDG Nitrogen-doped graphene
Nu Nusselt number
P Heater power, W
Pe Péclet number
PEG Poly Ethylene Glycol
PEC Performance evaluation criterion
PI Performance Index
Pr Prandtl number
PVD Physical vapor deposition method
q″ Heat flux, W/m2
Re Reynolds number
rGO Reduced graphene oxide
SAED Selected area electron diffraction
SDBS Sodium dodecyl benzene sulfonate
SDS Sodium dodecyl sulfonate
SEM Scanning electron microscopy
SSA Specific surface area
SWCNT Single-wall carbon nanotube
T Temperature, K
TEM Transmission electron microscopy
Univers
ity of
Mala
ya

xxv
TGA Thermogravimetric analysis
T-Gr Thermally-exfoliated graphene
THW Transient hot-wire
U Mean velocity, m/s
V Volts, V
v Mean velocity, m/s
w Water
W Watt
x Axial distance
XRD X-ray diffraction
XPS X-ray photoelectron spectroscopy
Uave Average velocity (m/s)
mº Mass flow rate (Kg/s)
Ac Surface area of the cross section (m2)
Tsx The wall temperature of fluid at the axial distance x
Tbx The bulk temperature of fluid at the axial distance x
XPS X-ray photoelectron spectroscopy
Rh Ratio of the heat transfer coefficient enhancement of new coolant
to the base-fluid
RΔp Ratio of pressure drop of new coolant to the base-fluid
PLC Programmable logic controller
RTD Resistance temperature detector
Greek
ΔP pressure drop, Pa
wt% weight percentage
Univers
ity of
Mala
ya

xxvi
ϕ nanoparticle volumetric fraction
µ viscosity, Pa.s
ε Performance Index
ρ density, kg/m3
𝜂 thermal performance factor
𝜎 Electrical conductivity
Subscripts
avg average
b bulk
bf base fluid
i inner
in inlet
m mean
nf nanofluid
np nanoparticle
out outer
out outlet
s & w wall
Univers
ity of
Mala
ya

xxvii
LIST OF APPENDICES
Appendix A: UNCERTAINTY ANALYSIS ............................................................. 361
A.1 Introduction ................................................................................................... 361
A.2 Theory ........................................................................................................... 361
A.3 Uncertainties ................................................................................................. 362
A.4 Summary ....................................................................................................... 367
Appendix B: XRD ANALYSIS .................................................................................. 368
B.1 Introduction ................................................................................................... 368
APPENDIX C: ANALYSIS AND INSTRUMENTS ................................................ 369
C.1 List of sample preparation and characterization instruments ...................... 369
Univers
ity of
Mala
ya

1
CHAPTER 1: INTRODUCTION
1.1 Background
1.1.1 Water-based carbon nanostructures dispersions
Since colloidal system was first experimentally introduced within thermal
engineering community, rapid growths of exploration into the fundamental theory as well
as extensive research on its potentials to address persisting heat transfer limitations have
shown promising results. In particular, the incorporation of colloidal system is the key to
major advancement in various thermal related researches such as energy storage and
conversion and thermal transport systems. It is also evident that the trend of research has
seen a dramatic transition in terms of the type of material used to generate the colloidal
system along with the engineered morphological structures that constitute major impact
on the technological progress. This is due to the fact that these two elements govern the
change in most physicochemical properties of colloids. Most of the current research
efforts have focused on carbon based materials of different dimensions and morphologies
owing to its superior thermal properties in comparison to oxide, metal and nitride based
materials which were extensively employed in the early period of the researches. The
pivotal cornerstone of this shift is associated to the growing evolution on the ability to
stabilize carbon based colloids in various polar and non-polar solvents in particular the
aqueous system. Nevertheless, the importance of addressing the stabilization issue also
befalls on other types of colloids since the key towards incorporating this approach lies
on the ability to ideally generate discrete suspension with minimal agglomeration as well
as leaning towards surfactant free matrix, which is known as impact provider on the
property of the colloidal systems.
The use of covalent and noncovalent functionalization to improve the stability of
aggregated prone structure in colloidal system is a relatively new approach within the
subject of colloidal stability. The fact that long chain molecules such as surfactant, etc.
Univers
ity of
Mala
ya

2
are replaced with orderly structured nanoparticles ensures that the physical properties of
the mixture remain uncompromised since nanoparticles themselves pose a relatively
similar property to the host colloids. It is evident that long chain molecules are capable
of improving colloidal stability, the major challenge lies on their low thermal property
which is known to induce negative impact on the overall potential of the colloids.
Moreover, removal of these substances also requires extended procedures and does not
guaranty completely purified end products. In energy transport applications which mostly
involves liquid medium, surfactant grafted on colloids will act as insulator which disturbs
the phonon transport among colloids. The low degradation temperature of surfactant and
other non-covalent molecules such as polymers also restrict their usage to low
temperature applications. In addition, owing to the formation of foam problem associated
with the use of surfactants and long-chain polymers for non-covalent functionalization of
carbon-based nanostructures, covalent functionalization can be a promising alternative
for preparing stable dispersion for heat transfer and fluid flow applications to meet the
requirements of foam-free working fluids. These shortcomings can be addressed by
employing highly covalently-functionalized carbon-based nanostructures with
hydrophobic molecules, which can radically react with the carbon-based nanostructures,
thus providing the overall coolant with high stability.
Considering the high thermal conductivity of free-defected graphene, they can be
a superior additive to prepare highly-conductive heat transfer working fluids. Balandin et
al. (2008) have reported an experimental thermal conductivity of 5300 W mK -1 for a
single layer graphene (higher than all of the carbon allotropes). However, in order to apply
few-layered graphene as an additive in various working fluids, three obstacles should be
solved.
1. Finding a method for mass production of graphene with high quality and specific
surface area in a commercially viable way.
Univers
ity of
Mala
ya
3
2. Finding suitable functional groups for decorating on graphene sheets to reach
highly-stable colloidal system, mostly, in aqueous media. Functional groups
should be selected wisely to avoid re-stacking, corrosion and foaming.
3. Finding an efficient, one-pot, industrially-scalable, cost-effective and facile
functionalization method for synthesizing highly soluble graphene sheets.
1.1.2 Mass-production of graphene
Over the last decade, the research on efficient, scalable and economical ways to
produce high quality graphene has witnessed unprecedented breakthrough (Konstantin S
Novoselov et al., 2012). It was known that several routes have been explored to exfoliate
graphene which include micromechanical cleavage (KS Novoselov et al., 2005),
topological growth on metal and non-metal substrate (Berger et al., 2006; Marchini et al.,
2007; Ohta et al., 2008), chemical oxidation (Dikin et al., 2007; D. Li et al., 2008; Yeh et
al., 2015) and solution phase processing (Athanasios B Bourlinos, Vasilios Georgakilas,
Radek Zboril, Theodore A Steriotis, & Athanasios K Stubos, 2009; Hernandez et al.,
2008; Matsumoto et al., 2015b; Paton et al., 2014). It is also evident that the first three
approaches suffer from scalability, cost effectiveness and quality issues (Kovtyukhova et
al., 2014; Loh et al., 2010; Matsumoto et al., 2015b; Sutter et al., 2008; S. Zhou et al.,
2008). As a low-cost and highly scalable method, chemical exfoliation was also suggested
for synthesizing mono- or few-layered graphene. This method comprises of graphene
oxide (GO) synthesis through chemical oxidation of graphite and subsequently
exfoliation via ultrasonic. However, the structural defects of GO cannot be completely
removed even with thermal reduction and chemical treatment. Obviously, the presence of
structural defects considerably restricts the applications of GO in different equipment
(Becerril et al., 2008; Stankovich et al., 2007; Zhu, Murali, Cai, et al., 2010). More
recently, a novel liquid-phase exfoliation illustrated significant performance in forming
Univers
ity of
Mala
ya

4
2D carbon-based nanostructures. Liquid-phase exfoliation refers to a group of approaches
that exfoliate bulk graphite into thing graphene (mono- or few-layered graphene) in the
liquid media directly. The lack of chemical oxidation is one of the advantages with this
method. On this note, special interest has been directed on liquid phase exfoliation which
typically employs fluids of specific properties along with external excitation to overcome
Van der Waals attraction and π-π bonding interaction between the graphene layers (W.
Du et al., 2013; Hernandez et al., 2008; Lotya et al., 2009). This approach was inspired
by the previous success in CNT debundling using solvents which interact strongly with
nanotubes surfaces (Bergin et al., 2008; Tawfique Hasan et al., 2007). The close
resemblance between CNT and graphene with respect to the mode of molecular attraction
has become the premise for graphene exfoliation using similar solvents (Hernandez et al.,
2008). This method was proven to address the above limitations of graphene production
toward achieving mono- and/or few layered crystal exfoliation. Nevertheless, the
challenge remains on producing high yield and quality in addition to defect-free pristine
graphene (Bracamonte et al., 2014) in order to harness its intrinsic properties (Geim &
Novoselov, 2007; K. Novoselov et al., 2005; K. Novoselov et al., 2004; Pisana et al.,
2007; Y. Zhang et al., 2005). Therefore, the liquid-phase exfoliation strategy has been
obtaining great attention due to its unique properties such as being cost-effective,
efficient, extraordinarily versatile and potentially for large-scale production of defect
free graphene (Hernandez et al., 2008; Paton et al., 2014).
Although lots of liquid-phase exfoliation approaches for scalable few-layered
graphene synthesis have been emerging (Edwards & Coleman, 2013), the second
fundamental problem is the difficulties in processing graphene, in particular in our study,
the graphene's poor colloidal stability in most common solvents (Ayan-Varela et al.,
2014). Nonetheless, many of graphene’s applications cannot be fully realized due to weak
solubility of graphene in most common solvents. So, graphene sheets are needed with
Univers
ity of
Mala
ya
5
high solubility in different working fluids. Therefore, in order to improve the interactivity
and solubility of graphene, functionalization was reported elsewhere as a general solution
(Johnson et al., 2015; Zhengzong Sun et al., 2010). Thus, a method is needed for mass
production of functionalized graphene sheets. In situ functionalization and exfoliation of
graphite into graphene sheets can be a gateway for solving all the aforementioned
problems. Accordingly, various functionalities such as amines, aryl diazonium salt, and
halogens have been employed onto graphene surface and edge. Selecting an appropriate
functional groups is another criterion for reaching stable dispersion. Among the various
functional groups attached to the carbon-based nanostructures, amines are attached in a
relatively simple procedure. In fact, the nitrogen atom of the amino group (–NH2) as well
as oxygen atom of the hydroxyl can easily be available for covalent bonding to other
molecules. Because of this reactivity, the amine- and hydroxyl-functionalized graphenes
are frequently used in fabrication of electrodes, composites, and membranes. Between all
functional groups including amine molecules and hydroxyl groups, non-corrosive
functional groups with hydrophilicity and preferably mono-functional groups are more
favorite molecules, since they could realize high stability for graphene sheets and limits
the negative effects of oxidative groups.
Also, in order to apply the different functionalities including amino or hydroxyl
groups, some conventional methods such as sonication and mixing have been employed.
However, these methods are often time-consuming and on a small-scale plan, as well as
comprising multiple steps. Recently, the microwave radiation was proposed as an
efficient and facile method for functionalization of different carbon-based nanostructures.
It has also shown to result in lower structural defects on carbon nanostructures’ surface
compared with the conventional methods. Thus, it can be a great method for in situ
functionalization and exfoliation. Noteworthy, the reaction intensifies under microwave
irradiation. When carbon nanostructures are exposed to microwaves, strong absorptions
Univers
ity of
Mala
ya
6
are obtained, which produces intense heating. Although the utilization of microwaves for
the activation of carbon nanostructures has not been fully explored, the strong absorptions
can open the door to the radical reactions. Note that the decomposition of the functional
groups on functionalized flakes under microwave irradiation can also generate some
pressure for overcoming the van der Waals interaction among graphene layers during the
microwave procedure.
The enhancement in solubility of graphene sheets after in situ functionalization
and exfoliation under microwave irradiation which can result in further enhancement in
thermo-physical properties, thus paving ways for its application within thermal transport
domain.
Investigation on the effect of incorporating carbon based materials in improving
convective heat transfer in different thermal equipment such as heat exchanger, duct with
sudden expansion, closed conduit has recently received considerable interest by
researchers. Due to the enhancement in thermal conductivity of the base fluid with the
addition of carbon nanostructure, the overall heat transfer performance was believed to
be increased accordingly. It is worthy to mention that pristine graphene for instance
exhibit more than 5000 times of the thermal conductivity of water, much higher than
oxide, metal or nitride based materials. Thus, theoretically, a small amount of this highly
conductive material is sufficient to cause significant change on the conductivity of the
base fluid provided that a well dispersed colloidal mixture can be established. Further,
the fact that only a small amount of filler material is required within the colloidal mixture
along with the formation of well homogenized system implies that the viscosity will
remain close to the base fluid. This condition negligibly compromises the pumping power
penalty and provides favorable enhancement of the overall energy transport system.
While research community within thermal engineering domain has been focusing on
metal- and metal oxide-based colloids on improving heat transfer performance of
Univers
ity of
Mala
ya

7
different thermal equipment such as ducts and channels with abrupt expansion, closed
conduit, car radiator, two-phase closed thermosyphon, etc. It was not until recent years
that attention has been increasing on switching into solution containing carbon-based
additives as the heat transport medium due to the ability to tackle the stability issue.
Note that large specific surface area and outstanding thermal conductivity at room
temperature make the few-layer graphene significantly promising material for heat
transfer applications. Developing an efficient and quick method for mass-production of
the few layer graphene, however, is critical for its large-scale industrial applications such
as for developing high performance nanofluids. It is also well known that thermal
conductivity and subsequently heat transfer rate improve as the specific surface area of
graphene increases (Sarsam, et al., 2016a). Therefore, in order to manufacture highly-
conductive nanofluids for improving heat transfer rate in different thermal equipment,
materials with high specific surface areas, such as crumpled graphene or highly porous
material, and in particular, few-layered graphene can be more suitable.
1.2 Objectives of present research
The objectives of the present work are:
To determine facile and economical methods for mass production of few-layered
graphene sheets via in situ liquid phase exfoliation and functionalization of
graphite
To investigate the effects of different hydrophilic functional groups and degree of
functionalization on solubility of graphene sheets in aqueous media.
To develop a quick covalent functionalization method for mass production of
graphene-based nanofluids.
To investigate the colloidal stability of covalently-functionalized graphene in
aqueous media.
To investigate the thermo-physical properties of the synthesized nanofluids.
Univers
ity of
Mala
ya

8
To investigate the effect of highly dispersed graphene based materials on
improving convective heat transfer rate in different thermal equipment such as
ducts with a backward-facing step, close conduit, thermosyphon, and car
radiator.
1.3 Motivation of Research
The lack of a facile and economical method is one of the biggest problems for the
scalable synthesis of few-layered graphene sheets. On the other hand, most of the reported
researches resulted in pure graphene, which is extremely hydrophobic and do not have
any tendency to solve in polar solvents. In situ exfoliation and functionalization can be a
great solution to solve above-mentioned problems. To this end, introducing a strong
radical reaction between graphene/ghraphite sheets with high-branch hydrophilic
molecules can be a great solution. Moreover, performing reaction can speed the reaction.
To do exfoliation simultaneously, selecting a solvent with surface energy matching the
van der Waal attraction of graphite can be a great solution for mass production of
functionalized graphene sheets. Covalently-functionalized graphene with hydrophilic
molecules can be very good additive for enhancing thermal conductivity of conventional
base fluids for improving thermal performance of heat exchangers, car radiators, two-
phase closed thermosyphon, etc. Utilization of highly conductive working fluids let
engineers to do effective energy optimization in different infrastructure, industry, defense
etc.
1.4 Thesis Overview
This thesis consists of five chapters. Chapter 1 is the “Introduction” that provides
background about the areas of this study, highlights the current problems that motivated
this research, and clarifies the objectives through which the aim of this study can be
reached. Chapter 2 is the “Literature Review” which comprehensively surveys the
Univers
ity of
Mala
ya

9
previous published studies related to the field of study which can be categorized as:
different methods for liquid-phase exfoliation, functionalization-assisted exfoliation,
shear-based exfoliation, different methods for covalent functionalization of graphene
sheets, non-covalent functionalization, graphene-based nanofluids, and enhancement of
colloidal stability and its challenges. Chapter 3 is the “Methodology” which concerns
about the devices and methods used in this study for the preparation of samples,
characterization instruments and how to prepare their samples, measurement of
thermophysical properties, evaluation of colloidal stability, and the experimental test
setup that is built and used for investigation of the thermal performance of graphene-
based nanofluids. Chapter 4 is the “Results and Discussion” which includes three main
sections: i) description of new in situ exfoliation and functionalization methods and
synthesis of novel graphene along with all the characterization; ii) preparation of
nanofluids with the prepared graphene sheets, evaluation of colloidal stability and
thermophysical properties and compare them with the recent results, iii) lists, compares
and discusses the data obtained from experiments to evaluate overall performance of
different thermal equipment e.g., car radiator, two phase closed thermosyphon, and heat
exchangers. Finally, chapter 5 is the conclusion and recommendations in which the
important outcome of this study are briefly summarized with some recommendations for
future work in this research field.
Univers
ity of
Mala
ya
10
CHAPTER 2: LITERATURE REVIEW
2.1 Introduction
After the discovery of carbon-based nanostructures, two-dimensional (2D)
graphene has attracted intensive research attention because of its unique properties. Mono
layer graphene with remarkable properties such as high thermal conductivity of the order
of 5000 W m-1K-1, large specific surface area of 2630 m2 g-1, high intrinsic mobility of
2× 105 cm2 V−1 s−1, Young’s modulus of 1.0 TPa, and high electrical conductivity have
high potential for different high tech applications (Geim & Novoselov, 2007; Huang et
al., 2011; Konstantin S Novoselov et al., 2012; Zhu, Murali, Cai, et al., 2010). Owning to
its unique properties such as low flake resistance and good transmittance, graphene was
applied in different electronic devices including the organic light emitting diodes and
touch screen displays. Note that the outstanding mechanical and chemical stability of 2D
graphene make it unique and exclusive to rigid indium tin oxide (ITO).
In addition, possessing comprehensive absorption ranging from ultraviolet to
infrared and ultrafast response, graphene could be used in different photodetectors (J. Li
et al., 2014) and various optical modulators (Sensale-Rodriguez et al., 2011). Graphene
has also illustrated superior potential for fabricating highly effective storage devices, such
as solar cells, supercapacitors, and lithium-ion batteries.
Due to the numerous applications of graphene, there is a need to develop a
commercially viable method for mass production of high quality graphene. This is a
critical issue if different industries are to use novel 2D graphene material for large scale
applications. To date, some methods have been reported for mass production of mono
layer graphene, such as chemical vapor deposition (CVD), chemical exfoliation,
exfoliation methods by micromechanical cleavage, and liquid-phase ultrasonic
exfoliation. Among these methods, the CVD has been used extensively for production of
graphene. In order to synthesize mono- and few-layered graphene sheets with the CVD
Univers
ity of
Mala
ya

11
method, precursors react on transition metal substrates at high temperature. The CVD is
able to synthesize mono- or few-layered graphene with superior quality; however, the
approach requires stringent manufacturing conditions such as high vacuum and high
temperature. Note that the CVD method is also size-limited, which is the major problem
of this method. In addition, in CVD the transfer procedure from the surface of metal to
target substrates may induce some defects, leading to low-quality graphene and associated
deteriorating performance. To increase the performance of the CVD synthesis and the
transfer procedures, many studies have been done (Obraztsov, 2009; Yu Wang et al.,
2011); however, further discussions of the details of these procedures are outside the
scope of this thesis.
The bulk graphite as a layered material possesses strong in-plane chemical bonds
and weak out-of-plane interactions, which correspond to the van der Waals forces.
Therefore, exfoliation of bulk graphite to thin graphene flakes with thickness of
nanometer is possible. To take advantage of this idea, micromechanical cleavage was
introduced (Ferrari et al., 2006; Sutter et al., 2008). However, the micromechanical
cleavage has shown very low performance and can produce extremely low amount of
few-layered graphene. As a low-cost and highly scalable method, chemical exfoliation
was suggested for synthesizing mono- or few-layered graphene (Lomeda et al., 2008;
Marcano et al., 2010; Zhengzong Sun et al., 2011). This method comprises of
synthesizing graphene oxide (GO) through chemical oxidation of graphite and subsequent
exfoliation via ultrasonic. However, the structural defects of GO cannot be completely
removed even with thermal reduction and chemical treatment. Obviously, the presence of
structural defects restricts the applications of graphene oxide in electronic and optical
devices (Becerril et al., 2008; Stankovich et al., 2007; Zhu, Murali, Cai, et al., 2010).
More recently, a novel liquid-phase exfoliation was introduced that shows significant
performance in forming 2D carbon-based nanostructures (Hernandez et al., 2008). Liquid-
Univers
ity of
Mala
ya

12
phase exfoliation refers to a group of approaches that exfoliate bulk graphite into thin
graphene (mono- or few-layered graphene) directly in the liquid media. The lack of
chemical oxidation is an advantage of this method.
Liquid-phase exfoliation includes:
i) Various ultrasonic exfoliation techniques such as liquid phase exfoliation by
surfactants, organic solvents, ionic liquids, and salts.
ii) Electrochemical exfoliation in different liquid media.
iii) Shear exfoliation method.
The liquid-phase exfoliation strategy has attracted considerable attention due to
its unique properties such as being cost-effective, efficient, extraordinarily versatile and
having the potential for large-scale production of defect-free graphene (Hernandez et al.,
2008; Paton et al., 2014). Although a number of liquid-phase exfoliation approaches for
synthesis of scalable few-layered graphene have been emerging (Edwards & Coleman,
2013), there are still difficulties with processing graphene, in particular, due to the weak
solubility and the poor colloidal stability of graphene in most common solvents (Ayan-
Varela et al., 2014). For example, pristine graphene tends to agglomerate in composites.
Therefore, in order to improve the interactivity and solubility of graphene,
functionalization was reported as a potential solution in the literature (Johnson et al.,
2015; Zhengzong Sun et al., 2010). With appropriate functionalization method, the
graphene can remain dispersed over a reasonable period of time.
In view of many great advantages of liquid phase exfoliation and the rapid
progress that is being made in the literature, this chapter aims to provide a comprehensive
review on the synthesis methods of mono- and few-layered graphene. In addition, the
effective functionalization strategies for solving the lack of dispersibility of graphene in
different media are also described. Also, for preparing graphene-based nanofluids, the
graphene must be dispersed at an appropriate concentration in a suitable base fluid for the
Univers
ity of
Mala
ya

13
heat transfer applications, and maintained in dispersed state over a reasonable period of
time. Also, current functionalization strategies to solve these challenges are the second
phase of this chapter (literature review). In the third section of this chapter, the
functionalized graphene-based nanofluids, which present the desirable heat transfer
properties and good solution dispersing ability, will be investigated.
2.2 Direct Ultrasonic Exfoliation
Direct ultrasonic exfoliation in liquid is referred to different approaches that
synthesize graphene via direct ultrasonication of the bulk graphite in liquid media. In this
method, two factors can critically influence the yield of exfoliation of the bulk graphite.
The first factor is having a strong bath sonication or probe sonication. This is because the
bulk graphite is effectively exfoliated upon exposure to the ultrasonic waves. Shear forces
or cavitation bubbles created from such waves can generate high amount of energy with
the collapse of bubbles in liquids that can change the main structure of bulk graphite from
layered structure to single- or few-layered graphene (Mason & Lorimer, 2002). The
second important factor is the liquid media used. There is commonly an energy barrier in
the interlayers of the graphite, and in the subsequent stabilization of nanosheets via
interfacial interactions. Different liquid media (ionic liquids, aqueous solutions of
stabilizers, and organic solvent) behave differently in decreasing the potential energy
barrier. To properly classify direct ultrasonic exfoliation, this part of the literature review
is organized into several sections based on the liquid media used.
2.2.1 Exfoliation in Organic Solvents
This approach includes the sonication of the bulk graphite in an organic solvent
and the subsequent purification procedure (Niu et al., 2016). In this method, the interfacial
tension between the bulk graphite and organic solvent is the most important parameter in
their interactions. As mentioned above, an appropriate organic solvent can decrease the
potential energy between adjacent layers in the bulk graphite to overcome the van der
Univers
ity of
Mala
ya

14
Waals attraction between layers (Blake et al., 2008; Hernandez et al., 2008; Israelachvili,
2011). In addition, the solvent–nanosheets interactions could balance the inter-sheet
attractive forces to stabilize the dispersion of graphene sheets in the suspension
(Hernandez et al., 2008; Israelachvili, 2011). There have been a number of investigations
on the interaction between the bulk graphite and organic solvents in the pursuit of
identifying the suitable solvents for efficient exfoliation, and enhancement of the stability
of concentrated dispersion of graphene sheets. These are described in this section.
In a comprehensive study, Coleman’s and coworkers (Hernandez et al., 2008)
investigated the liquid exfoliation performance of the bulk graphite with a series of
commonly-used organic solvents. They concluded that solvents with surface tension of
about 40 mJ m-2 like N-methyl-2-pyrrolidone (NMP) and N,N-dimethylformamide
(DMF) are the best candidates for mass-production of graphene sheets. In fact, surface
tension of 40 mJ m-2 is relatively close to the surface energy of graphene, which is 68 mJ
m-2 (Figure 2.1a). Note that the Raman spectrum of large graphene flakes shows no D
band, implying the lack of structural defects after the application of ultrasonic procedure
for 30 min. On the other hand, small graphene flakes show a weak D band, which is due
to the edge defect as is seen in Figure 2.1b. Figures 2.1c,d shows some transmission
electron microscopy (TEM) images of some graphene flakes with size of a few
micrometres (Hernandez et al., 2008). Interestingly, Hernandez et al. (2008) reported that
flakes with thickness of more than a few layers are rare, indicating high performance
liquid exfoliation. They concluded that the graphite was extensively exfoliated and
mainly single-layered and few-layered graphene was produced. Analyzing a large
number of TEM images and paying attention to the uniformity of the flake edges, they
found 28% of total number of flakes was monolayer graphene after sonication process in
NMP. Finally, they reported a dispersion concentration of 0.01 mg mL-1 and a flake size
range of 500 nm to 3 μm. The resulting weight fraction, however, was still too small to
Univers
ity of
Mala
ya

15
meet the industrial demands of large scale graphene production. Therefore, the search for
alternative organic solvents for production commercially viable graphene continues.
In order to synthesize homogenous dispersions of graphene nanosheets, Hamilton
et al. (2009) selected ortho-dichlorobenzene as a nonpolar solvent. Due to the surface
tension of 36.6 mJ m-2 and via - stacking, ortho-dichlorobenzene can easily interact
with graphene. But, the resulting weight concentration was improved to only 0.03 mg
mL-1, which is still quite low. In order to enhance the exfoliation yield, Bourlinos et al.
(Athanasios B Bourlinos, Vasilios Georgakilas, Radek Zboril, Theodore A Steriotis, &
Athanasios K Stubos, 2009) suggested the use of a peculiar series of perfluorinated
aromatic molecules such as pentafluorobenzonitrile (C6F5CN), hexafluorobenzene
(C6F6), pentafluoropyridine (C5F5N), and octafluorotoluene (C6F5CF3). According to
Figure 2.1: a) Graphite concentration measured after centrifugation for a range of solvents plotted versus solvent surface tension, b) Raman spectra of the graphite and few-layered graphene c) and d) TEM images of graphene (Hernandez et al., 2008).
Univers
ity of
Mala
ya

16
their results, in addition to the surface energy matching of the solvent and graphene, the
donor–acceptor interactions play an important role as a driving force for the exfoliation
of the bulk graphite. Overall, they reported that the pentafluorobenzonitrile (C6F5CN)
had the best results, showing the graphene sheets with thickness of 0.5–2 nm reaching a
concentration of 0.1 mg mL-1. The sequence of exfoliation yield was C6F5CN > C6F6 >
C5F5N > C6F5CF3. Also, a comparison between above-mentioned solvents and the
analogous hydrocarbon solvents such as benzene, and toluene showed that similar
solvents failed to produce stable suspension at high concentrations. In addition to the
selection of appropriate solvents, other parameters including ultrasonication power and
time were also studied to enhance the exfoliation performance. For instance, with a low-
power ultrasonication in NMP but using a long time period (up to 460 h), Khan and
coworkers (Khan, O'Neill, et al., 2010) reported increasing the graphene concentrations
up to 1.2 mg mL-1. The corresponding concentration of graphene versus sonication time
is presented in Figure 2.2a. It is seen that the concentrations of flakes in solutions
increases as the sonication time increases. However, Figure 2.2b shows that the flake
dimensions reduce with sonication time. The reduction of flake size is proportional to the
reverse of square root of time (t-1/2). Undoubtedly, long sonication times resulted in
inducing numerous edge- and basal plane defects. Later Khan et al. (2011) reported a
higher exfoliation performance (2 mg mL-1) by using a sonic tip. To enhance the
exfoliation yield, they also offered a novel method in which a pre-sonication and
centrifugation procedure was performed for eliminating big particles (unexfoliated
graphite). Then, the mixture was sonicated via a bath sonication for 24 h in NMP again
(Khan et al., 2011). They reported a significant graphene concentration of 63 mg mL-1,
with a flake size of about 1µm × 0.5 µm and thickness of 3–4 layers on average. These
high-concentrated solutions will be useful for practical applications such as the
Univers
ity of
Mala
ya

17
manufacturing of conducting films or formation of reinforced composites (Khan, May, et
al., 2010).
2.2.2 Exfoliation with Low Boiling Point Solvents
Despite great advantages for the dispersion of graphene in the aforementioned
solvents such as NMP and DMF, there are also some disadvantages such as their high
boiling point and toxicity. In particular, these undesirable solvent properties can hinder
their applications and deteriorate the device performance (E.-Y. Choi et al., 2011; O’Neill
et al., 2011). For instance, O’Neill et al. (2011) showed that the suspension of graphene
with a high colloidal stability and concentration can be obtained with low boiling point
solvents, such as isopropanol and chloroform. They found that the resulting graphene
flake had the lateral dimensions of 1 µm × 0.35 µm, and the thickness of almost 10 layers
on average is a suspension with the concentration of 0.5 mg mL-1. In a similar work, E.-
Y. Choi et al. (2011) used a volatile solvent (propanol) for exfoliation of graphite to
graphene and reported a weight concentration of 1 mg mL-1. Quick evaporation of
Figure 2.2: a) Concentration of graphene dispersion versus sonication time. The inset illustrates solutions including graphene after 6 h and 180 h. b) Mean layer number,
length, and width of flakes as a function of sonication time (Khan, O'Neill, et al., 2010).
Univers
ity of
Mala
ya
18
propanol could smooth the deposition procedure of graphene nanosheets onto substrates
without flake aggregation.
In addition, Qian and coworkers (Qian et al., 2009) studied the effect of
acetonitrile (ACN, boiling point of 81.6 ºC) as a low boiling point solvent on exfoliation
yield. Combined with a solvothermal procedure for producing adequate energy, ACN
molecules could diffuse into the interlayers of graphite and overcome the potential barrier.
They reported that a stable dispersion including monolayer and bilayer graphene was
synthesized after sonication and centrifugation. Their exfoliation yield was 10–12 wt%.
In addition to exfoliation with low boiling point solvents, a solvent exchange
technique was suggested by Zhang and coworkers (X. Zhang et al., 2010) for transferring
graphene dispersions from high boiling point solvents into low boiling point solvents. In
this method, after preparing NMP-based graphene solution, it was filtered and re-mixed
into ethanol. This procedure shows a much better stability when compared with the direct
exfoliation in ethanol. However, the reason for the stabilizing mechanism is not fully
understood. Additional investigations were also performed with methanol, toluene, and
dichloromethane, however, the graphene flakes were precipitated after centrifugation.
2.3 Stabilizer-Based Exfoliation
Based on the presented reviews in Section 2.2, it may be concluded that the direct
exfoliation in organic solvents is quick and simple, but some of the associated procedures
as well as most of the materials used are hazardous. To avoid these environmentally less
friendly materials, another method was proposed to exfoliate bulk graphite to graphene
in liquid media in the presence of stabilizers such as surfactants, polymers and pyrene
derivatives. Stabilizers play a key role in tuning the surface tension of the aqueous
solution, which can increase the exfoliation yield efficiently. Reviews of the related works
on different kinds of stabilizer are presented in this section.
Univers
ity of
Mala
ya

19
2.3.1 Ionic Surfactants
Sodium dodecylbenzene sulfonate (SDBS), which is an ionic surfactant was
employed to exfoliate bulk graphite to graphene by Lotya and coworkers (Lotya et al.,
2009). They reported that the obtained graphene flakes had dimensions in the range of
0.1 to 3 µm with the thickness distribution of 43% less than 5 layers. Fourier transform
infrared (FTIR) and Raman spectra showed the presence of a small percentage of
oxidation over the exfoliation procedure. They also reached the dispersion concentration
of 0.1 mg mL-1. The prepared sample was remained stable for over 6 weeks due to the
strong electrostatic repulsion. Later, Lotya and coworkers (Lotya et al., 2010) used
sodium cholate (SC) as an ionic surfactant to increase the dispersion concentration of
graphene up to 0.3 mg mL-1. After long time sonication of 400 h, TEM analysis showed
the graphene flakes with a lateral size of 1 µm and 400 nm and more than 20% of flakes
were mono layer.
To improve the electrical conductivity of this type of films, De and coworkers (De
et al., 2010) employed an annealing stage at 500 ºC. Green and Hersam (2009) also
employed the density gradient ultracentrifugation (DGU) method to separate graphene
flakes based on their thickness. As a result, in terms of sheet resistance and transmittance,
the performance of graphene-based films generated by DGU method was enhanced as
compared with the common sedimentation centrifugation. In a similar work, T Hasan et
al. (2010) used a mild sonication for exfoliation of the bulk graphite in aqueous solution
of sodium deoxycholate (SDC) bile salt. With SDC, they could generate denser colloidal
sample including graphene flakes with better stability. This enhancement in density was
attributed to the highly-hydrophobic index of SDC, which significantly increases the SDC
absorption on the graphitic surfaces. As a stabilizer, 7,7,8,8-tetracyanoquinodimethane
(TCNQ) anion was used by Hao et al. (Hao et al., 2008) to synthesize water-based
graphene solution by using expanded graphite. Via - stacking interactions, 7, 7, 8, 8-
Univers
ity of
Mala
ya

20
tetracyanoquinodimethane could be absorbed onto the surface of graphene flakes. Also,
the negative charge imposed by 7, 7, 8, 8-tetracyanoquinodimethane do not allow the
exfoliated graphene sheets to aggregate due to the inherent electrostatic repulsion.
Finally, they reported a successful exfoliation that produced only mono- and few-layered
graphene nanosheets, though with some defects. However, the weight concentrations of
the obtained samples were fairly low, of about 15–20 µg mL-1. Generally, surfactants
have both hydrophobic and hydrophilic chains (tail or head). The hydrophobic tail groups
could absorb carbon-based nanostructures (non-polar objects) through the van der Waals
interactions. On the contrary, the hydrophilic head groups are prone to dissociation and
charge the flakes. So, graphene flakes in the presence of surfactants are stabilized in
aqueous solution by the electrostatic repulsion between flakes. Zeta potential (ζ) is
typically used to measure the electric potential of aqueous dispersions. Like anionic
surfactants, cationic surfactants have been also applied as stabilizer for exfoliation of
graphite to graphene. As a cationic surfactant, cetyltrimethylammonium bromide (CTAB)
and acetic acid play essential roles in exfoliation of highly ordered pyrolytic graphite
(HOPG) to few-layered graphene flakes through rather mild sonication (Vadukumpully
et al., 2009). According to Vadukumpully’s results, the hydrophobic group of long alkyl
chains can adsorb via the surface of graphene (hydrophobic interactions). Also, the
electrostatic charge of hydrophilic chains can prevent restacking and agglomeration. They
concluded that the obtained graphene with their method had the thickness of 1.18 nm with
85% of which were less than four-layered. In addition, the average length and width of
flakes were, respectively, 0.7 µm and 0.5 µm. Figure 2.3 shows the topographic view of
the graphene flakes spin-coated on mica, AFM image of a graphene sheet, height profile
of the Figure panel b, and statistical analysis of the thickness, length and width of the
flakes. In order to increase the dispersion concentration and exfoliation yield with
surfactants, an ultrasonic exfoliation procedure with the continuous addition of
Univers
ity of
Mala
ya

21
surfactants was proposed by Notley (2012), resulting in significant increase in exfoliation
yield. With this method, the surface tension of solutions could be kept at an optimum
value of 41 mJ m-2, representing an efficient exfoliation and significant growth in the
weight concentration of samples. This approach was successful with the use of different
types of surfactants, either ionic or non-ionic.
2.3.2 Nonionic Surfactants
According to Guardia et al. (2011), due to the stronger steric repulsion compared
to the electrostatic repulsion, non-ionic surfactants can prepare the graphene-based
solution with higher dispersibility and stability compared with the ionic ones. They
prepared several water-based graphene solutions by using direct bath sonication with
various non-ionic surfactants and compared the results with different ionic ones. Their
Figure 2.3: (A) Topographic view of the graphene layers, (B) AFM image of a single flake. (C) Height profile of the image 2.3B. Statistical analysis of the AFM images of 60
flakes: (D) thickness, (E) length and (F) width of the flakes (Vadukumpully et al., 2009). Univ
ersity
of M
alaya
22
findings are shown in Figure 2.4, where the weight concentrations of graphene dispersion
in the presence of non-ionic surfactants are significantly larger than that for the ionic ones.
P-123, which was the best non-ionic surfactant, led to the weight concentration of 0.9 mg
mL-1. The concentration was further grown to almost 1.5 mg mL-1 after extending the
sonication period to 5 h. In addition, the paper-like films obtained from this procedure
had the highest electrical conductivity of 3600 S m-1.
A successful two-step process was suggested by Geng et al. (Geng et al., 2010) to
exfoliate bulk graphite in NMP containing nonionic porphyrin. Organic ammonium ion
and porphyrin were used for exfoliation via - interactions with graphene. The presence
of undisturbed sp2 carbon networks was the main result of this novel method. In this case
the stability of non-ionic surfactants was also caused by the steric effects. Also, the long
hydrophilic chains of surfactants can disperse into water easily. More interestingly, if the
graphene flakes get close to each other, the hydrophilic head groups of surfactants can
interact to induce osmotic repulsion.
Coleman’s group (Smith et al., 2010) investigated the effect steric repulsive
potential barrier on the dispersion of graphene using different surfactants. They studied
12 different ionic and nonionic surfactants for identifying the main stabilization
mechanism in surfactant-assisted graphite exfoliation. They found linear growth of the
dispersion concentration of graphene with the increase of steric repulsive potential
barrier. Univers
ity of
Mala
ya
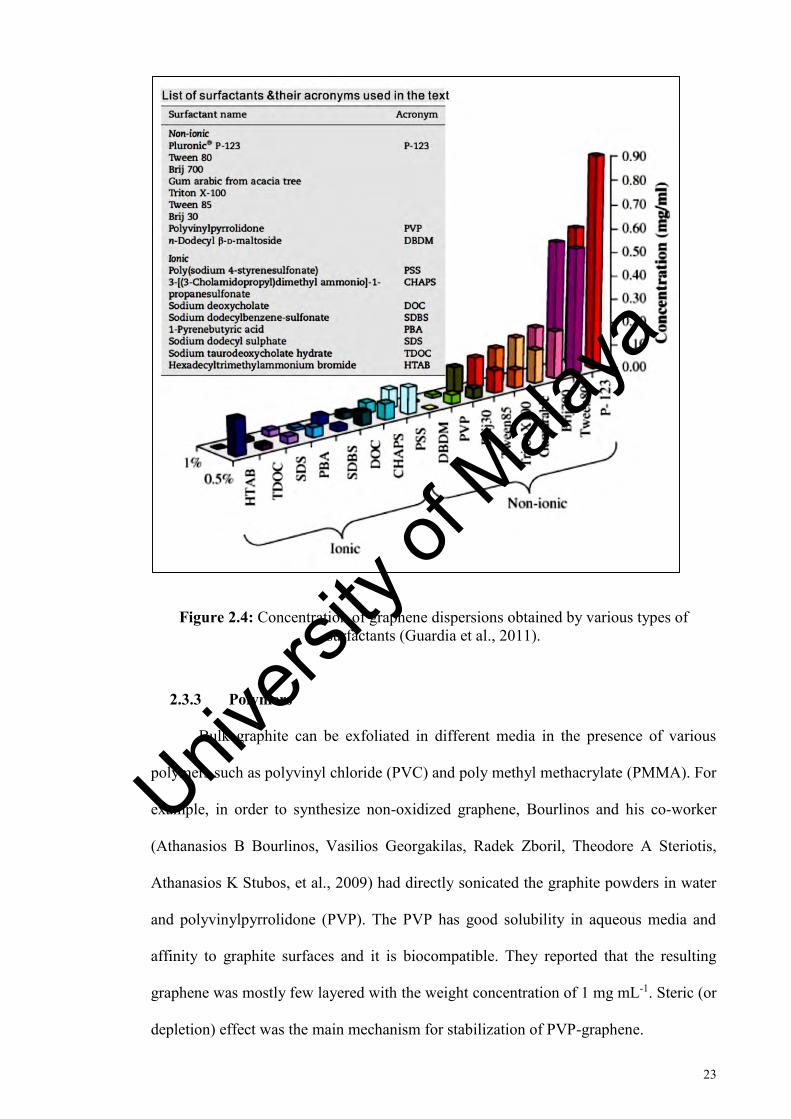
23
2.3.3 Polymers
Bulk graphite can be exfoliated in different media in the presence of various
polymers such as polyvinyl chloride (PVC) and poly methyl methacrylate (PMMA). For
example, in order to synthesize non-oxidized graphene, Bourlinos and his co-worker
(Athanasios B Bourlinos, Vasilios Georgakilas, Radek Zboril, Theodore A Steriotis,
Athanasios K Stubos, et al., 2009) had directly sonicated the graphite powders in water
and polyvinylpyrrolidone (PVP). The PVP has good solubility in aqueous media and
affinity to graphite surfaces and it is biocompatible. They reported that the resulting
graphene was mostly few layered with the weight concentration of 1 mg mL-1. Steric (or
depletion) effect was the main mechanism for stabilization of PVP-graphene.
Figure 2.4: Concentration of graphene dispersions obtained by various types of surfactants (Guardia et al., 2011).
Univers
ity of
Mala
ya

24
Using ethyl cellulose as a stabilizing polymer, Y. T. Liang and Hersam (2010)
reported a high yield of graphene exfoliation in ethanol. They reached the maximum
dispersion concentration of 1.02 mg mL-1 via iterative solvent exchange. Coleman’s group
(May et al., 2012) performed a study for identifying suitable type of polymer-solvent
combinations for exfoliation of bulk graphite. They established a simple model based on
Hildebrand solubility parameters of nanosheets, polymer and solvent. Despite the low
graphene concentration on a scale of µg mL-1, the proposed model was successful.
Recently, Xu and coworkers (L. Xu et al., 2013) obtained graphene dispersions with good
concentrations using tetrahydrofuran (THF) / hyperbranched polyethylene (HBPE). They
proposed the use of a solvent/polymer pair to exfoliate graphite via absorbing HBPE on
graphene flakes to generate steric stabilization for avoiding restacking. More
interestingly, the characterization instruments and morphological studies showed no
defect on the structure of graphene nanosheets. In addition, the produced graphene flakes
had between 2 and 4 layers with length of 0.5 µm and width of 0.2 µm. They reported the
concentration of 3.4 mg mL-1 for graphene dispersion in chloroform after solvent
evaporation.
In addition to the significant stabilization effect of polymers in the exfoliation
procedures, they can be utilized to enhance the graphene wettability. To address this issue,
Skaltsas and co-workers (Skaltsas et al., 2012) added amphiphilic block copolymers such
as poly[styrene-b-(2-vinylpyridine)] (PS-b-P2VP) and poly(isoprene-b-acrylic acid) (PI-
b -PAA) to switch solubility of graphene from the organic to aqueous phase. A tip
sonication was used in the presence of o-dichlorobenzene or NMP, however, the quality
of graphene, the concentration of dispersion and the lateral size of flakes were small.
2.3.4 Pyrene Derivatives
In the exfoliation of graphite, typically the higher concentration of small
molecular surfactants leads to higher concentration of graphene nanosheets in the
Univers
ity of
Mala
ya

25
dispersions. Nevertheless, eliminating additional surfactants or polymers is an immense
difficulty, which can reduce the exfoliation yield and impose some negative effects on
the performance of composites, electronic devices and films. Therefore, finding
alternative materials with low weight fraction for mass-stabilizing of graphene flakes is
critical. Pyrene (Py) molecules and some of its derivatives shown in Figure 2.5 could be
promising alternative materials for high-yield exfoliation of the bulk graphite. The -
interactions between graphene and the planar surfaces of this kind of stabilizers play a
key role in the exfoliation process (X. Dong et al., 2009; Jang et al., 2011; D.-W. Lee et
al., 2011; F. Liu et al., 2010; Niu et al., 2016; Parviz et al., 2012; Schlierf et al., 2013; H.
Yang et al., 2013; M. Zhang et al., 2010).
In the presence of tetrasodium 1,3,6,8-pyrenetetrasulfonic acid (Py-4SO3), Dong
and coworkers (X. Dong et al., 2009) presented an efficient exfoliation technique for
preparing monolayer graphene with only probe sonication. Their statistical analysis of
AFM images showed that the majority of graphene sheets were mono-layered. Their AFM
images are shown in Figure 2.6.
Figure 2.5: Molecular structures of pyrene derivatives with their names and corresponding acronyms for stabilizing graphene in the liquid media. (Niu et al., 2016) Univ
ersity
of M
alaya

26
In another study, pyrene derivatives, 1-pyrenecarboxylic acid (PCA) was used by
X. An et al. (2010) to produce water-based graphene dispersion. Using a method of
sonication of bulk graphite in aqueous solutions of pyrene molecules functionalized with
water-soluble groups, including Py-NH2 and Py-4SO3, Zhang and coworkers (M. Zhang
et al., 2010) could synthesize monolayer graphene flakes with high quality. In addition to
the stabilization effect of pyrene molecules, they also played a role as the fillers
(nanographene) to treat the structural defects on the surface of graphene sheets. After
annealing the graphene nanosheets at 1000 ºC, superior conductive transparent films with
Figure 2.6: (a) A typical AFM image of graphene flakes dispersed in TPA/D2O solution. (b) The thickness distribution of all the graphene flakes observed in panel (a).
(c) AFM image of a mechanically exfoliated monolayer graphene (X. Dong et al., 2009)..
Univers
ity of
Mala
ya
27
electrical conductivity of 181200 S m-1 and transmittance in the visible light range of 90%
were produced.
A supercritical fluid exfoliation with 1-pyrene sulfonic acid sodium (Py-1SO3)
was suggested (Jang et al., 2011) in a mixture of ethanol/water. The Py-1SO3 molecules
can attach on the surface of graphene flakes and act as electron-withdrawing groups,
resulting in an electron transfer from graphene flakes to Py-1SO3 molecules. Two main
advantages were reported with the addition of Py-1SO3 molecules. First, it could increase
the exfoliation yield of bulk graphite into monolayer and bilayer graphene sheets up to
60%. Second, the Li-ions storage capacity was also increased. Similarly, Yang and
coworkers (H. Yang et al., 2013) used Py-1SO3 for exfoliation of bulk graphite to
graphene sheets with only bath sonication in aqueous media. To enhance the exfoliation
yield, Lee and coworkers (D.-W. Lee et al., 2011) synthesized an aromatic amphiphile
molecules. These molecules have four pyrene units as an aromatic segment and a
hydrophilic dendron. With non-destructive - stacking interactions, these molecules
could easily attach on the surface of graphene flakes and subsequently facilitate the
production of water-based graphene dispersions. They reported the concentration up to
1.5 mg mL-1 via sonication in water/methanol media.
To investigate the effects of different pyrene derivatives on exfoliation yield,
Parviz et al. (2012) used various pyrene derivatives and determined the dispersion yield
of graphene sheets. They found that Py-1SO3 showed the best exfoliation performance
compared with all other pyrene derivatives shown in Figure 2.5. They could reach the
graphene concentration yield up to 0.8–1 mg mL-1 in the presence of Py-1SO3. They also
showed that the functional groups with larger electronegativity is more suitable for being
adsorbed on the surface of graphene sheets. Therefore, they concluded that pyrene
derivatives including sulfonyl groups can be the most effective stabilizer for producing
graphene flakes over a wide range of pH. In another comparative study, Schlierf et al.
Univers
ity of
Mala
ya

28
(Schlierf et al., 2013) reported a novel exfoliation method in aqueous media in the
presence of different pyrene sulfonic acid sodium salts such as Py-1SO3, 6,8-dihydroxy-
1,3-pyrenedisulfonic acid disodium salt (Py-2SO3), 8-hydroxypyrene-1,3,6-trisulfonic
acid trisodium salt (Py-3SO3) and Py-4SO3. Their results showed that the molecular
dipole was not essential per se, however, it can facilitate adsorption of the molecule on
the graphene flakes, enhancing lateral displacement of water molecules collocated
between aromatic cores of the organic dye and graphene (Niu et al., 2016).
2.3.5 Aromatic Stabilizers
Like pyrene molecules and polymers, some polycyclic aromatic hydrocarbons
such as tetrapotassium salt of coronene tetracarboxylic acid (Ghosh et al., 2010) and
perylenebisimide-based bolaamphiphile detergent (Englert et al., 2009) have the ability
to increase exfoliation yield of graphite. Being highly water-soluble, this type of aromatic
stabilizers with bulky planar aromatic surface provides a strong interaction with the
surface of graphene nanosheets via synergistic noncovalent charge-transfer and -
stacking interactions. Like other stabilizers, the negative charge imposed on the graphene
surfaces prevent them from inter and intra re-stacking, thus, leading to high level of
stabilization for graphene dispersions.
2.4 Exfoliation with Ionic Solvents
Semi-organic salts with a low melting point (mostly lower than 100 oC) are
commonly used as ionic solvents (X. Zhou et al., 2010), which have absorbed much
attention due to their promising properties including suitable thermal stability, proper
ionic conductivity, and non-flammability. According to the high dispersibility of carbon
nanotubes in ionic solvents (Gunasekaran & Dharmendirakumar, 2014), it is anticipated
that ionic solvents may also be utilized for stabilizing graphene flakes via Coulombic
interaction. The exfoliation of bulk graphite into graphene nanosheets via tip sonication
in a ionic solvent, namely, 1-butyl-3-methylimidazolium bis(trifl
Univers
ity of
Mala
ya
29
uoromethanesulfonyl)imide ([Bmim][Tf2N]) was reported (Xiqing Wang et al., 2010).
They found a rather high exfoliation yield and could also synthesize a stable graphene
suspension of 0.95 mg mL-1. They also reported that the graphene nanosheets were few-
layered with micrometer sizes. More interestingly, 1-hexyl-3-methylimidazolium
hexafluorophosphate (HMIH) was found to be a significantly strong ionic solvent for
exfoliation of bulk graphite, leading to a concentration of graphene dispersion up to 5.33
mg mL-1 via direct sonication (Alzari et al., 2011). Quantitative analysis showed that the
graphene nanosheets had the wide of 4 mm and an average thickness of 2 nm, representing
almost 6–7 atomic layers. Sanjeeva Rao et al. (Rao et al., 2015) described an efficient soft
processing approach for continuous synthesis of high-quality, few-layered graphene
nanosheets. They used electrochemical exfoliation of graphite in the presence of
environmentally friendly glycine-bisulfate ionic complex under ambient reaction
conditions. The resulting graphene nanosheets were mostly 2–5 layered. They suggested
that the formation of surface molecule nuclei via the polymerization of intercalated
monomeric HSO4− and SO4
2− ions can be the main plausible electrochemical exfoliation
mechanism.
2.5 Functionalization-Assisted Exfoliation
Functionalization-assisted exfoliation is a high-performance method for
exfoliation of bulk graphite into mono layered graphene via direct sonication in different
solvents. Covalently oxidation-assisted exfoliation is the most common method of the
functionalization-assisted exfoliation. Graphite oxide as the first resulting material can be
exfoliated in different media such as water by direct sonication. The presence of polar
functional groups and the increased d-spacing of the material were suggested as the main
reasons for increasing the exfoliation yield (Stankovich et al., 2007; Stankovich, Piner,
Chen, et al., 2006). Using functionalization of graphite oxide with isocyanate, Stankovich
et al. (Stankovich, Piner, Nguyen, et al., 2006) performed the first graphite oxide
Univers
ity of
Mala
ya

30
exfoliation in organic solvents. Such reactions decrease the percentage of hydrogen
bonding in the oxide layers by changing hydrogen bond donors, e.g. hydroxyl groups,
into carbamate esters and/or amides. They reached the stable monolayer graphene
dispersions of 1 mg mL-1 in dimethylformamide (DMF) and N-methyl-2-
pyrrolidone (NMP). In a similar study (G. L. Li et al., 2010), poly(tert-butyl acrylate)-
functionalized graphite oxide were employed to prepare a suitable dispersion of graphene
in toluene at 1 mg mL-1 (G. L. Li et al., 2010). Recently, exfoliation of GO in certain
organic solvents such as DMF, NMP, tetrahydrofuran (THF), and ethylene glycol (EG)
has also been performed with direct sonication (Paredes et al., 2008). Paredes et al.
reported synthesis of stable dispersions of 1 mg mL−1 in the presence of organic solvents.
In addition to all the advantages of graphite oxide, the oxidation of bulk graphite produces
different reactive oxygen-containing functional groups on the basal planes and edges (W.
Cai et al., 2008; Heyong He et al., 1998). Oxygen-containing functional groups like
hydroxyl and epoxy, carboxyl and ketone groups can impart hydrophilicity to the
graphene network, resulting in stable dispersion in water via direct sonication (Figure 2.7)
(S. Park et al., 2008; S. Park & Ruoff, 2015).
Univers
ity of
Mala
ya

31
Graphene oxide is heavily functionalized with many permanent chemical defects, such as
holes introduced into the basal plane. These holes are not readily healed even upon
annealing (Ruoff, 2008; H. Wang et al., 2009). Therefore, reduced graphene oxide (RGO)
were produced via the reduction of an aqueous graphene oxide suspension with hydrazine
(NH2NH2) or dimethylhydrazine (C2H8N2) as a pure material (Stankovich, Dikin, et al.,
2006; Stankovich, Piner, Chen, et al., 2006). Due to the promising electrical and thermal
properties as well as high surface area, RGO material has shown great potential in a wide
range of applications. Nevertheless, preparing stable and homogeneous suspensions of
RGO platelets has been challenging. In addition, the chemical reduction of the materials
with hydrazine led to agglomerated powders, which created another problem. To address
these problems, a mixture of water and organic solvents (9 parts organic solvent and 1
part water) were employed (S. Park et al., 2009) and subsequently was reduced by
hydrazine, leading a stable suspension of RGO for depositing films with a relatively high
electrical conductivity (Figure 2.8).
Figure 2.7: Scheme for the production of water-based graphene oxide suspension from graphite (a) a photo of bulk graphite powder, (b) a SEM image of the layer structure of
graphite oxide, (c) a water-based graphene oxide suspension, (d) a AFM image of graphene oxide placed on a mica substrate, and (e) chemical structure of graphene oxide
with different functional groups (S. Park & Ruoff, 2015).
Univers
ity of
Mala
ya
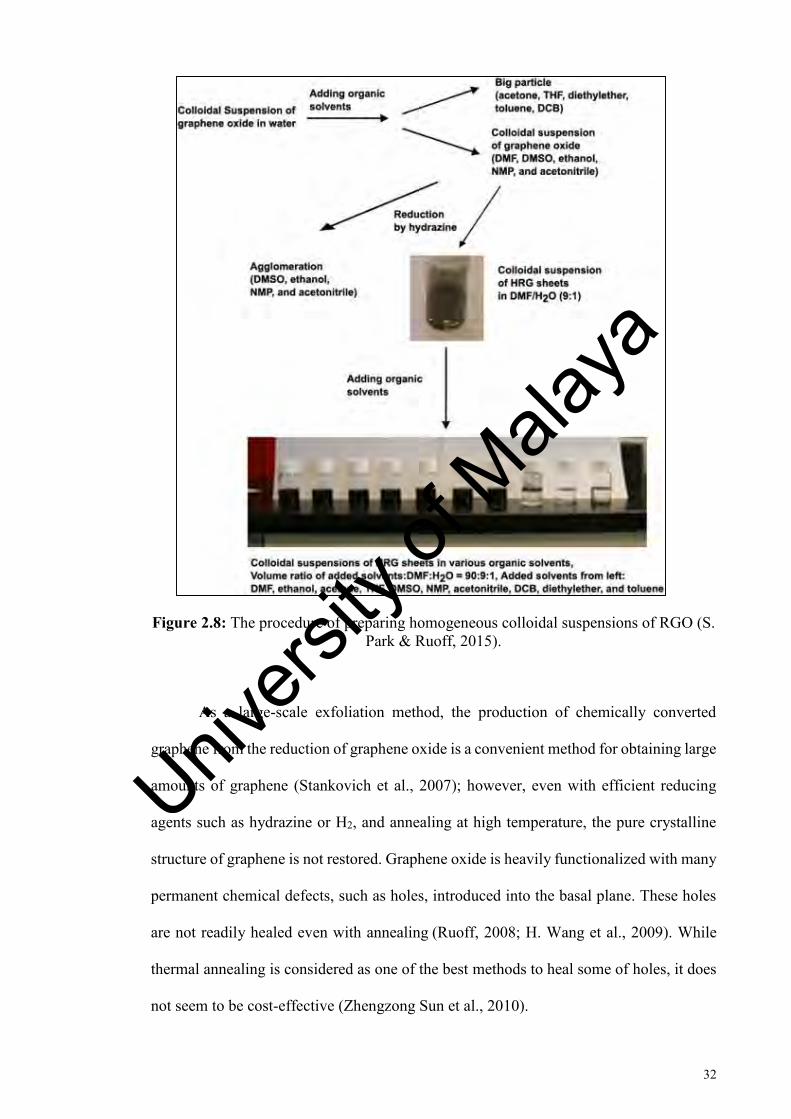
32
As a large-scale exfoliation method, the production of chemically converted
graphene from the reduction of graphene oxide is a convenient method for obtaining large
amounts of graphene (Stankovich et al., 2007); however, even with efficient reducing
agents such as hydrazine or H2, and annealing at high temperature, the pure crystalline
structure of graphene is not restored. Graphene oxide is heavily functionalized with many
permanent chemical defects, such as holes, introduced into the basal plane. These holes
are not readily healed even with annealing (Ruoff, 2008; H. Wang et al., 2009). While
thermal annealing is considered as one of the best methods to heal some of holes, it does
not seem to be cost-effective (Zhengzong Sun et al., 2010).
Figure 2.8: The procedure of preparing homogeneous colloidal suspensions of RGO (S. Park & Ruoff, 2015).
Univers
ity of
Mala
ya

33
As mentioned above, a novel technique for overcoming above-mentioning
drawbacks for production of single-layered and/or few-layered sheets of graphene is the
liquid phase exfoliation of graphite in the presence of high surface-tension organic
solvents and direct sonication (Zhengzong Sun et al., 2010). However, due to the lack of
easily-miscible functional groups, such as polymers to decrease interlayer attractions, the
graphene sheets suspended in the high-surface tension base fluids tend to aggregate and
restaking (Lotya et al., 2009). Also, due to the strong π–π interactions, liquid-phase
exfoliated graphene cannot reach stable dispersion in base fluids, leading high level of
aggregation (Zhengzong Sun et al., 2010). However, due to lack of graphene-solubility,
the exfoliation performances of most of the solvents suggested in previous attempts were
quite low. Also, in some cases, the obtained samples are only partially exfoliated and still
contain extensive amount of staked graphitic layers. To increase the efficiency of
exfoliation with this method, the chemical functionalization of graphite with different
functional groups, such as 4-bromophenyl, provides a new approach for improving the
solubility of graphene sheets in polar, aprotic, organic solvents, allowing the exfoliation
of bulk graphite with fewer problems (Lomeda et al., 2008).
Earlier, Zhengzong Sun et al. (2010) concluded that graphite can be changed to
graphene by covalent functionalization of the graphite and the synthesis of a stable
suspension in the presence of DMF without any added surfactant or stabilizer. They
achieved both exfoliation and functionalization with a fast procedure and obtained
appropriate edge-functionalization and intact pristine graphene structure in the interior
basal planes. In addition, the morphological results showed that more than 70% of the
graphene flakes had layers with thicknesses less than 5 nm, providing a high yield of
soluble graphene. They concluded that the proposed preparation approach is significantly
simpler than the multi-step approaches needed for preparing graphene oxide followed by
Univers
ity of
Mala
ya

34
reduction to chemically-converted graphene and is an effective method for producing
soluble graphene with high yield (Figure 2.9).
2.6 Thermal Exfoliation Techniques
In order to reach near-complete exfoliation of bulk graphite into mono layer
graphene, thermal exfoliation techniques are shown to be a promising approach.
Compared to the aforementioned exfoliation methods, thermal exfoliation approach has
Figure 2.9: (a) Histogram of number of layers per graphene flakes, (b) SEM image of graphene flake, (c & d) AFM of graphene on mica and (e and f) the height profiles
along the black imaged lines above in panels c and d, respectively (Zhengzong Sun et al. (2010)).
Univers
ity of
Mala
ya

35
the advantage of being faster and producing dry graphene (M. Cai et al., 2012; McAllister
et al., 2007). For instance, Schniepp and coworkers (Schniepp et al., 2006) showed that
the exfoliation could be done within seconds at high temperature. It should also be pointed
out that for many applications such as electrodes in lithium batteries dry graphene is
needed.
Overall, in thermal exfoliation techniques, the functional groups decorated on the
graphitic layers decompose and generate gases that exert pressure on the adjacent layers
during the heating procedure. Exfoliation procedure starts once this pressure exceeds the
van der Waals interlayer interaction force (McAllister et al., 2007). To reach a high-yield
exfoliation and generate proper pressure, the pristine graphite is required to possess
interlayer functional groups. Therefore, graphite oxide, chemically-treated expanded
graphite, and intercalated graphite compounds are commonly utilized instead of pure
graphite as the pristine materials for thermal exfoliation.
2.6.1 Thermal Exfoliation of Graphite Oxide
Schniepp et al. (2006) proposed the use of thermal exfoliation of graphite oxide
for producing mono layer graphene in 2006. For this purpose, they loaded dried GO into
a quartz tube that was heated in a furnace at 1050 °C for 30 seconds. They reported that
this approach leads to high-yield exfoliation of graphite oxide. Later, McAllister and
coworkers (McAllister et al., 2007) proposed a new exfoliation mechanism and the reason
for thermal exfoliation. They concluded that thermal exfoliation only occurred in the
presence of special conditions. That is, the decomposition rate of the functional groups
on graphite oxide flakes should exceed the diffusion rate of the evolved gases. This
phenomenon could generate sufficient pressure for overcoming the van der Waals
interaction among graphene layers. For a fast exfoliation, the experiments should be
performed at a critical temperature up to 550 °C. A wrinkled graphene nanosheet with
Univers
ity of
Mala
ya
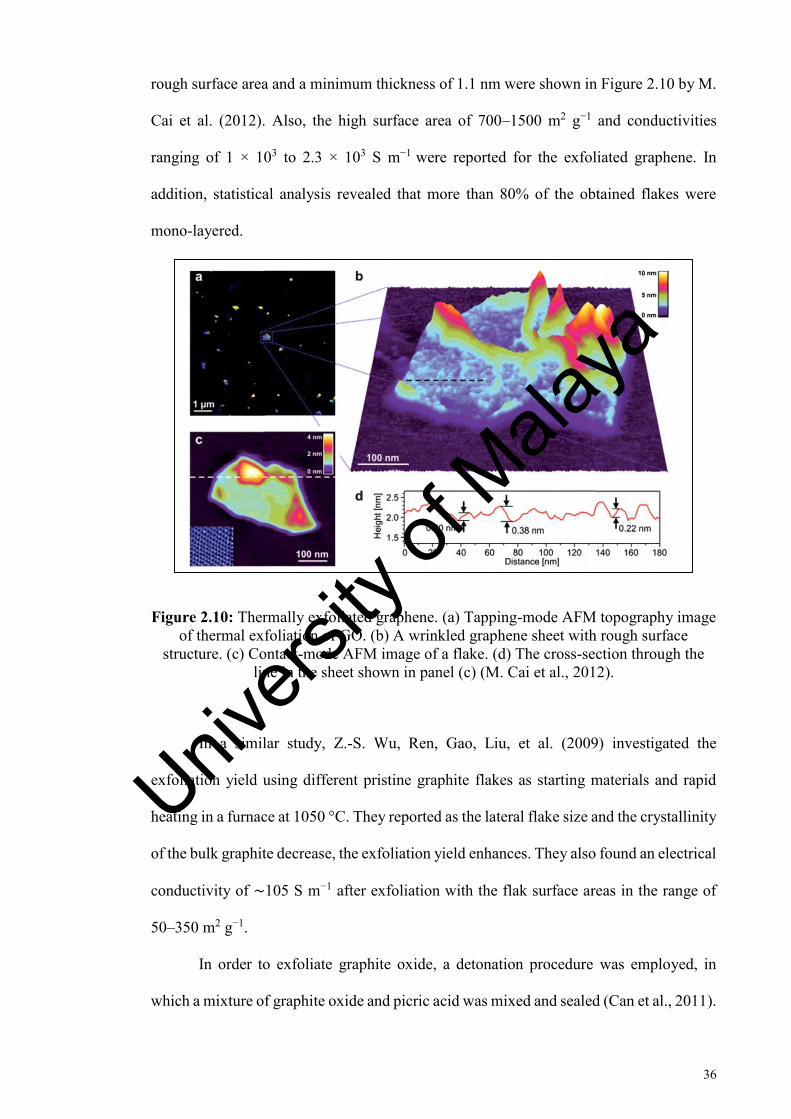
36
rough surface area and a minimum thickness of 1.1 nm were shown in Figure 2.10 by M.
Cai et al. (2012). Also, the high surface area of 700–1500 m2 g−1 and conductivities
ranging of 1 × 10³ to 2.3 × 10³ S m−1 were reported for the exfoliated graphene. In
addition, statistical analysis revealed that more than 80% of the obtained flakes were
mono-layered.
In a similar study, Z.-S. Wu, Ren, Gao, Liu, et al. (2009) investigated the
exfoliation yield using different pristine graphite flakes as starting materials and rapid
heating in a furnace at 1050 °C. They reported as the lateral flake size and the crystallinity
of the bulk graphite decrease, the exfoliation yield enhances. They also found an electrical
conductivity of ∼105 S m−1 after exfoliation with the flak surface areas in the range of
50–350 m2 g−1.
In order to exfoliate graphite oxide, a detonation procedure was employed, in
which a mixture of graphite oxide and picric acid was mixed and sealed (Can et al., 2011).
Figure 2.10: Thermally exfoliated graphene. (a) Tapping-mode AFM topography image of thermal exfoliation of GO. (b) A wrinkled graphene sheet with rough surface
structure. (c) Contact-mode AFM image of a flake. (d) The cross-section through the line in the sheet shown in panel (c) (M. Cai et al., 2012).
Univers
ity of
Mala
ya

37
The fast explosion could generate the powerful shockwave of about 20 MPa a high
temperature of 900 °C (G. Sun et al., 2008) to fully-exfoliate the bulk graphite sheets. As
a result, the obtained graphene flakes were 2–5 layered with lateral size of few
micrometers.
Other fast heating approaches for exfoliating graphite oxide, such as employing
microwave irradiation and arc discharge, were also suggested (M. Cai et al., 2012). Using
a microwave-assisted method, Zhu and coworkers (Zhu, Murali, Stoller, et al., 2010)
found that the exfoliation of graphite oxide occurred in about 1 min, preparing the
exfoliated graphene sheets with the surface area of 463 m2 g−1. They also reported a
conductivity of 274 S m−1 for the graphene sheets after microwave-assisted exfoliation.
To increase the exfoliation yield, these microwave assisted graphene flakes activated
chemically with KOH. Zhu et al. have also reported the specific surface area of 3100
m2 g−1 and the conductivity of 500 S m−1 (Zhu et al., 2011) for highly exfoliated graphene
sheets with an extensive number of holes. Using microwave-assisted method under
hydrogen atmosphere, Park et al. also reached a high surface area of 586 m2 g−1 for a
mixture of graphite oxide and graphite nanosheets. Graphite nanosheets collected all the
microwave irradiation, resulting in quick heating of graphite oxide (S.-H. Park et al.,
2011). Exfoliation of graphite oxide via a mixture of graphene and graphite oxide
precursor was also developed (H. Hu et al., 2012).
As another high temperature thermal exfoliation, hydrogen arc discharge was used
as a successful method for exfoliation of graphite. For example, Wu and coworkers (Z.-
S. Wu, Ren, Gao, Zhao, et al., 2009) showed an efficient exfoliation of graphite flakes
via hydrogen arc discharge, in which a sudden increase in the temperature up to 2000 °C
was applied. Eighty percent of the graphene sheets obtained via hydrogen arc discharge
were mono layered with a thickness of 0.9–1.1 nm and electrical conductivity of about 2
× 105 S m−1.
Univers
ity of
Mala
ya

38
In all of the above-mentioned thermal exfoliation methods, high temperature
processes were employed. As a low temperature thermal exfoliation, McAllister et al.
proposed a successful quick exfoliation of graphite oxide flakes at temperature of 550 °C
(McAllister et al., 2007). Later, a fast and low temperature thermal exfoliation method
was proposed (Q. Du et al., 2010). The procedure included heating of graphite oxide at
different temperatures of 250 °C, 300 °C, and 400 °C in air for 5 minutes. Du et al.
reported the specific surface area of 328–418 m2 g−1 for the exfoliated graphene (Q. Du
et al., 2010).
Exfoliation of graphite oxide was also investigated in different atmospheres such
as hydrogen at 200 °C (Kaniyoor et al., 2010) and argon at 275–295 °C (M. Jin et al.,
2010). The exfoliated graphene sheets had the specific surface area of 442 m2 g−1, which
was similar to the value reported for exfoliation in air. Note that vacuum was also utilized
to increase the exfoliation performance of graphite oxide at temperature of 200 °C (Lv et
al., 2009). Due to the release of functional groups on the graphite oxide, a pressure less
than 1 Pa obtained between layers, which caused an enhancement in net repulsive forces
between the layers (Figure 2.11). According to the statistical analysis, over 60% of the
graphene flakes were mono-layered (Lv et al., 2009). In addition, Zhang et al. (H.-B.
Zhang et al., 2011) reported an even lower temperature of 135 °C for producing graphene
in a vacuum oven. The exfoliated graphene had the specific surface area of 759 m2 g−1,
which was significantly high. Univers
ity of
Mala
ya
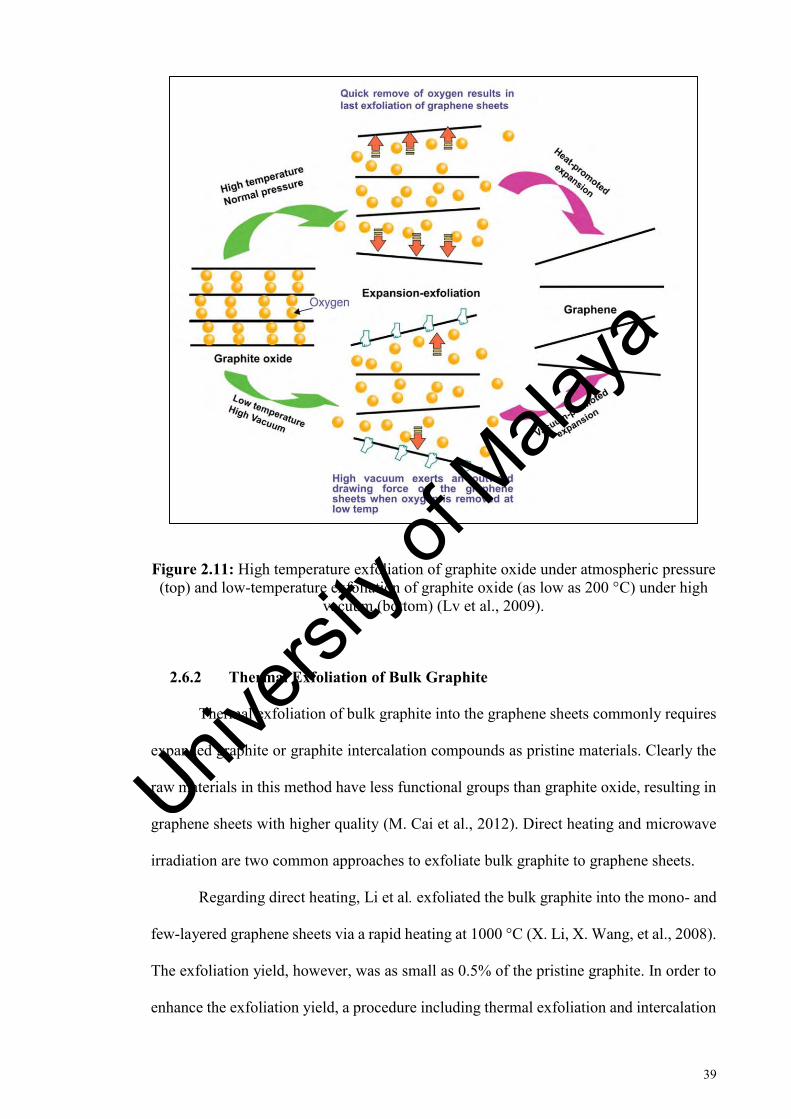
39
2.6.2 Thermal Exfoliation of Bulk Graphite
Thermal exfoliation of bulk graphite into the graphene sheets commonly requires
expanded graphite or graphite intercalation compounds as pristine materials. Clearly the
raw materials in this method have less functional groups than graphite oxide, resulting in
graphene sheets with higher quality (M. Cai et al., 2012). Direct heating and microwave
irradiation are two common approaches to exfoliate bulk graphite to graphene sheets.
Regarding direct heating, Li et al. exfoliated the bulk graphite into the mono- and
few-layered graphene sheets via a rapid heating at 1000 °C (X. Li, X. Wang, et al., 2008).
The exfoliation yield, however, was as small as 0.5% of the pristine graphite. In order to
enhance the exfoliation yield, a procedure including thermal exfoliation and intercalation
Figure 2.11: High temperature exfoliation of graphite oxide under atmospheric pressure (top) and low-temperature exfoliation of graphite oxide (as low as 200 °C) under high
vacuum (bottom) (Lv et al., 2009).
Univers
ity of
Mala
ya

40
of graphite was suggested by the same research group (X. Li, G. Zhang, et al.,
2008). Using a rapid heating, intercalating with oleum (fuming sulphuric acid) and
inserting by tetrabutylammonium hydroxide (TBA) in DMF, the distance between
adjacent graphite layers was increased, representing high-yield exfoliation. As a result, a
stable suspension of mono-layered graphene with yield of 90% was synthesized after mild
sonication in the presence of a surfactant. The graphene sheets obtained from the
bulk graphite had shown a high level of quality without significant defects as compared
to the graphene obtained from exfoliating graphite oxide (Figure 2.12).
A rapid heating exfoliation method at 900 °C in the presence of intercalation with
sulphuric acid and hydrogen peroxide was suggested by Gu et al. for producing single
and multi-layered graphene from natural graphite (Gu et al., 2009). Gu and coworkers
(Gu et al., 2009) finally produced multi-layered graphene sheets. Therefore, to enhance
the yield of mono layer graphene, a re-exfoliation procedure was suggested by Dhakate
and coworkers (Dhakate et al., 2011). After expanding graphite flakes, they were re-
intercalated, re-exfoliated, sonicated and centrifuges. They have reported an overall yield
Figure 2.12: (a) Graphite exfoliation after re-intercalation with sulphuric acid molecules and insertion of tetrabutylammonium hydroxide. Graphene sheets’ structure after thermal exfoliation of bulk graphite (b) and graphite oxide (c) (X. Li, G. Zhang, et
al., 2008).
Univers
ity of
Mala
ya

41
of around 4–5 wt%. using the Raman spectroscopy. Also, they found that the
graphene sheets were of high quality and free of defects (Gu et al., 2009).
Choi and coworkers (S. Y. Choi et al., 2011) employed an inductively coupled
thermal plasma for thermal expansion of graphite intercalation compounds. Accordingly,
the inductively coupled thermal plasma could heat the graphite intercalation compounds
up to 5000 ºK during a millisecond time period resulting in the rapid vaporization of the
intercalated species. For high-yield production of defect free graphene sheets, acoustic
cavitation was subsequently utilized. Figure 2.13 shows SEM images of expanded
graphite after inductively coupled thermal plasma treatment and Raman spectra of four
graphene sheets. Almost 12% of the graphene sheets were mono-layered with the
conductivity range of 6.6 × 10³ S m−1 to 8 × 10³ S m−1.
Also, microwaves irradiation has been effectively utilized for exfoliating bulk
graphite in different liquid or gas environments. As a microwave-assisted method to
exfoliate bulk graphite, Janowska and coworkers attained a high-yield exfoliation of bulk
graphite in an aqueous ammonia solution under microwave irradiation (Janowska et al.,
2010). They produced graphene sheets with thickness less than 10 layers and a yield of
almost 8 wt%. The outstanding wetting behavior of ammonia on graphite could develop
the infiltration of bulk graphite, so this procedure could result in increasing the exfoliation
Figure 2.13: (a) and (b) SEM images of expanded graphite after inductively coupled thermal plasma treatment. (c) Raman spectra of four graphene sheets obtained with
inductively coupled thermal plasma treatment method (S. Y. Choi et al., 2011). Univers
ity of
Mala
ya

42
of graphite. Note that natural decomposition of NH4OH to gaseous NH3 and H2O under
microwave irradiation were also introduced as another parameter to enhance the
exfoliation performance. J. Dong et al. (2010) were the first to use an
ultrasonication method to prepare homogenous graphite dispersion followed by the
microwave-assisted method for producing single and multilayered graphene.
Matsumoto et al. reported a microwave-assisted method for exfoliation of graphite
suspended in molecularly engineered oligomeric ionic liquids (Matsumoto et al., 2015a).
They reported exfoliation-efficiency of 93%, resulting in single-layer graphene with
thicknesses less than 1 nm and a short processing time. The obtained graphene sheets
were mostly mono-layered and damaged free. Similarly, Al-Hazmi et al. proposed a
facile, cost-effective, and quick method for mass production of high quality graphene
sheets (Al-Hazmi et al., 2015). After pretreatment of graphite flakes with glutaric acid,
the treated graphite flakes were homogenously dispersed into methanol and transferred
into a microwave oven. A majority of graphene sheets were mono-layered and as the
microwave power increased, the thickness of flakes decreased.
Highly-crumpled, few-layered graphene and highly-crumpled nitrogen-doped
graphene with high surface area were produced by the present research group. These
highly-crumpled materials were prepared by exfoliation of bulk graphite in the presence
of liquid-phase using microwave-assisted methods.
Using ultrasonication a variety of method was proposed for the exfoliation of
graphite and discussed in this section. Typically, liquid phase exfoliation is performed
with ultra-sonication of bulk graphite in proper solvents that result in dispersions of
defect-free graphene sheets at high concentrations. Nevertheless, exfoliation with
ultrasonication has a key drawback in scalability. The production rate of few-layered
graphene is measured by Eq. 2.1.
PR =CV/t (2.1)
Univers
ity of
Mala
ya
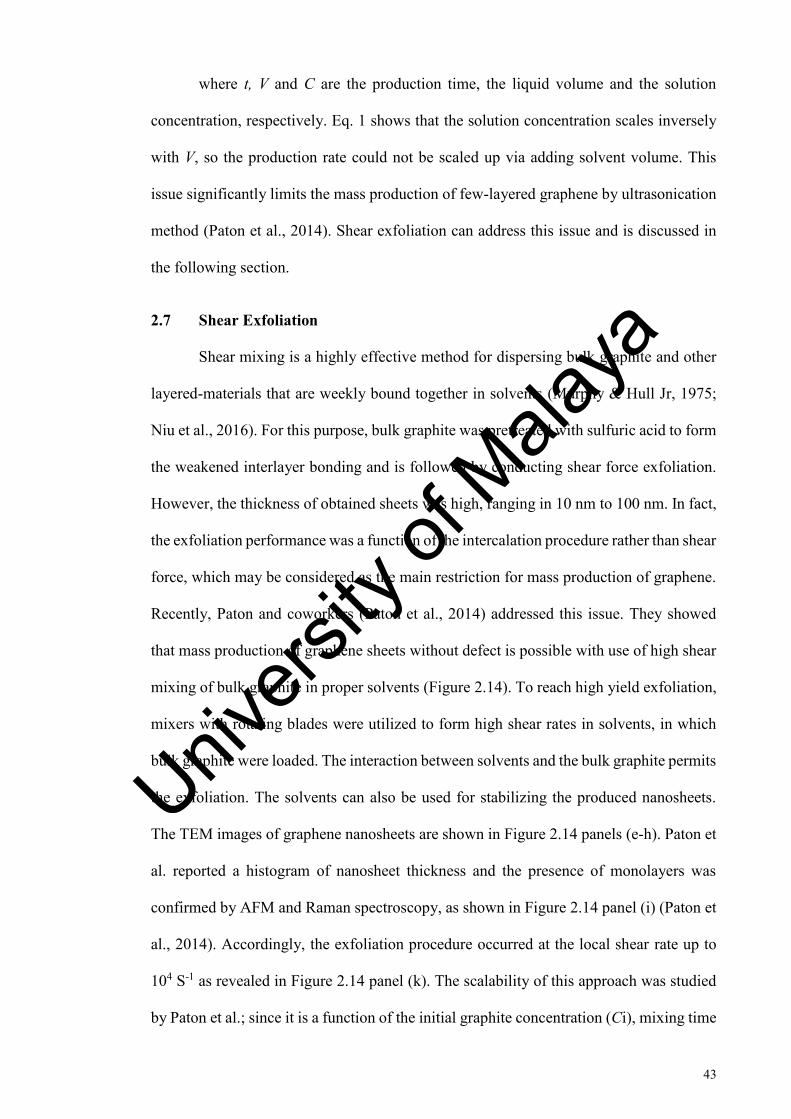
43
where t, V and C are the production time, the liquid volume and the solution
concentration, respectively. Eq. 1 shows that the solution concentration scales inversely
with V, so the production rate could not be scaled up via adding solvent volume. This
issue significantly limits the mass production of few-layered graphene by ultrasonication
method (Paton et al., 2014). Shear exfoliation can address this issue and is discussed in
the following section.
2.7 Shear Exfoliation
Shear mixing is a highly effective method for dispersing bulk graphite and other
layered-materials that are weekly bound together in solvents (Murphy & Hull Jr, 1975;
Niu et al., 2016). For this purpose, bulk graphite was pretreated with sulfuric acid to form
the weakened interlayer bonding and is followed by conducting shear force exfoliation.
However, the thickness of obtained sheets was high, ranging in 10 nm to 100 nm. In fact,
the exfoliation performance was a function of the intercalation procedure rather than shear
force, which may be considered as the main restriction for mass production of graphene.
Recently, Paton and coworkers (Paton et al., 2014) addressed this issue. They showed
that mass production of graphene sheets without defect is possible with use of high shear
mixing of bulk graphite in proper solvents (Figure 2.14). To reach high yield exfoliation,
mixers with rotating blades were utilized to form high shear rates in solvents, in which
bulk graphite were loaded. The interaction between solvents and the bulk graphite permits
the exfoliation. The solvents can also be used for stabilizing the produced nanosheets.
The TEM images of graphene nanosheets are shown in Figure 2.14 panels (e-h). Paton et
al. reported a histogram of nanosheet thickness and the presence of monolayers was
confirmed by AFM and Raman spectroscopy, as shown in Figure 2.14 panel (i) (Paton et
al., 2014). Accordingly, the exfoliation procedure occurred at the local shear rate up to
104 S-1 as revealed in Figure 2.14 panel (k). The scalability of this approach was studied
by Paton et al.; since it is a function of the initial graphite concentration (Ci), mixing time
Univers
ity of
Mala
ya
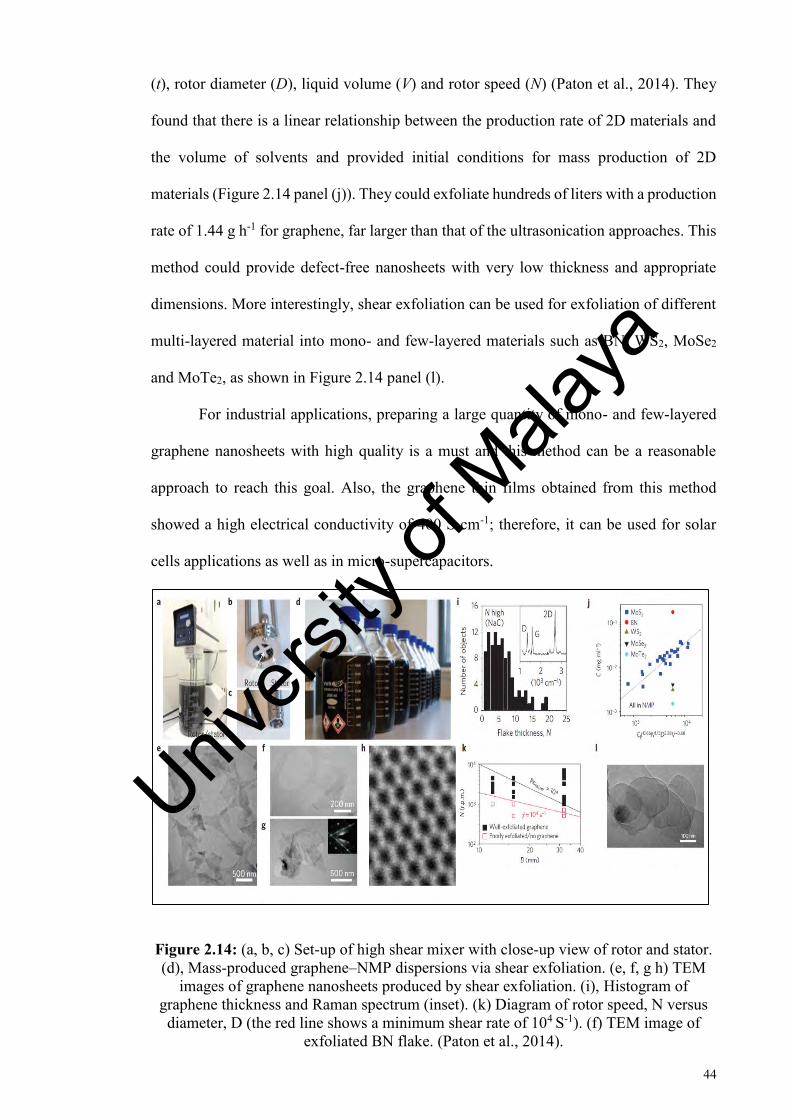
44
(t), rotor diameter (D), liquid volume (V) and rotor speed (N) (Paton et al., 2014). They
found that there is a linear relationship between the production rate of 2D materials and
the volume of solvents and provided initial conditions for mass production of 2D
materials (Figure 2.14 panel (j)). They could exfoliate hundreds of liters with a production
rate of 1.44 g h-1 for graphene, far larger than that of the ultrasonication approaches. This
method could provide defect-free nanosheets with very low thickness and appropriate
dimensions. More interestingly, shear exfoliation can be used for exfoliation of different
multi-layered material into mono- and few-layered materials such as BN, WS2, MoSe2
and MoTe2, as shown in Figure 2.14 panel (l).
For industrial applications, preparing a large quantity of mono- and few-layered
graphene nanosheets with high quality is a must and this method can be a reasonable
approach to reach this goal. Also, the graphene thin films obtained from this method
showed a high electrical conductivity of 400 S cm-1; therefore, it can be used for solar
cells applications as well as in micro-supercapacitors.
Figure 2.14: (a, b, c) Set-up of high shear mixer with close-up view of rotor and stator. (d), Mass-produced graphene–NMP dispersions via shear exfoliation. (e, f, g h) TEM
images of graphene nanosheets produced by shear exfoliation. (i), Histogram of graphene thickness and Raman spectrum (inset). (k) Diagram of rotor speed, N versus diameter, D (the red line shows a minimum shear rate of 104 S-1). (f) TEM image of
exfoliated BN flake. (Paton et al., 2014).
Univers
ity of
Mala
ya

45
Shinde et al. developed a shear-assisted electrochemical exfoliation procedure to
produce large graphene flakes with a high percentage of mono- and few-layered graphene
(Shinde et al., 2016). The suggested method includes intercalation of sulfate ions and then
shear-assisted exfoliation. Similarly, Tran et al. reported a shear-assisted exfoliation
method for mass production of few-layered graphene (Tran et al., 2016). They showed a
promising high-yield exfoliation of graphite into few-layered graphene by high shear
mixing of bulk graphite and solvent in the Taylor vortex flow regime. They also showed
that the obtained graphene was almost defect-free.
2.8 Electrochemical Exfoliation
Electrochemical exfoliation of graphite was suggested as a fast method in a two-
electrode system. Simplicity of operation procedure, high yield exfoliation under different
conditions, and the potential for mass production of mono layer graphene are of
advantages of electrochemical exfoliation (Abdelkader et al., 2015). The main
mechanism for electrochemical exfoliation is the intercalation of ionic species into multi-
layered graphite under an electrochemical bias to expand the graphite layers, which can
facilitate ultrasonic exfoliation as the second phase. Different anionic or cationic species
have been employed to accelerate the intercalation phase. To perform anionic
intercalation, bulk graphite material is installed in the setup as anode electrode and
another material like platinum (Pt) as the cathode electrode. Su et al. used a graphite anode
and Pt cathode to exfoliate graphite into the graphene with different electrolyte solutions,
as shown in Figure 2.15a (Dimiev et al., 2011). They tested a quick electrochemical
exfoliation in the presence of H2SO4-KOH solutions. They also studied the effects of
different acids such as HBr, HCl, HNO3 and H2SO4, and concluded that only H2SO4 is
able to exfoliate bulk graphite. Note that KOH was applied for attenuating the severe
oxidation effect of sulfuric acid to avoid introducing defects in graphene sheets. Despite
the presence of defects, over 65% of exfoliated graphene sheets were very thin with a
Univers
ity of
Mala
ya

46
thickness less than 2 nm. Similarly, Parvez et al. investigated the effect of higher acidic
solution to exfoliate graphite into graphene (Parvez et al., 2013), resulting in high-
performance electrochemically exfoliation (Figure 2.15b). To clear the main mechanism,
water oxidation under bias voltage formed some radicals (e.g. hydroxyl and oxygen)
which could easily react with edge sites and grain boundaries of graphite electrode. The
presence of these defects could assist the intercalation of SO42- into graphite interlayers.
Therefore, the decomposition or release of gaseous SO2 as well as anion depolarization
expands the graphite. As a result, they could introduce a high yield of exfoliation method,
representing that over 80% of graphite were exfoliated into graphene sheets with 1–3
layers. In addition, they also investigated the effects of different inorganic salts on the
electrochemical exfoliation of graphite in aqueous solutions (Parvez et al., 2014; Z. S.
Wu et al., 2015). Their method had a yield of 85% and produced large graphene sheets
with a lateral size up to 44 μm and thickness less than 4 layers. Fabrication of a highly
conductive graphene film was another advantage of this method.
Univers
ity of
Mala
ya

47
Sulfonate salts can be suitable candidates for intercalating and subsequently
exfoliation of bulk graphite. As an efficient electrolyte, poly (sodium-4-styrenesulfonate)
was used by Wang et al. to synthesize graphene sheets under a voltage of 5 V (G. Wang
et al., 2009). The yield of this method was 15% for production of mono- or few-layered
graphene sheets. Wang and coworker. (G. Wang et al., 2009) demonstrated that the
graphene dispersion has remained stable for 6 months without noticeable sedimentation.
As the proposed mechanism, the edge-to-face interaction between aromatic ring of
poly(sodium-4-styrenesulfonate) and the surface of graphene sheets was introduced to
Figure 2.15: (a) Electrochemical exfoliation of bulk graphite in the presence of acids. (b) Suggested mechanism for electrochemical Exfoliation (Parvez et al., 2013).
Univers
ity of
Mala
ya
48
facilitate the exfoliation. In a similar study, sodium dodecylbenzene sulfonate solution
was selected as the electrolyte for electrochemical production of mono- and few-layered
graphene by using 30 V for 48 h (Niu et al., 2016). Sodium dodecylbenzene sulfonate
plays two important roles in electrochemically exfoliation of graphite: intercalant and
surfactant. Mensing and coworkers (Mensing et al., 2012) proposed a quick
electrochemical approach to produce graphene-metal phthalocyanines hybrid in the
presence of copper phthalocyanine tetrasulfonic acid as electrolyte. The functionalized
graphene was obtained using electrolysis of two graphite rod-electrodes and subsequently
ultrasonication. Kuila and coworkers (Kuila et al., 2013) used 6-amino-4-hydroxy-2-
naphthalene-sulfonic acid as the electrolyte and surface modifier for exfoliation of
graphite anode. Functionalization of graphene and the presence of defects in graphene
nanosheets were confirmed via different characterization instruments.
Liu et al. reported an electrochemical exfoliation method in the presence of 1-
octyl-3-methyl-imidazolium hexafluorophosphate as an ionic liquid by using a two-
graphite electrode test-rig (N. Liu et al., 2008). They could produce the graphene sheets
with average thickness of 1.1 nm and the dimensions of 700 nm × 500 nm. According to
their results (N. Liu et al., 2008), 1-octyl-3-methylimidazolium free radicals have enough
potential to interact with -electrons of graphene sheets, resulting an interaction between
graphene sheets and ionic liquids and subsequently facilitating the exfoliation procedure.
Lu et al. utilized a new type of electrolyte, water-miscible ionic liquids such as 1-butyl-
3-methylimidazolium tetrafluoroborate [BMIm][BF4], to fabricate fluorescent carbon
nanoribbons, nanoparticles, and graphene from graphite electrodes (Lu et al., 2009).
According to their results, water as the main impurity in ionic liquids played a key role
in performing ionic liquid-assisted electrochemical exfoliation. Using the fabrication of
novel hydrogen-bonded networks, water seems to disrupt the internal organization of
ionic liquids, causing anionic intercalation in the ionic liquid, expansion and exfoliation
Univers
ity of
Mala
ya

49
of graphite into carbon nanoparticles, nanoribbons and graphene sheets (Lu et al., 2009).
In addition, the ionic liquids electrolyte with water content higher than 10% could form
soluble and oxidized carbon nanostructures. Due to high potential of this method of
exfoliation, some other anionic species have also proposed to enhance the exfoliation of
graphite anodes. For example, 9-anthracene carboxylate ion was applied as the electrolyte
to exfoliate the graphite into the graphene sheets at constant voltage of 20 V (Khanra et
al., 2012). Also, graphene sheets can be functionalized with 9-anthracene carboxylate ion
during the procedure, representing oxidation of graphite over the electrochemical
exfoliation. According to their proposed mechanism, 9-anthracene carboxylate ions were
attached on the surface of graphite anode via electrostatic interaction, subsequently
exfoliated into the graphene sheets under the electrical potential.
As another example, phosphate buffer solution was selected to perform
electrochemical exfoliation of bulk graphite via cyclic voltammetry (F. Zeng et al., 2011).
They showed that functionalization of graphite samples with oxygen in the intercalation
procedure could weaken the interlayer attraction and, therefore, facilitate the exfoliation
procedure upon the gas evolution.
According to the recent results (Abdelkader et al., 2015), the potentials needed for
intercalating of anions are commonly higher than that of the potentials required for the
oxidation of bulk graphite. Therefore, the formation of functionalized graphene sheets
with some defects is inevitable, and this can be a harmful factor for electronic
applications. In fact, after disrupting the -electron system with functionalization, it
seems impossible to reestablish the electronic structure of graphene, even by reduction
(Niu et al., 2016). Therefore, the cathodic exfoliation was proposed to solve the
aforementioned problem. Accordingly, Zhou and coworkers (M. Zhou et al., 2013)
proposed a method for electrochemical exfoliation of a graphite cathode at low voltage
(DC, 5 V) in the presence of Na+ / DMSO as the intercalant. To produce the graphene
Univers
ity of
Mala
ya

50
sheets with lower amount of functional groups (oxygen functional groups) and defects,
sonication was employed (M. Zhou et al., 2013). Similarly, Yang and coworkers (Y. Yang
et al., 2013) presented a high-performance cathodic exfoliation of graphite in an ionic
liquid namely N-butyl, methylpyrrolidinium bis(trifl uoromethylsulfonyl)-imide
(BMPTF2N). Their proposed mechanism of cathodic exfoliation in BMPTF2N was the
intercalation of ionic liquids cation, [BMP]+, under highly negatively charge, which
provide conditions for graphite expansion. They also synthesized porous graphene sheets
once KOH was used as the activation material.
Li+ can also be a promising alternative for intercalating the bulk graphite
(Rocquefelte et al., 2000; Z. Zeng et al., 2011). For instance, Zeng et al. presented an
efficient approach to generate mono-layered MoS2, WS2, TiS2, TaS2, ZrS2 and graphene
by a controllable lithiation procedure. They firstly put bulk layered material such as
graphite into an electrochemical test-rig as cathode, and the Li foil were selected as anode
for preparing the required Li ions (Z. Zeng et al., 2011). Note that the whole procedure
was accomplished within 6 h at ambient temperature and the production of mono-layered
materials yielded up to 92%. Also, Wang et al. reported a high-performance method for
exfoliation of graphite (yield of 70%) (J. Wang et al., 2011). To this end, the negative
graphite electrode was charged electrochemically and subsequently expanded in an
electrolyte of Li salts and propylene carbonate (J. Wang et al., 2011).
2.9 Exfoliation Summary and Conclusion
In this part of literature review, different methods for mass production of few-
layered graphene have been investigated. Selecting a cost-effective, efficient and facile
method for scalable production of large quantities of few-layered graphene is the most
important purpose of this part of study. Like different processing methods, liquid phase
exfoliation has bot merits and demerits. Among the merits, liquid phase exfoliation is
obviously a scalable method, which is capable to prepare graphene nanosheets extremely
Univers
ity of
Mala
ya

51
cheap. Also, it is significantly simple and prepares the practical concentrations up to 1
mg mL-1. Using functionalization, the exfoliation yield can enhance. Importantly, the
required graphene nanosheets for the present application, which has improved heat
transfer with nanofluids, should have some properties such as high specific surface area,
high thermal conductivity, superior stability in aqueous media and tend to be defect free.
Nonetheless, because of significant π–π interactions and trivial interaction between pure
graphene sheets and other materials, raw graphene tends to agglomerate in aqueous and
organic media. To enhance the interactivity of raw graphene as well as its stability in
different base fluids after exfoliation, surface functionalization was suggested as a general
solution elsewhere. Accordingly, various functionalities have been applied to increase the
interactivity and stability of graphene sheets in liquids. Different methods of
functionalization are described in the following sections. This part of review shows all
modes and methods of graphene functionalization including their classification.
2.10 Functionalization by Covalent Bonding
2.10.1 Covalent Attachment of Organic Functionalities
Numerous chemical processes for generating dispersible graphene, which are
based on different exfoliation procedures, chemical vapor deposition, reduction of
graphene oxide were proposed in the literature (Dreyer et al., 2010; D. Li et al., 2008).
The main aim is to produce dispersible graphene sheets in various solvents which are
typically achieved by covalent functionalization with organic functional groups. It is also
well known that the direct dispersion of hydrophobic graphene sheets in polar solvents is
a major challenge (D. Li et al., 2008). The covalent functionalization of graphene sheets
is done by two methods:
(i) Initiation of covalent bonds between C═C bonds of pristine graphene and free
radicals
Univers
ity of
Mala
ya
52
(ii) Initiation of covalent bonds between oxygen groups of GO and organic
functional groups.
Due to lack of defects and graphitic structure, graphene has higher thermal
conductivity compared to graphene oxide (Wei Yu et al., 2011). Therefore, it is more
interesting to investigate the thermal transport properties of graphene-based nanofluids,
and to explore the improvement in the thermo-physical and thermal properties of
basefluids. Hence, the present literature review is focused on covalent functionalization
of graphene sheets.
According to the recent studies on different carbon nanostructures (Hossain et al.,
2010; Niyogi et al., 2010; Sharma et al., 2010; Zardini et al., 2012), organic free radicals
can be classified as the most promising organic groups for the reaction with sp2 carbons
of graphene.
2.10.1.1 Functionalization by Free Radicals
Sinitskii et al. and Kosynkin et al. prepared a reactive free radical by heating of a
diazonium salt to attack the sp2 carbon atoms of graphene, resulting in nitrophenyls-
functionalized graphene (Kosynkin et al., 2009; Sinitskii et al., 2010). Upon chemically-
unzipping of carbon nanotubes (CNT), the graphene sheets were generated. Similarly,
Niyogi and coworkers (Niyogi et al., 2010) proposed the covalent functionalization of
graphene sheets with nitrophenyls. X-ray photoelectron spectroscopy (XPS) was used to
analyze the covalent attachment of the nitrobenzyl groups on the surface of graphene
(Figure 2.16). There are two peaks at 406 and 400 eV in the N1s XPS spectrum of the
nitrobenzyl-functionalized graphene, representing the presence of the nitrogen of
NO2 and reduced nitrogen, respectively. Note that the reactions with diazonium salts have
been employed to functionalize different carbon-based nanostructures (Ghiadi et al.,
2013; Z. Jin et al., 2009; Lomeda et al., 2008; Sharma et al., 2010).
Univers
ity of
Mala
ya
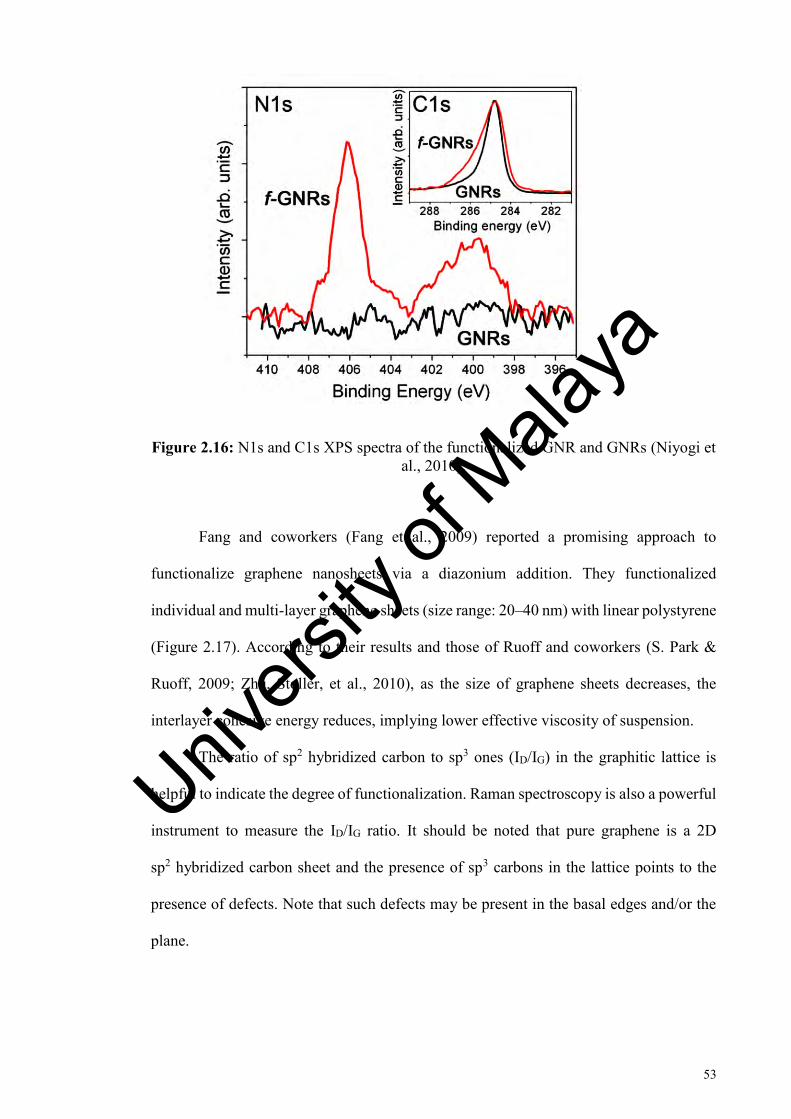
53
Fang and coworkers (Fang et al., 2009) reported a promising approach to
functionalize graphene nanosheets via a diazonium addition. They functionalized
individual and multi-layer graphene sheets (size range: 20–40 nm) with linear polystyrene
(Figure 2.17). According to their results and those of Ruoff and coworkers (S. Park &
Ruoff, 2009; Zhu, Stoller, et al., 2010), as the size of graphene sheets decreases, the
interlayer cohesive energy reduces, implying lower effective viscosity of suspension.
The ratio of sp2 hybridized carbon to sp3 ones (ID/IG) in the graphitic lattice is
helpful to indicate the degree of functionalization. Raman spectroscopy is also a powerful
instrument to measure the ID/IG ratio. It should be noted that pure graphene is a 2D
sp2 hybridized carbon sheet and the presence of sp3 carbons in the lattice points to the
presence of defects. Note that such defects may be present in the basal edges and/or the
plane.
Figure 2.16: N1s and C1s XPS spectra of the functionalized GNR and GNRs (Niyogi et al., 2010).
Univers
ity of
Mala
ya

54
Figure 2.18 panel (a) shows that the ID/IG ratio of samples increases from 1.7 to 2
after diazonium addition reaction (Haitao Liu et al., 2009). The functionalization of
graphene sheets with phenyl groups is confirmed by the presence of a sharp D band at
1343 cm–1 seen in Figure 2.18 panel (b), which is in good agreement with the presence of
defects on the graphene surface.
Figure 2.17: The functionalization procedure of graphene nanosheets by polystyrene (Fang et al., 2009).
Figure 2.18: Radical addition reaction mechanism. (a) Raman spectra of a mono layer graphene after and before functionalization and (b) optical image of a functionalized
mono layer graphene with some holes or defects (Haitao Liu et al., 2009).
Univers
ity of
Mala
ya

55
Recently, present research group (W. Sarsam et al., 2016b) proposed a new and
quick synthesis method for synthesizing triethanolamine-treated graphene nanoplatelets.
Using an electrophilic addition reaction, they could functionalize graphene nanoplatelets
via molecules including hydroxyl (OH) groups e.g. triethanolamine. They could
synthesized water-based graphene nanoplatelets nanofluids with high stability (W.
Sarsam, et al., 2016b). The triethanolamine-functionalized graphene nanoplatelets with
different weight concentrations and specific surface areas showed appropriate stability in
aqueous media. The direct coupling of graphene nanoplatelets with free radical of
triethanolamine was confirmed by several characterization methods as shown in Figure
2.19.
Figure 2.19: (a) Schematic of Electrophilic addition reaction. (b) FTIR spectra (c) Raman spectra, and (d) energy dispersive X-ray spectroscopy traces of the
triethanolamine-treated graphene nanoplatelets (EDS traces are presented for different specific surface areas).
Univers
ity of
Mala
ya

56
The higher ID/IG ratio of triethanolamine-treated graphene nanoplatelets compared
to that of the pristine sample, where the appearance of some meaningful bands in FTIR
spectrum and the presence of different elements in energy dispersive X-ray spectroscopy
(EDS) results confirm the successful attachment of functional groups on graphene
nanoplatelets.
2.10.1.2 Functionalization by Dienophiles
Like free radicals, dienophiles also can easily decorate on the graphene surface
with quick reaction with sp2 carbons. As one of the dienophiles, Azomethine ylide has
been commonly used to functionalize different carbon-based nanostructures. In fact,
Azomethine ylide reacts mostly through a 1,3 dipolar cycloaddition (Georgakilas et al.,
2012). In fact, 1,3 dipolar cycloaddition reaction can be employed for a number of organic
derivatives and plays a key role in increasing the performance of different applications
such as nanoelectronic devices, polymer composites, drug delivery, solar cells and
biotechnology (Dabiri et al., 2016; Georgakilas et al., 2008; Kostarelos et al.,
2007). Georgakilas and coworkers (Athanasios B. Bourlinos et al., 2009) produced
graphene sheets via direct sonication of pristine graphite in organic solvents, and
subsequently performed the substitution of graphene sheets with pyrrolidine rings by a
1,3 dipolar cycloaddition of azomethine ylide (Georgakilas et al., 2010).
The dihydroxyl phenyl-functionalized graphene sheets were generated
perpendicular to the graphene surface after the attachment of azomethine ylide precursors,
which is shown in Figure 2.20 (Georgakilas et al., 2010). Due to the introduction of
hydroxyl groups onto the graphene sheets, their dispersibility was significantly enhanced
in polar solvents (e.g. ethanol). The significant increase of the ratio of ID/IG verified the
appearance of sp3 planar carbon atoms, implying successful functionalization (Figure
2.20).
Univers
ity of
Mala
ya

57
Park and Ruoff (S. Park & Ruoff, 2009) reported the prepared large few-layered
graphene sheets with sizes ranging between 500 nm and 1 mm. Their morphological
studies using TEM and AFM are shown in Figure 2.21. Their AFM images illustrate a
mono layered graphene with a thickness of 1.5 nm. According to the resent studies
(Nemes-Incze et al., 2008; S. Park & Ruoff, 2009), monolayer graphene without any
modification has a thickness between 0.6 and 0.9 nm; therefore, the increase in graphene
layer thickness was attributed to the functional groups across the surface of graphene
sheets.
Dipolar cycloaddition can be employed for several aldehydes to yield the degree
of functionalization for desirable functional groups (Georgakilas et al., 2012). Due to this
flexibility, the current reaction procedure has attracted numerous researchers in this field
of study.
Figure 2.20: The 1,3 dipolar cycloaddition reaction for decorating the surface of graphene with azomethine ylide (left). Ethanol-based Functionalized graphene
nanoplatelets dispersion (top, right). Raman spectra of (a) pristine graphene and (b) pyrrolidine functionalized graphene (bottom, right) (Georgakilas et al., 2010).
Univers
ity of
Mala
ya

58
Zhang et al.(X. Zhang et al., 2011) utilized tetraphenylporphyrin aldehyde and
sarcosin as precursors to attach tetraphenylporphyrin (TPP) on the surface of graphene
sheets. Also, Quintana and coworkers(Quintana et al., 2010) used paraformaldehyde as
precursor to functionalize graphene flakes with 1,3-dipolar cycloaddition reaction and
NH2-terminated α-amino acid was obtained. To selectively bind gold nanorods, the
decorated amino groups were applied.
Upon the creation of the reactive intermediate nitrene, phenyl and alkyl azides can
easily attach to the graphene surface. Therefore, for producing different organic graphene
derivatives, some researchers have used the effective reaction of organic azides with
graphene sheets. For example, Liu and coworkers(L.-H. Liu et al., 2010) employed
aforementioned method to decorate different functionalities to the graphene sheets via a
three-membered aziridine ring. They have used this method for functionalization of
graphene sheets with perfluorophenylazides (PFPA) with thermal and photochemical
methods. Figure 2.22 shows the functionalization procedure of pristine graphite with
perfluorophenylazides. Solubility of the PFPA-treated graphene sheets was significantly
higher than that of pristine samples.
Figure 2.21: (a, b, c) TEM images and (d, e) AFM images of the functionalized graphene sheets (S. Park & Ruoff, 2009).
Univers
ity of
Mala
ya

59
Nitrene addition reaction is a suitable method for functionalization of graphene
sheets. Strom and coworkers (Strom et al., 2010) presented a high performance approach
to functionalize graphene sheets via nitrene addition of azido-phenylalanine [Phe(N3)].
This procedure was used to exfoliate bulk graphite into few layer graphene. Moreover,
nitrene addition of azido-phenylalanine could provide a direct method for reaching high-
degree of functionalization for graphene sheets. They could introduce a high degree of
functionalization, representing 1 phenylalanine substituent per 13 carbons.
Vadukumpully et al. also reported a quick and efficient method for the covalent
functionalization of graphene sheets (Vadukumpully et al., 2011). They functionalized
dispersible surfactant wrapped graphene sheets (CTAB-graphene) with different
alkylazides. Applied alkyl chains had several groups such as hexyl, hydroxyl-undecanyl,
dodecyl, and carboxy-undecanyl (Vadukumpully et al., 2011). According to their
Figure 2.22: Edge-functionalization of pristine graphene with perfluorophenylazides (L.-H. Liu et al., 2010).
Univers
ity of
Mala
ya

60
results 11-azidoundecanoic acid is the best type of azide for improving dispersibility and
the alkylazides-functionalized samples illustrated high dispersibility in organic solvents
like toluene and acetone. The functionalization of graphene sheets with various
alkylazides is shown in Figure 2.23 panel (a). The corresponding Raman results is shown
in Figure 2.23 panel (b), showing an increase in the ID/IG ratio after functionalization with
nitrene addition method (Vadukumpully et al., 2011). Consist with Raman results, the
amount of nitrene play a key role in increasing the degree of functionalization.
He and Gao introduced an efficient and useful nitrene cycloaddition reaction for
functionalization of graphene sheets with polymeric chains and different functional
groups (Hongkun He & Gao, 2010). Interestingly, this functionalization method can be
applied to covalently bond different functional moieties and polymers to the graphene
sheets, representing functionalized 2-D graphene sheets and 2-D macromolecular
brushes, respectively. As a result, the treated samples demonstrated higher chemical and
thermal stabilities compared to that of graphene oxide. The modified graphene sheets
Figure 2.23: (a) Functionalization of graphene sheets with alkyl nitrenes. (b) Raman spectra of graphene sheet before (1) and after functionalization of graphene sheets with
11-azidoundecanoic acid in 1:1 (2) and 10:1 (3) ratios (Vadukumpully et al., 2011). Univers
ity of
Mala
ya

61
showed high electrically conductivity and showed great stability and dispersibility in
solvents (Hongkun He & Gao, 2010). Figure 2.24 illustrates the photographs of
functionalized graphene nanosheets dispersion in various solvents after sonication. A
higher dispersibility of graphene sheets in various solvents are obvious after covalently
functionalization.
Similarly, Choi et al. proposed a method for covalent functionalization of
graphene sheets with thermally generated nitrene J. Choi et al. (2009). Upon selecting the
amount of nitrene in the functionalization procedure, the band gap of the functionalized
graphene sheets was controlled. Zhong et al. also proposed a facile method to produce
aryne-functionalized graphene sheets via aryne cycloaddition (Zhong et al., 2010). Using
2-(trimethylsilyl)aryl triate as a precursor along with reactive benzyne intermediate were
employed to do aryne cycloaddition. The aryne-functionalized graphene sheets showed a
significant stability in different solvents such as DMF, o-DCB, ethanol, chloroform, and
water. The functionalization procedure resulted in the attachment of a four-membered
ring, decorating graphene surface with the aromatic arene rings (Figure 2.25).
Additionally, different interesting derivatives have been synthesized by substituting of
Figure 2.24: The photographs of functionalized graphene nanosheets dispersion in solvents after sonication: hydroxyl-functionalized graphene in water (1) and DMF (2),
carboxyl-functionalized graphene in water (3) and DMF (4), poly(ethylene glycol)-functionalized graphene in water (5) and DMF (6), long alkyl chain-functionalized graphene in chloroform (7) and toluene (8), polystyrene-functionalized graphene in
chloroform (9) and toluene (10), amino-functionalized graphene in water/chloroform (12), graphene oxide in chloroform (13), and reduced graphene oxide in DMF (14)
(Hongkun He & Gao, 2010).
Univers
ity of
Mala
ya

62
organic groups with the aryl rings. Figure 2.25 also shows the great dispersibility of
functionalized graphene sheets in DMF (Zhong et al., 2010).
2.11 Covalent Attachment of Functionalities to Graphene Oxides
Graphene oxide is a single graphitic monolayer with randomly distributed
sp2 carbon atoms (aromatic regions) and oxygenated aliphatic regions (sp3 carbon atoms)
containing hydroxyl, epoxy, carbonyl, and carboxyl functional groups. Due to numerous
defects and the presence of lots of functional groups containing oxygen on the surface of
graphene oxide limits its suitability for heat transfer applications. In fact, due to the acidic
groups on the hydrophilic structure of graphene oxide, it can introduce large amount of
corrosion in different metal-based equipment. Also, graphene oxide mostly generates
unstable dispersions in water and other polar organic solvents including ethylene glycol,
Figure 2.25: (top) The schematic of chemical functionalization of graphene sheets via aryne cycloaddition. (Bottom left) Photographs of graphene sheets and aryne-
modified graphene sheets dispersions in DMF: (a) graphene sheets, (b) F- aryne-modified graphene sheets, (c) Me- aryne-modified graphene sheets and (d) H- aryne-
modified graphene sheets. (Bottom right) (B) UV–vis absorption spectra of Me- aryne-modified graphene sheets dispersed in ethanol with different concentrations (J. Choi et
al., 2009).
Univers
ity of
Mala
ya

63
THF, and DMF (Georgakilas et al., 2012). Furthermore, exfoliated graphene oxide
nanoplatelets have a tendency to aggregate through π–π stacking to produce large
particles. So, in order to stabilize graphene oxide in different solutions, some protective
agents were suggested (Y. Liang et al., 2009; N. Liu et al., 2008; Su et al., 2009;
Watcharotone et al., 2007). It is obvious that using these stabilizers cannot be favorable
for applying in technological applications and such works are however outwith the scope
of this thesis.
It should be noted that a percentage of oxygen groups and defects on graphene
oxide remain after any reductive treatment procedures. These defects can also decrease
the properties of the reduced graphene oxide, notably its electric and thermal
conductivities. For this reason and in order to reach maximum heat transfer, this study
only focuses on the pristine graphene.
2.12 Noncovalent Functionalization of Graphene sheets
Upon manipulating van der Waals interaction and/or exposing ionic interaction
between a molecule and graphene sheets, noncovalent functionalization of graphene is
occurred. Jaegfeldt et al. reported that the pyrene moiety have a severe affinity toward the
basal plane of graphite via π-stacking (Jaegfeldt et al., 1983). Similarly, a stable water-
based graphene nanoplatelets dispersion was synthesized using 1-pyrenebutyrate as one
of the water-soluble pyrene derivatives (Y. Xu et al., 2008). To make the stable water-
based graphene nanoplatelets dispersions, graphene oxide was initially reacted with
pyrenebutyric acid and subsequently the pyrenebutyric acid-treated graphene oxide was
reduced chemically in the presence of hydrazine (Y. Xu et al., 2008). They finally could
produce graphene oxide and pyrenebutyric-treated graphene nanoplatelets (Figure 2.26)
with thickness of 1.3 and 1.7 nm, respectively.
Univers
ity of
Mala
ya

64
Also, Wang et al. functionalized the graphene sheets with pyrene butanoic acid
succidymidyl ester to enhance the power conversion performance of graphene (Y. Wang
et al., 2009). An et al. also could prepared 1-pyrenecarboxylic acid-treated graphene films
with noncovalent (π-stacked) pyrenecarboxylic acid with graphene sheets to prepare films
with excellent optical and molecular sensing properties (X. An et al., 2011).
Yang et al. synthesized stable water-based graphene nanoplatelets suspensions
with a high volume fractions (0.6–2 mg/mL) using the reduction of graphite oxide (Q.
Yang et al., 2010). They used sodium lignosulfonate, sodium carboxymethyl cellulose,
and pyrene-containing hydroxypropyl cellulose (HPC-Py) to reduce graphite oxide
chemically. Kodali et al. proposed a method for noncovalently functionalization of
graphene sheets via pyrenebutanoic acid-succinimidyl ester, resulting in production of
flakes without disrupting structure (Kodali et al., 2010). In a majority of noncovalent
functional groups, the attachment of the substituted molecules and graphene was
attributed to the van der Waals interactions (Lopes et al., 2010). Recently, Su et al. offered
Figure 2.26: (left) AFM images of graphene oxide and (right) pyrenebutyric-treated graphene nanoplatelets on mica (Y. Xu et al., 2008).
Univers
ity of
Mala
ya
65
a promising method for functionalization of graphene sheets with pyrene and
perylenediimide (Su et al., 2009). They could synthesize a stable aqueous dispersion
including mostly mono and double layer graphene sheets.
As another type of noncovalent functional groups, DNA can be employed as
stabilizer for developing the stability of graphene in aqueous media and other basefluids.
For instance, Liang et al. could functionalize graphene sheets with single-stranded DNA,
non-covalently (Y. Liang et al., 2009). They initially oxidized graphite to graphene oxide
and subsequently performed the hydrazine reduction in the presence of single-stranded
DNA (Y. Liang et al., 2009). The produced graphene nanosheets presented a high
concentration in aqueous media, ranging as high as 2.5 mg/L.
In a similar study, for deposition of gold nanoparticles on graphene sheets, Liu et
al. produced thiolated DNA oligonucleotides-functionalized graphene nanoplatelets
(Jinbin Liu et al., 2010). This procedure included adsorbing thiolated DNA
oligonucleotides on graphene oxide nanoplatelets and reducing thiolated DNA
oligonucleotides-functionalized graphene oxide via hydrazine to thiolated DNA
oligonucleotides-functionalized reduced graphene oxide (Jinbin Liu et al., 2010). The
resulting functionalized materials had a unique solubility in aqueous media.
Subsequently, gold nanoparticles were poured into the aqueous solutions of thiolated
DNA oligonucleotides-functionalized reduced graphene oxide to form a homogenous
suspension. The reported mechanism is shown in Figure 2.27. Univers
ity of
Mala
ya

66
It is well known that methyl green has a positive charge with high solubility in
aqueous media, therefore it is a promising candidate for adsorbing on the graphite surface
via π–π stacking, weakening the powerful van der Waals interactions between layers.
Therefore, the adsorption of methyl green onto graphite can dramatically increases the
solubility of exfoliated graphene and graphite in aqueous media. To address this issue, Tu
et al. functionalized graphene flakes via water-soluble picket-fence iron porphyrin (Tu et
al., 2010). As shown in Figure 2.28, they presented a stable and homogenous picket-fence
iron porphyrin-treated reduced graphene oxide in water (Tu et al., 2010).
Figure 2.27: DNA coating, metal coating and aqueous dispersion of graphene oxide and Reduced graphene oxide (Jinbin Liu et al., 2010).
Univers
ity of
Mala
ya

67
In a similar way, porphyrin-functionalized graphene nanoplatelets were
synthesized via hydrazine reduction of graphene oxide with water-soluble porphyrins
(Geng & Jung, 2010). Zhang et al. proposed a method for nonocovalently
functionalization of graphene nanoribbons with water-soluble iron (III) meso-tetrakis(N-
methylpyridinum-4-yl) porphyrin (S. Zhang et al., 2011). They employed π–π
noncovalent interaction on an electrode surface to increase the degree of
functionalization. Note that the resulting Iron (III) meso-tetrakis(N-methylpyridinum-4-
yl) porphyrin-adsorbed graphene nanoribbons composite film illustrated unique
electrocatalysis for being used as a biosensor for the detection of glucose in human serum
(S. Zhang et al., 2011).
Bai et al. reported a noncovalent functionalization method for synthesizing
sulfonated polyaniline-graphene nanoplatelets (Bai et al., 2009). The resulting products
were significantly soluble in water and remained stable for more than two weeks. Because
of the electrostatic repulsion between negatively charged sulfonated polyaniline-graphene
nanoplatelets as well as severe π–π stacking between the graphene basal planes and the
Figure 2.28: TEM images of (left) 5,10,15,20-tetrakis α-2-trismethylammoniome thylphenyl] porphyrin iron (III) pentachloride/Reduced graphene oxide; and (right)
photographs of a) Reduced graphene oxide, b) 5,10,15,20-tetrakis [αααα-2-trismethylammoniome thylphenyl] porphyrin iron (III) pentachloride, and c) 5,10,15,20-tetrakis [α-2-trismethylammoniome thylphenyl] porphyrin iron (III) pentachloride (0.1
mg mL-1) dispensed in water (Tu et al., 2010).
Univers
ity of
Mala
ya

68
main structure of sulfonated polyaniline, the resulting sulfonated polyaniline-graphene
nanoplatelets presented suitable stability at pH of 1–2 (Bai et al., 2009).
Li and his coworkers (F. Li et al., 2010) non-covalently synthesized an extremely
soluble congo red-treated graphene nanoplatelets composite by direct coupling. They
claimed that the resulting materials have significant solubility in different organic
solvents as well as in water. It can be seen in Figure 2.29 that the congo red-treated
graphene nanoplatelets were fully dispersed in dimethylformamide, water, ethanol,
dimethyl sulfoxide, and methanol and partially dispersed in many other organic solvents.
The mechanism of high dispersibility and stability of congo red-treated graphene
nanoplatelets was completely explained by Hansen solubility parameters.
Figure 2.29: Solubility photographs of congo red-treated graphene nanoplatelets nanocomposites in (a) toluene, (b) benzene, (c) tetrahydrofuran, (d) ethyl acetate, (e) isopropanol, (f) chloroform, (g) acetone, (h) acetonitrile, (i) dimethylformamide, (j)
methanol, (k) dimethyl sulfoxide, (l) water, (m) N-Methyl-2-pyrrolidone, (n) ethanol, (o) isoamyl alcohol, (p) m-cresol, (q) pyridine, and (r) 1,4-dioxane (F. Li et
al., 2010).
Univers
ity of
Mala
ya

69
A water-soluble aromatic electroactive dye was applied for non-covalently
functionalization of graphene sheets by Liu and coworkers (Huan Liu et al., 2009). They
prepared methylene green-treated graphene during the chemical reduction of graphene
oxide with hydrazine. Methylene green-treated graphene showed a well-solubility in
water through coulomb repulsion between methylene green-treated graphene
nanoplatelets (Huan Liu et al., 2009). Also, Fang et al. investigated noncovalent
functionalization of reduced graphene oxide with chitosan (Fang et al., 2010). According
to their results, amino and hydroxyl groups of chitosan can be captured by graphene
thorough hydrogen bonding and zwitterionic interactions, showing considerable
solubility in water. It should be noted that the water-based graphene suspension is
biocompatible.
As another type of non-covalent groups, polymers were introduced recently for
increasing solubility of graphene sheets in aqueous media (Jo et al., 2011). Poly(3,4-
ethylene dioxythiophene):poly(styrene sulfonate) (PEDOT:PSS) was used by Jo et al.(Jo
et al., 2011) for noncovalent functionalization of reduced graphene oxide nanoplatelets.
They have reported a significant stability for PEDOT:PSS-treated RGO suspension in
aqueous media. Ghosh et al.(Ghosh et al., 2010) proposed a facile and quick method for
synthesizing stable water-based single- and few-layer graphenes dispersions via non-
covalent functionalization with a coronene carboxylate acceptor molecule.
To form a stable aqueous solution of single- and double-layer graphene sheets, a
noncovalent functionalization of graphene sheets with thionine was suggested by Chen
and coworkers (Chen et al., 2011). Some characterizations such as optical spectroscopy
showed and confirmed the existence of π–π interactions between the thionine and
graphene sheets. As another advantage, the conductivity of the hybrid material including
functionalized graphene with thionine was almost 7 orders of magnitude larger than that
observed for graphene oxide (Chen et al., 2011). Similarly, Liu and coworkers (Jingquan
Univers
ity of
Mala
ya
70
Liu et al., 2010) could synthesize poly(N-isopropylacrylamide) [PNIPAAm]-treated
graphene upon π–π stacking interactions, which resulted in an aqueous suspensions with
high stability.
Yang and coworkers (H. Yang et al., 2010) also proposed an efficient technique
for noncovalent functionalization of graphene sheets with poly(2,5-bis(3-
sulfonatopropoxy)-1,4-ethynyl-phenylene-alt-1,4-ethynylphenylene) sodium salt (PPE-
SO3–). Highly soluble poly(2,5-bis(3-sulfonatopropoxy)-1,4-ethynyl-phenylene-alt-1,4-
ethynylphenylene) sodium salt (PPE-SO3–) in water play a key role in providing highly
conductive and stable water-based graphene dispersions for long periods of time. The π
stacking interaction between graphene nanoplatelets and PPE-SO3– is the main proposed
mechanism. More interestingly, the successful adsorption of PPE-SO3– by graphene
sheets not only was used as a stabilizer for aqueous media but also donates the resulting
graphene sheets with negative charges, which provide suitable conditions for further
functionalization of graphene sheets. Hemin– treated graphene hybrid nanoplatelets (H-
GNs) (Guo et al., 2011) was also shown high solubility and stability in water, resulting
from π–π interactions. Wang et al. proposed a green method for the formation of soluble
reduced graphene oxide (Yan Wang et al., 2011). Upon the reduction of graphene oxide
in the presence of green tea, the resulting green tea-treated graphene sheets showed an
appropriate stability and solubility in both aqueous solution and a variety of organic
solvents. Park et al. synthesized a stable and biocompatible polyoxyethylene sorbitan
laurate (TWEEN)-adsorbed RGO platelets with highly stability in aqueous media (S. Park
et al., 2010). By taking advantage of the solubility in water of TWEEN paper in water
and the capability for being adsorbed on graphene sheets, this procedure was proposed.
The key role of Pluronic copolymer in dispersing graphene in aqueous media was
investigated by Zu et al., which resulted in the aqueous graphene solutions with three
months stability (Zu & Han, 2009). Liu and coworkers also synthesized an aqueous
Univers
ity of
Mala
ya
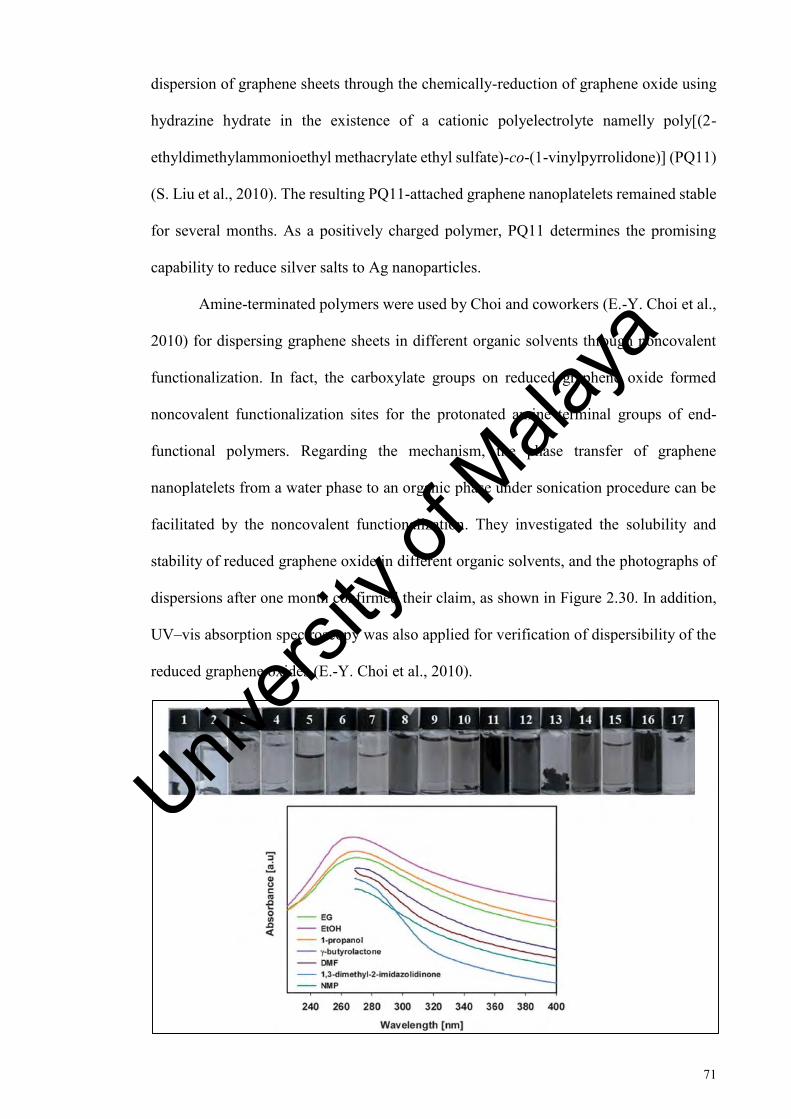
71
dispersion of graphene sheets through the chemically-reduction of graphene oxide using
hydrazine hydrate in the existence of a cationic polyelectrolyte namelly poly[(2-
ethyldimethylammonioethyl methacrylate ethyl sulfate)-co-(1-vinylpyrrolidone)] (PQ11)
(S. Liu et al., 2010). The resulting PQ11-attached graphene nanoplatelets remained stable
for several months. As a positively charged polymer, PQ11 determines the promising
capability to reduce silver salts to Ag nanoparticles.
Amine-terminated polymers were used by Choi and coworkers (E.-Y. Choi et al.,
2010) for dispersing graphene sheets in different organic solvents through noncovalent
functionalization. In fact, the carboxylate groups on reduced graphene oxide formed
noncovalent functionalization sites for the protonated amine terminal groups of end-
functional polymers. Regarding the mechanism, the phase transfer of graphene
nanoplatelets from a water phase to an organic phase under sonication procedure can be
facilitated by the noncovalent functionalization. They investigated the solubility and
stability of reduced graphene oxide in different organic solvents, and the photographs of
dispersions after one month confirmed their claim, as shown in Figure 2.30. In addition,
UV–vis absorption spectroscopy was also applied for verification of dispersibility of the
reduced graphene oxides (E.-Y. Choi et al., 2010).
Univers
ity of
Mala
ya
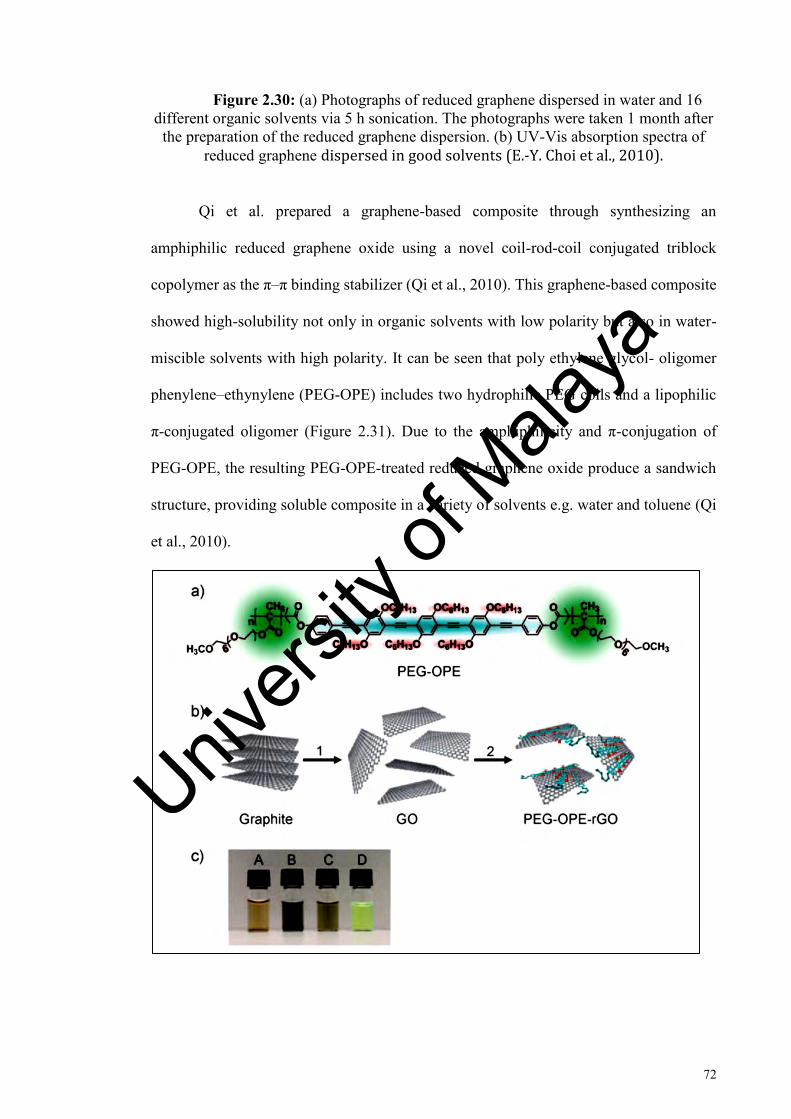
72
Qi et al. prepared a graphene-based composite through synthesizing an
amphiphilic reduced graphene oxide using a novel coil-rod-coil conjugated triblock
copolymer as the π–π binding stabilizer (Qi et al., 2010). This graphene-based composite
showed high-solubility not only in organic solvents with low polarity but also in water-
miscible solvents with high polarity. It can be seen that poly ethylene glycol- oligomer
phenylene–ethynylene (PEG-OPE) includes two hydrophilic PEG coils and a lipophilic
π-conjugated oligomer (Figure 2.31). Due to the amphiphilicity and π-conjugation of
PEG-OPE, the resulting PEG-OPE-treated reduced graphene oxide produce a sandwich
structure, providing soluble composite in a variety of solvents e.g. water and toluene (Qi
et al., 2010).
Figure 2.30: (a) Photographs of reduced graphene dispersed in water and 16 different organic solvents via 5 h sonication. The photographs were taken 1 month after
the preparation of the reduced graphene dispersion. (b) UV-Vis absorption spectra of reduced graphene dispersed in good solvents (E.-Y. Choi et al., 2010).
Univers
ity of
Mala
ya

73
2.13 In Situ Exfoliation and Functionalization for Applications
As mentioned above, despite numerous studies on the applications and
characteristics of graphene, researchers should find a method for mass production of
graphene with high quality in a commercially viable way. Exfoliation of bulk graphite to
thin graphene flakes with thickness of nanometer can be a promising method for mass
production of graphene. As a low-cost and highly scalable method, chemical exfoliation
was suggested for synthesizing mono- or few-layered graphene. However, the structural
defects of GO cannot be completely removed even with thermal reduction and chemical
treatment. Obviously, the presence of structural defects considerably restricts the
applications of in thermal, electronic and optical devices (Becerril et al., 2008; Stankovich
et al., 2007; Zhu, Murali, Cai, et al., 2010). More recently, a novel liquid-phase exfoliation
illustrates significant performance in forming 2D carbon-based nanostructures. This
liquid-phase exfoliation strategy has been obtaining great attention due to its unique
properties such as being cost-effective, efficient, extraordinarily versatile and potentially
for large-scale production of defect-free graphene (Hernandez et al., 2008; Paton et al.,
2014). The second fundamental problem is the difficulties in processing graphene, in
particular in our study, the graphene's poor colloidal stability in most common solvents
(Ayan-Varela et al., 2014). As mentioned above, graphene nanosheets are extremely
hydrophobic, and the interlayer cohesive energy (van der Waals interaction) enhances
significantly with rising sheet dimensions (Georgakilas et al., 2012). This increase usually
results in irreversible aggregation without electrostatic or steric protection. Overall, many
of graphene’s applications cannot be fully realized due to weak solubility of graphene in
most common solvents. Grafting covalent and non-covalent functional groups can
Figure 2.31: (a) The main chemical structure of poly ethylene glycol- oligomer phenylene–ethynylene (PEG-OPE). (b) The synthesis procedure of PEG-OPE–treated
Reduced graphene oxide in H2O. (c) Photograph of (A) graphene oxide and (B) Reduced graphene oxide in water and (C) PEG-OPE–treated Reduced graphene oxide
and (D) PEG-OPE in methanol (Qi et al., 2010).
Univers
ity of
Mala
ya
74
prevent aggregation of graphene sheets, resulting in initiating nanofluids. Once
functionalized with hydrophilic functional groups, the graphene-based nanofluids may
open a gateway to new fields in heat transfer.
Besides presenting the exfoliation and functionalization methods for synthesizing
stable dispersions, this comprehensive literature review includes experimental and
theoretical works on convective heat transfer using carbon allotropes based nanofluids.
2.13.1 Nanofluid as a New Class of Material to Enhance Heat Transfer
Performance
Since the dawn of industrialization, heat transfer has become the subject of interest
for many researchers within the industry and academia. Nevertheless, major obstacle
comes from the medium being used within the heat cycle. To date, oil, water and ethylene
glycol have been extensively used as heat transfer working fluids due to their favorable
attributes such as convenience in handling, disposal and recycling processes as well as
their accessibility at relatively low market price. However, these fluids suffer from low
thermal properties, and combined with other inherent limitations associated to the heat
exchanger design such as fouling and low total surface energy, the overall heat transfer
performance remains at technically low level. These impediments resort the manufacturer
to design heat exchanger with extended size factor to harness the energy needed to
achieve required operations within specific duration. Hence, relentless efforts have been
directed on exploring the fluids that could improve heat transfer performance
significantly. It is evident that the most notable and widely used technique for improving
fluid properties is the addition of particles to form two-phase fluid slurries. Commonly,
solid particles, such as metallic, non-metallic and polymeric are the main sources of
foreign substances added into the base fluids. The effect of particle suspension of various
types, sizes and volume fractions in base liquid mixture was first scientifically studied
Univers
ity of
Mala
ya

75
and reported by Maxwell (Maxwell, 1881). This method has been successful up to a
certain limit due to the adverse effects especially with respect to suspension stability,
clogging, erosion and large increase in pressure drop. The above scenario started to
change dramatically with the use of nanometer size particles (<100nm) (Chol, 1995). It
was demonstrated that issues pertaining to the application of large particle for enhancing
heat transfer properties in heat exchanger can be reduced significantly. Further, clogging
and erosion problems are substantially minimized with relatively small penalty in
pressure drop at low concentrations. The use of advanced techniques to uniformly
disperse nanoparticles in the base fluid ensures colloidal stability to avoid deposition and
settlement of particles due to the dominant effect of gravity and interparticle attractions
which reduce its performance. Research conducted by Chol (Chol, 1995) on the aspect of
improving the themophysical properties of heat transfer fluids through the use of
nanoparticles was among the pioneering work with regard to this subject. They coined
the formation of stable suspension of these minute particles in heat transfer liquid as
‘Nanofluid’. The earliest investigation on the role of nanolfuid in improving heat
exchanger performance was conducted by Pak and Cho who performed an experimental
study to highlight the effect of adding nanoparticle in water as the base fluid in convective
mode (Bock Choon Pak & Young I Cho, 1998). Since then, a lot of researchers have
participated in nanofluid related studies. Most experiments were conducted on the basis
of investigating heat transfer effect with particle of different type and morphological
properties suspended in different heat transfer fluids under both laminar and turbulent
regime (Murshed et al., 2008; Bock Choon Pak & Young I Cho, 1998; Zubir, Badarudin,
Kazi, Huang, Misran, Sadeghinezhad, Mehrali, Syuhada, et al., 2015; Zubir, Badarudin,
Kazi, Huang, Misran, Sadeghinezhad, Mehrali, & Yusoff, 2015; Zubir, Badarudin, Kazi,
Misran, et al., 2015). Among the most notable and frequently cited research works, the
Univers
ity of
Mala
ya

76
studies on formulating thermo-physical and heat transfer properties which are the pivotal
elements in determining nanofluid performance.
2.13.2 Using Graphene Based Nanofluids as Promising Candidate for
Improving Convective Heat Transfer
The critical demand for highly efficient thermal transport solution has become the
major challenge for industries particularly in the realm of energy and power supply. This
lies from the fact that many physical processes involve heat transportation between
different energy conversion devices in order to harness the useful energy. At the core of
heat transport system, specific priority has been given to address the limitation on the
medium employed to complete the energy conversion process. Conventionally, water has
been used as heat carrier especially in oil and gas refinery plants, nuclear and coal based
electrical power plants and centralized cooling and heating systems (S. Lee et al., 1999).
The reason being that water is abundant, inexpensive and readily available in its processed
form without requiring additional chemical synthesis prior to its usage. The purification
and post treatment processes are relatively straight forward and do not require specific
protocols for handling and disposal. However, it is also acknowledged that water suffers
from several drawbacks, particularly on the aspect of its heat transfer properties.
Measurement of the thermal conductivity for instance reveals extremely low magnitude
in comparison to solid metal which contributes the major obstacle in attaining high level
of heat exchange. Theoretically, a low thermal conductivity of water implies an increase
in thermal resistance by which the heat exchange medium would act as insulator,
compromising efficient heat conduction process. This impediment has prompted
researchers to explore innovative approaches such as modification of heat exchanger
surface and configurations, resizing of heat exchanger unit as well as adjusting operating
flow conditions as ways to boost the heat transfer efficiency. About two decades ago,
Univers
ity of
Mala
ya

77
Chol (Chol, 1995) has successfully demonstrated the addition of controlled amount of
sub-micron size, high thermal conductivity ceramic-based materials in aqueous system
that produces significant improvement to the overall thermal conductivity of the host
solutions. This research has inspired the long time ambition for achieving much compact
but high efficiency heat exchanger unit that would match the rapid increase in processing
capacity of integrated circuit technology for instance. Since then, booming research
efforts have seen exponential growth on the number of nanofliud related publications.
The research in nanofluids is classified into three main categories:
i) Addressing the role of quantum physics on describing the nanofluid property
enhancement (Eapen et al., 2007),
ii) Exploring different materials along with other mechanistic effects such as
concentration, particle morphological structure, state of suspension stability and external
excitation on tailoring the thermo-physical properties of nanofluid (Chon & Kihm, 2005),
and
iii) Unraveling the role of nanofluid in enhancing the performance of boiling and
convection heat transfer processes (You et al., 2003).
Studies have shown that nanofluid demonstrates novel characteristics previously
not found in base fluid alone namely strong temperature dependent thermal conductivity,
significant enhancement of thermal conductivity at very low particle loading, anomalous
increase in critical heat flux in pool boiling and prominent increase in heat transfer
coefficient at low concentration and beyond the increase on thermal conductivity alone
(Zheng et al., 2011).
It is evident that tremendous amount of research efforts have been dedicated on
studying the effect of adding oxide, nitride, and carbide ceramics nanoparticles, carbon
nanotube and their composites on physicochemical property of heat transfer fluid. It is
worthy to note that while the study of ceramic-based nanofluid is well-established within
Univers
ity of
Mala
ya

78
the scope of heat transfer subject, lack of work has been emphasized on the effect of
incorporating different carbon allotropes on augmenting the thermo-physical nature of
host fluids (Sundar et al., 2014). Using different base fluids including water and ethylene
glycol, many studies were performed on dispersing various types of carbon based-
nanostructures such as single-walled carbon nanotubes (Nanda et al., 2008; Z. Sun et al.,
2008), multi-walled carbon nanotubes (Shanbedi, Heris, Amiri, Adyani, et al., 2014),
graphene (W. Sarsam et al., 2016; W. Sarsam et al., 2016a) and nitrogen doped graphene
for synthesizing highly-conductive nanofluids. The unique properties of few-layer
graphene have attracted the attention of a large number of scientists in different fields (
Shanbedi, et al., 2015). In particular, large specific surface area and outstanding thermal
conductivity at room temperature make the few-layer graphene an ideal material for heat
transfer applications. In recent years, researchers have gradually shifted their attention to
the use of graphene based nanofluids (S. D. Park et al., 2010; Zhenyu Sun et al., 2013).
This is largely due to the ability to address the persisting issues on maintaining the long
term stability as well as the discovery of much effective stabilizing approaches that uses
substances highly benign to the environment, low in molecular weight, as well as
requiring low amount in comparison to the conventional strategies. As mentioned in
functionalization section, a large number of research findings have been documented
focusing the effect of stable carbon based colloidal suspensions in changing the
physicochemical properties of the host fluid as well as its role in improving different
modes of heat transfer processes. On this note, it is worthy to highlight that a significant
rise in thermal conductivity enhancement was reported with the addition of very low
particle loading while the rheological penalty was found to be insignificant (Baby &
Ramaprabhu, 2010; Mehrali, Sadeghinezhad, Latibari, Kazi, et al., 2014; S. S. Park &
Kim, 2014; Wei Yu et al., 2011). It was also discovered that substances containing
phenolic components served as the effective carbon allotrope stabilizers which interact
Univers
ity of
Mala
ya

79
via - aromatic stacking between benzene ring structures while abundance of oxygen
based functional groups provides the necessary hydrophilic feature to maintain the
solubility of carbon allotropes in aqueous solvent (Yan Wang et al., 2011).
Recently Mehrali et al. (Mehrali, Sadeghinezhad, Latibari, Kazi, et al., 2014) have
shown that nanofluids containing graphene nanoplatelets (GnP), having close
reminiscence to ideal graphene, demonstrates high thermal conductivity at very low
weight percentages, which correspond to the previous study on functionalized reduced
graphene oxide (RGO) (Baby & Ramaprabhu, 2011a). Further, the increase in rheological
penalty was reported to be minimal, which paves promising avenues for its application in
thermal transport system that strongly requires efficient heat transfer and energy
conversion. Motivated by the above findings, further study conducted by Sadeghinezhad
et al. on the effect of GnP based nanofluid on the convective heat transfer performance
shows an anomalous increase in heat transfer coefficient, far greater than the thermal
conductivity enhancement alone (Sadeghinezhad et al., 2014; Sadeghinezhad et al.,
2015). Similar works on graphene based colloidal systems earlier conducted by Baby et
al. (Baby & Ramaprabhu, 2011a; Baby & Sundara, 2011) have also shown similar trend
of heat transfer enhancement. Part of the successful incorporation of graphene in
convective heat transfer application is attributed to the series of innovative synthesis and
stabilization techniques employed for improving its solubility as well as restoring of the
conjugated aromatic structure of the planar region which holds the key for ballistic
phonon and electron transport (Gupta et al., 2011). Some of the recent experimental
studies on convective heat transfer coefficient in the presence of graphene-based
nanofluids are illustrated in Table 2.1. It can be seen that heat transfer rate increases
significantly in the presence of graphene as additive.
Table 2.1: Summary of experiments on convective heat transfer of graphene-based nanofluids.
Univers
ity of
Mala
ya
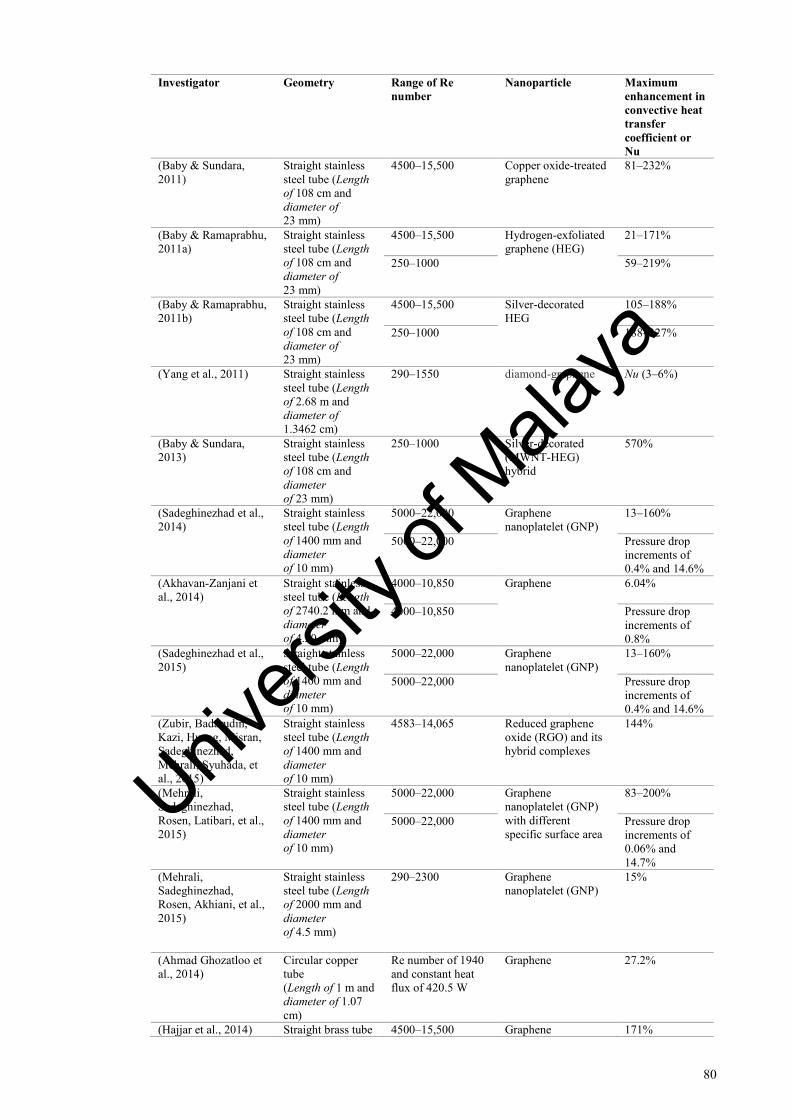
80
Investigator Geometry Range of Re number
Nanoparticle Maximum enhancement in convective heat transfer coefficient or Nu
(Baby & Sundara, 2011)
Straight stainless steel tube (Length of 108 cm and diameter of 23 mm)
4500–15,500 Copper oxide-treated graphene
81–232%
(Baby & Ramaprabhu, 2011a)
Straight stainless steel tube (Length of 108 cm and diameter of 23 mm)
4500–15,500
Hydrogen-exfoliated graphene (HEG)
21–171%
250–1000 59–219%
(Baby & Ramaprabhu, 2011b)
Straight stainless steel tube (Length of 108 cm and diameter of 23 mm)
4500–15,500 Silver-decorated HEG
105–188%
250–1000 188–327%
(Yang et al., 2011) Straight stainless steel tube (Length of 2.68 m and diameter of 1.3462 cm)
290–1550 diamond-graphene Nu (3–6%)
(Baby & Sundara, 2013)
Straight stainless steel tube (Length of 108 cm and diameter of 23 mm)
250–1000 Silver-decorated (MWNT-HEG) hybrid
570%
(Sadeghinezhad et al., 2014)
Straight stainless steel tube (Length of 1400 mm and diameter of 10 mm)
5000–22,000
Graphene nanoplatelet (GNP)
13–160%
5000–22,000
Pressure drop increments of 0.4% and 14.6%
(Akhavan-Zanjani et al., 2014)
Straight stainless steel tube (Length of 2740.2 mm and diameter of 4.20 mm)
4000–10,850 Graphene 6.04%
4000–10,850 Pressure drop increments of 0.8%
(Sadeghinezhad et al., 2015)
Straight stainless steel tube (Length of 1400 mm and diameter of 10 mm)
5000–22,000
Graphene nanoplatelet (GNP)
13–160%
5000–22,000 Pressure drop increments of 0.4% and 14.6%
(Zubir, Badarudin, Kazi, Huang, Misran, Sadeghinezhad, Mehrali, Syuhada, et al., 2015)
Straight stainless steel tube (Length of 1400 mm and diameter of 10 mm)
4583–14,065 Reduced graphene oxide (RGO) and its hybrid complexes
144%
(Mehrali, Sadeghinezhad, Rosen, Latibari, et al., 2015)
Straight stainless steel tube (Length of 1400 mm and diameter of 10 mm)
5000–22,000
Graphene nanoplatelet (GNP) with different specific surface area
83–200%
5000–22,000
Pressure drop increments of 0.06% and 14.7%
(Mehrali, Sadeghinezhad, Rosen, Akhiani, et al., 2015)
Straight stainless steel tube (Length of 2000 mm and diameter of 4.5 mm)
290–2300 Graphene nanoplatelet (GNP)
15%
(Ahmad Ghozatloo et al., 2014)
Circular copper tube (Length of 1 m and diameter of 1.07 cm)
Re number of 1940 and constant heat flux of 420.5 W
Graphene 27.2%
(Hajjar et al., 2014) Straight brass tube 4500–15,500 Graphene 171%
Univers
ity of
Mala
ya

81
(A Ghozatloo et al., 2014)
Straight copper pipe
2840 graphene 42.4% in Ethylene glycol-based nanofluids
Thermal conductivity of graphene-based nanofluids is one of the most important
heat transfer parameters. Table 2.2 summarizes some of the measured thermal
conductivities by different researchers of graphene-based nanofluids.
Investigator Particle type Base fluid Particle concentration
Maximum enhancement
Temperature
(Wei Yu et al., 2010)
Graphene oxide nanosheets
Ethylene glycol 1–5 vol% 10.5–61% 10–60 °C
(Baby & Ramaprabhu, 2010)
Exfoliated graphene
Water 0.005–0.056 vol%
14–64%
25–50 °C
Ethylene glycol
4–7%
(Martin-Gallego et al., 2011)
Functionalized graphene sheets [FGS]
Water 0.2–1 wt% 10–70% 30–60 °C
(Baby & Sundara, 2011)
Copper oxide-decorated graphene (CuO/HEG)
Water 0.005–0.05 wt%
23–90% 25–50 °C
Ethylene glycol 0.01–0.07 wt% 17–23%
(Baby & Ramaprabhu, 2011a)
Hydrogen-exfoliated graphene
Water 0.005–0.05 wt%
10–75% 25–50 °C
Ethylene glycol 0.05–0.08 wt% 1–5% (Wei Yu et al., 2011)
Graphene oxide nanosheets
Ethylene glycol 2–5 wt% Up to 86% 10–60 °C
(Baby & Ramaprabhu, 2011b)
Silver-decorated graphene
Water 0.005–0.05 wt%
7–86% 25–70 °C
Ethylene glycol 0.01–0.07 wt% 3–14% (Aravind & Ramaprabhu, 2011)
Graphene nanosheets
Water 0.008–0.138 vol%
2.4–17%
25 °C
Ethylene glycol 2.4–6.5%
(Zhenyu Sun et al., 2013)
Few-layer graphene
Polymer 0.55–1 vol% 18–25% 10–60 °C
(Dhar et al., 2013) Poly-dispersed graphene
Water 0.05–0.2 vol% 3–30% 25–50 °C
(Ghozatloo et al., 2013)
Functionalized Graphene
Water 0.01–0.05 wt% 3.8–17% 10–50 °C
(Kole & Dey, 2013)
Functionalized graphene nano-sheets (GnS)
Water + Ethylene glycol
0.041–0.395 vol%
Up to 15% 10–70 °C
(Gupta et al., 2011)
graphene nano-sheets
Water 0.05–0.2 vol% Up to 27% 30–50 °C
(Yang et al., 2011) Diamond-treated graphene
Silicon oil 0.35–5.2 vol% Up to 10% Room Temprature
(Baby & Sundara, 2013)
MWCNT-graphene hybrid
Water 0.005–0.04 vol%
1–20% 25–50 °C
(X. Li et al., 2014) SiO2-coated graphene
Water 0.1 wt% Up to 20% 15–65 °C
(Hajjar et al., 2014)
Graphite oxide (GO)
Water 0.05–0.25 wt% 14.75–47.57% 10–40 °C
(Mehrali, Sadeghinezhad, Latibari, Mehrali, et al., 2014)
Nitrogen-doped graphene (NDG)
Water 0.01–0.06 wt% 22.15–36.78% 15–40 °C
Table 2.2: Summary of experimental results on thermal conductivity of graphene-based nanofluids.
Univers
ity of
Mala
ya
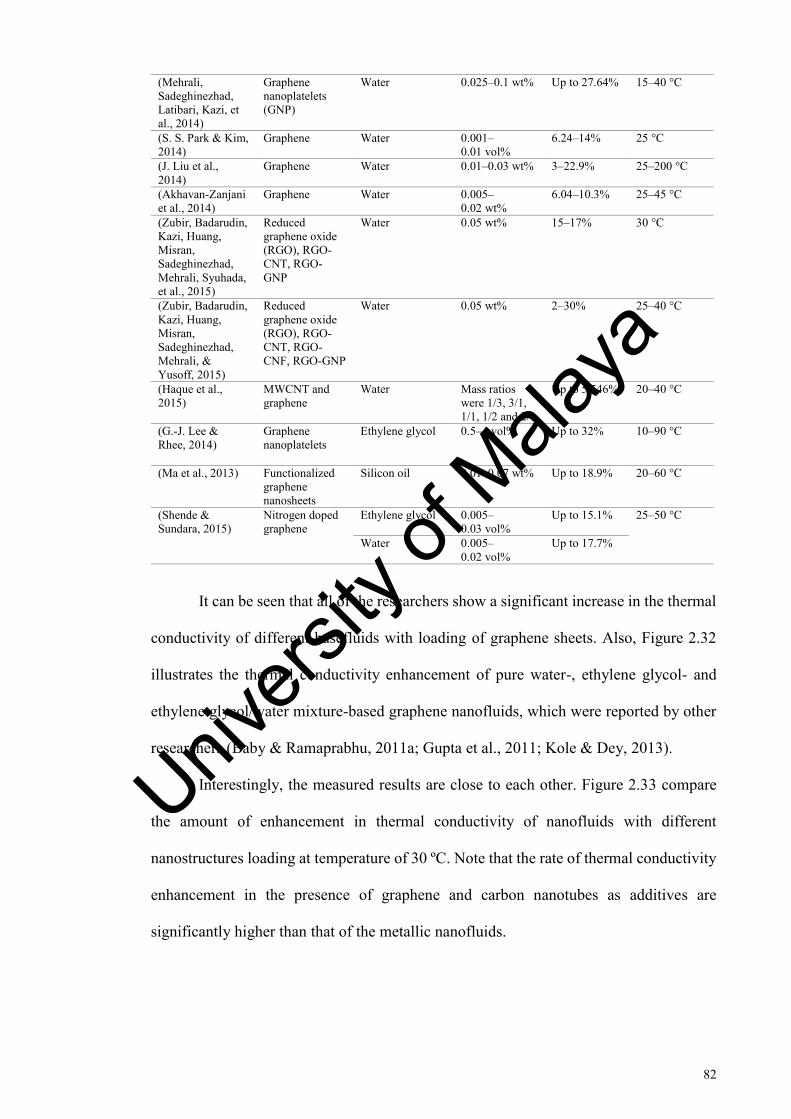
82
(Mehrali, Sadeghinezhad, Latibari, Kazi, et al., 2014)
Graphene nanoplatelets (GNP)
Water 0.025–0.1 wt% Up to 27.64% 15–40 °C
(S. S. Park & Kim, 2014)
Graphene Water 0.001–0.01 vol%
6.24–14% 25 °C
(J. Liu et al., 2014)
Graphene Water 0.01–0.03 wt% 3–22.9% 25–200 °C
(Akhavan-Zanjani et al., 2014)
Graphene Water 0.005–0.02 wt%
6.04–10.3% 25–45 °C
(Zubir, Badarudin, Kazi, Huang, Misran, Sadeghinezhad, Mehrali, Syuhada, et al., 2015)
Reduced graphene oxide (RGO), RGO-CNT, RGO-GNP
Water 0.05 wt% 15–17% 30 °C
(Zubir, Badarudin, Kazi, Huang, Misran, Sadeghinezhad, Mehrali, & Yusoff, 2015)
Reduced graphene oxide (RGO), RGO-CNT, RGO-CNF, RGO-GNP
Water 0.05 wt% 2–30% 25–40 °C
(Haque et al., 2015)
MWCNT and graphene
Water Mass ratios were 1/3, 3/1, 1/1, 1/2 and 2/1
Up to 5.546% 20–40 °C
(G.-J. Lee & Rhee, 2014)
Graphene nanoplatelets
Ethylene glycol 0.5–4 vol% Up to 32% 10–90 °C
(Ma et al., 2013) Functionalized graphene nanosheets
Silicon oil 0.01–0.07 wt% Up to 18.9% 20–60 °C
(Shende & Sundara, 2015)
Nitrogen doped graphene
Ethylene glycol 0.005–0.03 vol%
Up to 15.1% 25–50 °C
Water 0.005–0.02 vol%
Up to 17.7%
It can be seen that all of the researchers show a significant increase in the thermal
conductivity of different basefluids with loading of graphene sheets. Also, Figure 2.32
illustrates the thermal conductivity enhancement of pure water-, ethylene glycol- and
ethylene glycol/water mixture-based graphene nanofluids, which were reported by other
researchers (Baby & Ramaprabhu, 2011a; Gupta et al., 2011; Kole & Dey, 2013).
Interestingly, the measured results are close to each other. Figure 2.33 compare
the amount of enhancement in thermal conductivity of nanofluids with different
nanostructures loading at temperature of 30 ºC. Note that the rate of thermal conductivity
enhancement in the presence of graphene and carbon nanotubes as additives are
significantly higher than that of the metallic nanofluids.
Univers
ity of
Mala
ya

83
Figure 2.34 presents the thermal conductivity of the water-based graphene
nanofluids, water-based graphene/SiO21
as covalent nanofluids and water-based
graphene/SiO2-SDBS as non-covalent nanofluids. It can be seen that the covalent
nanofluids showed higher thermal conductivity than that of non-covalent
functionalization. Li and coworker investigated the effect of SiO2/graphene nanofluid and
reported that the low thermal conductivity of the water-based graphene nanofluid is
highly depended to the stability of dispersion (X. Li et al., 2014).
1 Silicon Dioxide-decorated graphene
Figure 2.32: Thermal conductivity ratio of graphene-based nanofluids in the presence of different basefluids (Distillated water (DW) and ethylene glycol (EG)) (Kole & Dey,
2013). Univers
ity of
Mala
ya

84
Figure 2.33: Thermal conductivity of water-based nanofluids in the presence of different additives e.g. metals, metal oxide, carbon nanotubes (CNT) and graphene
(Gupta et al., 2011).
Figure 2.34: Thermal conductivity of graphene, graphene/SiO2, and graphene/SiO2-SDBS (X, Li. et al.)
Univers
ity of
Mala
ya

85
2.14 The challenge of graphene stabilization in solvents
As mentioned in previous sections, using different base fluids including water and
ethylene glycol, many studies were performed on dispersing various types of carbon
based-nanostructures such as single-walled carbon nanotubes (Nanda et al., 2008; Z. Sun
et al., 2008), multi-walled carbon nanotubes (Shanbedi, Heris, Amiri, Adyani, et al.,
2014), graphene (W. Sarsam et al., 2016; W. Sarsam et al., 2016a) and nitrogen doped
graphene (Amiri et al., 2016) for synthesizing highly-conductive nanofluids. The unique
properties of few-layer graphene have attracted the attention of a large number of
scientists in different fields (M. Shanbedi, et al., 2015). In particular, large specific surface
area and outstanding thermal conductivity at room temperature make the few-layer
graphene an ideal material for heat transfer applications. Developing an efficient and
quick method for mass-production of few layer graphene, however, is critical for its large-
scale industrial applications such for developing high performance nanofluids. It is also
well known that the thermal conductivity and subsequently the heat transfer rate improve
as the specific surface area of graphene increases (W. Sarsam et al., 2016a). Therefore, in
order to manufacture highly-conductive nanofluids for improving heat transfer rate in
different thermal equipment, materials with high specific surface areas, such as crumpled
graphene, and in particular, few-layered graphene are used. Crumpling the 2D graphene
with chemical treatment can be an approach to achieve materials with high specific
surface area and pore structures. Thus, highly-crumpled few layer graphene or highly-
porous graphene with large specific surface area seem to have the ideal properties.
There are, however, a number of challenges. To fully exploiting the properties of
graphene with large specific surface area as an additive in base fluids requires a method
for the mass production of these remarkable materials. The second problem is the lack of
stability of carbon-based nanostructures in aqueous media. To solve the first problem,
numerous studies have been performed. As a large-scale exfoliation technique, the
Univers
ity of
Mala
ya
86
production of chemically converted graphene from the reduction of graphene oxide is a
convenient method to obtain large amounts of graphene (Stankovich et al., 2007);
however, even with efficient reducing agents such as hydrazine or H2, and annealing at
high temperature, the original crystalline structure of graphene is not restored, reducing
all the unique properties. Also, graphene oxide is heavily functionalized with many
permanent chemical defects, such as holes, introduced into the basal plane. These holes
are not readily healed even upon annealing (Ruoff, 2008; Stankovich et al., 2007;
Zhengzong Sun et al., 2010; H. Wang et al., 2009). As a new method to overcome the
above-mentioned defects, the liquid phase exfoliation of graphite in the presence of high
surface-tension organic solvents, along with continuous sonication (Hamilton et al., 2009;
Hernandez et al., 2008), opened a new gateway to achieve few-layered graphene.
There are, however, other issues. The π–π interactions leads to high level of
aggregation and the liquid-phase exfoliated graphene cannot reach stable dispersion in
base fluids (Zhengzong Sun et al., 2010). However, due to lack of graphene-solubility,
the exfoliation performances of most of the solvents used in previous studies (Niu et al.,
2016) were quite low. To increase the efficiency of exfoliation with this method and
solving the problem of low stability, in situ chemical functionalization and exfoliation of
graphite with different functional groups, such as 4-bromophenyl, were used, providing
a new approach for improving its solubility in polar, aprotic, organic solvents (Lomeda
et al., 2008). For example, Sun et al. concluded that graphite can be changed to graphene
by covalent functionalization of the graphite and the synthesis of a stable suspension in
the presence of DMF without any added surfactant or stabilizer (Zhengzong Sun et al.,
2010). Also, they achieved both exfoliation and functionalization with a fast procedure
and obtained suitable edge-functionalization and intact pristine graphene structure in the
interior basal planes. Thus, finding a method for mass-production of highly-crumpled few
Univers
ity of
Mala
ya

87
layer graphene or highly-porous graphene with hydrophilic functional groups to prepare
highly-stable nanofluids is the major goal of this study.
Availability of highly-stable superconductive nanofluid opens a new gateway for
economical increase in the performance of thermal loops in industrial applications (W.
An et al., 2016; Bellos et al., 2016; Delfani et al., 2016; Kaloudis et al., 2016; Tong et al.,
2015). Ducts and channels with abrupt expansion, two-phase closed thermosyphon,
closed ducts and heat exchangers are broadly applied in different industrial applications
and heat transfer equipment.
To reach high performance equipment, owning working fluid with superior
thermal capability is essential. Herein, after synthesizing superior graphene based
working fluids, heat transfer rate of new coolants is investigated in different equipment.
The research investigation reported different experimental results in Tables 2.1
and 2.2 show the superior increase of thermal parameters in the presence of graphene.
However, more experimental research works are required to:
Find a method for mass production of functionalized few-layered
graphene with high specific surface area.
Find a suitable covalent functional groups to reach completely stable
dispersion including graphene.
Find the effects of covalently and non-covalently functionalization on heat
transfer parameters.
To fully exploiting the thermo-physical and rheological properties of
graphene-based nanofluids
To investigate the effect of specific surface area of graphene nanosheets
as additives.
To investigate convective heat transfer coefficient of different thermal
equipment such as ducts and channels with abrupt expansion (backward
Univers
ity of
Mala
ya

88
facing step), two-phase closed thermosyphon, closed conduct, and car
radiator.
Univers
ity of
Mala
ya

89
CHAPTER 3: METHODOLOGY
3.1 Characterization Methods and Instruments
As discussed above, in order to confirm the exfoliation and functionalization,
carbon-based nanostructures should be analyzed with different morphological, structural
and elemental analysis. Also, in order to check the stability and thermo-physical
properties, some common methods are used which are discussed in this chapter. In
addition, to investigate heat transfer rate of synthesized nanofluids, some test-rigs should
be employed. In this chapter, all of the used equipment are introduced.
3.1.1 Preparation of samples for characterization instruments
3.1.1.1 Field Emission Scanning Electron Microscopy
Field emission scanning electron microscopy (FESEM) is utilized for inspecting
topographies of specimens at very high magnifications using a piece of equipment called
the scanning electron microscope. Herein, scanning electron microscopy (Cold-Emission
FESEM SU8000, Series UHR) was employed to study surface morphology of carbon-
based nanostructures.
3.1.1.2 Transmission Electron Microscopy
Transmission electron microscopy (TEM) is the primary technique to verify single
particle dimensions, the main structures of flakes and to identify the thickness of sheets.
The electron beam can be used to see features on the nanometer level. A major drawback
to the use of TEM is that samples must be dried out of solution in order to be attached to
the carbon matrix (lacey carbon grid) and placed in the vacuum chamber of the TEM;
therefore, the particles are not exactly in the colloid state and agglomeration might occur
during drying. However, TEM can be used in combination with dynamic light scattering
to acquire exact sizing in nanofluid form. Another drawback of TEM is the cost and time
investment needed to prepare and view the samples. It was decided that only some initial
imaging will be done as a feasibility study. In this study, 120kV High-Contrast/High-
Univers
ity of
Mala
ya
90
Resolution Digital TEM HT7700 was employed to study surface morphology of graphene
sheets, and thickness. As a TEM sample, each sample powder was dispersed in a suitable
solvent, followed by dropping on a lacey carbon grid and subsequently dried under
vacuum. An ultrasonic processor (Misonix Inc., Farmingdale, New York, NY, USA) with
output of 600 W was used for performing sonication. All samples sonicated with 85% of
total power of ultrasonic processor.
3.1.1.3 Atomic Force Microscopy
AFM observation was conducted for the slightly sonicated samples on the freshly
cleaved mica surfaces (Multi Modes 8, Bruker, frequency of 1 Hz) in tapping and
ScanAsyst mode was used to depict the dimensions.
3.1.2 Functionality and Elemental Analysis
3.1.2.1 Fourier Transform Infrared Spectroscopy (FTIR)
The infrared spectra of samples were studied by Fourier transform infrared
spectroscopy (Bruker IFS 66/S) in the region of 400–4000 cm−1 at room temperature
(around 25 ºC), and all samples were placed on KBr pellets.
3.1.2.2 X-ray Photoelectron Spectroscopy
X-ray photoelectron spectroscopy (XPS) is a surface-sensitive quantitative
spectroscopic technique that measures the elemental composition at the parts per
thousand range, empirical formula, chemical state and electronic state of the elements that
exist within a material. XPS spectra are obtained by irradiating a material with a beam of
X-rays while simultaneously measuring the kinetic energy and number of electrons that
escape from the top 0 to 10 nm of the material being analyzed. X-ray photoelectron
spectroscopy (model: Kratos Analytical XSAM HS spectrometer) with an Al-Kα X-ray
source was used to identify the bonded elements in the carbon nanostructures over
exfoliation and functionalization.
Univers
ity of
Mala
ya

91
3.1.2.3 Energy Dispersive X-Ray Spectroscopy
Energy dispersive X-Ray spectroscopy (EDS or EDX) is a chemical microanalysis
technique used in conjunction with scanning electron microscopy (SEM). Desktop
scanning electron microscope (Phenom ProX, Netherlands) was used to do EDS analysis
of graphene sheets. Also, combustible elemental analysis (CHNS/O) was performed using
a Perkin Elmer 2400 series II and was used to measure carbon, oxygen, nitrogen and
hydrogen elemental content. The instrument was used in CHN operating mode to convert
the sample elements to simple gases (CO2, H2O and N2). The PE 2400 analyzer
automatically performed combustion, reduction, homogenization of product gases,
separation and detection.
3.1.2.4 Raman Spectroscopy
Raman spectroscopy is a spectroscopic technique used to observe vibrational,
rotational, and other low-frequency modes in a system. To investigate functionalization
and explore alterations in the layers, Raman spectra were obtained via a Renishaw
confocal spectrometer at 514 nm at room temperature (around 25 ºC).
3.1.2.5 Thermogravimetric Analysis
Thermogravimetric Analysis (TGA) is a type of elemental study that is performed
on samples to determine changes in weight in relation to change in temperature.
Simultaneous TGA-DTA/DSC measures both heat flow and weight changes (TGA) in a
material as a function of temperature or time in a controlled atmosphere. Simultaneous
measurement of these two material properties not only improves productivity but also
simplifies interpretation of the results. The complementary information obtained allows
differentiation between endothermic and exothermic events which have no associated
weight loss (e.g., melting and crystallization) and those which involve a weight loss (e.g.,
degradation).
Univers
ity of
Mala
ya

92
In this study, the thermogravimetric analysis was measured by a Perkin Elmer
TGA-7 in the atmosphere of air. The weight loss of graphene samples was analyzed in
TGA as a function of temperature at the heating rate of 10 °C/min up to a temperature of
900 °C under 50 cm3/min flow rate of air and nitrogen.
3.1.2.6 Selected Area (Electron) Diffraction
Selected area electron diffraction (SAED) is a crystallographic experimental
technique that can be performed inside a transmission electron microscope (TEM). In a
TEM, a thin crystalline specimen is subjected to a parallel beam of high-energy electrons.
As TEM specimens are typically ~100 nm thick, and the electrons typically have an
energy of 100–400 kiloelectron volts, the electrons pass through the sample easily. In this
case, electrons are treated as wave-like, rather than particle-like. Because the wavelength
of high-energy electrons is a few thousandths of a nanometer, and the spacing between
atoms in a solid is about a hundred times larger, the atoms act as a diffraction grating to
the electrons, which are diffracted. Some fraction of them will be scattered to particular
angles, determined by the crystal structure of the sample, while the others continue to
pass through the sample without deflection.
Therefore, SAED can be used as a definitive identification of graphene sheets. For
identification of monolayers by electron diffraction, the ratio of the intensity of the
{1100} to the {2110} peaks gives an unambiguous local identification of monolayer,
bilayer, and multilayer to provide information on the yield of graphene sheets with
different layers.
3.1.3 Specific Surface Area
The specific surface area of carbon-based nanostructures is determined by
physical adsorption of a gas on the surface of the solid and by calculating the amount of
adsorbate gas corresponding to a monomolecular layer on the surface. Physical adsorption
results from relatively weak forces (van der Waals forces) between the adsorbate gas
Univers
ity of
Mala
ya
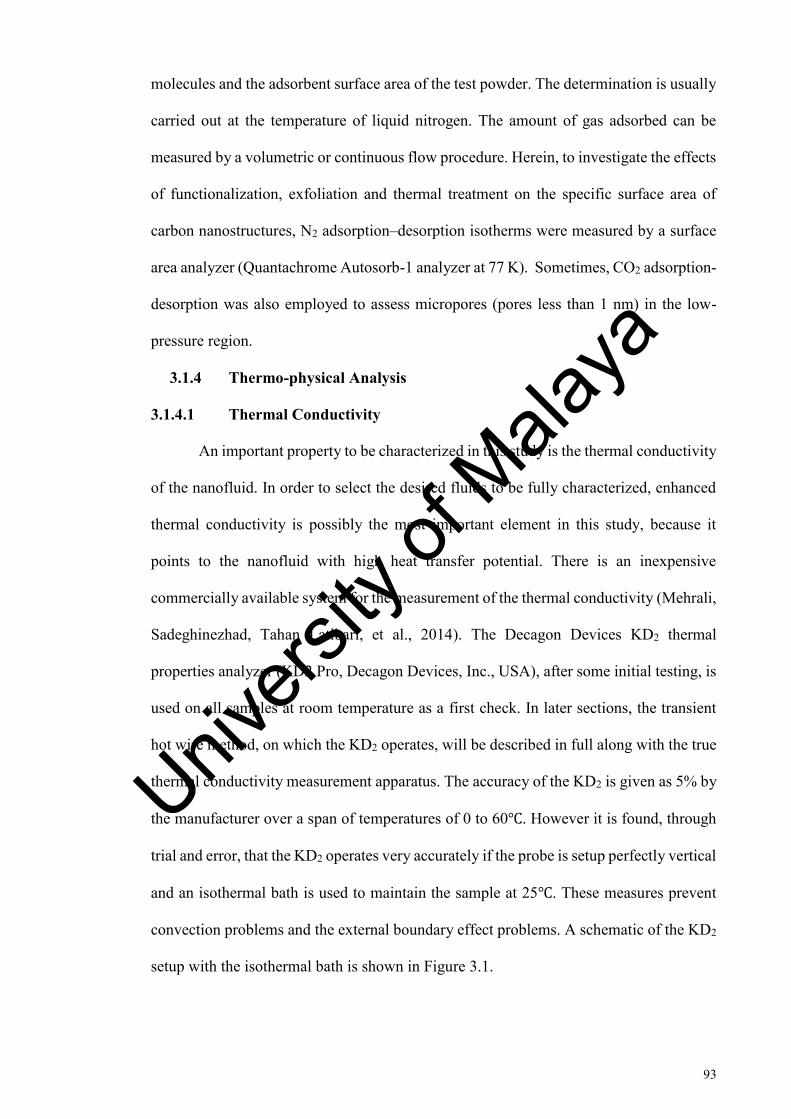
93
molecules and the adsorbent surface area of the test powder. The determination is usually
carried out at the temperature of liquid nitrogen. The amount of gas adsorbed can be
measured by a volumetric or continuous flow procedure. Herein, to investigate the effects
of functionalization, exfoliation and thermal treatment on the specific surface area of
carbon nanostructures, N2 adsorption–desorption isotherms were measured by a surface
area analyzer (Quantachrome Autosorb-1 analyzer at 77 K). Sometimes, CO2 adsorption-
desorption was also employed to assess micropores (pores less than 1 nm) in the low-
pressure region.
3.1.4 Thermo-physical Analysis
3.1.4.1 Thermal Conductivity
An important property to be characterized in this study is the thermal conductivity
of the nanofluid. In order to select the desired fluids to be fully characterized, enhanced
thermal conductivity is possibly the most important element in this study, because it
points to the nanofluid with high heat transfer potential. There is an inexpensive
commercially available system for the measurement of the thermal conductivity (Mehrali,
Sadeghinezhad, Tahan Latibari, et al., 2014). The Decagon Devices KD2 thermal
properties analyzer (KD2 Pro, Decagon Devices, Inc., USA), after some initial testing, is
used on all samples at room temperature as a first check. In later sections, the transient
hot wire method, on which the KD2 operates, will be described in full along with the true
thermal conductivity measurement apparatus. The accuracy of the KD2 is given as 5% by
the manufacturer over a span of temperatures of 0 to 60℃. However it is found, through
trial and error, that the KD2 operates very accurately if the probe is setup perfectly vertical
and an isothermal bath is used to maintain the sample at 25℃. These measures prevent
convection problems and the external boundary effect problems. A schematic of the KD2
setup with the isothermal bath is shown in Figure 3.1.
Univers
ity of
Mala
ya
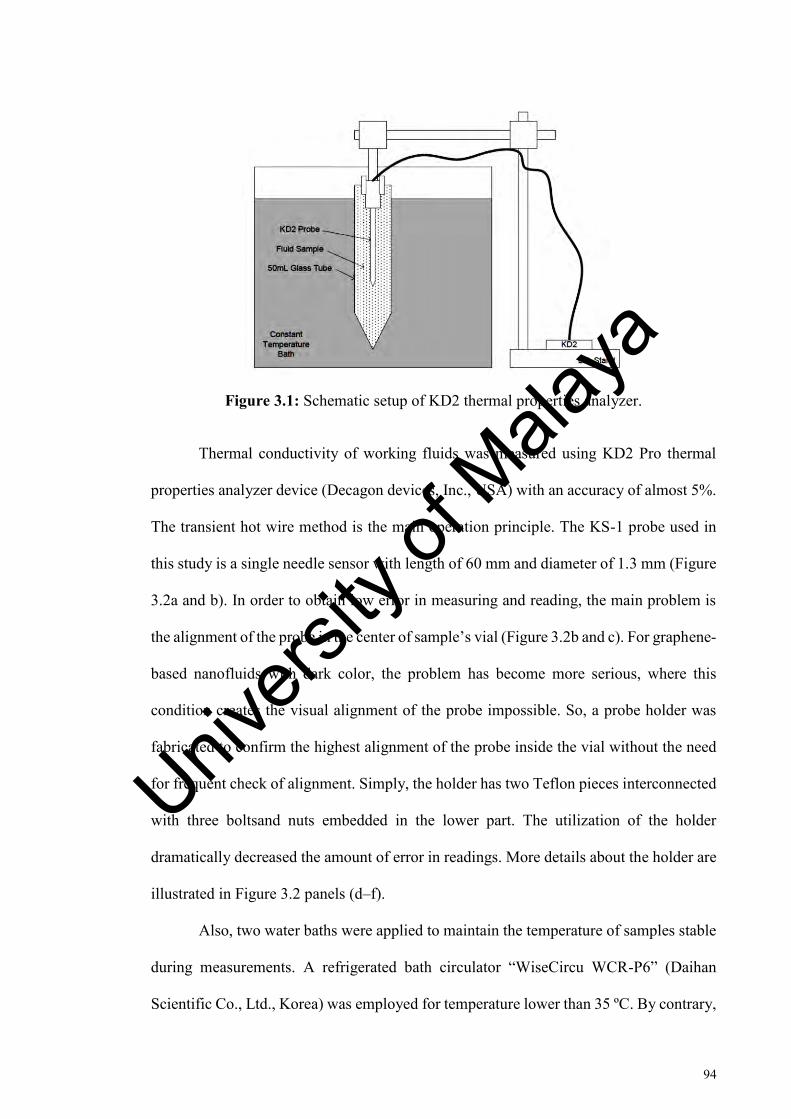
94
Thermal conductivity of working fluids was measured using KD2 Pro thermal
properties analyzer device (Decagon devices, Inc., USA) with an accuracy of almost 5%.
The transient hot wire method is the main operation principle. The KS-1 probe used in
this study is a single needle sensor with length of 60 mm and diameter of 1.3 mm (Figure
3.2a and b). In order to obtain low error in measuring and reading, the main problem is
the alignment of the probe in the center of sample’s vial (Figure 3.2b and c). For graphene-
based nanofluids with dark color, the problem has become more serious, where this
condition creates the visual alignment of the probe impossible. So, a probe holder was
fabricated to confirm the highest alignment of the probe inside the vial without the need
for frequent check of alignment. Simply, the holder has two Teflon pieces interconnected
with three boltsand nuts embedded in the lower part. The utilization of the holder
dramatically decreased the amount of error in readings. More details about the holder are
illustrated in Figure 3.2 panels (d–f).
Also, two water baths were applied to maintain the temperature of samples stable
during measurements. A refrigerated bath circulator “WiseCircu WCR-P6” (Daihan
Scientific Co., Ltd., Korea) was employed for temperature lower than 35 ºC. By contrary,
Figure 3.1: Schematic setup of KD2 thermal properties analyzer.
Univers
ity of
Mala
ya
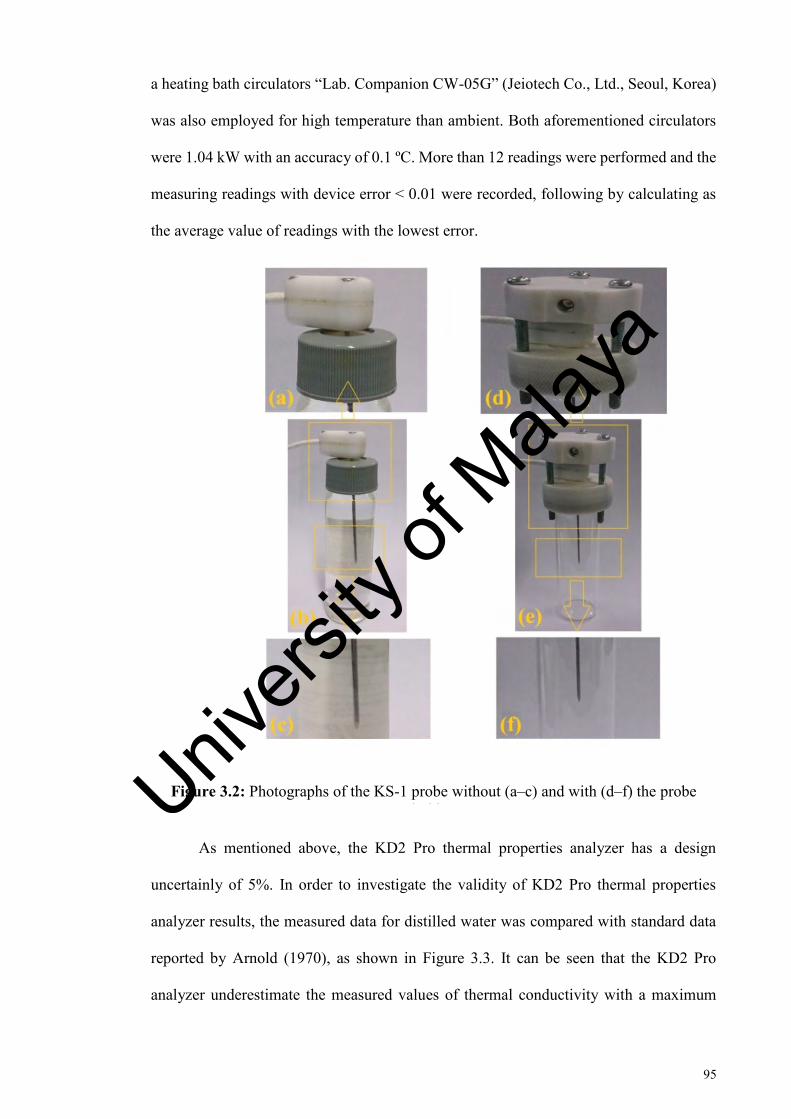
95
a heating bath circulators “Lab. Companion CW-05G” (Jeiotech Co., Ltd., Seoul, Korea)
was also employed for high temperature than ambient. Both aforementioned circulators
were 1.04 kW with an accuracy of 0.1 ºC. More than 12 readings were performed and the
measuring readings with device error < 0.01 were recorded, following by calculating as
the average value of readings with the lowest error.
As mentioned above, the KD2 Pro thermal properties analyzer has a design
uncertainly of 5%. In order to investigate the validity of KD2 Pro thermal properties
analyzer results, the measured data for distilled water was compared with standard data
reported by Arnold (1970), as shown in Figure 3.3. It can be seen that the KD2 Pro
analyzer underestimate the measured values of thermal conductivity with a maximum
Figure 3.2: Photographs of the KS-1 probe without (a–c) and with (d–f) the probe holder. Univ
ersity
of M
alaya

96
error of 4.08%. So, it confirmed that the device is satisfactorily working within its
designed accuracy and can be reliable.
3.1.4.2 Differential Scanning Calorimetry
Differential scanning calorimetry (DSC) is a powerful tool to measure the heat
capacity of nanofluids. The difference in the amount of heat flow required for heating up
a sample pan and reference pan are measured as a function of temperature. During the
whole process, the sample and reference pans are maintained at nearly the same
temperature throughout the experiment. The heat capacity of the reference pan is already
known. By measuring the difference in heat flow, the heat capacity of the sample is
obtained. If there are phase transitions happened in the sample pan, more or less heat will
need to flow to it than the reference to maintain both at the same temperature, so
endothermal or exothermal peaks are shown on the DSC curves, corresponding to melting
or freezing, respectively. The phase transition temperatures and latent heats are
determined according to the DSC curves. The heat capacity of all working fluids was
obtained on a differential scanning calorimeter (two models: Perkin Elmer Diamond DSC
Figure 3.3: Comparison between distilled water and previous data
Univers
ity of
Mala
ya

97
and METTLER TOLEDO 820C-Error ±0.25–1℃) at a heating rate of 5℃/min in purified
nitrogen atmosphere.
3.1.4.3 Rheometer
The viscosity of nanofluids is an important parameter for characterizing the
suitability of the nanofluids for heat transfer applications. To investigate the effect of
carbon nanostructure loading in base fluids on viscosity behavior, the viscosity of
graphene-based nanofluids should be measured at different rotor RPMs, showing
Newtonian or non-Newtonian behaviors. Herein, the rheological behavior of nanofluids
was measured on Anton Paar rheometer (Physica MCR 301). The accuracy and reliability
of the Anton Paar rheometer were validated by comparing its data at 200 1/s shear rate
with the standard values presented by Arnold (1970), as shown in Figure 3.4, and a
maximum error of 1.04% was found.
3.1.4.4 Densitometer
Density is another thermo-physical property of fluids affecting convective heat
transfer. Force Tensiometer K100 (KRÜSS Ltd., Germany) and DM40 (Mettler Toledo,
Figure 3.4: Comparison between the measured viscosity with the standard values reported by Arnold (1970) for distilled water at 200 1/s shear rate.
Univers
ity of
Mala
ya

98
Malaysia) were used to measure surface tension and the density of nanofluids. Accuracy
of equipment is 0.0001 g cm-3 and it has temperature controller.
3.1.5 Stability Analysis
3.1.5.1 UV–Vis Spectroscopy
The UV–Vis spectroscopy is a common method, which is utilized for the
investigation of the stability of nanofluids including solid particles. According to the
Beer–Lambert’s law, there is a direct connection between the absorbance of a solution
and the concentration of the absorbing species such as particles in the solution. Consist
with this law, the absorption spectrum of our prepared nanofluids exhibits a maximum
peak at around 265 nm corresponding to π–π transition of conjugation system in the
polyaromatic structures. The band gap energy, Eg, can be measured from UV–Vis
absorption by Tauc’s equation (Hadadian et al., 2014) given as,
(α ℎ𝜗)𝑛 = 𝐵(ℎ𝜗 − 𝐸𝑔) (3-1)
where α, ℎ𝜗, n, Eg and B are, respectively, absorption coefficient, photon energy,
the nature of optical transition, band gap energy and a material constant. Plotting (αhν)n
against the photon energy and extrapolating the linear region of the curve to the x-axis
give the optical band gap. Regarding the dispersion state and the long-term stability, the
colloidal stability of the carbon-nanostructures in base fluid is investigated quantitatively
by UV–Vis spectroscopy.
The light transmission of all samples were measured with a Shimadzu UV
spectrometer (UV-1800) operating between 190 and 1100 nm. The nanofluid solution
was diluted with distilled water to allow sufficient transmission while each measurement
was repeated three times to achieve a better accuracy.
Univers
ity of
Mala
ya
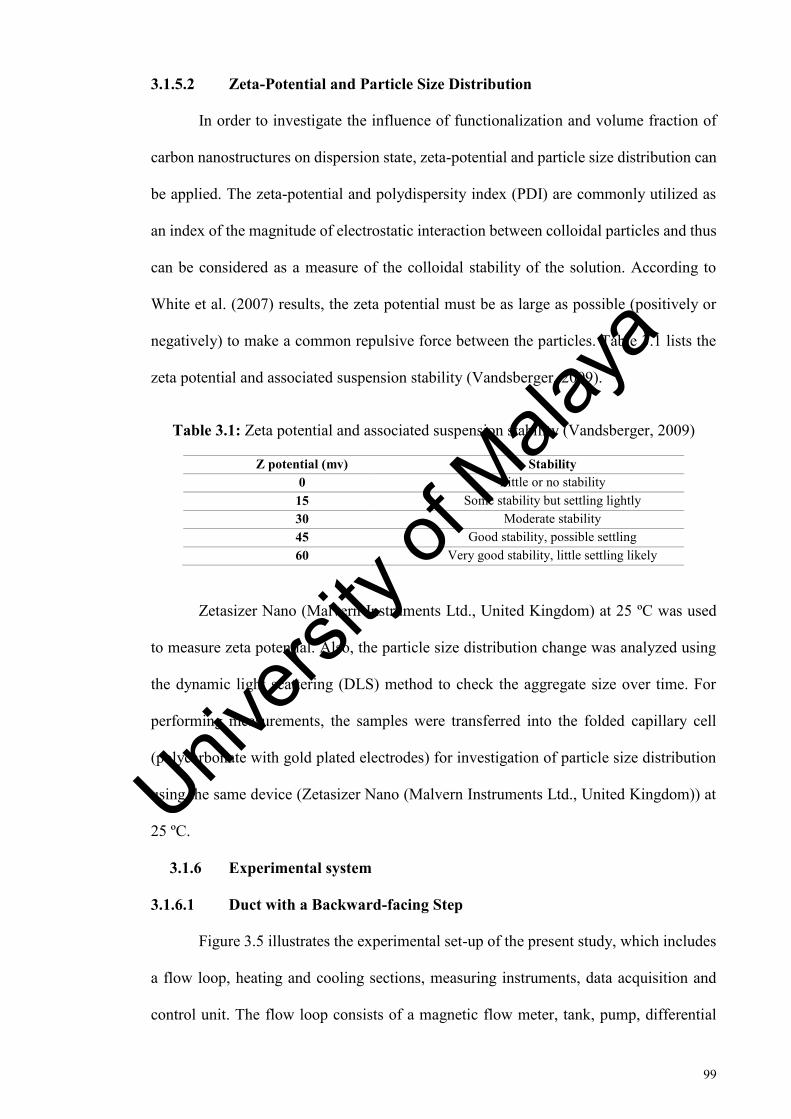
99
3.1.5.2 Zeta-Potential and Particle Size Distribution
In order to investigate the influence of functionalization and volume fraction of
carbon nanostructures on dispersion state, zeta-potential and particle size distribution can
be applied. The zeta-potential and polydispersity index (PDI) are commonly utilized as
an index of the magnitude of electrostatic interaction between colloidal particles and thus
can be considered as a measure of the colloidal stability of the solution. According to
White et al. (2007) results, the zeta potential must be as large as possible (positively or
negatively) to make a common repulsive force between the particles. Table 3.1 lists the
zeta potential and associated suspension stability (Vandsberger, 2009).
Z potential (mv) Stability 0 Little or no stability
15 Some stability but settling lightly 30 Moderate stability 45 Good stability, possible settling 60 Very good stability, little settling likely
Zetasizer Nano (Malvern Instruments Ltd., United Kingdom) at 25 ºC was used
to measure zeta potential. Also, the particle size distribution change was analyzed using
the dynamic light scattering (DLS) method to check the aggregate size over time. For
performing measurements, the samples were transferred into the folded capillary cell
(polycarbonate with gold plated electrodes) for investigation of particle size distribution
using the same device (Zetasizer Nano (Malvern Instruments Ltd., United Kingdom)) at
25 ºC.
3.1.6 Experimental system
3.1.6.1 Duct with a Backward-facing Step
Figure 3.5 illustrates the experimental set-up of the present study, which includes
a flow loop, heating and cooling sections, measuring instruments, data acquisition and
control unit. The flow loop consists of a magnetic flow meter, tank, pump, differential
Table 3.1: Zeta potential and associated suspension stability (Vandsberger, 2009)
Univers
ity of
Mala
ya
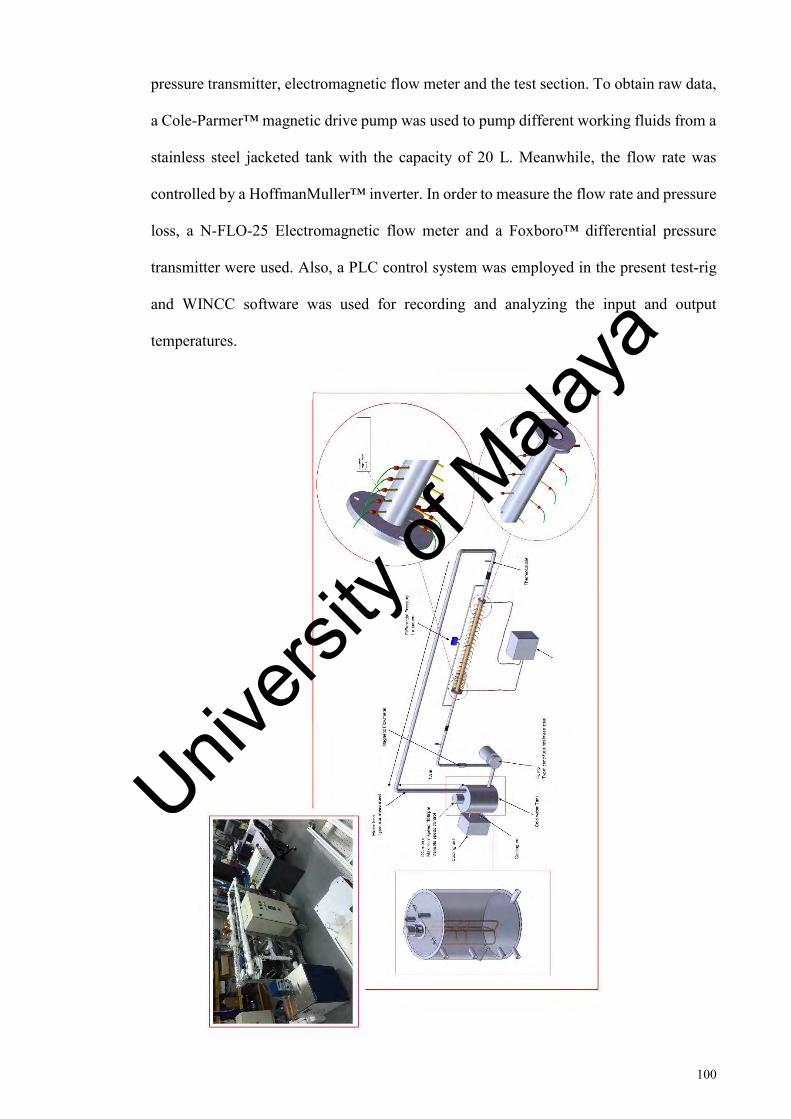
100
pressure transmitter, electromagnetic flow meter and the test section. To obtain raw data,
a Cole-Parmer™ magnetic drive pump was used to pump different working fluids from a
stainless steel jacketed tank with the capacity of 20 L. Meanwhile, the flow rate was
controlled by a HoffmanMuller™ inverter. In order to measure the flow rate and pressure
loss, a N-FLO-25 Electromagnetic flow meter and a Foxboro™ differential pressure
transmitter were used. Also, a PLC control system was employed in the present test-rig
and WINCC software was used for recording and analyzing the input and output
temperatures.
Univers
ity of
Mala
ya

101
The geometrical dimensions of the tube were 12.7 mm inlet diameter, 800 mm
upstream length, 25.4 mm outlet diameter and 800 mm downstream length for an
expansion ratio of 2. At the test section, the downstream part was a heated straight
stainless steel tube, with all the outer walls were insulated. The test section was also
heated by using two programmable DC power supplies (N8731A Power Supply, Agilent
Technology) with outputs of 8V and 400A current with the maximum power of 3200 W.
Sixteen K type thermocouples (Omega) were installed on the test section by using high
temperature epoxy glue on the outer surface of the test section. The positioning of the
thermocouples on the outer surface of the cylindrical tube is schematically shown in
Figure 3.6. Thermocouples were installed at outer surface of the cylindrical tube in
order to avoid boundary layer interruption originating from the thermocouple
probe protruding into the conduit inner surface. The boundary conditions of the
experiments were maintained as follows: After expansion, there was a constant heat flux
of 600 W provided by DC power supplies. Also, the inlet fluid rate was in the range of 1
to 16 Lit/min.
Figure 3.5: (Up) Photograph, schematic and (down) 2D diagram of the duct with a backward-facing step.
Univers
ity of
Mala
ya
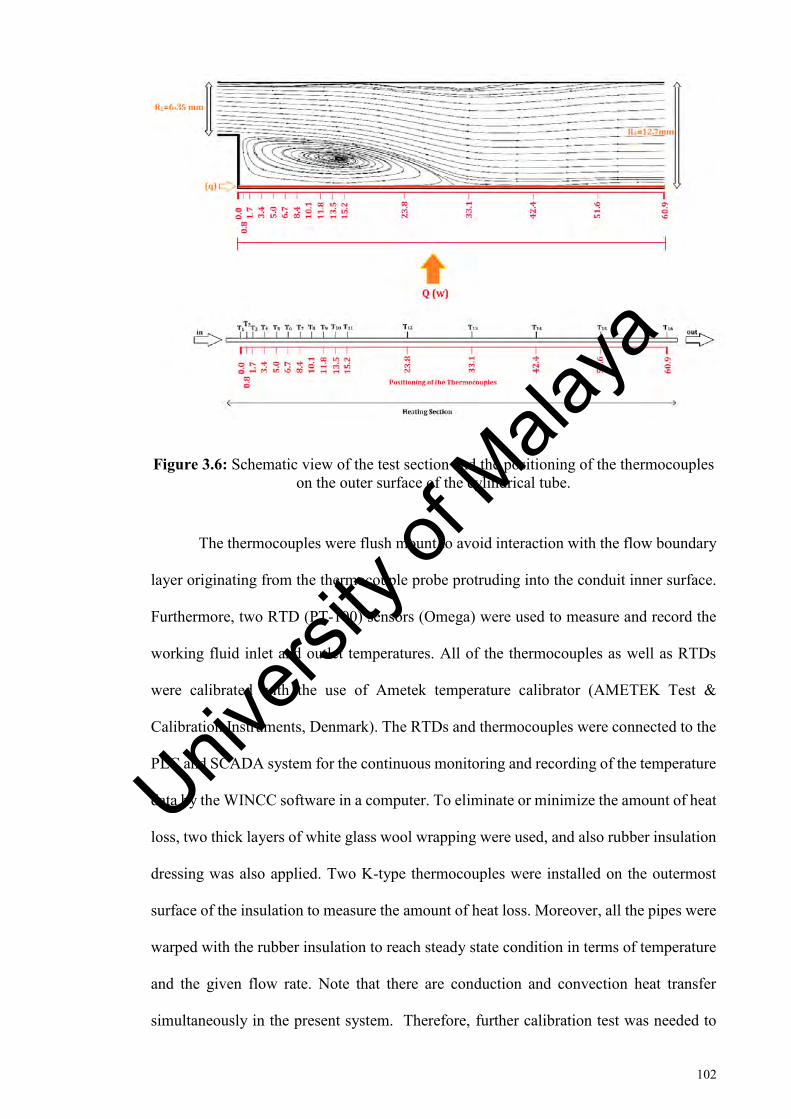
102
The thermocouples were flush mount to avoid interaction with the flow boundary
layer originating from the thermocouple probe protruding into the conduit inner surface.
Furthermore, two RTD (PT-100) sensors (Omega) were used to measure and record the
working fluid inlet and outlet temperatures. All of the thermocouples as well as RTDs
were calibrated with the use of Ametek temperature calibrator (AMETEK Test &
Calibration Instruments, Denmark). The RTDs and thermocouples were connected to the
PLC and SCADA system for the continuous monitoring and recording of the temperature
data by the WINCC software in a computer. To eliminate or minimize the amount of heat
loss, two thick layers of white glass wool wrapping were used, and also rubber insulation
dressing was also applied. Two K-type thermocouples were installed on the outermost
surface of the insulation to measure the amount of heat loss. Moreover, all the pipes were
warped with the rubber insulation to reach steady state condition in terms of temperature
and the given flow rate. Note that there are conduction and convection heat transfer
simultaneously in the present system. Therefore, further calibration test was needed to
Figure 3.6: Schematic view of the test section and the positioning of the thermocouples on the outer surface of the cylindrical tube.
Univers
ity of
Mala
ya
103
determine the exact temperature at the inner surface of the test section. Therefore, a
Wilson plot was used for this purpose. The inlet temperature of bulk fluid and heat flux
at different locations “x” of the duct were formulated as mentioned in the data processing
section. The specifications and the accuracy of the measuring instruments and sensors
used in the present experimental setup are presented in Table 3.2.
Measured parameter
Instrument and sensor type Operating Error
Surface temperature
Type K thermocouple 0-300℃ ±0.1℃
Bulk Temperature
RTD (PT-100) sensor 0-200℃ ±0.1℃
Fluid flow rate N-FLO-25 Electromagnetic flow meter
0.03 m/s ~ 12 m/s ±0.5%
Fluid pressure drop
Foxboro™ differential pressure transmitter
0-25 kPa ±0.075%
Cooling unit WiseCircu, DAIHAN Scientific, Refrigerated circulating bath
2.2 kW ±0.1℃
3.1.6.2 Design and Construction
Some basic requirements are developed as design considerations for the
convection loop. These requirements are generated in order to meet certain goals: some
to mimic heat exchanger conditions, some to meet existing equipment and lab
requirements, and finally some arbitrary conditions.
The reservoir tank is a Jacketed Stainless steel made and in cylindrical shape with
a capacity of 20 liters. The reservoir is kept 30 cm above the gear pump so that the pump
will have adequate pressure avoiding it to run dry. At the bottom of the reservoir a piping
connects to the gear pump while at the top a bypass line, return line and top stirrer to
mixing fluid inside the tank are connected (Figure 3.7).
Table 3.2: Specifications and errors of the measuring instruments and sensors used in the present experiment.
Univers
ity of
Mala
ya

104
The gear pump used for the experiment is a liquid flow sealed gear pump (Cole-
Parmer magnetic drive pump), see Figure 3.8. It is rated for a maximum flow of 64 LPM
and max head is 6.3M. This pump is capable of operating at variable speed with the
maximum rated speed as 3200 RPM. The suction side of the pump is connected to the
reservoir.
The pump is capable of operating with water up to 80℃, due to the shaft seal
limitations. After rough estimation of the total loop pressure losses, assuming 10mm inner
Figure 3.7: Photograph of the Reservoir Tank.
Figure 3.8: Photograph of the Magnetic gear pump.
Univers
ity of
Mala
ya

105
diameter tubing, and from knowledge of the pump characteristic curve, it is found that
the pump should be capable of pumping around 10LPM.This will deliver a significantly
turbulent flow rate for water at room temperature, up to Reynolds number of 20,000.
Therefore, the pump is deemed usable for the experiment. A Hoffman Muller inverter
was used to control the speed of the pump, see Figure 3.9.
Figure 3.9: Photograph of the Hoffman Muller inverter.
The specifications of the inverter are presented in Table 3.3.
Items Contents Model HM-V8A11P5B Input AC, 1PH, 230V, 50/60HZ Output 3PH, 1.5KW, 7A, 0-650HZ
The electromagnetic flow meter (N-FLO-25) was used to measure fluid flow rate
(Figure 3.10). A magnetic flow meter (mag flowmeter) is a volumetric flow meter which
does not have any moving parts and is ideal for wastewater applications or any dirty liquid
which is conductive or water-based working fluids. Magnetic flowmeters are also ideal
for applications where low pressure drop and low maintenance are required.
Table 3.3: Technical specifications for V8 series inverters.
Univers
ity of
Mala
ya
106
The operation of a magnetic flow meter or mag meter is based upon Faraday’s
Law, which states that the voltage induced across any conductor as it moves right angles
through a magnetic field is proportional to velocity of that conductor. As stated above,
the flow meters come calibrated from the manufacturer.
A smart differential pressure transmitter (Model Foxboro™) with accuracy of
±0.075% of span connected to the inlet and outlet of the test section was used in this test
(see Figure 3.11).
A refrigerated bath circulator (DAIHAN-brand, WCR- P30) was used to balance
the heat input, which is inside the jacketed tank (Figure 3.12). This refrigerated bath has:
1. RS232C Interface for remote monitoring and controlling with PC
2. Stainless steel bath (#304) for Superior Durability & High Thermal Efficiency.
Figure 3.10: Photograph of the Electromagnetic flow meter.
Figure 3.11: Photograph of the Differential Pressure Transducers. Univers
ity of
Mala
ya

107
3. Powerful Circulation Pump ensures Temperature Uniformity: Internal and
External Circulation.
4. Locking Mode Supported for Experimental Safety (Input to Jog-Shuttle can be
Disabled)
The specification of the refrigerated bath is listed in Table 3.4.
Items Contents Capacity & Models 30 L, WCR- P30 Temp. Range & Accuracy -25℃~ +150℃, ±0.1℃ Temp. Resolution 0.1℃-Display, 0.1℃-Control Temp. Uniformity & Probe ±0.2℃ at -10℃, PT100 Heating Power 2.2 kW Refrigerator 7/8 HP
Cooling Capacity
at +20℃ 631 W at 0℃ 429 W at -20℃ 284 W
Refrigerant CFC -Free(R-404A) Refrigeration System
Two N8731A DC-power supplies (Keysight (Agilent) Technologies) with
maximum power output of 400A and output voltage of 8V were used to supply enough
energy for heating of working fluid homogenously (Figure 3.13). Two DC power supplies
Figure 3.12: Photograph of the refrigerated bath circulators.
Table 3.4: Specifications of the refrigerated bath.
Univers
ity of
Mala
ya
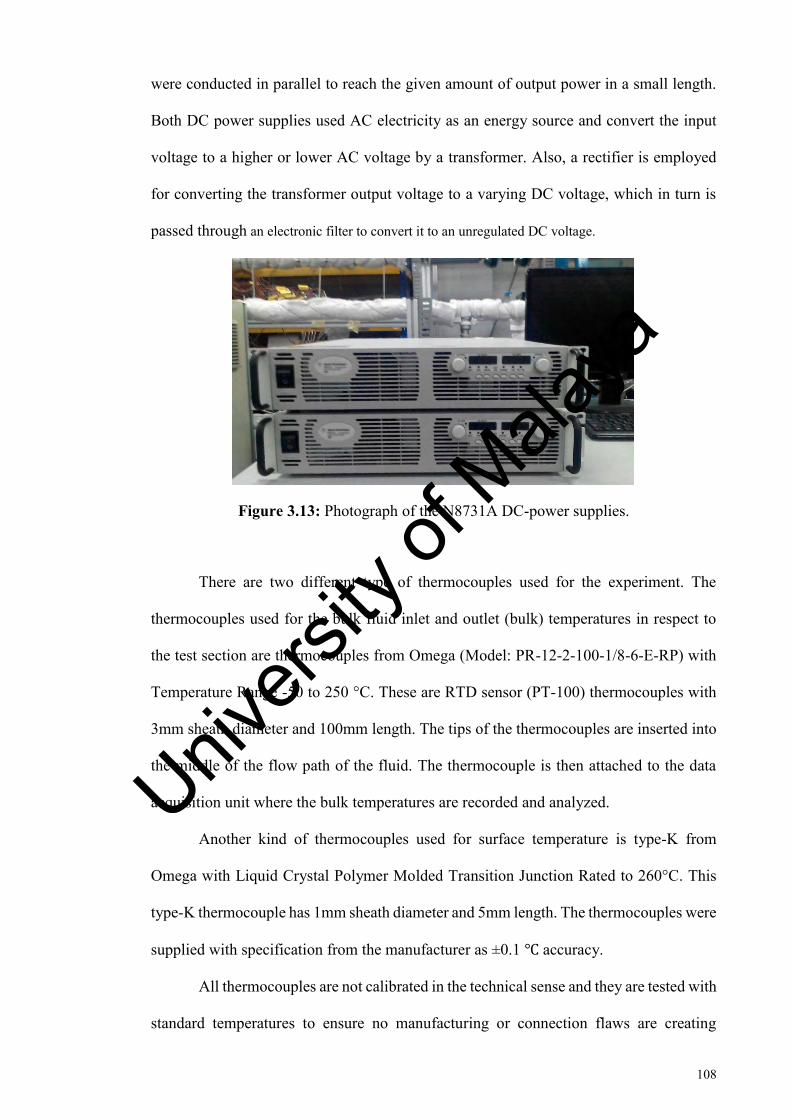
108
were conducted in parallel to reach the given amount of output power in a small length.
Both DC power supplies used AC electricity as an energy source and convert the input
voltage to a higher or lower AC voltage by a transformer. Also, a rectifier is employed
for converting the transformer output voltage to a varying DC voltage, which in turn is
passed through an electronic filter to convert it to an unregulated DC voltage.
There are two different type of thermocouples used for the experiment. The
thermocouples used for the bulk fluid inlet and outlet (bulk) temperatures in respect to
the test section are thermocouples from Omega (Model: PR-12-2-100-1/8-6-E-RP) with
Temperature Range -50 to 250 °C. These are RTD sensor (PT-100) thermocouples with
3mm sheath diameter and 100mm length. The tips of the thermocouples are inserted into
the middle of the flow path of the fluid. The thermocouple is then attached to the data
acquisition unit where the bulk temperatures are recorded and analyzed.
Another kind of thermocouples used for surface temperature is type-K from
Omega with Liquid Crystal Polymer Molded Transition Junction Rated to 260°C. This
type-K thermocouple has 1mm sheath diameter and 5mm length. The thermocouples were
supplied with specification from the manufacturer as ±0.1 ℃ accuracy.
All thermocouples are not calibrated in the technical sense and they are tested with
standard temperatures to ensure no manufacturing or connection flaws are creating
Figure 3.13: Photograph of the N8731A DC-power supplies.
Univers
ity of
Mala
ya

109
erroneous readings. The heat transfer results are directly affected by the temperature
measurements. Thus, all the thermocouples (Type-K and RTD sensor) used in this
experiment must be calibrated to determine their accuracy. The thermocouples are
calibrated by two ways:
1. 650SE - Reference Temperature Calibrator
The system provides significant improvement in the calibration accuracy up
to ±0.04°C with the use of an external reference sensor. Axial homogeneity in
the calibration well is important, as the typical thermo-sensitive element of a
sensor can vary from 5mm to 60mm. The actual temperature in the well will
inherently deviate from the ideal temperature as a function of the proximity to
the bottom of the well (Figure 3.14).
2. The thermocouples are immersed in well mixed boiling-water bath which is
at 100.16°C for the laboratory pressure and a well-mixed ice-water bath is
maintained at 0°C (Figure 3.15).
Figure 3.14: Photograph of the Thermocouple calibrator.
Univers
ity of
Mala
ya

110
Graphtec (midi logger gl220) data acquisition systems are used in this study
(Figure 3.16). Meanwhile, data loggers are connected to a PC for continuous data logging
and monitoring.
All the type-K thermocouples are attached to the channels of Graphtec data logger.
This multi-channel data logger provides 10 analog measurement channels, in addition to
four channels each of discrete logic and pulse inputs. The GL220 supports one external
trigger input and four alarm outputs. The GL220 connected to a PC to allow data upload
in real time as well as remote configuration and real time data acquisition.
Figure 3.15: Thermocouple testing.
Figure 3.16: Photograph of the Data acquisition instruments. Univers
ity of
Mala
ya

111
The RTD sensors, flow meter, and pressure transducer are attached to the channels
of standard PID temperature controller (Scada Autonics) (Figure 3.17). All
thermocouples were connected to the PLC and SCADA system for the continuous
monitoring and recording of the temperature data by the WINCC software in a computer.
The system linked to the PC with the USB cable and RS485 communication (Modbus
RTU) to log the data in real time.
The amount of the heating power is measured by output voltage and current
supported by both DC power supplies.
Note that the heat transfer test section is the main part and design of that takes
much effort and it was constructed by the Advanced Fluid dynamics lab, University of
Malaya. The sectional view of the experimental test section is presented in Figure 3.6 and
major dimension of the test section are tabulated in Table 3.5.
Parameters Values Overall length 700 mm Diameter before step 12.7 mm Diameter after step 25.4 mm Heating length 800 mm Expansion Ratio 1/2
Figure 3.17: Photograph of the controlling unit that attached with SCADA system.
Table 3.5: Dimensions of the test section Univers
ity of
Mala
ya

112
The heat transfer test section included two straight stainless steel 316 tube with a
length of 700 mm and 800 mm. Sixteen grooves were cut along the tube length that was
used to house the thermocouples. The grooves were cut as deep as possible while ensuring
that the inside surface of the pipe was not disturbed. The distance between groove surface
and inner surface of the tube was maintained at 1mm. Also, to keep thermocouple in
location the stainless steel tubes with 2 mm outer diameter were installed and fixed with
high temperature epoxy glue (Figure 3.18). The thermocouples were installed inside the
tube and filled by thermo-oil to confirm the uniform heating to thermocouple sensors.
High temp. Epoxy up to 200℃
Thermo-wells installation
Figure 3.18: Thermocouple installation.
Univers
ity of
Mala
ya

113
The thermocouples were calibrated to measure the surface temperature according
to Equation (3.1).
𝑇𝑊 = 𝑇𝑇𝑐 −��
𝜆/𝑥 (3.1)
This experimental system was designed and constructed to perform experiments
and investigated the convection heat transfer coefficient and pressure drop over a
backward facing step at constant heat flux (Figure 3.19).
Figure 3.19: Photograph of the heat transfer test rig.
3.1.6.3 Car Radiator
To study the thermal properties of coolant, an automobile radiator was also
employed and is shown in Figure 3.20. The experimental system consisted of a closed
loop of working fluid. To measure temperatures, the working fluid, after being warmed
in a feed reservoir, was pumped into the radiator using 2.0 cm inner diameter tubes and
was subsequently cooled over flowing through the radiator. The working fluid was
returned to the main tank after passing through the radiator. The size of feed reservoir
Univers
ity of
Mala
ya
114
was 22.5 liters (Figure 3.20) and, in every circulation, 25 liters of working fluids was
nourished by a tank located on the top of the reservoir. To enhance the accuracy of the
experiments, the radiator system was completely closed, which was performed via an air
drain mounted on the top of the feeding repository. Moreover, to keep temperature of the
working fluid steady, eight electrical elements with the power of 18 kW and a controller
were used. Three calibrated thermocouples (PT100-type) were inserted into the calming
and mixing chamber of the flow at inlet and outlet of the radiator for measuring the bulk
temperatures of working fluids, and also eight K-type thermocouples were soldered at
axial diameter on the outer surfaces of the radiator to measure wall temperatures. The
accuracy of all the thermocouples was ±0.1 ºC at full scale. Due to very small thickness
(2.0 mm) and very large thermal conductivity of the tubes, it was reasonable to equate
inside temperature of the tube with the outside one.
The test section included a storage tank, a centrifugal pump, heating elements,
flow meter, a forced draft fan, a cross flow heat exchanger and flow lines. The
experimental setup was totally a closed system and worked under pressure (0.25 kPa) and
the working fluid filled the whole storage tank in all the experiments. Additionally, the
flow rate in the system was regulated by adjusting a globe valve on the recycle line. Three
layer insulated tubes (Isopipe 0.75 in diameter) were applied as a connecting line. A
flowmeter (Instrument Company LZT) was used to measure and manipulate the flow rate.
When the flow rate was adjusted at the beginning of the experiments, it was monitored
continually during the experiments. When it was fixed at our desired flow rate for at least
15 minutes, the results were recorded. The accuracy of the flowmeter was around 2.0%.
A fin-and-tube type radiator with 40 vertical tubes (circular shaped cross section) was the
main part of set-up, which schematically shown in Figure 3.21. All mechanical parts of
the experimental setup were made of aluminum. For cooling the working fluid, a forced
fan (Techno pars: 1,400 rpm) was installed behind the radiator. Air and fluid had indirect
Univers
ity of
Mala
ya
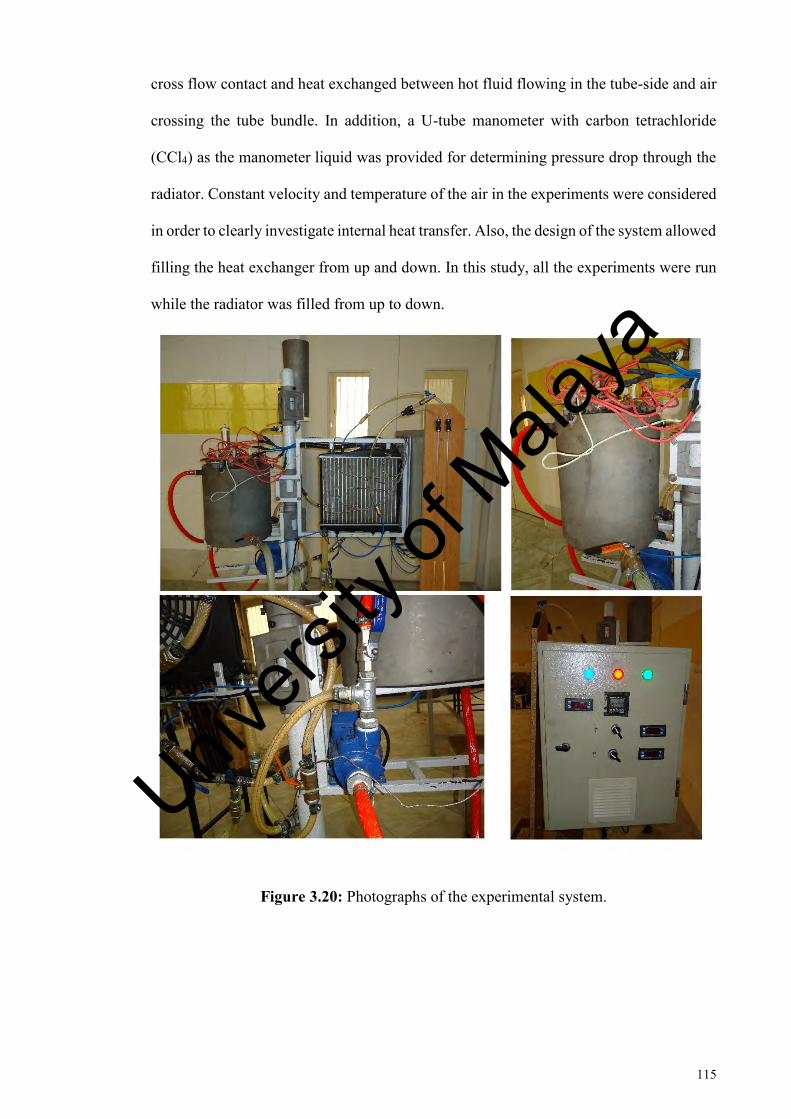
115
cross flow contact and heat exchanged between hot fluid flowing in the tube-side and air
crossing the tube bundle. In addition, a U-tube manometer with carbon tetrachloride
(CCl4) as the manometer liquid was provided for determining pressure drop through the
radiator. Constant velocity and temperature of the air in the experiments were considered
in order to clearly investigate internal heat transfer. Also, the design of the system allowed
filling the heat exchanger from up and down. In this study, all the experiments were run
while the radiator was filled from up to down.
Figure 3.20: Photographs of the experimental system.
Univers
ity of
Mala
ya

116
All tests were carried out in triplicate to consider the average and improve the
accuracy. Table 3.6 illustrates some essential parameters of experiments as well as
experimental set up.
Volumetric flow rate (lit.min-1) 3-8
Nanoparticle concentration (weight
%)
0-0.2
Type of Nano-structures Graphene nanoplateless and
nitrogen doped graphene
Reynolds number 2000–8000
Inlet temperature (ºC) 35, 45, 55
Figure 3.21: Schematic of the experimental system
Table 3.6: Test condition during the experiments.
Univers
ity of
Mala
ya

117
3.1.6.4 Two Phase Closed Thermosyphon
Figure 3.22 illustrated the schematic and photograph of the thermosyphon as an
experimental apparatus used in the current study. The thermosyphon consisted of a copper
tube with a length of 1000 mm and inner diameter of 20 mm. The apparatus was fabricated
of three parts: the evaporator, the adiabatic region, and the condenser part. The evaporator
part was made-up of a straight 20 mm inner diameter copper tube with a length of
350 mm. The adiabatic part was 250 mm long and the condenser part was also fabricated
from a straight copper tube with an inner diameter of 20 mm and a length of 400 mm, and
was placed in the top of the thermosyphon. Also, the condenser section comprised of a
shell as heat exchanger with the diameter of 40 mm and length of 400 mm surrounding
the main pipe with an inner diameter of 20 mm.
The apparatus uses 10 K-type thermocouples, with four installed in the evaporator
section and another four in the condenser region. An electric heater was placed at the
evaporator section which was isolated with a fireproof blanket with a thickness of 20 mm.
A power supply, a water storage tank, and a vacuum pump to remove the non-condensate
gases from the thermosyphon are other parts of the experimental setup. Two K-type
thermocouples were also used to report the temperatures of input water and output water
in the shell. A cooling system was also used to control the temperature of the storage tank.
The flow rate of the input water was measured with the flow control valve and
was kept at 250 mL/min with ±1.0% margin of errors. Also, the ammeter, thermocouples
and voltmeter with a 0.001 A, 0.1 °C and 0.1 V margin of errors were maintained
respectively, to measure the different thermal parameters.
Univers
ity of
Mala
ya

118
Overall, the image of all the characterization instruments employed in this study
for analyzing the samples in terms of structures and morphology are shown in Appendix
C.
3.1.6.5 Flowchart of study
Figure 3.23 shows the phase of this study. In fact, this study has 3 phases including
material preparation and characterization, investigation of colloidal stability and
thermophysical properties, and investigation of heat transfer in different equipment. In
phase of material preparation and characterization, 6 graphene-based additives were
synthesized, analyzed and utilized as additive for preparing different nanofluids. The
second phase includes the investigation of colloidal stability of the prepared nanofluids,
continuing with checking thermophysical properties. The third phase of study includes
the investigation of heat transfer rate of car radiator, ducts and channels with abrupt
expansion and two-phase closed thermosyphon in the presence of the prepared
nanofluids.
Figure 3.22: (left and middle) Schematic and (right) photograph of the experimental apparatus.
Univers
ity of
Mala
ya

119
Figure 3.23: Flowchart of phases of this study.
Univers
ity of
Mala
ya

120
CHAPTER 4: RESULTS AND DISCUSSION
4.1 Introduction
As mentioned in chapter 2, the liquid-phase exfoliation strategy has been
obtaining great attention due to its unique properties such as being cost-effective,
efficient, extraordinarily versatile and potentially for large-scale production of defect-
free graphene (Hernandez et al., 2008; Paton et al., 2014). Although lots of liquid-phase
exfoliation approaches for scalable few-layered graphene synthesis have been emerging
(Edwards & Coleman, 2013), the second fundamental problem can be the difficulties in
processing graphene, in particular in this study, the graphene's poor colloidal stability in
most common solvents (Ayan-Varela et al., 2014). With introducing functionalization,
graphene can remain dispersed over a reasonable period of time, which is a one of the
most important goal of this study.
In view of great advantages of liquid phase exfoliation along with in situ
functionalization that is being made, this chapter aims to provide a list of synthesized
graphene materials and their production methods. Besides the proposed methods and
introduction of materials, different characterization methods including morphological and
elemental analysis were employed to confirm the present claims regarding synthesizing
of materials.
The goals of this chapter are to propose some exfoliation and functionalization
methods and mechanisms, investigate the exfoliation yield and functionalization degree
as the first phase of study. The second phase includes the investigation of colloidal
stability and thermophysical properties of the prepared nanofluids. The third phase of
study includes the investigation of heat transfer rate of different thermal equipment e.g.,
car radiator and heat exchangers in the presence of prepared nanofluids. To have an
overview on the whole thesis, the readers are referred to the flowchart represented in
chapter 3.
Univers
ity of
Mala
ya
121
4.2 Exfoliation, Functionalization and Characterization
4.2.1 Preparation of Chemically-Assisted Exfoliated, Highly-Porous,
Graphene (CE-GR) and Thermally-Treated Graphene (T-GR)
4.2.1.1 Chemicals
All reagents such as Tetrahydrofurfuryl polyethylene glycol ((PEG, C5H9O
(C2H4O)n=2,3OH, MW∼200), AlCl3, N,N-dimethylformamide (DMF), N,N-
Dimethylacetamide (DMA), g-butyrolactone (GBL), ethylene glycol (EG),
polytetrafluoroethylene (PTFE) binder and HCl with analytical grade were obtained from
Sigma-Aldrich and were employed without additional purification. The natural graphite
with 100 mesh (<150 μm) and purity of 99.9% was obtained from Alfa Aesar.
4.2.1.2 In Situ Functionalization and Exfoliation Procedure
Figure 4.1 shows the experimental procedure for functionalization, as well as the
exfoliation of graphite to produce chemically-assisted exfoliated, highly-porous,
graphene (CE-GR) and thermally-treated graphene (T-GR). Regarding functionalization,
in a typical experiment, the pristine graphite (10 mg) and 185.4 mg of AlCl3 as a Lewis
acid were ball-milled and poured into a Teflon reaction vessel and 200 ml of PEG were
gradually added during sonication for 30 min at room temperature to obtain a
homogeneous suspension under nitrogen atmosphere. A special white smoke was seen
during adding the PEG. Also, concentrated hydrochloric acid (0.5 mL) was added
dropwise to the graphite suspension during the sonication process. Then, the mixture was
poured into a Teflon vessel, sealed and transferred into an industrial microwave and
irradiated at 150 °C at an output power of 700 W for 20 min (with frequently of 5 min
sonication and 5 min placed under microwave irradiation). An electrophilic addition
reaction occurred between the PEG and the graphite, resulting in the attachment of the
PEG groups and hydroxyl groups to the exposed edges and side of the expanded graphite
flakes, thereby producing functionalized, expanded graphite. Microwave irradiation was
Univers
ity of
Mala
ya
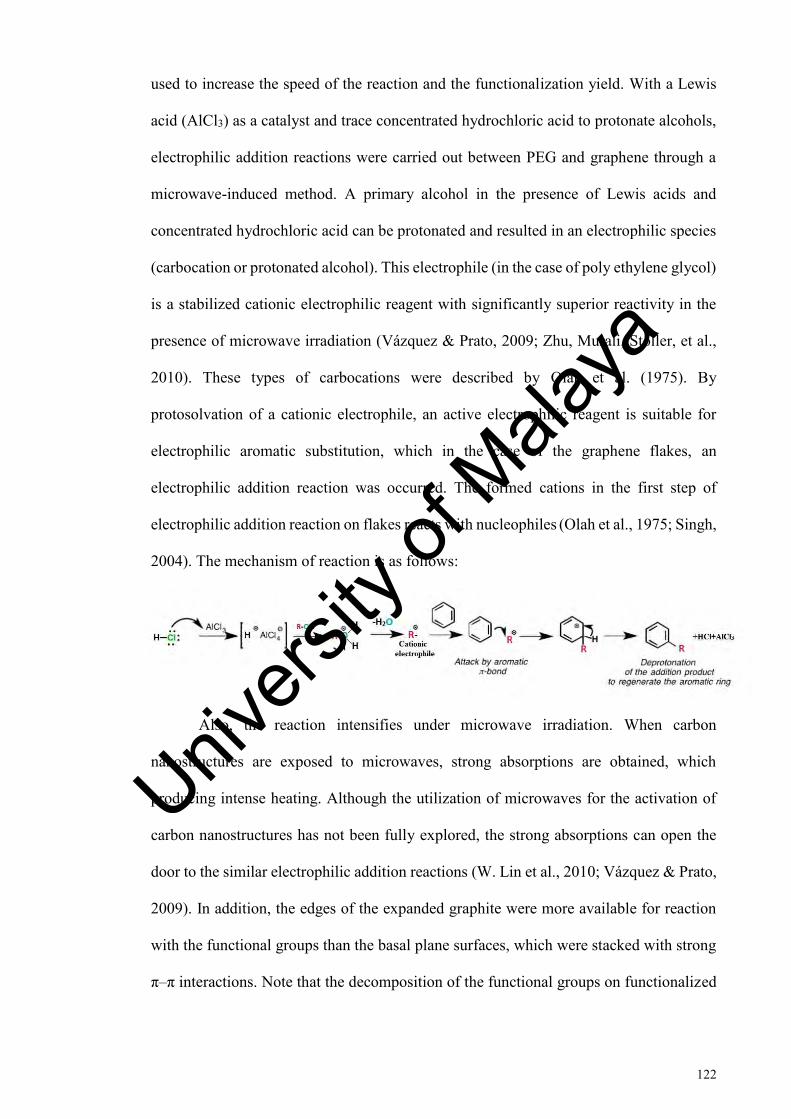
122
used to increase the speed of the reaction and the functionalization yield. With a Lewis
acid (AlCl3) as a catalyst and trace concentrated hydrochloric acid to protonate alcohols,
electrophilic addition reactions were carried out between PEG and graphene through a
microwave-induced method. A primary alcohol in the presence of Lewis acids and
concentrated hydrochloric acid can be protonated and resulted in an electrophilic species
(carbocation or protonated alcohol). This electrophile (in the case of poly ethylene glycol)
is a stabilized cationic electrophilic reagent with significantly superior reactivity in the
presence of microwave irradiation (Vazquez & Prato, 2009; Zhu, Murali, Stoller, et al.,
2010). These types of carbocations were described by Olah et al. (1975). By
protosolvation of a cationic electrophile, an active electrophilic reagent is suitable for
electrophilic aromatic substitution, which in the case of the graphene flakes, an
electrophilic addition reaction was occurred. The formed cations in the first step of
electrophilic addition reaction on flakes reacts with nucleophiles (Olah et al., 1975; Singh,
2004). The mechanism of reaction is as follows:
Also, the reaction intensifies under microwave irradiation. When carbon
nanostructures are exposed to microwaves, strong absorptions are obtained, which
producing intense heating. Although the utilization of microwaves for the activation of
carbon nanostructures has not been fully explored, the strong absorptions can open the
door to the similar electrophilic addition reactions (W. Lin et al., 2010; Vázquez & Prato,
2009). In addition, the edges of the expanded graphite were more available for reaction
with the functional groups than the basal plane surfaces, which were stacked with strong
π–π interactions. Note that the decomposition of the functional groups on functionalized
Univers
ity of
Mala
ya

123
flakes under microwave irradiation can also generate some pressure for overcoming the
van der Waals interaction among graphene layers during the microwave procedure.
Univers
ity of
Mala
ya

124
Subsequently, the resulting black ink-like dispersion was left for 24 hr to separate
large unstable graphite aggregates. The functionalized graphite unlike unstable graphite
aggregates was expanded and was much more soluble in dimethylformamide (DMF),
Dimethylacetamide (DMA), g-butyrolactone (GBL) and ethylene glycol (EG) than the
pristine graphite, as shown in Figure 4.2, panel 1. It is noteworthy that a majority of flakes
remained stable for more than 1 week. Also, plot of absorbance versus wavelength for
various colloidal solutions were studied to trace the presence of functionalized graphite
within the binary system. Figure 4.2 show the plot of absorbance intensity versus
wavelength and the colloidal stability of PEG-treated graphite in different solutions for
expanded graphite in EG, DMA, DMF and GBL taken at specific period.
Then, the homogeneous suspension of PEG-treated graphite in EG was poured
into another vessel that contained 450 ml of EG, and the mixture was sonicated for 2 hr
to completely disperse the functionalized graphite flakes; this was followed by 30 min of
centrifugation at 3000 rpm to collect the supernatant, which was filtered, washed, dried,
and denoted as CE-GR after ball-milling the dry-powder for another 30 min. Part of the
CE-GR was used for testing and the reminder was set aside for further treatment.
In order to obtain pure graphene without functional groups, thermal treatment up
to 500 ºC under a nitrogen atmosphere was applied for 15 min to remove all PEG
molecules or other impurities. The product was labeled as T-GR. The pure graphene
powder that was extracted was black (Figure 4.2 panel 2), which was a significant contrast
with the shiny, metallic grey pristine graphite.
Figure 4.1: The experimental procedure for functionalization as well as exfoliation of graphite and synthesizing of CE-GR and T-GR.
Univers
ity of
Mala
ya

125
4.2.1.3 Characterizations, Results and Discussion
Graphene graft copolymers is first synthesized by covalent functionalization of
graphite with the monofunctional, tetrahydrofurfuryl-terminated polyethylene glycol to
increase the dispersibility and wettability of the individual graphite and expanding flakes.
The monofunctional group, as a covalent group, prevents cross-linking of the graphite
(Kalinina et al., 2011a). Also, another promising approach was followed for the
exfoliation of graphite to produce just highly-porous, single-layered graphene as a quick
method for application to the high-conductive nanofluids.
4.2.1.4 Functionality and Quality of Graphene
As mentioned above, covalent functionalization occurs through the formation of
an electrophilic addition reaction between graphite and the PEG chain under microwave
irradiation, which was verified by FTIR spectroscopy.
Figure 4.3(a) shows the FTIR spectra of pristine graphite, CE-GR, and T-GR. It
is seen that the FTIR spectrum of pristine graphite provided no evidence of PEG. The
peaks at 1471, 1535 and 1577 cm-1 were respectively consistent with the bending
vibration of the CH2 group, stretching vibrations of the C=C and C=O. In contrast, the
Figure 4.2: (1) Photographs of functionalized and expanded graphite dispersed in (a) DMF, (b) DMA, (c) g-butyrolactone and (d) EG. (2) The extracted black pure graphene
powder (T-GR).
Univers
ity of
Mala
ya

126
FTIR spectrum of CE-GR had two peaks in the range of 2800-3000 cm-1, which were
associated with the C-H stretching vibration31. The peak at 1548 cm-1 was consistent with
C=O or C=C stretching vibrations, which are infrared-activated by extensive
functionalization. Also, the OH stretching vibration produced a weak peak at 3455 cm-1,
indicating the presence of hydroxyl groups attached to the graphite. The FTIR spectrum
of the treated samples also had a peak at 1460 cm-1, representing the bending vibration of
the CH2 group. The peak at 1182 cm−1 was in agreement with the stretching vibration of
the C–O groups. In contrast to the CE-GR, T-GR showed no evidence of PEG molecules,
which confirmed that all of the functional groups had been removed. The FTIR spectrum
of T-GR shows two weak peaks in the range of 2800-3000 cm-1, which were associated
with the C-H stretching vibration. The lack of above-mentioned peaks in T-GR spectrum
shows the prepared graphene was almost pure and that a majority of the functional groups
had been removed (Ou et al., 2012; Pan et al., 2013; Radic et al., 2013).
To provide evidence supporting the above statements, thermogravimetric analysis
(TGA) was used to detect quantitatively the weight fraction (loading) of organic groups
attached to the graphite. Figure 4.3 panels b, c, and d show the TGA curves of the pristine
graphite, CE-GR, and T-GR samples, respectively. Also, Figure 4.3 panels b, c, and d
show the differential thermogravimetric analysis (DTG) curves of the pristine graphite,
CE-GR, and T-GR powders after filtration. It is apparent that there was no significant
weight loss with pristine graphite, which was thermally stable when heated to 770 °C
under an air flow rate of 50 cm3/min. The DTG curves also show that there were two
phases of degradation with the CE-GR sample. CE-GR illustrates a mild weight loss in
the temperature range of 100–205 °C, which was due to the decomposition of the
covalently-grafted organic addends (PEG).
Univers
ity of
Mala
ya
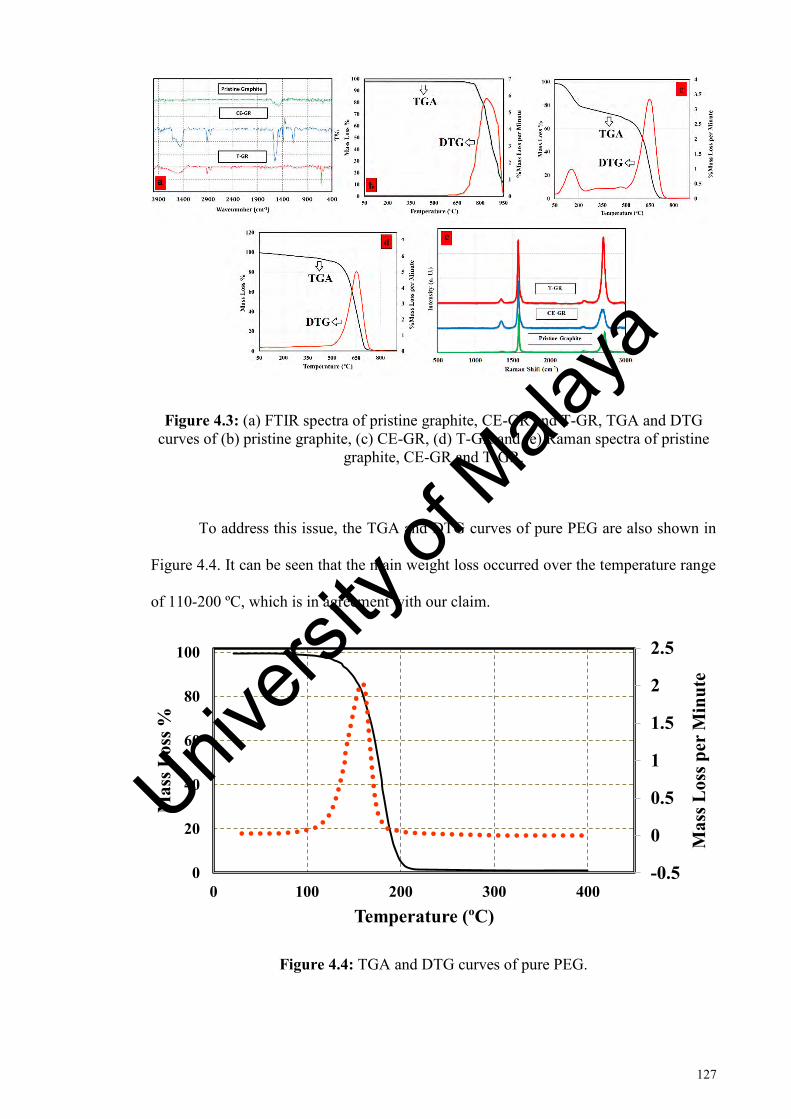
127
To address this issue, the TGA and DTG curves of pure PEG are also shown in
Figure 4.4. It can be seen that the main weight loss occurred over the temperature range
of 110-200 ºC, which is in agreement with our claim.
-0.5
0
0.5
1
1.5
2
2.5
0
20
40
60
80
100
0 100 200 300 400
Mas
s Los
s per
Min
ute
Mas
s Los
s %
Temperature (ºC)
Figure 4.3: (a) FTIR spectra of pristine graphite, CE-GR and T-GR, TGA and DTG curves of (b) pristine graphite, (c) CE-GR, (d) T-GR and (e) Raman spectra of pristine
graphite, CE-GR and T-GR.
Figure 4.4: TGA and DTG curves of pure PEG.
Univers
ity of
Mala
ya

128
Because the PEG molecules were used initially to achieve exfoliation and expand
the layers, the weight loss that occurred up to 500 °C was attributed to the PEG that was
trapped within the graphene layers. Also, the second phase of degradation was associated
with the decomposition of the graphitic carbon. It is noteworthy that the results suggest
that CE-GR had an appropriate degree of functionalization. Also, the weight loss obtained
by our method was greater than those reported by conventional methods (Kalinina et al.,
2011a), suggesting a strong functionalization of carbon nanostructures with organic
molecules.
To achieve pure graphene, the remaining PEG that was decorated on the structure
of CE-GR was removed by thermal treatment under a nitrogen atmosphere at
temperatures up to 500 ºC for 15 min. Figure 4.3(d) shows the TGA and DTG curves of
the T-GR after freeze drying. As observed in the DTG curve, the only obvious peak was
the graphitic peak. Also, the graphitic structure of T-GR remained stable up to750 °C,
indicating that the prepared graphene is totally pure and those functional groups can be
removed with a simple and fast method (Lv et al., 2009). In addition, the decomposition
temperature of both products are same and shifted towards lower temperatures compared
to the pure graphite, indicating that the number of layer per flakes decreased.
The Raman spectra of the pristine graphite, CE-GR, and T-GR are shown in
Figure 4.3, panel (e). A feeble D band can be seen at 1344 cm–1, and there are fairly strong
G and 2D bands at 1568 and 2695 cm–1, respectively. The ratio of the intensities of the
D-band to the G-band (ID/IG) is considered to be the amount of disordered carbon (sp3-
hybridized carbon) relative to graphitic carbon (sp2-hybridized carbon). In
functionalization studies of carbon nanostructures, the higher intensity ratio of ID/IG
indicates the higher disruption of aromatic π-π electrons, implying the partial damage of
graphitic carbon produced by expansion and edge functionalization (Lv et al., 2009).
Although the D bands of all of the samples had weak peaks, the ID/IG ratios of CE-GR
Univers
ity of
Mala
ya

129
were relatively higher than those of pristine graphite, which confirmed the successful
functionalization via an electrophilic addition reaction under microwave irradiation
(McAllister et al., 2007). Also, the Raman results of CE-GR showed lower ID/IG ratios
than the graphene oxide and/or chemically-converted graphene (Dikin et al., 2007),
implying that there were fewer defects on the basal planes of the CE-GR.
Also, the poor D-mode (ID/IG) of T-GR, which was in agreement with the DTG
and TGA results, confirmed that the prepared graphene was totally pure and that the
functional groups had been removed completely. Surprisingly, the G peak in the spectra
of CE-GR and T-GR retained their intensities after the electrophilic addition reaction
(insignificant decrease in G mode with CE-GR sample), which confirmed that the quality
of the graphene layers that were obtained was preserved. Also, the higher intensity ratio
of I(2D)/I(G) confirms the presence of few-layer graphene.
Raman spectroscopy can obviously distinguish a single layer from a bilayer and/or
from a few layers by focusing on the shape, size, and intensity of the 2D bands (Ferrari
et al., 2006). According to the results of Ferrari et al. (2006), as the layer of graphene
increases, the 2D band becomes much broader and up-shifted. Accordingly, a
considerable change in sizes, shapes, and intensities of the 2D peaks of CE-GR and T-
GR are more obvious than they are for the pristine graphite. It can be seen that the 2D
bond of the pristine graphite includes a coupled peak, i.e., D1 and D2 peaks, which
produced a broad peak (Ferrari et al., 2006). However, single, sharp 2D peaks were shown
in the Raman spectra of CE-GR and T-GR. This change in the 2D bands observed in the
CE-GR and T-GR samples potentially verified the presence of few-layer flakes sheets.
The natures of pristine graphite, CE-GR, and T-GR were studied by X-ray
photoelectron spectroscopy (XPS), as illustrated in Figure 4.5a. It can be seen that C1s
and O1s peaks appeared at almost 284.5 eV and 531.8 eV, respectively. Based on these
results, pristine graphite presents a very small amount of oxygen. Upon functionalization,
Univers
ity of
Mala
ya
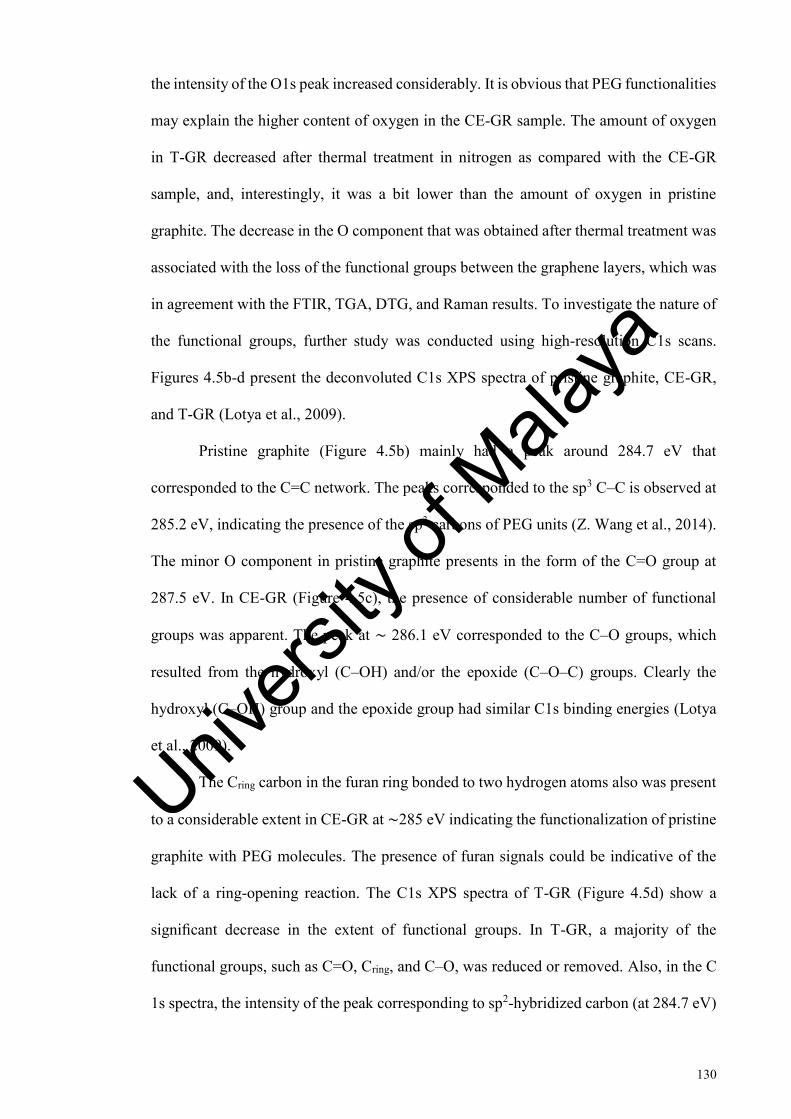
130
the intensity of the O1s peak increased considerably. It is obvious that PEG functionalities
may explain the higher content of oxygen in the CE-GR sample. The amount of oxygen
in T-GR decreased after thermal treatment in nitrogen as compared with the CE-GR
sample, and, interestingly, it was a bit lower than the amount of oxygen in pristine
graphite. The decrease in the O component that was obtained after thermal treatment was
associated with the loss of the functional groups between the graphene layers, which was
in agreement with the FTIR, TGA, DTG, and Raman results. To investigate the nature of
the functional groups, further study was conducted using high-resolution C1s scans.
Figures 4.5b-d present the deconvoluted C1s XPS spectra of pristine graphite, CE-GR,
and T-GR (Lotya et al., 2009).
Pristine graphite (Figure 4.5b) mainly had a peak around 284.7 eV that
corresponded to the C=C network. The peaks corresponded to the sp3 C–C is observed at
285.2 eV, indicating the presence of the sp3 carbons of PEG units (Z. Wang et al., 2014).
The minor O component in pristine graphite presents in the form of the C=O group at
287.5 eV. In CE-GR (Figure 4.5c), the presence of considerable number of functional
groups was apparent. The peak at ∼ 286.1 eV corresponded to the C–O groups, which
resulted from the hydroxyl (C–OH) and/or the epoxide (C–O–C) groups. Clearly the
hydroxyl (C–OH) group and the epoxide group had similar C1s binding energies (Lotya
et al., 2009).
The Cring carbon in the furan ring bonded to two hydrogen atoms also was present
to a considerable extent in CE-GR at ∼285 eV indicating the functionalization of pristine
graphite with PEG molecules. The presence of furan signals could be indicative of the
lack of a ring-opening reaction. The C1s XPS spectra of T-GR (Figure 4.5d) show a
significant decrease in the extent of functional groups. In T-GR, a majority of the
functional groups, such as C=O, Cring, and C–O, was reduced or removed. Also, in the C
1s spectra, the intensity of the peak corresponding to sp2-hybridized carbon (at 284.7 eV)
Univers
ity of
Mala
ya
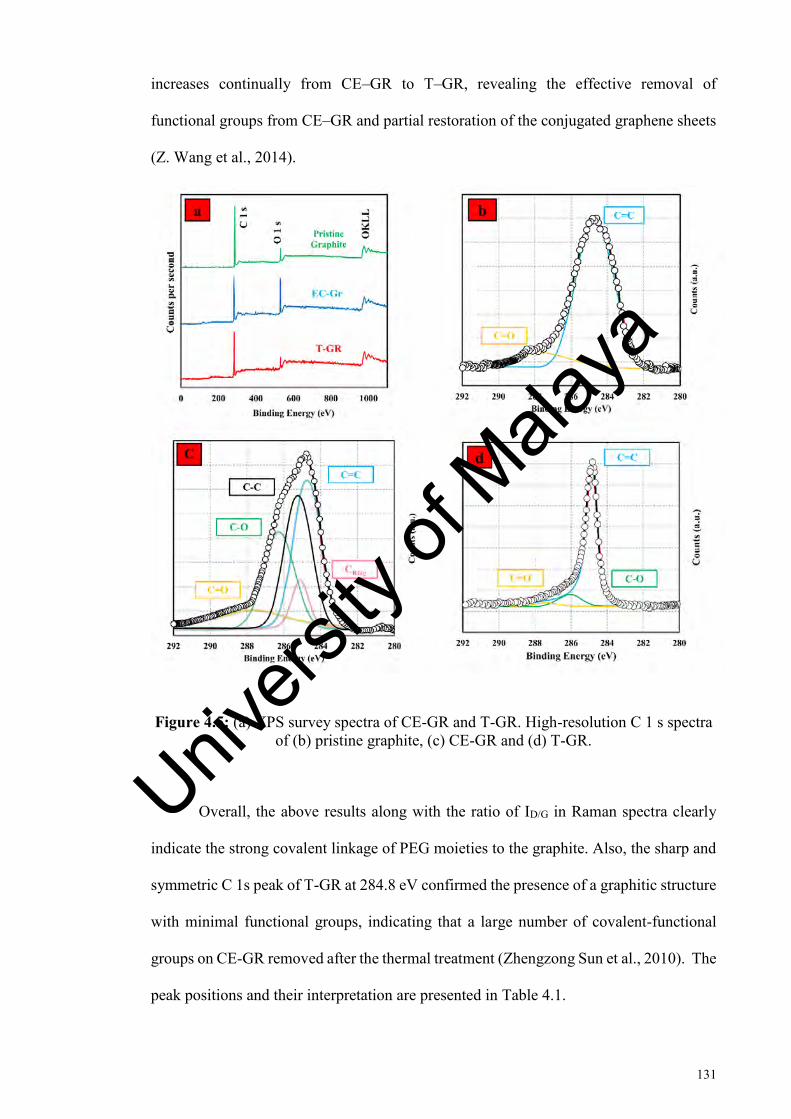
131
increases continually from CE–GR to T–GR, revealing the effective removal of
functional groups from CE–GR and partial restoration of the conjugated graphene sheets
(Z. Wang et al., 2014).
Overall, the above results along with the ratio of ID/G in Raman spectra clearly
indicate the strong covalent linkage of PEG moieties to the graphite. Also, the sharp and
symmetric C 1s peak of T-GR at 284.8 eV confirmed the presence of a graphitic structure
with minimal functional groups, indicating that a large number of covalent-functional
groups on CE-GR removed after the thermal treatment (Zhengzong Sun et al., 2010). The
peak positions and their interpretation are presented in Table 4.1.
Figure 4.5: (a) XPS survey spectra of CE-GR and T-GR. High-resolution C 1 s spectra of (b) pristine graphite, (c) CE-GR and (d) T-GR.
Univers
ity of
Mala
ya

132
sample functional group peak positions (eV)
C=C C-C C-O C=O Cring
Pristine Graphite 284.7 --- --- 287.7
CE-GR 284.6 285.2 286.1 287.6 285
T-GR 284.8 --- 286.1 287.3 ---
4.2.1.5 Morphological Study
Figure 4.6 illustrate the FESEM images of the (a-h) CE-GR and (i-l) T-GR that
show a high yield exfoliation was achieved. Note that, for CE-GR samples, high-
resolution imaging of FESEM (Figure 4.6) was obtained with no pretreatment, such as
surface sputtering with a thin gold layer, suggesting that the samples had high
conductivity (Lv et al., 2009).
Figure 4.6 shows the exfoliations of the multi-layered graphite into single- or few-
layered graphene, which was obtained by microwave-assisted functionalization along
with physical cracking by a sonicator, demonstrating a marked reduction in thickness by
chemical-mechanical cracking with no significant damage to the size of the grains. The
mentioned approach is able to open the graphite layers swiftly, and it produces CE-GR
and T-GR with appropriately uniform surfaces.
It is worth mentioning that the FESEM pictures of samples showed some
crumpled and curved sheets that were transparent to the electron beam. Also, such a
worm-like surface, with crumpled and curved sheets, is due to strict exfoliation and
functionalization. Although FESEM images cannot distinguish the precise thickness of
flakes and functional groups, the planar morphology of graphene layer, the exfoliation
and formation of low-layered graphene are clearly seen from these pictures. It is worth
mentioning that FESEM clearly showed intense cleavage surfaces of graphite by
Table 4.1: Peak positions of various groups in C1s Spectra of pristine graphite, CE-GR and thermally-treated graphene.
Univers
ity of
Mala
ya

133
functionalization under microwave irradiation and sonication. Some of T-GR images
show that the extent of wrinkles, which commonly developed during functionalization
and were attributed to the addition of functional groups, almost decreased after thermal
treatment. This may be a result of decomposition of functional groups (PEG) during the
thermal-treatment procedure. More evidence in this regard is provided by transmission
electron microscopy and atomic force microscopy in the following section.
Figure 4.7 shows the transmission electron microscopy (TEM) images and
selected areas electron diffraction (SAED) patterns of CE-GR and T-GR. Figures 4.7a-c
show the TEM images of CE-GR, which included some individual graphene sheets with
wrinkled morphology and folded edges. It can be seen that large graphene nanosheets (a
few hundred square nanometers) resemble crumpled silk veil waves. Figure 4.7 (panels
d, e, f, and g) illustrate TEM images of the T-GR sample, which comprised of a
single/few-layered graphene with large grain sizes.
Figure 4.6: FESEM images of the CE-GR (3a-h) and T-GR (3i-l).
Univers
ity of
Mala
ya

134
Figure 4.7: a-h, High-resolution TEM images of CE-GR (a-c) and T-GR (d-g) graphene. h, i, Electron diffraction patterns taken from the positions of the red (h) and
white spots (i), respectively, of the sheet shown in d, with the peaks labelled by Miller–Bravais indices. The graphene is clearly one layer thick in (h) and two layers thick in
(i). j, k, Diffracted intensity taken along the 1–210 to –2110 axis for the patterns shown in h and i, respectively. l, Histogram of the ratios of the intensity of the {1100} and
{2110} diffraction peaks for all the diffraction patterns collected.
Univers
ity of
Mala
ya

135
In addition, some of the small and big holes are obvious in Figure 4.8.
A more definitive identification of graphene can be made by analysis of electron
diffraction patterns (Hernandez et al., 2008; J. Meyer et al., 2007). For identification of
monolayers by electron diffraction, the fact that the ratio of the intensity of the {1100} to
the {2110} peaks gives an unambiguous local identification of monolayer, bilayer, and
multilayer can be used to provide information on the yield of monolayer graphene. The
recent results were reported experimental intensity ratios of I{1100}/I{2110} ≈ 0.4 for bilayer
graphene and I{1100}/I{2110} ≈1.4 for monolayer graphene (J. Meyer et al., 2007; Shen &
Lua, 2013). Also, a bimodal distribution is obtained, with peaks centered at
I{1100}/I{2110}=0.56 and I{1100}/I{2110}=1.45, representing bilayer and monolayer graphene,
respectively, which agreed well with other reported results (Hernandez et al., 2008; Shen
& Lua, 2013). Other quantities are caused by multilayer graphene. As an example of this,
Figure 4.7d shows what appear to be a graphene monolayer and a graphene bilayer,
respectively. Figure 4.7d is particularly interesting as almost the middle side of the flake
consists of at least two layers, whereas on the edge side, a single monolayer protrudes.
Figure 4.7h shows the normal-incidence electron diffraction pattern of the flake in Figure
4.7d, taken with beam position close to the red dot. Figure 4.7i shows normal-incidence
selected-area diffraction patterns for the flake in Figure 4.7d, taken with beam position
close to the white dot. In both cases, the patterns show the typical sixfold symmetry
expected for graphite/graphene (J. C. Meyer et al., 2007), permitting to label the peaks
Figure 4.8: TEM images of the CE-GR.
Univers
ity of
Mala
ya

136
with the Miller–Bravais (hkil) indices. Also, the hexagonal patterns are similar to those
in other researches’ reports for single-layer and bilayer graphene.
The main difference between Figures 4.7h and 4.7i is that for the multilayers (or
bilayer) (Figure 4.7i), the {2110} spots appear to be more intense relative to the {1100}
spots. As mentioned above, this identification of AB stacking in these thin multilayers
allows us to differentiate monolayer from bilayer as well as multilayer graphene by
inspection of the intensity ratio I{1100}/I{2110}. To this end, a line section is plotted through
the (1–210)–(0–110)–(–1010)–(–2110) axis for the patterns in Figure 4.7h and 4.7i in
Figure 4.7j and 4.7k, respectively. In Figure 4.7j, it can be seen that the inner peaks, (0–
110) and (–1010), are more intense than the outer ones, (1–210) and (–2110), confirming
that the region marked by the red dot in Figure 4.7d is monolayer. Conversely, Figure
4.7k shows inner peaks that are less intense than the outer ones, confirming that the area
around the white dot in Figure 4.7d consists of more than one layer. By analysing a large
number of TEM images and their electron diffraction patterns based on the intensity ratio
I{1100}/I{2110}, paying close attention to the uniformity of the flake edges, the flake
thickness statistics could be generated as shown in Figure 4.7l. The distribution of the
number of layers per flakes was obtained by analyzing 3 batches of flakes (first group 97
flakes, second group 50 flakes and third group 50 flakes). The results suggested that about
84% and 6% of the sheets were single- and bi-layered, respectively (Figure 4.7l). Also, it
is rarely (almost 10% of flakes) observed large objects with thickness of more than a few
layers. Thus, the present authors believe that, graphite has been extensively exfoliated to
give monolayer as is obvious in FESEM images as well.
AFM was utilized for the further morphological characterization of the thin-
layered graphene and for the investigation of the thicknesses of the CE-GR and T-GR
flakes. AFM samples were prepared by sonicating CE-GR and T-GR sheets in DMF
without any additives. Figure 4.9 and Figure 4.10 present typical AFM images in which
Univers
ity of
Mala
ya
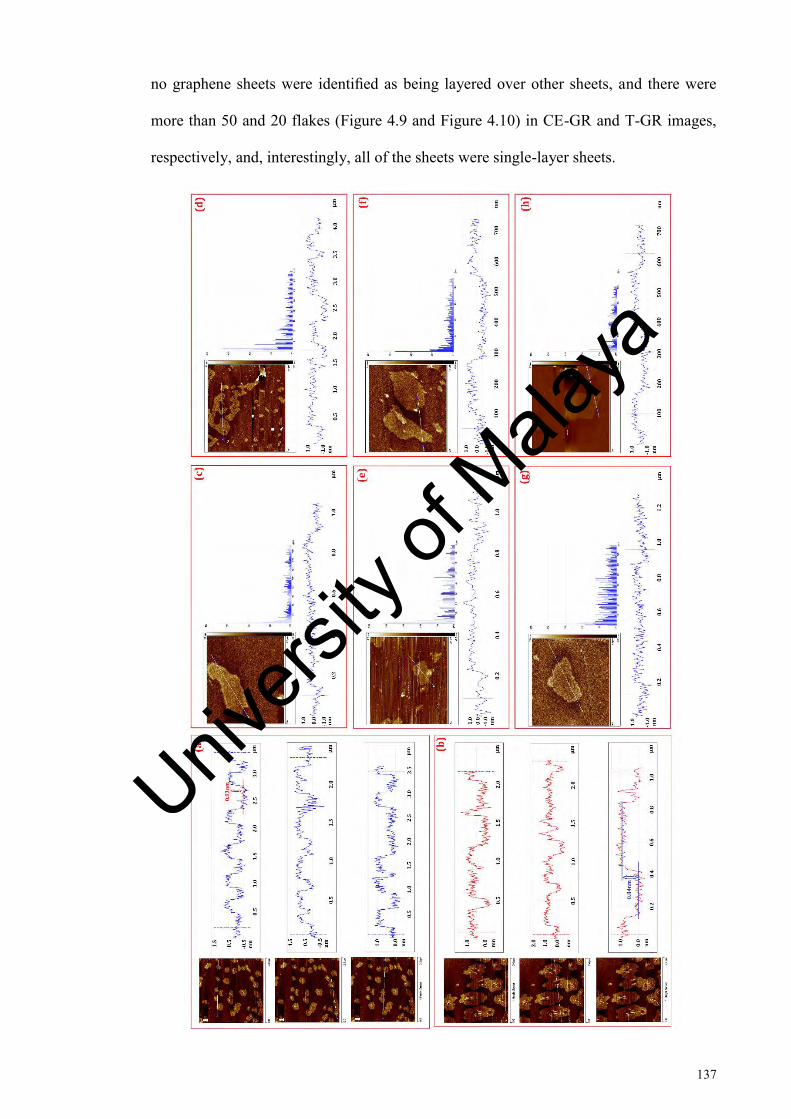
137
no graphene sheets were identified as being layered over other sheets, and there were
more than 50 and 20 flakes (Figure 4.9 and Figure 4.10) in CE-GR and T-GR images,
respectively, and, interestingly, all of the sheets were single-layer sheets.
Univers
ity of
Mala
ya

138
As shown in Figure 4.9 and Figure 4.10, both samples indicated that all of the
sheets had thicknesses of less than 1 nm. With a maximum height of 1 nm in both figures,
the CE-GR and T-GR samples showed the thickness of one layer, which some of them
was decorated with many large and small holes and it is attributed to severe side
functionalization by the electrophilic aromatic substitution under microwave irradiation.
Also, some of flakes shows no big holes. It is worth to note that for energy applications,
some defects or functional groups can be beneficial by representing high specific surface
area.
Figure 4.9: AFM ichnography and cross-section contour of (a, c, d and e) CE-GR and (b, f, g and h) T-GR.
Figure 4.10: AFM ichnography and cross-section contour of (a1&a2) CE-GR and (b) T-GR.
Univers
ity of
Mala
ya

139
To investigate the effects of functionalization and thermal treatment on the
specific surface area of CE-GR and T-GR, N2 adsorption–desorption isotherms were
measured by a surface area analyzer (Quantachrome Autosorb-1 analyzer at 77 K). The
N2 adsorption–desorption isotherms of the CE-GR and T-GR are shown in Figure 4.11
and Table 4.2. The nitrogen adsorption isotherms exhibit a mixture of type IV and type
V with a pronounced hysteresis at a high relative pressure region, implying the presence
of a large number of mesopores in both samples. In addition, CO2 adsorption-desorption
was performed to assess micropores (pores less than 1 nm) in the low-pressure region.
BET analysis indicated that the specific surface area of CE-GR and T-GR were up to 761
and 1559 m2/g, respectively.
Also, the pores in T-GR have a well-defined micro-mesopore size distribution as
shown in Table 4.2, with a huge increase in pore volume (up to 4.53 cm3/g) relative to
CE-GR. This larger specific surface area of T-GR suggests that the introduction of PEG
between the 2D graphene sheets can increase the layer-to-layer stacking to a greater extent
than T-GR or the filled the porous area.
0
200
400
600
800
1000
0 0.2 0.4 0.6 0.8 1
Vol
ume
Ads
orbe
d (c
m3 /g
)
Relative Pressure (P/P0)
T-GR
CE-GR
Figure 4.11: N2-adsorption/desorption of the CE-GR and T-GR.
Table 4.2: Pore structure of the CE-GR and T-GR
Univers
ity of
Mala
ya
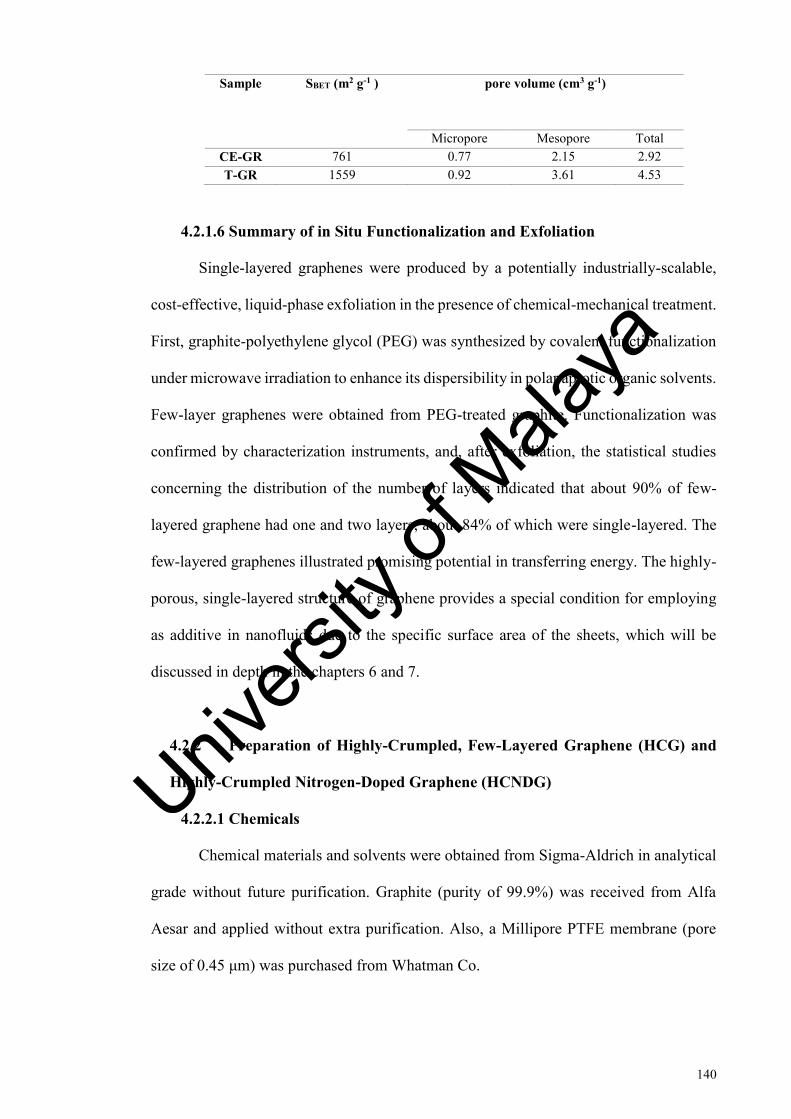
140
Sample SBET (m2 g-1 ) pore volume (cm3 g-1)
Micropore Mesopore Total CE-GR 761 0.77 2.15 2.92 T-GR 1559 0.92 3.61 4.53
4.2.1.6 Summary of in Situ Functionalization and Exfoliation
Single-layered graphenes were produced by a potentially industrially-scalable,
cost-effective, liquid-phase exfoliation in the presence of chemical-mechanical treatment.
First, graphite-polyethylene glycol (PEG) was synthesized by covalent functionalization
under microwave irradiation to enhance its dispersibility in polar aprotic organic solvents.
Few-layer graphenes were obtained from PEG-treated graphite. Functionalization was
confirmed by characterization instruments, and, after exfoliation, the statistical studies
concerning the distribution of the number of layers indicated that about 90% of few-
layered graphene had one and two layers, about 84% of which were single-layered. The
few-layered graphenes illustrated promising potential in transferring energy. The highly-
porous, single-layered structure of graphene provides a special condition for employing
as additive in nanofluids due to the specific surface area of the sheets, which will be
discussed in depth in the chapters 6 and 7.
4.2.2 Preparation of Highly-Crumpled, Few-Layered Graphene (HCG) and
Highly-Crumpled Nitrogen-Doped Graphene (HCNDG)
4.2.2.1 Chemicals
Chemical materials and solvents were obtained from Sigma-Aldrich in analytical
grade without future purification. Graphite (purity of 99.9%) was received from Alfa
Aesar and applied without extra purification. Also, a Millipore PTFE membrane (pore
size of 0.45 μm) was purchased from Whatman Co.
Univers
ity of
Mala
ya
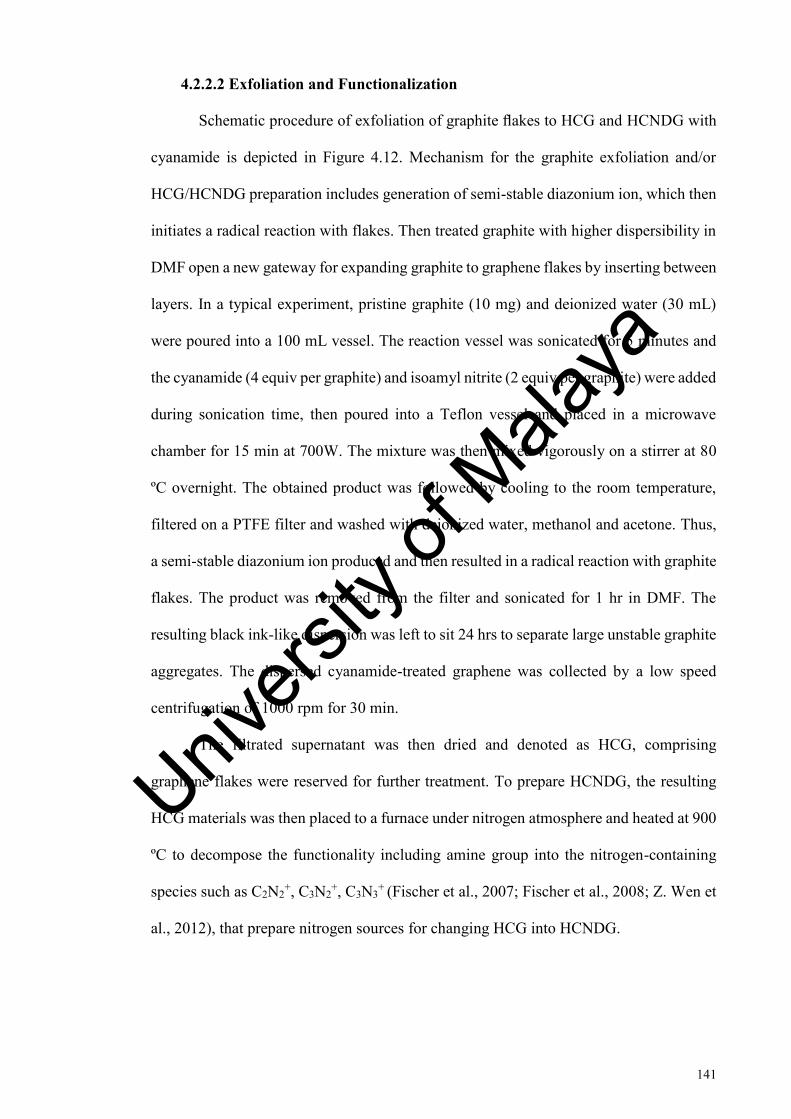
141
4.2.2.2 Exfoliation and Functionalization
Schematic procedure of exfoliation of graphite flakes to HCG and HCNDG with
cyanamide is depicted in Figure 4.12. Mechanism for the graphite exfoliation and/or
HCG/HCNDG preparation includes generation of semi-stable diazonium ion, which then
initiates a radical reaction with flakes. Then treated graphite with higher dispersibility in
DMF open a new gateway for expanding graphite to graphene flakes by inserting between
layers. In a typical experiment, pristine graphite (10 mg) and deionized water (30 mL)
were poured into a 100 mL vessel. The reaction vessel was sonicated for 5 minutes and
the cyanamide (4 equiv per graphite) and isoamyl nitrite (2 equiv per graphite) were added
during sonication time, then poured into a Teflon vessel and placed in a microwave
chamber for 15 min at 700W. The mixture was then mixed vigorously on a stirrer at 80
ºC overnight. The obtained product was followed by cooling to the room temperature,
filtered on a PTFE filter and washed with deionized water, methanol and acetone. Thus,
a semi-stable diazonium ion produced and then resulted in a radical reaction with graphite
flakes. The product was removed from the filter and sonicated for 1 hr in DMF. The
resulting black ink-like dispersion was left to sit 24 hrs to separate large unstable graphite
aggregates. The dispersed cyanamide-treated graphene was collected by a low speed
centrifugation of 1000 rpm for 30 min.
The filtrated supernatant was then dried and denoted as HCG, comprising
graphene flakes were reserved for further treatment. To prepare HCNDG, the resulting
HCG materials was then placed to a furnace under nitrogen atmosphere and heated at 900
ºC to decompose the functionality including amine group into the nitrogen-containing
species such as C2N2+, C3N2
+, C3N3+ (Fischer et al., 2007; Fischer et al., 2008; Z. Wen et
al., 2012), that prepare nitrogen sources for changing HCG into HCNDG.
Univers
ity of
Mala
ya

142
4.2.2.3 Results and Discussion
First, highly-crumpled graphene (HCG) and nitrogen-doped graphene (HCNDG)
were synthesized with a low-cost and efficient approach. Then, both HCG and HCNDG
materials were analyzed in terms of surface area, structure and morphology to investigate
the exfoliation and functionalization yield.
4.2.2.4 Functionality
Figure 4.13 presents the Fourier transform infrared spectroscopy spectra of HCG
and HCNDG. While there is no cue of functional groups in pristine graphite, it can be
seen that both of the HCG-based and HCNDG-based samples illustrate significant peaks
in their spectra. The FT-IR spectrum of HCG shows two new peaks at 1151 and 2268 cm-
1, which were attributed to the C–N and C≡N stretching vibrations on the HCG generated
by the attachment of the -C≡N chain of cyanamide during the diazonium treatment. Also,
the peak at 3436 cm-1 can be assigned to N-H stretching vibration. For HCNDG, the peak
at 1151 cm-1, corresponding to the stretching vibration of C-N, shifted to 1193 cm-1. More
importantly, the peak at 1550 cm-1 was associated with the stretching vibrations of C=N,
Figure 4.12: The experimental procedure for exfoliation of graphite and synthesizing HCG and HCNDG.
Univers
ity of
Mala
ya

143
which provided evidence of the doping of nitrogen atoms into the HCG framework. In
addition, two other peaks, one at 2851 cm−1 and one at 2921 cm−1, are consistent with the
sp3 C−H and sp2 C−H, respectively, which resulted from hydrogenation at the edges and
the size reduction. It can be seen that the peaks at 3436 and 2268 cm-1, which were
attributed to the C≡N and N-H stretching vibrations, respectively, were removed in the
FT-IR spectrum of the HCNDG after heating at 900 ºC. However, the new peak at 1550
cm-1 that was associated with the stretching vibrations of C=N was a suitable substitute
for above-mentioned groups.
Raman characterization is a strong measurement for analyzing structure, sp2 and
sp3 hybridized carbon atoms in carbon-based nanomaterials, functionalization, and
exfoliation by following alterations in hole and electron doping (Das et al., 2008; DasA
et al., 2008; L. Feng et al., 2013). The Raman spectra of the pristine graphite, HCG, and
HCNDG are presented in Figure 4.13, panel (b). While the pristine graphite is weak in
terms of D intensity, the fairly strong D, G and 2D bands in the HCG and HCNDG
samples can be seen at 1351, 1578, and 2699 cm–1, respectively. The ratio of the
intensities of the D-band to those of the G-band (ID/IG) was considered to be the amount
of disordered carbon (sp3-hybridized carbon) relative to graphitic carbon (sp2-hybridized
carbon). In edge-functionalization and/or nitrogen doping studies of graphene, the higher
intensity ratio of ID/IG indicates the higher disruption of aromatic π-π electrons, implying
partial damage of the graphitic carbon produced by expansion and/or doping (Lv et al.,
2009). The ID/IG ratio of HCG was relatively higher than that of pristine graphite, which
confirmed the successful functionalization via a diazonium reaction under microwave
irradiation. Also, the Raman results of HCNDG showed a higher ID/IG ratio than that of
the pristine graphite as well as HCG, implying that the N-doping procedure was
performed. Also, the G and 2D peaks in the spectra of HCG and HCNDG retained their
Univers
ity of
Mala
ya

144
intensities after the diazoniation, which confirmed that the quality of the graphene layers
was preserved.
Obviously, Raman spectroscopy can distinguish a single layer from a few layers
by focusing on the shape, size, and intensity of the 2D bands (Ferrari et al., 2006;
Hernandez et al., 2008). According to the results of Ferrari et al. (Ferrari et al., 2006), as
the layer of graphene increases, the 2D band becomes much broader and up-shifted.
Accordingly, a noticeable change in sizes, shapes, and intensities of the 2D peaks of HCG
and HCNDG are observed clearly as compared with the pristine graphite. It can be seen
that the 2D band of the pristine graphite includes a coupled peak, i.e., D1 and D2 peaks,
which produced a broad peak (Ferrari et al., 2006; Hernandez et al., 2008). However,
single, sharp 2D peaks were shown in the Raman spectra of HCG and HCNDG. This
change in the 2D bands observed in the treated samples potentially verified the presence
of single layered- or few layered- graphene and nitrogen-doped graphene.
The nature and amount of nitrogen-containing groups in pristine graphite, HCG,
and HCNDG were studied by X-ray photoelectron spectroscopy (XPS), which are
illustrated in Figure 4.14a. The survey spectra of HCG and HCNDG have C1s at around
286 eV, N 1s at 399eV, and O1s at 530 eV. Based on the results, all samples present a
Figure 4.13: (a) FTIR and (b) Raman spectra of the pristine graphite, HCG and HCNDG.
Univers
ity of
Mala
ya

145
very small amount of oxygen, and pristine graphite doesn’t illustrate any nitrogen
molecule in its structure. Upon exfoliation and functionalization, the intensity of the N 1s
peak increased considerably. The cyanamide functionalities (especially the C≡N chain)
may explain the higher content of nitrogen in the HCG sample. More interestingly, the
amount of nitrogen in HCNDG presents a similar result with HCG after thermal treatment
in a nitrogen atmosphere. The insignificant decrease in the N component which was
obtained after thermal treatment in the nitrogen atmosphere was in agreement with the
FTIR, Raman, C 1s, and N 1s results.
Figure 4.14, panels (b) and (c), present the XPS C1s spectra of HCG and HCNDG,
respectively. Both HCG and HCNDG mainly had peaks around 284.6 eV, which
corresponded to the C–C/C=C network. Although the intensity of the oxygen element is
insignificant, the minor O component in HCG and in HCNDG presents two peaks in the
form of the C=O and O–C= O groups at around 286.8 and 288.5 eV, respectively. Also,
the C–N peak centered at 285.6 eV was observed in both the HCG and HCNDG spectra.
The N 1s spectrum of HCG (Figure 4.14d) composed of two peaks at about 399.2
and 401.8 eV, which would be assigned the bonding configurations of amine functional
groups and C≡N or that was detected by FTIR discussed above. However, Figure 4.14e
(HCNDG spectrum) shows an asymmetric N1s spectrum, which can be decomposed into
four peaks, i.e., pyridinic N (~ 398.5 eV), pyrrolic N (~ 399.8 eV), graphitic N (~ 401
eV), and N-oxides of pyridinic N (~402.1 eV). Interestingly, the functional groups,
including the nitrogen groups in HCG, change into more thermally-stable graphitic N
after annealing, as illustrated in Figure 4.14e.
Univers
ity of
Mala
ya

146
The distributions of the content of N species and their interpretation are presented
in Table 4.3. The elemental analysis showed that the nitrogen weight content in the
resulting HCG and after annealing (HCNDG) at 900 ºC were 17.57% N and 10.32 % N,
respectively.
Materials C% N% N/C Pyridinic N Pyrrolic N Graphitic N N-oxides of pyridinic N
HCG 69.13
17.56
0.254 --- --- --- ---
HCNDG 79.75
10.32
0.129
4.12
4.72
0.81
0.67
4.2.2.5 Morphological Study
Figures 4.15a-d show the SEM images of highly-crumpled, few-layered graphene
and exfoliated HCG, which were achieved by using a diazonium reaction under
microwave irradiation along with physical cracking by a sonicator, demonstrating a
noticeable reduction in thickness. The proposed method is able to expand the graphite
layers swiftly by initiating a semi-stable diazonium ion and radical reaction with layers.
The SEM images of HCG (Figures 4.15a-d) showed homogenous, crumpled structures.
Figure 4.14: (a) XPS survey spectra of pristine graphite, HCG and HCNDG, High-resolution C 1s spectra of (b) HCG and (c) HCNDG, N1s spectra of (d) HCG and (e)
HCNDG.
Table 4.3: The content distributions of N species in HCG and HCNDG.
Univers
ity of
Mala
ya

147
Such a worm-like surface, with crumpled and curved sheets, was due to strict
functionalization and nitrogen impurity. The HCNDG (Figures 4.15e-h) also showed the
distinct, crumpled structures with 2D geometry, as did HCG. The crumpled structures of
HCNDG were attributed to nitrogen doping (Z. Wen et al., 2012). More evidence of this
is presented by transmission electron microscopy (TEM) and atomic force microscopy
(AFM) in the following section.
Figure 4.16 shows the TEM images and select area electron diffraction (SAED)
patterns of HCG and HCNDG. Figures 4.16a and 4.16b show the TEM images of HCG,
in which the crumpled structure can be distinguished. This figure shows a large number
of few-layered graphene nanosheets with wrinkled morphology and folded edges. Figures
4.16 c-e show the TEM images of the HCNDG sample, which was comprised of a few-
layered graphene with wrinkled morphology and folded edges. A set of highly-crumpled,
individual graphene flakes with suitable transparency and without observable graphite
crystalline structure in Figures 4.16a-e confirmed that these wrinkles resulted from the
crumpling of graphene rather than stacking, which is in agreement with the sharp 2D
bands in the Raman spectra. As further evidence, the crystalline structures of HCG and
HCNDG were verified by selected area electron diffraction (SAED), as shown in Figures
4.16f and 4.16g, respectively. Selected area electron diffraction (SAED) of both samples
Figure 4.15: SEM images of (a-d) HCG and (e-h) HCNDG.
Univers
ity of
Mala
ya
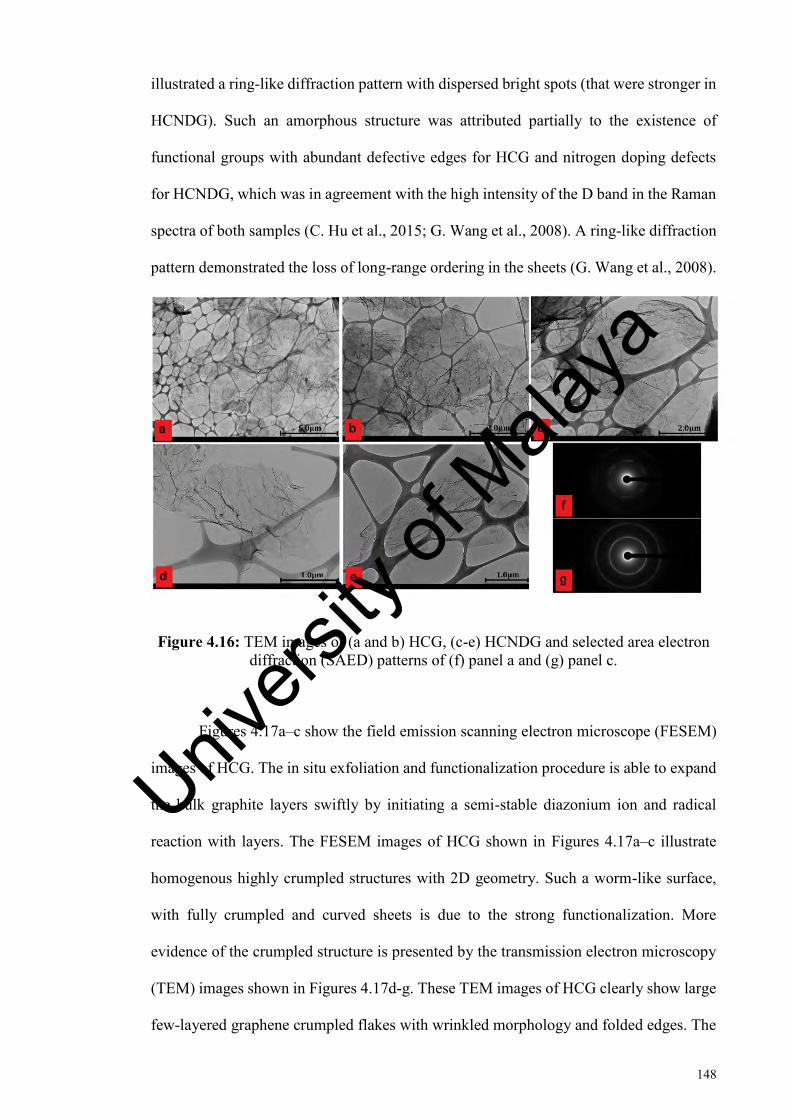
148
illustrated a ring-like diffraction pattern with dispersed bright spots (that were stronger in
HCNDG). Such an amorphous structure was attributed partially to the existence of
functional groups with abundant defective edges for HCG and nitrogen doping defects
for HCNDG, which was in agreement with the high intensity of the D band in the Raman
spectra of both samples (C. Hu et al., 2015; G. Wang et al., 2008). A ring-like diffraction
pattern demonstrated the loss of long-range ordering in the sheets (G. Wang et al., 2008).
Figures 4.17a–c show the field emission scanning electron microscope (FESEM)
images of HCG. The in situ exfoliation and functionalization procedure is able to expand
the bulk graphite layers swiftly by initiating a semi-stable diazonium ion and radical
reaction with layers. The FESEM images of HCG shown in Figures 4.17a–c illustrate
homogenous highly crumpled structures with 2D geometry. Such a worm-like surface,
with fully crumpled and curved sheets is due to the strong functionalization. More
evidence of the crumpled structure is presented by the transmission electron microscopy
(TEM) images shown in Figures 4.17d-g. These TEM images of HCG clearly show large
few-layered graphene crumpled flakes with wrinkled morphology and folded edges. The
Figure 4.16: TEM images of (a and b) HCG, (c-e) HCNDG and selected area electron diffraction (SAED) patterns of (f) panel a and (g) panel c.
Univers
ity of
Mala
ya

149
TEM images in the figures show no observable graphite crystalline structure, which is in
agreement with the sharp 2D bands in the Raman spectrum of HCG. As further evidence,
the crystalline structure of HCG was confirmed via selected area electron diffraction
(SAED), as shown in Figures 4.17 panels (h) and (i). Figure 4.17 panel (h) shows the
normal-incidence electron diffraction pattern of the flake in Figure 4.17f, taken with beam
position close to the white dot in this figure.
Figure 4.17i shows the normal-incidence selected-area diffraction patterns for the
flake in Figure 4.17g, taken with beam position close to the red dot. In one of the cases,
the patterns show the typical six-fold symmetry expected for graphite/graphene (J. C.
Meyer et al., 2007), allowing labeling the peaks with the Miller–Bravais (hkil) indices (J.
C. Meyer et al., 2007). Also, the hexagonal patterns are similar to those in reported by
Figure 4.17: (a-c) FESEM images and (d-g) TEM images of HCG; (h and i) selected area electron diffraction (SAED) patterns of white point in panel (f) and red point in
panel (g). Univers
ity of
Mala
ya
150
other researches (Hamilton et al., 2009; Khan, O'Neill, et al., 2010) for single-layer and
few layer graphene.
In another case, selected area electron diffraction of the HCG sample also shows
a ring-like diffraction pattern with the dispersed bright spots. Such an amorphous
structure was attributed partially to the presence of functional groups with abundant
defective edges for HCG, which is in agreement with the high intensity D band in the
Raman spectrum of HCG sample (C. Hu et al., 2015; G. Wang et al., 2008). A ring-like
diffraction pattern suggests the loss of long-range ordering in the sheets (G. Wang et al.,
2008).
AFM was used for the further morphological characterization of the thin-layered
HCG and HCNDG for the investigation of the thicknesses of the flakes in the final
product. AFM samples were prepared by sonicating HCG and HCNDG sheets in ethanol
for two minutes in a bath sonicator without any additives. Figure 4.18 shows typical AFM
images of HCG and HCNDG in which one highly-crumpled sheet was investigated, and,
interestingly, the other sheets were mostly few-layered, which is in agreement with the
sharp 2D bands of the Raman results and XRD results (Appendix B). As shown in Figure
4.18, the sheets had mostly the thicknesses of about 1 nm, which can be considered to be
the thickness of one layer, including the wrinkled morphology.
Univers
ity of
Mala
ya

151
Figure 4.18: AFM ichnography and cross-section contour of (a) HCNDG and (b and c) HCG.
Univers
ity of
Mala
ya

152
To investigate the effects of exfoliation and functionalization on the specific
surface area of HCG and HCNDG, N2 adsorption–desorption isotherms were measured
by a surface area analyzer (Quantachrome Autosorb-1 analyzer at 77 K). The N2
adsorption–desorption isotherms of the HCG and HCNDG are illustrated in Figure 4.19
and Table 4.4. The comparison between the BET results of this study and previous studies
(Jeong et al., 2011; Z. Wen et al., 2012) of graphene materials showed a significant
increase in the specific surface area. Also, it can be seen that the N2 adsorption amount
of the HCNDG was greater than that of HCG. The specific surface area of HCNDG after
annealing at the high temperature of 900 ºC was 1689 m2 g-1, but that of HCG was just
1568 m2 g-1. This lower specific surface area of HCG suggested that the introduction of
functional groups between the 2D graphene sheets can fill the porous area. By looking at
the dependence of thermal conductivity of nanofluids on the specific surface area (W.
Sarsam et al., 2016a), the HCG and HCNDG with appropriate surface area can be the
suitable candidates for fabricating graphene-based nanofluids. Note that the highly
crumpled nature of the samples can be an advantageous property for preparing highly
conductive nanofluids.
02468
101214161820
0.000 0.200 0.400 0.600 0.800 1.000
Nitr
ogen
Ads
orbe
d (c
m3 .g
-1)
Relative Pressure (P/P0)
a
Univers
ity of
Mala
ya

153
Sample SBET (m2 g-1 ) Total pore volume (cm3 g-1)
Pristine Graphite
85 0.3
HCG 1568 1.33 HCNDG 1689 1.39
0
100
200
300
400
500
600
700
0.000 0.200 0.400 0.600 0.800 1.000
Nitr
ogen
Ads
orbe
d (c
m3 .g
-1)
Relative Pressure (P/P0)
c
Figure 4.19: N2-adsorption/desorption of (a) the pristine graphite, (b) HCG and (c) HCNDG.
Table 4.4: Pore structure of the HCG and HCNDG.
0
100
200
300
400
500
600
700
800
0.000 0.200 0.400 0.600 0.800 1.000
Nitr
ogen
Ads
orbe
d (c
m3 .g
-1)
Relative Pressure (P/P0)
b
Univers
ity of
Mala
ya

154
4.2.3 Preparation of Crumpled Nitrogen-Doped Graphene (CNDG)
4.2.3.1 Material and Methods
To prepare CNDG, first graphene oxide (GO) was prepared by using Hummers
method (Z. Wen et al., 2012). Typically, 10.0 ml cyanamide (NH2CN) was poured into
100 ml GO solution (1 mg/ml) under stirring. The obtained solution was then heated at
90 °C until completely dry, which followed by a reaction between oxygen-containing
groups in GO and amine groups in cyanamide to form amides and/or alkylammonium
ions via ring-opening aminations of epoxides. Due to the electrostatic interactions
between negatively charged GO and positively charged cyanamide during drying, the rest
of NH2CN was deposited on the GO surface. The obtained product (GO-NH2CN) was
then placed into a furnace and heated at 400 °C to induce the polymerization of
cyanamide. As forming a thin C3N4 polymer layer on the surface of the GO, the
calcination temperature was set at 900 °C for the production of CNDG (Z. Wen et al.,
2012). After drying, in the case of preparing coolants, the CNDG was weakly dispersible
in both media of deionized water and ethylene glycol at room temperature. So, to provide
better dispersion with known weight concentrations, the given amount of CNDG was
mixed with Gum Arabic by a ratio of 0.5:1 and then poured into a vessel filled with the
given amount of water and ethylene glycol with a volumetric ratio of 40:60.
4.2.3.2 Functionalization Analysis
As mentioned above, Raman characterization is a strong measurement for analyzing
structure, sp2 and sp3 hybridized carbon atoms in carbon based nanomaterials,
functionalization and exfoliation by following alterations in hole and electron doping
(Gharehkhani et al., 2015; Seyed Shirazi et al., 2015; Yarmand et al., 2015). The Raman
spectrum of the CNDG is illustrated in Figure 4.20a. Strong D and G bands in CNDG
sample can be seen at 1346 cm–1 and 1588 cm–1, respectively. The ratio of the intensities
Univers
ity of
Mala
ya

155
of the D-band to the G-band (ID/IG) is considered to be the amount of disordered carbon
(sp3-hybridized carbon) relative to graphitic carbon (sp2-hybridized carbon). The ID/IG
ratio of CNDG material represents a high intensity ratio of 1.28, indicating the high
disruption of aromatic π-π electrons and partial damage of graphitic carbon with N-doping
(Lv et al., 2009). In addition, the 2D-band peak, which is characteristic for multi-layer
graphene structures, can be hardly observed. The 2D peak suggest the defective structure
of graphene due to N doping (Kudin et al., 2008).
The nature and amount of nitrogen-containing groups in CNDG was studied by X-ray
photoelectron spectroscopy (XPS), which is illustrated in Figure 4.20b. The survey
spectrum of CNDG has C1s at around 285 eV, N1s at 399 eV and O1s at 530 eV. The
high resolution XPS of N1s spectrum of the CNDG (Figure 4.20c) reveals an asymmetric
N1s spectrum, which can be decomposed into four peaks, including pyridinic N (ca. 397.7
eV), pyrrolic N (ca. 399.2 eV), graphitic N (ca. 400.1 eV) and N-oxides of pyridinic N
(401.8). XPS results confirms the presence of N doping and is in good agreement with
Raman results. Also, N 1s results confirms the presence of three common bonding
configurations.
Univers
ity of
Mala
ya

156
0 200 400 600 800 1000
Inte
nsi
ty
Binding Energy (ev)
(b)
C1s
N1sO1s
Figure 4.20: (a) Raman spectrum (b) XPS spectrum of and (c) high-resolution N 1s Spectra of CNDG.
0 500 1000 1500 2000 2500 3000
Inte
nsi
ty (
a.u
.)
Raman Shift (cm-1)
(a)
Univers
ity of
Mala
ya

157
4.2.3.3 Morphological Study
Figure 4.21 illustrates the transmission electron microscopy (TEM) images of
CNDG. Figure 4.21a and 4.21b show the TEM images of GO-C3N4 and CNDG,
respectively. The GO-C3N4 sample was prepared by adding 4.0 ml of cyanamide in 20 ml
GO solution. First, a thin thickness of C3N4 polymer is obvious on the surface of all GO
flakes, revealing that the reaction between GO and cyanamide was completely successful
(Z. Wen et al., 2012). After annealing at 900 °C and/or N doping, TEM image of the
CNDG with crumpled structure can be observed. Figure 4.21b shows a CNDG nanosheet
with wrinkled morphology and folded edges, which confirms that these wrinkles are
resulted from the crumpling of graphene as well as stacking.
Also, N2 adsorption–desorption isotherms were measured by a BET surface area
analyzer at 77 K. The N2 adsorption–desorption isotherms of the CNDG is illustrated in
Figure 4.22. The CNDG has the high specific surface area of 1175 m2g−1, total pore
volume of 1.11 cm3g-1 and average pore diameter of 2.93 nm. This high specific surface
area of CNDG can be suggested for preparing coolant based recent researches results.
Figure 4.21: TEM image of (a) forming C3N4 polymer layers on the surface of the GO (b) CNDG.
Univers
ity of
Mala
ya

158
4.2.4 Synthesis of Ethylene Glycol-Treated Graphene Nanoplatelets
4.2.4.1 Functionalization Procedure
Figure 4.23 illustrates the experimental procedure for chemical-assisted
functionalization of graphene nanoplatelets (GNP) with ethylene glycol (EG). In a typical
experiment, the pristine GNP (0.5 g) and AlCl3 (9.27 g) were first poured into a planetary
ball-mill container, fixed and agitated at 500 rpm for 1h. The resultant mixture was then
transferred into a Teflon vessel filled with 80 ml of anhydrous EG and sonicated for 15
min with a probe-sonicator to attain a relatively homogeneous suspension. The
concentrated hydrochloric acid (1 ml) was added drop by drop into the vessel over
sonication time. The suspension was then sealed and placed in an industrial microwave
(Milestone MicroSYNTH programmable microwave system), followed by irradiating at
150 °C for 15 min. The reaction mixture was subsequently filtered through a PTFE
membrane and followed by washing with abundant DI water to eliminate any unreacted
materials and then dried for 48 h at 50 °C. The EG-treated GNP was much more soluble
in both water and EG than the pristine GNP. The easily-miscible EG functionalities can
0
100
200
300
400
500
600
700
800
900
1000
0.E+00 2.E-01 4.E-01 6.E-01 8.E-01 1.E+00
Vo
lum
e a
dso
rbe
d (
cm3g
-1)
Relative Pressure (P/P0)
0
0.5
1
1.5
2
2.5
3
0 5 10 15 20
Rel
ativ
e p
ore
vo
lum
e (c
m3g-1
)
Pore diameter (nm)
Figure 4.22: N2 sorption isotherms, (insert figure) pore size distribution of the CNDG nanosheets.
Univers
ity of
Mala
ya
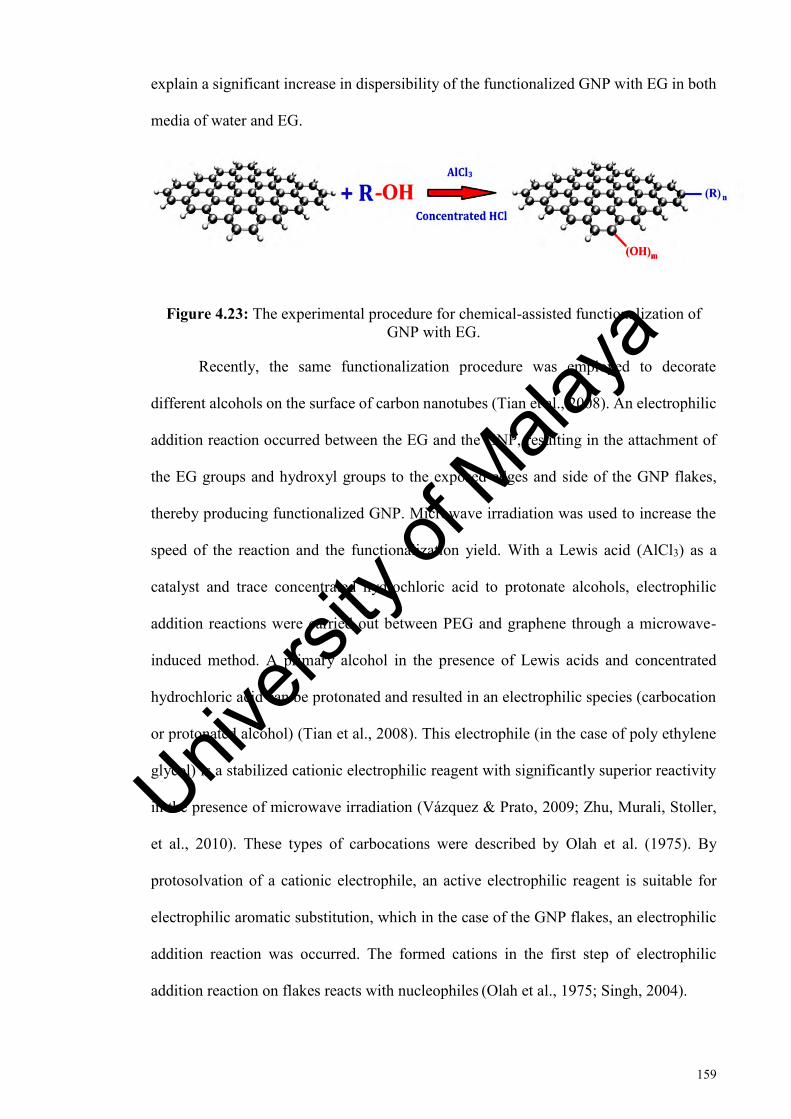
159
explain a significant increase in dispersibility of the functionalized GNP with EG in both
media of water and EG.
Recently, the same functionalization procedure was employed to decorate
different alcohols on the surface of carbon nanotubes (Tian et al., 2008). An electrophilic
addition reaction occurred between the EG and the GNP, resulting in the attachment of
the EG groups and hydroxyl groups to the exposed edges and side of the GNP flakes,
thereby producing functionalized GNP. Microwave irradiation was used to increase the
speed of the reaction and the functionalization yield. With a Lewis acid (AlCl3) as a
catalyst and trace concentrated hydrochloric acid to protonate alcohols, electrophilic
addition reactions were carried out between PEG and graphene through a microwave-
induced method. A primary alcohol in the presence of Lewis acids and concentrated
hydrochloric acid can be protonated and resulted in an electrophilic species (carbocation
or protonated alcohol) (Tian et al., 2008). This electrophile (in the case of poly ethylene
glycol) is a stabilized cationic electrophilic reagent with significantly superior reactivity
in the presence of microwave irradiation (Vazquez & Prato, 2009; Zhu, Murali, Stoller,
et al., 2010). These types of carbocations were described by Olah et al. (1975). By
protosolvation of a cationic electrophile, an active electrophilic reagent is suitable for
electrophilic aromatic substitution, which in the case of the GNP flakes, an electrophilic
addition reaction was occurred. The formed cations in the first step of electrophilic
addition reaction on flakes reacts with nucleophiles (Olah et al., 1975; Singh, 2004).
Figure 4.23: The experimental procedure for chemical-assisted functionalization of GNP with EG.
Univers
ity of
Mala
ya

160
Also, the reaction intensifies under microwave irradiation. When carbon
nanostructures are exposed to microwaves, strong absorptions are obtained, which
producing intense heating. Although the utilization of microwaves for the activation of
carbon nanostructures has not been fully explored, the strong absorptions can open the
door to the similar electrophilic addition reactions (W. Lin et al., 2010; Vázquez & Prato,
2009). In addition, the edges of the GNP flakes were more available for reaction with the
functional groups than the basal plane surfaces.
4.2.4.2 Functionalization Analysis
To analyze functional groups, various characterizations methods such as FTIR
and Raman spectroscopy as well as TGA were employed. Also, the morphology/structure
of EG treated GNP was studied by TEM. FTIR was employed to investigate chemical
groups which attached to the GNP. Figure 4.24a illustrates the FTIR spectra of EG-treated
GNP as well as a pristine sample. In contrast to the pristine sample, EG-treated GNP
demonstrates low infrared absorption intensities as the cues of EG molecules. Two broad
peaks at 3486 and 1141 cm-1 are consistent, respectively, with the O–H and C–O
stretching vibrations. These peaks could be due to the reaction of one of the hydroxyl
groups of EG with GNP and/or the attached hydroxyl groups on the GNP. The peak at
1592 cm-1 is related to the C=C graphitic stretching mode of GNP, which is infrared-
activated by functionalization. A couple of peaks at the ranges of 2850–3000 cm−1 and a
peak at 1403 cm-1 are consistent, respectively, to the stretching and in-plane bending
vibrations of the C–H bond. Based on the results of FTIR, the alkyl and hydroxyl groups
are successfully attached to the GNP material through an electrophilic addition reaction
under microwave irradiation (Kalinina et al., 2011b; Mehdi Shanbedi et al., 2013; Zardini
et al., 2012; Zardini et al., 2014).
As extra evidence, Raman spectra can provide fundamental information to
evaluate the modification and functionalization of GNP. Figure 4.24b is shown the Raman
Univers
ity of
Mala
ya
161
spectra of the pristine and EG-treated GNP, which illustrates the amorphous/disorder (D
mode) and tangential (G mode) bonds at 1346 and 1573 cm-1. The D band is commonly
attributed to the amorphous (sp3) carbon, is due to disruption of aromatic π-electrons, and
G band is related to the graphitic carbon (sp2)(Zardini et al., 2012; Zardini et al., 2014).
It can be seen that the intensity ratios of the D–G band (ID/IG) is larger than that of pristine
sample, indicating some sp2 hybridized carbons changed to the sp3 hybridization. Raman
spectra can be considered as one of the strongest evidence for studying covalent
functionalization (Tian et al., 2008), which provided a strong confirmation from the
results.
TGA (Figure 4.24c) traces of the pristine and EG-treated GNP provide more
evidence about functionalization by thermal analysis of samples (Zare‐Zardini et al.,
2015b). While there is no significant weight loss in the trace of pristine GNP, a steady
weight loss between 140 and 500 °C is seen in the EG-treated GNP trace, confirming the
decomposition of the functional groups. Also, the obtained results indicate that the
functionalization of GNP with EG is successful, since a steady weight loss observed in
EG-treated GNP curve. As expected, the EG-treated GNP can easily disperse in a mixture
of water-EG as a base-fluid (Figure 4.24d), pointing to the easily-miscible EG
functionalities. EG as a functional group, not only provide suitable dispersibility, but also
synthesized coolant suspension which has no corrosive function for different metals or
engines.
Univers
ity of
Mala
ya

162
4.2.4.3 Morphological Study
Figure 4.25 shows the TEM images of the pristine GNP and EG-treated GNP.
TEM Image of the pristine GNP (Figure 4.25a) demonstrate two flakes with relatively
smooth layer’s surface and edge. Although TEM images for the EG-treated GNP (Figure
4.25b) could not distinguish minute functional groups, surface deterioration and wrinkles
of the GNPs that formed as a result of covalent functionalization with EG, which could
clearly have been observed. The lines seen in the TEM images are wrinkles on the GNP
surface due to the inherent instability of 2D structures. The increase of these lines after
functionalization can be attributed to the enhancement of wrinkles (waviness) during the
sonication and microwave procedures, resulting from the flexibility of GNP flakes after
treatment or higher wettability of flakes (Q. Zhang et al., 2013). Obviously, higher
tendency for wrinkling indicates an increase in the wettability of GNP’s surface due to
Figure 4.24: (A) FTIR spectra, (B) Raman spectra, (C) thermogravimetric analysis of the pristine and EG-treated GNP and (D) photographs of EG-treated GNP dispersed in
water-EG after 1 month.
Univers
ity of
Mala
ya
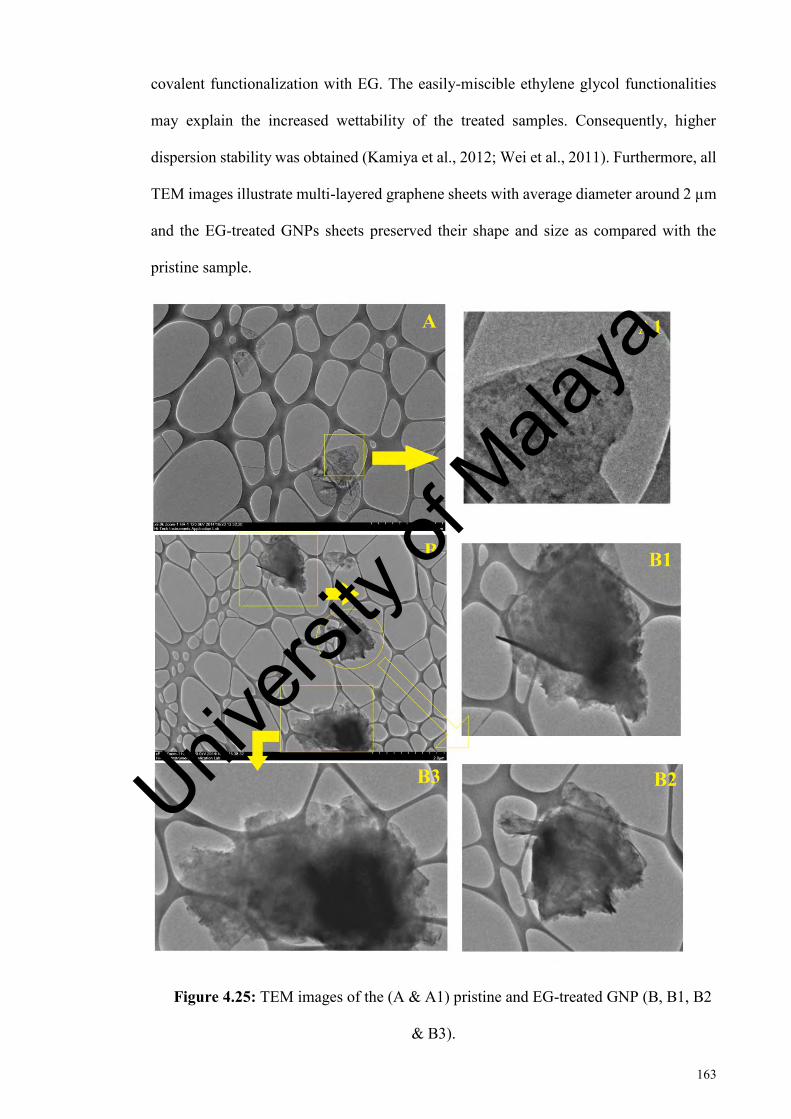
163
covalent functionalization with EG. The easily-miscible ethylene glycol functionalities
may explain the increased wettability of the treated samples. Consequently, higher
dispersion stability was obtained (Kamiya et al., 2012; Wei et al., 2011). Furthermore, all
TEM images illustrate multi-layered graphene sheets with average diameter around 2 µm
and the EG-treated GNPs sheets preserved their shape and size as compared with the
pristine sample.
Figure 4.25: TEM images of the (A & A1) pristine and EG-treated GNP (B, B1, B2
& B3).
Univers
ity of
Mala
ya
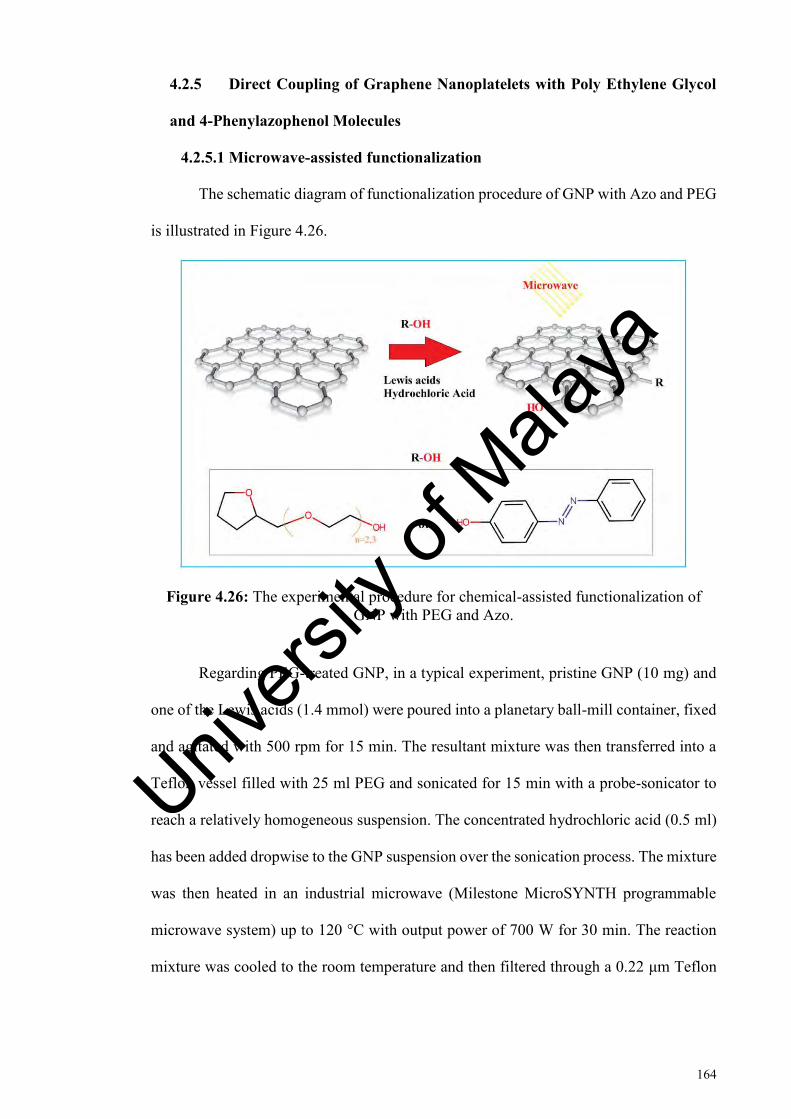
164
4.2.5 Direct Coupling of Graphene Nanoplatelets with Poly Ethylene Glycol
and 4-Phenylazophenol Molecules
4.2.5.1 Microwave-assisted functionalization
The schematic diagram of functionalization procedure of GNP with Azo and PEG
is illustrated in Figure 4.26.
Regarding PEG-treated GNP, in a typical experiment, pristine GNP (10 mg) and
one of the Lewis acids (1.4 mmol) were poured into a planetary ball-mill container, fixed
and agitated with 500 rpm for 15 min. The resultant mixture was then transferred into a
Teflon vessel filled with 25 ml PEG and sonicated for 15 min with a probe-sonicator to
reach a relatively homogeneous suspension. The concentrated hydrochloric acid (0.5 ml)
has been added dropwise to the GNP suspension over the sonication process. The mixture
was then heated in an industrial microwave (Milestone MicroSYNTH programmable
microwave system) up to 120 °C with output power of 700 W for 30 min. The reaction
mixture was cooled to the room temperature and then filtered through a 0.22 μm Teflon
Figure 4.26: The experimental procedure for chemical-assisted functionalization of GNP with PEG and Azo.
Univers
ity of
Mala
ya

165
membrane. The filter cake was thoroughly washed with DMF and abundant deionized
water to remove any unreacted materials and then dried under vacuum at 50 °C.
The same procedure is carried out for the functionalization of Azo. However,
since Azo is solid in the room temperature, it was first sonicated in THF (25 ml) for
30 min at 60 °C. The used amount of this precursor was as same as the molar equivalent
of Azo. Since Azo did not react with GNP at 120 °C, its treatment temperature in the
microwave chamber was increased to 180 °C. Also, since different kinds of Lewis acids
can demonstrate the different degree of functionalization, four catalysts of ZnCl2, FeCl2,
TiCl4and AlCl3 have been employed and their performance have been compared.
4.2.5.2 Functionalization Analysis
In different applications of GNP, the covalent functionalization of GNP with Azo
and PEG were commonly reported. Here, Tetrahydrofurfuryl polyethylene glycol and 4-
phenylazophenol which are the monofunctional oligomers were used in order to prevent
cross-linking between the GNP flakes. Noteworthy, PEG was also used, which has been
utilizing as one of the base materials in the biomedical applications. Also, Azo-treated
GNP has several promising properties in charge transfer and preparing long-term solar
thermal storage. To realize this issue, a green, cheap and fast technique (microwave)
should be developed to enhance the degree of functionalization and decrease the time of
interaction and defects. Thus, after functionalization with molecules including hydroxyl
(-OH), GNP samples were characterized by FTIR spectroscopy, TGA and Raman
spectroscopy. Also, several simple Lewis acids catalyzed the reaction and their
effectiveness for the functionalization process has been reported. Microwaves irradiation
has also been employed in the direct coupling reaction and producing hot sites on the
surface of GNP in the presence of metallic catalysts.
Univers
ity of
Mala
ya

166
4.2.5.2.1 FTIR
The covalent functionalization, which had been occurred through the formation
of an electrophilic addition reaction between the GNP and PEG and/or Azo, was
investigated by FTIR spectroscopy. To complete the reaction, four catalysts of ZnCl2,
FeCl2, TiCl4 and AlCl3 were applied separately. Figure 4.27 shows the FT-IR spectra of
pristine GNP, PEG-treated GNP and Azo-treated GNP in the presence of ZnCl2.
Figure 4.27: FTIR spectra of the pristine GNP as well as PEG- and Azo-treated GNP in the presence of ZnCl2.
Univers
ity of
Mala
ya

167
In contrast to the pristine GNP, Azo/PEG-treated GNP shows the cues of different
molecules on the main structures. The spectrum of treated GNP with PEG represents a
peak at 1122 cm−1, which could be attributed to the C O stretching vibrations. Also,
another weak peak centered on 1385 cm−1 is attributable to the CH2 bending vibration.
The board peak at 3442 cm−1 is in agreement with stretching vibration of O H. The peaks
at the range of 2850–2918 cm−1 corresponds to the C H stretching vibration (Zardini et
al., 2014). The deformation vibration of the CH2 group provides a peak at 1460 cm−1
(Kalinina et al., 2011a).
Regarding Azo-treated GNP, a peak at 1180 cm−1 is consistent to the C C
stretching vibrations. A couple peaks in the range of 3020–3100 cm−1 are in agreement
with the C H stretching vibration. Also, the peaks at 1396 and 1509 cm−1 are respectively
related to the νcis and νtrans of N=N stretching vibration (Y. Feng et al., 2013). The presence
of azobenzenes bound to the GNP is also supported by the observation of new bands in
the FTIR spectra of Azo-treated GNP that can be assigned to the C=C stretch (1602 cm−1)
and the O H bend (3451 cm−1).
In order to evaluate the specific role of Lewis acids, our experimental procedure
was also done without using Lewis acids as catalyst (Figure 4.28). As could be seen, in
the absence of Lewis acids, FTIR spectra show just low intensities for all samples.
However, using Lewis acids was led to the aforementioned peaks for PEG and Azo.
Unfolding C O, CH2, O H, C H, =C H, N=N, and C=C peaks in these samples with
Lewis acids could highlight the essential role of Lewis acid in PEG and Azo
functionalization.
Univers
ity of
Mala
ya

168
Reaction products showed approximately similar trends in presence of other
Lewis acids as the catalysts. Since the FTIR spectra of pristine GNP, PEG-treated GNP
and Azo-treated GNP show similar peaks in presence of different kinds of catalysts, the
quantitative tests such as Raman spectroscopy and TGA has been considerably employed
to characterize various functional groups, indicating essential information for estimation
Figure 4.28: FTIR spectra of (a) PEG-treated GNP and (b) Azo-treated GNP without using catalysts.
Univers
ity of
Mala
ya

169
of the covalent functionalization and compare the performance of functionalization in
presence of different catalysts.
4.2.5.2.2 Raman spectroscopy
Raman spectroscopy is applied to present fundamental information for
investigation of the covalent modification of GNP. Figure 4.29 panels (a) and (b) show
the Raman spectra of pristine GNP and functionalized GNP with Azo & PEG,
respectively. This technique established an eminent sensitivity to the disordered band on
the structure depending upon the optical skin depth (Shirazi et al., 2015). Raman spectra
of the pristine and functionalized samples with Azo & PEG are illustrated the D and G
bands at around 1341 and 1572 cm−1, respectively. The D band around 1341 cm−1 is
connected to the amorphous carbon, which resulted from addition of functional groups to
the main backbone of GNP. In contrast, the tangential G-mode of GNP at 1572 cm−1 is
associated with the motion in opposite direction of two nigh carbon atoms in a graphitic
framework (Shirazi et al., 2015). The G band implies the existence of crystalline graphitic
carbon in GNP. Previous researches (E.-Y. Choi et al., 2010; Fu et al., 2013), confirmed
that GNP functionalization is one of the main causes of different results on the shift of
the D and G bands. Raman spectra can be applied to characterize the amount of disordered
carbon relative to the graphitic carbon by measuring the ratio of D to G bands (ID/IG).
Hence, it can be seen that the intensity ratio (ID/IG) of all functionalized samples increased
as compared with pristine GNP, which verify successful functionalization, indicating an
improvement in the structure defects or disruption of aromatic π–electrons on the GNP
framework (Ghiadi et al., 2013; Zare‐Zardini et al., 2015a). Again, the higher values of
ID/IG determined by Raman spectroscopy indicate the higher degree of covalent
functionalization. Also, the results suggest different intensity ratios (ID/IG) in the presence
of different catalysts, which first confirmed functionalization of GNP in the presence of
Univers
ity of
Mala
ya
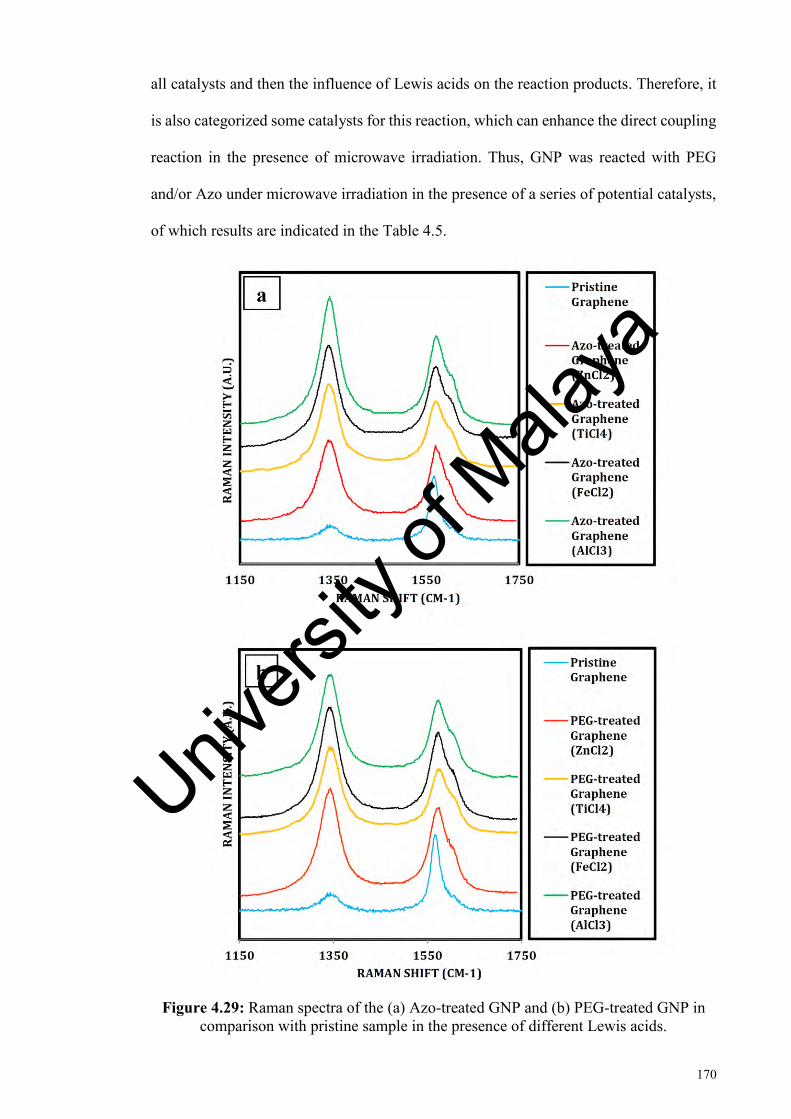
170
all catalysts and then the influence of Lewis acids on the reaction products. Therefore, it
is also categorized some catalysts for this reaction, which can enhance the direct coupling
reaction in the presence of microwave irradiation. Thus, GNP was reacted with PEG
and/or Azo under microwave irradiation in the presence of a series of potential catalysts,
of which results are indicated in the Table 4.5.
Figure 4.29: Raman spectra of the (a) Azo-treated GNP and (b) PEG-treated GNP in comparison with pristine sample in the presence of different Lewis acids.
Univers
ity of
Mala
ya

171
ID/IG
Pristine GNP 0.459
Material/Catalyst 2ZnCl 4TiCl 2FeCl 3AlCl
Azo-treated GNP 1.187135 1.450617 1.409756 2.238462
PEG-treated GNP 1.392157 1.405556 1.554839 1.778761
According to the values of ID/IG determined by Raman spectroscopy in Table 4.5,
it could be recognized that all of the catalysts (ZnCl2, TiCl4, FeCl2 and AlCl3) led to
successful reaction between GNP and Azo/PEG. With the above catalysts loading and
under same conditions, the best result was obtained by AlCl3. The use of alternative
catalysts led to the good development of ID/IG ratio, especially for AlCl3. Based on the
observed Raman results, the sequence of ID/IG for functionalization in the presence of
different catalysts was AlCl3 ≫ FeCl2 > TiCl4 > ZnCl2.
Interestingly, G-bands of the treated GNP samples in the presence of different
catalysts show a redshift (around 20 cm−1), implying weakening of graphitic (sp2) carbon
moieties (Khare et al., 2005). This could again confirm functionalization of GNP.
4.2.5.2.3 TGA
TGA can present valuable information about the quantitative extent of functional
groups on GNP because of lower degradation temperature of organic functional moieties
than graphitic layers of GNP. Figures 4.30a and b represent further evidence of the
functionalization of GNP with Azo and PEG, respectively. Further evidence from TGA
traces of the treated GNP with Azo and PEG demonstrated functionalization of GNP in
the presence of different kinds of catalysts which had applied here.
Table 4.5: Identification of catalysts for formation of the electrophilic addition reactions.
Univers
ity of
Mala
ya

172
Despite the fact that TGA curve of pristine GNP illustrates no considerable weight
loss up to 400 °C as the thermal degradation of main graphitic structures, an obvious
weight loss for the treated samples can be occurred in temperature range of 0–400 °C in
all the samples. In the curve of functionalized samples with PEG, the sharp weight loss
(the first weight loss) presented in temperature range of 100–250 °C can be attributed to
the functionality of PEG as an unstable organic moieties decorated on the edge of GNP.
Figure 4.30: Thermogravimetric analysis of the (a) Azo-treated GNP and (b) PEG-treated GNP in comparison with pristine sample in the presence of different Lewis
acids. Univers
ity of
Mala
ya
173
The TGA curves of various functionalized samples in the presence of different kinds of
catalysts demonstrate different weight loss at mentioned temperature range, which may
be due to the fact that employed Lewis acids have different activities and lead to different
conversion.
Regarding Azo-treated GNP, the first sharp weight loss explained in the
temperature range of 150–350 °C, which may be attributed to the functionality of Azo.
According to the TGA results for both PEG- and Azo-treated GNP, the use of AlCl3 as
catalysts can provide the best reaction performance at same catalyst loading, which also
confirmed by Raman results. So, hydroxyl (–OH) group can be decorated on the edge of
GNP by an efficient method including an electrophilic addition reaction under microwave
irradiation. It was discovered that all catalysts employed here noticeably accelerated the
reaction. According to the results of TGA and Raman spectroscopy, ZnCl2 has the least
reactive activity for electrophilic addition reaction under microwave irradiation.
Interestingly, in order to quantify the functionalization yield, Moaseri et al. (2014) have
introduced the degree of functionalization from the TGA results. On the basis of this
weight loss, the following formula employed to calculate the degree of functionalization
of GNP:
𝐷𝑒𝑔𝑟𝑒𝑒 𝑜𝑓 𝐹𝑢𝑛𝑐𝑡𝑖𝑜𝑛𝑎𝑙𝑖𝑧𝑎𝑡𝑖𝑜𝑛 =𝑚𝑚𝑜𝑙 𝑜𝑓 𝑎𝑡𝑡𝑎𝑐ℎ𝑒𝑑 𝑓𝑢𝑛𝑐𝑡𝑖𝑜𝑛𝑎𝑙 𝑔𝑟𝑜𝑢𝑝
𝑔𝑟𝑎𝑚𝑠 𝑜𝑓 𝐺𝑟𝑎𝑝ℎ𝑒𝑛𝑒
The degree of functionalization might be measured as an extent of
functionalization improvement. Table 4.6 demonstrates the amounts of the degree of
functionalization for the treated samples with Azo and PEG as well as pristine GNP.
Based on the determined values of the degree of functionalization, all the treated GNP
represent different results in the presence of various catalysts. Also, these results can
confirm the Raman results for functionalization with Azo and PEG. In agreement with
Univers
ity of
Mala
ya

174
Raman results, AlCl3 and ZnCl2 have the maximum and minimum performances in
functionalization among the selected catalysts. On the other hand, the second weight loss
interval at more than 400 °C corresponds chiefly to the degradation onset temperature of
main graphitic structures in nitrogen atmosphere.
𝐃𝐞𝐠𝐫𝐞𝐞 𝐨𝐟 𝐅𝐮𝐧𝐜𝐭𝐢𝐨𝐧𝐚𝐥𝐢𝐳𝐚𝐭𝐢𝐨𝐧 (mmol/gr)
Material/Catalyst
AlCl3
FeCl2
TiCl4
ZnCl2
PEG-treated GNP 1.702125378 1.136362242 0.869564197 0.762194244
Azo-treated GNP 2.423127591 1.728406126 1.436165044 0.957884155
4.2.5.3 Morphology studies
Figure 4.31 depicts the TEM images of pristine GNP as well as Azo- and PEG-
treated GNP. First, the multi-layered structure of the GNP is obvious in the TEM images
of pristine Gr (Figure 4.31a), which has almost smooth surface (Figure 4.31b and c).
Although TEM images are not able to distinguish minuscule functional groups, whereas
any change in morphology and surface deterioration can be considered as an evidence in
TEM images. Pristine sample (Figure 4.31a–c) shows a GNP flake with relatively smooth
layers’ surface and edge. Unlike pristine sample, the PEG-treated GNP (Figure 4.31d)
and Azo-treated GNP (Figure 4.31e) provide edges with high defect density. Such higher
roughness indicates the partial damage of graphitic carbon, in the effect of our severe
functionalization under microwave irradiation. Also, the lines seen in the TEM images
can be wrinkles on the GNP surface, which is due to the inherent instability of the 2D
structures. The obtained increase of such lines after functionalization can be attributed to
the enhancement of wrinkles (waviness) during the microwave procedures, resulting from
appropriate flexibility of GNP flakes after treatment.
Table 4.6: Comparative study of the functionalization of compounds in the presence of different catalysts
Univers
ity of
Mala
ya

175
4.2.6 Preparation of GNP-COOH
4.2.6.1 Covalent functionalization of GNP
Based on the technique explained by Y. Wang et al. (2006) with slight
modification, carboxylation of GNP was performed. In order to generate carboxylated
GNP, the GNP (1 g) with a mixture of HNO3 and H2SO4 (1:3 volume ratio) were first
sonicated for 0.5 h at room temperature in a closed vessel. The GNP suspension was then
poured into a Teflon reaction vessel and placed in an industrial microwave (Milestone
MicroSYNTH programmable microwave system) with output power of 700 W and heated
up to 90 °C for 15 min. The resulting suspension was cooled at room temperature and
then diluted with 200 mL deionized water to reduce the intensity of acids for filtration
stage. The GNP suspension was filtered through 45 μm polytetrafluoroethylene (PTFE)
membrane, and the filtrate was continually washed with the deionized water to remove
any unreacted acids. The functionalized sample was dried overnight at 40 °C in a vacuum.
Figure 4.31: TEM images of (a–c) pristine sample, (d) PEG-treated GNP and (e) Azo-treated GNP.
Univers
ity of
Mala
ya

176
4.2.6.2 Morphological and functionalization studies
Figure 4.32 shows FTIR spectra of GNP-COOH as well as pristine GNP. In
contrast to the pristine GNP, acid treated GNP sample obviously shows the cues of
carboxylic groups. In the FTIR spectrum of GNP-COOH, a broad peak at 3327 cm−1 was
associated with the O-H stretching vibrations (Zardini et al., 2012). GNP-COOH sample
also illustrates a peak at 1667 cm−1, which could be attributed to the C=O. It is obvious
that the carboxyl group has a sharp peak, resulting from the oxidation stage by
nitric/sulfuric acid. Also, another peak centered on 1573 cm−1 is attributable to the C=C
stretching vibration, which can be resulted from edge-defected sites. The mentioned
picks, which are insignificant in the pristine spectrum, can confirm GNP carboxylation.
Figure 4.33 illustrates the TEM images of pristine GNPs and acid treated GNPs.
Although TEM images are not able to distinguish minute functional groups, it can show
Figure 4.32: FTIR spectra of pristine and acid treated GNP.
Univers
ity of
Mala
ya

177
the surface deterioration and change of the GNPs that formed as a result of acid treatment.
In pristine sample, one can see multi-layered GNPs with relatively smooth layers and low
edge-defected GNPs. On the other hand, the acid treated samples provide higher surface
roughness on the GNPs. Such higher roughness implies the partial damage of graphitic
carbon, in effect of severe carboxylation. Also, the lines seen in the TEM images are
wrinkles on the surface of the GNP due to the inherent instability of the 2D structures.
The increase in these lines with functionalization may just be a result of increased
wrinkling (waviness) during the sonication process.
4.3 Colloidal stability and Thermo-physical properties
4.3.1 Water-based highly crumpled few layered graphene nanofluids
4.3.1.1 Preparation
To synthesize water-based HCFLG nanofluids, the obtained HCFLG (section
4.2.2) was mixed with Gum Arabic by a ratio of 0.5:1 and then poured into a vessel filled
with the given amount of water and finally sonicated with a probe-sonicator for 10 min.
Figure 4.33: TEM images of (A) pristine, (B and C) acid-treated GNP.
Univers
ity of
Mala
ya

178
4.3.1.2 Colloidal Stability
The UV–Vis spectroscopy is a common method, which is utilized for the
investigation of the stability of nanofluids including solid particles. According to the
Beer–Lambert’s law, there is a direct connection between the absorbance of a solution
and the concentration of the absorbing species such as particles in the solution.
Considering this law, the absorption spectrum of the prepared nanofluids exhibits a
maximum peak at around 265 nm corresponding to π–π transition of conjugation
system in the polyaromatic structures. The band gap energy, Eg, can be measured from
UV–Vis absorption by Tauc’s equation (Hadadian et al., 2014) given as equation no.
4.1,
(α ℎ𝜗)𝑛 = 𝐵(ℎ𝜗 − 𝐸𝑔) 4.1
where α, ℎ𝜗, n, Eg and B are, respectively, absorption coefficient, photon energy, the
nature of optical transition, band gap energy and a material constant. Therefore, the
UV–vis spectrum for the distillated water-based HCFLG nanofluids with different weight
concentrations was investigated and photometric analysis of the UV–vis spectrometer
was employed to trace the weight concentrations of samples versus time. To this end, a
standard curve was drawn for each concentration. Figure 4.34 shows the colloidal stability
for distillated water-based HCFLG nanofluids versus time. It is seen that the
concentration of the samples decreases slightly with time because of agglomeration and
sedimentation. Figure 4.34, however, shows that the relative reduction of weight
concentration for all of the samples after 30 days was less than 2%. The high colloidal
stability of distillated water-based HCFLG nanofluids is attributed to the small particle
size associated with very high specific surface area (1568 m2/g).
Univers
ity of
Mala
ya

179
4.3.1.3 Thermo-physical properties
Thermal conductivity is an important thermo-physical properties and was
measured by a KD2 Pro analyzer based on the transient hot wire technique. The measured
values of thermal conductivity of distilled water and distilled water-based HCFLG
nanofluids are shown in Figure 4.35(a). As expected, this figure shows that the measured
thermal conductivity increases with temperature. In the recent study (W. Sarsam et al.,
2016b), it has been found that the higher specific surface area leads to the higher thermal
conductivity of water-based graphene nanofluids. Since HCFLG has high specific surface
area, the increase of thermal conductivity of the nanofluids is consistent with the earlier
findings.
From Figure 4.35(a) it can be seen that all the samples were prepared with very
low weight concentration, nevertheless, the amount of enhancements in thermal
98
98.2
98.4
98.6
98.8
99
99.2
99.4
99.6
99.8
100
0 5 10 15 20 25 30
Re
lati
ve
co
nce
ntr
ati
on
Time (day)
HCFLG-0.001 HCFLG-0.005 HCFLG-0.01
Figure 4.34: The colloidal stability of HCFLG in distillated water as a function of time and weight concentration.
Univers
ity of
Mala
ya

180
conductivity of different samples are significant. As the concentration was increased from
0.0 wt% to 0.01 wt%, the figure shows that the thermal conductivity of water-based
HCFLG nanofluids increases from 0.642 to 0.915 W/mK at 50 ºC, which represents
42.5% enhancement. This amount of enhancement is quite impressive for the low weight
concentration of 0.01wt%. Also, for distillated water, Figure 4.35(a) showed that the
increase in temperature from 20 to 50 °C resulted in 8.6% increase in the thermal
conductivity, while for water-based HCFLG nanofluids at 0.001 wt%, 0.005 wt%, and
%0.01 wt% concentrations, the increase in thermal conductivity were 20.8%, 23.8%, and
21.9% respectively. Keblinski et al. (2002) and Eastman et al. (2004) suggested some
potential mechanisms for the increase in the thermal conductivity in the presence of
nanoparticles. These are, Brownian motion, molecular-level layering of the liquid at the
liquid/particle interface, fluctuation of fluid velocity due to drag of Brownian
nanoparticles, thermophoresis, reduction in thermal boundary layer thickness, nature of
heat transport in nanoparticles, and effects of nanoparticle clustering. According to the
recent studies (S. Choi et al., 2001; Godson et al., 2010; Huxtable et al., 2003; Kang et
al., 2006; Nan et al., 1997), the thermal conductivity of nanofluids is affected by the
thermal conductivities of the basefluid and nanoparticles, temperature, concentration,
specific surface area, shape/geometry of nanostructures etc. The present results show that
the specific surface area of nanoparticles also affects the thermal conductivity as well as
the colloidal stability.
In Figure 4.35b, the effects of temperature and weight concentration of HCFLG
on the specific heat capacity of distillated water-based HCFLG nanofluids are studied. It
is seen that an increase in the weight concentration of HCFLG leads to a drop in the
specific heat capacity. In particular, an average drop of 0.1–0.5% is observed for weight
concentrations of 0.001–0.01 wt%. Specific heat capacity of distillated water-based
Univers
ity of
Mala
ya

181
HCFLG is lower than that of water due to the lower specific heat capacity of HCFLG
loaded in the base fluid.
The measured values of viscosity are plotted in Figure 4.36 as function of shear
rate for water-based HCFLG nanofluids and weight concentrations, as well as, distillated
0.55
0.6
0.65
0.7
0.75
0.8
0.85
0.9
0.95
1
15 25 35 45 55
Th
erm
al
con
du
ctiv
ity
(W
m-1
K-1
)
T (°C)
Di-Water HCFLG-0.001 HCFLG-0.005 HCFLG-0.01
4.02E+03
4.03E+03
4.04E+03
4.05E+03
4.06E+03
4.07E+03
4.08E+03
4.09E+03
15 25 35 45 55
Cp
(J
kg
-1K
-1)
T (°C)
Di-Water HCFLG-0.001 HCFLG-0.005 HCFLG-0.01
(b)
Figure 4.35: (a) Thermal conductivity and (b) specific heat capacity plots of water-based HCFLG nanofluids at different weight concentrations as well as distillated water.
(a)
Univers
ity of
Mala
ya

182
water at various temperatures. This figure shows that the effective viscosity of water-
based HCFLG nanofluids is higher than water and increases as weight concentration
increases. Furthermore, the effective viscosity decreases with increase of the temperature.
Figure 4.36 also shows that the behavior of water-based HCFLG nanofluids is Newtonian
with almost constant viscosity for different values of shear rate.
0.00090
0.00095
0.00100
0.00105
0.00110
0 50 100 150 200 250 300
Vis
cosi
ty [P
a·s]
Shear Rate [1/s]
293.15 ºK
Di-Water HCFLG-0.001 HCFLG-0.005 HCFLG-0.01
0.00075
0.00077
0.00079
0.00081
0.00083
0.00085
0 50 100 150 200 250 300
Vis
cosi
ty [P
a·s]
Shear Rate [1/s]
303.15 ºK
Di-Water HCFLG-0.001 HCFLG-0.005 HCFLG-0.01
Univers
ity of
Mala
ya

183
The densities of water-based HCFLG nanofluids and water are measured as
functions of temperature and weight concentrations, and the results are shown in Table
4.7. It is observed that the density of water-based HCFLG nanofluids as well as water
decreases by increasing the temperature, which may be related to the thermal expansion
of liquid. Also, there is an upward trend between the density of samples and weight
0.00062
0.00064
0.00066
0.00068
0.00070
0.00072
0.00074
0 50 100 150 200 250 300
Vis
cosi
ty [P
a·s]
Shear Rate [1/s]
313.15 ºK
Di-Water HCFLG-0.001 HCFLG-0.005 HCFLG-0.01
0.00052
0.00054
0.00056
0.00058
0.00060
0.00062
0 50 100 150 200 250 300
Vis
cosi
ty [P
a·s]
Shear Rate [1/s]
323.15 ºK
Di-Water HCFLG-0.001 HCFLG-0.005 HCFLG-0.01
Figure 4.36: Plots of the measured values of viscosity versus shear rate for water-based HCFLG nanofluids at different temperatures and weight concentrations. Univ
ersity
of M
alaya
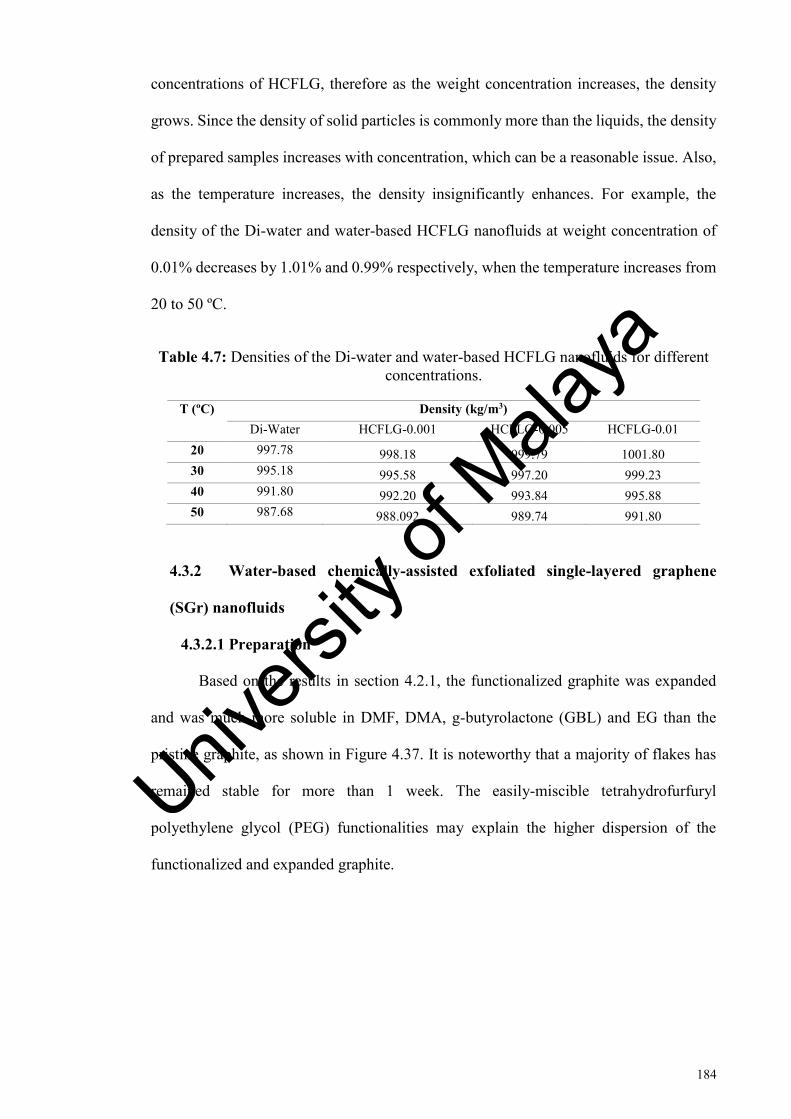
184
concentrations of HCFLG, therefore as the weight concentration increases, the density
grows. Since the density of solid particles is commonly more than the liquids, the density
of prepared samples increases with concentration, which can be a reasonable issue. Also,
as the temperature increases, the density insignificantly enhances. For example, the
density of the Di-water and water-based HCFLG nanofluids at weight concentration of
0.01% decreases by 1.01% and 0.99% respectively, when the temperature increases from
20 to 50 ºC.
T (ºC) Density (kg/m3) Di-Water HCFLG-0.001 HCFLG-0.005 HCFLG-0.01
20 997.78 998.18 999.79 1001.80 30 995.18 995.58 997.20 999.23 40 991.80 992.20 993.84 995.88 50 987.68 988.092 989.74 991.80
4.3.2 Water-based chemically-assisted exfoliated single-layered graphene
(SGr) nanofluids
4.3.2.1 Preparation
Based on the results in section 4.2.1, the functionalized graphite was expanded
and was much more soluble in DMF, DMA, g-butyrolactone (GBL) and EG than the
pristine graphite, as shown in Figure 4.37. It is noteworthy that a majority of flakes has
remained stable for more than 1 week. The easily-miscible tetrahydrofurfuryl
polyethylene glycol (PEG) functionalities may explain the higher dispersion of the
functionalized and expanded graphite.
Table 4.7: Densities of the Di-water and water-based HCFLG nanofluids for different concentrations.
Univers
ity of
Mala
ya

185
To synthesize water-based SGr nanofluids, the given amount of chemically-
assisted exfoliated single-layered graphene after preparation (Section 4.2.1) poured into
a vessel filled with the given amount of water and finally sonicated with a probe-sonicator
for 15 minutes to reach homogenous suspension. Three different weight concentrations
of 0.001%, 0.005% and 0.01% were prepared for next phase of study.
4.3.2.2 Colloidal Stability
As mentioned in section 3.1.5, the UV–Vis spectroscopy is a common method,
which is utilized for investigation of the stability of nanofluids including solid
particles. Therefore, the UV–vis spectrum for the distillated water-based SGr nanofluids
with different weight concentrations was investigated and photometric analysis of the
UV–vis spectrometer was employed to trace the weight concentrations of samples versus
time. To this end, a standard curve was drawn for each concentration. The UV–vis
spectrum for the water-based SGr nanofluids with different weight concentrations is
presented in Figure 4.38 panel (a), from which it can be seen that the peak value of
absorbance for all samples due to the presence of SGr in the wavelengths of 265 nm.
Figure 4.38 panel (b) illustrates the colloidal stability for distillated water-based SGr
nanofluids versus time. From this figure, the concentration of the samples decreases with
Figure 4.37: Photographs of functionalized and expanded graphite dispersed in (a) DMF, (b) DMA, (c) g-butyrolactone and (d) EG.
Univers
ity of
Mala
ya
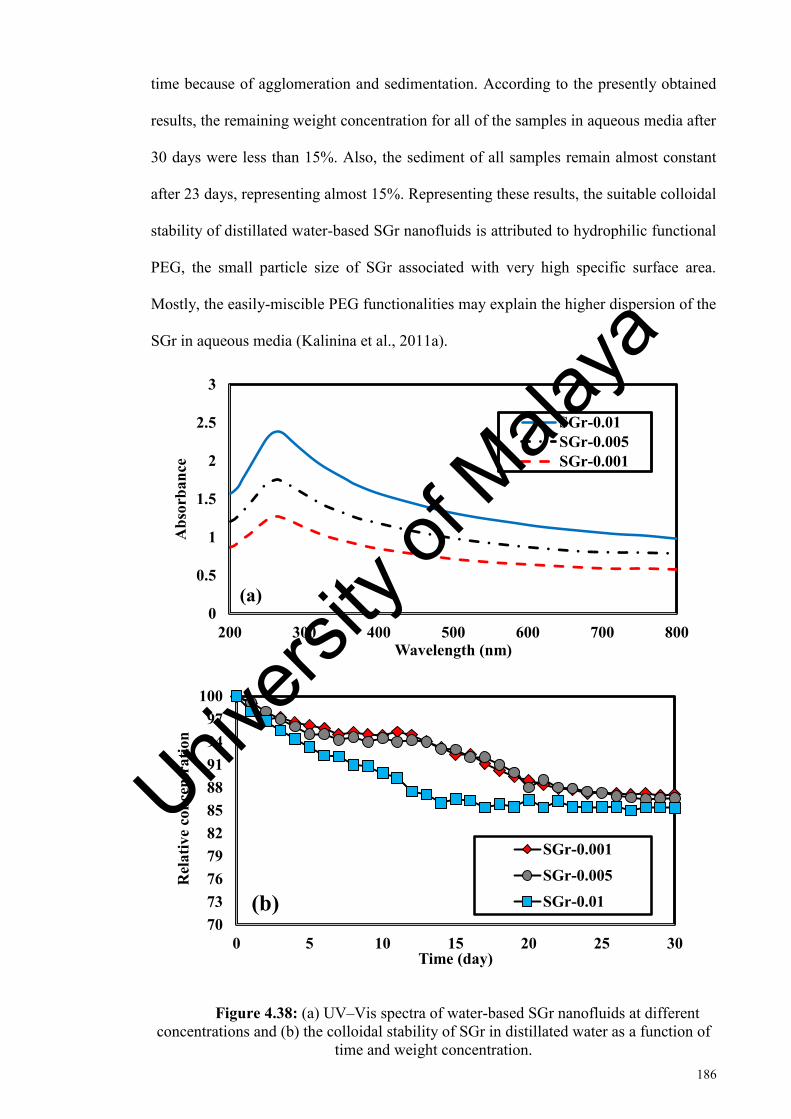
186
time because of agglomeration and sedimentation. According to the presently obtained
results, the remaining weight concentration for all of the samples in aqueous media after
30 days were less than 15%. Also, the sediment of all samples remain almost constant
after 23 days, representing almost 15%. Representing these results, the suitable colloidal
stability of distillated water-based SGr nanofluids is attributed to hydrophilic functional
PEG, the small particle size of SGr associated with very high specific surface area.
Mostly, the easily-miscible PEG functionalities may explain the higher dispersion of the
SGr in aqueous media (Kalinina et al., 2011a).
0
0.5
1
1.5
2
2.5
3
200 300 400 500 600 700 800
Abs
orba
nce
Wavelength (nm)
(a)
SGr-0.01SGr-0.005SGr-0.001
70737679828588919497
100
0 5 10 15 20 25 30
Rel
ativ
e co
ncen
trat
ion
Time (day)
(b)
SGr-0.001SGr-0.005SGr-0.01
Figure 4.38: (a) UV–Vis spectra of water-based SGr nanofluids at different concentrations and (b) the colloidal stability of SGr in distillated water as a function of
time and weight concentration.
Univers
ity of
Mala
ya

187
4.3.2.3 Thermo-physical properties
As one of the most fundamental thermo-physical properties, thermal conductivity
was obtained by using the KD2 Pro analyzer based on the transient hot wire technique.
The measured values of thermal conductivity for distilled water and distilled water-based
SGr nanofluids are shown in Figure 4.39 panel (a). From which, it can be first concluded
that as temperature increases, the measured thermal conductivity increases, which is an
expected phenomenon. According to Sarsam et al. (2016b), the higher specific surface
area of graphene means the higher thermal conductivity for nanofluids loaded with
graphene flakes. Therefore, the synthesized material with superior specific surface area
was estimated to represent high thermal conductivity at low weight concentration.
Obviously, all the nanofluids samples were arranged at low weight concentrations,
however the amount of enhancements for different samples were fairly significant. From
Figure 4.39 panel (a), there is more than 25% increase in the thermal conductivity of
water-based SGr nanofluids for different temperatures and at the weight concentration of
0.01%. For example, water-based SGr nanofluids increased from 0.624 to 0.782 W/m ºK
at 40 ºC for concentration of 0.01%, representing 25.3% enhancement as compared with
water. This amount of enhancement was brilliant for the low weight concentration of
0.01wt%. Regarding the mechanism of increasing thermal conductivity with loading
graphene in base fluid, Keblinski et al. (2002) and Eastman et al. (2004) reported four
potential mechanisms to introduce reasons for the enhancement, i.e., Brownian motion,
molecular-level layering of the liquid at the liquid/particle interface, the nature of heat
transport in the nanoparticles, and the effects of nanoparticle clustering. In addition,
according to the recent studies (S. Choi et al., 2001; Godson et al., 2010; Huxtable et al.,
2003; Kang et al., 2006; Nan et al., 1997), some basic parameters such as thermal
conductivities of the basefluid and nanoparticles, temperature, concentration, specific
surface area, shape or geometry of nanostructures play key roles in determining the
Univers
ity of
Mala
ya

188
thermal conductivity of nanofluids. Herein, the results show that the specific surface area
of nanoparticles has a direct effect on the thermal conductivity as well as colloidal
stability.
As another thermo-physical property, the specific heat capacity of distillated
water-based SGr nanofluids and distillated water are illustrated in Figure 4.39 panel (b)
for different temperatures and weight concentrations. It is seen that an increase in the
weight concentration of SGr leads to a small drop in the specific heat capacity.
Commonly, average drop of 0.1–0.5% in the specific heat capacity of distillated water-
based SGr nanofluids as compared with base fluid indicated an insignificant decrease.
Specific heat capacity of distillated water-based SGR is lower than that of water due to
the lower specific heat capacity of SGr loaded in the basefluid.
0.55
0.6
0.65
0.7
0.75
0.8
0.85
0.9
15 25 35 45 55
Th
erm
al
con
du
ctiv
ity
(W
m-1
K-1
)
T (°C)
(a)water SGr-0.001
SGr-0.005 SGr-0.01
Univers
ity of
Mala
ya
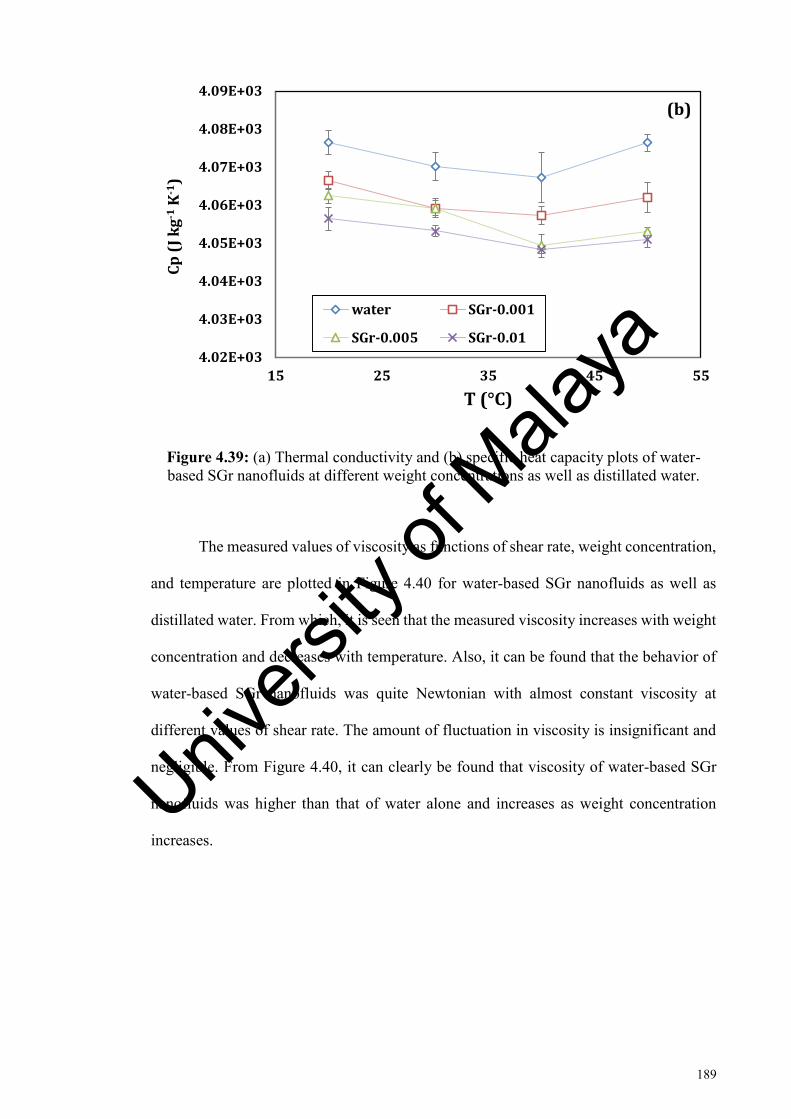
189
The measured values of viscosity as functions of shear rate, weight concentration,
and temperature are plotted in Figure 4.40 for water-based SGr nanofluids as well as
distillated water. From which, it is seen that the measured viscosity increases with weight
concentration and decreases with temperature. Also, it can be found that the behavior of
water-based SGr nanofluids was quite Newtonian with almost constant viscosity at
different values of shear rate. The amount of fluctuation in viscosity is insignificant and
negligible. From Figure 4.40, it can clearly be found that viscosity of water-based SGr
nanofluids was higher than that of water alone and increases as weight concentration
increases.
4.02E+03
4.03E+03
4.04E+03
4.05E+03
4.06E+03
4.07E+03
4.08E+03
4.09E+03
15 25 35 45 55
Cp
(J
kg
-1K
-1)
T (°C)
(b)
water SGr-0.001
SGr-0.005 SGr-0.01
Figure 4.39: (a) Thermal conductivity and (b) specific heat capacity plots of water-based SGr nanofluids at different weight concentrations as well as distillated water.
Univers
ity of
Mala
ya

190
0.00090
0.00095
0.00100
0.00105
0.00110
0.00115
0 50 100 150 200 250 300
Vis
cosi
ty [P
a·s]
Shear Rate [1/s]
293.15 ºK
Di-Water SGr-0.001 SGr-0.005 SGr-0.01
0.00075
0.00077
0.00079
0.00081
0.00083
0.00085
0 50 100 150 200 250 300
Vis
cosi
ty [P
a·s]
Shear Rate [1/s]
303.15 ºK
Di-Water SGr-0.001 SGr-0.005 SGr-0.01
Univers
ity of
Mala
ya

191
The densities of water-based SGr nanofluids and water are measured as functions
of temperature and weight concentration, and the results are shown in Table 4.8. It is
observed that the density of water-based SGr nanofluids as well as water decreases by
increasing the temperature, which may be related to the thermal expansion of liquid. Also,
there is an upward trend between the density of samples and weight concentration of SGr,
0.00062
0.00064
0.00066
0.00068
0.00070
0.00072
0.00074
0 50 100 150 200 250 300
Vis
cosi
ty [P
a·s]
Shear Rate [1/s]
313.15 ºK
Di-Water SGr-0.001 SGr-0.005 SGr-0.01
0.00051
0.00053
0.00055
0.00057
0.00059
0.00061
0.00063
0 50 100 150 200 250 300
Vis
cosi
ty [P
a·s]
Shear Rate [1/s]
323.15 ºK
Di-Water SGr-0.001 SGr-0.005 SGr-0.01
Figure 4.40: Plots of the measured values of viscosity versus shear rate for water-based SGr nanofluids at different temperatures and weight concentrations. Univ
ersity
of M
alaya
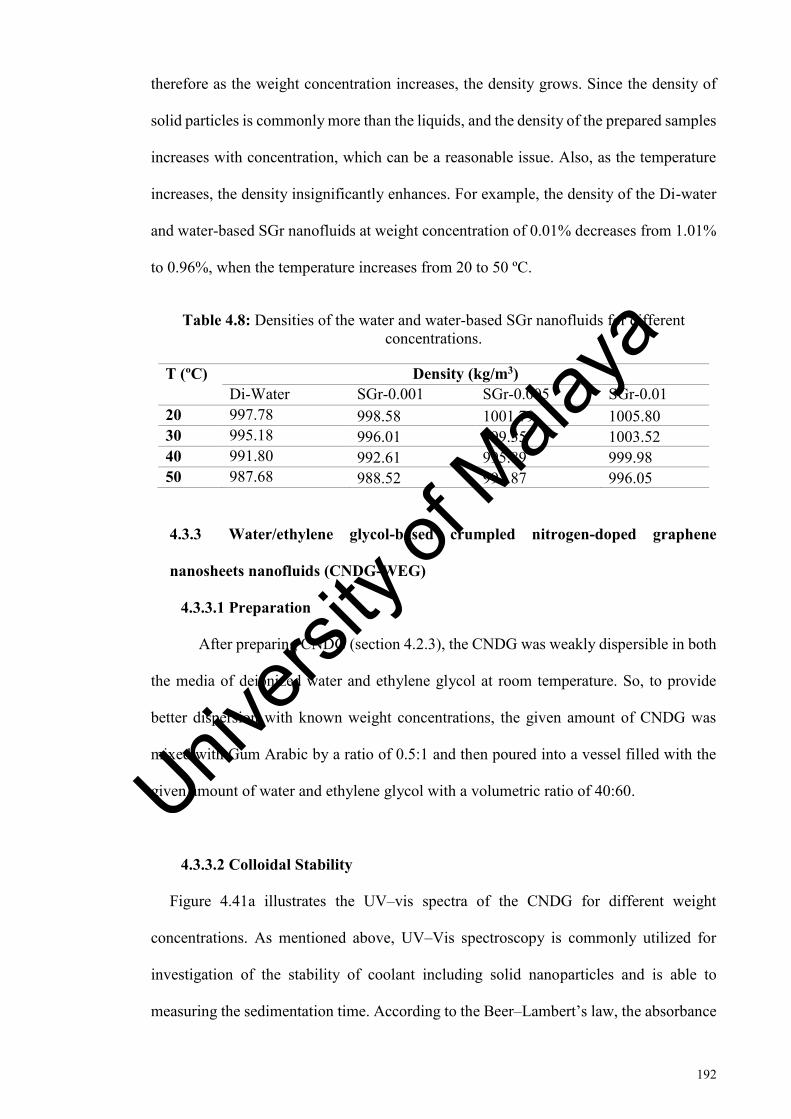
192
therefore as the weight concentration increases, the density grows. Since the density of
solid particles is commonly more than the liquids, and the density of the prepared samples
increases with concentration, which can be a reasonable issue. Also, as the temperature
increases, the density insignificantly enhances. For example, the density of the Di-water
and water-based SGr nanofluids at weight concentration of 0.01% decreases from 1.01%
to 0.96%, when the temperature increases from 20 to 50 ºC.
T (ºC) Density (kg/m3) Di-Water SGr-0.001 SGr-0.005 SGr-0.01
20 997.78 998.58 1001.79 1005.80 30 995.18 996.01 999.35 1003.52 40 991.80 992.61 995.89 999.98 50 987.68 988.52 991.87 996.05
4.3.3 Water/ethylene glycol-based crumpled nitrogen-doped graphene
nanosheets nanofluids (CNDG-WEG)
4.3.3.1 Preparation
After preparing CNDG (section 4.2.3), the CNDG was weakly dispersible in both
the media of deionized water and ethylene glycol at room temperature. So, to provide
better dispersion with known weight concentrations, the given amount of CNDG was
mixed with Gum Arabic by a ratio of 0.5:1 and then poured into a vessel filled with the
given amount of water and ethylene glycol with a volumetric ratio of 40:60.
4.3.3.2 Colloidal Stability
Figure 4.41a illustrates the UV–vis spectra of the CNDG for different weight
concentrations. As mentioned above, UV–Vis spectroscopy is commonly utilized for
investigation of the stability of coolant including solid nanoparticles and is able to
measuring the sedimentation time. According to the Beer–Lambert’s law, the absorbance
Table 4.8: Densities of the water and water-based SGr nanofluids for different concentrations.
Univers
ity of
Mala
ya
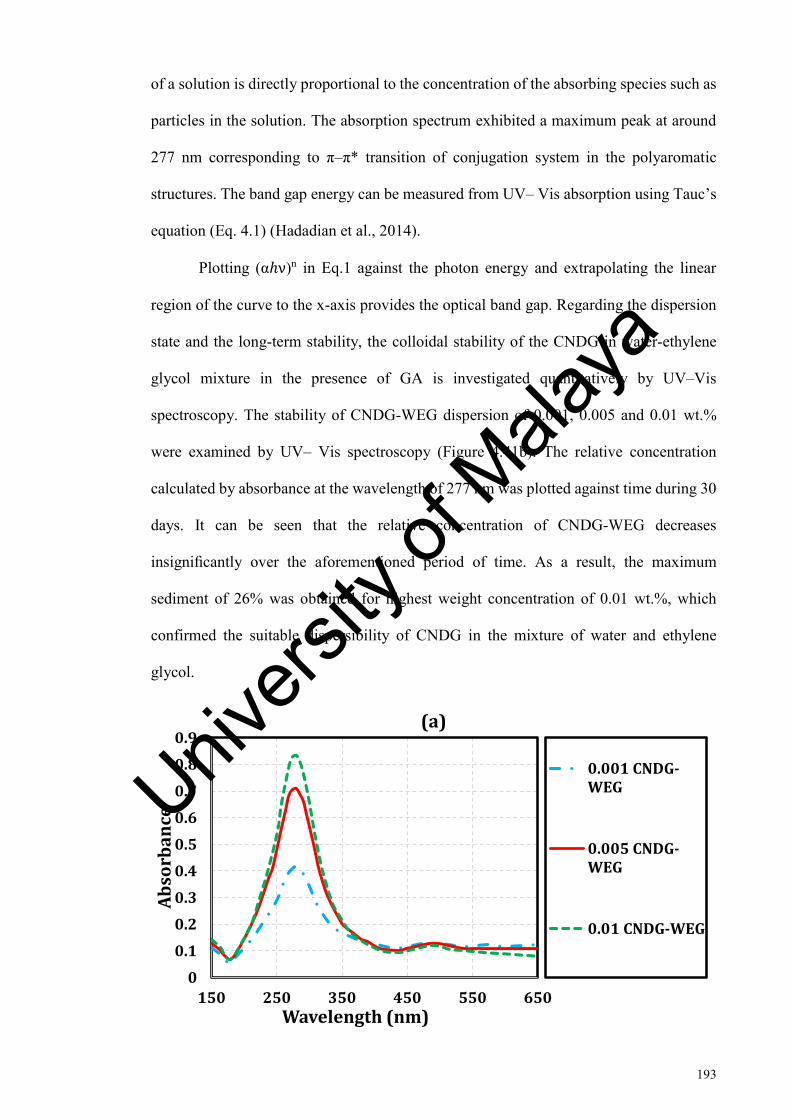
193
of a solution is directly proportional to the concentration of the absorbing species such as
particles in the solution. The absorption spectrum exhibited a maximum peak at around
277 nm corresponding to π–π* transition of conjugation system in the polyaromatic
structures. The band gap energy can be measured from UV– Vis absorption using Tauc’s
equation (Eq. 4.1) (Hadadian et al., 2014).
Plotting (αℎν)n in Eq.1 against the photon energy and extrapolating the linear
region of the curve to the x-axis provides the optical band gap. Regarding the dispersion
state and the long-term stability, the colloidal stability of the CNDG in water-ethylene
glycol mixture in the presence of GA is investigated quantitatively by UV–Vis
spectroscopy. The stability of CNDG-WEG dispersion of 0.001, 0.005 and 0.01 wt.%
were examined by UV– Vis spectroscopy (Figure 4.41b). The relative concentration
calculated by absorbance at the wavelength of 277 nm was plotted against time during 30
days. It can be seen that the relative concentration of CNDG-WEG decreases
insignificantly over the aforementioned period of time. As a result, the maximum
sediment of 26% was obtained for highest weight concentration of 0.01 wt.%, which
confirmed the suitable dispersibility of CNDG in the mixture of water and ethylene
glycol.
0
0.1
0.2
0.3
0.4
0.5
0.6
0.7
0.8
0.9
150 250 350 450 550 650
Ab
sorb
an
ce
Wavelength (nm)
(a)
0.001 CNDG-WEG
0.005 CNDG-WEG
0.01 CNDG-WEG
Univers
ity of
Mala
ya

194
To check whether the decrease in signal intensity by time is just due to reversible
particle settling or gradual irreversible particle aggregation, Figure 4.42 is plotted. The
colloidal stability of the HCND-WEG for weight concentration of 0.01 wt.% obtained by
performing UV measurements for 20 days on suspensions mechanically stirred every day.
The stirring was performed for 15 min at room temperature with speed range ~ 1000 rpm.
The measurement was again carried out at peak wavelength of each material to trace the
alteration in the intensity which can be further used to describe the suspension stability
for CNDG-WEG with different intervals. It can be seen that all colloidal mixtures show
almost 1% decrease (can be attributed to the error in measurement) in the relative
concentrations as the time progressed, indicating that the colloidal suspensions have been
remained stable for 20 days without irreversible particle aggregation.
70
75
80
85
90
95
100
0 5 10 15 20 25 30
Re
lati
ve
co
nce
ntr
ati
on
Time (day)
(b)
0.001 CNDG-WEG
0.005 CNDG-WEG
0.01 CNDG-WEG
Figure 4.41: (a) UV–Vis spectrum of CNDG-WEG at different concentrations and (b) the colloidal stability of CNDG in water-EG mixture as a function of time and weight
concentration.
Univers
ity of
Mala
ya

195
The feasibility of forming stable CNDG-WEG dispersions through electrostatic
stabilization was examined by the zeta potential analysis. The zeta potential values more
negative than -30 mV or more positive than +30 mV are generally considered to represent
sufficient mutual repulsion to ensure the stability of a dispersion (S. Park & Ruoff, 2009).
Concerning the CNDG-WEG interface, it is known that GNDG nanosheets have negative
charges when they are dispersed in water-EG mixture (S. A. Hasan et al., 2012). As shown
in Figure 4.43, zeta potential of CNDG-WEG coolant at pH ~ 7 was highly negative
revealing strong repulsive forces between CNDG nanosheets. As the figure shows, by
increasing the weight concentration from 0.001 to 0.01 wt.%, zeta potential decreased
from -47.7 to -57 (Figure 4.44). The increase in nitrogen group and acidity (unreacted
COOH) of the suspension by increasing CNDG loading indicates that more number of
protons (H+) are released through deprotonation of pyrrolic N and/or remaining acidic-
groups. The electrostatic repulsion between CNDG nanosheets can also be considered as
one of the reasons in the preventing of the CNDG sheets from aggregating (C.-J. Shih et
98
98.2
98.4
98.6
98.8
99
99.2
99.4
99.6
99.8
100
0 4 8 12 16 20
Re
lati
ve c
on
cen
tra
tio
n%
Time (day)
0.01 CNDG-WEG
Figure 4.42: The colloidal stability of the HCND-WEG for weight concentration of 0.01 wt.% obtained by performing UV measurements for 20 days on suspensions
mechanically stirred with speed range ~ 1000 rpm every day.
Univers
ity of
Mala
ya

196
al., 2011). The negative zeta potential value indicates that the surface charges are
negative. Also, it can be concluded that higher weight concentration means higher
electrical conductivity, which can be a reason for decreasing trend of zeta potential (or
higher absolute amount of zeta potential).
10
20
30
40
50
60
70
-70
-65
-60
-55
-50
-45
-40
-35
-30
-25
-20
0 0.002 0.004 0.006 0.008 0.01 0.012
Ele
ctri
cal
con
du
ctiv
ity
(μ
S/c
m)
ζ-p
ote
nti
al
Weight Percent
Zeta-potential
Electrical conductivity
Figure 4.43: Zeta-potential and electrical conductivity of CNDG-WEG at 25 °C.
Univers
ity of
Mala
ya
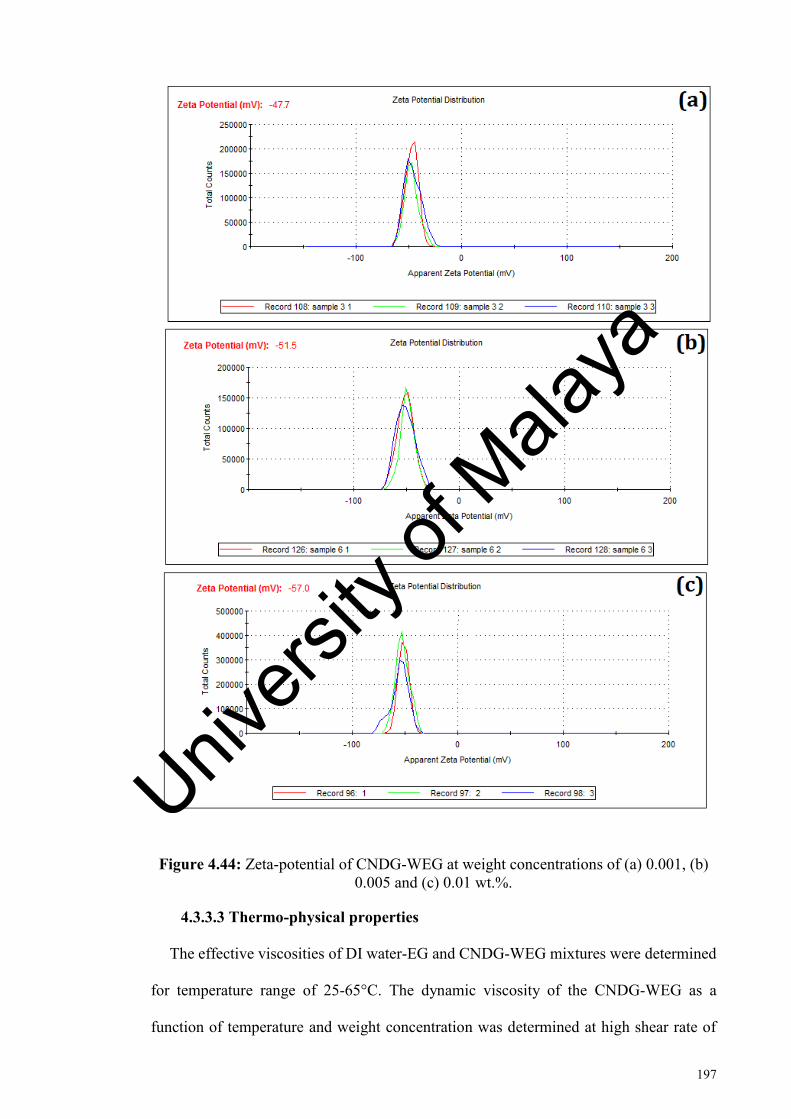
197
4.3.3.3 Thermo-physical properties
The effective viscosities of DI water-EG and CNDG-WEG mixtures were determined
for temperature range of 25-65°C. The dynamic viscosity of the CNDG-WEG as a
function of temperature and weight concentration was determined at high shear rate of
Figure 4.44: Zeta-potential of CNDG-WEG at weight concentrations of (a) 0.001, (b) 0.005 and (c) 0.01 wt.%.
Univers
ity of
Mala
ya
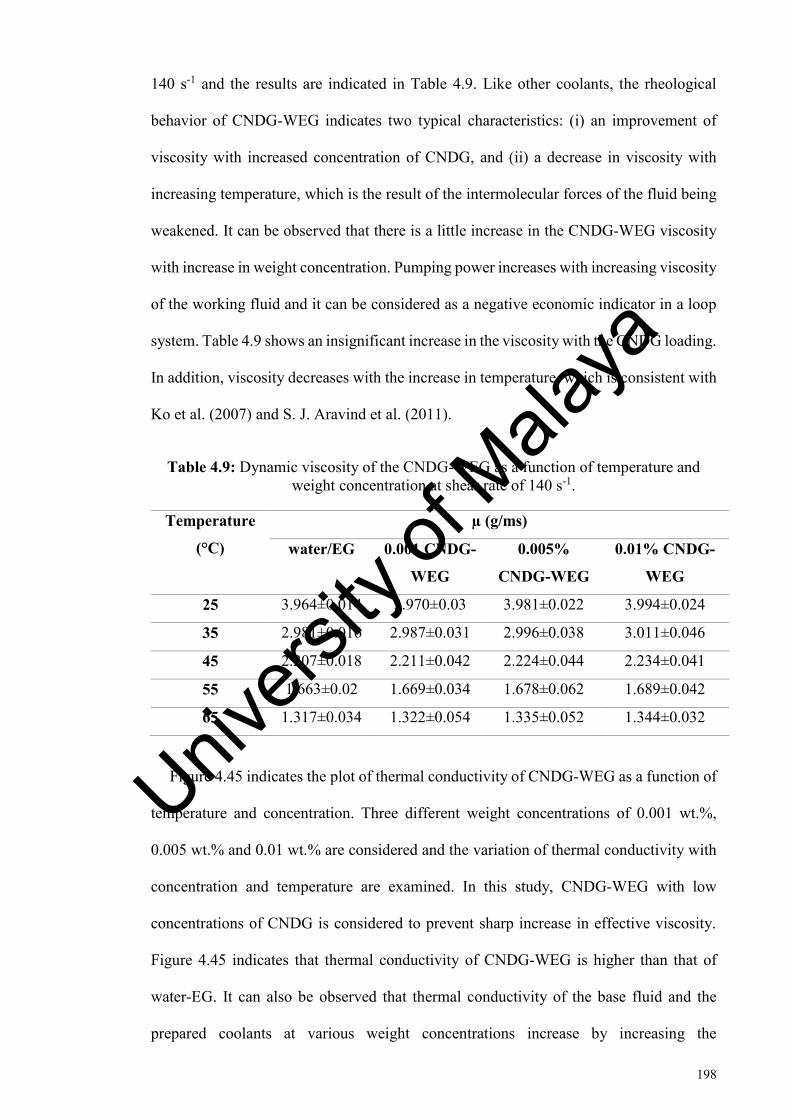
198
140 s-1 and the results are indicated in Table 4.9. Like other coolants, the rheological
behavior of CNDG-WEG indicates two typical characteristics: (i) an improvement of
viscosity with increased concentration of CNDG, and (ii) a decrease in viscosity with
increasing temperature, which is the result of the intermolecular forces of the fluid being
weakened. It can be observed that there is a little increase in the CNDG-WEG viscosity
with increase in weight concentration. Pumping power increases with increasing viscosity
of the working fluid and it can be considered as a negative economic indicator in a loop
system. Table 4.9 shows an insignificant increase in the viscosity with the CNDG loading.
In addition, viscosity decreases with the increase in temperature, which is consistent with
Ko et al. (2007) and S. J. Aravind et al. (2011).
Temperature
(°C)
µ (g/ms)
water/EG 0.001 CNDG-
WEG
0.005%
CNDG-WEG
0.01% CNDG-
WEG
25 3.964±0.014 3.970±0.03 3.981±0.022 3.994±0.024
35 2.981±0.016 2.987±0.031 2.996±0.038 3.011±0.046
45 2.207±0.018 2.211±0.042 2.224±0.044 2.234±0.041
55 1.663±0.02 1.669±0.034 1.678±0.062 1.689±0.042
65 1.317±0.034 1.322±0.054 1.335±0.052 1.344±0.032
Figure 4.45 indicates the plot of thermal conductivity of CNDG-WEG as a function of
temperature and concentration. Three different weight concentrations of 0.001 wt.%,
0.005 wt.% and 0.01 wt.% are considered and the variation of thermal conductivity with
concentration and temperature are examined. In this study, CNDG-WEG with low
concentrations of CNDG is considered to prevent sharp increase in effective viscosity.
Figure 4.45 indicates that thermal conductivity of CNDG-WEG is higher than that of
water-EG. It can also be observed that thermal conductivity of the base fluid and the
prepared coolants at various weight concentrations increase by increasing the
Table 4.9: Dynamic viscosity of the CNDG-WEG as a function of temperature and weight concentration at shear rate of 140 s-1.
Univers
ity of
Mala
ya

199
temperature. For CNDG-WEG samples, the increase in thermal conductivity with
temperature is more sensible. Therefore, it supports that the temperature plays an
important role in increasing the thermal conductivity of CNDG-WEG coolant. The
enhancement of thermal conductivity with increase of temperature is attributed to the
Brownian motion of the nanoparticles, which are suspended in the base-fluid (Aravind et
al., 2011). Figure 4.45 also indicates that CNDG-WEG samples show larger enhancement
in thermal conductivity at higher weight concentration of CNDG.
According to (Aravind et al., 2011; Jha & Ramaprabhu, 2008), the formation of
surface nanolayers plays a key role in heat transfer for CNDG base-fluids. Liquid
molecules create layers around the CNDG, so enhance local ordering of the liquid layer
at the interface region. Therefore, the liquid layer at the interface would indicate a higher
thermal conductivity compared to the base-fluid. The higher slope in thermal conductivity
of CNDG-WEG coolant with concentration of 0.01 wt.% shows higher rate of formation
0.27
0.29
0.31
0.33
0.35
0.37
0.39
0.41
0.43
20 30 40 50 60 70
Th
erm
al
Co
nd
uct
ivit
y (
W/
m.K
)
Temperature (°C)
water/EG
0.001 CNDG-WEG%
0.005 CNDG-WEG
0.01 CNDG-WEG
Figure 4.45: Thermal conductivity plot of CNDG-WEG at different weight concentrations and pure water–EG mixture. Univers
ity of
Mala
ya
200
of the surface nanolayers. Layering of base fluid molecules on the surface of nanoparticles
in a nanofluid should be studied using nuclear magnetic resonance (NMR). Professor
Buongiorno and his coworker from Massachusetts Institute of Technology (Gerardi et al.,
2009) show a thin ordered layer of liquid molecules surrounds each nanoparticle with
NMR method. This ordered layer increases the nanoparticle effective volumetric fraction;
however, the nanofluid thermal conductivity appears to be unaffected by this layer.
Numerous researchers applied the concept of liquid/solid interfacial layer to show the
different enhancements of the thermal conductivity in nanofluids. Some studies (W Yu &
Choi, 2003, 2004) proposed some models according to the conventional theory by
considering a liquid molecular layer around the nanoparticles. However, some theoretical
and experimental studies e.g. Xue et al. (2004) and Gerardi et al. (2009) showed that the
thermal transport in layered liquids had no effect on the heat transfer characteristics and
it is not adequate to explain the increased thermal conductivity of suspensions included
nanoparticles.
In order to elucidate the reasons for the strange growth in thermal conductivity of
nanofluids, Keblinski et al. (2002) and Eastman et al. (2004) suggested four potential
mechanisms e.g. molecular-level layering of the liquid at the liquid/particle interface,
Brownian motion of the nanoparticles, the nature of heat transport in the nanoparticles,
and the effects of nanoparticle clustering. They suggested that the effect of Brownian
motion can be neglected since influence of thermal diffusion is higher than Brownian
diffusion. However, they only measured the cases of stationary nanofluids. Xinwei Wang
et al. (1999) concluded that the thermal conductivity of nanofluids is a function of the
particle structure and microscopic motion (Brownian motion and inter-particle forces).
Also, Xuan and Li (2000) argued that some effective reasons for improving the
thermal conductivity of nanofluids e.g. the increased surface area by suspended
nanoparticles, the increased thermal conductivity of the fluid, the interaction and collision
Univers
ity of
Mala
ya

201
among particles, the intensified mixing fluctuation and turbulence of the fluid, and the
dispersion of nanoparticles. Khaled and Vafai (2005) also studied the effect of thermal
conductivity on heat transfer enhancement of nanofluids. These results suggested that
utilization of a dispersive element in the core region has no effect on the heat transfer rate.
However, the corresponding dispersive elements led to almost 21% enhancement in
Nusselt number for a uniform tube supplied by a fixed heat flux as compared to the
uniform distribution for the dispersive elements. These results suggest a conceivable
elucidation for the enhanced thermal conductivity of nanofluids which can regulate
partially by the dispersive properties.
Wen and Ding (Ding & Wen, 2005; D. Wen & Ding, 2005) investigated the
influence of particle migration on heat transfer characteristics in nanofluids flowing
through mini-channels theoretically. The influence of shear-induced and viscosity-
gradient-induced particle migration and the self-diffusion due to Brownian motion on
heat transfer rate were investigated. Their results illustrated a considerable non-
uniformity in particle concentration and thermal conductivity over the test-section due to
particle migration, which resulted in a higher Nusselt number as compared to the uniform
distribution of thermal conductivity. Koo and Kleinstreuer (2005) discussed the effects
of Brownian, thermo-phoretic, and osmo-phoretic motions on the effective thermal
conductivities. They proposed that Brownian motion is a much more vital factor than the
thermo- and osmo-phoretic motions. However, their claim has not been confirmed by
experiment yet. Evans et al. (2006) proposed that the effect of Brownian motion on the
thermal conductivity enhancement of the nanofluid is insignificant and it alone is not able
to reach this amount of extraordinary thermal transport properties. They employed the
molecular dynamics simulations and the effective medium theory, but, they just focused
on the stationary fluids, which weakens their results.
Univers
ity of
Mala
ya

202
Rather than abovementioned reasons, the effect of surface charge state of the
nanoparticle in suspension on the thermal conductivity was experimentally studied by
Lee et al. (D. Lee et al., 2006). They illustrated that the pH value of the nanofluid strongly
influenced the heat transfer rate of the fluid. With farther diverged pH value from the
isoelectric point of the particles, the nanoparticles in the suspension got more stable state
to change the thermal conductivity. That may partially explain the disparities between
different experimental data since many researchers used surfactants in nanofluids, but
with insufficient descriptions. Vadasz (Vadasz, 2006) demonstrated that the transient heat
conduction process in nanofluids may provide a valid explanation for the apparent heat
transfer enhancement by adopting a variation of the classical heat conduction method in
porous media to the problem of heat conduction in nanofluid. Hence, so far there are no
general mechanisms to rule the strange behavior of nanofluids including the highly
improved effective thermal conductivity, although many possible factors have been
considered, including Brownian motion, liquid–solid interface layer, ballistic phonon
transport, and surface charge state. However, there are still some other possible macro-
scale explanations such as heat conduction, particle-driven natural convection,
convection induced by electrophoresis, thermo-phoresis, etc.
In this section, the effects of temperature in a range of 25 to 65 °C as well as weight
concentration of CNDG on the specific heat capacity of CNDG-WEG coolant is studied.
Figure 4.46a indicates an increase in the weight concentrations of CNDG leads to a drop
in the specific heat capacity. In particular, an average drop of 1.2 % to 2% is observed for
weight concentration of 0.001 to 0.01 wt. %, respectively. Also, as the temperature
increases specific heat capacity increases gradually. Specific heat capacity decreases in
the presence of CNDG-WEG which can be attributed to the lower specific heat capacity
of CNDG loaded in water-EG mixture than that of the base-fluid. Figure 4.46a also
indicates that heat capacity of base-fluid increases with temperature, so it is expected that
Univers
ity of
Mala
ya

203
there would be a rising trend of the specific heat capacity in the presence of CNDG.
However, the specific heat capacities curves of CNDG-WEG indicate almost the same
slopes, which is consistent with Bock Choon Pak and Young I. Cho (1998) results.
Figure 4.46b shows the average drop in Cp as the functions of temperature and weight
concentration of CNDG in basefluid. It is seen that the amount of drop in Cp increases
with increasing temperature and/or weight concentration. At weight concentration of 0.01
wt.%, the drop in Cp increases by an average of 2.026%, which is an insignificant change.
3100
3120
3140
3160
3180
3200
3220
3240
3260
3280
20 30 40 50 60 70
Cp
(J/
kg
.K)
Temperature (°C)
Water-EG
0.001 CNDG-WEG
0.005 CNDG-WEG
0.01 CNDG-WEG
a
Univers
ity of
Mala
ya

204
Note that some of the thermo-physical properties have shown negative effects by
nanoparticle loading. It is well known that under different flow regimes, the heat transfer
rate of coolants depends on the whole of thermo-physical properties of the fluid, and can
be evaluated from the Mouromtseff number, Mo (Halelfadl et al., 2014; Minea et al.; W
Yu et al., 2010; Wenhua Yu et al., 2009a; Wenhua Yu et al., 2013). Mouromtseff number
is a figure of merit to evaluate and compare the heat transfer capability of alternative
thermal fluids. This number is defined by Eq. 5.2. Higher the Mouromtseff number, better
the potential of the nanofluid as coolant. At the constant flow velocity for a turbulent flow,
the relative Mo number ratio with the heat transfer coefficient is predicted by the Dittus–
Boelter equation as expressed by different researchers (Minea et al.; Wenhua Yu et al.,
2013):
𝑀𝑜𝑛𝑓
𝑀𝑜𝑏𝑓= (𝜌𝑛𝑓
𝜌𝑏𝑓)0.8(
𝐶𝑝𝑛𝑓
𝐶𝑝𝑏𝑓)0.4(
µ𝑛𝑓
µ𝑏𝑓)−0.4(
𝑘𝑛𝑓
𝑘𝑏𝑓)0.6
4.2
0
0.5
1
1.5
2
2.5
20 30 40 50 60 70
Av
era
ge
dro
p i
n C
p (
%)
Temperature (°C)
0.001 CNDG-WEG
0.005 CNDG-WEG
0.01 CNDG-WEG
b
Figure 4.46: The effects of inlet temperature and weight concentration of CNDG-WEG on the specific heat capacities of coolant.
Univers
ity of
Mala
ya

205
To elucidate the potential of the samples, the Mouromtseff number ratios (or
equivalently or heat transfer coefficient ratios) calculated from Eq. (5.2) for the CNDG-
WEG nanofluids at various particle weight concentrations of 0.001, 0.005, and 0.01 % in
turbulent flow with the heat transfer coefficients are predicted by the Dittus–Boelter
equation and plotted as a function of the temperature in Figure 4.47. It can be seen that
the Mouromtseff number ratios of the CNDG-WEG over the base fluid are bigger than 1
for all the weight concentrations and temperatures. These results also show that the
temperature effect is one of the important factors affecting the Mouromtseff number
ratios. Also, these levels of heat transfer (Mouromtseff number ratios) enhancement at
different temperatures are very attractive for the common high- and low-temperature heat
transfer applications.
4.3.4 Water/ethylene glycol-based EG-treated graphene nanosheets
nanofluids
4.3.4.1 Preparation
After preparation of the EG-treated GNP (section 4.2.4), as expected, the EG-
treated GNP can easily be dispersed in a mixture of water–EG as a base-fluid (Figure
4.48) due to easily-miscible EG functionalities. EG as a functional group, not only
1
1.01
1.02
1.03
1.04
1.05
1.06
1.07
1.08
1.09
1.1
1.11
10 20 30 40 50 60 70
Mo
nf/
Mo
bf
Temperature (°C)
0.001 CNDG-WEG0.005 CNDG-WEG0.01 CNDG-WEG
Figure 4.47: The relative Mo numbers of CNDG-WEG for turbulent flow conditions. Univers
ity of
Mala
ya

206
provide suitable dispersibility, but also the synthesized coolant suspension has no
corrosive effect on different metals or engine parts. The easily-miscible EG
functionalities could be responsible for a significant increase in dispersibility of the
functionalized GNP with EG in both the media of water and EG. EG-treated GNP based
water–EG coolant (GNP-WEG) were synthesized at different weight concentrations.
4.3.4.2 Thermo-physical properties
The effective viscosities of DI water-EG and GNP-WEG mixtures were measured
at the temperature range of 25-65 °C. The dynamic viscosity of the GNP-WEG as a
function of temperature and weight concentration was measured at high shear rate of 140
s-1 and the results are shown in Table 4.10. Similar to other coolants, the rheological
behavior of GNP-WEG shows two typical characteristics: (i) an enhancement of viscosity
with increasing concentration of EG-treated GNP, and (ii) a decrease in viscosity with
increasing temperature, which is due to weakening of the intermolecular forces of the
fluid itself. It can be seen that the enhancement in the GNP-WEG viscosity are
insignificant with increase in weight concentration, which can show a positive point of
the chemical treatment. In addition, the data are in agreement with the results of Ko et
al. (2007) and Aravind et al. (2011), that the viscosity decreases with the increase in
temperature.
Figure 4.48: Photographs of EG-treated GNP dispersed in water–EG (after 1 month).
Univers
ity of
Mala
ya
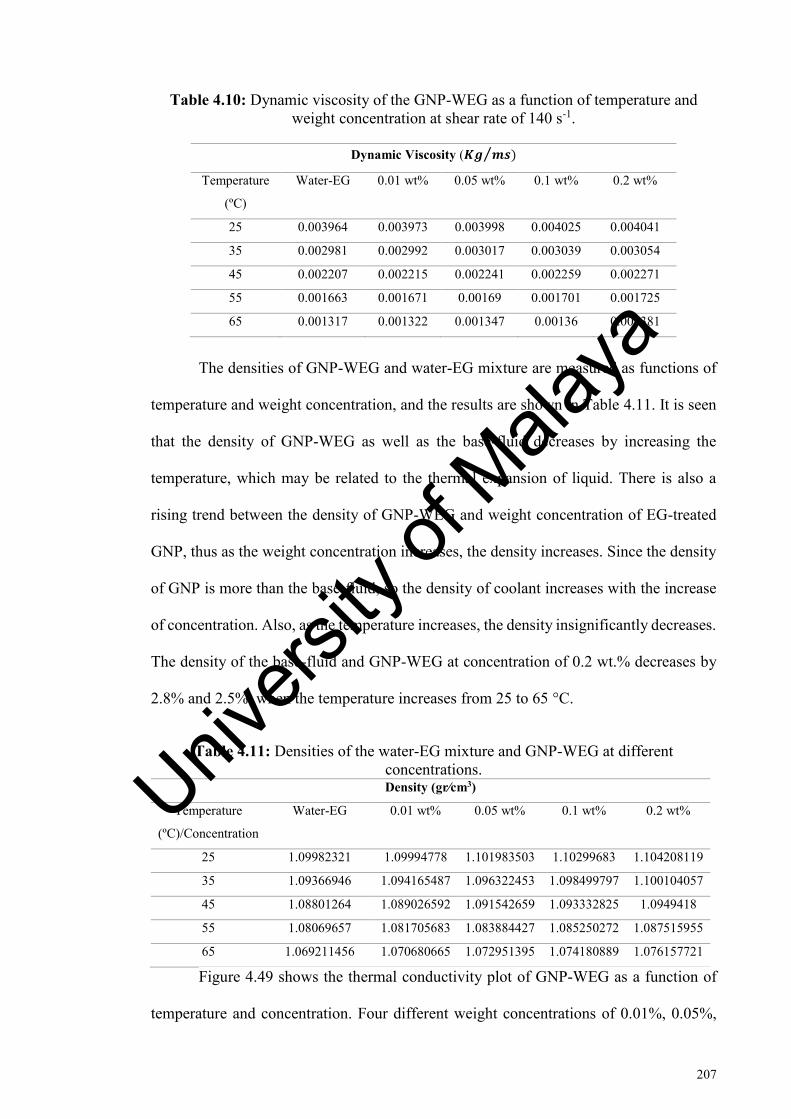
207
Dynamic Viscosity (𝑲𝒈 𝒎𝒔)⁄
Temperature
(ºC)
Water-EG 0.01 wt% 0.05 wt% 0.1 wt% 0.2 wt%
25 0.003964 0.003973 0.003998 0.004025 0.004041
35 0.002981 0.002992 0.003017 0.003039 0.003054
45 0.002207 0.002215 0.002241 0.002259 0.002271
55 0.001663 0.001671 0.00169 0.001701 0.001725
65 0.001317 0.001322 0.001347 0.00136 0.001381
The densities of GNP-WEG and water-EG mixture are measured as functions of
temperature and weight concentration, and the results are shown in Table 4.11. It is seen
that the density of GNP-WEG as well as the base-fluid decreases by increasing the
temperature, which may be related to the thermal expansion of liquid. There is also a
rising trend between the density of GNP-WEG and weight concentration of EG-treated
GNP, thus as the weight concentration increases, the density increases. Since the density
of GNP is more than the base-fluid, so the density of coolant increases with the increase
of concentration. Also, as the temperature increases, the density insignificantly decreases.
The density of the base-fluid and GNP-WEG at concentration of 0.2 wt.% decreases by
2.8% and 2.5%, when the temperature increases from 25 to 65 °C.
Density (gr∕cm3)
Temperature
(ºC)/Concentration
Water-EG 0.01 wt% 0.05 wt% 0.1 wt% 0.2 wt%
25 1.09982321 1.09994778 1.101983503 1.10299683 1.104208119
35 1.09366946 1.094165487 1.096322453 1.098499797 1.100104057
45 1.08801264 1.089026592 1.091542659 1.093332825 1.0949418
55 1.08069657 1.081705683 1.083884427 1.085250272 1.087515955
65 1.069211456 1.070680665 1.072951395 1.074180889 1.076157721
Figure 4.49 shows the thermal conductivity plot of GNP-WEG as a function of
temperature and concentration. Four different weight concentrations of 0.01%, 0.05%,
Table 4.10: Dynamic viscosity of the GNP-WEG as a function of temperature and weight concentration at shear rate of 140 s-1.
Table 4.11: Densities of the water-EG mixture and GNP-WEG at different concentrations. Univ
ersity
of M
alaya
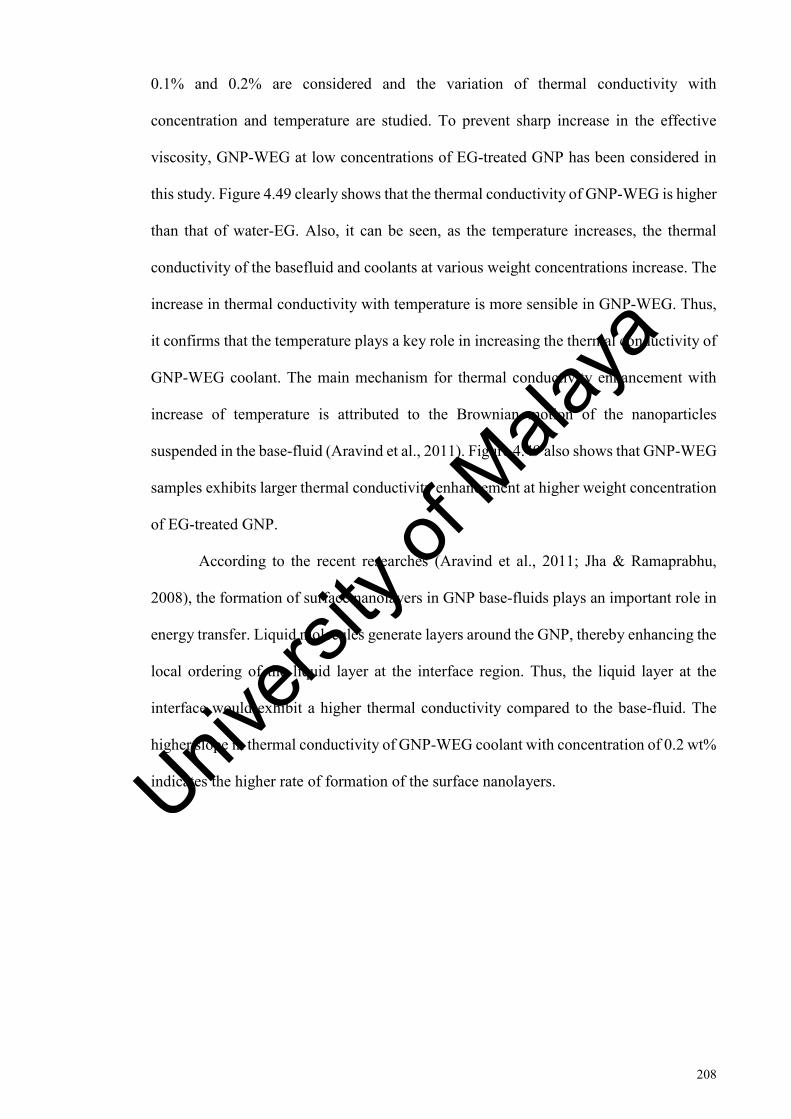
208
0.1% and 0.2% are considered and the variation of thermal conductivity with
concentration and temperature are studied. To prevent sharp increase in the effective
viscosity, GNP-WEG at low concentrations of EG-treated GNP has been considered in
this study. Figure 4.49 clearly shows that the thermal conductivity of GNP-WEG is higher
than that of water-EG. Also, it can be seen, as the temperature increases, the thermal
conductivity of the basefluid and coolants at various weight concentrations increase. The
increase in thermal conductivity with temperature is more sensible in GNP-WEG. Thus,
it confirms that the temperature plays a key role in increasing the thermal conductivity of
GNP-WEG coolant. The main mechanism for thermal conductivity enhancement with
increase of temperature is attributed to the Brownian motion of the nanoparticles
suspended in the base-fluid (Aravind et al., 2011). Figure 4.49 also shows that GNP-WEG
samples exhibits larger thermal conductivity enhancement at higher weight concentration
of EG-treated GNP.
According to the recent researches (Aravind et al., 2011; Jha & Ramaprabhu,
2008), the formation of surface nanolayers in GNP base-fluids plays an important role in
energy transfer. Liquid molecules generate layers around the GNP, thereby enhancing the
local ordering of the liquid layer at the interface region. Thus, the liquid layer at the
interface would exhibit a higher thermal conductivity compared to the base-fluid. The
higher slope in thermal conductivity of GNP-WEG coolant with concentration of 0.2 wt%
indicates the higher rate of formation of the surface nanolayers. Univers
ity of
Mala
ya
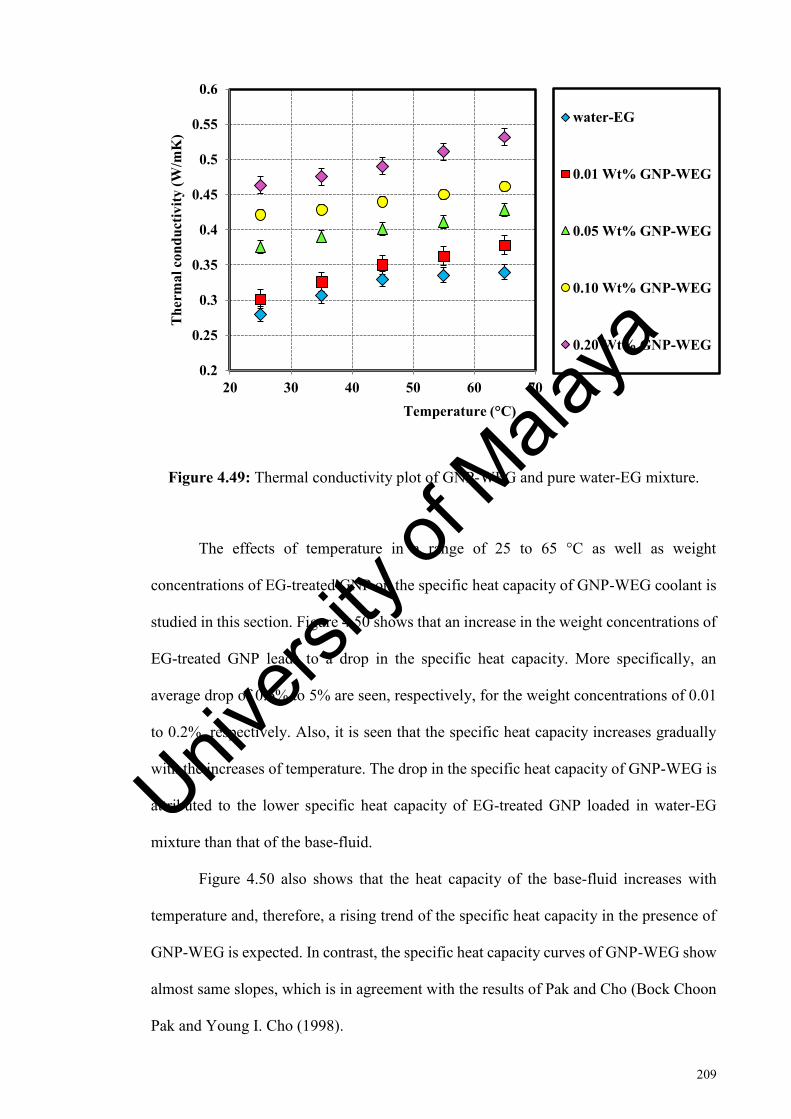
209
The effects of temperature in a range of 25 to 65 °C as well as weight
concentrations of EG-treated GNP on the specific heat capacity of GNP-WEG coolant is
studied in this section. Figure 4.50 shows that an increase in the weight concentrations of
EG-treated GNP leads to a drop in the specific heat capacity. More specifically, an
average drop of 0.6% to 5% are seen, respectively, for the weight concentrations of 0.01
to 0.2%, respectively. Also, it is seen that the specific heat capacity increases gradually
with the increases of temperature. The drop in the specific heat capacity of GNP-WEG is
attributed to the lower specific heat capacity of EG-treated GNP loaded in water-EG
mixture than that of the base-fluid.
Figure 4.50 also shows that the heat capacity of the base-fluid increases with
temperature and, therefore, a rising trend of the specific heat capacity in the presence of
GNP-WEG is expected. In contrast, the specific heat capacity curves of GNP-WEG show
almost same slopes, which is in agreement with the results of Pak and Cho (Bock Choon
Pak and Young I. Cho (1998).
0.2
0.25
0.3
0.35
0.4
0.45
0.5
0.55
0.6
20 30 40 50 60 70
The
rmal
con
duct
ivity
(W/m
K)
Temperature (°C)
water-EG
0.01 Wt% GNP-WEG
0.05 Wt% GNP-WEG
0.10 Wt% GNP-WEG
0.20 Wt% GNP-WEG
Figure 4.49: Thermal conductivity plot of GNP-WEG and pure water-EG mixture.
Univers
ity of
Mala
ya

210
4.3.5 Water-based carboxylated GNP nanofluids
4.3.5.1 Preparation of nanofluids
In the case of covalent nanofluids, the carboxylated GNPs (GNP-COOH) produced
after microwave phase (section 4.2.6) were highly dispersible in the deionized water at
room temperature. Dispersed GNPs at concentration of 0.1 wt% was easily obtained in
water in the presence of COOH groups. The dispersions results illustrated no sign of GNP
sedimentation after 1 month under ambient conditions.
To provide non-covalent nanofluids at the known weight concentrations, the estimated
amount of pristine GNP was first weighted, followed by pouring a weight ratio of
SDBS/pristine GNP (0.5:1) into a vessel filled with the required distillated water (Botelho
et al., 2011).
In the current study, two aqueous nanofluids comprising of GNP-COOH and GNP-
SDBS at concentrations of 0.025, 0.05 and 0.1 wt% were prepared. To obtain stable and
homogeneous suspensions, GNP-COOH and GNP-SDBS samples were sonicated in
water about 10 min.
3
3.05
3.1
3.15
3.2
3.25
3.3
20 30 40 50 60 70
Spec
ific h
eat c
apac
ity (J
/g°K
)
Temperature (°C)
water-EG
0.01 Wt% GNP-WEG
0.05 Wt% GNP-WEG
0.10 Wt% GNP-WEG
0.20 Wt% GNP-WEG
Figure 4.50: The effects of temperature and weight concentrations of EG-treated GNP on the specific heat capacity of GNP-WEG coolant.
Univers
ity of
Mala
ya

211
4.3.5.2 Thermo-physical properties
Figure 4.51 shows the thermal conductivity of water-based nanofluids including
GNP-COOH and GNP-SDBS at the weight concentrations of 0.025%, 0.05% and 0.1%
and at different temperatures. In Figure 4.51, one can clearly see that the thermal
conductivity of water based GNP-COOH and GNP-SDBS nanofluids are higher than that
of water. In addition, the thermal conductivity increases as the concentrations of GNP in
the water-based nanofluids increases. In nanofluids, the main mechanism of thermal
conductivity enhancement can be attributed to the Brownian motion of the suspended
particles as it is one of the most dominating functions of temperature (S. J. Aravind et al.,
2011). Figure 4.51 also shows that the thermal conductivity for GNP-COOH prepared
nanofluid is higher than that of GNP-SDBS. For nanofluids comprising of carbon
nanostructures like GNP with chemical functionalization, in addition to the Brownian
motion of GNP, the formation of surface nanolayers dominate the energy transfer in the
nanofluids.
0.55
0.6
0.65
0.7
0.75
0.8
0.85
0.9
15 25 35 45 55
The
rmal
Con
duct
ivity
(Wm
-1K
-1)
Temprature (˚C)
water
GNP-SDBS (0.025%)
GNP-SDBS (0.05%)
GNP-SDBS (0.1%)
GNP-COOH(0.025%)
GNP-COOH (0.05%)
GNP-COOH (0.1%)
Figure 4.51: Thermal conductivity of GNP-based water nanofluids at different temperatures and weight concentrations.
Univers
ity of
Mala
ya

212
The higher thermal conductivity of GNP-COOH can be attributed to the higher
effective heat transfer area in the presence of covalent functional groups. Liquid
molecules create layers around the GNP, thereby increasing the local ordering of the
liquid layer at the interface region. The liquid layer at the interface would reasonably have
a higher thermal conductivity than the bulk liquid (S. J. Aravind et al., 2011). Thus, the
nanolayer is considered as an essential parameter in increasing the thermal conductivity
of the GNP-based nanofluids. On the other hand, absorbing non-covalent groups on the
surface of GNP can reduce the generation of layers around the nanostructures by
decreasing the effective heat transfer area, since non-covalent groups warp around the
GNP flakes and thereby decreasing the local liquid layer at the interface area of GNPs.
Also, the generation of more hydrophilic phase on the GNP surface by addition of
oxygen-containing functional groups (COOH) may result in the more homogeneous
dispersion in basefluids (Jha & Ramaprabhu, 2008).
Thus, when surfactant like SDBS is utilized to increase the dispersibility of carbon
nanostructures, surfactants tend to wrap around them, preventing the enhancement of
nanolayer, leading to lower microconvection (Duan et al., 2011; Kim et al., 2010).
Furthermore, Figure 4.51 confirmed that the thermal conductivity of nanofluids is
a function of temperature. In all samples, an increase in temperature results in an
enhancement of thermal conductivity, with the higher slope in covalent water-based
nanofluids, which can validate the presence of higher Brownian motion (Duan et al.,
2011; Jha & Ramaprabhu, 2008).
The viscosity of nanofluids is another important parameter for characterizing the
suitability of the nanofluids for heat transfer applications. Figure 4.52 shows the measured
viscosity of the prepared GNP nanofluids versus temperature for a shear rate of 300 s−1 at
various concentrations. It is seen that both the GNP-COOH/water and GNP-SDBS/water
Univers
ity of
Mala
ya

213
have higher viscosities than that of the deionized water. As expected, the viscosity of all
the samples decreases as temperature increases at a constant concentration.
As can be seen in Figure 4.52, the GNP-SDBS/water nanofluids have significantly
higher viscosity than those of covalent nanofluids (GNP-COOH/water) under similar
experimental conditions. This infers that surfactants such as SDBS and GA are the main
reason for the increase of viscosity of nanofluids. Interestingly, the viscosity of GNP-
SDBS/water nanofluid at concentration of 0.025% is larger than that of GNP-
COOH/water nanofluid at the concentration of 0.01%, which is due to the influence of
surfactants or non-covalent functionalization on nanofluids viscosity.
Table 4.12 shows the average percentage increase in viscosity of the nanofluids
compared with the deionized water. The percentage increase is evaluated as shown in
Equation 4.3.
0
0.0002
0.0004
0.0006
0.0008
0.001
0.0012
0.0014
0.0016
0.0018
10 30 50 70 90
Vis
cosi
ty (P
a.s)
Temprature (˚C)
WATER
GNP-SDBS(0.025%)
GNP-SDBS (0.05%)
GNP-SDBS (0.1%)
GNP-COOH(0.025%)
GNP-COOH(0.05%)
GNP-COOH (0.1%)
Figure 4.52: Viscosity of the GNP-based water nanofluids as a function of temperature and concentration for a shear rate of 300 s−1.
Univers
ity of
Mala
ya

214
Percentage increase =𝜇𝑛𝑎𝑛𝑜𝑓𝑙𝑢𝑖𝑑−𝜇𝑤𝑎𝑡𝑒𝑟
𝜇𝑤𝑎𝑡𝑒𝑟 4.3
Percentage increase of nanofluid viscosity for different temperatures and concentrations T(°C) GNP-SDBS
0.025 wt% GNP-SDBS 0.05 wt%
GNP-SDBS 0.1 wt%
GNP-COOH 0.025 wt%
GNP-COOH 0.05 wt%
GNP-COOH
0.1 wt% 20 29.7% 44.7% 54.5% 9.4% 14.7% 21.4% 35 32.7% 50.0% 68.0% 10.5% 13.5% 21.7% 50 41.6% 68.7% 100.7% 13.0% 21.3% 31.3% 65 50.4% 81.4% 122.9% 8.4% 18.9% 36.8% 80 55.0% 83.2% 136.4% 1.4% 15.0% 29.4%
4.3.6 Water-based PEG-treated GNP and acetone-based Azo-treated GNP
acetone nanofluids
4.3.6.1 Preparation of nanofluids
In the case of covalent nanofluids, tetrahydrofurfuryl polyethylene glycol-treated
GNP (PEG-treated GNP) and 4-phenylazophenol-treated GNP (Azo-treated GNP)
produced after microwave phase were highly dispersible in some of the solvents at room
temperature (section 4.2.5). Dispersion of the treated GNPs at the concentration of
0.1 wt% was easily obtained in some solvents in the presence of functional groups. The
dispersions results illustrated a small amount of GNP sedimentation after 1 month under
ambient conditions.
4.3.6.2 Colloidal Stability
Plot of absorbance versus wavelength for different colloidal solutions (PEG-
treated GNP based water and Azo-treated GNP based acetone) were investigated to
indirectly trace the presence of specific particles within the binary system. Figure 4.53
panels (1) and (2) show the plot of absorbance intensity versus wavelength for each
bimodal system taken at a specific period of time. The measurements were performed
Table 4.12: The average increase in the viscosity of nanofluids compared with deionized water.
Univers
ity of
Mala
ya
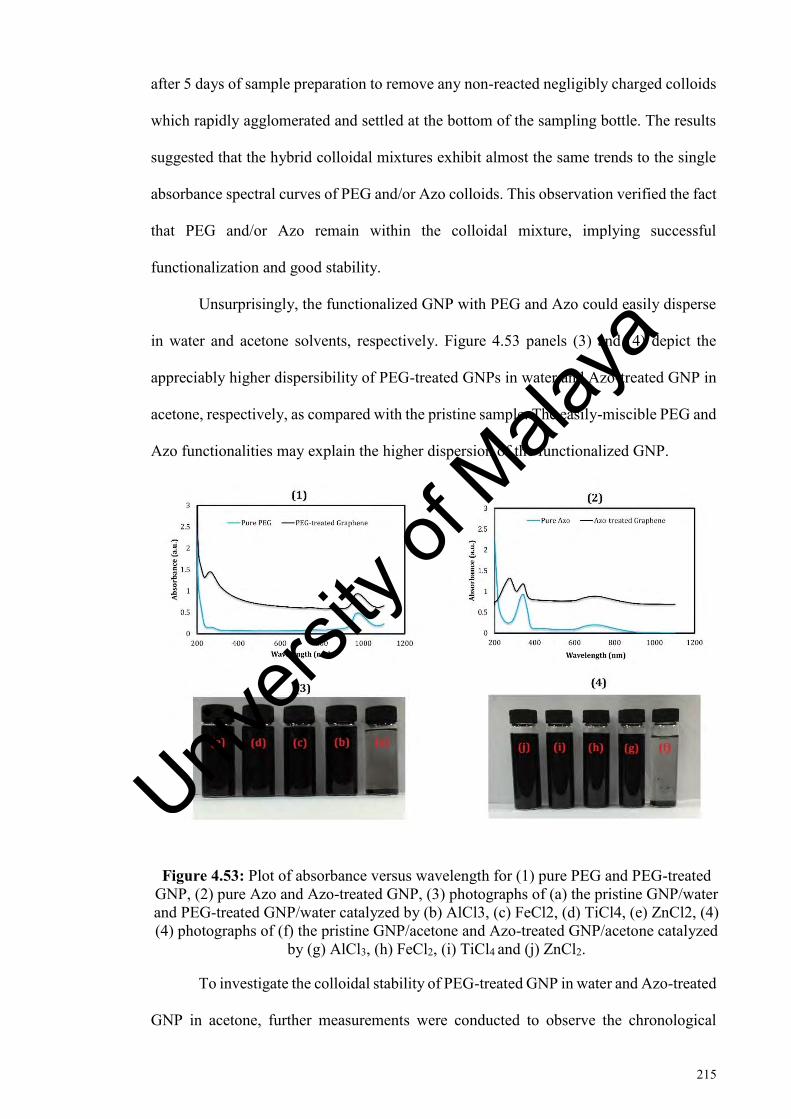
215
after 5 days of sample preparation to remove any non-reacted negligibly charged colloids
which rapidly agglomerated and settled at the bottom of the sampling bottle. The results
suggested that the hybrid colloidal mixtures exhibit almost the same trends to the single
absorbance spectral curves of PEG and/or Azo colloids. This observation verified the fact
that PEG and/or Azo remain within the colloidal mixture, implying successful
functionalization and good stability.
Unsurprisingly, the functionalized GNP with PEG and Azo could easily disperse
in water and acetone solvents, respectively. Figure 4.53 panels (3) and (4) depict the
appreciably higher dispersibility of PEG-treated GNPs in water and Azo-treated GNP in
acetone, respectively, as compared with the pristine sample. The easily-miscible PEG and
Azo functionalities may explain the higher dispersion of the functionalized GNP.
To investigate the colloidal stability of PEG-treated GNP in water and Azo-treated
GNP in acetone, further measurements were conducted to observe the chronological
Figure 4.53: Plot of absorbance versus wavelength for (1) pure PEG and PEG-treated GNP, (2) pure Azo and Azo-treated GNP, (3) photographs of (a) the pristine GNP/water and PEG-treated GNP/water catalyzed by (b) AlCl3, (c) FeCl2, (d) TiCl4, (e) ZnCl2, (4) (4) photographs of (f) the pristine GNP/acetone and Azo-treated GNP/acetone catalyzed
by (g) AlCl3, (h) FeCl2, (i) TiCl4 and (j) ZnCl2.
Univers
ity of
Mala
ya
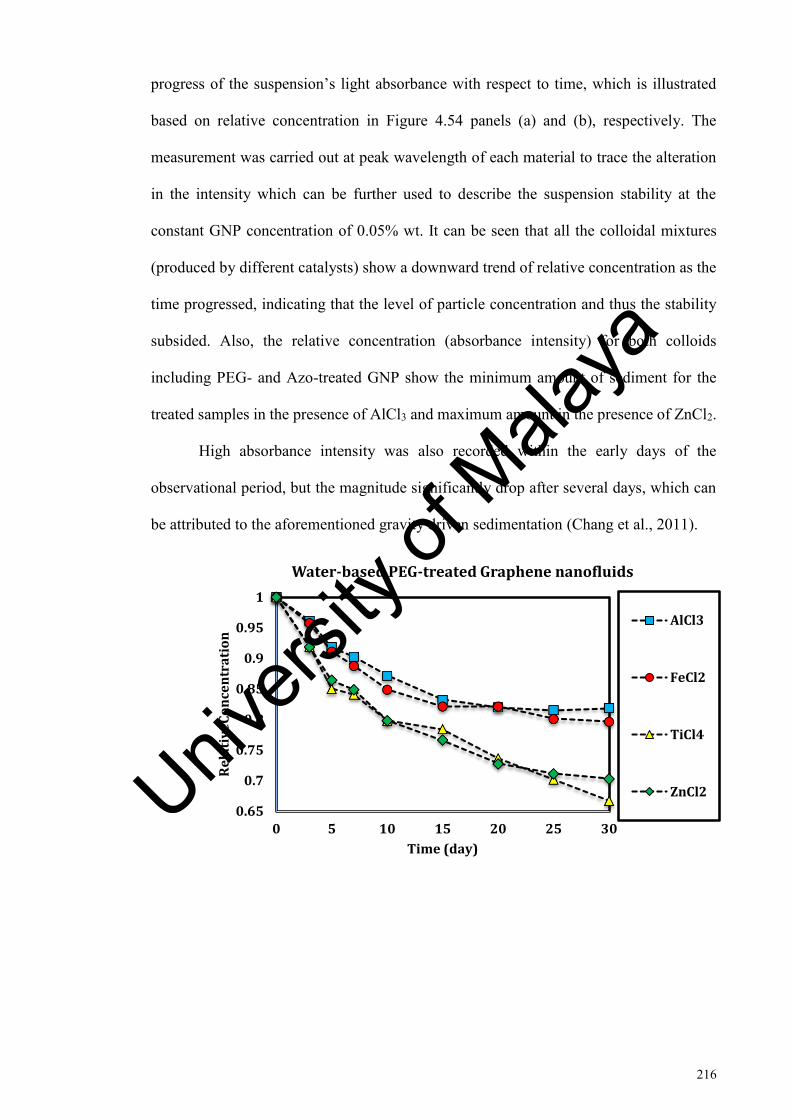
216
progress of the suspension’s light absorbance with respect to time, which is illustrated
based on relative concentration in Figure 4.54 panels (a) and (b), respectively. The
measurement was carried out at peak wavelength of each material to trace the alteration
in the intensity which can be further used to describe the suspension stability at the
constant GNP concentration of 0.05% wt. It can be seen that all the colloidal mixtures
(produced by different catalysts) show a downward trend of relative concentration as the
time progressed, indicating that the level of particle concentration and thus the stability
subsided. Also, the relative concentration (absorbance intensity) for both colloids
including PEG- and Azo-treated GNP show the minimum amount of sediment for the
treated samples in the presence of AlCl3 and maximum amount in the presence of ZnCl2.
High absorbance intensity was also recorded within the early days of the
observational period, but the magnitude significantly drop after several days, which can
be attributed to the aforementioned gravity driven sedimentation (Chang et al., 2011).
0.65
0.7
0.75
0.8
0.85
0.9
0.95
1
0 5 10 15 20 25 30
Re
lati
ve
Co
nce
ntr
ati
on
Time (day)
Water-based PEG-treated Graphene nanofluids
AlCl3
FeCl2
TiCl4
ZnCl2Univers
ity of
Mala
ya
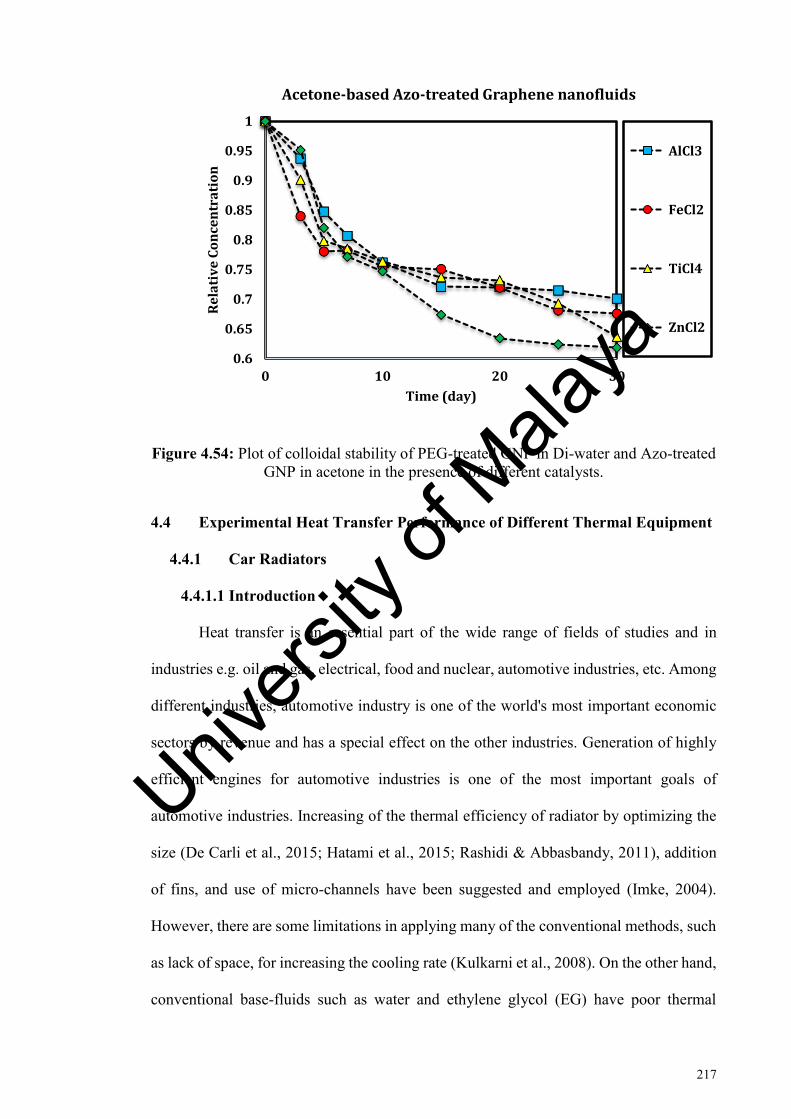
217
4.4 Experimental Heat Transfer Performance of Different Thermal Equipment
4.4.1 Car Radiators
4.4.1.1 Introduction
Heat transfer is an essential part of the wide range of fields of studies and in
industries e.g. oil and gas, electrical, food and nuclear, automotive industries, etc. Among
different industries, automotive industry is one of the world's most important economic
sectors by revenue and has a special effect on the other industries. Generation of highly
efficient engines for automotive industries is one of the most important goals of
automotive industries. Increasing of the thermal efficiency of radiator by optimizing the
size (De Carli et al., 2015; Hatami et al., 2015; Rashidi & Abbasbandy, 2011), addition
of fins, and use of micro-channels have been suggested and employed (Imke, 2004).
However, there are some limitations in applying many of the conventional methods, such
as lack of space, for increasing the cooling rate (Kulkarni et al., 2008). On the other hand,
conventional base-fluids such as water and ethylene glycol (EG) have poor thermal
0.6
0.65
0.7
0.75
0.8
0.85
0.9
0.95
1
0 10 20 30
Re
lati
ve
Co
nce
ntr
ati
on
Time (day)
Acetone-based Azo-treated Graphene nanofluids
AlCl3
FeCl2
TiCl4
ZnCl2
Figure 4.54: Plot of colloidal stability of PEG-treated GNP in Di-water and Azo-treated GNP in acetone in the presence of different catalysts.
Univers
ity of
Mala
ya

218
conductivity, which intensify the reduction of engine efficiency. To solve this issue, high
performance heat transfer fluids can be utilized in the car radiators.
To enhance the heat transfer properties of conventional base-fluids and heat
transfer rate in heat exchangers, addition of different particles, in particular carbon
nanostructures such as carbon nanotubes (CNT), graphene nanoplatelets (GNP) and few-
layered graphene (Gr), has been suggested as a promising approach (Chandrasekaran et
al., 2014; S. U. S. Choi & Eastman, 1995; Dalir et al., 2015; Mohammad Zadeh et al.,
2015; Saidi & Karimi, 2014; X. J. Wang et al., 2014).
Jha and Ramaprabhu (2008) studied the influence of Cu-loaded carbon nanotubes
(Cu-CNTs) in deionized water (DI water) and Cu-CNTs in EG on the thermal
conductivity. They obtained a significant enhancement at a very low volume fraction,
which attributed to the well-dispersibility of Cu-CNTs in the working fluids as well as
the formation of hydrophilic CNT. A similar study was conducted by this group which
showed noticeable enhancement in the thermal conductivity and heat transfer rate
enhancements of CNT-based water nanofluids and the reason was attributed to the
thinning of the thermal boundary layer by CNT resulting to reduction in thermal
resistance (Aravind et al., 2011; Aravind & S. Ramaprabhu, 2013).
The intrinsic heat transfer capacity of the carbon nanostructures could be
considered as the main factor for thermal improvement. For working fluids including
carbon nanostructures such as CNT and graphene, the chemical surface effects and
surface area of carbon nanostructures can dominate the extent of energy transfer in the
prepared coolants (Murshed et al., 2006; Shanbedi et al., 2015). Murshed et al. concluded
that liquid molecules form layers around the carbon nanostructures, thus increasing the
local ordering of the liquid layer at the interface region. It is obvious that the liquid layers
at the interface would fairly have a higher thermal conductivity than the bulk liquid.
Therefore, in addition to the effect of Brownian motion of carbon nanostructures, the
Univers
ity of
Mala
ya

219
prepared nanolayer around nanostructures play a vital role in enhancing the thermal
conductivity of carbon nanostructures-based nanofluids (Murshed et al., 2006).
It is also well known that thermal conductivity and subsequently heat transfer rate
improve as the specific surface area of graphene increases (W. Sarsam et al., 2016a).
Therefore, in order to manufacture highly-conductive nanofluids for improving heat
transfer rate in different thermal equipment, materials with high specific surface areas,
such as crumpled graphene, and in particular, few-layered graphene should be used. Thus,
carbon nanostructures with high surface area can provide better condition for enhancing
heat transfer rate and thermal conductivity of working fluid. To reach a carbon
nanostructure with high surface area and for preparing high-performance heat transfer
coolant, modification of graphene should be elaborately designed by taking the
morphology and pore structure into consideration. It is also noteworthy that N-doping
performs an important role in regulating the electronic, thermal and chemical properties
of carbon materials because of the similar atomic size and the availability of five valence
electrons to form strong valence bonds with carbon atoms. Nitrogen-doped graphene
materials with large mesopores favorable for heat transfer were found to exhibit a good
coolant property as an additive and significantly well-dispersed suspension (Seyed
Shirazi et al., 2015). The higher electronegativities of N (x = 3.04) than that of C atoms
(x = 2.55) in N-doped graphene resulted in a significant surface charge state of
nanoparticles, leading to the excellent stabilized colloidal suspension (Xie et al., 2015).
A significant enhancement in thermal conductivity as well as in electrical conductivity of
dispersed NDG in the ethylene glycol (EG) (Seyed Shirazi et al., 2015) confirms its
potential application towards nanofluids. Although various studies conducted on the
thermal and electrical conductivity of composite material suspensions, no investigation
has yet performed on the nanofluids containing crumpled N-doped graphene in water-EG
Univers
ity of
Mala
ya

220
media. The crumpled nitrogen-doped graphene (CNDG) seems to meet both above-
mentioned criteria and thus it is attractive and novel for coolant applications.
To this end, an efficient and facile method for fabricating highly crumpled
nitrogen-doped graphene nanosheets (CNDG) with high surface area is employed (section
4.2.2) to reach a carbon nanostructure with the above-mentioned properties. After
investigation of functionality and morphology (section 4.2.2), the thermo-physical and
colloidal stability of coolants containing CNDG and EG-treated GNP and the cooling
potentials of synthesized coolants have been investigated in terms of the steady-state
forced convective heat transfer. In addition, physical insight was prepared to clarify the
improved heat transfer coefficient of CNDG-based water-ethylene glycol coolant
(CNDG-WEG) and EG-treated GNP-based water coolants (GNP-WEG).
4.4.1.2 Data Processing
The thermo-physical properties such as thermal conductivity, density, specific
heat capacities and viscosity at different concentrations were measured experimentally.
A study on the heat transfer behavior and energy management of the synthesized coolant
in the car radiator was performed via evaluating the convective heat transfer coefficient
(h), Nusselt number (Nu), friction factor (f), pressure drop (ΔP), and pumping power (W).
The convective heat transfer coefficient was attained via evaluating the values of the inlet,
outlet, wall and bulkfluid temperatures as well as the flow rates. The Reynolds number
was calculated using equation 4.4,
𝑅𝑒 =𝜌𝑈𝐷
µ
(4.4)
where D, U, ρ and µ are the inner diameter of the tube, the flow velocity, density
and viscosity of working fluid, respectively.
According to the Newton’s cooling law, the convective heat transfer coefficient
(h) can be calculated from equation 4.5,
Univers
ity of
Mala
ya

221
ℎ =𝑞
𝐴(𝑇𝑏− 𝑇𝑤) (4.5)
where Tb and Tw are the average temperature of the bulkfluid and the radiator tube wall,
respectively. Also, heat transfer rate is obtained by using equation 4.6.
𝑞 = 𝑚°𝐶𝑝(𝑇𝑖𝑛 − 𝑇𝑜𝑢𝑡) (4.6)
where mº is the mass flow rate, Tin and Tout are the inlet and outlet temperature of the
bulkfluid respectively of the car radiator. Considering the same value for q in the
equations (4.7) and (4.8), the convective heat transfer coefficient and Nusselt number are
respectively obtained from the equation 4.7 and 4.8 respectively.
ℎ =𝑚°𝐶𝑝(𝑇𝑖𝑛 − 𝑇𝑜𝑢𝑡)
𝐴(𝑇𝑏− 𝑇𝑤)
(4.7)
𝑁𝑢 =𝑚°𝐶𝑝(𝑇𝑖𝑛 − 𝑇𝑜𝑢𝑡)𝐷
𝐴(𝑇𝑏− 𝑇𝑤)𝐾
(4.8)
In Equations (4.7) and (4.8), Cp, A and K are introduced as the specific heat
capacity, spherical area of radiator tubes, and the thermal conductivity of the fluids,
respectively. In Eq. (6.5), Nu is the average Nusselt number for the entire radiator. The
pressure drop of working fluid flowed through the radiator was measured by a differential
pressure transducer for different concentrations of nanoparticles. Also, the empirical
friction factor was measured from the pressure drop of synthesized coolants through the
radiator. That is represented by equation 4.9 (Samira et al., 2014),
𝑓 =2 ∆𝑃 𝜌𝐷
𝐺2𝑛𝐿
(4.9)
where ΔP is pressure drop, n is the number of tube passes, L is the tube length of radiator
and G is the mass flow rate per unit area defined as,
𝐺 =𝑚°
𝐴
(4.10)
Employing new type of working fluid (GNP-WEG) as a new coolant for car
radiator requires investigation of performance of the coolant as well as their suitability as
Univers
ity of
Mala
ya

222
appropriate alternative candidate for a range of Reynolds numbers and temperatures.
According to Samira and coworkers (Samira et al., 2014), using of nanofluids in a car
radiator provides enhancement in both pressure drop (negative effects) and heat transfer
coefficient (positive effects). To assess the effectiveness of nanofluids, a performance
index (ɛ) is selected as an appropriate parameter (Equation 4.11) to clarify the range of
temperature and velocity that can be used by the synthesized coolant (Samira et al., 2014):
ε =
ℎ𝑛𝑓ℎ𝑏𝑓⁄
∆𝑃𝑛𝑓∆𝑃𝑏𝑓⁄
= RhR∆P
(4.11)
where Rh is the ratio of the heat transfer enhancement of the new coolant (GNP-
WEG) to the base-fluid and RΔP is the ratio of pressure drop of synthesized coolant to the
base-fluid. To study the energy saving in the turbulent region, the pumping power can be
measured as follows by equation (4.12) (Mansour et al., 2007).
𝑊𝑛𝑓
𝑊𝑏𝑓= (
𝜇𝑛𝑓
𝜇𝑏𝑓)
0.25
(𝜌𝑏𝑓
𝜌𝑛𝑓)
2
(4.12)
where Wnf and Wbf are the pumping power in the presence of nanofluid and basefluid,
respectively.
4.4.1.3 Thermal performance studies
Prior to carrying out the set of detailed experiments on the GNP-WEG and
CNDG-WEG as the novel coolants for car radiator, a set of initial experiments has
performed for water-EG mixture as the base-fluid, in order to assess the accuracy and
reliability of the experimental set-up. The empirical correlations of Gnielinsky and Dittus-
Boelter (Dittus & Boelter, 1985; S. Zeinali Heris et al., 2013) were selected for
comparison with the obtained results especially for test of accuracy of the set-up in the
turbulent region. These correlations are stated by equations 4.13 and 4.14, respectively.
Univers
ity of
Mala
ya
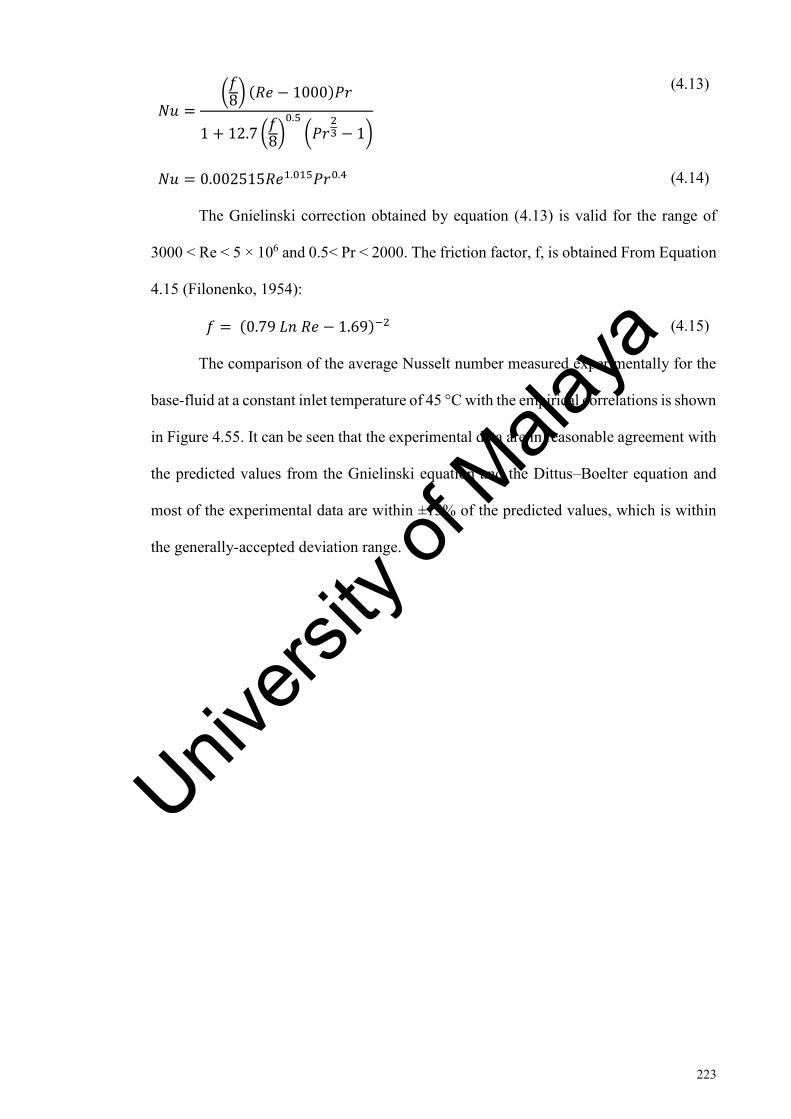
223
𝑁𝑢 =(𝑓8)(𝑅𝑒 − 1000)𝑃𝑟
1 + 12.7 (𝑓8)0.5
(𝑃𝑟23 − 1)
(4.13)
𝑁𝑢 = 0.002515𝑅𝑒1.015𝑃𝑟0.4 (4.14)
The Gnielinski correction obtained by equation (4.13) is valid for the range of
3000 < Re < 5 × 10⁶ and 0.5< Pr < 2000. The friction factor, f, is obtained From Equation
4.15 (Filonenko, 1954):
𝑓 = (0.79 𝐿𝑛 𝑅𝑒 − 1.69)−2 (4.15)
The comparison of the average Nusselt number measured experimentally for the
base-fluid at a constant inlet temperature of 45 °C with the empirical correlations is shown
in Figure 4.55. It can be seen that the experimental data are in reasonable agreement with
the predicted values from the Gnielinski equation and the Dittus–Boelter equation and
most of the experimental data are within ±15% of the predicted values, which is within
the generally-accepted deviation range.
Univers
ity of
Mala
ya

224
This figure, in particular, shows good agreement between the experimental
measurements and the Gnielinsky correlation for different Reynolds numbers. The
average error is 2.4%, which is quite reasonable. In addition, the correlation of Dittus-
Boelter provides an acceptable agreement with the experimental data for the water-EG
mixture. Figure 4.55 also shows the expected trend of increase of Nusselt number with
Reynolds number.
4.4.1.3.1 GNP-WEG
Figure 4.56 (A-C) presents the average outlet temperature (𝑇𝑜𝑢𝑡) of the car
radiator as a function of flow rate for the GNP-WEG as coolant fluid for inlet
temperatures of 35, 45 and 55°C and at different weight concentrations of EG-treated
GNP. These figures show an increasing trend of 𝑇𝑜𝑢𝑡 with volume flow rate and a
downward trend of 𝑇𝑜𝑢𝑡 with concentration of EG-treated GNP. That is, 𝑇𝑜𝑢𝑡 decreases
15
25
35
45
55
65
75
85
95
15 25 35 45 55 65 75 85 95
Ex
pe
rim
en
tal
Nu
sse
lt n
um
be
r
Predicted Nusselt number
Dittus–Boelter equation
Gnielinski equation
+15
-15%
Figure 4.55: A comparison of the data obtained from the Gnielinsky and Dittus-Boelter correlations and the experimental data for the Water-EG mixture at the inlet
temperature of 45 °C.
Univers
ity of
Mala
ya
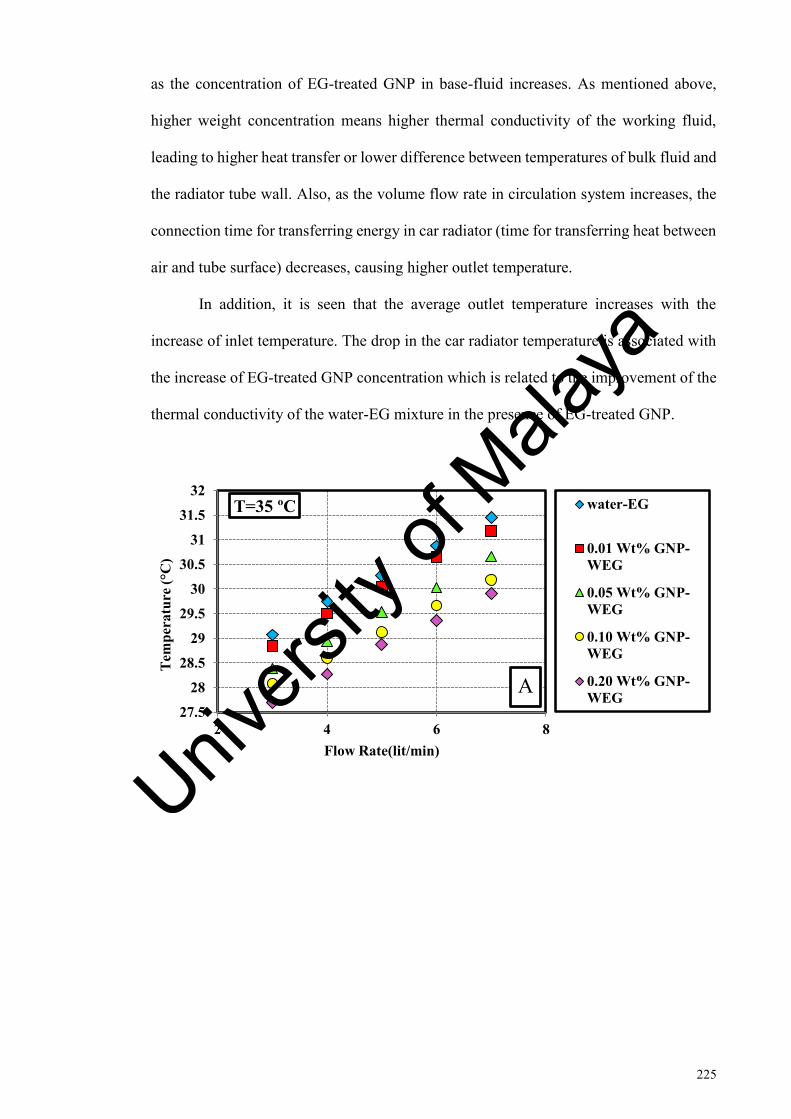
225
as the concentration of EG-treated GNP in base-fluid increases. As mentioned above,
higher weight concentration means higher thermal conductivity of the working fluid,
leading to higher heat transfer or lower difference between temperatures of bulk fluid and
the radiator tube wall. Also, as the volume flow rate in circulation system increases, the
connection time for transferring energy in car radiator (time for transferring heat between
air and tube surface) decreases, causing higher outlet temperature.
In addition, it is seen that the average outlet temperature increases with the
increase of inlet temperature. The drop in the car radiator temperature is associated with
the increase of EG-treated GNP concentration which is related to the improvement of the
thermal conductivity of the water-EG mixture in the presence of EG-treated GNP.
27.5
28
28.5
29
29.5
30
30.5
31
31.5
32
2 4 6 8
Tem
pera
ture
(°C
)
Flow Rate(lit/min)
T=35 ºC water-EG
0.01 Wt% GNP-WEG
0.05 Wt% GNP-WEG
0.10 Wt% GNP-WEG
0.20 Wt% GNP-WEG
A
Univers
ity of
Mala
ya

226
Variations of the convective heat transfer coefficient of EG-treated GNP dispersed
in a mixture of DI water-EG are studied and the results are presented in this section.
Figures 4.57A, 4.57B and 4.57C present the comparison of convective heat transfer
coefficients of GNP-WEG for different weight concentrations at three different
temperatures. It is seen that the augmentations of the convective heat transfer coefficient
of GNP-WEG significantly exceed those of the thermal conductivity enhancements for
34
35
36
37
38
39
40
41
42
2 3 4 5 6 7 8
Tem
pera
ture
(°C
)
Flow Rate(lit/min)
T=45 ºC water-EG
0.01 Wt% GNP-WEG
0.05 Wt% GNP-WEG
0.10 Wt% GNP-WEG
0.20 Wt% GNP-WEG
B
42
43
44
45
46
47
48
49
50
51
2 3 4 5 6 7 8
Tem
pera
ture
(°C
)
Flow Rate(lit/min)
T=55 ºC water-EG
0.01 Wt% GNP-WEG
0.05 Wt% GNP-WEG
0.10 Wt% GNP-WEG
0.20 Wt% GNP-WEG
C
Figure 4.56: The average outlet temperature (Tout) as a function of flow rate for the car radiator in the presence of GNP-WEG as well as pure basefluid at inlet temperatures of
(a) 35, (b) 45 and (c) 55 °C.
Univers
ity of
Mala
ya

227
different weight concentrations. The maximum thermal conductivity and convective heat
transfer coefficient enhancements for GNP-WEG are 65% and 130% respectively at the
weight concentration of 0.2 wt% and volume flow rate of 7 lit/min. The reason for larger
enhancement of the convective heat transfer compared to that of thermal conductivity was
introduced by Aravind and coworkers (Aravind et al., 2011; Aravind & S. Ramaprabhu,
2013) using a simple analogy that the connective heat transfer is proportional to k/δt,
where δt is the thickness of thermal boundary layer. Thus, to increase the convective heat
transfer coefficient, k can be increased and/or δt can be decreased. According to the recent
studies (Aravind et al., 2011; Ding et al., 2006b), carbon nanomaterials such as CNTs and
graphene have a tendency to decrease the thermal boundary layer thickness. Higher
thermal conductivity or lower difference between temperatures of bulk fluid and tube wall
in radiator can be introduced as the main reason for aforementioned enhancement in the
convective heat transfer coefficient. More studies, typically flow visualization studies,
should be conducted to get a clearer picture of the heat transfer enhancement mechanism.
1000
1500
2000
2500
3000
3500
4000
4500
5000
5500
2 3 4 5 6 7 8
h (W
/m2 K
)
Flow Rate(lit/min)
T=35 ºC water-EG
0.01 Wt% GNP-WEG
0.05 Wt% GNP-WEG
0.10 Wt% GNP-WEG
0.20 Wt% GNP-WEGAUnivers
ity of
Mala
ya

228
In order to evaluate the ratio of convective to conductive heat transfer of GNP-
WEG coolants, experiments are performed for different weight concentrations (0.01,
0.05, 0.1, and 0.2 %), volume flow rates and inlet temperatures and the average Nusselt
numbers are evaluated and presented in Figure 4.58 (A-C). This figure shows that for the
GNP-WEG coolants the Nusselt number increases significantly compared to the base-
fluid. The higher Nusselt number for the GNP-WEG coolant is attributed to the decrease
in circulation temperature by increasing thermal conductivity of working fluid, which
1000
2000
3000
4000
5000
6000
7000
2 3 4 5 6 7 8
h (W
/m2 K
)
Flow Rate(lit/min)
T=45 ºC water-EG
0.01 Wt% GNP-WEG
0.05 Wt% GNP-WEG
0.10 Wt% GNP-WEG
0.20 Wt% GNP-WEGB
1500
2500
3500
4500
5500
6500
7500
2 4 6 8
h (W
/m2 K
)
Flow Rate(lit/min)
T=55 ºC water-EG
0.01 Wt% GNP-WEG
0.05 Wt% GNP-WEG
0.10 Wt% GNP-WEG
0.20 Wt% GNP-WEGC
Figure 4.57: The effects of Reynolds number and concentration of EG-treated GNP on the convective heat transfer coefficient at the inlet temperatures of (a) 35 °C, (b) 45 ºC
and (c) 55 °C.
Univers
ity of
Mala
ya

229
decreases the temperature difference between the tube wall and bulk fluid in the car
radiator. The lower temperature difference between the tube wall and the working fluid
explains the increase in the heat transfer rate. This in turn could lead to a decrease in the
size of radiator or heat exchanger.
30
40
50
60
70
80
90
100
110
120
2 3 4 5 6 7 8
Nu
Flow Rate(lit/min)
T=35 ºC water-EG
0.01 Wt% GNP-WEG
0.05 Wt% GNP-WEG
0.10 Wt% GNP-WEG
0.20 Wt% GNP-WEGA
Univers
ity of
Mala
ya
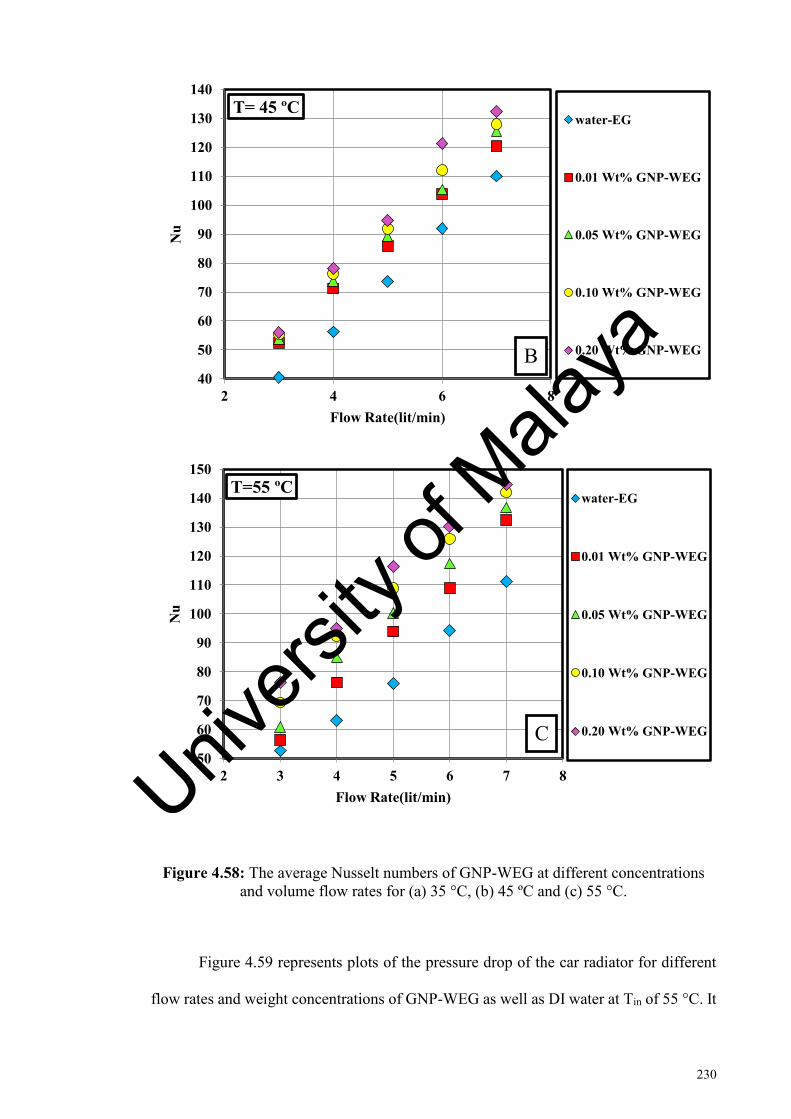
230
Figure 4.59 represents plots of the pressure drop of the car radiator for different
flow rates and weight concentrations of GNP-WEG as well as DI water at Tin of 55 °C. It
40
50
60
70
80
90
100
110
120
130
140
2 4 6 8
Nu
Flow Rate(lit/min)
T= 45 ºCwater-EG
0.01 Wt% GNP-WEG
0.05 Wt% GNP-WEG
0.10 Wt% GNP-WEG
0.20 Wt% GNP-WEGB
50
60
70
80
90
100
110
120
130
140
150
2 3 4 5 6 7 8
Nu
Flow Rate(lit/min)
T=55 ºCwater-EG
0.01 Wt% GNP-WEG
0.05 Wt% GNP-WEG
0.10 Wt% GNP-WEG
0.20 Wt% GNP-WEGC
Figure 4.58: The average Nusselt numbers of GNP-WEG at different concentrations and volume flow rates for (a) 35 °C, (b) 45 ºC and (c) 55 °C.
Univers
ity of
Mala
ya

231
is seen that as the volume flow rate and concentration of EG-treated GNP increases, the
pressure drop increases. The pressure drops for the coolant suspensions at low
concentrations of 0.01 and 0.05 are quite close to that for the mixture of DI water-EG.
Figure 4.59 shows that the pressure drop for the GNP-WEG at the concentration of 0.2
wt% and flow rate of 7 lit/min has the highest pressure drop for the current range of
measurements. It is also noteworthy that the pressure drop and viscosity curves exhibit
similar trends, which can be attributed to the direct relationship between pressure drop
and viscosity.
Also, the influence of inlet flow temperature and flow rate on pressure drop at the
concentration of 0.1 wt% of EG-treated GNP is shown in Figure 4.60. Expectedly, as the
temperature increases, the amount of pressure drop decreases, which can be resulted from
reducing viscosity at higher temperature and also observed similar trend for other
concentrations.
0
100
200
300
400
500
600
2 3 4 5 6 7 8
Pres
sure
Dro
p (P
a)
Flow Rate(lit/min)
water-EG
0.01 Wt% GNP-WEG
0.05 Wt% GNP-WEG
0.10 Wt% GNP-WEG
0.20 Wt% GNP-WEG
Figure 4.59: Pressure drop of the car radiator for different flow rates and weight concentrations of GNP-WEG as well as deionized water at Tin of 55 °C. Univ
ersity
of M
alaya

232
The friction factor for the radiator at different volume flow rates as well as weight
concentrations of EG-treated GNP is shown in Figure 4.61 at constant inlet flow
temperature of 55 °C. It is seen that the experimental friction factor decreases with the
increasing of the volume flow rate at different concentrations. In addition, the friction
factor increases as the concentration of EG-treated GNP increases, although there are
some fluctuations in the measured friction factor for different volume flow rates. The
minimum value of friction factor occurs for the base-fluid.
It is also seen as the volume flow rate increases, the dependence of friction factor
on the concentration of EG-treated GNP decreases. At low extent of the Reynolds
numbers, Brownian motion can be the main important parameter that influenced on the
momentum transfer between the nanoparticles and base-fluid molecules. Thus, with the
increase of the Brownian motion in the presence of GNP-WEG, the friction factor
increases with higher slope as compared with base-fluid (Shanbedi et al., 2015; Shanbedi
et al., 2012). However, this mechanism is not dominant when the high extent of Reynolds
number is employed. In summary, the velocity of working fluids can be considered as the
200
250
300
350
400
450
500
550
2 3 4 5 6 7 8
Pres
sure
Dro
p (P
a)
Flow Rate(lit/min)
T= 55 °C
T= 45 °C
T= 35 °C
Figure 4.60: Effect of Inlet temperature of working fluid on the pressure drop at concentration of 0.1 wt%.
Univers
ity of
Mala
ya

233
most important parameter in increasing the friction factor at the high extent of Reynolds
number. Overall, the low difference between the friction factors of the base fluid and the
GNP-WEG suspensions at different volume flow rates is attributed to the insignificant
gap between viscosities of basefluids and GNP-WEG.
Also, Figure 4.62 shows the effect of inlet temperature of working fluid on the
friction factor at the constant concentration of 0.1 wt%. It is observed that the friction
factor increases with the decrease in temperature especially for volume flow rate less than
4 lit/min. Also, as the volume flow rate of working fluid (coolant) increases, the friction
factor as well as the gap between the friction factors of working fluid at different
temperatures decreases. As mentioned above, a drop in viscosity and/or pressure drop can
be considered as the main reason for decreasing friction factor with the increasing of
temperature.
0.0002
0.0003
0.0004
0.0005
0.0006
0.0007
0.0008
0.0009
0.001
0.0011
0.0012
2 4 6 8
Fric
tion
Fact
or
Flow Rate(lit/min)
water-EG
0.01 Wt% GNP-WEG
0.05 Wt% GNP-WEG
0.10 Wt% GNP-WEG
0.20 Wt% GNP-WEG
Figure 4.61: Effect of volume flow rate and concentration of EG-treated GNP on the friction factor at inlet temperature of 55 °C.
Univers
ity of
Mala
ya

234
The economic performance of working fluids for car radiator is typically
evaluated using the performance index (ɛ), which expressed as the ratio of the heat
transfer rate to the pressure drop. Earlier studies (e.g., (Samira et al., 2014)) showed that
while the addition of nanoparticles increases the heat transfer rate, it also increases the
pressure drop, which is undesirable. Performance index is then introduced to investigate
the combined effect of both parameters. The variations of the performance indexes of the
coolants are shown for different volume flow rates and various concentrations for a
constant Tin of 55 °C in Figure 4.63. It is seen that the performance indexes of all the
samples are greater than 1, which indicates the effectiveness of the prepared coolant
samples for car radiators. This figure shows that the performance index curves for
different concentrations reach their peaks for a volume flow rate of 6 lit/min, and that is
followed by a gradual decrease of the performance index for further increase in the flow
rate which refers the optimum value of flow rates. Also, an increase in the performance
index is obtained with an increase in the weight fraction of GNP.
0.0004
0.0005
0.0006
0.0007
0.0008
0.0009
0.001
0.0011
0.0012
2 4 6 8
Fric
tion
Fact
or
Flow Rate(lit/min)
T= 55 °C
T= 45 °C
T= 35 °C
Figure 4.62: Effect of volume flow rate and inlet temperature of working fluid on the friction factor at concentration of 0.1 wt%.
Univers
ity of
Mala
ya

235
Figure 4.64 presents the performance indexes of GNP-WEG for the concentration
of 0.1 wt% for different inlet temperatures and flow rates. This figure exhibits a rising
trend of performance index with the volume flow rate. That is, as the volume flow rate
increases, performance index increases. It is also seen that the performance indices of all
the samples (except for volume flow rate of 3 lit/min and an inlet temperature of 35 °C)
are greater than 1, indicating that GNP-WEG is an appropriate coolant for the car radiator
at different volume flow rates.
These results also validate that the positive effects of heat transfer exceed the
negative effects of pressure drop for GNP-WEG coolants for a wide range of inlet
temperatures, concentrations, and volume flow rates; thus indicating excellent capability
of the synthesized coolant for use in car radiators. In this study, it is also distinct that the
performance index drops down after the flow rate of 6 lit/min which refers to the
importance of optimization of the flow parameters for the best performance.
0.9
1
1.1
1.2
1.3
1.4
1.5
1.6
1.7
1.8
2 3 4 5 6 7 8
Perf
orm
ance
Inde
x
Flow Rate(lit/min)
T= 55 °C 0.01 Wt% GNP-WEG
0.05 Wt% GNP-WEG
0.10 Wt% GNP-WEG
0.20 Wt% GNP-WEG
Figure 4.63: The performance index of the synthesized coolant versus flow rate at different concentrations of EG-treated GNP.
Univers
ity of
Mala
ya

236
Power consumption and pumping characteristics in a loop is a critical parameter
in terms of economy as well as energy-saving. Pumping power can be considered as an
economic performance indicator in a loop system for evaluating the operability of fluid
and performance of power plant. Figure 4.65 compares the pumping power of the car
radiator coolant (GNP-WEG) at various concentrations of EG-treated GNP at different
inlet temperatures with that of the base-fluid. This figure shows that there is a slight
increase in the pumping power with the EG-treated GNP loading, and the effect of
temperature variation is negligible (Wenhua Yu et al., 2012).
0.9
1
1.1
1.2
1.3
1.4
1.5
1.6
1.7
1.8
2 3 4 5 6 7 8
Perf
orm
ance
Inde
x
Flow Rate(lit/min)
T= 55 °C
T= 45 °C
T= 35 °C
Figure 4.64: The performance index of the synthesized coolant versus flow rate at different temperatures and concentration of 0.1 wt%.
Univers
ity of
Mala
ya
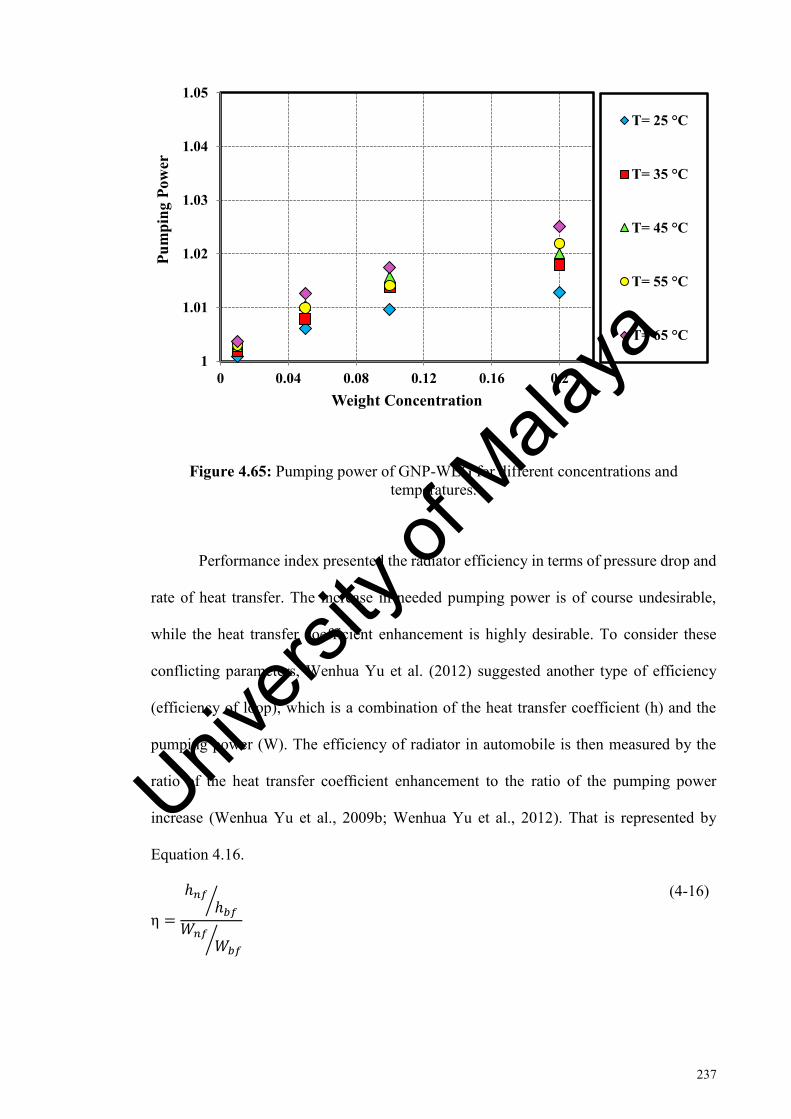
237
Performance index presented the radiator efficiency in terms of pressure drop and
rate of heat transfer. The increase in needed pumping power is of course undesirable,
while the heat transfer coefficient enhancement is highly desirable. To consider these
conflicting parameters, Wenhua Yu et al. (2012) suggested another type of efficiency
(efficiency of loop), which is a combination of the heat transfer coefficient (h) and the
pumping power (W). The efficiency of radiator in automobile is then measured by the
ratio of the heat transfer coefficient enhancement to the ratio of the pumping power
increase (Wenhua Yu et al., 2009b; Wenhua Yu et al., 2012). That is represented by
Equation 4.16.
η =
ℎ𝑛𝑓ℎ𝑏𝑓⁄
𝑊𝑛𝑓𝑊𝑏𝑓⁄
(4-16)
1
1.01
1.02
1.03
1.04
1.05
0 0.04 0.08 0.12 0.16 0.2
Pum
ping
Pow
er
Weight Concentration
T= 25 °C
T= 35 °C
T= 45 °C
T= 55 °C
T= 65 °C
Figure 4.65: Pumping power of GNP-WEG for different concentrations and temperatures.
Univers
ity of
Mala
ya

238
As discussed above, the efficiency of loop should be higher than 1 for a cost-
effective system. It can be seen in Figure 4.66 that the efficiency of loop is higher than 1
at different temperatures, concentrations and flow rates, indicating the promising
potential of GNP-WEG for being an alternative coolant in the car radiators.
0
0.5
1
1.5
2
2.5
3
2 3 4 5 6 7 8
Eff
icie
ncy
of lo
op
Flow Rate(lit/min)
0.01 Wt% GNP-WEG
0.05 Wt% GNP-WEG
0.1 Wt% GNP-WEG
0.2 Wt% GNP-WEG
A
0
0.5
1
1.5
2
2.5
3
2 3 4 5 6 7 8
Eff
icie
ncy
of lo
op
Flow Rate(lit/min)
0.01 Wt% GNP-WEG
0.05 Wt% GNP-WEG
0.1 Wt% GNP-WEG
0.2 Wt% GNP-WEG
B
Univers
ity of
Mala
ya
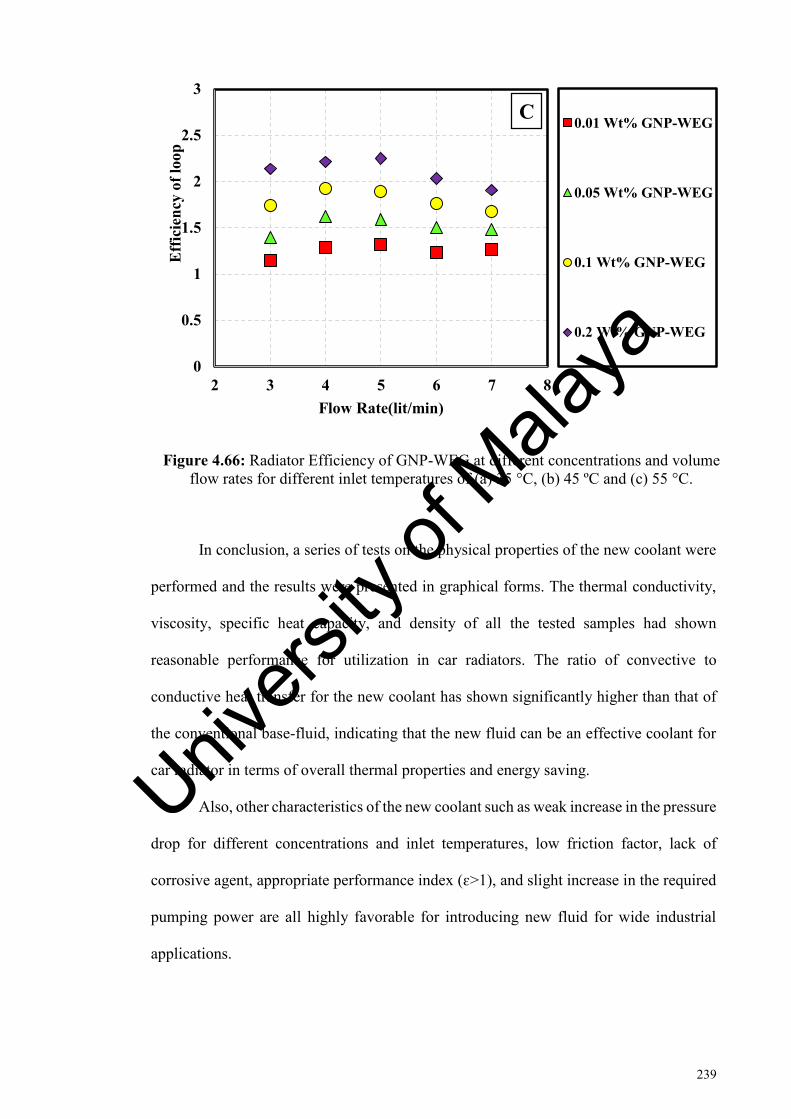
239
In conclusion, a series of tests on the physical properties of the new coolant were
performed and the results were presented in graphical forms. The thermal conductivity,
viscosity, specific heat capacity, and density of all the tested samples had shown
reasonable performance for utilization in car radiators. The ratio of convective to
conductive heat transfer for the new coolant has shown significantly higher than that of
the conventional base-fluid, indicating that the new fluid can be an effective coolant for
car radiator in terms of overall thermal properties and energy saving.
Also, other characteristics of the new coolant such as weak increase in the pressure
drop for different concentrations and inlet temperatures, low friction factor, lack of
corrosive agent, appropriate performance index (ɛ>1), and slight increase in the required
pumping power are all highly favorable for introducing new fluid for wide industrial
applications.
0
0.5
1
1.5
2
2.5
3
2 3 4 5 6 7 8
Eff
icie
ncy
of lo
op
Flow Rate(lit/min)
0.01 Wt% GNP-WEG
0.05 Wt% GNP-WEG
0.1 Wt% GNP-WEG
0.2 Wt% GNP-WEG
C
Figure 4.66: Radiator Efficiency of GNP-WEG at different concentrations and volume flow rates for different inlet temperatures of (a) 35 °C, (b) 45 ºC and (c) 55 °C.
Univers
ity of
Mala
ya

240
4.4.1.3.2 CNDG-WEG
To reach better results, CNDG-WEG with higher specific surface area than that
of GNP-WEG were synthesized at different weight concentrations. The same
experiments’ phases were repeated for CNDG-WEG and the results are reported as
follow.
The average outlet temperature (𝑇𝑜𝑢𝑡) of the car radiator by using CNDG-WEG
as a coolant fluid for inlet temperatures of 55, 45 and 35°C and different weight
concentrations of CNDG are shown in Figure 4.67. The figures indicate an increasing
trend of 𝑇𝑜𝑢𝑡 with volume flow rate and a downward trend of 𝑇𝑜𝑢𝑡 with concentration of
CNDG. It means that, as the concentration of CNDG in base-fluid increases, 𝑇𝑜𝑢𝑡
decreases. As mentioned earlier, higher weight concentration means higher thermal
conductivity of the working fluid, resulting in higher heat transfer or lower difference
between temperatures of bulk fluid and the radiator tube wall. Moreover, by increasing
the volume flow rate in circulation system, the connection time for transfer heat in car
radiator (time for transferring heat between air and tube surface) decreases, making the
outlet temperature to be higher.
Additionally, it is observed that as the inlet temperature increases, the average
outlet temperature increases too. Temperature drop of the car radiator associated with the
increase of CNDG concentration is attributed to the increase of thermal conductivity of
water-EG mixture in the presence of CNDG. Univers
ity of
Mala
ya

241
43
44
45
46
47
48
49
50
51
2 3 4 5 6 7 8
Te
mp
era
ture
(°C
)
Flow Rate(lit/min)
T=55 °C Water-EG
0.001 CNDG-WEG
0.005 CNDG-WEG
0.01 CNDG-WEG
34
35
36
37
38
39
40
41
42
43
2 3 4 5 6 7 8
Te
mp
era
ture
(°C
)
Flow Rate(lit/min)
T=45 °C Water-EG
0.001 CNDG-WEG"
0.005 CNDG-WEG
0.01 CNDG-WEG
Univers
ity of
Mala
ya

242
Variations of the convective heat transfer coefficient of CNDG dispersed in a
mixture of DI water-EG are studied and the results are systematically presented. Figures
4.68 compare convective heat transfer coefficients of CNDG-WEG for different weight
concentrations at three different outlet temperatures. It is observed that the improvements
of the convective heat transfer coefficient of CNDG-WEG are significantly higher than
those of the thermal conductivity for different weight concentrations. This behavior can
be qualitatively explained by a simple scale analysis. It is obvious that the heat-transfer
coefficient is a macroscopic parameter and can be approximately given by k/δt with δt as
the thickness of thermal boundary layer (Ding et al., 2006a). In a double tube heat
exchanger, at the entrance of the test section (x/D = 0), where the theoretical boundary
layer thickness is zero, the heat-transfer coefficient approaches infinity (S. J. Aravind &
S. Ramaprabhu, 2013). With the increase in axial distance, the boundary layer increases
27.5
28
28.5
29
29.5
30
30.5
31
31.5
32
32.5
2 3 4 5 6 7 8
Tem
per
atu
re (
°C)
Flow Rate(lit/min)
T=35 °C Water-EG
0.001 CNDG-WEG
0.005 CNDG-WEG
0.01 CNDG-WEG
Figure 4.67: The average outlet temperature (Tout) of car radiator in the presence of CNDG-WEG as well as Water-EG mixture at different inlet temperatures.
Univers
ity of
Mala
ya
243
until fully developed, after which the boundary layer thickness and hence the convective
heat-transfer coefficient are constant.
However, according to the results, the maximum heat transfer coefficient
enhancements for CNDG-WEG is 83% for a volume fraction of 0.01 wt.%, whereas the
maximum enhancements in thermal conductivity is respectively 19.4%. Therefore, it is
obvious that the enhancement of the convective heat-transfer coefficient is much greater
than that of the thermal conductivity, especially at high flow rates. So, the heat-transfer
enhancement can be largely obtained by thinning of the thermal boundary layer thickness
(S. J. Aravind et al., 2011). As mentioned by several studies, the possible reasons for this
reduction in boundary layer thickness are particle migration in nanofluids due to shear
action, viscosity gradient, and Brownian motion in the cross-section of the tube (S.
Aravind & S. Ramaprabhu, 2013; Phillips et al., 1992). The increase of the thermal
conduction under dynamic conditions could be another decisive factor for heat transfer
improvement (Xuan & Li, 2003). It is also possible that as the surface area increases,
Brownian motion increases, particle migration increases and a reduction in boundary
layer thickness happens. More studies on a double tube heat exchanger should be
conducted to get a clearer picture of the heat transfer enhancement mechanism. To reach
a clearer picture of the heat transfer enhancement mechanism, more studies, typically
flow visualization studies, need to be conducted.
Univers
ity of
Mala
ya
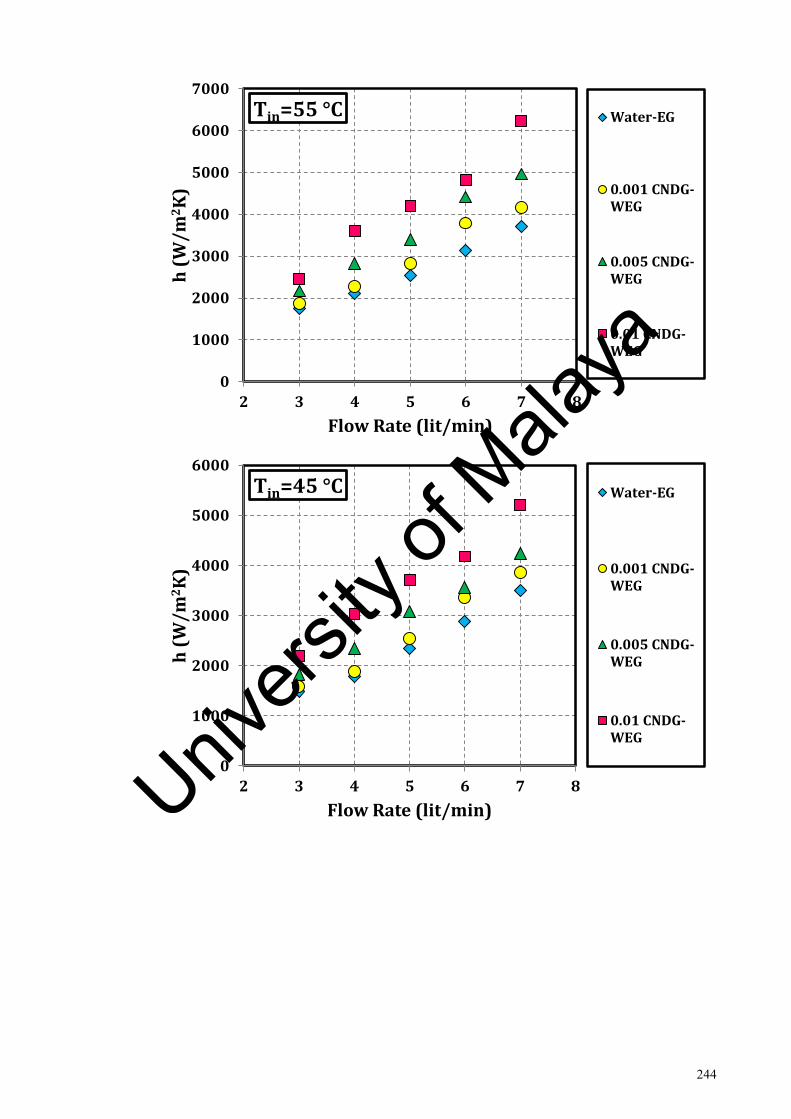
244
0
1000
2000
3000
4000
5000
6000
7000
2 3 4 5 6 7 8
h (
W/
m2K
)
Flow Rate (lit/min)
Tin=55 °C Water-EG
0.001 CNDG-WEG
0.005 CNDG-WEG
0.01 CNDG-WEG
0
1000
2000
3000
4000
5000
6000
2 3 4 5 6 7 8
h (
W/
m2K
)
Flow Rate (lit/min)
Tin=45 °C Water-EG
0.001 CNDG-WEG
0.005 CNDG-WEG
0.01 CNDG-WEG
Univers
ity of
Mala
ya

245
For evaluating the ratio of convective to conductive heat transfer of CNDG-WEG
coolants as compared with the basefluid, some experiments were performed at different
weight concentrations (0.001 wt.%, 0.005 wt.% and 0.01 wt.%), volume flow rates, inlet
temperatures and the ratio of Nusselt number of coolants to the basefluid are assessed and
indicated in Figure 4.69 for different input temperatures. This figure indicates that the
ratio of Nusselt numbers of all the samples to the basefluid are greater than 1, and
significantly increases with increasing weight concentration of CNDG in coolants. The
higher ratio of Nusselt numbers to base fluid than 1 is attributed to the reduction of
circulation temperature by increase in thermal conductivity of working fluid, leading to
decrease in the temperature difference between the tube wall and the bulk fluid in the car
radiator. The lower temperature difference between the tube wall and the working fluid
can be explained by the increase in the heat transfer rate. This could result in a decrease
in the size of radiator or heat exchanger.
500
1000
1500
2000
2500
3000
3500
4000
4500
2 3 4 5 6 7 8
h (
W/
m2K
)
Flow Rate (lit/min)
Tin=35 °C Water-EG
0.001 CNDG-WEG
0.005 CNDG-WEG
0.01 CNDG-WEG
Figure 4.68: The effects of Reynolds numbers and weight concentrations of CNDG on the forced convective heat transfer coefficient at different inlet temperatures.
Univers
ity of
Mala
ya

246
0.4
0.6
0.8
1
1.2
1.4
1.6
1.8
2
2 3 4 5 6 7 8
Nu
/N
u(b
f)
Flow Rate (lit/min)
Tin=55 °C0.001 CNDG-WEG
0.005 CNDG-WEG
0.01 CNDG-WEG
0.4
0.6
0.8
1
1.2
1.4
1.6
1.8
2
2 3 4 5 6 7 8
Nu
/N
u(b
f)
Flow Rate (lit/min)
Tin=45 °C0.001 CNDG-WEG
0.005 CNDG-WEG
0.01 CNDG-WEG
Univers
ity of
Mala
ya

247
Figure 4.70 indicates the pressure drop of the car radiator for different flow rates
and weight concentrations of CNDG-WEG as well as DI water-EG mixture at Tin = 55
°C. It is observed that by increasing the volume flow rate and concentration of CNDG,
the pressure drop increases too. The pressure drops for the coolant suspensions at different
concentrations are very close to that for the mixture of DI water-EG. Figure 4.70 indicates
that the highest pressure drop for the current range of measurement is for the pressure
drop of the CNDG-WEG at the concentration of 0.01 wt.% and flow rate of 7 lit/min. It
is of note that the similar trends are seen for pressure drop and viscosity curves, attributing
to the direct relationship between pressure drop and viscosity. Also, Figure 4.70 shows
the influence of inlet flow temperature and flow rate on pressure drop at the concentration
of 0.01 wt.% of CNDG. It can be seen that as the weight concentration of CNDG in
CNDG-WEG and/or inlet temperature of flow was increased, the higher pressure drop
observed.
0.4
0.6
0.8
1
1.2
1.4
1.6
1.8
2
2 3 4 5 6 7 8
Nu
/N
u(b
f)
Flow Rate (lit/min)
Tin=35 °C0.001 CNDG-WEG
0.005 CNDG-WEG
0.01 CNDG-WEG
Figure 4.69: The Nusselt number enhancement of CNDG-WEG at different concentrations, inlet temperatures and volume flow rates.
Univers
ity of
Mala
ya

248
100
150
200
250
300
350
400
450
500
2 3 4 5 6 7 8
Pre
ssu
re D
rop
(P
a)
Flow Rate (lit/min)
Tin=55 °CWater-EG
0.001CNDG-WEG
0.005CNDG-WEG
0.01 CNDG-WEG
100
150
200
250
300
350
400
450
500
2 3 4 5 6 7 8
Pre
ssu
re D
rop
(P
a)
Flow Rate (lit/min)
Tin=45 °C Water-EG
0.001CNDG-WEG
0.005CNDG-WEG
0.01 CNDG-WEG
Univers
ity of
Mala
ya

249
Figure 4.71 represents the pressure drop of the car radiator for different Tf (the
average temperature between inlet and outlet) and weight concentrations of CNDG-WEG
at volume flow rate of 7 lit/min. There is a decrease in pressure drop at temperature range
of 30-55 °C for the base fluids and coolant suspensions at different concentrations. Figure
4.71 indicates that the highest pressure drop for the current range of measurements for
the pressure drop of the CNDG-WEG (0.01 wt.%) at Tf of 32.8 °C and flow rate of 7
lit/min.
100
150
200
250
300
350
400
450
500
550
600
2 3 4 5 6 7 8
Pre
ssu
re D
rop
(P
a)
Flow Rate (lit/min)
Tin=35 °C Water-EG
0.001CNDG-WEG
0.005CNDG-WEG
0.01 CNDG-WEG
Figure 4.70: Pressure drop of the car radiator at different flow rates and weight concentrations of GNP-WEG and inlet temperatures.
Univers
ity of
Mala
ya

250
The performance of working fluids in car radiator is commonly measured by
performance index (ɛ), defined as the ratio of the heat transfer rate to the pressure drop.
Previous researches (e.g., (Samira et al., 2014)) showed that adding nanoparticles increase
the heat transfer rate as well as the pressure drop, which is undesirable. Thus, performance
index is introduced to examine the combined effect of both parameters. Figure 4.72 shows
the variations of performance index of the CNDG for different volume flow rates and
various concentrations. It is observed that performance index is greater than 1 for all
samples in a majority of experimental condition, indicating the effectiveness of the
prepared coolant samples for car radiators. This figures also indicate that performance
index curves showed some reasonable enhancements at different temperatures and
concentrations, indicating a high potential alternative for car radiator in different
conditions. Furthermore, as the weight concentration of CNDG increases, the amount of
performance index increases, however the concentrations of CNDG in all samples are
450
460
470
480
490
500
510
520
530
540
30 35 40 45 50 55
Pre
ssu
re D
rop
(P
a)
Tf(°C)
Water-EG
0.001 CNDG-WEG%
0.005 CNDG-WEG%
0.01 CNDG-WEG%
Figure 4.71: The pressure drop of the car radiator for different Tf (the average temperature between inlet and outlet) and weight concentrations of CNDG-WEG at
volume flow rate of 7 lit/min.
Univers
ity of
Mala
ya

251
fairly low. These results support that for a wide range of inlet temperatures, the
concentrations and volume flow rates have the positive effects of heat transfer which are
more than the negative effects of pressure drop for CNDG-WEG coolants; so the
synthesized coolants have excellent capability for using in car radiators.
0
0.2
0.4
0.6
0.8
1
1.2
1.4
1.6
1.8
2 3 4 5 6 7 8
Pe
rfo
rma
nce
In
de
x
Flow Rate (lit/min)
Tin=55 °C0.001CNDG-WEG
0.005CNDG-WEG
0.01 CNDG-WEG
0
0.2
0.4
0.6
0.8
1
1.2
1.4
1.6
2 3 4 5 6 7 8
Pe
rfo
rma
nce
In
de
x
Flow Rate (lit/min)
Tin=45 °C0.001CNDG-WEG
0.005CNDG-WEG
0.01 CNDG-WEGUniv
ersity
of M
alaya

252
Low concentration of CNDG in prepared samples and high convective and
conductive heat transfer coefficient of alternative coolant noted here can be presented as
much more suitable and economical for being used in car radiator and can provide lower
erosion, which should be further investigated. Also, NDG with special properties such as
high number of electrons for carrying of charged ions “called activation region” which
has attractive and unique electrical properties (Seyed Shirazi et al., 2015; Zakaria et al.,
2015). Electrical conductivity behavior of fluids is a technological importance and has
not been widely studied. The electrical conductivity and enhancement of CNDG-WEG
for different weight concentrations were measured at the temperature range of 20–50 °C,
which are illustrated in Figures 4.73a and b, respectively. It can be seen that the prepared
samples are presented larger electrical conductivity enhancement at higher weight
concentrations of CNDG, due to the presence of higher activation region in the base fluid.
Thus, the intrinsic electron transfer capacity of the CNDG should be the main reason for
electrical conductivity enhancement.
0
0.2
0.4
0.6
0.8
1
1.2
1.4
1.6
1.8
2 3 4 5 6 7 8
Pe
rfo
rma
nce
In
de
x
Flow Rate (lit/min)
Tin=35 °C0.001CNDG-WEG
0.005CNDG-WEG
0.01 CNDG-WEG
Figure 4.72: The performance index of the CNDG-WEG coolants at different flow rates, inlet temperatures and weight concentrations.
Univers
ity of
Mala
ya

253
0
10
20
30
40
50
60
70
80
90
100
15 20 25 30 35 40 45 50 55
Ele
ctri
cal
con
du
ctiv
ity
(μ
S/
cm)
Temperature (°C)
(a) GA+Water-EG
0.001CNDG-WEG
0.005CNDG-WEG
0.01 CNDG-WEG
0
500
1000
1500
2000
2500
3000
3500
4000
15 20 25 30 35 40 45 50 55
Ele
ctri
cal
con
du
ctiv
ity
en
ha
nce
me
nt
Temperature (°C)
(b) 0.001CNDG-WEG
0.005CNDG-WEG
0.01CNDG-WEG
Univers
ity of
Mala
ya

254
Also, resistance of CNDG in solid phase was measured by using 4-point probe
electrical measurements probe. The electrical conductivities of the CNDG were measured
using a Jandel Multi Height Four-Point Probe. The electrical conductibility of the CNDG
material was 2381 S/m, presumably due to the restoration of the graphene network by the
formation of C–N bonded groups and N-doping (Li et al., 2009; X. Li, X. Wang, et al.,
2008).
Also, the ratios of the thermal conductivity (κ) to the electrical conductivity (σ)
of CNDG-WEG nanofluid at different weight concentrations are shown in Figure 4.73c.
From this panel, the k/σ of the water-EG mixture versus temperature show some
fluctuations, while the k/σ of the CNDG-WEG remains almost the same with the increase
of temperature. A sharp increase in electrical conductivity and gradual increase in thermal
conductivity resulted in decreasing k/σ with the increasing of temperature. It reached to
about 0.007 WΩ/K for a weight fraction of 0.005 wt.% at the temperature range of 20-50
°C. No leveling off in k/σ of the present nanofluids by increasing weight concentration
0
0.02
0.04
0.06
0.08
0.1
0.12
0.14
0.16
15 20 25 30 35 40 45 50 55
k/
σ(W
Ω/
K)
Temperature (°C)
(c) Water-EG
0.001 CNDG-WEG
0.005 CNDG-WEG
0.01 CNDG-WEG
Figure 4.73: (a) Electrical conductivity and (b) enhancement in electrical conductivity of CNDG-WEG at different weight concentrations and temperatures (c) the ratio of the thermal conductivity (κ) to the electrical conductivity (σ) of CNDG-WEG for different
weight percentages
Univers
ity of
Mala
ya

255
was observed. The leveling off is due to the counter-ion condensation effect, indeed, it
happens at high weight concentration (Steven et al., 2011), which is not observed here.
In the main results of this phase of study, the structural aspects, dispersion
phenomena, electrical and thermal conductivity enhancement, and forced convective heat
transfer coefficients affirm the superior electrical, thermal and rheological properties of
CNDG-WEG. Further, the thermal conductivity and heat transfer enhancements in the
presence of CNDG has been confirmed that the high specific surface area of CNDG and
the thinning of the thermal boundary layer could be the main reasons for enhancing the
heat transfer rate. The suitable stability without irreversible particle aggregation and
improved thermal conductivity and heat transfer rate would enable the CNDG-WEG to
be used as advanced alternative coolants in car radiators.
4.4.2 Ducts and channels with abrupt expansion
4.4.2.1 Introduction
Availability of highly-stable superconductive nanofluids (such as water-based
HCFLG nanofluids, water-based SGr nanofluids) opens a new gateway for economical
increase in the performance of thermal loops in industrial applications (Azmi et al., 2016;
Cingarapu et al., 2014; Manimaran et al., 2014). Ducts and channels with abrupt
expansion are broadly applied in different industrial applications and heat transfer
equipment. These include passages of turbine blades, combustors, diffusers, and heat
exchangers. Due to mixing of high and low energy fluids in the flow reattachment zone,
the rate of heat transfer along with other thermal parameters are affected in the back-step
flows. In particular, in the reattaching flow region, momentum, mass and heat transfer
vary significantly due to the presence of reverse flows (Mohammed et al., 2015). There
have been many mostly numerically performed studies in the literature to determine the
effects of different parameters on the heat transfer performance as well as identifying the
actual mechanism of flow separation and reattachment (Kherbeet, Mohammed, Salman,
Univers
ity of
Mala
ya

256
et al., 2014; Kherbeet et al., 2015; Lancial et al., 2013; Mohammed et al., 2015;
Sheikholeslami et al., 2015).
It is now known that one efficient way to increase the heat transfer rate in the
separated flow regions is to use highly-conductive working fluids (E. Abu-Nada et al.,
2008; Arzani et al., 2016; Solangi et al., 2016; Yarmand et al., 2016; Zeinali Heris et al.,
2006). To take advantage of this potential, numerous researchers have been employing
different suspension of metal and metal oxide nanoparticles (Mohammed, Al-Aswadi, et
al., 2011; Zeinali Heris et al., 2006).
Eiyad Abu-Nada (2008) was one of the pioneers in studying the heat transfer of
nanofluids in a backward-facing step flow. He synthesized CuO-, Al2O3-, Ag-, Cu- and
TiO2-based water nanofluids and investigated the rate of convective heat transfer
enhancement for various nanofluids of different thermal conductivities. He concluded
that the thermo-physical properties of the nanofluids, in particular the thermal
conductivity, play the key roles in increasing Nusselt number particularly inside the
recirculation zone.
In a similar work, Mohammed and coworkers (Mohammed et al., 2012;
Mohammed, Al‐aswadi, et al., 2011) studied the effects of different nanofluids on the
mixed convective heat transfer coefficient in vertical and horizontal backward-facing
steps. According to their results, the nanofluids with secondary recirculation regions have
lower Nusselt number and the diamond-based water nanofluids showed a significant
enhancement of Nusselt number. More recently, Kherbeet et al. (Kherbeet et al.,
2012) studied the heat transfer rate of Al2O3-, CuO-, SiO2- and ZnO-based water
nanofluids in the laminar flow regime over a microscale backward-facing step. They
reported that there was no recirculation region behind the step for all four nanofluids at
various concentrations. They concluded that SiO2-based water nanofluid showed the best
performance among their prepared nanofluids.
Univers
ity of
Mala
ya
257
The literature reviews of applications reveal that the majority of previous studies
on the heat transfer over a backward-facing step used water-based suspension of metal or
metal oxide nanofluids and the lack of highly-conductive nanofluids including the few-
layered graphene with high stability and specific surface area is obvious. They were also
mostly focused on heat transfer in the laminar regime and there is no reported study on
transition and turbulent flow regimes over a backward-facing step. Thus, discovering the
heat transfer behavior of water and highly-conductive nanofluids in the transition and
turbulent flow regimes is the second target of this study.
To this end, three phases of study have been performed to investigate the heat
transfer behavior of water-based highly crumpled few layered graphene nanofluids as
well as water over a backward facing step. First of all, a quick and efficient
functionalization procedure was developed to fabricate highly-crumpled, few layer
graphene (HCFLG) and single layer graphene (SGr) flakes with large specific surface
area (sections 4.2.1 and 4.2.2). Also, the methods of synthesizing HCFLG and SGR seem
to be new, simple, cost-effective, and with the capability of mass-production. The
HCFLG and SGR materials with nanoscopic porous morphology are of high specific
surface areas based on BET analyses of nitrogen cryo-adsorption method. Morphology
and structure of HCFLG and SGR were analyzed thoroughly (sections 4.2.1 and 4.2.2).
Secondly, water-based HCFLG and water-based SGr nanofluids for different low weight
concentrations were prepared, and thermo-physical properties and colloidal stability in
the presence of covalent and non-covalent functional groups were investigated (sections
4.3.1 and 4.3.2). Lastly, heat transfers parameters such as Nusselt number (Nu) and the
convective heat transfer coefficient (h) over a backward-facing step in both of the
transitional and turbulent flow regimes were investigated for both the aforementioned
nanofluids and compare with water as the basefluid. The results suggest that water-based
Univers
ity of
Mala
ya
258
HCFLG and water-based SGr nanfluids are the highly conductive nanofluids at very low
weight concentration.
4.4.2.2 Data Processing
Experimental measurements of the thermo-physical properties of water-based
HCFLG and water-based SGr nanofluids including thermal conductivity, specific heat
capacities, density and viscosities at different concentrations were performed. Heat
transfer behavior and energy management of the synthesized coolant in the test-rig were
studied and the convective heat transfer coefficient (h), Nusselt number (Nu), and
pressure drop (ΔP) were evaluated. By measuring the temperatures at the inlet and outlet,
and on the wall for different flow rates, the local convective heat transfer coefficients
were obtained. The flow Reynolds number was calculated using,
𝑅𝑒 =𝜌𝑈𝑎𝑣𝑒𝐷
𝜇
(4.17)
where D, Uave, µ and ρ are, respectively, the inner diameter of the test section, the
average flow velocity, the viscosity, and the density of the working fluid. Also, Uave is
given as,
𝑈𝑎𝑣𝑒 =𝑚°
𝜌𝐴𝑐
(4.18)
where m° and Ac are the mass flow rate and surface area of the cross section. The
local heat transfer coefficient “hx” and local Nusselt number “Nux” can be obtained by
the following equations:
𝑄 = 𝑚°𝐶𝑝(𝑇𝑜𝑢𝑡 − 𝑇𝑖𝑛) (4.19)
𝑞 =𝑄
𝐴𝑤
(4.20)
ℎ𝑥 =𝑞
𝑇𝑤𝑥− 𝑇𝑏𝑥 (4.21)
Univers
ity of
Mala
ya

259
Also, the bulk temperature of fluid (Tbx) at the axial distance x is given as (Aravind
et al., 2011):
𝑇𝑏𝑥 = 𝑇𝑖𝑛 +
𝑞𝐷𝑥⁄
𝑚𝑜𝐶𝑝
(4.22)
𝑁𝑢𝑥 =ℎ𝑥𝐷
𝑘
(4.23)
In order to calculate the friction factor, “f”, the pressure drop across the test
section was measured by a Foxboro™ differential pressure transmitter and Eq. (4.24) was
used. That is,
𝑓 = ∆𝑃2𝐷
𝜌𝑈𝑎𝑣𝑒2 𝐿
(4.24)
Employing new working fluids as a coolant requires investigation of their thermal
performance, as well as, their suitability as an appropriate alternative candidate for a range
of Reynolds numbers and temperatures. According to researchers (Samira et al., 2014),
use of nanofluids as the working fluids in heat exchangers provides increase in both heat
transfer coefficient (positive effects)and pressure drop (negative effects). To assess the
effectiveness of water-based HCFLG and water based SGr nanofluids, a performance
index is evaluated which is represented by equation 4.25.
PI =
ℎ𝑛𝑓ℎ𝑏𝑓⁄
∆𝑃𝑛𝑓∆𝑃𝑏𝑓⁄
= RhR∆P
(4.25)
Here Rh is the ratio of the heat transfer enhancement of the new coolant to the base-fluid,
RΔP is the ratio of pressure drop of synthesized coolant to the base-fluid, and subscripts
nf and bf, respectively, refer to the nanofluid and base fluid. As mentioned above, the use
of nanofluids along with the sudden expansion in the duct not only increases the Nusselt
number, but also increases the friction factor. In order to assess the overall performance
of the system, including the thermal performance, as well as, the hydraulic performance
of the system, the performance evaluation criterion (PEC) is evaluated. The PEC shows
Univers
ity of
Mala
ya
260
the ratio of thermal performance of nanofluids in comparison to the Di-water to the
hydraulic performance of nanofluids in comparison to Di-water. Mathematically, the PEC
is given by (Manca et al., 2012),
PEC =
𝑁𝑢𝑛𝑓𝑁𝑢𝑏𝑓⁄
(𝑓𝑛𝑓
𝑓𝑏𝑓⁄ )
13⁄
(4.26)
Equation (6.24) provides an appropriate parameter for clarifying the range of
temperatures and velocities that the synthesized coolant can be used (Samira et al., 2014).
To study the energy saving in the turbulent flow region, the pumping power can be
measured (Mansour et al., 2007). Thus the pumping power ratio is represented by
equation 4.27.
𝑊𝑛𝑓
𝑊𝑏𝑓= (
𝜇𝑛𝑓
𝜇𝑏𝑓)
0.25
(𝜌𝑏𝑓
𝜌𝑛𝑓)
2
(4.27)
where Wnf and Wbf are, respectively, the pumping powers for the nanofluid and the
basefluid.
The uncertainty analysis of the experimental data for the heat transfer and flow
characteristics in the test-rig are of critical importance to ensure the range of validity and
the applicability of the test results. Here uncertainty analysis according to the method
described by Kline and McClintock (S. J. Kline, and F. A. McClintock, January 1953)
was performed and the resulting uncertainties in the Nusselt number, heat transfer
coefficient and friction factor measurements are listed in Table 4.13 and Appendix A. The
measurement uncertainties in the friction factor, heat transfer coefficient, and
performance index (ɛ) were calculated as follows:
∆𝜑
𝜑=1
𝜑√∑(
𝜕𝜑
𝜕𝑥𝑖
𝑛
𝑖=1
× ∆𝑥𝑖)2
(4.28)
Univers
ity of
Mala
ya
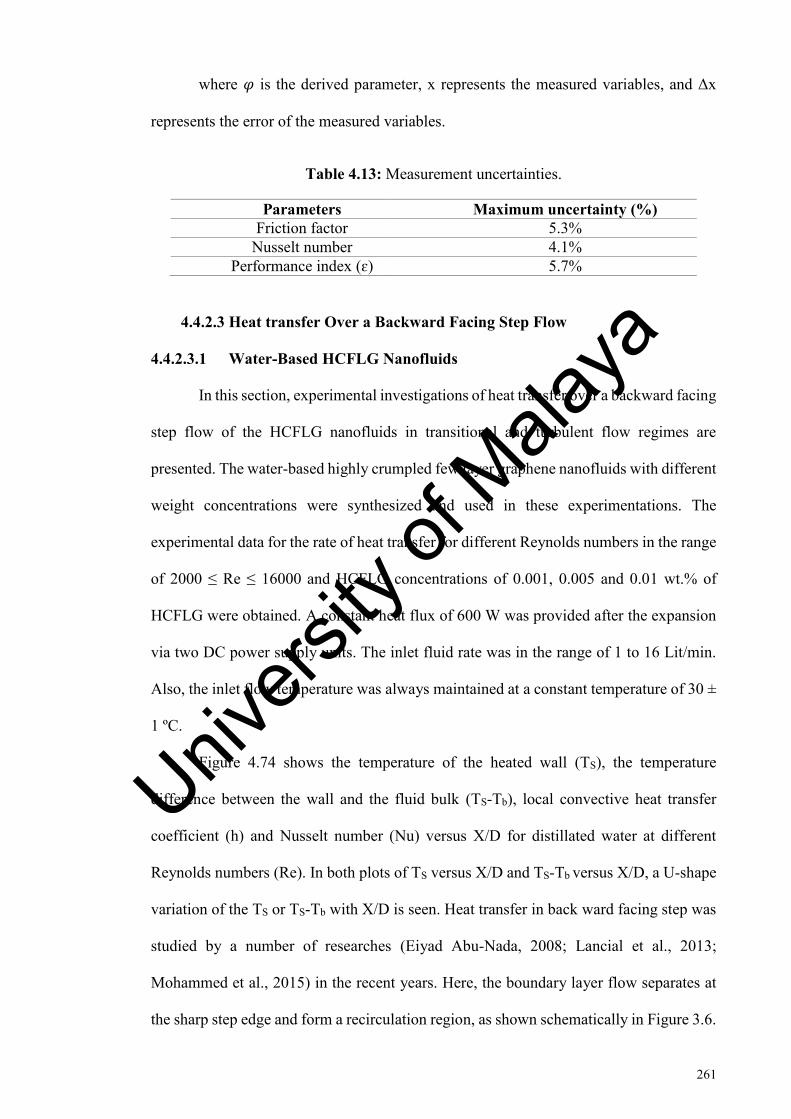
261
where 𝜑 is the derived parameter, x represents the measured variables, and Δx
represents the error of the measured variables.
Parameters Maximum uncertainty (%) Friction factor 5.3%
Nusselt number 4.1% Performance index (ɛ) 5.7%
4.4.2.3 Heat transfer Over a Backward Facing Step Flow
4.4.2.3.1 Water-Based HCFLG Nanofluids
In this section, experimental investigations of heat transfer over a backward facing
step flow of the HCFLG nanofluids in transitional and turbulent flow regimes are
presented. The water-based highly crumpled few layer graphene nanofluids with different
weight concentrations were synthesized and used in these experimentations. The
experimental data for the rate of heat transfer for different Reynolds numbers in the range
of 2000 ≤ Re ≤ 16000 and HCFLG concentrations of 0.001, 0.005 and 0.01 wt.% of
HCFLG were obtained. A constant heat flux of 600 W was provided after the expansion
via two DC power supply units. The inlet fluid rate was in the range of 1 to 16 Lit/min.
Also, the inlet flow temperature was always maintained at a constant temperature of 30 ±
1 ºC.
Figure 4.74 shows the temperature of the heated wall (TS), the temperature
difference between the wall and the fluid bulk (TS-Tb), local convective heat transfer
coefficient (h) and Nusselt number (Nu) versus X/D for distillated water at different
Reynolds numbers (Re). In both plots of TS versus X/D and TS-Tb versus X/D, a U-shape
variation of the TS or TS-Tb with X/D is seen. Heat transfer in back ward facing step was
studied by a number of researches (Eiyad Abu-Nada, 2008; Lancial et al., 2013;
Mohammed et al., 2015) in the recent years. Here, the boundary layer flow separates at
the sharp step edge and form a recirculation region, as shown schematically in Figure 3.6.
Table 4.13: Measurement uncertainties.
Univers
ity of
Mala
ya

262
The shear layer, downstream, impinges on the surface and reattaches to the lower wall at
the so-called the reattachment point (Eaton & Johnston, 1981). Downstream of the
reattachment point, the boundary layer begins to redevelop and far downstream the flow
approached fully developed flow in the larger diameter pipe. The separation and
reattachment in this area cause major changes in the flow in this region. Close to the step,
the velocity is insignificant, leading to the maximum wall temperature and consequently
minimum Nusselt number. On the other hand, the velocity can reach the maximum
amount in the recirculation zone, where the wall temperature is minimum and the Nusselt
number is maximum. So, a U-shape variation of the TS or TS-Tb with X/D is reasonable
and were reported by a majority of recent studies in this field (Eiyad Abu-Nada, 2008;
Lancial et al., 2013; Mohammed et al., 2015).
Thus, there is a sharp downward trend of temperature with X/D up to ~ 2.66, after
which both of the temperature of the heated wall (TS) and the temperature difference
between the wall and the fluid bulk for the deionized water increase moderately with
further increase of X/D. The heat transfer coefficient was computed from the temperature
given by the thermocouples in different positions. Eqs. (6.18) and (6.20) indicate that the
local convective heat transfer coefficient (hx) and local Nusselt number (Nux) have an
inverse relation with the temperature difference between the wall and the bulk fluid.
Therefore, for X/D less than 2.66 for distillated water, the amount of local convective
heat transfer coefficient (h) and local Nusselt number (Nu) increase. By contrast, the h
and Nu show a downward trend for X/D higher than 2.66. Figures 4.75, 4.76 and 4.77
present the measured temperature of the heated wall (TS), the measured temperature
difference between the wall and the fluid bulk (TS-Tb), local convective heat transfer
coefficient (h) and Nusselt number (Nu) for different Re numbers and X/D location for
water-based HCFLG nanofluids with concentrations of 0.001, 0.005 and 0.01 wt%,
respectively.
Univers
ity of
Mala
ya

263
Figure 4.74: Measured temperature of the heated wall (TS), the temperature difference between the wall and the fluid bulk (TS-Tb), local convective heat transfer coefficient (h) and Nusselt number (Nu) versus X/D for distillated water at different Reynolds
numbers (Re).
Univers
ity of
Mala
ya

264
Like distillated water, these figures show a similar U-shape variation of the TS or
TS-Tb with X/D, representing a sudden decrease and a gradual increase. Also, the local
convective heat transfer coefficient (hx) and local Nusselt number (Nux) show the same
trends as the variations of distillated water. From a comparison between Figures 4.74-
4.77, it is observed that the measured temperature of the heated wall (TS) and the
measured temperature difference between the wall and the fluid bulk temperature (TS-Tb)
become closer for higher weight concentration of HCFLG, representing the key role of
HCFLG in transferring heat in the recirculation zone. All of the Nusselt profiles present
the same characteristic behavior: their values are low in the recirculation zone, increase
through a maximum at the reattachment point and decrease in the recovery region to a
stable value, as observed by Nie and Armaly (Nie & Armaly, 2002) for a confined
configuration.
Also, as the concentration of HCFLG in nanofluids increases, the U-shape
variation of the TS or TS-Tb with X/D becomes wider. As mentioned above, the local
convective heat transfer coefficient and local Nusselt number have the inverse
relationship with the measured temperature difference between the wall temperature and
the fluid bulk temperature.
Univers
ity of
Mala
ya

265
Figure 4.75: Measured temperature of the heated wall (TS), the temperature difference between the wall and the fluid bulk (TS-Tb), local convective heat transfer coefficient (h) and Nusselt number (Nu) versus X/D for water-based HCFLG nanofluid at 0.001
wt%.
Univers
ity of
Mala
ya

266
Figure 4.76: Measured temperature of the heated wall (TS), the temperature difference between the wall and the fluid bulk (TS-Tb), local convective heat transfer coefficient (h) and Nusselt number (Nu) versus X/D for water-based HCFLG nanofluid at 0.005
wt%.
Univers
ity of
Mala
ya

267
Figure 4.77: Measured temperature of the heated wall (TS), the temperature difference between the wall and the fluid bulk (TS-Tb), local convective heat transfer coefficient
(h) and Nusselt number (Nu) versus X/D for water-based HCFLG nanofluids at 0.01wt%.
Univers
ity of
Mala
ya

268
In order to perform an appropriate comparison, the variation of average heat
transfer coefficient with the Reynolds number for water-based HCFLG nanofluids at
different weight concentrations as well as water were evaluated, as shown in Figure 4.78.
For all the samples, the average heat transfer coefficient increases with the Reynolds
number and weight concentrations. The highest average heat transfer coefficient was
achieved for water-based HCFLG nanofluid with weight concentration of 0.01% and Re
number of 16,000, representing the average heat transfer coefficient of 5520.26 W/m2K.
For instance, the maximum ratio of enhancement in the average heat transfer coefficient
was almost 60% for water-based HCFLG nanofluid at 0.01 wt.% and Re number of
16,000 as compared with pure water, where the improvement is brilliant.
In order to clarify the key role of weight concentration of HCFLG, the measured
results for Nusselt number are shown for the Reynolds numbers of 2000, 3500, 7000,
13000 in Figure 4.79. These four Reynolds numbers were selected as the candidates for
0
1000
2000
3000
4000
5000
6000
1000 4000 7000 10000 13000 16000
h (
ave
rag
e)
Re
Water HCFLG-0.001 HCFLG-0.005 HCFLG-0.01
Figure 4.78: Average heat transfer coefficient of distillated water and water-based HCFLG nanofluids over a backward-facing step.
Univers
ity of
Mala
ya
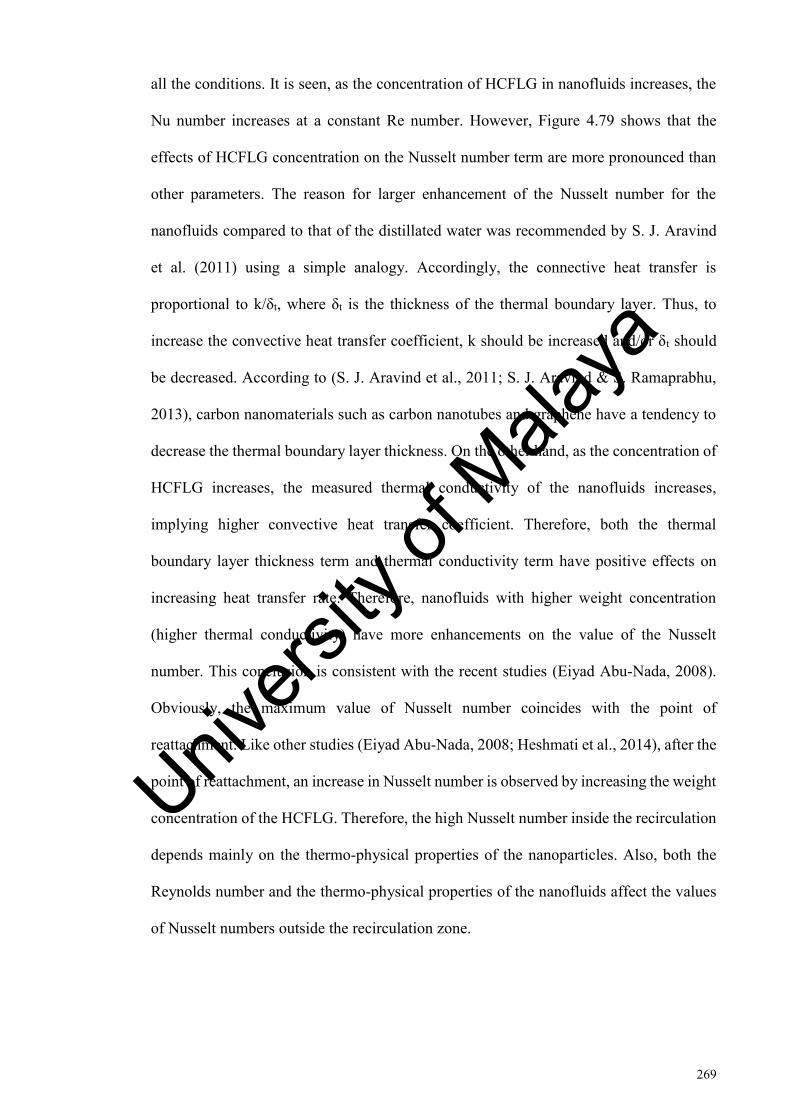
269
all the conditions. It is seen, as the concentration of HCFLG in nanofluids increases, the
Nu number increases at a constant Re number. However, Figure 4.79 shows that the
effects of HCFLG concentration on the Nusselt number term are more pronounced than
other parameters. The reason for larger enhancement of the Nusselt number for the
nanofluids compared to that of the distillated water was recommended by S. J. Aravind
et al. (2011) using a simple analogy. Accordingly, the connective heat transfer is
proportional to k/δt, where δt is the thickness of the thermal boundary layer. Thus, to
increase the convective heat transfer coefficient, k should be increased and/or δt should
be decreased. According to (S. J. Aravind et al., 2011; S. J. Aravind & S. Ramaprabhu,
2013), carbon nanomaterials such as carbon nanotubes and graphene have a tendency to
decrease the thermal boundary layer thickness. On the other hand, as the concentration of
HCFLG increases, the measured thermal conductivity of the nanofluids increases,
implying higher convective heat transfer coefficient. Therefore, both the thermal
boundary layer thickness term and thermal conductivity term have positive effects on
increasing heat transfer rate. Therefore, nanofluids with higher weight concentration
(higher thermal conductivity) have more enhancements on the value of the Nusselt
number. This conclusion is consistent with the recent studies (Eiyad Abu-Nada, 2008).
Obviously, the maximum value of Nusselt number coincides with the point of
reattachment. Like other studies (Eiyad Abu-Nada, 2008; Heshmati et al., 2014), after the
point of reattachment, an increase in Nusselt number is observed by increasing the weight
concentration of the HCFLG. Therefore, the high Nusselt number inside the recirculation
depends mainly on the thermo-physical properties of the nanoparticles. Also, both the
Reynolds number and the thermo-physical properties of the nanofluids affect the values
of Nusselt numbers outside the recirculation zone.
Univers
ity of
Mala
ya
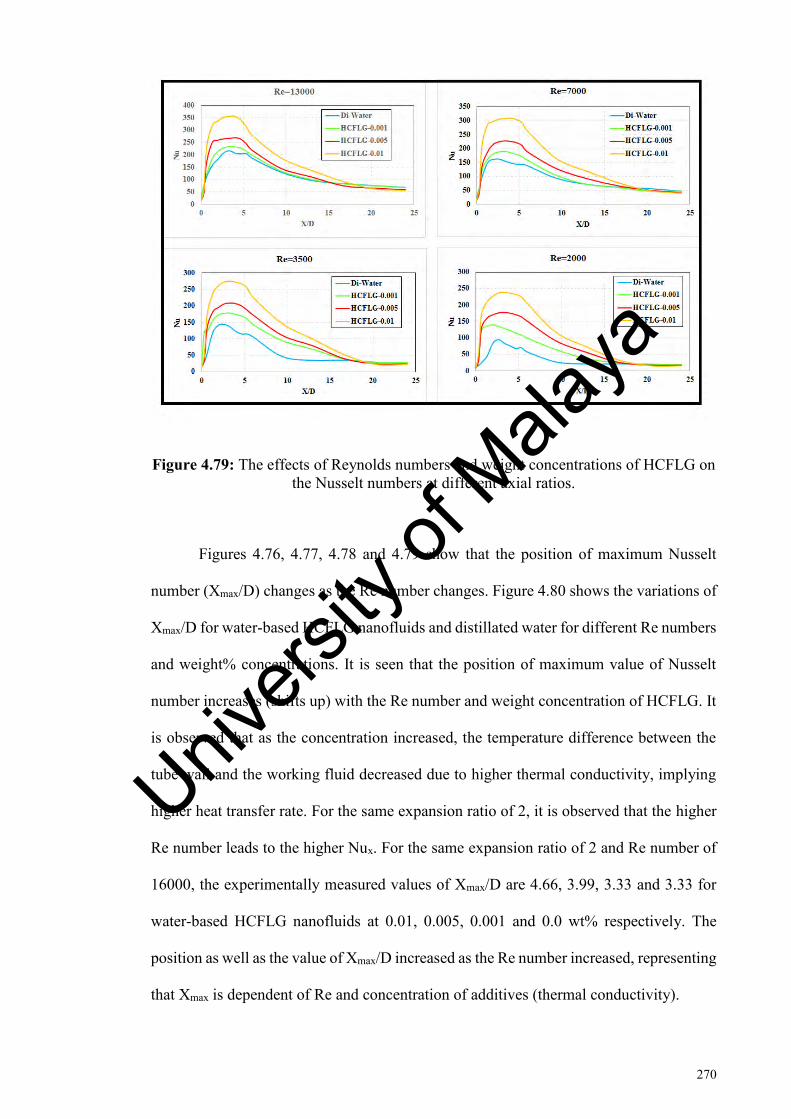
270
Figures 4.76, 4.77, 4.78 and 4.79 show that the position of maximum Nusselt
number (Xmax/D) changes as the Re number changes. Figure 4.80 shows the variations of
Xmax/D for water-based HCFLG nanofluids and distillated water for different Re numbers
and weight% concentrations. It is seen that the position of maximum value of Nusselt
number increases (shifts up) with the Re number and weight concentration of HCFLG. It
is observed that as the concentration increased, the temperature difference between the
tube wall and the working fluid decreased due to higher thermal conductivity, implying
higher heat transfer rate. For the same expansion ratio of 2, it is observed that the higher
Re number leads to the higher Nux. For the same expansion ratio of 2 and Re number of
16000, the experimentally measured values of Xmax/D are 4.66, 3.99, 3.33 and 3.33 for
water-based HCFLG nanofluids at 0.01, 0.005, 0.001 and 0.0 wt% respectively. The
position as well as the value of Xmax/D increased as the Re number increased, representing
that Xmax is dependent of Re and concentration of additives (thermal conductivity).
Figure 4.79: The effects of Reynolds numbers and weight concentrations of HCFLG on the Nusselt numbers at different axial ratios.
Univers
ity of
Mala
ya

271
Figure 4.81a represents the plots of the pressure drop of flow over the backward-
facing step for different Re numbers and weight concentrations of HCFLG including
distillated water. It is seen that as the Re number and concentration of HCFLG in the
basefluid increase, the pressure drop increases. It is noteworthy that the pressure drops
for the prepared samples are quite close to that for the distillated water, which is attributed
to the low concentrations of 0.001 wt%, 0.005 wt% and 0.01 wt%. Figure 4.81a also
shows that the pressure drop for the water-based HCFLG nanofluids at the concentration
of 0.01 wt.% and Re number of 16000 has the highest pressure drop for the current range
of measurements. Note that the pressure drop is proportional to the viscosity of the
working fluids, which exhibit the highest and the lowest amounts corresponding to the
highest and the lowest viscosities in the similar conditions.
The friction factor for the flow over the backward-facing step at different Re
numbers as well as weight concentrations of HCFLG is shown in Figure 4.81b. It is seen
that the measured friction factor decreases with the increase of the Re number for different
weight concentrations of HCFLG. In addition, the friction factor increases as the
concentration of HCFLG increases, although percentage of enhancement is more obvious
Figure 4.80: The effects of Reynolds numbers and weight concentrations of HCFLG on the position of maximum Nusselt numbers.
Univers
ity of
Mala
ya

272
in low values of the Re numbers. As expected, the minimum value of friction factor occurs
for the base fluid. It is also seen as the Re number increases, the dependence of friction
factor on the weight concentration of HCFLG decreases. At low Reynolds numbers, the
Brownian motion is the main mechanism that influences the momentum transfer between
the HCFLG and the base-fluid molecules. Thus, as the Brownian motion increases, the
concentration of HCFLG in the nanofluids increases, which causes the increase of the
friction factor with higher slope as compared with base fluid (Mohammed, Al-Aswadi, et
al., 2011). In contrast, this mechanism loses its dominance for high Reynolds number
flows, where turbulent agitations in flow play the key role. In summary, the turbulence of
the working fluid can be considered as the most important parameters in increasing the
friction factor at the high Reynolds numbers. Also, the small difference between the
friction factors of the distillated water and the water-based HCFLG suspensions at
different weight concentrations is attributed to the small difference between viscosities of
base fluid and the prepared nanofluid samples.
0
10
20
30
40
50
60
0 3000 6000 9000 12000 15000 18000
ΔP
Re
Di-Water HCFLG-0.001
HCFLG-0.005 HCFLG-0.01
(a)
Univers
ity of
Mala
ya

273
The economic performance of working fluids for different heat transfer equipment
is measured via performance index (ε), which identified as the ratio of the heat transfer
rate to the pressure drop ratios. Recent studies (e.g., (Samira et al., 2015)) suggested that
while the addition of solid nanoparticles improves the heat transfer rate, the pressure drop
in the flow loops also increases, which is undesirable. Therefore, performance index is
presented to consider both parameters. The variations of the average performance index
and PEC for water-based HCFLG nanofluids are illustrated for different Re numbers and
weight concentrations in Figure 4.82a. It is seen that the average performance index as
well as PEC of all the samples including HCFLG is higher than 1, representing the
effectiveness of the prepared coolant samples for use over the backward-facing step
flows. It is also seen, as the weight concentration of HCFLG in nanofluids increases, the
average performance index as well as PEC increase, which shows that the enhancement
in heat transfer is more effective compared to the increase in pressure drop. This figure
0
0.01
0.02
0.03
0.04
0.05
0.06
0 3000 6000 9000 12000 15000 18000
Fri
ctio
n f
act
or
Re
Di-Water HCFLG-0.001HCFLG-0.05 HCFLG-0.01
(b)
Figure 4.81: (a) The measured values of pressure drop in the set-up at different Re numbers for distillated water and water-based HCFLG nanofluids with different weight
concentrations. (b) Experimental friction factor for distillated water and water-based HCFLG nanofluids with different weight concentrations at different Re numbers.
Univers
ity of
Mala
ya
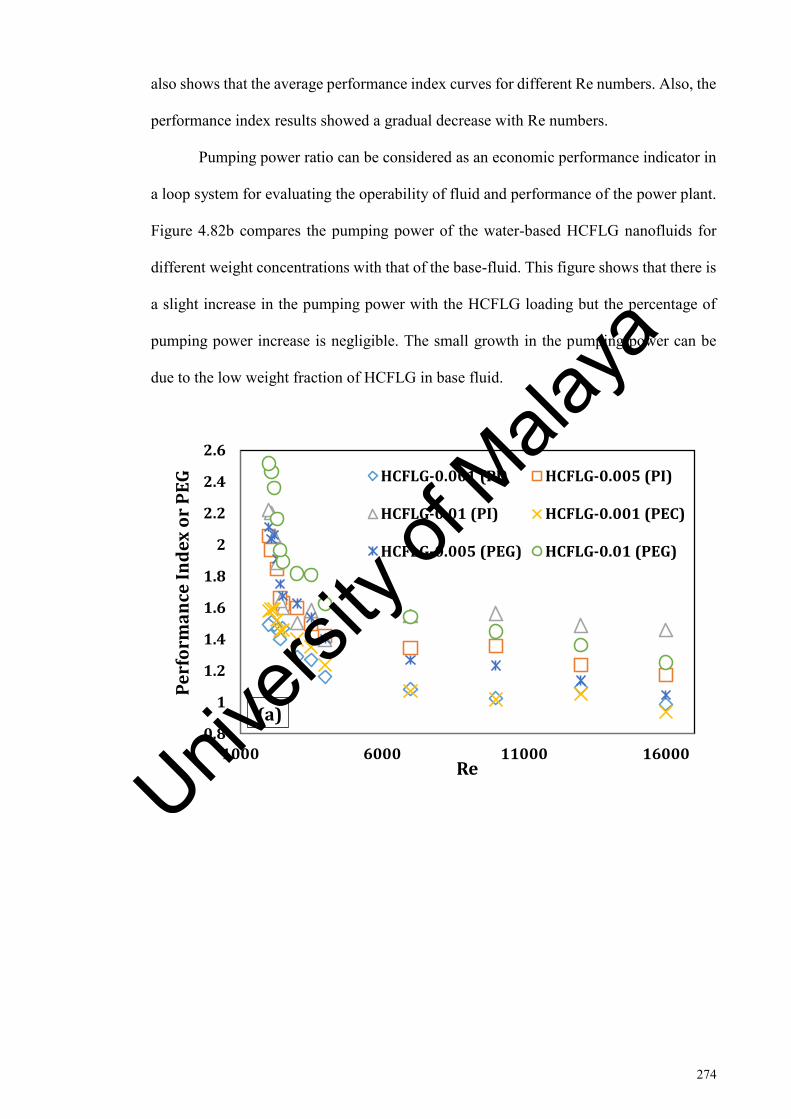
274
also shows that the average performance index curves for different Re numbers. Also, the
performance index results showed a gradual decrease with Re numbers.
Pumping power ratio can be considered as an economic performance indicator in
a loop system for evaluating the operability of fluid and performance of the power plant.
Figure 4.82b compares the pumping power of the water-based HCFLG nanofluids for
different weight concentrations with that of the base-fluid. This figure shows that there is
a slight increase in the pumping power with the HCFLG loading but the percentage of
pumping power increase is negligible. The small growth in the pumping power can be
due to the low weight fraction of HCFLG in base fluid.
0.8
1
1.2
1.4
1.6
1.8
2
2.2
2.4
2.6
1000 6000 11000 16000
Pe
rfo
rma
nce
In
de
x o
r P
EG
Re
HCFLG-0.001 (PI) HCFLG-0.005 (PI)
HCFLG-0.01 (PI) HCFLG-0.001 (PEC)
HCFLG-0.005 (PEG) HCFLG-0.01 (PEG)
(a)
Univers
ity of
Mala
ya
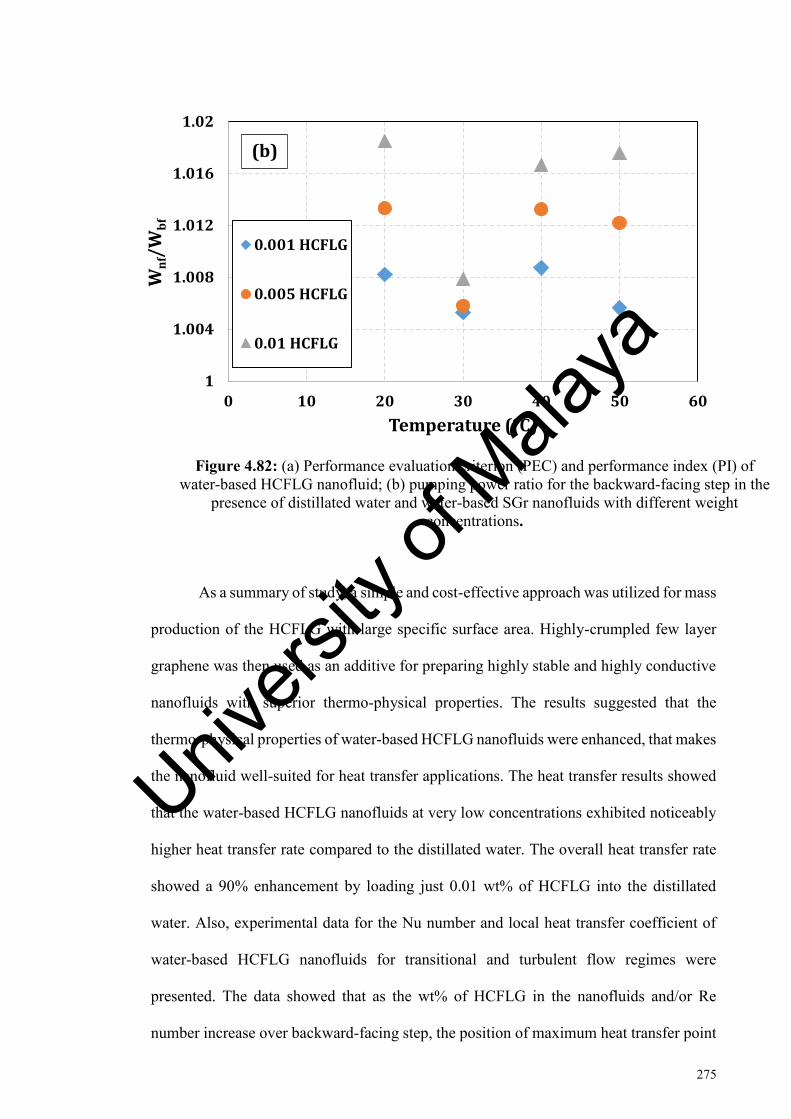
275
As a summary of study, a simple and cost-effective approach was utilized for mass
production of the HCFLG with large specific surface area. Highly-crumpled few layer
graphene was then used as an additive for preparing highly stable and highly conductive
nanofluids with superior thermo-physical properties. The results suggested that the
thermo-physical properties of water-based HCFLG nanofluids were enhanced, that makes
the nanofluid well-suited for heat transfer applications. The heat transfer results showed
that the water-based HCFLG nanofluids at very low concentrations exhibited noticeably
higher heat transfer rate compared to the distillated water. The overall heat transfer rate
showed a 90% enhancement by loading just 0.01 wt% of HCFLG into the distillated
water. Also, experimental data for the Nu number and local heat transfer coefficient of
water-based HCFLG nanofluids for transitional and turbulent flow regimes were
presented. The data showed that as the wt% of HCFLG in the nanofluids and/or Re
number increase over backward-facing step, the position of maximum heat transfer point
1
1.004
1.008
1.012
1.016
1.02
0 10 20 30 40 50 60
Wn
f/W
bf
Temperature (°C)
0.001 HCFLG
0.005 HCFLG
0.01 HCFLG
(
b)
Figure 4.82: (a) Performance evaluation criterion (PEC) and performance index (PI) of water-based HCFLG nanofluid; (b) pumping power ratio for the backward-facing step in the
presence of distillated water and water-based SGr nanofluids with different weight concentrations.
(b)
Univers
ity of
Mala
ya
276
Xmax/D shifts to the higher distances, leading to larger recirculation zone. The presented
results showed that the water-based HCFLG nanofluid is a great candidate for a new
generation of heat transfer fluids.
4.4.2.3.2 Water-Based SGr Nanofluids
For the first time, experimental investigation of heat transfer over a backward
facing step using nanofluids is presented for the transitional and turbulent flow regimes.
A promising water-based SGr nanofluid with unique thermo-physical properties were
synthesized. The experimental study examines the rate of heat transfer over a backward-
facing step for different Reynolds numbers and weight concentrations of SGr. To address
this issue, water-based SGr samples with three weight concentrations of 0.001, 0.005 and
0.01 wt% were utilized and Nusselt number as a candidate for introducing heat transfer
rate were measured in the range of 2000 ≤ Re ≤ 16000. Figure 4.83 shows the temperature
of the heated wall (TS) and the temperature difference between the wall and the fluid bulk
(TS-Tb) of water-based SGr nanofluids with different weight concentrations and
distillated water for different Re numbers and X/D locations. In both plots of TS vs. X/D
and TS-Tb vs. X/D, a U-shape variation of the TS or TS-Tb with X/D is seen. That is, there
is a sharp downward trend of temperature with X/D up to almost 2.66, after which both
the temperature of the heated wall (TS) and the temperature difference between the wall
and the fluid bulk for the deionized water increase gradually with further increase of X/D.
From Figure 4.83, it is observed that the measured temperature of the heated wall (TS)
and the measured temperature difference between the wall and the fluid bulk temperature
(TS-Tb) become closer for higher weight concentration of SGr. Also, as the concentration
of SGr in nanofluids increases, the U-shape variation of the TS or TS-Tb with X/D becomes
wider.
Univers
ity of
Mala
ya

277
Eqs. (6.18) and (6.20) indicate that the local convective heat transfer coefficient
(hx) and local Nusselt number (Nux) have a diverse connection with the temperature
difference between the wall and the bulk fluid. Therefore, for X/D less than ~ 2.66 for
distillated water, the amount of local convective heat transfer coefficient (h) and local
Figure 4.83: The temperature of the heated wall (TS) and the temperature difference between the wall and the fluid bulk (TS-Tb) for water and water-based SGr nanofluids.
Univers
ity of
Mala
ya

278
Nusselt number (Nu) should be increased. By contrary, the h and Nu show a downward
trend for X/D higher than ~ 2.66, which is obvious in Figure 4.84.
Figures 4.84 present the measured Nusselt number of water and samples with
different weight concentrations of 0.001, 0.005 and 0.01 wt% for different Re numbers
and X/D axial ratios. It can be seen that the local Nusselt number (Nux) peaked at the X/D
range of 3 to 4 before starting to decrease gradually. From a comparison between panels
in Figure 4.84, the local Nusselt number has the diverse relationship with the measured
temperature difference between the wall temperature and the fluid bulk temperature. Note
that as the weight concentration increases, the local Nusselt number for all axial ratios
increases, representing higher heat transfer rate than that of base fluid.
In order to perform an appropriate comparison, the variation of average heat
transfer coefficient with the Reynolds number for water-based SGr nanofluids at different
weight concentrations as well as water were evaluated, as shown in Figure 4.85a. For all
the samples, the average heat transfer coefficient increases with the Reynolds number and
weight concentrations. The highest average heat transfer coefficient was achieved in
water-based SGr nanofluid at the weight concentration of 0.01% and Re number of
16,000, such as the average heat transfer coefficient of 6306.18 W/m2K. For instance, the
ratio of enhancement in the average heat transfer coefficient was 83.8% for water-based
SGr nanofluid at 0.01 wt% and Re number of 16,000 as compared with pure water, which
is a brilliant improvement.
From Figure 4.85b, despite some initial fluctuations, the average heat transfer
coefficient ratio (hnf / hbf)ave showed a downward trend with increasing of Reynolds
number for all the concentrations. For example, as the Re number increased from 2000 to
16000, the (hnf / hbf)ave ratio decreased from 233.5 % to only 83.8% at 0.01 wt%; from
132.9 % to 42.4% at 0.005 wt%; and from 5.6 % to only 18.4% at 0.001 wt%. From
Univers
ity of
Mala
ya

279
which, it can be found that the increase in the weight concentration of SGr enhances the
(hnf / hbf)ave ratio.
Figure 4.84: Experimental Nusselt number of distillated water and water-based SGr nanofluids at weight concentrations of 0.001, 0.005 and 0.01% for different Re
numbers.
Univers
ity of
Mala
ya

280
In order to clarify the key role of weight concentration of SGr in samples, the
measured Nusselt number for Reynolds number of 2000, 3500, 7000, 16000 are shown
in Figure 4.86. From Figure 4.86, as the weight concentration of SGr in nanofluids
increases, the Nu number increases. The effect of weight concentration of SGr in water-
Fig. 8. Figure 4.85: Average heat transfer coefficient of distillated water and water-based SGr
nanofluids over a backward-facing step. Univ
ersity
of M
alaya

281
based nanofluids on the temperature gradient term (Ts-Tb) is not negligible. However,
Figure 4.86 shows that the effects of weight concentration of SGr on the temperature
gradient term and on the thermal conductivity term are more pronounced. The reason for
larger enhancement of the Nusselt number of nanofluids compared to that of distillated
water was introduced by S. J. Aravind et al. (2011) using a simple analogy that the
connective heat transfer is proportional to k/δt where δt is the thickness of thermal
boundary layer. Thus, to increase the convective heat transfer coefficient, k can be
increased and/or δt can be decreased. According to (S. J. Aravind et al., 2011; S. J.
Aravind & S. Ramaprabhu, 2013), carbon nanomaterials such as carbon nanotubes and
graphene have a tendency to decrease the thermal boundary layer thickness. On the other
hand, as the concentration of SGr increases, the measured thermal conductivity of
nanofluids increases, implying higher convective heat transfer coefficient. Therefore,
both the thermal boundary layer thickness term and thermal conductivity term have
positive effects on increasing heat transfer rate in the presence of nanofluids including
carbon nanostructures. It is interesting to note that nanofluids with higher weight
concentration (higher thermal conductivity) show higher convective heat transfer
coefficient, indicating the key role of carbon nanostructure on increasing thermal
conductivity and decreasing the thermal boundary layer thickness. This conclusion is the
same with the recent studies (Eiyad Abu-Nada, 2008). According to (Eiyad Abu-Nada,
2008), the maximum value of Nusselt number coincides with the point of reattachment.
Like other studies (Eiyad Abu-Nada, 2008; Heshmati et al., 2014), after the point of
reattachment, an increase in the convective heat transfer coefficient is observed by
increasing the weight concentration of the nanoparticles. Therefore, the high convective
heat transfer coefficient inside the recirculation depends mainly on the thermo-physical
properties of the nanoparticles. Also, both of the Reynolds number and the thermo-
Univers
ity of
Mala
ya
282
physical properties of the nanofluids affect the value of the heat transfer coefficient
outside the recirculation zone.
From Figures 4.84 and 4.86, it can be seen that the position of maximum value of
the heat transfer coefficient and/or Nusselt number (Xmax/D) changes with the Re number.
Figure 4.87 illustrates the Xmax/D of water-based SGr nanofluids and distillated water for
different Re numbers and weight concentrations. It can be seen that the position of
maximum value of the heat transfer coefficient and/or Nusselt number increases (shifts
up) with the Re number and weight concentration of SGr. Regarding weight concentration
of SGr, the lower temperature difference between the tube wall and the working fluid
explains the increase in the heat transfer rate.
Figure 4.86: The effects of Reynolds number and weight concentration of SGr on the local heat transfer coefficient at different axial ratios.
Univers
ity of
Mala
ya

283
Figure 4.88a plots the pressure drop of flow over the backward-facing step for
different Re numbers and weight concentrations of SGr as well as distillated water. It is
seen that as the Re number and concentration of SGr in basefluid increase, the pressure
drop increases. It is noteworthy that the pressure drops for the prepared samples are quite
close to that for the distillated water, which is attributed to the low concentrations of
additive. Figure 4.88a also shows that the pressure drop for the water-based SGr
nanofluids at the concentration of 0.01 wt.% and Re number of 16000 has the highest
pressure drop for the current range of measurement. Note that the pressure drop and
viscosity curves exhibit similar trends, which can be attributed to the direct relationship
between pressure drop and viscosity.
Figure 4.87: The effects of Reynolds number and weight concentration of SGr on the position of maximum local heat transfer coefficient.
Univers
ity of
Mala
ya
284
The friction factor, f, over the backward-facing step is considered for different Re
numbers and weight concentrations of SGr, which is shown in Figure 4.88b. It is seen
that the measured friction factor decreases with increasing the Re Number at different
weight concentrations of SGr. In addition, the friction factor increases as the
concentration of SGr increases, although percentage of enhancement is more sensible in
low amount of Re numbers. The minimum value of friction factor occurs for the base-
fluid. It is also seen as the Re number increases, the dependence of friction factor on the
weight concentration of SGr decreases. At low amount of the Reynolds number,
Brownian motion is the main important parameter that influenced on the momentum
transfer between the SGr and base-fluid molecules. Thus, as the Brownian motion
increases, in the presence of water-based SGr nanofluids, the friction factor increases with
higher slope as compared with base fluid (Mohammed, Al-Aswadi, et al., 2011). By
contrary, this mechanism cannot be dominant for high amount of Reynolds number and
agitation in flow plays the key role. In summary, the velocity of working fluid can be
considered as the most important parameter in increasing the friction factor at the high
amount of Reynolds number. Also, the small difference between friction factors of the
distillated water and water-based SGr suspensions at different weight concentrations may
be related to the insignificant gap between viscosities of base fluid and prepared samples.
Univers
ity of
Mala
ya

285
The economic performance of working fluids for different heat transfer equipment
is measured via performance index (PI), which identified as the ratio of the heat transfer
rate to the pressure drop. Recent studies in the field of heat transfer (e.g., (Samira et al.,
2015)) presented that although the addition of solid nanoparticles improves the heat
transfer rate, the pressure drop in the heat transfer loops also increases, which is
significantly undesirable. Therefore, performance index is presented to consider both
0
10
20
30
40
50
60
0 5000 10000 15000 20000
ΔP
Re
Di-Water
SGr-0.001%
SGr-0.005%
SGr-0.01%
(a)
0
0.01
0.02
0.03
0.04
0.05
0.06
0 5000 10000 15000 20000
Fri
ctio
n f
act
or
Re
Di-Water
SGr-0.001
SGr-0.005
SGr-0.01
(b)
Figure 4.88: (a) The measured value of pressure drop of the set-up at different Re numbers for distillated water and water-based SGr nanofluids with different weight concentrations. (b) Experimental friction factor for distillated water and water-based
SGr nanofluids with different weight concentrations at different Re numbers. Univers
ity of
Mala
ya

286
parameters. The variations of the average performance index for water-based SGr
nanofluids are illustrated for different Re numbers and weight concentrations in Figure
4.89a. It is seen that the average performance index of all samples including SGr
(excluding water-based SGr nanofluids at weight concentration of 0.001% and Re <
4000) is higher than 1, representing the effectiveness of the prepared coolant samples for
being used over the backward-facing step. It is also seen, as the weight concentration of
SGr in nanofluids increases, the average performance index increases, which is an
expecting phenomenon by looking at higher heat transfer coefficient in the presence of
higher weight concentration. This figure also depicts that the average performance index
curves for different Re numbers attain the best results for the weight concentration of 0.01
wt.%, which is followed by a gradual decrease of the average performance index for
further increase in the Re numbers. As the second controller and in order to found a
relation between the thermal performance and hydraulic performance of the test-rig in the
presence of nanofluids, the performance evaluation criterion (PEC) is calculated (Manca
et al., 2012). Like the PI, PEC is assessed as a criteria of optimization of employing both
nanofluids and the backward-facing step as shown in Figure 4.89 panel (a). The PEC
higher than 1 indicates that the enhancement in heat transfer rate is higher than that of an
increase in the pressure drop penalty. Like PI trend, the same trend for PEC was repeated.
From Figure 4.89 panel (a), the performance of nanofluids combined with set-up is higher
than unit for water-based SGr nanofluids at different weight concentrations. Note that the
enhancement in heat transfer become more significant than the pressure drop penalty at
weight concentration > 0.005 wt%.
Also, power consumption and pumping characteristics in a loop is another critical
parameter in terms of economy as well as energy-saving. Pumping power can be
considered as an economic performance indicator in a loop system for evaluating the
operability of fluid and performance of power plant.
Univers
ity of
Mala
ya

287
Figure 4.89b compares the pumping power of the water-based SGr nanofluids for
different weight concentrations and temperatures with that of the base fluid. This figure
0.8
1
1.2
1.4
1.6
1.8
2
2.2
2.4
2.6
1000 4000 7000 10000 13000 16000
Pe
rfo
rma
nce
In
de
x o
r P
EG
Re
SGr-0.001 (PI) SGr-0.005 (PI)
SGr-0.01 (PI) SGR-0.001 (PEC)
SGr-0.005 (PEG) SGr-0.01 (PEG)
(a)
1
1.002
1.004
1.006
1.008
1.01
1.012
1.014
1.016
1.018
10 20 30 40 50 60
Wnf
/Wbf
T (ºC)
(b)
Figure 4.89: (a) Performance evaluation criterion (PEC) and performance index (PI) and (b) pumping power for the backward-facing step in the presence of distillated water and
water-based SGr nanofluids with different weight concentrations.
Univers
ity of
Mala
ya
288
shows that there is a small increase in the pumping power with the SGr loading and the
percentage of pumping power growth is negligible. The small growth in the pumping
power can be due to the low weight fraction of SGr in base fluid.
As a result, a simple and cost-effective approach was utilized for mass production
of the SGr with large specific surface area. Mono layer graphene with high surface area
was then used as additive for preparing highly stable and highly conductive nanofluids
with superior thermo-physical properties. The results suggested that the thermo-physical
properties of water-based SGr were increased significantly, and they are well-suited for
heat transfer applications. A comprehensive study on the prepared nanofluids over a
backward-facing step for transitional and turbulent flow regimes illustrated that water-
based SGr nanofluids at very low concentrations exhibited higher rate of heat transfer as
compared to the distillated water. Overall heat transfer rate showed a dramatic rise by
loading only 0.01 wt% of SGr into the distillated water, representing more than 83%
enhancement. Also, the Nu number and local heat transfer coefficient of distillated water
and water-based nanofluids for transitional and turbulent flow regimes were measured for
the first time. Regarding heat transfer in set-up, as the surface area of additive in
nanofluids increases, the thermal conductivity increases. So, SGr with high thermal
conductivity and high specific surface area can be a great candidate for a new generation
of heat transfer equipment. In addition, as the thermal conductivity of nanofluids and/or
Re number increase over backward-facing step, the position of Xmax/D shifts to the higher
axial ratio.
4.4.3 Two-phase closed thermosyphon
4.4.3.1 Introduction
Different kinds of heat pipes are essential equipment in the electronics, thermal
and electrical appliances. Also, heat pipes are commonly energy-efficient vehicles with
Univers
ity of
Mala
ya

289
minimal maintenance requirements for a long period of time (Chehade et al., 2014; Z.-H.
Liu et al., 2013). Heat pipes are commonly designed based on the characteristics of the
apparatus including working fluid, temperature of the basefluid, the dimension and heat
flux (Z.-H. Liu et al., 2013). In terms of design, heat pipes can be categorized into four
groups: heat pipe with wick, loop heat pipe, thermosyphon heat pipe and thermosyphon
loop. Each type of the heat pipes is appropriate for an special application based on the
thermal performance, rate of heat transfer, the objective device to be cooled and the
installation reason (Bojić & Lukić, 2002; Jaisankar et al., 2011).
Previous researches showed that various factors such as right filling ratio to the
evaporator volume, basefluids, design, bent position and bend angle play key roles in the
thermal performance of the thermosyphon heat pipe (Chien et al., 2011; Jouhara &
Merchant, 2012). Finding optimal filling ratio, working fluids, the geometry, diameters
and bend angles, application of vibration and rotation system have been considered as the
main essential subjects to increase the performance of thermosyphons. Although all the
mentioned novelties have appropriate influence on the thermal performance of
thermosyphon heat pipe, employing of the new basefluids seems to be the most cost-
effective, especially for systems which are already manufactured.
As mentioned above, the effects of working fluids on the performance of
thermosyphon heat pipes were investigated extensively by some researchers (Z.-H. Liu
et al., 2013; Shanbedi, Heris, Amiri, & Baniadam, 2014; Shanbedi et al., 2012; M
Shanbedi et al., 2013). In addition, previous studies (Chol, 1995; S Zeinali Heris et al.,
2006) confirmed that nanofluids made of the mixture of basefluids and nanoparticles with
good thermal conductivity could enhance the thermal performance of the heat pipes. This
observation showed that the thermal conductivity of nanoparticles plays an essential role
in the heat transfer characteristics of nanofluids. A maximal reduction of the thermal
resistance of about 24% was reported in the presence of water based titanium dioxide and
Univers
ity of
Mala
ya
290
gold nanofluids by Buschmann and Franzke (2014). As another example, M Shanbedi et
al. (2013) studied the influence of multiwalled carbon nanotubes (MWCNT) on the
efficiency of two-phase closed thermosyphon (TPCT). They observed about 11%
enhancement in the thermal efficiency of the TPCT at 90 kW in the presence of
functionalized MWCNT. The recent results also showed that the thermo-physical
properties like thermal conductivity of nanoparticles play a key role in their applications
especially in heat transfer equipment (Afshar et al., 2009; Garg et al., 2009). The thermal
conductivity of graphene nanoparticles (GNP) is much higher than the value presented by
other carbon allotropes like MWNT, SWNT and diamond (Azizi et al., 2013). Due to the
promising properties, GNP may have numerous applications in different scientific fields
for making some equipment such as sensors, and batteries (Zhu, Murali, Cai, et al., 2010).
A majority of these applications, however, cannot fully be realized because of
insignificant interaction between GNP and other materials. Thus, in order to increase the
interactivity of carbon nanostructures, covalent and non-covalent functionalizations were
proposed as the common solutions elsewhere. Covalent and non-covalent
functionalizations are two possible methods to increase the GNP dispersibility in
aqueous/organic solvents. Non-covalent functionalization of carbon nanostructures is
performed by employing various surfactants. In order to increase the dispersibility of
carbon nanostructures in aqueous media, four common surfactants of gum Arabic (GA),
sodium dodecyl sulphonate (SDS), sodium dodecyl benzene sulphonate (SDBS) and
triton X-100 are commonly utilized. SDBS and triton X-100 have a benzene function,
which produce powerful π–π interaction with the surface of carbon nanostructures. It is
noteworthy that SDBS has higher dispersibility than that of Triton X-100. This is
attributed to the steric hindrance of tip chains in triton X-100, which resulted in low
concentration of triton on the carbon nanostructures surface (Islam et al., 2003). On the
other hand, although GA can provide better condition for dispersion of carbon
Univers
ity of
Mala
ya

291
nanostructures in comparison with SDBS and triton X-100, it significantly increases the
viscosity of mixture, which may cause numerous problems including increase in pressure
drop in thermal equipment (M Shanbedi et al., 2013). Thus, SDBS was selected as a
suitable candidate for synthesizing non-covalent nanofluid. Also, covalent
functionalization comprises the addition of hydrophobic or hydrophilic groups on the
high energy features such as edges of GNP. To compare the effect of functionalization,
in the present study, the GNPs with two methods based on covalent and non-covalent
reactions were functionalized (section 4.2.6). These include rapid non-covalent
functionalization of GNP with SDBS and the covalent functionalization with carboxyl
groups. The samples were then characterized and the thermal performance in a
thermosyphon was evaluated. The covalent and non-covalent functionalization effects on
the thermal conductivity, viscosity, and thermosyphon performance were studied for
various operating temperatures and concentrations. As discussed in section 4.2.6, in the
presence of non-covalent groups, a significant increase in viscosity of suspension vitiates
the enhancement in the heat transfer characteristics of GNP nanofluids. The presented
results showed that the thermo-physical properties of covalent nanofluids (GNP-
COOH/water) were more enhanced compared to those of non-covalent nanofluids (GNP-
SDBS/water) and water. In this phase of study, overall heat transfer, entropy, thermal
efficiency, thermal resistance and pressure drop are investigated in the presence of
covalent nanofluids even at low concentrations.
4.4.3.2 Data Processing
A study on the heat transfer behavior of the thermosyphon was performed by
evaluating the thermal efficiency, thermal resistance and overall heat transfer coefficient
as well as thermo-physical properties such as viscosity and thermal conductivity of
nanofluids. The overall heat transfer coefficient was obtained by measuring the values of
Univers
ity of
Mala
ya

292
the inlet, outlet, and inner bulk fluid temperatures. The input power at the evaporator
section was measured by using,
𝑄𝑖𝑛 = 𝑉𝐼 (4.29)
where V and I are the voltage and current, respectively. The output power at the
condenser sections (Qout) can be calculated as,
𝑄𝑜𝑢𝑡 = 𝑚∙ 𝐶𝑝(𝑇𝑜𝑢𝑡-𝑇𝑖𝑛 ) (4.30)
where �� is the mass flow rate, Tin and Tout are, respectively, the temperatures of
the inlet and the outlet water to the condenser.
The ratio of output power to input power is commonly introduced as the thermal
efficiency and is given as (Faghri, 1995; Shanbedi et al., 2012),
𝜂1 =𝑄𝑜𝑢𝑡𝑄𝑖𝑛
(4.31)
The overall thermal resistance of the thermosyphon (Rth) is measured from the
average temperature difference between the evaporator and the condenser sections and
the input power. That is (Faghri, 1995; Shanbedi et al., 2012),
𝑅𝑡ℎ =𝑇𝑒 − 𝑇𝑐𝑄𝑖𝑛
(4.32)
where and are introduced as the average temperature of the evaporator and
condenser sections, respectively. The overall heat transfer coefficient (U) can be
calculated as (Faghri, 1995; Shanbedi et al., 2012),
𝑈 =𝑄𝑖𝑛
𝜋𝐷𝐿(𝑇𝑒 − 𝑇𝑐)
(4.33)
where, D and L are the diameter and the length of the evaporator section,
respectively. Based on the second law of thermodynamics, the thermal efficiency of
thermosyphon can be evaluated as the ratio of exergy at the condenser to evaporator
sections. That is (Khalkhali et al., 1999),
eT cT
Univers
ity of
Mala
ya

293
𝜂2 =𝑒𝑜𝑢𝑡𝑒𝑖𝑛
= 𝜂1
(
1 −
1
(𝑇𝑒
∆𝑇 − 1)(𝑇𝑒
𝑇𝑜𝑢𝑡 − 1))
(4.34)
Here, ΔT is the average temperature difference between the condenser and
evaporator sections, which is given by ΔT=Tout-Tin.
The entropy, S, can be calculated as by equation 4.35 (Khalkhali et al., 1999;
Maheshkumar & Muraleedharan, 2011).
𝑆 =𝑄𝑜𝑢𝑡
𝑇𝑐−𝑄𝑖𝑛
𝑇𝑒
(4.35)
4.4.3.3 Heat Transfer Rate
In order to evaluate the thermal efficiency enhancement of the thermosyphon
filled with water-based nanofluids and deionized water, different input powers (30.1,
59.7, 90.5, 119.9 and 149.8 W) were applied and the measured efficiency data are
presented in Figure 4.90. It is seen that when GNP/water nanofluids is used, the thermal
efficiency of thermosyphon improves considerably, which implies enhancement of the
heat transfer effectiveness. The higher thermal efficiency of GNP/water nanofluids is
attributed to the decrease in bubbles size produced at the evaporator interface. The lower
thermal resistance between solid and liquid surfaces in the presence of smaller bubbles
and/or air layer explains the increase in the heat transfer rate. It is also seen that the
enhancement increases as volume concentration of GNP in both covalent and non-
covalent nanofluids increases. Univers
ity of
Mala
ya

294
The thermal efficiency of thermosyphon also increases as the input power
increases, although the increasing trends vary with concentrations and the type of
GNP/water nanofluids. In general, the gradient of thermal efficiency (with respect to
power) is larger at lower input powers compared to that at the higher input power for all
the nanofluids as well as deionized water.
Shanbedi et al. (Shanbedi et al., 2015; Shanbedi, Heris, Amiri, & Baniadam, 2014;
Shanbedi et al., 2012) reported that the geyser-effect (impulsive boiling at low pressures)
can decrease the thermal efficiency of thermosyphon at the higher input power of 90 W
in the presence of carbon nanostructures-nanofluids. A decrease in the slope of thermal
efficiency versus input power at the range of 120–150 W can be attributed to the geyser-
effect phenomenon.
According to the data presented in Figure 4.90, GNP-COOH/water nanofluids
with various weight concentrations are more efficient than the corresponding GNP-
0.7
0.75
0.8
0.85
0.9
0.95
25 50 75 100 125 150
Eff
icie
ncy
Input Power (W)
WATER
GNP-SDBS(0.025%)
GNP-SDBS(0.05%)
GNP-SDBS(0.1%)
GNP-COOH(0.025%)
GNP-COOH(0.05%)
GNP-COOH(0.1%)
Figure 4.90: Efficiency of thermosyphon in the presence of GNP-based water nanofluids at various concentrations.
Univers
ity of
Mala
ya

295
SDBS/water nanofluids, which can be considered as the best non-covalent nanofluids
among the cases studied.
The heat transfer coefficient and thermal efficiency enhancements of the
functionalized nanofluids can result mainly from the improvement of the thermo-physical
properties, in which the synthesized covalent nanofluids at the same conditions show
higher thermo-physical properties e.g. thermal conductivity than that of non-covalent
nanofluids. Thus, the more increase in the thermal conductivity of basefluid in the
presence of GNP-COOH in comparison with GNP-SDBS can possibly explain the
corresponding increase in heat transfer coefficient (Mehta & Khandekar, 2007;
Parametthanuwat et al., 2011). In addition, it is obvious that the thermal efficiency is
influenced by many complementary parameters such as bubble diameter, nucleation site
density and the average rise velocity of the individual bubbles. In terms of nucleation site
density and bubble diameter as another possible mechanism, produced vapor bubbles
easily burst during their generation due to contact with nanoparticles surfaces. This
phenomenon prevents the formation of bubble layers in the solid and liquid interface,
which are the main reason for the reduction of heat transfer. As a result, in the absence of
bubbles, the amount of heat loaded on the evaporator decreased by removing the bubble
layer on the evaporator surface. Thus, when the non-covalent groups warped around the
GNP, it may decrease the effective surface of GNP, implying lower heat transfer rate in
comparison with covalent samples (Kim et al., 2010). The presented results suggest that
a maximum thermal efficiency of 91.5% was archived at the concentration of 0.1 wt%
and the power of 150 W.
Figure 4.91 presents the measured average temperature difference (ΔT) between
evaporator temperature and condenser temperature for different input powers and
concentrations. This figure shows a rising trend of ΔT with the input power and a
Univers
ity of
Mala
ya

296
decreasing trend of ΔT with the concentration of GNP. That is, as the concentration of
GNP increases, ΔT decreases.
As mentioned above, the higher bubble size means higher thermal resistance
between solid and liquid surfaces in the evaporator, leading to a lower heat transfer
rate (Duan et al., 2011; Kim et al., 2010). As a result, in the absence of bubbles, there is
a lower heat load on the evaporator, while the formation of bubble layer on the evaporator
surface lead to a higher heat load on the evaporator, which leads to an increase in the
surface temperature of evaporator and subsequently larger ΔT.
Figure 4.92 shows the variation of evaporator temperature with concentration and
power input. It is seen that the evaporator temperature rises with the input power and
decreases with the increase of GNP concentration. The drop in the evaporator temperature
associated with the increase of GNP concentration may be attributed to the enhancement
of the bubble burst process in the presence of more nanoparticles that prevents the
formation of air layer at the solid–liquid interfaces in the evaporator. This trend is in
20
25
30
35
40
45
25 50 75 100 125 150
ΔT
Input Power (W)
water
GNP-SDBS(0.025%)
GNP-SDBS(0.05%)
GNP-SDBS (0.1%)
GNP-COOH(0.025%)
GNP-COOH(0.05%)
GNP-COOH(0.1%)
Figure 4.91: Effect of input power and concentration of GNP-based water nanofluids on the average temperature difference (ΔT) between the evaporator and the condenser.
Univers
ity of
Mala
ya

297
agreement with the results presented for the efficiency in Figure 4.90. That is, the
formation of smaller bubbles results in higher heat transfer rate and subsequently higher
thermal efficiency compared to the basefluids.
Noteworthy, the higher enhancement in the thermal conductivity of basefluid in
the presence of GNP-COOH in comparison with GNP-SDBS can possibly clarify the
corresponding decrease in ΔT, implying lower heat load on the evaporator and followed
by lower the evaporator temperature, as is apparent in the results.
Figure 4.93 compares the measured overall thermal resistance of nanofluids with
various concentrations of GNP for different heat fluxes with that of deionized water. It is
observed that the overall thermal resistance decreases rapidly with the increase in heat
flux especially for power input less than 90 W. Also, as the concentration of GNP in
nanofluids increases, the overall thermal resistance decreases. As mentioned above, the
thermal conductivity of the basefluids is preferably high for minimizing the temperature
gradient, which also repeated in GNP-COOH-based water nanofluids in comparison with
50
54
58
62
66
70
25 50 75 100 125 150
Tem
prat
ure
of E
vapo
rato
r (˚
C)
Input power (W)
water
GNP-SDBS(0.025%)
GNP-SDBS (0.05%)
GNP-SDBS (0.1%)
GNP-COOH(0.025%)
GNP-COOH(0.05%)
GNP-COOH (0.1%)
Figure 4.92: Effect of input power and concentration of GNP-based water nanofluids on the average temperature of the evaporator section.
Univers
ity of
Mala
ya

298
the non-covalent nanofluids. The reason of increasing the efficiency with the increasing
of concentration of volume of nanofluid can also be related to the increasing of fluid
thermal conductivity (Hussein et al., 2013; Mousa, 2011).
On the effects of functional groups, it is seen that the increase of concentration of
GNP-SDBS has lower influence on the overall thermal resistance as compared with
covalent samples, which can be resulted from lower thermal conductivity of non-covalent
nanofluids, implying the higher temperature gradient (Mousa, 2011). In agreement with
the evaporator temperature variations, Figure 4.93 shows that the thermal resistance of
the thermosyphon is the lowest for GNP-COOH nanofluids with concentration of 0.1 wt%
which is the highest of the concentration being studied.
Figure 4.94 shows the overall heat transfer coefficient of thermosyphon for
different input powers and GNP concentrations. It is seen that the overall heat transfer
coefficient increases with the increasing of the input power and GNP concentration.
Among the data shown in this figure, the heat transfer coefficient for the covalent samples
of GNP-COOH show larger increases. In fact, the maximum overall heat transfer
0
0.2
0.4
0.6
0.8
1
1.2
25 50 75 100 125 150
The
rmal
Res
ista
nce
(˚C/W
)
Input Power (W)
water
GNP-SDBS (0.025%)
GNP-SDBS (0.05%)
GNP-SDBS (0.1%)
GNP-COOH(0.025%)
GNP-COOH(0.05%)
GNP-COOH (0.1%)
Figure 4.93: Effect of input power and concentration of GNP-based water nanofluids on the thermal resistance of thermosyphon.
Univers
ity of
Mala
ya

299
coefficient of 601 Wm−2 °C−1 was found for the GNP-COOH concentration of 0.1% and
input power of 149.8 W. The maximum overall heat transfer coefficient enhancements
for GNP-COOH and GNP-SDBS-based Water Nanofluids are respectively 35% and 68%
for a weight fraction of 0.1%.
In agreement with the temperature gradient and thermal resistance results, the
concentration and type of functionalization method play key roles in increasing the
overall heat transfer coefficient. In thermosyphon studies, due to the higher thermal
conductivity of the basefluids in the presence of GNP-COOH as well as GNP-SDBS, the
lower temperature gradient obtained in the presence of nanofluids means the higher extent
of overall heat transfer coefficient. Also, this reason can identify the gap between the
covalent and non-covalent samples.
Entropy, S, is an important parameter that affects the thermosyphon performance.
Variations of entropy of thermosyphon for water-based nanofluids versus input power for
different concentrations of GNP-COOH and GNP-SDBS are presented in Figure 4.95.
0
100
200
300
400
500
600
700
25 50 75 100 125 150
Ove
rall
Hea
t Tra
nsfe
r Coe
ffic
ient
Input Power (W)
WATER
GNP-SDBS(0.025%)GNP-SDBS (0.05%)
GNP-SDBS (0.1%)
GNP-COOH(0.025%)GNP-COOH(0.05%)GNP-COOH (0.1%)
Figure 4.94: Effect of input power and concentration of GNP-based water nanofluids on the overall heat transfer coefficient of thermosyphon.
Univers
ity of
Mala
ya
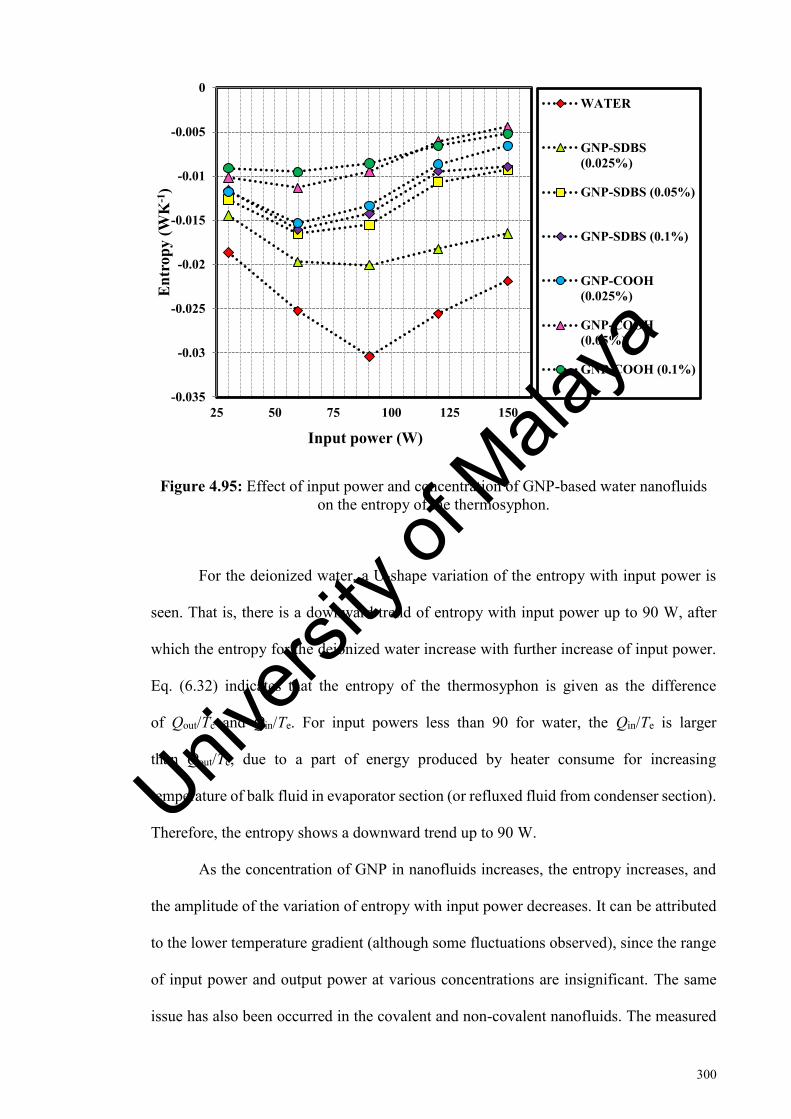
300
For the deionized water, a U-shape variation of the entropy with input power is
seen. That is, there is a downward trend of entropy with input power up to 90 W, after
which the entropy for the deionized water increase with further increase of input power.
Eq. (6.32) indicates that the entropy of the thermosyphon is given as the difference
of Qout/Tc and Qin/Te. For input powers less than 90 for water, the Qin/Te is larger
than Qout/Tc, due to a part of energy produced by heater consume for increasing
temperature of balk fluid in evaporator section (or refluxed fluid from condenser section).
Therefore, the entropy shows a downward trend up to 90 W.
As the concentration of GNP in nanofluids increases, the entropy increases, and
the amplitude of the variation of entropy with input power decreases. It can be attributed
to the lower temperature gradient (although some fluctuations observed), since the range
of input power and output power at various concentrations are insignificant. The same
issue has also been occurred in the covalent and non-covalent nanofluids. The measured
-0.035
-0.03
-0.025
-0.02
-0.015
-0.01
-0.005
0
25 50 75 100 125 150
Ent
ropy
(WK
-1)
Input power (W)
WATER
GNP-SDBS(0.025%)
GNP-SDBS (0.05%)
GNP-SDBS (0.1%)
GNP-COOH(0.025%)
GNP-COOH(0.05%)
GNP-COOH (0.1%)
Figure 4.95: Effect of input power and concentration of GNP-based water nanofluids on the entropy of the thermosyphon.
Univers
ity of
Mala
ya

301
data suggests the point of minimum entropy shifts to the lower input power to about 60 W
for the range of concentrations studied. For high input power, a thin layer of vapor forms
around the evaporator surfaces, which acts like an insulation layer and leads to
low thermal conductivity. When the concentration of GNP increases, it is conjectured that
the nanoparticle bursts the vapor bubbles and decrease the air layer (Kim et al., 2010),
thus, providing a higher heat transfer rate from the heater to the bulk fluid in evaporator
and shifting up the entropy.
Figure 4.96 plots the measured vacuum pressure drop of the thermosyphon for
different input powers and concentrations of nanofluids as well as deionized water. It is
seen, as the input power and concentration of nanofluids increases, the pressure drop
increases. The pressure drops for GNP-COOH/water nanofluids at various concentrations
are quite similar and close to that for deionized water pressure drop. This observation
confirms that influence of GNP nanostructures on the effective viscosity of nanofluids
and consequently on the pressure drop is small. On the other hand, as the concentration
of GNP-SDBS increases, the variation of pressure drop with the input power shows
sharper slope. That is, the GNP-SDBS/water nanofluids at the concentration of 0.1 wt%
and input power of 149.8 W shows the maximum pressure drop. Expectedly, the pressure
drop curve and viscosity curves show similar trends in the presence of covalent and non-
covalent samples, which can be resulted from the direct connection between pressure drop
and viscosity. Univers
ity of
Mala
ya

302
It should be pointed out that the uncertainties of the measured parameters are
evaluated by the method described by S. J. Kline and McClintock (1953). Accordingly,
the maximum error in evaluating all quantities was less than 4.5%.
As a summary of this phase of study, GNP-based water nanofluids were
synthesized using two methods, one SDBS as one of the most effective surfactants (non-
covalent functional group) and subsequently by acid treated GNP under microwave. The
thermal performances of the nanofluids functionalized by two different methods are
evaluated and compared for a range of concentrations and input powers. Acid treatment
was introduced numerous carboxyl groups on the surface of GNP and due to attachment
of COOH groups with main flake of GNPs, good dispensability was achieved. The
prepared GNP-based water nanofluids exhibited higher thermo-physical properties
compared to the distillated water. The experimental data suggests that the thermo-
physical properties of covalent nanofluids (GNP-COOH/water) was more significantly
enhanced compared with those of non-covalent nanofluids (GNP-SDBS/water). The
15
17
19
21
23
25
27
0 25 50 75 100 125 150
Pres
sure
Dro
p (in
Hg)
Input power (W)
WATER
GNP-SDBS (0.025%)
GNP-SDBS (0.05%)
GNP-SDBS (0.1%)
GNP-COOH(0.025%)
GNP-COOH (0.05%)
GNP-COOH (0.1%)
Figure 4.96: Effect of input power and concentration of GNP-based water nanofluids on the vacuum pressure drop of thermosyphon.
Univers
ity of
Mala
ya

303
measured overall heat transfer, entropy, thermal efficiency, thermal resistance and
pressure drop of covalent nanofluids showed promising results even at low nanofluid
concentrations. The presented results suggest that the thermal performance of covalent
nanofluids is better than that of non-covalent samples in the same experimental
conditions. The results also suggest that the addition of GNP-SDBS to the deionized water
increased the pressure drop and viscosity in thermosyphon more than GNP-COOH/water.
In summary, the covalent functionalization under microwave radiation is quick and cost-
effective with promising enhancement of thermal performance; therefore, it has the
potential to replace the use of surfactant for synthesizing nanofluids.
4.5 Numerical Study on the Convective Heat Transfer Over a Backward-
Facing Step
4.5.1 Introduction
The thermo-physical phenomena of separation and reattachment e.g. backward-
facing step, involving heat transfer, are frequently encountered in many engineering
problems like electrical rotating machines. Thus, investigation of the convection heat
transfer over a backward facing step is one of the interesting topics in many research
studies. Heat transfer applications of backward facing step appear in different industrial
equipment such as combustors, aircraft, gas turbine engines, and buildings. It is obvious
that the separation and reattachment of the flow can change the flow structure and has a
direct influence on the heat transfer mechanism as well as thermal performance of the
equipment (Eiyad Abu-Nada, 2008). Thus, numerous numerical studies have been
investigated to determine the real mechanism of flow separation and reattachment, the
best geometry for heat transfer applications, and the best type of working fluids in the
past decades (Abu-Mulaweh et al., 1993; J.-T. Lin et al., 1991). Although, the flow over
a backward-facing step with heat transfer was investigated by some scientists (Vradis &
Univers
ity of
Mala
ya

304
Vannostrand, 1992; Vradis et al., 1993), a majority of studies considered the isothermal
flow, commonly in two dimensional geometry.
A study on the two non-Newtonian liquids was performed in a sudden expansion
in the presence of viscoelastic polyacrylamide (PAA) solutions and a purely viscous
shear-thinning liquid (Vradis & Vannostrand, 1992). According to their results, the
reattachment length of non-Newtonian fluid was shorter than that of Newtonian
counterparts and surely water. Abu-Nada (Eiyad Abu-Nada, 2006) performed a numerical
study on the entropy over a backward facing step for different expansion ratios. Different
expansion ratios of 1/4, 1/3, 1/2, 2/3, and 3/4 were selected and the results presented an
increase in the Reynolds number with the value of total entropy generation number, which
was for the high range of Reynolds number. A numerical study on the laminar regime in
a rectangular duct including backward-facing step was performed by Nie and Armaly
(2002). They suggested the appearance of the maximum reattachment length at the
sidewall. Also, they concluded that as the step height enhances, the amount of Nusselt
number increases. Biswas et al. (2004) investigated the laminar fluid flow behavior over
a three dimensional backward-facing step with various expansion ratios. They concluded
that the formation of wall jets at the side wall within the separating shear layer, formed
by the spanwise of the velocity moves towards the symmetry channel plane. An
experimental study have been done by Armaly et al. (2003) for measuring the velocity
over a backward-facing step by using two-component laser Doppler velocimeter in
laminar regime. In another similar study, Hsieh et al. (2010) studied the flow over a
backward-facing step by the Direct Simulation Monte Carlo method (DSMC). According
to their results, the side walls can significantly affect the flow structure and thermal
characteristics in the 3-D structure. Bao and Lin (2011) also utilized the DSMC approach
for investigation of the thermal performance over the microscale backward-facing step in
the transition regime. They reported that the streamwise velocity is positive at the
Univers
ity of
Mala
ya
305
Knudsen number of 0.136, indicating the lack of the reversed flow after the step. Also,
they concluded that there is a non-linear connection between the mass flow rate and
pressure drop ratio in traditional flow.
As mentioned above, a majority of studies focused on having novelty in changing
design such as expansion ratio, in particular in the laminar regime, and neglected thermo-
physical properties of working fluid. Thus, as another novelty for improving heat transfer
rate over a backward-facing step is the utilization of nanofluids. A combination of
nanofluids with thermal conductivity and backward-facing step can result in an effective
approach for enhancing the heat transfer rate. In addition, previous studies (Solangi et al.,
2015) showed that nanofluids made of the mixture of basefluids and nanoparticles with
good thermal conductivity could enhance the thermal performance of the different heat
transfer equipment.
Kherbeet et al. (2012) investigated the heat transfer behaviors of four types of
nanofluids (Al2O3-, CuO-, SiO2- and ZnO-based water nanofluid) in the laminar regime
over a microscale backward-facing step. The results showed the lack of recirculation
region behind the step for all the prepared samples at different concentrations. In addition,
the results suggested that SiO2-based water nanofluid has the highest Nusselt number as
compared with other nanofluids. In addition, the results showed that the amount of
Nusselt number enhances with the increment of the volume fraction of the nanoparticles
in the base fluid. Kherbeet, Mohammed, Munisamy, et al. (2014) performed a numerical
study on the laminar mixed convection flow of nanofluids over a horizontal microscale
forward-facing step (MFFS) using a finite volume method. Different nanofluids including
SiO2-, Al2O3-, CuO-, and ZnO-based ethylene glycol nanofluids at various volume
fractions investigated in terms of heat transfer parameters and the results demonstrated
that the SiO2-based ethylene glycol nanofluid had the maximum Nusselt number. They
Univers
ity of
Mala
ya

306
also reported that the Nusselt number increases with decreasing nanoparticle density and
diameter as well as increasing volume fraction of nanoparticles.
It is obvious from the above literature review that the terms of thermal
conductivity of nanoparticles was neglected. In addition, most of the previous studies on
the backward-facing step involved metal- or metal oxide-based water or ethylene glycol
as the basefluid and there is no study concentrated on nanofluids including carbon
nanostructures. It is known that the thermal conductivity of most carbon particles such as
carbon nanotubes (CNTs) and graphene nanoplatelets (GNPs) are much higher than that
of metal or metal oxide nanoparticles. This implies that the carbon-base nanoparticles
have higher potential for enhancing the thermal conductivity of base fluids. Despite some
promising thermal properties of graphene nanopleteles in the field of nanofluids, the
strong van der Waals interactions have limited their thermal applications. Non-covalent
and covalent functionalization are the effective approaches to improve the dispersibility
of GNPs. Also, there is no study in water–ethylene glycol media over the backward-facing
step.
Herein, three phases of study have been performed for numerical investigation of
heat transfer behavior in the presence of EG-treated GNP based water–EG coolants over
a backward facing step. First, a promising and potentially industrially scalable
functionalization approach is employed to prepare ethylene glycol-functionalized
graphene nanoplatelets (EGNP) and EGNP based water–EG coolant (EGNP-WEG). First
phase followed by analyzing EG-treated GNP samples in terms of functionality and
morphology (section 4.2.4). Second phase of study comprises of the experimental-
evaluation of the thermo-physical, rheological and colloidal properties of EGNP-WEG
(section 4.3.4). As the three phase of study, a numerical analysis on the heat transfer over
a backward-facing step is performed in the presence of EGNP-WEG at different weight
concentrations. The main objective was to investigate the heat transfer enhancement and
Univers
ity of
Mala
ya

307
pressure drop in the presence of EGNP in basefluid. The latter is obtained by the
calculation of the performance index.
4.5.2 Numerical implementation
The numerical method available in the commercial CFD package of ANSYS-
Fluent, V15, has been used here. Fluent uses a finite volume approach to convert the
governing partial differential equations into a system of discrete algebraic equations. As
the discretization methods, a second-order upwind scheme was selected for the
momentum, turbulent kinetic energy and turbulent dissipation rate equations whereas the
first order upwind for energy equation was selected. For two-phase calculations, the phase
momentum equations with the shared pressure are solved in a coupled and segregated
fashion. The phase coupled SIMPLE (PC-SIMPLE) algorithm was employed for the
pressure–velocity coupling. PC-SIMPLE is an extension of the SIMPLE algorithm to
multiphase flows. The scaled residuals for the velocity components and energy are set
equal to 10−8 and 10−9, respectively.
4.5.3 Governing equations
Considering the turbulent forced convection in a steady flow of an incompressible
and Newtonian fluid, the governing equations can be written as follows (T. M. Shih,
1984):
(a) Continuity equation
. 0eff V (4.36)
(b) Momentum equations
2 ' '.( ) .( )eff eff effVV P V v v (4.37)
(c) Conservation of energy
,.( ) .((k k ) )eff p eff eff tC VT T (4.38)
Univers
ity of
Mala
ya
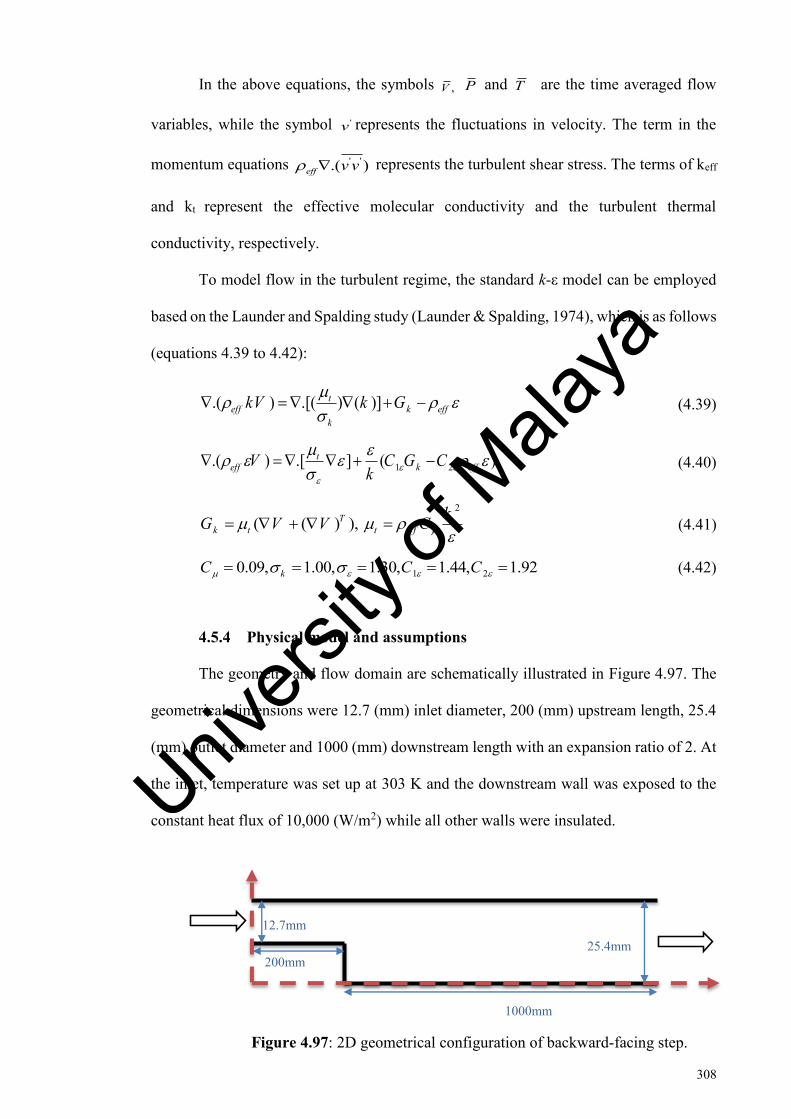
308
In the above equations, the symbols ,V P and T are the time averaged flow
variables, while the symbol 'v represents the fluctuations in velocity. The term in the
momentum equations ' '.( )eff v v represents the turbulent shear stress. The terms of keff
and kt represent the effective molecular conductivity and the turbulent thermal
conductivity, respectively.
To model flow in the turbulent regime, the standard k-ε model can be employed
based on the Launder and Spalding study (Launder & Spalding, 1974), which is as follows
(equations 4.39 to 4.42):
.( ) .[( ) ( )]teff k eff
k
kV k G
(4.39)
1 2.( ) .[ ] ( )teff k effV C G C
k
(4.40)
2
( ( ) ), Tk t t eff
kG V V C
(4.41)
1 20.09, 1.00, 1.30, 1.44, 1.92kC C C (4.42)
4.5.4 Physical model and assumptions
The geometry and flow domain are schematically illustrated in Figure 4.97. The
geometrical dimensions were 12.7 (mm) inlet diameter, 200 (mm) upstream length, 25.4
(mm) outlet diameter and 1000 (mm) downstream length with an expansion ratio of 2. At
the inlet, temperature was set up at 303 K and the downstream wall was exposed to the
constant heat flux of 10,000 (W/m2) while all other walls were insulated.
12.7mm 25.4mm
200mm
1000mm
y
Figure 4.97: 2D geometrical configuration of backward-facing step.
Univers
ity of
Mala
ya

309
The base fluid (ethylene glycol-water mixture) and the nanoparticles are assumed
to have a thermal equilibrium and no slip condition occurs. The fluid flow is considered
to be Newtonian and incompressible. The thermo-physical properties of the mixture of
EG-water and EGNP-WEG coolants at different weight concentrations were obtained
from experimental tests.
4.5.5 Grid study
The meshing tool available in ANSYS was used to construct the computational
mesh. A structured mesh based on a rectangular grid was used throughout the domain.
Several grid distributions had been tested and the results were compared to ensure that
the calculated results were grid independent. Figure 4.98 shows the comparison of surface
Nusselt numbers for Reynolds number of 5000 and pure water as a working fluid at three
different grid distributions. It has shown that obtained results are independent of the
number of grid points.
45.00
50.00
55.00
60.00
65.00
70.00
75.00
80.00
0.2 0.4 0.6 0.8 1
Nu
Pipe Length (m)
142129
195994
249859
Figure 4.98: Local Nusselt numbers for Re = 5000 and pure water at three different grid distributions.
Univers
ity of
Mala
ya

310
To reduce computational time and effort, the total grid points and the elements
have employed throughout the tube are 142,129 and 140,800, respectively. A non-
uniform grid was utilized in the meshing phase. Noteworthy, the grids are smaller where
close to the separated region (backward phase of flow happen) for obtaining better results
(see Figure 4.99).
4.5.6 Result and discussion
Dynamic viscosities, density, thermal conductivity and specific heat capacity of
water–EG and EGNP-WEG mixtures were experimentally obtained and presented in
section 4.3.4.
As a next phase of study, the numerical study on the forced convection heat
transfer for the turbulent regime over a backward-facing step has been performed in the
presence of EGNP-WEG coolants for various Reynolds numbers and weight
concentrations. There are 15 cases of simulation, where weight concentrations of 0%,
0.01%, 0.05%, 0.1%, and 0.2% and the Reynolds numbers of 5000, 10,000 and 15,000
have been selected. The streamlines in the turbulent regime for the weight concentration
of 0.2% and Reynolds number of 5000, 10,000 and 15,000 are presented in Figure 4.100
Figure 4.99: Mesh configuration of backward facing step.
Univers
ity of
Mala
ya

311
panels a, b and c, respectively. Streamline plots present the flow patterns for backward-
facing step for the expansion ratio of 1:2.
(a) (b)
(c)
Univers
ity of
Mala
ya

312
In addition, as the Reynolds number increases, the flow at the edge of the step
separates and a recirculation zone is observed behind the step (Lancial et al., 2013). As
another important phenomenon, the size of recirculation zone increases with an increase
Figure 4.100: Streamline of velocity with weight fraction of 0.2% (a) Re = 5000, (b) Re = 10,000, (c) Re = 15,000, isothermal streamline with weight fraction of
0.2% (d) Re = 5000, (e) Re = 10,000, (f) Re = 15,000.
(d)
(f)
(e)
Univers
ity of
Mala
ya

313
in the Reynolds number. From the streamline plots, it is seen that the recirculation region
expands in terms of length with the increase of Reynolds number. Thus, the largest
recirculation region in our results is obtained for Re of 15,000, which can be resulted in
higher heat transfer rate improvement due to the recirculation formation (Lancial et al.,
2013). For more clarification, isothermal streamlines are presented in Figure
4.100d, e and f for three Reynolds numbers of 5000, 10,000 and 15,000, respectively.
Figure 4.101 (a–c) and (d–f) are presented the forced convective heat transfer
coefficient (hx) and the local Nusselt numbers (Nux) of EGNP-WEG as well as basefluid
as a function of the Reynolds number and weight concentration, respectively. First, all of
the forced convective heat transfer coefficient plots show the same characteristic
behavior. Based on the results, both Nux and hx values are small in the recirculation zone,
significantly increase through the recirculation zone to reach a maximum in the
reattachment region and followed by decreasing into the recovery region to a stable value,
which is in agreement with Nie and Armaly (2002), Lancial et al. (2013), Cheng and Tsay
(2006) and Heshmati et al. (2014). It can be observed that the Nusselt number and
convective heat transfer coefficient are higher for the cases with higher Re number, with
maximum Nu of 342.61 for Re of 15,000 and weight concentration of 0.2%.
Consequently, the higher Re number, the higher Nu is and the higher the position of the
happened maximum Nusselt number is. It can be seen that the maximum Nusselt number
and heat transfer points move depending on the Reynolds number. Also, all of the plots
regarding the Nusselt number profile and heat transfer coefficient at constant Re number
present the same maximum points, indicating Xmax is independent of weight concentration
of nanofluids, which is confirmed by Heshmati et al. (2014). The value of Xmax is 0.24.5,
0.25.5, and 0.26 m for Re numbers of 5000, 10,000, and 15,000, respectively.
Univers
ity of
Mala
ya

314
Further downstream, where the variation of Nu tends to be constant, the flow
become fully-developed. All samples showed similar results in terms of weight
concentration, meaning the higher weight concentration, the higher heat transfer
coefficient and Nusselt number as well.
As it is seen in Figure 4.101, the maximum enhancement in the forced convective
heat transfer coefficient for EGNP-WEG is 50% at Xmax. The reason for larger
enhancement of the convective heat transfer with increasing concentration was discussed
above by S. J. Aravind et al. (2011) using a simple analogy that the connective heat
Figure 4.101: Convective heat transfer coefficient as a function of different weight concentrations at different Reynolds numbers of (a) 5000, (b) 10,000, and (c)
15,000 and the local Nusselt number as a function of different concentrations at (d) Re = 5000, (e) Re = 10,000, and (f) Re = 15,000.
Univers
ity of
Mala
ya
315
transfer can be introduced with k/σ, where σ and k are the thickness of the thermal
boundary layer and thermal conductivity of sample, respectively. According to S. J.
Aravind et al. (2011), carbon nanostructures such as carbon nanotubes and graphene
decrease the thermal boundary layer thickness. On the other hand, they increase the
thermal conductivity of working fluids such as water and EG, as it is obvious in the
present experimental results, indicating a significant increase in the convective heat
transfer coefficient.
Also, the higher Nusselt number for the EGNP-WEG coolants in comparison with
basefluid is attributed to the improved thermal conductivity, which leads to the lower
temperature difference between the tube wall and the bulk fluid.
The friction factor for the upper and lower walls at different weight concentrations
of EGNP is shown in Figure 4.102a at constant inlet flow temperature of 35 °C. It is also
clear from Figure 4.102a, as there are two peaks for skin friction coefficient for all cases.
It is seen that the numerical friction shows some fluctuations, which is attributed to the
circulation zone and followed by showing similar friction factor in the fully-developed
regime. In addition, although the difference is not significant, the friction factor increases
as the concentration of EGNP increases, which is in agreement with many experimental
results in different regimes of flow, meaning basefluid has the lowest friction factor. The
second peak can be attributed to the secondary recirculation region. Figure 4.102b is
shown the ratio of skin friction factor of nanofluid to basefluid at different weight
concentrations. It can be seen as the weight concentration increases, the ratio of the ratio
of skin friction factor of nanofluid to basefluid increases. Figure 4.102c presents the
performance index of EGNP-WEG for different weight concentration and Reynolds
numbers. The performance index (ɛ) is the ratio of the heat transfer rate to the pressure
drop. Some studies (e.g., Solangi et al. (2016)) illustrate that the addition of nanoparticles
increases the heat transfer rate enhancement and the pressure drop together, which is
Univers
ity of
Mala
ya

316
desirable and undesirable, respectively. Noticeably, the performance index results of all
samples in Xmax for all Reynolds number is greater than 1, indicating the effectiveness of
the prepared coolant over a backward facing step. This figure also shows that the
performance index curves for different Reynolds number reach their peaks for a weight
concentration of 0.05%, and that is followed by a decrease of the performance index for
further increase in the weight concentration of EGNP.
0
0.002
0.004
0.006
0.008
0.01
0.012
0.014
0.1 0.2 0.3 0.4 0.5 0.6 0.7 0.8 0.9 1 1.1 1.2
Cf
Pipe Length (m)
(a)
0.00%0.01%0.05%0.10%0.20%
0
0.5
1
1.5
2
2.5
3
3.5
4
0.1 0.2 0.3 0.4 0.5 0.6 0.7 0.8 0.9 1 1.1 1.2
Cf n
f/C
f bf
Pipe Length
0.01%0.05%0.10%0.20%
(b)
Univers
ity of
Mala
ya

317
As a summery, this numerical study analyses the recirculation phenomena in a
turbulent flow downstream over a backward facing step in the presence of a new type of
coolant. Numerical simulation showed that the value and the position of maximum Nu
depends on Re in the turbulent regime.
1.03
1.04
1.05
1.06
1.07
1.08
1.09
1.1
1.11
1.12
1.13
0 0.05 0.1 0.15 0.2
Pe
rfo
rma
nce
(ɛ)
Concentration (ϕ)
(c)5000
10000
15000
Figure 4.102: (a) Prediction of skin friction factor, (b) the ratio of skin friction factors of EGNP to basefluid, and (c) the performance index of the synthesized coolant
versus weight concentrations of EGNP for various Reynolds numbers.
Univers
ity of
Mala
ya

318
CHAPTER 5: CONCLUSIONS AND RECOMMENDATIONS
5.1 Conclusions
Present research work focused on investigation of a facile and economical method
for the scalable synthesis of few-layered graphene sheets by the microwave-assisted
functionalization. Here, single-layered graphene, few-layered graphene, highly-
crumpled, few-layered graphene and highly-crumpled nitrogen-doped graphene with high
surface area were produced by dispersion and liquid-phase exfoliation of functionalized
graphite.
As the first phase of study, for mass-production of single and few-layered
graphene, the treated graphite with PEG was firstly synthesized by covalent
functionalization under microwave irradiation to enhance its dispersibility in polar aprotic
organic solvents. Functionalization was confirmed by necessary characterization of the
samples and statistically obtained about 90% of few-layered graphene containing one and
two layers, about 84% of which were single-layered. The highly-porous, single-layered
structure of graphene provides a special condition for using as additive in basefluids due
to the specific surface area of the sheets. The nanoscopic porous morphology of single-
layered graphene-based nanofluids have an important role in increasing BET surface.
Furthermore, thermal treatment is a successful approach to prepare pure graphene without
functional groups. The obtained results show that this procedure can be applied to prepare
both functionalized sample and the pure graphene and product has been labeled as
thermally-treated graphene (T-GR). Also, BET analysis indicated that the specific surface
area of CE-GR and T-GR were up to 761 and 1559 m2/g, respectively. Another
industrially-scalable, cost-effective, and simple approach was introduced for the first time
to synthesize highly-crumpled, few-layered graphene and highly-crumpled nitrogen-
doped graphene with large specific surface area. Highly-crumpled graphene and highly-
crumpled nitrogen-doped graphene with appropriate specific surface area of 1689 and
Univers
ity of
Mala
ya

319
1568 m2/g were synthesized and used as the additives for preparing highly-conductive
coolants, respectively.
Owing to unique surface chemistry, superior specific surface area and high
functionalization degree, the single-layered graphene, highly-crumpled, few-layered
graphene and highly-crumpled nitrogen-doped graphene demonstrate excellent potential
for using as additive in heat transfer liquids. So, all of the prepared materials with high
degree of hydrophilic-functionalization and extremely high specific surface area have
been introduced as promising candidates for heat transfer applications.
As the second phase of study, after manufacture of graphene sheets as additives,
the colloidal stability of the samples in the presence of different functional groups has
been investigated. The covalently functionalization of carbon-based nanostructures with
highly-branched molecules are more effective than small molecules in terms of colloidal
stability. It means, a functional group with higher hydrophilic branches is, a higher
stability is, implying lower sediment in a specific period of time. The results suggest that
the loss of weight concentration for the distillated water-based SGr nanofluids after 30
days was less than 13%. Thus the suitable colloidal stability of distillated water-based
SGr nanofluids is attributed to the hydrophilic functional PEG which makes the small
particle size of SGr associated with very high SSA as stable suspension in distillated
water. Mostly, the easily-miscible PEG functionalities may explain the higher dispersion
of the SGr in aqueous media. As the second sample, the prepared water-based HCFLG
nanofluids were shown to be stable with less than 2% sedimentation after 30 days, which
is the most stable sample in this study. As other samples, the maximum sediment of 26%,
15% and 25% were obtained for water/ethylene glycol-based CNDG nanofluid, water-
based PEG-treated GNP nanofluid, and water-based Azo-treated GNP, respectively.
Univers
ity of
Mala
ya

320
As the third phase of study, the thermo-physical properties of water-based
HCFLG nanofluids and water-based SGr nanofluids were enhanced significantly, which
make the nanofluids well-suited for heat transfer applications. The maximum
enhancement in the thermal conductivity of water-based HCFLG nanofluids, water-based
SGr nanofluids, water/ethylene glycol-based CNDG nanofluids, water/ethylene glycol-
baed EG-GNP nanofluids and water-based GNP-COOH nanofluids was 42.5%, 26%,
20%, 55% and 27%, respectively. These rates of enhancement are quite impressive even
for some case in low weight concentration of 0.01 wt%. The thermal conductivity
enhancements in the presence of different graphene-based additives have been confirmed
that the high specific surface area of graphene family and the thinning of the thermal
boundary layer can be the main reasons for enhancement of heat transfer rate.
Average drops in the range of 0.1–1% in specific heat capacity were observed
after addition of SGr and HCFLG into the water with the weight concentration of 0.001–
0.01 wt%. Also, the results show that the eff ective viscosity of water-based HCFLG
nanofluids, water-based SGr nanofluids, water/ethylene glycol-based CNDG nanofluids,
water/ethylene glycol-baed EG-GNP nanofluids and water-based GNP-COOH
nanofluids is higher than that of base fluid and increases as the weight concentration
increases. Furthermore, the eff ective viscosity decreases with an increase in the
temperature. Interestingly, the amounts of enhancement in viscosity are insignificant and
negligible, resulting in maintaining the Newtonian behavior of base fluids. The maximum
enhancement in viscosity was almost 10% in the presence of different graphene-based
nanofluids. Also, the density of the water-based HCFLG nanofluids, water-based SGr
nanofluids, and water/ethylene glycol-baed EG-GNP nanofluids at weight concentration
of 0.01% decreases by 1.01 and 0.99%, 0.87 and 0.88%, and 0.01 and 0.1%, when the
temperature increases from 20 to 50 °C, respectively, which are really insignificant.
Univers
ity of
Mala
ya
321
As the forth phase of study, the suitable stability without irreversible particle
aggregation, improved thermal conductivity, low drop in specific heat capacity and
density, and maintaining Newtonian behavior would enable the graphene-based
nanofluids to be used as advanced alternative coolants in different heat transfer equipment
e.g., car radiators, thermosyphon, and heat exchangers. The experimental results showed
that both of the water-based HCFLG and water-based SGr nanofluids at very low
concentrations exhibited noticeably higher heat transfer rate compared to the distillated
water over a duct with a backward-facing step. As compared to the base fluid, the
maximum enhancement in average heat transfer coefficient for transitional and turbulent
flow regimes was 271% and 177% in the presence of water-based SGr nanofluid at 0.01
wt%, respectively. The amount of enhancement was 233.5% and 199% for water-based
HCFLG nanofluids, respectively. Moreover, as the Re number increased from 2000 to
16000, the average ratio of enhancement decreased from 233.5% to only 83.8% at 0.01
wt%; from 132.9% to 42.4% at 0.005 wt%; and from 18.4% to only 5.6% at 0.001 wt%
in the presence of water-based SGr nanofluids.
Also, Nu number and local heat transfer coefficient of water-based nanofluids for
transitional and turbulent flow regimes showed that as the wt% of HCFLG as well as SGr
in the nanofluids and/or Re number increase over backward-facing step, the position of
maximum heat transfer point Xmax/D shifts to the higher distances, leading to larger
recirculation zone. For example, for the same expansion ratio of 2 and Re number of
16000, the experimentally measured values of Xmax/D are, 4.66, 3.99, 3.33 and 3.33 for
water-based HCFLG nanofluids at 0.01, 0.005, 0.001 and 0.00 wt%, respectively. The
position as well as the amount of Xmax/D increased as the Re number increased, showing
that Xmax is dependent on Re and the concentration of additives (thermal conductivity). It
should be mentioned that the average overall performance index of duct including
Univers
ity of
Mala
ya

322
expansion was 1.8 and 1.6 in the presence of water-based SGr nanofluids and water-based
HCFLG nanofluids, respectively.
Also, crumpled nitrogen-doped graphene nanosheet and ethylene glycol-treated
GNP were tested as the new additives for preparing a new engine coolant. The prepared
two-dimensional crumpled nitrogen-doped graphene nanosheet feature high electrical
conductivity, excellent thermal conductivity and heat transfer properties, permitting the
water-ethylene glycol-based CNDG coolants to exhibit excellent Mouromtseff number,
electrical properties and heat transfer performance for all temperatures and weight
concentrations in a car radiator. Also, using ethylene glycol-treated GNP in GNP-WEG,
without acid treatment phase, a new type of coolant with promising thermo-physical
properties was developed for use in the car radiator. The average thermal performance of
car radiator in the presence of water/EG-based ethylene glycol-treated GNP nanofluids
increased by 99.9%, 102.2% and 115.3% for inlet temperature of 35, 45 and 55 °C,
respectively. Other characteristics of the new coolant such as weak increase in the
pressure drop for different concentrations (and inlet temperature, low friction factor, lack
of corrosive agent, appropriate performance index (PI> 1), and slight increase in the
required pumping power (less than 2%) are all highly favorable for introducing new fluid
for wide industrial applications.
In thermosyphon, the experimental data suggests that the thermo-physical
property of covalent nanofluids (GNP-COOH/water) was more significantly enhanced
compared with those of non-covalent nanofluids (GNP-SDBS/water). The measured
overall heat transfer, entropy, thermal efficiency, thermal resistance and pressure drop of
covalent nanofluids showed promising results even at low nanofluid concentrations. The
presented results suggest that the thermal performance of covalent nanofluids is
significantly better than that of non-covalent samples in same experimental conditions.
In summary, the covalent functionalization under microwave radiation is quick and cost-
Univers
ity of
Mala
ya

323
effective with promising enhancement of thermal performance; therefore, it has the
potential to replace the use of surfactant for synthesizing nanofluids and simple
basefluids.
5.2 Recommendations for Future Work
1- Investigation heat transfer performance of heat pipes in the presence of water-
based graphene nanofluids
2- Investigation of miniature thermosyphons in terms of convective heat transfer
rate in the presence of water-based graphene nanofluids
3- Mass production of highly-porous graphene sheets for heat transfer
application
4- Investigation of heat transfer performance of thermosyphons in the presence
of graphene quantum dots as additive
5- Investigation heat transfer performance of heat pipes in the presence of water-
based graphene quantum dots nanofluids
6- Investigation of miniature thermosyphons in terms of convective heat transfer
rate in the presence of water-based graphene quantum dots nanofluids
7- Investigation of colloidal stability of graphene quantum dots in different
solvents such as water, ethylene glycol, DMF, etc.
8- Investigation of thermo-physical properties of different graphene quantum
dots nanofluids.
Univers
ity of
Mala
ya

324
REFERENCES
Abdelkader, A., Cooper, A., Dryfe, R., & Kinloch, I. (2015). How to get between the sheets: a review of recent works on the electrochemical exfoliation of graphene materials from bulk graphite. Nanoscale, 7(16), 6944-6956.
Abu-Mulaweh, H., Armaly, B. F., & Chen, T. (1993). Measurements in buoyancy-assisting laminar boundary layer flow over a vertical backward-facing step—uniform wall heat flux case. Experimental thermal and fluid science, 7(1), 39-48.
Abu-Nada, E. (2006). Entropy generation due to heat and fluid flow in backward facing step flow with various expansion ratios. International Journal of Exergy, 3(4), 419-435.
Abu-Nada, E. (2008). Application of nanofluids for heat transfer enhancement of separated flows encountered in a backward facing step. International Journal of Heat and Fluid Flow, 29(1), 242-249.
Abu-Nada, E., Masoud, Z., & Hijazi, A. (2008). Natural convection heat transfer enhancement in horizontal concentric annuli using nanofluids. International Communications in Heat and Mass Transfer, 35(5), 657-665. doi:http://dx.doi.org/10.1016/j.icheatmasstransfer.2007.11.004
Afshar, H., Shams, M., Nainian, S., & Ahmadi, G. (2009). Microchannel heat transfer and dispersion of nanoparticles in slip flow regime with constant heat flux. International communications in heat and mass transfer, 36(10), 1060-1066.
Akhavan-Zanjani, H., Saffar-Avval, M., Mansourkiaei, M., Ahadi, M., & Sharif, F. (2014). Turbulent convective heat transfer and pressure drop of graphene–water nanofluid flowing inside a horizontal circular tube. Journal of Dispersion Science and Technology, 35(9), 1230-1240.
Al-Hazmi, F. S., Al-Harbi, G. H., Beall, G. W., Al-Ghamdi, A. A., Obaid, A. Y., & Mahmoud, W. E. (2015). One pot synthesis of graphene based on microwave assisted solvothermal technique. Synthetic Metals, 200, 54-57. doi:http://dx.doi.org/10.1016/j.synthmet.2014.12.028
Alzari, V., Nuvoli, D., Sanna, R., Scognamillo, S., Piccinini, M., Kenny, J. M., Mariani, A. (2011). In situ production of high filler content graphene-based polymer nanocomposites by reactive processing. Journal of Materials Chemistry, 21(41), 16544-16549.
A. Amiri, M. M., M. Baniadam, S. Zeinali Heris. (2011). One-pot, efficient functionalization of multi-walled carbon nanotubes withdiamines by microwave method. Applied Surface Science, 257, 10261 - 11026.
An, W., Zhang, J., Zhu, T., & Gao, N. (2016). Investigation on a spectral splitting photovoltaic/thermal hybrid system based on polypyrrole nanofluid: Preliminary test. Renewable Energy, 86, 633-642. doi:http://dx.doi.org/10.1016/j.renene.2015.08.080
Univers
ity of
Mala
ya
325
An, X., Butler, T. W., Washington, M., Nayak, S. K., & Kar, S. (2011). Optical and sensing properties of 1-pyrenecarboxylic acid-functionalized graphene films laminated on polydimethylsiloxane membranes. ACS nano, 5(2), 1003-1011.
An, X., Simmons, T., Shah, R., Wolfe, C., Lewis, K. M., Washington, M., Kar, S. (2010). Stable aqueous dispersions of noncovalently functionalized graphene from graphite and their multifunctional high-performance applications. Nano letters, 10(11), 4295-4301.
Aravind, S. J., Baskar, P., Baby, T. T., Sabareesh, R. K., Das, S., & Ramaprabhu, S. (2011). Investigation of structural stability, dispersion, viscosity, and conductive heat transfer properties of functionalized carbon nanotube based nanofluids. The Journal of Physical Chemistry C, 115(34), 16737-16744.
Aravind, S. J., & Ramaprabhu, S. (2011). Surfactant free graphene nanosheets based nanofluids by in-situ reduction of alkaline graphite oxide suspensions. Journal of Applied Physics, 110(12), 124326.
Aravind, S. S. J., & Ramaprabhu, S. (2013). Graphene-multiwalled carbon nanotube-based nanofluids for improved heat dissipation. RSC Advances, 3(13), 4199-4206. doi:10.1039/C3RA22653K
Armaly, B. F., Li, A., & Nie, J. (2003). Measurements in three-dimensional laminar separated flow. International Journal of Heat and Mass Transfer, 46(19), 3573-3582.
Arnold, E. (1970). UK steam tables in SI units. United Kingdom Committee on the Properties of Steam, London, UK.
Arzani, H. K., Amiri, A., Kazi, S., Chew, B., & Badarudin, A. (2016). Experimental investigation of thermophysical properties and heat transfer rate of covalently functionalized MWCNT in an annular heat exchanger. International communications in heat and mass transfer, 75, 67-77.
Ayan-Varela, M., Paredes, J., Villar-Rodil, S., Rozada, R., Martinez-Alonso, A., & Tascón, J. (2014). A quantitative analysis of the dispersion behavior of reduced graphene oxide in solvents. Carbon, 75, 390-400.
Azizi, M., Hosseini, M., Zafarnak, S., Shanbedi, M., & Amiri, A. (2013). Experimental analysis of thermal performance in a two-phase closed thermosiphon using graphene/water nanofluid. Industrial & Engineering Chemistry Research, 52(29), 10015-10021.
Azmi, W., Hamid, K. A., Mamat, R., Sharma, K., & Mohamad, M. (2016). Effects of working temperature on thermo-physical properties and forced convection heat transfer of TiO 2 nanofluids in water–Ethylene glycol mixture. Applied Thermal Engineering, 106, 1190-1199.
Baby, T. T., & Ramaprabhu, S. (2010). Investigation of thermal and electrical conductivity of graphene based nanofluids. Journal of Applied Physics, 108(12), 124308.
Baby, T. T., & Ramaprabhu, S. (2011a). Enhanced convective heat transfer using graphene dispersed nanofluids. Nanoscale research letters, 6(1), 1.
Univers
ity of
Mala
ya

326
Baby, T. T., & Ramaprabhu, S. (2011b). Synthesis and nanofluid application of silver nanoparticles decorated graphene. Journal of Materials Chemistry, 21(26), 9702-9709.
Baby, T. T., & Sundara, R. (2011). Synthesis and transport properties of metal oxide decorated graphene dispersed nanofluids. The Journal of Physical Chemistry C, 115(17), 8527-8533.
Baby, T. T., & Sundara, R. (2013). Synthesis of silver nanoparticle decorated multiwalled carbon nanotubes-graphene mixture and its heat transfer studies in nanofluid. AIP Advances, 3(1), 012111.
Bai, H., Xu, Y., Zhao, L., Li, C., & Shi, G. (2009). Non-covalent functionalization of graphene sheets by sulfonated polyaniline. Chemical Communications(13), 1667-1669.
Balandin, A. A., Ghosh, S., Bao, W., Calizo, I., Teweldebrhan, D., Miao, F., & Lau, C. N. (2008). Superior thermal conductivity of single-layer graphene. Nano letters, 8(3), 902-907.
Bao, F.-b., & Lin, J.-z. (2011). Continuum simulation of the microscale backward-facing step flow in a transition regime. Numerical Heat Transfer, Part A: Applications, 59(8), 616-632.
Becerril, H. A., Mao, J., Liu, Z., Stoltenberg, R. M., Bao, Z., & Chen, Y. (2008). Evaluation of solution-processed reduced graphene oxide films as transparent conductors. ACS nano, 2(3), 463-470.
Bellos, E., Tzivanidis, C., Antonopoulos, K. A., & Gkinis, G. (2016). Thermal enhancement of solar parabolic trough collectors by using nanofluids and converging-diverging absorber tube. Renewable Energy, 94, 213-222. doi:http://dx.doi.org/10.1016/j.renene.2016.03.062
Berger, C., Song, Z., Li, X., Wu, X., Brown, N., Naud, C., Marchenkov, A. N. (2006). Electronic confinement and coherence in patterned epitaxial graphene. science, 312(5777), 1191-1196.
Bergin, S. D., Nicolosi, V., Streich, P. V., Giordani, S., Sun, Z., Windle, A. H., Carpenter, L. (2008). Towards solutions of single-walled carbon nanotubes in common solvents. ADVANCED MATERIALS-DEERFIELD BEACH THEN WEINHEIM-, 20(10), 1876.
Biswas, G., Breuer, M., & Durst, F. (2004). Backward-facing step flows for various expansion ratios at low and moderate Reynolds numbers. Journal of fluids engineering, 126(3), 362-374.
Blake, P., Brimicombe, P. D., Nair, R. R., Booth, T. J., Jiang, D., Schedin, F., Hill, E. W. (2008). Graphene-based liquid crystal device. Nano letters, 8(6), 1704-1708.
Bojić, M., & Lukić, N. (2002). Controlling evaporative three finger thermosyphon. Energy Conversion and Management, 43(5), 709-720.
Univers
ity of
Mala
ya

327
Botelho, E. C., Edwards, E. R., Bittmann, B., & Burkhart, T. (2011). Dispersing carbon nanotubes in phenolic resin using an aqueous solution. Journal of the Brazilian Chemical Society, 22(11), 2040-2047.
Bourlinos, A. B., Georgakilas, V., Zboril, R., Steriotis, T. A., & Stubos, A. K. (2009). Liquid‐Phase Exfoliation of Graphite Towards Solubilized Graphenes. Small, 5(16), 1841-1845.
Bourlinos, A. B., Georgakilas, V., Zboril, R., Steriotis, T. A., Stubos, A. K., & Trapalis, C. (2009). Aqueous-phase exfoliation of graphite in the presence of polyvinylpyrrolidone for the production of water-soluble graphenes. Solid State Communications, 149(47), 2172-2176.
Bracamonte, M. V., Lacconi, G. I., Urreta, S. E., & Foa Torres, L. (2014). On the nature of defects in liquid-phase exfoliated graphene. The Journal of Physical Chemistry C, 118(28), 15455-15459.
Buschmann, M. H., & Franzke, U. (2014). Improvement of thermosyphon performance by employing nanofluid. International Journal of Refrigeration, 40, 416-428.
Cai, M., Thorpe, D., Adamson, D. H., & Schniepp, H. C. (2012). Methods of graphite exfoliation. Journal of Materials Chemistry, 22(48), 24992-25002.
Cai, W., Piner, R. D., Stadermann, F. J., Park, S., Shaibat, M. A., Ishii, Y., Stoller, M. (2008). Synthesis and solid-state NMR structural characterization of 13C-labeled graphite oxide. science, 321(5897), 1815-1817.
Can, W., Liang, Z., Qiao, W.-m., & Ling, L.-c. (2011). Preparation of graphene nanosheets through detonation. New Carbon Materials, 26(1), 21-25.
Cappella, B., & Dietler, G. (1999). Force-distance curves by atomic force microscopy. Surface Science Reports, 34(1–3), 1-104. doi:http://dx.doi.org/10.1016/S0167-5729(99)00003-5
Chandrasekaran, P., Cheralathan, M., Kumaresan, V., & Velraj, R. (2014). Enhanced heat transfer characteristics of water based copper oxide nanofluid PCM (phase change material) in a spherical capsule during solidification for energy efficient cool thermal storage system. Energy, 72(0), 636-642. doi:http://dx.doi.org/10.1016/j.energy.2014.05.089
Chang, Y.-I., Chang, C.-C., & Cheng, W.-Y. (2011). Can nanoparticles stabilize microparticle suspension? Separation and Purification Technology, 79(3), 393-398.
Chehade, A., Louahlia-Gualous, H., Le Masson, S., Victor, I., & Abouzahab-Damaj, N. (2014). Experimental investigation of thermosyphon loop thermal performance. Energy Conversion and Management, 84, 671-680.
Chen, C., Zhai, W., Lu, D., Zhang, H., & Zheng, W. (2011). A facile method to prepare stable noncovalent functionalized graphene solution by using thionine. Materials Research Bulletin, 46(4), 583-587.
Univers
ity of
Mala
ya

328
Cheng, J.-C., & Tsay, Y.-L. (2006). Effects of solid and slotted baffles on the convection characteristics of backward-facing step flow in a channel. Heat and Mass Transfer, 42(9), 843-852.
Chien, C., Kung, C., Chang, C., Lee, W., Jwo, C., & Chen, S. (2011). Theoretical and experimental investigations of a two-phase thermosyphon solar water heater. Energy, 36(1), 415-423.
Choi, E.-Y., Han, T. H., Hong, J., Kim, J. E., Lee, S. H., Kim, H. W., & Kim, S. O. (2010). Noncovalent functionalization of graphene with end-functional polymers. Journal of Materials Chemistry, 20(10), 1907-1912.
Choi, E.-Y., San Choi, W., Lee, Y. B., & Noh, Y.-Y. (2011). Production of graphene by exfoliation of graphite in a volatile organic solvent. Nanotechnology, 22(36), 365601.
Choi, J., Kim, K.-j., Kim, B., Lee, H., & Kim, S. (2009). Covalent functionalization of epitaxial graphene by azidotrimethylsilane. The Journal of Physical Chemistry C, 113(22), 9433-9435.
Choi, S., Zhang, Z., Yu, W., Lockwood, F., & Grulke, E. (2001). Anomalous thermal conductivity enhancement in nanotube suspensions. Applied Physics Letters, 79(14), 2252-2254.
Choi, S. Y., Mamak, M., Cordola, E., & Stadler, U. (2011). Large scale production of high aspect ratio graphite nanoplatelets with tunable oxygen functionality. Journal of Materials Chemistry, 21(13), 5142-5147.
Chol, S. (1995). Enhancing thermal conductivity of fluids with nanoparticles. ASME-Publications-Fed, 231, 99-106.
Chon, C., & Kihm, K. (2005). Thermal conductivity enhancement of nanofluids by Brownian motion. Journal of Heat Transfer, 127(8), 810-810.
Cingarapu, S., Singh, D., Timofeeva, E. V., & Moravek, M. R. (2014). Nanofluids with encapsulated tin nanoparticles for advanced heat transfer and thermal energy storage. International Journal of Energy Research, 38(1), 51-59. doi:10.1002/er.3041
Dabiri, M., Kasmaei, M., Salari, P., & Movahed, S. K. (2016). Copper nanoparticle decorated three dimensional graphene with high catalytic activity for Huisgen 1, 3-dipolar cycloaddition. Rsc Advances, 6, 57019-57023. doi: 10.1039/C5RA25317A
Dalir, N., Dehsara, M., & Nourazar, S. S. (2015). Entropy analysis for magnetohydrodynamic flow and heat transfer of a Jeffrey nanofluid over a stretching sheet. Energy, 79(0), 351-362. doi:http://dx.doi.org/10.1016/j.energy.2014.11.021
Das, B., Voggu, R., Rout, C. S., & Rao, C. N. R. (2008). Changes in the electronic structure and properties of graphene induced by molecular charge-transfer. Chemical Communications(41), 5155-5157. doi:10.1039/B808955H
Das, A., Pisana, S., Chakraborty, B., Piscanec, S., Saha, S. K., Waghmare, U. V., Sood, A. K. (2008). Monitoring dopants by Raman scattering in an
Univers
ity of
Mala
ya
329
electrochemically top-gated graphene transistor. Nat Nano, 3(4), 210-215. doi:http://www.nature.com/nnano/journal/v3/n4/suppinfo/nnano.2008.67_S1.html
De Carli, M., Fiorenzato, S., & Zarrella, A. (2015). Performance of heat pumps with direct expansion in vertical ground heat exchangers in heating mode. Energy Conversion and Management, 95(0), 120-130. doi:http://dx.doi.org/10.1016/j.enconman.2015.01.080
De, S., King, P. J., Lotya, M., O'Neill, A., Doherty, E. M., Hernandez, Y., Coleman, J. N. (2010). Flexible, Transparent, Conducting Films of Randomly Stacked Graphene from Surfactant‐Stabilized, Oxide‐Free Graphene Dispersions. Small, 6(3), 458-464.
Delfani, S., Karami, M., & Behabadi, M. A. A. (2016). Performance characteristics of a residential-type direct absorption solar collector using MWCNT nanofluid. Renewable Energy, 87, Part 1, 754-764. doi:http://dx.doi.org/10.1016/j.renene.2015.11.004
Dhakate, S., Chauhan, N., Sharma, S., Tawale, J., Singh, S., Sahare, P., & Mathur, R. (2011). An approach to produce single and double layer graphene from re-exfoliation of expanded graphite. Carbon, 49(6), 1946-1954.
Dhar, P., Gupta, S. S., Chakraborty, S., Pattamatta, A., & Das, S. K. (2013). The role of percolation and sheet dynamics during heat conduction in poly-dispersed graphene nanofluids. Applied Physics Letters, 102(16), 163114.
Dikin, D. A., Stankovich, S., Zimney, E. J., Piner, R. D., Dommett, G. H., Evmenenko, G., Ruoff, R. S. (2007). Preparation and characterization of graphene oxide paper. Nature, 448(7152), 457-460.
Dimiev, A., Kosynkin, D. V., Sinitskii, A., Slesarev, A., Sun, Z., & Tour, J. M. (2011). Layer-by-layer removal of graphene for device patterning. Science, 331(6021), 1168-1172.
Ding, Y., Alias, H., Wen, D., & Williams, R. A. (2006a). Heat transfer of aqueous suspensions of carbon nanotubes (CNT nanofluids). International Journal of Heat and Mass Transfer, 49(1), 240-250.
Ding, Y., Alias, H., Wen, D., & Williams, R. A. (2006b). Heat transfer of aqueous suspensions of carbon nanotubes (CNT nanofluids). International Journal of Heat and Mass Transfer, 49(1–2), 240-250. doi:http://dx.doi.org/10.1016/j.ijheatmasstransfer.2005.07.009
Ding, Y., & Wen, D. (2005). Particle migration in a flow of nanoparticle suspensions. Powder Technology, 149(2), 84-92.
Dittus, F. W., & Boelter, L. M. K. (1985). Heat transfer in automobile radiators of the tubular type. International Communications in Heat and Mass Transfer, 12(1), 3-22. doi:http://dx.doi.org/10.1016/0735-1933(85)90003-X
Dong, J., Zeng, B., Lan, Y., Tian, S., Shan, Y., Liu, X., Ren, Z. (2010). Field emission from few-layer graphene nanosheets produced by liquid phase exfoliation of graphite. Journal of nanoscience and nanotechnology, 10(8), 5051-5055.
Univers
ity of
Mala
ya

330
Dong, X., Shi, Y., Zhao, Y., Chen, D., Ye, J., Yao, Y., Shen, Z. (2009). Symmetry breaking of graphene monolayers by molecular decoration. Physical review letters, 102(13), 135501.
Dreyer, D. R., Park, S., Bielawski, C. W., & Ruoff, R. S. (2010). The chemistry of graphene oxide. Chemical Society Reviews, 39(1), 228-240.
Du, Q., Zheng, M., Zhang, L., Wang, Y., Chen, J., Xue, L., Cao, J. (2010). Preparation of functionalized graphene sheets by a low-temperature thermal exfoliation approach and their electrochemical supercapacitive behaviors. Electrochimica Acta, 55(12), 3897-3903.
Du, W., Jiang, X., & Zhu, L. (2013). From graphite to graphene: direct liquid-phase exfoliation of graphite to produce single-and few-layered pristine graphene. Journal of Materials Chemistry A, 1(36), 10592-10606.
Duan, W. H., Wang, Q., & Collins, F. (2011). Dispersion of carbon nanotubes with SDS surfactants: a study from a binding energy perspective. Chemical Science, 2(7), 1407-1413.
Eapen, J., Li, J., & Yip, S. (2007). Beyond the Maxwell limit: thermal conduction in nanofluids with percolating fluid structures. Physical Review E, 76(6), 062501.
Eastman, J. A., Phillpot, S., Choi, S., & Keblinski, P. (2004). Thermal transport in nanofluids 1. Annu. Rev. Mater. Res., 34, 219-246.
Eaton, J., & Johnston, J. (1981). A review of research on subsonic turbulent flow reattachment. AIAA journal, 19(9), 1093-1100.
Edwards, R. S., & Coleman, K. S. (2013). Graphene synthesis: relationship to applications. Nanoscale, 5(1), 38-51.
Englert, J. M., Röhrl, J., Schmidt, C. D., Graupner, R., Hundhausen, M., Hauke, F., & Hirsch, A. (2009). Soluble Graphene: Generation of Aqueous Graphene Solutions Aided by a Perylenebisimide‐Based Bolaamphiphile. Advanced Materials, 21(42), 4265-4269.
Evans, W., Fish, J., & Keblinski, P. (2006). Role of Brownian motion hydrodynamics on nanofluid thermal conductivity. Applied Physics Letters, 88(9), 093116.
Faghri, A. (1995). Heat pipe science and technology: Global Digital Press.
Fang, M., Long, J., Zhao, W., Wang, L., & Chen, G. (2010). pH-responsive chitosan-mediated graphene dispersions. Langmuir, 26(22), 16771-16774.
Fang, M., Wang, K., Lu, H., Yang, Y., & Nutt, S. (2009). Covalent polymer functionalization of graphene nanosheets and mechanical properties of composites. Journal of Materials Chemistry, 19(38), 7098-7105.
Feng, L., Yang, L., Huang, Z., Luo, J., Li, M., Wang, D., & Chen, Y. (2013). Enhancing electrocatalytic oxygen reduction on nitrogen-doped graphene by active sites implantation. Scientific reports, 3, 3306.
Univers
ity of
Mala
ya

331
Feng, Y., Liu, H., Luo, W., Liu, E., Zhao, N., Yoshino, K., & Feng, W. (2013). Covalent functionalization of graphene by azobenzene with molecular hydrogen bonds for long-term solar thermal storage. Scientific reports, 3, 3260.
Ferrari, A., Meyer, J., Scardaci, V., Casiraghi, C., Lazzeri, M., Mauri, F., Roth, S. (2006). Raman spectrum of graphene and graphene layers. Physical review letters, 97(18), 187401.
Filonenko, G. K. (1954). Hydraulic Resistance in Pipes (in Russian). Teploenergetika, 1(4), 40-44.
Fischer, A., Antonietti, M., & Thomas, A. (2007). Growth confined by the nitrogen source: synthesis of pure metal nitride nanoparticles in mesoporous graphitic carbon nitride. Advanced Materials, 19(2), 264-267.
Fischer, A., Mul er, J. O., Antonietti, M., & Thomas, A. (2008). Synthesis of ternary metal nitride nanoparticles using mesoporous carbon nitride as reactive template. ACS nano, 2(12), 2489-2496.
Fu, Y., Zhang, J., Liu, H., Hiscox, W. C., & Gu, Y. (2013). Ionic liquid-assisted exfoliation of graphite oxide for simultaneous reduction and functionalization to graphenes with improved properties. Journal of Materials Chemistry A, 1(7), 2663-2674.
Garg, P., Alvarado, J. L., Marsh, C., Carlson, T. A., Kessler, D. A., & Annamalai, K. (2009). An experimental study on the effect of ultrasonication on viscosity and heat transfer performance of multi-wall carbon nanotube-based aqueous nanofluids. International Journal of Heat and Mass Transfer, 52(21), 5090-5101.
Geim, A. K., & Novoselov, K. S. (2007). The rise of graphene. Nature materials, 6(3), 183-191.
Geng, J., & Jung, H.-T. (2010). Porphyrin functionalized graphene sheets in aqueous suspensions: from the preparation of graphene sheets to highly conductive graphene films. The Journal of Physical Chemistry C, 114(18), 8227-8234.
Geng, J., Kong, B.-S., Yang, S. B., & Jung, H.-T. (2010). Preparation of graphene relying on porphyrin exfoliation of graphite. Chemical Communications, 46(28), 5091-5093.
Georgakilas, V., Bourlinos, A., Gournis, D., Tsoufis, T., Trapalis, C., Mateo-Alonso, A., & Prato, M. (2008). Multipurpose organically modified carbon nanotubes: from functionalization to nanotube composites. Journal of the American Chemical Society, 130(27), 8733-8740.
Georgakilas, V., Bourlinos, A. B., Zboril, R., Steriotis, T. A., Dallas, P., Stubos, A. K., & Trapalis, C. (2010). Organic functionalisation of graphenes. Chemical Communications, 46(10), 1766-1768.
Georgakilas, V., Otyepka, M., Bourlinos, A. B., Chandra, V., Kim, N., Kemp, K. C., Kim, K. S. (2012). Functionalization of graphene: covalent and non-covalent approaches, derivatives and applications. Chemical Reviews, 112(11), 6156-6214.
Univers
ity of
Mala
ya

332
Gerardi, C., Cory, D., Buongiorno, J., Hu, L. W., & McKrell, T. (2009). Nuclear magnetic resonance-based study of ordered layering on the surface of alumina nanoparticles in water. Applied Physics Letters, 95(25), 253104.
Gharehkhani, S., Seyed Shirazi, S. F., Pilban Jahromi, S., Sookhakian, M., Baradaran, S., Yarmand, H., Basirun, W. J. (2015). Spongy nitrogen-doped activated carbonaceous hybrid derived from biomass material/graphene oxide for supercapacitor electrodes. RSC Advances, 5(51), 40505-40513. doi:10.1039/C5RA01525A
Ghiadi, B., Baniadam, M., Maghrebi, M., & Amiri, A. (2013). Rapid, one-pot synthesis of highly-soluble carbon nanotubes functionalized by L-arginine. Russian Journal of Physical Chemistry A, 87(4), 649-653.
Ghosh, A., Rao, K. V., George, S. J., & Rao, C. (2010). Noncovalent functionalization, exfoliation, and solubilization of graphene in water by employing a fluorescent coronene carboxylate. Chemistry–A European Journal, 16(9), 2700-2704.
Ghozatloo, A., Rashidi, A., & Shariaty-Niassar, M. (2014). Convective heat transfer enhancement of graphene nanofluids in shell and tube heat exchanger. Experimental Thermal and Fluid Science, 53, 136-141.
Ghozatloo, A., Shariaty-Niasar, M., & Rashidi, A. (2014). Investigation of Heat Transfer Coefficient of Ethylene Glycol/Graphenenanofluid in Turbulent Flow Regime. International Journal of Nanoscience and Nanotechnology, 10(4), 237-244.
Ghozatloo, A., Shariaty-Niasar, M., & Rashidi, A. M. (2013). Preparation of nanofluids from functionalized graphene by new alkaline method and study on the thermal conductivity and stability. International Communications in Heat and Mass Transfer, 42, 89-94.
Godson, L., Raja, B., Lal, D. M., & Wongwises, S. (2010). Experimental investigation on the thermal conductivity and viscosity of silver-deionized water nanofluid. Experimental Heat Transfer, 23(4), 317-332.
Green, A. A., & Hersam, M. C. (2009). Solution phase production of graphene with controlled thickness via density differentiation. Nano letters, 9(12), 4031-4036.
Gu, W., Zhang, W., Li, X., Zhu, H., Wei, J., Li, Z., Shen, W. (2009). Graphene sheets from worm-like exfoliated graphite. Journal of Materials Chemistry, 19(21), 3367-3369.
Guardia, L., Fernández-Merino, M., Paredes, J., Solis-Fernandez, P., Villar-Rodil, S., Martinez-Alonso, A., & Tascón, J. (2011). High-throughput production of pristine graphene in an aqueous dispersion assisted by non-ionic surfactants. Carbon, 49(5), 1653-1662.
Gunasekaran, S., & Dharmendirakumar, M. (2014). Carboxyl-tailed ionic liquid promoted aqueous dispersion of multi-walled carbon nanotubes. High Performance Polymers, 26(3), 274-282.
Guo, Y., Deng, L., Li, J., Guo, S., Wang, E., & Dong, S. (2011). Hemin− graphene hybrid nanosheets with intrinsic peroxidase-like activity for label-free colorimetric detection of single-nucleotide polymorphism. ACS nano, 5(2), 1282-1290.
Univers
ity of
Mala
ya

333
Gupta, S. S., Siva, V. M., Krishnan, S., Sreeprasad, T., Singh, P. K., Pradeep, T., & Das, S. K. (2011). Thermal conductivity enhancement of nanofluids containing graphene nanosheets. Journal of Applied Physics, 110(8), 084302.
Hadadian, M., Goharshadi, E. K., & Youssefi, A. (2014). Electrical conductivity, thermal conductivity, and rheological properties of graphene oxide-based nanofluids. Journal of Nanoparticle Research, 16(12), 1-17. doi:10.1007/s11051-014-2788-1
Hajjar, Z., morad Rashidi, A., & Ghozatloo, A. (2014). Enhanced thermal conductivities of graphene oxide nanofluids. International Communications in Heat and Mass Transfer, 57, 128-131.
Halelfadl, S., Maré, T., & Estellé, P. (2014). Efficiency of carbon nanotubes water based nanofluids as coolants. Experimental Thermal and Fluid Science, 53, 104-110.
Hamilton, C. E., Lomeda, J. R., Sun, Z., Tour, J. M., & Barron, A. R. (2009). High-yield organic dispersions of unfunctionalized graphene. Nano letters, 9(10), 3460-3462.
Hao, R., Qian, W., Zhang, L., & Hou, Y. (2008). Aqueous dispersions of TCNQ-anion-stabilized graphene sheets. Chemical Communications(48), 6576-6578. doi:10.1039/B816971C
Haque, A. M., Kwon, S., Kim, J., Noh, J., Huh, S., Chung, H., & Jeong, H. (2015). An experimental study on thermal characteristics of nanofluid with graphene and multi-wall carbon nanotubes. Journal of Central South University, 22(8), 3202-3210.
Hasan, S. A., Tsekoura, E. K., Sternhagen, V., & Strømme, M. (2012). Evolution of the composition and suspension performance of nitrogen-doped graphene. The Journal of Physical Chemistry C, 116(11), 6530-6536.
Hasan, T., Scardaci, V., Tan, P., Rozhin, A. G., Milne, W. I., & Ferrari, A. C. (2007). Stabilization and “debundling” of single-wall carbon nanotube dispersions in N-methyl-2-pyrrolidone (NMP) by polyvinylpyrrolidone (PVP). The Journal of Physical Chemistry C, 111(34), 12594-12602.
Hasan, T., Torrisi, F., Sun, Z., Popa, D., Nicolosi, V., Privitera, G., Ferrari, A. (2010). Solution‐phase exfoliation of graphite for ultrafast photonics. physica status solidi (b), 247(11‐12), 2953-2957.
Hatami, M., Ganji, D. D., & Gorji-Bandpy, M. (2015). Experimental and numerical analysis of the optimized finned-tube heat exchanger for OM314 diesel exhaust exergy recovery. Energy Conversion and Management, 97(0), 26-41. doi:http://dx.doi.org/10.1016/j.enconman.2015.03.032
He, H., & Gao, C. (2010). General approach to individually dispersed, highly soluble, and conductive graphene nanosheets functionalized by nitrene chemistry. Chemistry of Materials, 22(17), 5054-5064.
He, H., Klinowski, J., Forster, M., & Lerf, A. (1998). A new structural model for graphite oxide. Chemical Physics Letters, 287(1), 53-56.
Univers
ity of
Mala
ya

334
Heris, S. Z., Etemad, S. G., & Esfahany, M. N. (2006). Experimental investigation of oxide nanofluids laminar flow convective heat transfer. International communications in heat and mass transfer, 33(4), 529-535.
Heris, S. Z., Shokrgozar, M., Poorpharhang, S., Shanbedi, M., & Noie, S. H. (2013). Experimental Study of Heat Transfer of a Car Radiator with CuO/Ethylene Glycol-Water as a Coolant. Journal of Dispersion Science and Technology, 35(5), 677-684. doi:10.1080/01932691.2013.805301
Hernandez, Y., Nicolosi, V., Lotya, M., Blighe, F. M., Sun, Z., De, S., Gun'Ko, Y. K. (2008). High-yield production of graphene by liquid-phase exfoliation of graphite. Nature nanotechnology, 3(9), 563-568.
Heshmati, A., Mohammed, H., & Darus, A. (2014). Mixed convection heat transfer of nanofluids over backward facing step having a slotted baffle. Applied Mathematics and Computation, 240, 368-386.
Hossain, M. Z., Walsh, M. A., & Hersam, M. C. (2010). Scanning tunneling microscopy, spectroscopy, and nanolithography of epitaxial graphene chemically modified with aryl moieties. Journal of the American Chemical Society, 132(43), 15399-15403.
Hsieh, T.-Y., Hong, Z.-C., & Pan, Y.-C. (2010). Flow characteristics of three-dimensional microscale backward-facing step flows. Numerical Heat Transfer, Part A: Applications, 57(5), 331-345.
Hu, C., Yu, C., Li, M., Wang, X., Dong, Q., Wang, G., & Qiu, J. (2015). Nitrogen-doped carbon dots decorated on graphene: a novel all-carbon hybrid electrocatalyst for enhanced oxygen reduction reaction. Chemical Communications, 51(16), 3419-3422. doi:10.1039/C4CC08735F
Hu, H., Zhao, Z., Zhou, Q., Gogotsi, Y., & Qiu, J. (2012). The role of microwave absorption on formation of graphene from graphite oxide. Carbon, 50(9), 3267-3273.
Huang, X., Yin, Z., Wu, S., Qi, X., He, Q., Zhang, Q., Zhang, H. (2011). Graphene‐based materials: synthesis, characterization, properties, and applications. Small, 7(14), 1876-1902.
Hussein, A. M., Sharma, K., Bakar, R., & Kadirgama, K. (2013). The effect of nanofluid volume concentration on heat transfer and friction factor inside a horizontal tube. Journal of Nanomaterials, 2013, 1.
Huxtable, S. T., Cahill, D. G., Shenogin, S., Xue, L., Ozisik, R., Barone, P., Shim, M. (2003). Interfacial heat flow in carbon nanotube suspensions. Nature Materials, 2(11), 731-734.
Imke, U. (2004). Porous media simplified simulation of single- and two-phase flow heat transfer in micro-channel heat exchangers. Chemical Engineering Journal, 101(1–3), 295-302. doi:http://dx.doi.org/10.1016/j.cej.2003.10.012
Islam, M., Rojas, E., Bergey, D., Johnson, A., & Yodh, A. (2003). High weight fraction surfactant solubilization of single-wall carbon nanotubes in water. Nano letters, 3(2), 269-273.
Univers
ity of
Mala
ya

335
Israelachvili, J. N. (2011). Intermolecular and surface forces: revised third edition: Academic press.
Jaegfeldt, H., Kuwana, T., & Johansson, G. (1983). Electrochemical stability of catechols with a pyrene side chain strongly adsorbed on graphite electrodes for catalytic oxidation of dihydronicotinamide adenine dinucleotide. Journal of the American Chemical Society, 105(7), 1805-1814.
Jaisankar, S., Radhakrishnan, T., & Sheeba, K. (2011). Experimental studies on heat transfer and thermal performance characteristics of thermosyphon solar water heating system with helical and left–right twisted tapes. Energy Conversion and Management, 52(5), 2048-2055.
Jang, J.-H., Rangappa, D., Kwon, Y.-U., & Honma, I. (2011). Direct preparation of 1-PSA modified graphene nanosheets by supercritical fluidic exfoliation and its electrochemical properties. Journal of Materials Chemistry, 21(10), 3462-3466.
Janowska, I., Chizari, K., Ersen, O., Zafeiratos, S., Soubane, D., Da Costa, V., Bégin, D. (2010). Microwave synthesis of large few-layer graphene sheets in aqueous solution of ammonia. Nano Research, 3(2), 126-137.
Jeong, H. M., Lee, J. W., Shin, W. H., Choi, Y. J., Shin, H. J., Kang, J. K., & Choi, J. W. (2011). Nitrogen-doped graphene for high-performance ultracapacitors and the importance of nitrogen-doped sites at basal planes. Nano letters, 11(6), 2472-2477.
Jha, N., & Ramaprabhu, S. (2008). Synthesis and Thermal Conductivity of Copper Nanoparticle Decorated Multiwalled Carbon Nanotubes Based Nanofluids. The Journal of Physical Chemistry C, 112(25), 9315-9319. doi:10.1021/jp8017309
Jin, M., Jeong, H.-K., Kim, T. H., So, K. P., Cui, Y., Yu, W. J., Lee, Y. H. (2010). Synthesis and systematic characterization of functionalized graphene sheets generated by thermal exfoliation at low temperature. Journal of Physics D: Applied Physics, 43(27), 275402.
Jin, Z., Lomeda, J. R., Price, B. K., Lu, W., Zhu, Y., & Tour, J. M. (2009). Mechanically assisted exfoliation and functionalization of thermally converted graphene sheets. Chemistry of Materials, 21(14), 3045-3047.
Jo, K., Lee, T., Choi, H. J., Park, J. H., Lee, D. J., Lee, D. W., & Kim, B.-S. (2011). Stable aqueous dispersion of reduced graphene nanosheets via non-covalent functionalization with conducting polymers and application in transparent electrodes. Langmuir, 27(5), 2014-2018.
Johnson, D. W., Dobson, B. P., & Coleman, K. S. (2015). A manufacturing perspective on graphene dispersions. Current Opinion in Colloid & Interface Science, 20(5–6), 367-382. doi:http://dx.doi.org/10.1016/j.cocis.2015.11.004
Jouhara, H., & Merchant, H. (2012). Experimental investigation of a thermosyphon based heat exchanger used in energy efficient air handling units. Energy, 39(1), 82-89.
Kalinina, I., Worsley, K., Lugo, C., Mandal, S., Bekyarova, E., & Haddon, R. C. (2011a). Synthesis, dispersion, and viscosity of poly (ethylene glycol)-functionalized
Univers
ity of
Mala
ya

336
water-soluble single-walled carbon nanotubes. Chemistry of Materials, 23(5), 1246-1253.
Kalinina, I., Worsley, K., Lugo, C., Mandal, S., Bekyarova, E., & Haddon, R. C. (2011b). Synthesis, Dispersion, and Viscosity of Poly(ethylene glycol)-Functionalized Water-Soluble Single-Walled Carbon Nanotubes. Chemistry of Materials, 23(5), 1246-1253. doi:10.1021/cm103030s
Kaloudis, E., Papanicolaou, E., & Belessiotis, V. (2016). Numerical simulations of a parabolic trough solar collector with nanofluid using a two-phase model. Renewable Energy, 97, 218-229. doi:http://dx.doi.org/10.1016/j.renene.2016.05.046
Kamiya, H., Gotoh, K., Shimada, M., Uchikoshi, T., Otani, Y., Fuji, M., Higashitani, K. (2012). Characteristics and behavior of nanoparticles and its dispersion systems. Nanoparticle Technology Handbook, 5, 115-119.
Kang, H. U., Kim, S. H., & Oh, J. M. (2006). Estimation of thermal conductivity of nanofluid using experimental effective particle volume. Experimental Heat Transfer, 19(3), 181-191.
Kaniyoor, A., Baby, T. T., & Ramaprabhu, S. (2010). Graphene synthesis via hydrogen induced low temperature exfoliation of graphite oxide. Journal of Materials Chemistry, 20(39), 8467-8469.
Keblinski, P., Phillpot, S., Choi, S., & Eastman, J. (2002). Mechanisms of heat flow in suspensions of nano-sized particles (nanofluids). International Journal of Heat and Mass Transfer, 45(4), 855-863.
Khaled, A.-R., & Vafai, K. (2005). Heat transfer enhancement through control of thermal dispersion effects. International Journal of Heat and Mass Transfer, 48(11), 2172-2185.
Khalkhali, H., Faghri, A., & Zuo, Z. (1999). Entropy generation in a heat pipe system. Applied Thermal Engineering, 19(10), 1027-1043.
Khan, U., May, P., O’Neill, A., & Coleman, J. N. (2010). Development of stiff, strong, yet tough composites by the addition of solvent exfoliated graphene to polyurethane. Carbon, 48(14), 4035-4041.
Khan, U., O'Neill, A., Lotya, M., De, S., & Coleman, J. N. (2010). High‐Concentration Solvent Exfoliation of Graphene. Small, 6(7), 864-871.
Khan, U., Porwal, H., O’Neill, A., Nawaz, K., May, P., & Coleman, J. N. (2011). Solvent-exfoliated graphene at extremely high concentration. Langmuir, 27(15), 9077-9082.
Khanra, P., Kuila, T., Bae, S. H., Kim, N. H., & Lee, J. H. (2012). Electrochemically exfoliated graphene using 9-anthracene carboxylic acid for supercapacitor application. Journal of Materials Chemistry, 22(46), 24403-24410.
Khare, B., Wilhite, P., Tran, B., Teixeira, E., Fresquez, K., Mvondo, D. N., Meyyappan, M. (2005). Functionalization of carbon nanotubes via nitrogen glow discharge. The Journal of Physical Chemistry B, 109(49), 23466-23472.
Univers
ity of
Mala
ya

337
Kherbeet, A. S., Mohammed, H., Munisamy, K. M., & Salman, B. (2014). Combined convection nanofluid flow and heat transfer over microscale forward-facing step. International Journal of Nanoparticles, 7(1), 1-25.
Kherbeet, A. S., Mohammed, H., Salman, B., Ahmed, H. E., & Alawi, O. A. (2014). Experimental and numerical study of nanofluid flow and heat transfer over microscale backward-facing step. International Journal of Heat and Mass Transfer, 79, 858-867.
Kherbeet, A. S., Mohammed, H., Salman, B., Ahmed, H. E., Alawi, O. A., & Rashidi, M. (2015). Experimental study of nanofluid flow and heat transfer over microscale backward-and forward-facing steps. Experimental Thermal and Fluid Science, 65, 13-21.
Kherbeet, A. S., Mohammed, H. A., & Salman, B. (2012). The effect of nanofluids flow on mixed convection heat transfer over microscale backward-facing step. International Journal of Heat and Mass Transfer, 55(21), 5870-5881.
Kim, S., Kim, H. D., Kim, H., Ahn, H. S., Jo, H., Kim, J., & Kim, M. H. (2010). Effects of nano-fluid and surfaces with nano structure on the increase of CHF. Experimental thermal and fluid science, 34(4), 487-495.
Kline, S. J., and F. A. McClintock. ( January 1953). Describing Uncertainties in Single-Sample Experiments. Mechanical Engineering 75(1), 3-8.
Kline, S. J., & McClintock, F. (1953). Describing uncertainties in single-sample experiments. Mechanical engineering, 75(1), 3-8.
Ko, G. H., Heo, K., Lee, K., Kim, D. S., Kim, C., Sohn, Y., & Choi, M. (2007). An experimental study on the pressure drop of nanofluids containing carbon nanotubes in a horizontal tube. International Journal of Heat and Mass Transfer, 50(23), 4749-4753.
Kodali, V. K., Scrimgeour, J., Kim, S., Hankinson, J. H., Carroll, K. M., De Heer, W. A., Curtis, J. E. (2010). Nonperturbative chemical modification of graphene for protein micropatterning. Langmuir, 27(3), 863-865.
Kole, M., & Dey, T. (2013). Investigation of thermal conductivity, viscosity, and electrical conductivity of graphene based nanofluids. Journal of Applied Physics, 113(8), 084307.
Koo, J., & Kleinstreuer, C. (2005). Impact analysis of nanoparticle motion mechanisms on the thermal conductivity of nanofluids. International Communications in Heat and Mass Transfer, 32(9), 1111-1118.
Kostarelos, K., Lacerda, L., Pastorin, G., Wu, W., Wieckowski, S., Luangsivilay, J., Muller, S. (2007). Cellular uptake of functionalized carbon nanotubes is independent of functional group and cell type. Nature Nanotechnology, 2(2), 108-113.
Kosynkin, D. V., Higginbotham, A. L., Sinitskii, A., Lomeda, J. R., Dimiev, A., Price, B. K., & Tour, J. M. (2009). Longitudinal unzipping of carbon nanotubes to form graphene nanoribbons. Nature, 458(7240), 872-876.
Univers
ity of
Mala
ya
338
Kovtyukhova, N. I., Wang, Y., Berkdemir, A., Cruz-Silva, R., Terrones, M., Crespi, V. H., & Mallouk, T. E. (2014). Non-oxidative intercalation and exfoliation of graphite by Brønsted acids. Nature chemistry, 6, 957–963.
Kudin, K. N., Ozbas, B., Schniepp, H. C., Prud'Homme, R. K., Aksay, I. A., & Car, R. (2008). Raman spectra of graphite oxide and functionalized graphene sheets. Nano letters, 8(1), 36-41.
Kuila, T., Khanra, P., Kim, N. H., Choi, S. K., Yun, H. J., & Lee, J. H. (2013). One-step electrochemical synthesis of 6-amino-4-hydroxy-2-napthalene-sulfonic acid functionalized graphene for green energy storage electrode materials. Nanotechnology, 24(36), 365706.
Kulkarni, D. P., Vajjha, R. S., Das, D. K., & Oliva, D. (2008). Application of aluminum oxide nanofluids in diesel electric generator as jacket water coolant. Applied Thermal Engineering, 28(14–15), 1774-1781. doi:http://dx.doi.org/10.1016/j.applthermaleng.2007.11.017
Lancial, N., Beaubert, F., Harmand, S., & Rolland, G. (2013). Effects of a turbulent wall jet on heat transfer over a non-confined backward-facing step. International Journal of Heat and fluid flow, 44, 336-347.
Launder, B. E., & Spalding, D. (1974). The numerical computation of turbulent flows. Computer methods in applied mechanics and engineering, 3(2), 269-289.
Lee, D.-W., Kim, T., & Lee, M. (2011). An amphiphilic pyrene sheet for selective functionalization of graphene. Chemical Communications, 47(29), 8259-8261.
Lee, D., Kim, J.-W., & Kim, B. G. (2006). A new parameter to control heat transport in nanofluids: surface charge state of the particle in suspension. The Journal of Physical Chemistry B, 110(9), 4323-4328.
Lee, G.-J., & Rhee, C. K. (2014). Enhanced thermal conductivity of nanofluids containing graphene nanoplatelets prepared by ultrasound irradiation. Journal of Materials Science, 49(4), 1506-1511.
Lee, S., Choi, S.-S., Li, S., and, & Eastman, J. (1999). Measuring thermal conductivity of fluids containing oxide nanoparticles. Journal of Heat Transfer, 121(2), 280-289.
Li, D., Mueller, M. B., Gilje, S., Kaner, R. B., & Wallace, G. G. (2008). Processable aqueous dispersions of graphene nanosheets. Nature Nanotechnology, 3(2), 101-105.
Li, F., Bao, Y., Chai, J., Zhang, Q., Han, D., & Niu, L. (2010). Synthesis and application of widely soluble graphene sheets. Langmuir, 26(14), 12314-12320.
Li, G. L., Liu, G., Li, M., Wan, D., Neoh, K., & Kang, E. (2010). Organo-and water-dispersible graphene oxide− polymer nanosheets for organic electronic memory and gold nanocomposites. The Journal of Physical Chemistry C, 114(29), 12742-12748.
Li, J., Niu, L., Zheng, Z., & Yan, F. (2014). Photosensitive graphene transistors. Advanced Materials, 26(31), 5239-5273.
Univers
ity of
Mala
ya

339
Li, X., Chen, Y., Mo, S., Jia, L., & Shao, X. (2014). Effect of surface modification on the stability and thermal conductivity of water-based SiO 2-coated graphene nanofluid. Thermochimica Acta, 595, 6-10.
Li, X., Wang, H., Robinson, J. T., Sanchez, H., Diankov, G., & Dai, H. (2009). Simultaneous nitrogen doping and reduction of graphene oxide. Journal of the American Chemical Society, 131(43), 15939-15944.
Li, X., Wang, X., Zhang, L., Lee, S., & Dai, H. (2008). Chemically derived, ultrasmooth graphene nanoribbon semiconductors. Science, 319(5867), 1229-1232.
Li, X., Zhang, G., Bai, X., Sun, X., Wang, X., Wang, E., & Dai, H. (2008). Highly conducting graphene sheets and Langmuir–Blodgett films. Nature Nanotechnology, 3(9), 538-542.
Liang, Y., Wu, D., Feng, X., & Müllen, K. (2009). Dispersion of graphene sheets in organic solvent supported by ionic interactions. Advanced Materials, 21(17), 1679-1683.
Liang, Y. T., & Hersam, M. C. (2010). Highly concentrated graphene solutions via polymer enhanced solvent exfoliation and iterative solvent exchange. Journal of the American Chemical Society, 132(50), 17661-17663.
Lin, J.-T., Armalyy, B., & Chen, T. (1991). Mixed convection heat transfer in inclined backward-facing step flows. International Journal of Heat and Mass Transfer, 34(6), 1568-1571.
Lin, W., Moon, K.-S., Zhang, S., Ding, Y., Shang, J., Chen, M., & Wong, C.-p. (2010). Microwave makes carbon nanotubes less defective. ACS nano, 4(3), 1716-1722.
Liu, F., Choi, J. Y., & Seo, T. S. (2010). DNA mediated water-dispersible graphene fabrication and gold nanoparticle-graphene hybrid. Chemical Communications, 46(16), 2844-2846.
Liu, H., Gao, J., Xue, M., Zhu, N., Zhang, M., & Cao, T. (2009). Processing of graphene for electrochemical application: noncovalently functionalize graphene sheets with water-soluble electroactive methylene green. Langmuir, 25(20), 12006-12010.
Liu, H., Ryu, S., Chen, Z., Steigerwald, M. L., Nuckolls, C., & Brus, L. E. (2009). Photochemical reactivity of graphene. Journal of the American Chemical Society, 131(47), 17099-17101.
Liu, J., Li, Y., Li, Y., Li, J., & Deng, Z. (2010). Noncovalent DNA decorations of graphene oxide and reduced graphene oxide toward water-soluble metal–carbon hybrid nanostructures via self-assembly. Journal of Materials Chemistry, 20(5), 900-906.
Liu, J., Wang, F., Zhang, L., Fang, X., & Zhang, Z. (2014). Thermodynamic properties and thermal stability of ionic liquid-based nanofluids containing graphene as advanced heat transfer fluids for medium-to-high-temperature applications. Renewable Energy, 63, 519-523.
Liu, J., Yang, W., Tao, L., Li, D., Boyer, C., & Davis, T. P. (2010). Thermosensitive graphene nanocomposites formed using pyrene‐terminal polymers
Univers
ity of
Mala
ya
340
made by RAFT polymerization. Journal of Polymer Science Part A: Polymer Chemistry, 48(2), 425-433.
Liu, L.-H., Lerner, M. M., & Yan, M. (2010). Derivitization of pristine graphene with well-defined chemical functionalities. Nano letters, 10(9), 3754-3756.
Liu, N., Luo, F., Wu, H., Liu, Y., Zhang, C., & Chen, J. (2008). One‐step ionic‐liquid‐assisted electrochemical synthesis of ionic‐liquid‐functionalized graphene sheets directly from graphite. Advanced Functional Materials, 18(10), 1518-1525.
Liu, S., Tian, J., Wang, L., Li, H., Zhang, Y., & Sun, X. (2010). Stable aqueous dispersion of graphene nanosheets: noncovalent functionalization by a polymeric reducing agent and their subsequent decoration with Ag nanoparticles for enzymeless hydrogen peroxide detection. Macromolecules, 43(23), 10078-10083.
Liu, Z.-H., Hu, R.-L., Lu, L., Zhao, F., & Xiao, H.-s. (2013). Thermal performance of an open thermosyphon using nanofluid for evacuated tubular high temperature air solar collector. Energy Conversion and Management, 73, 135-143.
Loh, K. P., Bao, Q., Eda, G., & Chhowalla, M. (2010). Graphene oxide as a chemically tunable platform for optical applications. Nature chemistry, 2(12), 1015-1024.
Lomeda, J. R., Doyle, C. D., Kosynkin, D. V., Hwang, W.-F., & Tour, J. M. (2008). Diazonium functionalization of surfactant-wrapped chemically converted graphene sheets. Journal of the American Chemical Society, 130(48), 16201-16206.
Lopes, M., Candini, A., Urdampilleta, M., Reserbat-Plantey, A., Bellini, V., Klyatskaya, S., Wernsdorfer, W. (2010). Surface-enhanced Raman signal for terbium single-molecule magnets grafted on graphene. ACS nano, 4(12), 7531-7537.
Lotya, M., Hernandez, Y., King, P. J., Smith, R. J., Nicolosi, V., Karlsson, L. S., McGovern, I. (2009). Liquid phase production of graphene by exfoliation of graphite in surfactant/water solutions. Journal of the American Chemical Society, 131(10), 3611-3620.
Lotya, M., King, P. J., Khan, U., De, S., & Coleman, J. N. (2010). High-concentration, surfactant-stabilized graphene dispersions. ACS nano, 4(6), 3155-3162.
Lu, J., Yang, J.-x., Wang, J., Lim, A., Wang, S., & Loh, K. P. (2009). One-Pot Synthesis of Fluorescent Carbon Nanoribbons, Nanoparticles, and Graphene by the Exfoliation of Graphite in Ionic Liquids. ACS nano, 3(8), 2367-2375. doi:10.1021/nn900546b
Lv, W., Tang, D.-M., He, Y.-B., You, C.-H., Shi, Z.-Q., Chen, X.-C., Yang, Q.-H. (2009). Low-temperature exfoliated graphenes: vacuum-promoted exfoliation and electrochemical energy storage. ACS nano, 3(11), 3730-3736.
Ma, W., Yang, F., Shi, J., Wang, F., Zhang, Z., & Wang, S. (2013). Silicone based nanofluids containing functionalized graphene nanosheets. Colloids and Surfaces A: Physicochemical and Engineering Aspects, 431, 120-126.
Univers
ity of
Mala
ya

341
Maheshkumar, P., & Muraleedharan, C. (2011). Minimization of entropy generation in flat heat pipe. International Journal of Heat and Mass Transfer, 54(1), 645-648.
Manca, O., Nardini, S., & Ricci, D. (2012). A numerical study of nanofluid forced convection in ribbed channels. Applied Thermal Engineering, 37, 280-292.
Manimaran, R., Palaniradja, K., Alagumurthi, N., & Hussain, J. (2014). Experimental comparative study of heat pipe performance using CuO and TiO2 nanofluids. International Journal of Energy Research, 38(5), 573-580. doi:10.1002/er.3058
Mansour, R. B., Galanis, N., & Nguyen, C. T. (2007). Effect of uncertainties in physical properties on forced convection heat transfer with nanofluids. Applied Thermal Engineering, 27(1), 240-249. doi:http://dx.doi.org/10.1016/j.applthermaleng.2006.04.011
Marcano, D. C., Kosynkin, D. V., Berlin, J. M., Sinitskii, A., Sun, Z., Slesarev, A., Tour, J. M. (2010). Improved synthesis of graphene oxide. ACS nano, 4(8), 4806-4814.
Marchini, S., Günther, S., & Wintterlin, J. (2007). Scanning tunneling microscopy of graphene on Ru (0001). Physical Review B, 76(7), 075429.
Martin-Gallego, M., Verdejo, R., Khayet, M., de Zarate, J. M. O., Essalhi, M., & Lopez-Manchado, M. A. (2011). Thermal conductivity of carbon nanotubes and graphene in epoxy nanofluids and nanocomposites. Nanoscale research letters, 6(1), 1-7.
Mason, T. J., & Lorimer, J. P. (2002). Introduction to applied ultrasonics. Applied Sonochemistry: Uses of Power Ultrasound in Chemistry and Processing, 5, 1-24.
Matsumoto, M., Saito, Y., Park, C., Fukushima, T., & Aida, T. (2015a). Ultrahigh-throughput exfoliation of graphite into pristine ‘single-layer’ graphene using microwaves and molecularly engineered ionic liquids. Nat Chem, 7(9), 730-736. doi:10.1038/nchem.2315, http://www.nature.com/nchem/journal/v7/n9/abs/nchem.2315.html#supplementary-information
Matsumoto, M., Saito, Y., Park, C., Fukushima, T., & Aida, T. (2015b). Ultrahigh-throughput exfoliation of graphite into pristine ‘single-layer’graphene using microwaves and molecularly engineered ionic liquids. Nature chemistry, 7(9), 730-736.
Maxwell, J. C. (1881). A treatise on electricity and magnetism (Vol. 1): Clarendon press, 1.
May, P., Khan, U., Hughes, J. M., & Coleman, J. N. (2012). Correction to “Role of Solubility Parameters in Understanding the Steric Stabilization of Exfoliated Two-Dimensional Nanosheets by Adsorbed Polymers”. The Journal of Physical Chemistry C, 116(45), 24390-24391.
Univers
ity of
Mala
ya

342
McAllister, M. J., Li, J.-L., Adamson, D. H., Schniepp, H. C., Abdala, A. A., Liu, J., Prud'homme, R. K. (2007). Single sheet functionalized graphene by oxidation and thermal expansion of graphite. Chemistry of Materials, 19(18), 4396-4404.
Mehrali, M., Sadeghinezhad, E., Latibari, S. T., Kazi, S. N., Mehrali, M., Zubir, M. N. B. M., & Metselaar, H. S. C. (2014). Investigation of thermal conductivity and rheological properties of nanofluids containing graphene nanoplatelets. Nanoscale research letters, 9(1), 1-12.
Mehrali, M., Sadeghinezhad, E., Latibari, S. T., Mehrali, M., Togun, H., Zubir, M., Metselaar, H. S. C. (2014). Preparation, characterization, viscosity, and thermal conductivity of nitrogen-doped graphene aqueous nanofluids. Journal of Materials Science, 49(20), 7156-7171.
Mehrali, M., Sadeghinezhad, E., Rosen, M. A., Akhiani, A. R., Latibari, S. T., Mehrali, M., & Metselaar, H. S. C. (2015). Heat transfer and entropy generation for laminar forced convection flow of graphene nanoplatelets nanofluids in a horizontal tube. International Communications in Heat and Mass Transfer, 66, 23-31.
Mehrali, M., Sadeghinezhad, E., Rosen, M. A., Latibari, S. T., Mehrali, M., Metselaar, H. S. C., & Kazi, S. N. (2015). Effect of specific surface area on convective heat transfer of graphene nanoplatelet aqueous nanofluids. Experimental Thermal and Fluid Science, 68, 100-108.
Mehrali, M., Sadeghinezhad, E., Tahan Latibari, S., Kazi, S. N., Mehrali, M., Zubir, M. N. B. M., & Metselaar, H. S. C. (2014). Investigation of thermal conductivity and rheological properties of nanofluids containing graphene nanoplatelets. Nanoscale Research Letters, 9(1), 1-12.
Mehta, B., & Khandekar, S. (2007). Two-phase closed thermosyphon with nanofluids. 14th International Heat Pipe Conference, 1, 25-48.
Mensing, J. P., Kerdcharoen, T., Sriprachuabwong, C., Wisitsoraat, A., Phokharatkul, D., Lomas, T., & Tuantranont, A. (2012). Facile preparation of graphene–metal phthalocyanine hybrid material by electrolytic exfoliation. Journal of Materials Chemistry, 22(33), 17094-17099.
Meyer, J., Geim, A., Katsnelson, M., Novoselov, K., Obergfell, D., Roth, S., Zettl, A. (2007). On the roughness of single-and bi-layer graphene membranes. Solid State Communications, 143(1), 101-109.
Meyer, J. C., Geim, A. K., Katsnelson, M. I., Novoselov, K. S., Booth, T. J., & Roth, S. (2007). The structure of suspended graphene sheets. Nature, 446(7131), 60-63.
Minea, A., Manca, O., Moldoveanu, M. (2015) Fom comparison on al2o3, cuo and tio2 water based nanofluids in laminar and turbulent flow, Conference on Thermal Energy Systems, 8, 21-45.
Moaseri, E., Maghrebi, M., & Baniadam, M. (2014). Improvements in mechanical properties of carbon fiber-reinforced epoxy composites: a microwave-assisted approach in functionalization of carbon fiber via diamines. Materials & Design, 55, 644-652.
Univers
ity of
Mala
ya

343
Moffat, R. J. (1988). Describing the uncertainties in experimental results. Experimental Thermal and Fluid Science, 1(1), 3-17. doi:http://dx.doi.org/10.1016/0894-1777(88)90043-X
Mohammad Zadeh, P., Sokhansefat, T., Kasaeian, A. B., Kowsary, F., & Akbarzadeh, A. (2015). Hybrid optimization algorithm for thermal analysis in a solar parabolic trough collector based on nanofluid. Energy, 82(0), 857-864. doi:http://dx.doi.org/10.1016/j.energy.2015.01.096
Mohammed, H., Al-Aswadi, A., Shuaib, N., & Saidur, R. (2011). Convective heat transfer and fluid flow study over a step using nanofluids: a review. Renewable and Sustainable Energy Reviews, 15(6), 2921-2939.
Mohammed, H., Al-Aswadi, A., Yusoff, M., & Saidur, R. (2012). Mixed convective flows over backward facing step in a vertical duct using various nanofluids-buoyancy-assisting case. Thermophys. Aeromech, 42(1), 1-30.
Mohammed, H., Al‐aswadi, A., Abu‐Mulaweh, H., & Shuaib, N. (2011). Influence of nanofluids on mixed convective heat transfer over a horizontal backward‐facing step. Heat Transfer—Asian Research, 40(4), 287-307.
Mohammed, H., Alawi, O. A., & Wahid, M. (2015). Mixed convective nanofluid flow in a channel having backward-facing step with a baffle. Powder Technology, 275, 329-343.
Mousa, M. (2011). Effect of nanofluid concentration on the performance of circular heat pipe. Ain shams engineering journal, 2(1), 63-69.
Murphy, D., & Hull Jr, G. (1975). Monodispersed tantalum disulfide and adsorption complexes with cations. The Journal of Chemical Physics, 62(3), 973-978.
Murshed, S., Leong, K., & Yang, C. (2006). A model for predicting the effective thermal conductivity of nanoparticle-fluid suspensions. International Journal of Nanoscience, 5(01), 23-33.
Murshed, S., Leong, K., & Yang, C. (2008). Investigations of thermal conductivity and viscosity of nanofluids. International Journal of Thermal Sciences, 47(5), 560-568.
Nan, C.-W., Birringer, R., Clarke, D. R., & Gleiter, H. (1997). Effective thermal conductivity of particulate composites with interfacial thermal resistance. Journal of Applied Physics, 81(10), 6692-6699.
Nanda, J., Maranville, C., Bollin, S. C., Sawall, D., Ohtani, H., Remillard, J. T., & Ginder, J. (2008). Thermal conductivity of single-wall carbon nanotube dispersions: role of interfacial effects. The Journal of Physical Chemistry C, 112(3), 654-658.
Nemes-Incze, P., Osváth, Z., Kamarás, K., & Biró, L. (2008). Anomalies in thickness measurements of graphene and few layer graphite crystals by tapping mode atomic force microscopy. Carbon, 46(11), 1435-1442.
Nie, J., & Armaly, B. F. (2002). Three-dimensional convective flow adjacent to backward-facing step-effects of step height. International Journal of Heat and Mass Transfer, 45(12), 2431-2438.
Univers
ity of
Mala
ya
344
Niu, L., Coleman, J. N., Zhang, H., Shin, H., Chhowalla, M., & Zheng, Z. (2016). Production of Two‐Dimensional Nanomaterials via Liquid‐Based Direct Exfoliation. Small, 12(3), 272-293.
Niyogi, S., Bekyarova, E., Itkis, M. E., Zhang, H., Shepperd, K., Hicks, J., Deheer, W. A. (2010). Spectroscopy of covalently functionalized graphene. Nano letters, 10(10), 4061-4066.
Notley, S. M. (2012). Highly concentrated aqueous suspensions of graphene through ultrasonic exfoliation with continuous surfactant addition. Langmuir, 28(40), 14110-14113.
Novoselov, K., Geim, A. K., Morozov, S., Jiang, D., Katsnelson, M., Grigorieva, I., Firsov, A. (2005). Two-dimensional gas of massless Dirac fermions in graphene. Nature, 438(7065), 197-200.
Novoselov, K., Jiang, D., Schedin, F., Booth, T., Khotkevich, V., Morozov, S., & Geim, A. (2005). Two-dimensional atomic crystals. Proceedings of the National Academy of Sciences of the United States of America, 102(30), 10451-10453.
Novoselov, K. S., Fal, V., Colombo, L., Gellert, P., Schwab, M., & Kim, K. (2012). A roadmap for graphene. Nature, 490(7419), 192-200.
Novoselov, K. S., Geim, A. K., Morozov, S., Jiang, D., Zhang, Y., Dubonos, S. a., Firsov, A. (2004). Electric field effect in atomically thin carbon films. science, 306(5696), 666-669.
O’Neill, A., Khan, U., Nirmalraj, P. N., Boland, J., & Coleman, J. N. (2011). Graphene dispersion and exfoliation in low boiling point solvents. The Journal of Physical Chemistry C, 115(13), 5422-5428.
Obraztsov, A. N. (2009). Chemical vapour deposition: making graphene on a large scale. Nature nanotechnology, 4(4), 212-213.
Ohta, T., El Gabaly, F., Bostwick, A., McChesney, J. L., Emtsev, K. V., Schmid, A. K., Rotenberg, E. (2008). Morphology of graphene thin film growth on SiC (0001). New Journal of Physics, 10(2), 023034.
Olah, G. A., Germain, A., Lin, H. C., & Forsyth, D. A. (1975). Electrophilic reactions at single bonds. XVIII. Indication of protosolvated de facto substituting agents in the reactions of alkanes with acetylium and nitronium ions in superacidic media. Journal of the American Chemical Society, 97(10), 2928-2929.
Ou, B., Zhou, Z., Liu, Q., Liao, B., Yi, S., Ou, Y., Li, D. (2012). Covalent functionalization of graphene with poly (methyl methacrylate) by atom transfer radical polymerization at room temperature. Polymer Chemistry, 3(10), 2768-2775.
Pak, B. C., & Cho, Y. I. (1998). Hydrodynamic and heat transfer study of dispersed fluids with submicron metallic oxide particles. Experimental Heat Transfer, 11(2), 151-170. doi:10.1080/08916159808946559
Pak, B. C., & Cho, Y. I. (1998). Hydrodynamic and heat transfer study of dispersed fluids with submicron metallic oxide particles. Experimental Heat Transfer an International Journal, 11(2), 151-170.
Univers
ity of
Mala
ya
345
Pan, S., Zhu, J., & Liu, X. (2013). Preparation, electrochemical properties, and adsorption kinetics of Ni 3 S 2/graphene nanocomposites using alkyldithiocarbonatio complexes of nickel (ii) as single-source precursors. New Journal of Chemistry, 37(3), 654-662.
Parametthanuwat, T., Rittidech, S., Pattiya, A., Ding, Y., & Witharana, S. (2011). Application of silver nanofluid containing oleic acid surfactant in a thermosyphon economizer. Nanoscale research letters, 6(1), 1-10.
Paredes, J. I., Villar-Rodil, S., Martínez-Alonso, A., & Tascón, J. M. D. (2008). Graphene Oxide Dispersions in Organic Solvents. Langmuir, 24(19), 10560-10564. doi:10.1021/la801744a
Park, S.-H., Bak, S.-M., Kim, K.-H., Jegal, J.-P., Lee, S.-I., Lee, J., & Kim, K.-B. (2011). Solid-state microwave irradiation synthesis of high quality graphene nanosheets under hydrogen containing atmosphere. Journal of Materials Chemistry, 21(3), 680-686.
Park, S., An, J., Jung, I., Piner, R. D., An, S. J., Li, X., Ruoff, R. S. (2009). Colloidal suspensions of highly reduced graphene oxide in a wide variety of organic solvents. Nano letters, 9(4), 1593-1597.
Park, S., Lee, K.-S., Bozoklu, G., Cai, W., Nguyen, S. T., & Ruoff, R. S. (2008). Graphene oxide papers modified by divalent ions—enhancing mechanical properties via chemical cross-linking. ACS nano, 2(3), 572-578.
Park, S., Mohanty, N., Suk, J. W., Nagaraja, A., An, J., Piner, R. D., Ruoff, R. S. (2010). Biocompatible, robust free‐standing paper composed of a tween/graphene composite. Advanced Materials, 22(15), 1736-1740.
Park, S., & Ruoff, R. S. (2009). Chemical methods for the production of graphenes. Nature Nanotechnology, 4(4), 217-224.
Park, S., & Ruoff, R. S. (2015). Synthesis and characterization of chemically modified graphenes. Current Opinion in Colloid & Interface Science, 20(5), 322-328.
Park, S. D., Lee, S. W., Kang, S., Bang, I. C., Kim, J. H., Shin, H. S., Lee, D. W. (2010). Effects of nanofluids containing graphene/graphene-oxide nanosheets on critical heat flux. Applied Physics Letters, 97(2), 023103.
Park, S. S., & Kim, N. J. (2014). Influence of the oxidation treatment and the average particle diameter of graphene for thermal conductivity enhancement. Journal of Industrial and Engineering Chemistry, 20(4), 1911-1915.
Parvez, K., Li, R., Puniredd, S. R., Hernandez, Y., Hinkel, F., Wang, S., Mu len, K. (2013). Electrochemically exfoliated graphene as solution-processable, highly conductive electrodes for organic electronics. ACS nano, 7(4), 3598-3606.
Parvez, K., Wu, Z.-S., Li, R., Liu, X., Graf, R., Feng, X., & Mul en, K. (2014). Exfoliation of graphite into graphene in aqueous solutions of inorganic salts. Journal of the American Chemical Society, 136(16), 6083-6091.
Univers
ity of
Mala
ya

346
Parviz, D., Das, S., Ahmed, H. T., Irin, F., Bhattacharia, S., & Green, M. J. (2012). Dispersions of non-covalently functionalized graphene with minimal stabilizer. ACS nano, 6(10), 8857-8867.
Paton, K. R., Varrla, E., Backes, C., Smith, R. J., Khan, U., O’Neill, A., King, P. (2014). Scalable production of large quantities of defect-free few-layer graphene by shear exfoliation in liquids. Nature materials, 13(6), 624-630.
Phillips, R. J., Armstrong, R. C., Brown, R. A., Graham, A. L., & Abbott, J. R. (1992). A constitutive equation for concentrated suspensions that accounts for shear‐induced particle migration. Physics of Fluids A: Fluid Dynamics (1989-1993), 4(1), 30-40.
Pisana, S., Lazzeri, M., Casiraghi, C., Novoselov, K. S., Geim, A. K., Ferrari, A. C., & Mauri, F. (2007). Breakdown of the adiabatic Born–Oppenheimer approximation in graphene. Nature materials, 6(3), 198-201.
Popiel, C. O., & Wojtkowiak, J. (1998). Simple Formulas for Thermophysical Properties of Liquid Water for Heat Transfer Calculations (from 0°C to 150°C). Heat transfer engineering, 19(3), 87-101. doi:10.1080/01457639808939929
Qi, X., Pu, K. Y., Li, H., Zhou, X., Wu, S., Fan, Q. L., Zhang, H. (2010). Amphiphilic graphene composites. Angewandte Chemie International Edition, 49(49), 9426-9429.
Qian, W., Hao, R., Hou, Y., Tian, Y., Shen, C., Gao, H., & Liang, X. (2009). Solvothermal-assisted exfoliation process to produce graphene with high yield and high quality. Nano Research, 2(9), 706-712.
Quintana, M., Spyrou, K., Grzelczak, M., Browne, W. R., Rudolf, P., & Prato, M. (2010). Functionalization of graphene via 1, 3-dipolar cycloaddition. ACS nano, 4(6), 3527-3533.
Radic, S., Geitner, N. K., Podila, R., Käkinen, A., Chen, P., Ke, P. C., & Ding, F. (2013). Competitive binding of natural amphiphiles with graphene derivatives. Scientific reports, 3, 2273.
Rao, K. S., Sentilnathan, J., Cho, H. W., Wu, J. J., & Yoshimura, M. (2015). Soft Processing of Graphene Nanosheets by Glycine‐Bisulfate Ionic‐Complex‐Assisted Electrochemical Exfoliation of Graphite for Reduction Catalysis. Advanced Functional Materials, 25(2), 298-305.
Rashidi, M., & Abbasbandy, S. (2011). Analytic approximate solutions for heat transfer of a micropolar fluid through a porous medium with radiation. Communications in Nonlinear Science and Numerical Simulation, 16(4), 1874-1889.
Rocquefelte, X., Boucher, F., Gressier, P., Ouvrard, G., Blaha, P., & Schwarz, K. (2000). Mo cluster formation in the intercalation compound LiMoS 2. Physical Review B, 62(4), 2397.
Ruoff, R. (2008). Graphene: Calling all chemists. Nature nanotechnology, 3(1), 10-11.
Univers
ity of
Mala
ya

347
Sadeghinezhad, E., Mehrali, M., Tahan Latibari, S., Mehrali, M., Kazi, S., Oon, C. S., & Metselaar, H. S. C. (2014). Experimental Investigation of Convective Heat Transfer Using Graphene Nanoplatelet Based Nanofluids under Turbulent Flow Conditions. Industrial & Engineering Chemistry Research, 53(31), 12455-12465.
Sadeghinezhad, E., Togun, H., Mehrali, M., Nejad, P. S., Latibari, S. T., Abdulrazzaq, T., Metselaar, H. S. C. (2015). An experimental and numerical investigation of heat transfer enhancement for graphene nanoplatelets nanofluids in turbulent flow conditions. International Journal of Heat and Mass Transfer, 81, 41-51.
Saidi, M., & Karimi, G. (2014). Free convection cooling in modified L-shape enclosures using copper–water nanofluid. Energy, 70(0), 251-271. doi:http://dx.doi.org/10.1016/j.energy.2014.03.121
Samira, P., Saeed, Z., Motahare, S., & Mostafa, K. (2014). Pressure drop and thermal performance of CuO/ethylene glycol (60%)-water (40%) nanofluid in car radiator. Korean Journal of Chemical Engineering, 5, 1-8. doi:10.1007/s11814-014-0244-7
Samira, P., Saeed, Z. H., Motahare, S., & Mostafa, K. (2015). Pressure drop and thermal performance of CuO/ethylene glycol (60%)-water (40%) nanofluid in car radiator. Korean Journal of Chemical Engineering, 32(4), 609-616.
Sarsam, W., Amiri, A., Kazi, S., & Badarudin, A. (2016). Stability and thermophysical properties of non-covalently functionalized graphene nanoplatelets nanofluids. Energy Conversion and Management, 116, 101-111.
Sarsam, W., Amiri, A., Zubir, M. N. M., Yarmand, H., Kazi, S. N., & Badarudin, A. (2016b). Stability and thermophysical properties of water-based nanofluids containing triethanolamine-treated graphene nanoplatelets with different specific surface areas. Colloids and Surfaces A: Physicochemical and Engineering Aspects, 500, 17-31. doi:http://dx.doi.org/10.1016/j.colsurfa.2016.04.016
Schlierf, A., Yang, H., Gebremedhn, E., Treossi, E., Ortolani, L., Chen, L., Casiraghi, C. (2013). Nanoscale insight into the exfoliation mechanism of graphene with organic dyes: effect of charge, dipole and molecular structure. Nanoscale, 5(10), 4205-4216.
Schniepp, H. C., Li, J.-L., McAllister, M. J., Sai, H., Herrera-Alonso, M., Adamson, D. H., Aksay, I. A. (2006). Functionalized single graphene sheets derived from splitting graphite oxide. The Journal of Physical Chemistry B, 110(17), 8535-8539.
Sensale-Rodriguez, B., Fang, T., Yan, R., Kelly, M. M., Jena, D., Liu, L., & Xing, H. G. (2011). Unique prospects for graphene-based terahertz modulators. Applied Physics Letters, 99(11), 113104.
Seyed Shirazi, S. F., Gharehkhani, S., Yarmand, H., Badarudin, A., Cornelis Metselaar, H. S., & Kazi, S. N. (2015). Nitrogen doped activated carbon/graphene with high nitrogen level: Green synthesis and thermo-electrical properties of its nanofluid. Materials Letters, 152, 192-195. doi:http://dx.doi.org/10.1016/j.matlet.2015.03.110
Univers
ity of
Mala
ya

348
Shanbedi, M., Amiri, A., Rashidi, S., Heris, S. Z., & Baniadam, M. (2015). Thermal Performance Prediction of Two-Phase Closed Thermosyphon Using Adaptive Neuro-Fuzzy Inference System. Heat Transfer Engineering, 36(3), 315-324.
Shanbedi, M., Heris, S. Z., Amiri, A., Adyani, S., Alizadeh, M., & Baniadam, M. (2014). Optimization of the thermal efficiency of a two-phase closed thermosyphon using active learning on the human algorithm interaction. Numerical Heat Transfer, Part A: Applications, 66(8), 947-962.
Shanbedi, M., Heris, S. Z., Amiri, A., & Baniadam, M. (2014). Improvement in heat transfer of a two-phased closed thermosyphon using silver-decorated MWCNT/water. Journal of Dispersion Science and Technology, 35(8), 1086-1096.
Shanbedi, M., Heris, S. Z., Baniadam, M., Amiri, A., & Maghrebi, M. (2012). Investigation of heat-transfer characterization of EDA-MWCNT/DI-water nanofluid in a two-phase closed thermosyphon. Industrial & Engineering Chemistry Research, 51(3), 1423-1428.
Shanbedi, M., Jafari, D., Amiri, A., Heris, S. Z., & Baniadam, M. (2013). Prediction of temperature performance of a two-phase closed thermosyphon using Artificial Neural Network. Heat and Mass Transfer, 49(1), 65-73.
Shanbedi, M., Zeinali Heris, S., Baniadam, M., & Amiri, A. (2013). The effect of multi-walled carbon nanotube/water nanofluid on thermal performance of a two-phase closed thermosyphon. Experimental Heat Transfer, 26(1), 26-40.
Sharma, R., Baik, J. H., Perera, C. J., & Strano, M. S. (2010). Anomalously large reactivity of single graphene layers and edges toward electron transfer chemistries. Nano letters, 10(2), 398-405.
Sheikholeslami, M., Ganji, D. D., Javed, M. Y., & Ellahi, R. (2015). Effect of thermal radiation on magnetohydrodynamics nanofluid flow and heat transfer by means of two phase model. Journal of Magnetism and Magnetic Materials, 374, 36-43.
Shen, Y., & Lua, A. C. (2013). A facile method for the large-scale continuous synthesis of graphene sheets using a novel catalyst. Scientific reports, 3.
Shende, R., & Sundara, R. (2015). Nitrogen doped hybrid carbon based composite dispersed nanofluids as working fluid for low-temperature direct absorption solar collectors. Solar Energy Materials and Solar Cells, 140, 9-16.
Shih, C.-J., Lin, S., Sharma, R., Strano, M. S., & Blankschtein, D. (2011). Understanding the pH-dependent behavior of graphene oxide aqueous solutions: a comparative experimental and molecular dynamics simulation study. Langmuir, 28(1), 235-241.
Shih, T. M. (1984). Numerical heat transfer: CRC Press, 11, 250-290.
Shinde, D. B., Brenker, J., Easton, C. D., Tabor, R. F., Neild, A., & Majumder, M. (2016). Shear Assisted Electrochemical Exfoliation of Graphite to Graphene. Langmuir, 32(14), 3552-3559. doi:10.1021/acs.langmuir.5b04209
Shirazi, S. F. S., Gharehkhani, S., Yarmand, H., Badarudin, A., Metselaar, H. S. C., & Kazi, S. N. (2015). Nitrogen doped activated carbon/graphene with high nitrogen
Univers
ity of
Mala
ya

349
level: green synthesis and thermo-electrical properties of its nanofluid. Materials Letters, 152, 192-195.
Singh, M. S. (2004). Advanced organic chemistry: reactions and mechanisms: Pearson Education India, 9, 243.
Sinitskii, A., Dimiev, A., Corley, D. A., Fursina, A. A., Kosynkin, D. V., & Tour, J. M. (2010). Kinetics of diazonium functionalization of chemically converted graphene nanoribbons. ACS nano, 4(4), 1949-1954.
Skaltsas, T., Karousis, N., Yan, H.-J., Wang, C.-R., Pispas, S., & Tagmatarchis, N. (2012). Graphene exfoliation in organic solvents and switching solubility in aqueous media with the aid of amphiphilic block copolymers. Journal of Materials Chemistry, 22(40), 21507-21512.
Smith, R. J., Lotya, M., & Coleman, J. N. (2010). The importance of repulsive potential barriers for the dispersion of graphene using surfactants. New Journal of Physics, 12(12), 125008.
Solangi, K., Amiri, A., Luhur, M., Ghavimi, S. A. A., Zubir, M. N. M., Kazi, S., & Badarudin, A. (2016). Experimental investigation of the propylene glycol-treated graphene nanoplatelets for the enhancement of closed conduit turbulent convective heat transfer. International communications in heat and mass transfer, 73, 43-53.
Solangi, K., Kazi, S., Luhur, M., Badarudin, A., Amiri, A., Sadri, R., Teng, K. (2015). A comprehensive review of thermo-physical properties and convective heat transfer to nanofluids. Energy, 89, 1065-1086.
Stankovich, S., Dikin, D. A., Dommett, G. H., Kohlhaas, K. M., Zimney, E. J., Stach, E. A., Ruoff, R. S. (2006). Graphene-based composite materials. Nature, 442(7100), 282-286.
Stankovich, S., Dikin, D. A., Piner, R. D., Kohlhaas, K. A., Kleinhammes, A., Jia, Y., Ruoff, R. S. (2007). Synthesis of graphene-based nanosheets via chemical reduction of exfoliated graphite oxide. Carbon, 45(7), 1558-1565.
Stankovich, S., Piner, R. D., Chen, X., Wu, N., Nguyen, S. T., & Ruoff, R. S. (2006). Stable aqueous dispersions of graphitic nanoplatelets via the reduction of exfoliated graphite oxide in the presence of poly (sodium 4-styrenesulfonate). Journal of Materials Chemistry, 16(2), 155-158.
Stankovich, S., Piner, R. D., Nguyen, S. T., & Ruoff, R. S. (2006). Synthesis and exfoliation of isocyanate-treated graphene oxide nanoplatelets. Carbon, 44(15), 3342-3347.
Steven, B., Albert, J., & Kevin, P. (2011). Investigation of the electrical conductivity of propylene glycol-based ZnO nanofluids. Nanosca. Res. Lett, 6, 346-351.
Strom, T. A., Dillon, E. P., Hamilton, C. E., & Barron, A. R. (2010). Nitrene addition to exfoliated graphene: a one-step route to highly functionalized graphene. Chemical Communications, 46(23), 4097-4099.
Su, Q., Pang, S., Alijani, V., Li, C., Feng, X., & Müllen, K. (2009). Composites of graphene with large aromatic molecules. Advanced Materials, 21(31), 3191-3195.
Univers
ity of
Mala
ya

350
Sun, G., Li, X., Yan, H., Qiu, J., & Zhang, Y. (2008). Production of nanosized graphite powders from natural graphite by detonation. Carbon, 46(3), 476-481.
Sun, Z., James, D. K., & Tour, J. M. (2011). Graphene chemistry: synthesis and manipulation. The Journal of Physical Chemistry Letters, 2(19), 2425-2432.
Sun, Z., Kohama, S.-i., Zhang, Z., Lomeda, J. R., & Tour, J. M. (2010). Soluble graphene through edge-selective functionalization. Nano Research, 3(2), 117-125.
Sun, Z., Nicolosi, V., Rickard, D., Bergin, S. D., Aherne, D., & Coleman, J. N. (2008). Quantitative evaluation of surfactant-stabilized single-walled carbon nanotubes: dispersion quality and its correlation with zeta potential. The Journal of Physical Chemistry C, 112(29), 10692-10699.
Sun, Z., Pöller, S., Huang, X., Guschin, D., Taetz, C., Ebbinghaus, P., Schuhmann, W. (2013). High-yield exfoliation of graphite in acrylate polymers: A stable few-layer graphene nanofluid with enhanced thermal conductivity. Carbon, 64, 288-294.
Sundar, L. S., Singh, M. K., & Sousa, A. C. (2014). Enhanced heat transfer and friction factor of MWCNT–Fe 3 O 4/water hybrid nanofluids. International Communications in Heat and Mass Transfer, 52, 73-83.
Sutter, P. W., Flege, J.-I., & Sutter, E. A. (2008). Epitaxial graphene on ruthenium. Nature materials, 7(5), 406-411.
Tian, R., Wang, X., Li, M., Hu, H., Chen, R., Liu, F., Wan, L. (2008). An efficient route to functionalize singe-walled carbon nanotubes using alcohols. Applied Surface Science, 255(5), 3294-3299.
Tong, Y., Kim, J., & Cho, H. (2015). Effects of thermal performance of enclosed-type evacuated U-tube solar collector with multi-walled carbon nanotube/water nanofluid. Renewable Energy, 83, 463-473. doi:http://dx.doi.org/10.1016/j.renene.2015.04.042
Tran, T. S., Park, S. J., Yoo, S. S., Lee, T.-R., & Kim, T. (2016). High shear-induced exfoliation of graphite into high quality graphene by Taylor-Couette flow. Rsc Advances, 6(15), 12003-12008. doi:10.1039/C5RA22273G
Tu, W., Lei, J., Zhang, S., & Ju, H. (2010). Characterization, Direct Electrochemistry, and Amperometric Biosensing of Graphene by Noncovalent Functionalization with Picket‐Fence Porphyrin. Chemistry–A European Journal, 16(35), 10771-10777.
Vadasz, P. (2006). Heat conduction in nanofluid suspensions. Journal of Heat Transfer, 128(5), 465-477.
Vadukumpully, S., Gupta, J., Zhang, Y., Xu, G. Q., & Valiyaveettil, S. (2011). Functionalization of surfactant wrapped graphene nanosheets with alkylazides for enhanced dispersibility. Nanoscale, 3(1), 303-308.
Vadukumpully, S., Paul, J., & Valiyaveettil, S. (2009). Cationic surfactant mediated exfoliation of graphite into graphene flakes. Carbon, 47(14), 3288-3294.
Univers
ity of
Mala
ya
351
Vandsberger, L. (2009). Synthesis and Covalent Surface Modification of Carbon Nanotubes for Preparation of Stablized Nanofluid Suspensions. McGill University, 6, 2002.
Vázquez, E., & Prato, M. (2009). Carbon nanotubes and microwaves: interactions, responses, and applications. ACS nano, 3(12), 3819-3824.
Vradis, G. C., & Vannostrand, L. (1992). Laminar coupled flow downstream of an asymmetric sudden expansion. Journal of thermophysics and heat transfer, 6(2), 288-295.
Vradis, G. C., Volkan Otugen, M., & Sanchez, J. G. (1993). Heat Transfer Over a Backward-Facing Step: Solutions to a Benchmark Problem. ASME-Publications-HTD, 222, 27-27.
Wang, G., Wang, B., Park, J., Wang, Y., Sun, B., & Yao, J. (2009). Highly efficient and large-scale synthesis of graphene by electrolytic exfoliation. Carbon, 47(14), 3242-3246.
Wang, G., Yang, J., Park, J., Gou, X., Wang, B., Liu, H., & Yao, J. (2008). Facile synthesis and characterization of graphene nanosheets. The Journal of Physical Chemistry C, 112(22), 8192-8195.
Wang, H., Robinson, J. T., Li, X., & Dai, H. (2009). Solvothermal reduction of chemically exfoliated graphene sheets. Journal of the American Chemical Society, 131(29), 9910-9911.
Wang, J., Manga, K. K., Bao, Q., & Loh, K. P. (2011). High-yield synthesis of few-layer graphene flakes through electrochemical expansion of graphite in propylene carbonate electrolyte. Journal of the American Chemical Society, 133(23), 8888-8891.
Wang, X., Fulvio, P. F., Baker, G. A., Veith, G. M., Unocic, R. R., Mahurin, S. M., Dai, S. (2010). Direct exfoliation of natural graphite into micrometre size few layers graphene sheets using ionic liquids. Chemical Communications, 46(25), 4487-4489.
Wang, X., Xu, X., & S. Choi, S. U. (1999). Thermal conductivity of nanoparticle-fluid mixture. Journal of thermophysics and heat transfer, 13(4), 474-480.
Wang, X. J., Li, X. F., Xu, Y. H., & Zhu, D. S. (2014). Thermal energy storage characteristics of Cu–H2O nanofluids. Energy, 78(0), 212-217. doi:http://dx.doi.org/10.1016/j.energy.2014.10.005
Wang, Y., Chen, X., Zhong, Y., Zhu, F., & Loh, K. P. (2009). Large area, continuous, few-layered graphene as anodes in organic photovoltaic devices. Applied Physics Letters, 95(6), 063302.
Wang, Y., Iqbal, Z., & Mitra, S. (2006). Rapidly functionalized, water-dispersed carbon nanotubes at high concentration. Journal of the American Chemical Society, 128(1), 95-99.
Wang, Y., Shi, Z., & Yin, J. (2011). Facile synthesis of soluble graphene via a green reduction of graphene oxide in tea solution and its biocomposites. ACS applied materials & interfaces, 3(4), 1127-1133.
Univers
ity of
Mala
ya
352
Wang, Y., Zheng, Y., Xu, X., Dubuisson, E., Bao, Q., Lu, J., & Loh, K. P. (2011). Electrochemical delamination of CVD-grown graphene film: toward the recyclable use of copper catalyst. ACS nano, 5(12), 9927-9933.
Wang, Z., Dong, Y., Li, H., Zhao, Z., Wu, H. B., Hao, C., Lou, X. W. D. (2014). Enhancing lithium–sulphur battery performance by strongly binding the discharge products on amino-functionalized reduced graphene oxide. Nature communications, 5, 5002.
Watcharotone, S., Dikin, D. A., Stankovich, S., Piner, R., Jung, I., Dommett, G. H., Liu, C.-P. (2007). Graphene-silica composite thin films as transparent conductors. Nano letters, 7(7), 1888-1892.
Wei, D., Li, H., Han, D., Zhang, Q., Niu, L., Yang, H., Ryhänen, T. (2011). Properties of graphene inks stabilized by different functional groups. Nanotechnology, 22(24), 245702.
Wen, D., & Ding, Y. (2005). Effect of particle migration on heat transfer in suspensions of nanoparticles flowing through minichannels. Microfluidics and Nanofluidics, 1(2), 183-189.
Wen, Z., Wang, X., Mao, S., Bo, Z., Kim, H., Cui, S., Chen, J. (2012). Crumpled Nitrogen‐Doped Graphene Nanosheets with Ultrahigh Pore Volume for High‐Performance Supercapacitor. Advanced Materials, 24(41), 5610-5616.
White, B., Banerjee, S., O'Brien, S., Turro, N. J., & Herman, I. P. (2007). Zeta-potential measurements of surfactant-wrapped individual single-walled carbon nanotubes. The Journal of Physical Chemistry C, 111(37), 13684-13690.
Wu, Z.-S., Ren, W., Gao, L., Liu, B., Jiang, C., & Cheng, H.-M. (2009). Synthesis of high-quality graphene with a pre-determined number of layers. Carbon, 47(2), 493-499.
Wu, Z.-S., Ren, W., Gao, L., Zhao, J., Chen, Z., Liu, B., Cheng, H.-M. (2009). Synthesis of graphene sheets with high electrical conductivity and good thermal stability by hydrogen arc discharge exfoliation. ACS nano, 3(2), 411-417.
Wu, Z. S., Liu, Z., Parvez, K., Feng, X., & Müllen, K. (2015). Ultrathin Printable Graphene Supercapacitors with AC Line‐Filtering Performance. Advanced Materials, 27(24), 3669-3675.
Xie, Y., Huang, Q., Liu, M., Wang, K., Wan, Q., Deng, F., Wei, Y. (2015). Mussel inspired functionalization of carbon nanotubes for heavy metal ion removal. RSC Advances, 5(84), 68430-68438. doi:10.1039/C5RA08908E
Xu, L., McGraw, J.-W., Gao, F., Grundy, M., Ye, Z., Gu, Z., & Shepherd, J. L. (2013). Production of high-concentration graphene dispersions in low-boiling-point organic solvents by liquid-phase noncovalent exfoliation of graphite with a hyperbranched polyethylene and formation of graphene/ethylene copolymer composites. The Journal of Physical Chemistry C, 117(20), 10730-10742.
Xu, Y., Bai, H., Lu, G., Li, C., & Shi, G. (2008). Flexible graphene films via the filtration of water-soluble noncovalent functionalized graphene sheets. Journal of the American Chemical Society, 130(18), 5856-5857.
Univers
ity of
Mala
ya

353
Xuan, Y., & Li, Q. (2000). Heat transfer enhancement of nanofluids. International Journal of heat and fluid flow, 21(1), 58-64.
Xuan, Y., & Li, Q. (2003). Investigation on convective heat transfer and flow features of nanofluids. Journal of Heat transfer, 125(1), 151-155.
Xue, L., Keblinski, P., Phillpot, S., Choi, S., & Eastman, J. (2004). Effect of liquid layering at the liquid–solid interface on thermal transport. International Journal of Heat and Mass Transfer, 47(19), 4277-4284.
Yang, H., Hernandez, Y., Schlierf, A., Felten, A., Eckmann, A., Johal, S., Mullen, K. (2013). A simple method for graphene production based on exfoliation of graphite in water using 1-pyrenesulfonic acid sodium salt. Carbon, 53, 357-365.
Yang, H., Zhang, Q., Shan, C., Li, F., Han, D., & Niu, L. (2010). Stable, conductive supramolecular composite of graphene sheets with conjugated polyelectrolyte. Langmuir, 26(9), 6708-6712.
Yang, Q., Pan, X., Huang, F., & Li, K. (2010). Fabrication of high-concentration and stable aqueous suspensions of graphene nanosheets by noncovalent functionalization with lignin and cellulose derivatives. The Journal of Physical Chemistry C, 114(9), 3811-3816.
Yang, Y., Lu, F., Zhou, Z., Song, W., Chen, Q., & Ji, X. (2013). Electrochemically cathodic exfoliation of graphene sheets in room temperature ionic liquids N-butyl, methylpyrrolidinium bis (trifluoromethylsulfonyl) imide and their electrochemical properties. Electrochimica Acta, 113, 9-16.
Yang, Y., Oztekin, A., Neti, S., & Mohapatra, S. (2011). Characterization and convective heat transfer with nanofluids. Thermal Engineering Joint Conference, 2, 202-207.
Yarmand, H., Gharehkhani, S., Ahmadi, G., Shirazi, S. F. S., Baradaran, S., Montazer, E., Dahari, M. (2015). Graphene nanoplatelets–silver hybrid nanofluids for enhanced heat transfer. Energy Conversion and Management, 100, 419-428. doi:http://dx.doi.org/10.1016/j.enconman.2015.05.023
Yarmand, H., Gharehkhani, S., Shirazi, S. F. S., Amiri, A., Montazer, E., Arzani, H. K., Kazi, S. (2016). Nanofluid based on activated hybrid of biomass carbon/graphene oxide: Synthesis, thermo-physical and electrical properties. International communications in heat and mass transfer, 72, 10-15.
Yeh, C.-N., Raidongia, K., Shao, J., Yang, Q.-H., & Huang, J. (2015). On the origin of the stability of graphene oxide membranes in water. Nature chemistry, 7(2), 166-170.
You, S., Kim, J., & Kim, K. (2003). Effect of nanoparticles on critical heat flux of water in pool boiling heat transfer. Applied Physics Letters, 83(16), 3374-3376.
Yu, W., & Choi, S. (2003). The role of interfacial layers in the enhanced thermal conductivity of nanofluids: a renovated Maxwell model. Journal of Nanoparticle Research, 5(1-2), 167-171.
Univers
ity of
Mala
ya

354
Yu, W., & Choi, S. (2004). The role of interfacial layers in the enhanced thermal conductivity of nanofluids: a renovated Hamilton–Crosser model. Journal of Nanoparticle Research, 6(4), 355-361.
Yu, W., France, D., Timofeeva, E., Singh, D., & Routbort, J. (2010). Thermophysical property-related comparison criteria for nanofluid heat transfer enhancement in turbulent flow. Applied physics letters, 96(21), 213109.
Yu, W., France, D. M., Smith, D. S., Singh, D., Timofeeva, E. V., & Routbort, J. L. (2009a). Heat transfer to a silicon carbide/water nanofluid. International Journal of Heat and Mass Transfer, 52(15), 3606-3612.
Yu, W., France, D. M., Smith, D. S., Singh, D., Timofeeva, E. V., & Routbort, J. L. (2009b). Heat transfer to a silicon carbide/water nanofluid. International Journal of Heat and Mass Transfer, 52(15–16), 3606-3612. doi:http://dx.doi.org/10.1016/j.ijheatmasstransfer.2009.02.036
Yu, W., France, D. M., Timofeeva, E. V., Singh, D., & Routbort, J. L. (2012). Comparative review of turbulent heat transfer of nanofluids. International Journal of Heat and Mass Transfer, 55(21–22), 5380-5396. doi:http://dx.doi.org/10.1016/j.ijheatmasstransfer.2012.06.034
Yu, W., Timofeeva, E. V., Singh, D., France, D. M., & Smith, R. K. (2013). Investigations of heat transfer of copper-in-Therminol 59 nanofluids. International Journal of Heat and Mass Transfer, 64, 1196-1204.
Yu, W., Xie, H., Chen, L., Li, Y., & Li, D. (2010). The Preparation and Thermal Conductivities Enhacement of Nanofluids Containing Graphene Oxide Nanosheets. Paper presented at the 2010 14th International Heat Transfer Conference, 7, 2423.
Yu, W., Xie, H., Wang, X., & Wang, X. (2011). Significant thermal conductivity enhancement for nanofluids containing graphene nanosheets. Physics Letters A, 375(10), 1323-1328.
Zakaria, I., Azmi, W., Mohamed, W., Mamat, R., & Najafi, G. (2015). Experimental Investigation of Thermal Conductivity and Electrical Conductivity of Al2O3 Nanofluid in Water-Ethylene Glycol Mixture for Proton Exchange Membrane Fuel Cell Application. International communications in heat and mass transfer, 61, 61-68.
Zardini, H. Z., Amiri, A., Shanbedi, M., Maghrebi, M., & Baniadam, M. (2012). Enhanced antibacterial activity of amino acids-functionalized multi walled carbon nanotubes by a simple method. Colloids and Surfaces B: Biointerfaces, 92, 196-202.
Zardini, H. Z., Davarpanah, M., Shanbedi, M., Amiri, A., Maghrebi, M., & Ebrahimi, L. (2014). Microbial toxicity of ethanolamines—Multiwalled carbon nanotubes. Journal of Biomedical Materials Research Part A, 102(6), 1774-1781.
Zare‐Zardini, H., Amiri, A., Shanbedi, M., Taheri‐Kafrani, A., Kazi, S., Chew, B., & Razmjou, A. (2015a). In vitro and in vivo study of hazardous effects of Ag nanoparticles and Arginine‐treated multi walled carbon nanotubes on blood cells: Application in hemodialysis membranes. Journal of Biomedical Materials Research Part A, 103(9), 2959-2965.
Univers
ity of
Mala
ya

355
Zare‐Zardini, H., Amiri, A., Shanbedi, M., Taheri‐Kafrani, A., Kazi, S., Chew, B. T., & Razmjou, A. (2015b). In vitro and in vivo study of hazardous effects of Ag nanoparticles and Arginine‐treated multi walled carbon nanotubes on blood cells: Application in hemodialysis membranes. Journal of Biomedical Materials Research Part A. 103, 2959–2965.
Zeinali Heris, S., Etemad, S. G., & Nasr Esfahany, M. (2006). Experimental investigation of oxide nanofluids laminar flow convective heat transfer. International Communications in Heat and Mass Transfer, 33(4), 529-535. doi:http://dx.doi.org/10.1016/j.icheatmasstransfer.2006.01.005
Zeng, F., Sun, Z., Sang, X., Diamond, D., Lau, K. T., Liu, X., & Su, D. S. (2011). In situ one‐step electrochemical preparation of graphene oxide nanosheet‐modified electrodes for biosensors. ChemSusChem, 4(11), 1587-1591.
Zeng, Z., Yin, Z., Huang, X., Li, H., He, Q., Lu, G., Zhang, H. (2011). Single‐Layer Semiconducting Nanosheets: High‐yield preparation and device fabrication. Angewandte Chemie International Edition, 50(47), 11093-11097.
Zhang, H.B., Wang, J.-W., Yan, Q., Zheng, W.-G., Chen, C., & Yu, Z.-Z. (2011). Vacuum-assisted synthesis of graphene from thermal exfoliation and reduction of graphite oxide. Journal of Materials Chemistry, 21(14), 5392-5397.
Zhang, M., Parajuli, R. R., Mastrogiovanni, D., Dai, B., Lo, P., Cheung, W., Liu, Z. (2010). Production of graphene sheets by direct dispersion with aromatic healing agents. Small, 6(10), 1100-1107.
Zhang, Q., Li, W., Kong, T., Su, R., Li, N., Song, Q., Cheng, G. (2013). Tailoring the interlayer interaction between doxorubicin-loaded graphene oxide nanosheets by controlling the drug content. Carbon, 51, 164-172.
Zhang, S., Tang, S., Lei, J., Dong, H., & Ju, H. (2011). Functionalization of graphene nanoribbons with porphyrin for electrocatalysis and amperometric biosensing. Journal of Electroanalytical Chemistry, 656(1), 285-288.
Zhang, X., Coleman, A. C., Katsonis, N., Browne, W. R., Van Wees, B. J., & Feringa, B. L. (2010). Dispersion of graphene in ethanol using a simple solvent exchange method. Chemical Communications, 46(40), 7539-7541.
Zhang, X., Hou, L., Cnossen, A., Coleman, A. C., Ivashenko, O., Rudolf, P., Feringa, B. L. (2011). One‐Pot Functionalization of Graphene with Porphyrin through Cycloaddition Reactions. Chemistry–A European Journal, 17(32), 8957-8964.
Zhang, Y., Tan, Y.-W., Stormer, H. L., & Kim, P. (2005). Experimental observation of the quantum Hall effect and Berry's phase in graphene. Nature, 438(7065), 201-204.
Zheng, R., Gao, J., Wang, J., Feng, S.-P., Ohtani, H., Wang, J., & Chen, G. (2011). Thermal percolation in stable graphite suspensions. Nano letters, 12(1), 188-192.
Zhong, X., Jin, J., Li, S., Niu, Z., Hu, W., Li, R., & Ma, J. (2010). Aryne cycloaddition: highly efficient chemical modification of graphene. Chemical Communications, 46(39), 7340-7342.
Univers
ity of
Mala
ya

356
Zhou, M., Tang, J., Cheng, Q., Xu, G., Cui, P., & Qin, L.-C. (2013). Few-layer graphene obtained by electrochemical exfoliation of graphite cathode. Chemical Physics Letters, 572, 61-65.
Zhou, S., Siegel, D., Fedorov, A., El Gabaly, F., Schmid, A., Neto, A. C., Lanzara, A. (2008). Origin of the energy bandgap in epitaxial graphene. Nature materials, 7(4), 259-260.
Zhou, X., Wu, T., Ding, K., Hu, B., Hou, M., & Han, B. (2010). Dispersion of graphene sheets in ionic liquid [bmim][PF6] stabilized by an ionic liquid polymer. Chemical Communications, 46(3), 386-388.
Zhu, Y., Murali, S., Cai, W., Li, X., Suk, J. W., Potts, J. R., & Ruoff, R. S. (2010). Graphene and graphene oxide: synthesis, properties, and applications. Advanced Materials, 22(35), 3906-3924.
Zhu, Y., Murali, S., Stoller, M. D., Ganesh, K., Cai, W., Ferreira, P. J., Thommes, M. (2011). Carbon-based supercapacitors produced by activation of graphene. science, 332(6037), 1537-1541.
Zhu, Y., Murali, S., Stoller, M. D., Velamakanni, A., Piner, R. D., & Ruoff, R. S. (2010). Microwave assisted exfoliation and reduction of graphite oxide for ultracapacitors. Carbon, 48(7), 2118-2122.
Zhu, Y., Stoller, M. D., Cai, W., Velamakanni, A., Piner, R. D., Chen, D., & Ruoff, R. S. (2010). Exfoliation of graphite oxide in propylene carbonate and thermal reduction of the resulting graphene oxide platelets. ACS nano, 4(2), 1227-1233.
Zu, S. Z., & Han, B.-H. (2009). Aqueous dispersion of graphene sheets stabilized by pluronic copolymers: formation of supramolecular hydrogel. The Journal of Physical Chemistry C, 113(31), 13651-13657.
Zubir, M. N. M., Badarudin, A., Kazi, S., Huang, N. M., Misran, M., Sadeghinezhad, E., Gharehkhani, S. (2015). Experimental investigation on the use of reduced graphene oxide and its hybrid complexes in improving closed conduit turbulent forced convective heat transfer. Experimental Thermal and Fluid Science, 66, 290-303.
Zubir, M. N. M., Badarudin, A., Kazi, S., Huang, N. M., Misran, M., Sadeghinezhad, E., Yusoff, N. (2015). Highly dispersed reduced graphene oxide and its hybrid complexes as effective additives for improving thermophysical property of heat transfer fluid. International Journal of Heat and Mass Transfer, 87, 284-294.
Zubir, M. N. M., Badarudin, A., Kazi, S., Misran, M., Amiri, A., Sadri, R., & Khalid, S. (2015). Experimental investigation on the use of highly charged nanoparticles to improve the stability of weakly charged colloidal system. Journal of colloid and interface science, 454, 245-255.
Univers
ity of
Mala
ya

357
LIST OF PUBLICATIONS AND AWARDS
[1] A. Amiri, M. Shanbedi, B. Chew, S. Kazi, K. Solangi, Toward improved engine performance with crumpled nitrogen-doped graphene based water–ethylene glycol coolant, Chemical Engineering Journal, 289 (2016) 583-595.
[2] A. Amiri, M. Shanbedi, H. Yarmand, H.K. Arzani, S. Gharehkhani, E. Montazer, R. Sadri, W. Sarsam, B. Chew, S. Kazi, Laminar convective heat transfer of hexylamine-treated MWCNTs-based turbine oil nanofluid, Energy Conversion and Management, 105 (2015) 355-367.
[3] A. Amiri, M. Shanbedi, A.R. Rafieerad, M. M. Rashidi, Tuan Zaharinie, M. N. Mohd Zubir , S.N. Kazi , B.T. Chew, Functionalization and exfoliation of graphite into mono layer graphene for improved heat dissipation, Journal of the Taiwan Institute of Chemical Engineers, (2017), Doi: http://dx.doi.org/10.1016/j.jtice.2016.12.009
[4] A. Amiri, G. Ahmadi, M. Shanbedi, M. Etemadi, M.N.M. Zubir, B. Chew, S. Kazi, Heat transfer enhancement of water-based highly crumpled few-layer graphene nanofluids, RSC Advances, 6 (2016) 105508-105527.
[5] A. Amiri, M. Shanbedi, H. Amiri, S.Z. Heris, S. Kazi, B. Chew, H. Eshghi, Pool boiling heat transfer of CNT/water nanofluids, Applied Thermal Engineering, 71 (2014) 450-459.
[6] A. Amiri, H.K. Arzani, S. Kazi, B. Chew, A. Badarudin, Backward-facing step heat transfer of the turbulent regime for functionalized graphene nanoplatelets based water–ethylene glycol nanofluids, International Journal of Heat and Mass Transfer, 97 (2016) 538-546. [7] A. Amiri, M. Shanbedi, G. Ahmadi, H. Eshghi, S. Kazi, B. Chew, M. Savari, M.N.M. Zubir, Mass production of highly-porous graphene for high-performance supercapacitors, Scientific Reports-Nature, 6 (2016), 32686.
[8] A. Amiri, G. Ahmadi, M. Shanbedi, M. Savari, S. Kazi, B. Chew, Microwave-assisted synthesis of highly-crumpled, few-layered graphene and nitrogen-doped graphene for use as high-performance electrodes in capacitive deionization, Scientific Reports-Nature, 5 (2015), 17503.
[9] A. Amiri, R. Sadri, M. Shanbedi, G. Ahmadi, B. Chew, S. Kazi, M. Dahari, Performance dependence of thermosyphon on the functionalization approaches: an experimental study on thermo-physical properties of graphene nanoplatelet-based water nanofluids, Energy Conversion and Management, 92 (2015) 322-330.
[10] A. Amiri, R. Sadri, M. Shanbedi, G. Ahmadi, S. Kazi, B. Chew, M.N.M. Zubir, Synthesis of ethylene glycol-treated graphene nanoplatelets with one-pot, microwave-assisted functionalization for use as a high performance engine coolant, Energy Conversion and Management, 101 (2015) 767-777.
[11] A. Amiri, S. Kazi, M. Shanbedi, M.N.M. Zubir, H. Yarmand, B. Chew, Transformer oil based multi-walled carbon nanotube–hexylamine coolant with optimized electrical, thermal and rheological enhancements, RSC Advances, 5 (2015) 107222-107236.
Univers
ity of
Mala
ya
358
[12] A. Amiri, R. Sadri, G. Ahmadi, B. Chew, S. Kazi, M. Shanbedi, M.S. Alehashem, Synthesis of polyethylene glycol-functionalized multi-walled carbon nanotubes with a microwave-assisted approach for improved heat dissipation, RSC Advances, 5 (2015) 35425-35434.
[13] A. Amiri, M. Shanbedi, G. Ahmadi, H. Eshghi, B. Chew, S. Kazi, Microwave-assisted direct coupling of graphene nanoplatelets with poly ethylene glycol and 4-phenylazophenol molecules for preparing stable-colloidal system, Colloids and Surfaces A: Physicochemical and Engineering Aspects, 487 (2015) 131-141.
[14] A. Amiri, M. Shanbedi, M. Savari, B. Chew, S. Kazi, Cadmium ion sorption from aqueous solutions by high surface area ethylenediaminetetraacetic acid-and diethylene triamine pentaacetic acid-treated carbon nanotubes, RSC Advances, 5 (2015) 71144-71152.
Collaborative article
[1] H.K. Arzani, A. Amiri, H.K. Arzani, S.B. Rozali, S. Kazi, A. Badarudin, Toward improved heat transfer performance of annular heat exchangers with water/ethylene glycol-based nanofluids containing graphene nanoplatelets, Journal of Thermal Analysis and Calorimetry, 126 (2016) 1427-1436.
[2] H.K. Arzani, A. Amiri, S. Kazi, A. Badarudin, B. Chew, Heat transfer performance of water-based tetrahydrofurfuryl polyethylene glycol-treated graphene nanoplatelet nanofluids, RSC Advances, 6 (2016) 65654-65669.
[3] H.K. Arzani, A. Amiri, S. Kazi, B. Chew, A. Badarudin, Experimental and numerical investigation of thermophysical properties, heat transfer and pressure drop of covalent and noncovalent functionalized graphene nanoplatelet-based water nanofluids in an annular heat exchanger, International communications in heat and mass transfer, 68 (2015) 267-275.
[4] H.K. Arzani, A. Amiri, S. Kazi, B. Chew, A. Badarudin, Experimental investigation of thermophysical properties and heat transfer rate of covalently functionalized MWCNT in an annular heat exchanger, International communications in heat and mass transfer, 75 (2016) 67-77.
[5] W.S. Sarsam, A. Amiri, S. Kazi, A. Badarudin, Stability and thermophysical properties of non-covalently functionalized graphene nanoplatelets nanofluids, Energy Conversion and Management, 116 (2016) 101-111.
[6] W.S. Sarsam, A. Amiri, M.N.M. Zubir, H. Yarmand, S. Kazi, A. Badarudin, Stability and thermophysical properties of water-based nanofluids containing triethanolamine-treated graphene nanoplatelets with different specific surface areas, Colloids and Surfaces A: Physicochemical and Engineering Aspects, 500 (2016) 17-31.
[7] M. Savari, S. Rashidi, A. Amiri, M. Shanbedi, S. Zeinali Heris, S. Kazi, Hydrodynamic and thermal performance prediction of functionalized MWNT-based water nanofluids under the laminar flow regime using the adaptive neuro-fuzzy inference system, Numerical Heat Transfer, Part A: Applications, (2016) 1-14.
Univers
ity of
Mala
ya
359
[8] M. Shanbedi, S.Z. Heris, A. Amiri, E. Hosseinipour, H. Eshghi, S. Kazi, Synthesis of aspartic acid-treated multi-walled carbon nanotubes based water coolant and experimental investigation of thermal and hydrodynamic properties in circular tube, Energy Conversion and Management, 105 (2015) 1366-1376.
[9] K. Solangi, A. Amiri, M. Luhur, S.A.A. Ghavimi, S. Kazi, A. Badarudin, M.N.M. Zubir, Experimental investigation of heat transfer performance and frictional loss of functionalized GNP-based water coolant in a closed conduit flow, RSC Advances, 6 (2016) 4552-4563.
[10] K. Solangi, A. Amiri, M. Luhur, S.A.A. Ghavimi, M.N.M. Zubir, S. Kazi, A. Badarudin, Experimental investigation of the propylene glycol-treated graphene nanoplatelets for the enhancement of closed conduit turbulent convective heat transfer, International communications in heat and mass transfer, 73 (2016) 43-53.
[11] K. Solangi, S. Kazi, M. Luhur, A. Badarudin, A. Amiri, R. Sadri, M. Zubir, S. Gharehkhani, K. Teng, A comprehensive review of thermo-physical properties and convective heat transfer to nanofluids, Energy, 89 (2015) 1065-1086.
[12] K. Teng, A. Amiri, S. Kazi, M. Bakar, B. Chew, Fouling mitigation on heat exchanger surfaces by EDTA-treated MWCNT-based water nanofluids, Journal of the Taiwan Institute of Chemical Engineers, 60 (2016) 445-452.
[13] K. Teng, A. Amiri, S. Kazi, M. Bakar, B. Chew, A. Al-Shamma’a, A. Shaw, Retardation of heat exchanger surfaces mineral fouling by water-based diethylenetriamine pentaacetate-treated CNT nanofluids, Applied Thermal Engineering, 110 (2017) 495-503.
[14] H. Zare‐Zardini, A. Amiri, M. Shanbedi, A. Taheri‐Kafrani, S. Kazi, B. Chew, A. Razmjou, In vitro and in vivo study of hazardous effects of Ag nanoparticles and Arginine‐treated multi walled carbon nanotubes on blood cells: Application in hemodialysis membranes, Journal of Biomedical Materials Research Part A, 103 (2015) 2959-2965.
[15] M.N.M. Zubir, A. Badarudin, S.N. Kazi, M. Misran, R. Ibrahim, A. Amiri, R. Sadri, Exploration of the environmentally benign and highly effective approach for improving carbon nanotube homogeneity in aqueous system, Journal of Thermal Analysis and Calorimetry, 124 (2016) 815-825.
[16] A. Amiri, H.K. Arzani, S. Kazi, B. Chew, Numerical Heat Transfer Performance of Water-Based Graphene Nanoplatelets, Numerical Heat Transfer, 3 (2016) 54948.
Book Chapters
[1] Ahmad Amiri, Hadi Zare-Zardini, Mehdi Shanbedi, Salim Newaz Kazi, Asghar Taheri-Kafrani, Bee Teng Chew and Ali Zarrabi, Microbial toxicity of different functional groups-treated carbon nanotubes, chapter 2, Surface Chemistry of Nanobiomaterials Applications of Nanobiomaterials, vol. 3, Elsevier, ISBN: 978-0-323-42861-3, 2016.
Univers
ity of
Mala
ya

360
[2] Mehdi Shanbedi, Ahmad Amiri, Saeed Zeinali Heris, Salim Newaz Kazi, and Chew Bee Teng, Nanofluids: Basic Principles and Modern Aspects, chapter 57, Encyclopedia of Nanotechnology, CRC Press, Taylor & Francis, 2016. Conference
[1] Ahmad Amiri, Hamed K Arzani, SN Kazi, BT Chew, Numerical Heat Transfer Performance of Water-Based Graphene Nanoplatelets, World Academy of Science, Engineering and Technology International Journal of Chemical, Molecular, Nuclear, Materials and Metallurgical Engineering 2016, 10, 10-16. [2] Ahmad Amiri, Chew Bee Teng, S. N. Kazi, Mass production of few-layer graphene, Putrajaya International Built Environment, Technology and Engineering Conference, PIBEC 2016, 1, 58-62. [3] BT Chew, SN Kazi, A Amiri, Adaptive Thermal Comfort Model for Air-Conditioned Lecture Halls in Malaysia, World Academy of Science, Engineering and Technology, International Journal of Civil, Environmental, Structural, Construction and Architectural Engineering, 2015, 9, 150-157.
Univers
ity of
Mala
ya