UNIVERSITY OF MISSOURI SYSTEM - Fiscal Year 2017 … · university of missouri system fiscal year...
30
UNIVERSITY OF MISSOURI SYSTEM FISCAL YEAR 2017 RATES STUDENT HOUSING, ACTIVITY, FACILITY, AND HEALTH SERVICE FEES Office of Budget & Planning University of Missouri System
Transcript of UNIVERSITY OF MISSOURI SYSTEM - Fiscal Year 2017 … · university of missouri system fiscal year...
UNIVERSITY OF MISSOURI SYSTEM FISCAL YEAR 2017 RATES
STUDENT HOUSING, ACTIVITY, FACILITY, AND HEALTH SERVICE FEES
Office of Budget & Planning University of Missouri System
University of Missouri System Fiscal Year 2017 Rates
Student Housing, Activity, Facility, and Health Service Fees Table of Contents Page
Overview ................................................................................................................................... 1 Table 1. University of Missouri Academic Year Resident Undergraduate Student Fees............... 1
Housing System Highlights ...................................................................................................... 2
Table 2. Summary of Housing Contracts Effective Beginning Summer 2016 ...................... 3 Table 2a. Changes in Housing Contracts, MU ......................................................................... 8 Table 2b. Changes in Housing Contracts, UMKC ................................................................. 10 Table 2c. Changes in Housing Contracts, S&T ..................................................................... 12 Table 2d. Changes in Housing Contracts, UMSL .................................................................. 14 Table 3. Summary of Housing System Financial Plans, System Total ................................ 18
Table 3a. Summary of Housing System Financial Plans, MU ............................................... 19 Table 3b. Summary of Housing System Financial Plans, UMKC ......................................... 20 Table 3c. Summary of Housing System Financial Plans, S&T ............................................. 21 Table 3d. Summary of Housing System Financial Plans, UMSL .......................................... 22
Activity, Facility, and Health Service Fee Highlights ............................................................ 23
Table 4. Changes in Student Activity, Facility, and Health Service Fees for FY2017, UM ....... 25 Table 4a. Student Activity, Facility, and Health Service Fees, MU ...................................... 26
Table 4b. Student Activity, Facility, and Health Service Fees, UMKC ................................ 27 Table 4c. Student Activity, Facility, and Health Service Fees, S&T ..................................... 28

1
Overview
This document contains the approved rates for student housing, activity, facility, and health service
fees for fiscal year 2017 and other supporting materials as submitted by each campus in the University of
Missouri System. This information was prepared in support of housing fee changes that become effective
in the Summer Session 2016 and activity, facility, and health service fee changes that become effective in
Fall Session 2016.
The fee proposals were prepared under the direction of the Vice Chancellors or Vice Provosts for
Student Affairs on each campus. Planning for fee changes is conducted using operating assumptions unique
to each campus and activity, within the context of general economic guidelines communicated by the
Assistant Vice President of Budget and Planning. The appropriate advisory groups, affected students,
and/or their elected officers reviewed and approved the activity, facility, and health service fee proposals.
Student housing rate proposals were developed with input from the affected students and the Residence
Hall Associations. These groups had the opportunity to review, ask questions, and provide comments as
the proposed room and board rates and plans were developed.
These rate changes are in compliance with Higher Education Student Funding Act (HESFA,
SB389) (section 173.1003; RSMO) unless otherwise noted. FY2017 total tuition and required fees will
increase below the rate of inflation at 0.1% for MU, UMKC and S&T. Total tuition and required fees for
UMSL remain the same. UMSL has a comprehensive tuition rate that combines per credit hour tuition rates
with activity, facility, and health service fees which are charged to all students. As a result, there will be
no separate assessment of activity, facility, and health services fees for UMSL in FY2014 and beyond.
Table 1 shows a summary of Board approved tuition and required fees and room and board charges for
academic year 2017 compared to 2016.

2
Housing System Highlights
Room and Board Contract Rates
Room and board charges vary across the four campuses and within each campus based on the
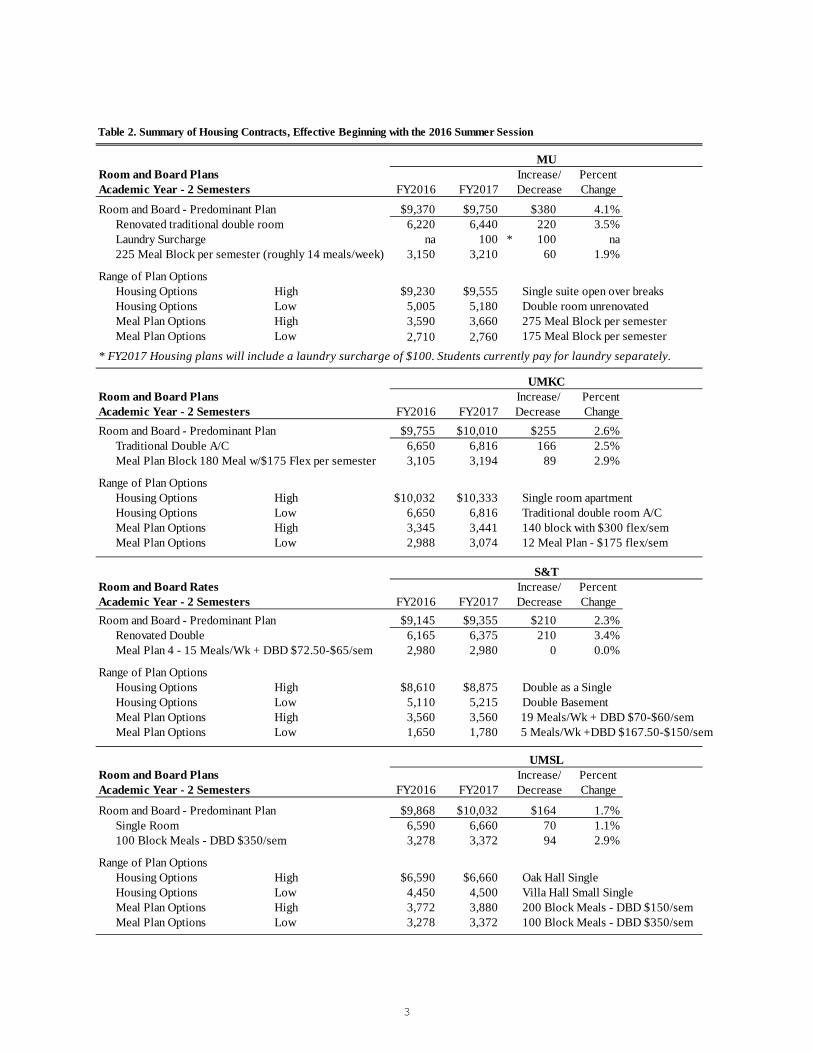
residence facility and meal plan selected by the student. Table 2 summarizes the approved changes in the
predominant room and board plans on each campus as well as showing the range of plans available. Based
on the predominant room and board plan on each campus, rates increase by 4.1% at MU, 2.6% at UMKC,
2.3% at S&T, and 1.7% at UMSL. These increases are driven by various factors that impact housing and
dining differently and the campus operations differently including but not limited to utility costs, debt
service, food costs, labor costs, and contractual arrangements with third party vendors. Tables 2a - 2d detail
the type of rooms and meal plans that are available on each campus as well as the approved rates for each
plan.
Table 1. University of Missouri Academic Year Resident Undergraduate Student Fees
MU UMKC S&T UMSLPercent Percent Percent Percent
2016 2017 Increase 2016 2017 Increase 2016 2017 Increase 2016 2017 IncreaseTuition $8,286 $8,286 0.0% $8,169 $8,169 0.0% $8,286 $8,286 0.0% $10,065 $10,065 0.0%Information Technology Fee 393 396 0.8% 411 414 0.7% 417 420 0.7% n/a (3) n/a (3) n/a (3)
Student Activity, Facility & Health Fee 830 836 0.6% 973 980 0.7% 917 923 0.7% n/a (3) n/a (3) n/a (3)
Total Tuition and Required Fees (1) 9,509 9,518 0.1% 9,553 9,563 0.1% 9,620 9,629 0.1% 10,065 10,065 0.0%Room & Board (2) 9,370 9,750 4.1% 9,755 10,010 2.6% 9,145 9,355 2.3% 9,868 10,032 1.7% Total including Room and Board $18,879 $19,268 2.1% $19,308 $19,573 1.4% $18,765 $18,984 1.2% $19,933 $20,097 0.8%
Notes:(1) Based on required fees for a resident undergraduate student at fifteen credit hours per semester for two semesters. Excludes special course fees.(2) Predominant plan as submitted by each campus. (3) UMSL will no longer be separately assessing information technology, activity, facility and health service fees. They were incorporated into the tuition rate
beginning in FY2014.
3
Table 2. Summary of Housing Contracts, Effective Beginning with the 2016 Summer Session
MURoom and Board Plans Increase/ PercentAcademic Year - 2 Semesters FY2016 FY2017 Decrease Change
Room and Board - Predominant Plan $9,370 $9,750 $380 4.1%Renovated traditional double room 6,220 6,440 220 3.5%Laundry Surcharge na 100 * 100 na225 Meal Block per semester (roughly 14 meals/week) 3,150 3,210 60 1.9%
Range of Plan OptionsHousing Options High $9,230 $9,555 Single suite open over breaksHousing Options Low 5,005 5,180 Double room unrenovatedMeal Plan Options High 3,590 3,660 275 Meal Block per semesterMeal Plan Options Low 2,710 2,760 175 Meal Block per semester
* FY2017 Housing plans will include a laundry surcharge of $100. Students currently pay for laundry separately.
UMKCRoom and Board Plans Increase/ PercentAcademic Year - 2 Semesters FY2016 FY2017 Decrease ChangeRoom and Board - Predominant Plan $9,755 $10,010 $255 2.6%
Traditional Double A/C 6,650 6,816 166 2.5%Meal Plan Block 180 Meal w/$175 Flex per semester 3,105 3,194 89 2.9%
Range of Plan OptionsHousing Options High $10,032 $10,333 Single room apartmentHousing Options Low 6,650 6,816 Traditional double room A/CMeal Plan Options High 3,345 3,441 140 block with $300 flex/semMeal Plan Options Low 2,988 3,074 12 Meal Plan - $175 flex/sem
S&TRoom and Board Rates Increase/ PercentAcademic Year - 2 Semesters FY2016 FY2017 Decrease ChangeRoom and Board - Predominant Plan $9,145 $9,355 $210 2.3%
Renovated Double 6,165 6,375 210 3.4%Meal Plan 4 - 15 Meals/Wk + DBD $72.50-$65/sem 2,980 2,980 0 0.0%
Range of Plan OptionsHousing Options High $8,610 $8,875 Double as a SingleHousing Options Low 5,110 5,215 Double BasementMeal Plan Options High 3,560 3,560 19 Meals/Wk + DBD $70-$60/semMeal Plan Options Low 1,650 1,780 5 Meals/Wk +DBD $167.50-$150/sem
UMSLRoom and Board Plans Increase/ PercentAcademic Year - 2 Semesters FY2016 FY2017 Decrease Change
Room and Board - Predominant Plan $9,868 $10,032 $164 1.7%Single Room 6,590 6,660 70 1.1%100 Block Meals - DBD $350/sem 3,278 3,372 94 2.9%
Range of Plan OptionsHousing Options High $6,590 $6,660 Oak Hall SingleHousing Options Low 4,450 4,500 Villa Hall Small SingleMeal Plan Options High 3,772 3,880 200 Block Meals - DBD $150/semMeal Plan Options Low 3,278 3,372 100 Block Meals - DBD $350/sem
4
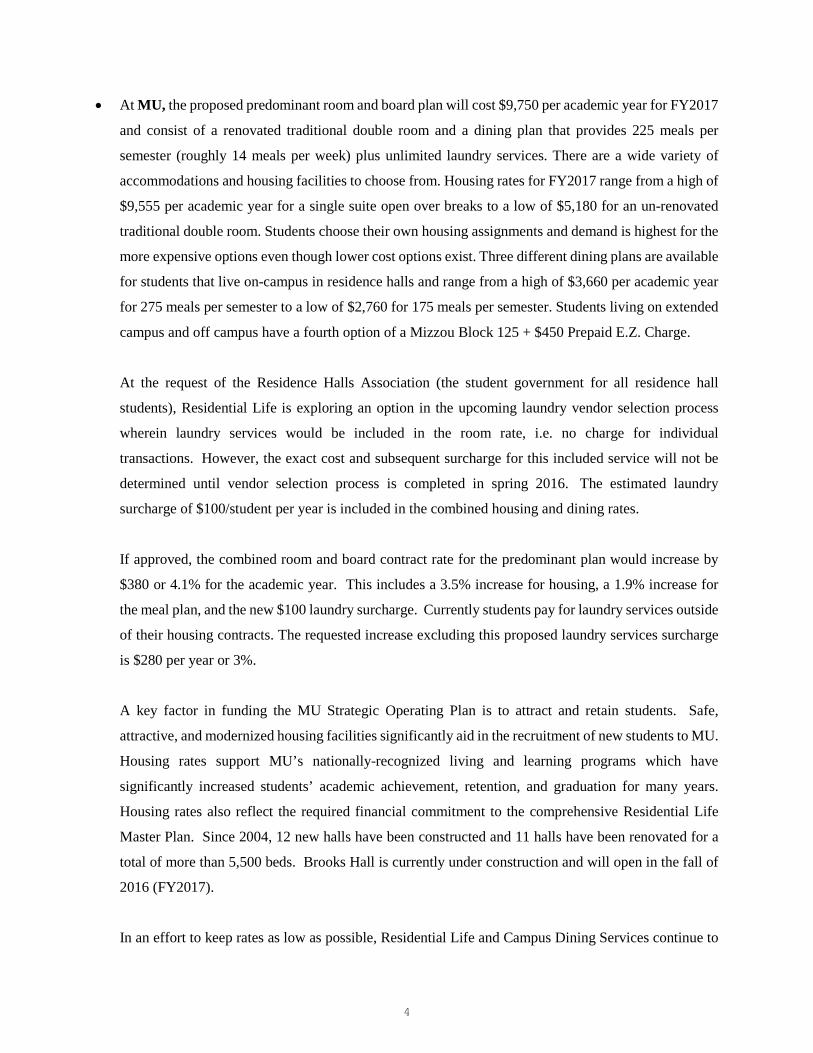
• At MU, the proposed predominant room and board plan will cost $9,750 per academic year for FY2017
and consist of a renovated traditional double room and a dining plan that provides 225 meals per
semester (roughly 14 meals per week) plus unlimited laundry services. There are a wide variety of
accommodations and housing facilities to choose from. Housing rates for FY2017 range from a high of
$9,555 per academic year for a single suite open over breaks to a low of $5,180 for an un-renovated
traditional double room. Students choose their own housing assignments and demand is highest for the
more expensive options even though lower cost options exist. Three different dining plans are available
for students that live on-campus in residence halls and range from a high of $3,660 per academic year
for 275 meals per semester to a low of $2,760 for 175 meals per semester. Students living on extended
campus and off campus have a fourth option of a Mizzou Block 125 + $450 Prepaid E.Z. Charge.
At the request of the Residence Halls Association (the student government for all residence hall
students), Residential Life is exploring an option in the upcoming laundry vendor selection process
wherein laundry services would be included in the room rate, i.e. no charge for individual
transactions. However, the exact cost and subsequent surcharge for this included service will not be
determined until vendor selection process is completed in spring 2016. The estimated laundry
surcharge of $100/student per year is included in the combined housing and dining rates.
If approved, the combined room and board contract rate for the predominant plan would increase by
$380 or 4.1% for the academic year. This includes a 3.5% increase for housing, a 1.9% increase for
the meal plan, and the new $100 laundry surcharge. Currently students pay for laundry services outside
of their housing contracts. The requested increase excluding this proposed laundry services surcharge
is $280 per year or 3%.
A key factor in funding the MU Strategic Operating Plan is to attract and retain students. Safe,
attractive, and modernized housing facilities significantly aid in the recruitment of new students to MU.
Housing rates support MU’s nationally-recognized living and learning programs which have
significantly increased students’ academic achievement, retention, and graduation for many years.
Housing rates also reflect the required financial commitment to the comprehensive Residential Life
Master Plan. Since 2004, 12 new halls have been constructed and 11 halls have been renovated for a
total of more than 5,500 beds. Brooks Hall is currently under construction and will open in the fall of
2016 (FY2017).
In an effort to keep rates as low as possible, Residential Life and Campus Dining Services continue to

5
look for efficiencies and opportunities to reduce costs. For example, dining plan rates are proposed to
increase only 1.9% even though food and labor costs, the primary costs for Campus Dining Services,
are expected to increase more than 4%. The difference is offset by additional revenue from more
students living on campus and increased sales at the MU Student Center and other retail locations. In
addition, cost reduction efforts such as more effective application of inventory management software;
product, menu, and service adjustments, savings from vendor contracts, and decreased one-time costs
for repair and maintenance of facilities and equipment help keep dining costs down. Various cost-
containment efforts in Residential Life have resulted in nearly static or reduced expenses in most areas
beyond compensation, debt service (related to new construction within the Residential Life Master
Plan), and utilities. Strategic investments in more energy-efficient appliances continue to be essential
to address increasing utility rates. In addition, changes in cleaning methods and equipment and
inventory management have reduced cleaning times and use of cleaning chemicals while maintaining
or improving cleanliness standards. Residential Life continues to spend less on postage and printing
due to their use of electronic and social media to communicate and less on computer purchases due to
their continued efforts to recycle equipment within the department to lower demand/less critical
applications versus purchase of new equipment. Residential Life is also expanding efforts to increase
revenue during the spring and summer months. While residence halls and apartments have been
operating at nearly 100% of capacity at the start of the academic year, Residential Life will be more
aggressively marketing spring semester move-in to new students enrolling at MU that semester, as well
as students returning from Study Abroad, exchange, or other programs. Finally, with newer/renovated
facilities, Residential Life has been actively courting more summer camps and conferences to utilize
facilities during summer months to increase revenues that generate more than $1 million dollars
annually.
Graduate and family student apartments rates will increase approximately 2% depending on facility
and room type, but will remain well below market rate.
• The predominant room and board plan at UMKC for FY2017 will cost $10,010 per academic year and
consists of a traditional double room and a 180 block meal plan with $175 in Flex cash per semester.
This is an increase of 2.6% over FY2016. Room rates for regular academic year will increase from
2.5%-3.0%. Room rates vary by type of room ranging from a high of $10,333 for a single apartment to
a low of $6,816 for a traditional double room. Starting FY2017 (summer 2016), summer rates will be
based on the academic year daily rate which is determined by the corresponding academic year rate
6
divided by check in/out dates in the academic year. The standard summer term (57 days) will be
computed based on the daily rate.
UMKC food service is outsourced to a third party vendor. Meal plan rates will increase by 2.9% per
adjustment clauses in the third party contract. Five different meal plans are available ranging from a
high of $3,441 per academic year for a 140 meal block with $300 in Flex cash per semester to a low of
$3,074 for 12 meals per week with $175 in Flex cash per semester.
• In FY2017, Missouri S&T’s leased residence facilities including North Pine, Rollamo, and Sands will
no longer be under contract resulting in a decrease of 285 beds. A new residence facility, University
Commons will open in August 2016 with an increase of 448 beds. The net change of the residence hall
capacity is an increase of 163 beds.
The predominant room and board plan at Missouri S&T for FY2017 will cost $9,355 per academic
year and consists of a renovated double room and 15 meals per week plus $65 declining balance dollars
per semester. The increase in the predominant room and board plan at Missouri S&T is 2.3% or $210
for the academic year. Housing rate increases range from 2.1% to 3.6% for residence halls and 4.6%
for Miner Village apartments. Room rates range from a high of $8,875 for a double as a single suite,
to a low of $5,215 for a double basement room.
Seven different meal plans are available ranging from a high of $3,560 for 19 meals per week with $60
declining balance per semester to a low of $1,780 for five meals per week with $150 declining balance
per semester. The cost of most meal plans, including the predominate plan, remain the same, with a
small decrease in the declining balance amount ranging from $0 to $25 depending on the plan. The rate
for Meal Plan 2, a 300 meal block plus $110 declining balance, will decrease by 8.4% and a $10
decrease in the declining balance amount. Meal Plan 7, five meals per week plus $167.50 declining
balance per semester, will increase by 7.9% and the declining balance decreases by $17.50. Missouri
S&T uses a third party vendor for dining services.
• The predominant room and board plan at UMSL for FY2017 will increase 1.7% or $164 and will cost
$10,032 per academic year. The predominant plan consists of a single room in Oak Hall and a 100
block meal plan plus $350 declining balance dollars per semester.

7
Housing rate increases range from 0.8% to 1.1% for FY2017. Rates for LeGras Hall will remain
unchanged. Housing options range from a high of $6,660 for a single room in Oak Hall to a low of
$4,500 for a small single room in Villa Hall.
UMSL’s meal plans are contracted with a third party food service provider. Four meal plans are offered
and range from a low of $3,372 per academic year for a 100 meal block with a $350 declining balance
per semester to a high of $3,880 for a 200 meal block with a $150 declining balance per semester. Meal
plan costs will increase by 2.9%.
Family Housing
The increases in rates for family student housing are 1.1% to 2.3% at MU. UMSL’s rates will remain
unchanged for the FY2017 academic year. UMKC and S&T do not offer family housing.

8
Table 2a. MU, Approved Changes in Housing & Dining Contract Rates Effective Beginning with the 2016 Summer Session
Room and Board Plans Increase/ PercentAcademic Year - 2 Semesters FY2016 FY2017 Decrease Change
Predominant PlanRoom and Board $9,370 $9,750 $380 4.1%
Renovated traditional double room 6,220 6,440 220 3.5%Laundry Surcharge na 100 100 na225 Meal Block per semester 3,150 3,210 60 1.9%
Meal Plans OptionsRegular Academic Year (Two Semesters)
275 Meal Block per semester $3,590 $3,660 $70 1.9%225 Meal Block per semester 3,150 3,210 60 1.9%175 Meal Block per semester 2,710 2,760 50 1.8%125 Meal Block per semester including $450 2,710 2,760 50 1.8%prepaid EZ charge
Summer Session (Eight Weeks)140 Meal Block per semester $915 $935 $20 2.2%114 Meal Block per semester 800 815 15 1.9%88 Meal Block per semester 685 695 10 1.5%
Laundry surcharge na $100 $100 na
Housing Options **Regular Academic Year (Two Semesters)Suite Style
Semi-Suite Single $8,985 $9,300 $315 3.5%Single w/bath 8,985 9,300 315 3.5%Suite Single 8,985 9,300 315 3.5%Single (traditional) 7,875 8,150 275 3.5%Double 7,380 7,640 260 3.5%Double (traditional) 6,220 6,440 220 3.5%Semi-Suite Double 7,380 7,640 260 3.5%Suite Double 7,880 8,155 275 3.5%Extended Campus 6,830 7,070 240 3.5%
Renovated TraditionalSingle $7,875 $8,150 $275 3.5%Double 6,220 6,440 220 3.5%
Unrenovated TraditionalSingle ( Lathrop, Laws) $6,660 $6,895 $235 3.5%Double (Lathrop, Laws) 5,005 5,180 175 3.5%
** Rooms open over breaks cost $255 more per year.
Residential Life is exploring an option in the upcoming laundry vendor selection process wherein laundry services would be included in the room rate. The laundry surcharge is estimated to be $100/student per year in FY2017. Currently residents pay for laundry outside of their housing contracts.
9
MU Changes in Housing & Dining Contract Rates (continued)
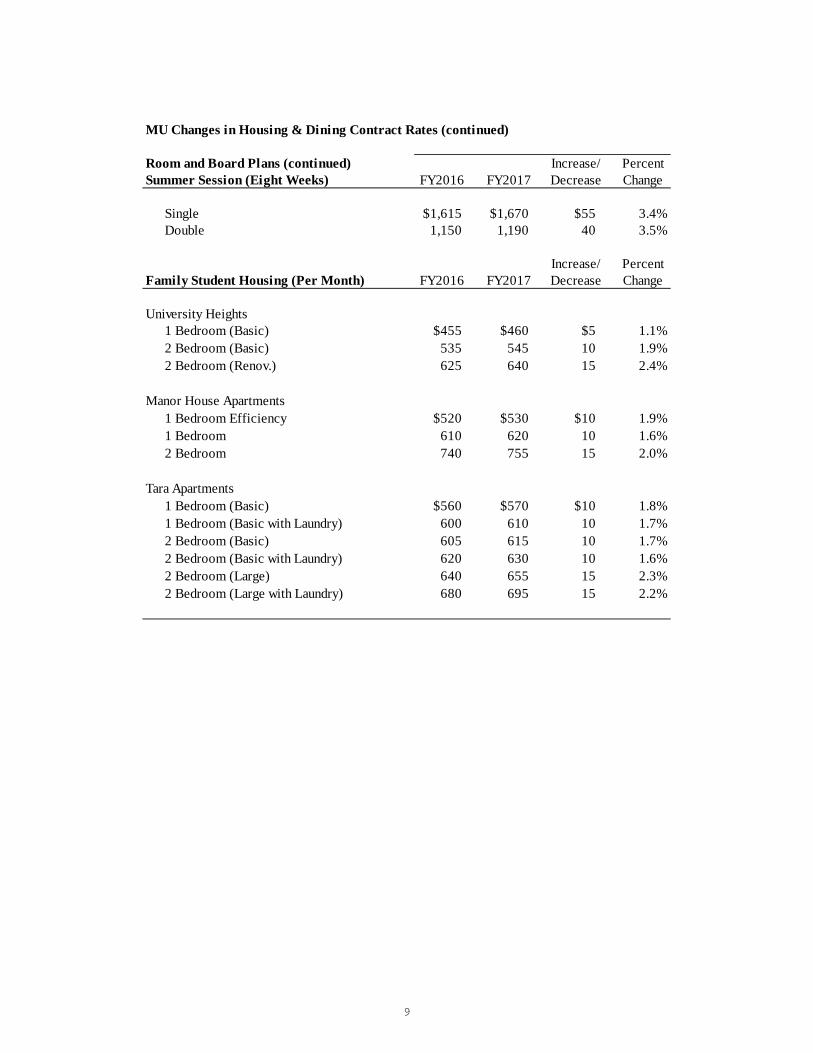
Room and Board Plans (continued) Increase/ PercentSummer Session (Eight Weeks) FY2016 FY2017 Decrease Change
Single $1,615 $1,670 $55 3.4%Double 1,150 1,190 40 3.5%
Increase/ PercentFamily Student Housing (Per Month) FY2016 FY2017 Decrease Change
University Heights1 Bedroom (Basic) $455 $460 $5 1.1%2 Bedroom (Basic) 535 545 10 1.9%2 Bedroom (Renov.) 625 640 15 2.4%
Manor House Apartments1 Bedroom Efficiency $520 $530 $10 1.9%1 Bedroom 610 620 10 1.6%2 Bedroom 740 755 15 2.0%
Tara Apartments1 Bedroom (Basic) $560 $570 $10 1.8%1 Bedroom (Basic with Laundry) 600 610 10 1.7%2 Bedroom (Basic) 605 615 10 1.7%2 Bedroom (Basic with Laundry) 620 630 10 1.6%2 Bedroom (Large) 640 655 15 2.3%2 Bedroom (Large with Laundry) 680 695 15 2.2%

10
Table 2b. UMKC, Approved Changes in Housing & Dining Contract Rates Effective Beginning with the 2016 Summer Session
Room and Board Plans Increase/ PercentAcademic Year - 2 Semesters FY2016 FY2017 Decrease Change
Predominant PlanRoom and Board $9,755 $10,010 $255 2.6%
Traditional Double - A/C 6,650 6,816 166 2.5%Meal Plan Block 180 Meal w/$175 Flex per sem 3,105 3,194 89 2.9%
Meal Plans DefinedMeal Plan 1 - 15 meal - w/$125 Flex/sem $3,122 $3,212 $90 2.9%Meal Plan 2 - 12 meal - w/$175 Flex/sem 2,988 3,074 86 2.9%Meal Plan 3 - 180 Block Meal w/ $175 Flex/sem 3,105 3,194 89 2.9%Meal Plan 4 - 160 Block Meal w/$200 Flex/sem 3,105 3,194 89 2.9%Meal Plan 5 - 140 Block Meal w/$300 Flex/sem 3,345 3,441 96 2.9%
Housing Options - Regular Academic Year (Two Semesters)
Johnson HallDouble A/C $6,650 $6,816 $166 2.5%Single Private Bath A/C 8,406 8,616 210 2.5%Single Shared Bath A/C 8,222 8,428 206 2.5%
Oak Street EastDouble A/C $6,650 $6,816 $166 2.5%Single Private Bath A/C 8,406 8,616 210 2.5%Single Shared Bath A/C 8,222 8,428 206 2.5%
Oak Place AptsQuad Apt $7,824 $8,059 $235 3.0%Double Apt 9,082 9,354 272 3.0%Single Apt 10,020 10,320 301 3.0%
Quad Apts $7,972 $8,211 $239 3.0%Double Apt 9,085 9,357 273 3.0%Single Apt 10,032 10,333 301 3.0%
Hospital Hill Apts

11
UMKC Changes in Housing & Dining Contract Rates (continued)
Increase/ PercentSummer Session FY2016 FY2017 Decrease ChangeOak Street East - Room Only
Double A/C $1,798 $1,619 ($179) -10.0%Single Private Bath A/C n/a 2,046 n/a n/aSingle Shared Bath A/C 1,467 2,002 535 36.4%
Johnson Hall - Room OnlyDouble A/C $1,798 $1,619 ($179) -10.0%Single Private Bath A/C 1,467 2,046 579 39.5%Single Shared Bath A/C n/a 2,002 n/a n/a
Oak Place AptsQuad Apt $1,475 $1,708 $233 15.8%Double Apt 1,712 1,982 270 15.8%Single Apt 1,910 2,187 277 14.5%
Hospital Hill AptsQuad Apt $1,594 $1,740 $146 9.2%Double Apt 1,800 1,983 183 10.2%Single Apt 2,006 2,190 184 9.2%

12
Table 2c. Missouri S&T, Approved Changes in Housing & Dining Contract Rates Effective Beginning with the 2016 Summer Session
Room and Board Rates Increase/ PercentAcademic Year - 2 Semesters FY2016 FY2017 Decrease Change
Predominant PlanRoom and Board $9,145 $9,355 $210 2.3%
Thomas Jefferson North Renovated Double 6,165 6,375 210 3.4%Meal Plan 4 15 Meals/Wk + DBD $72.50-$65/sem 2,980 2,980 0 0.0%
Meal Plans DefinedMeal Plan 1 $1805 Declining Balance Dollars (DBD) $2,750 $2,750 $0 0.0%Meal Plan 2 300 Meal Block + DBD $110-$100/sem 3,165 2,900 (265) -8.4%Meal Plan 3 19 Meals/Wk + DBD $70-$60/sem 3,560 3,560 0 0.0%Meal Plan 4 15 Meals/Wk + DBD $72.50-$65/sem 2,980 2,980 0 0.0%Meal Plan 5 12 Meals/Wk + DBD $167.50-$150/sem 2,900 2,900 0 0.0%Meal Plan 6 10 Meals/Wk + DBD $225-$200/sem 2,900 2,900 0 0.0%Meal Plan 7 5 Meals/Wk + DBD $167.50-$150/sem 1,650 1,780 130 7.9%
Housing Options - Regular Academic Year (Two Semesters)
Farrar Hall Co-opDouble $6,245 $6,375 $130 2.1%Single 7,710 7,870 160 2.1%Double Basement 5,110 5,215 105 2.1%
Residential College SuitesDouble $7,085 $7,305 $220 3.1%Single 8,465 8,725 260 3.1%Single in Triple Suite 7,755 n/a n/a n/aDouble Deluxe 7,660 7,895 235 3.1%Double as a Single 8,610 8,875 265 3.1%
Thomas Jefferson NorthDouble Room $6,165 $6,375 $210 3.4%Single Room 7,595 7,870 275 3.6%
Thomas Jefferson SouthDouble Room $6,285 $6,510 $225 3.6%Large Double Room 6,500 6,735 235 3.6%Single Room 7,735 8,015 280 3.6%
Miner Village Apartments4 Bedroom Apartments $7,050 $7,375 $325 4.6%2 Bedroom Apartments 7,585 7,935 350 4.6%
North Pine (1)2 BR Apt Double $6,490 n/a n/a n/a2 BR Apt Single 7,550 n/a n/a n/a3 BR Apt Single 7,550 n/a n/a n/a2 BR Townhouse Dbl 6,490 n/a n/a n/a2 BR Townhouse Sgl 7,550 n/a n/a n/aEfficiency Single 6,490 n/a n/a n/a
13
S&T Changes in Housing & Dining Contract Rates (continued)
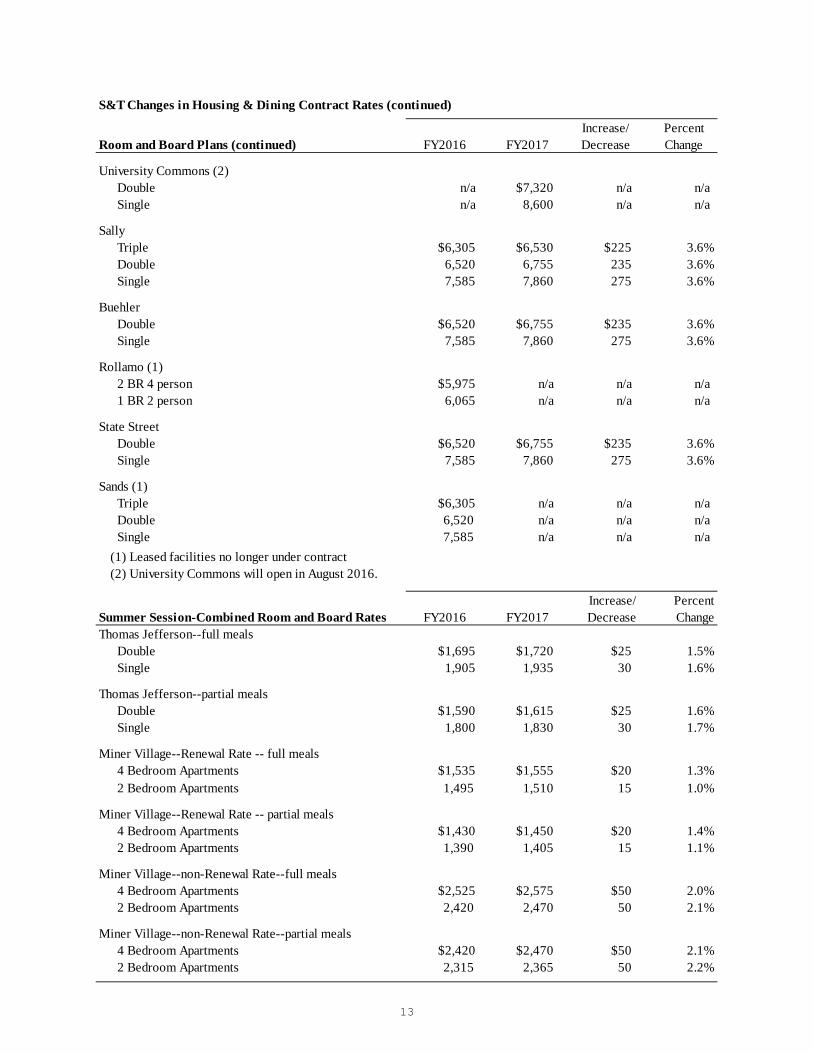
Increase/ PercentRoom and Board Plans (continued) FY2016 FY2017 Decrease Change
University Commons (2)Double n/a $7,320 n/a n/aSingle n/a 8,600 n/a n/a
SallyTriple $6,305 $6,530 $225 3.6%Double 6,520 6,755 235 3.6%Single 7,585 7,860 275 3.6%
BuehlerDouble $6,520 $6,755 $235 3.6%Single 7,585 7,860 275 3.6%
Rollamo (1)2 BR 4 person $5,975 n/a n/a n/a1 BR 2 person 6,065 n/a n/a n/a
State StreetDouble $6,520 $6,755 $235 3.6%Single 7,585 7,860 275 3.6%
Sands (1)Triple $6,305 n/a n/a n/aDouble 6,520 n/a n/a n/aSingle 7,585 n/a n/a n/a
(1) Leased facilities no longer under contract(2) University Commons will open in August 2016.
Increase/ PercentSummer Session-Combined Room and Board Rates FY2016 FY2017 Decrease ChangeThomas Jefferson--full meals
Double $1,695 $1,720 $25 1.5%Single 1,905 1,935 30 1.6%
Thomas Jefferson--partial meals Double $1,590 $1,615 $25 1.6%Single 1,800 1,830 30 1.7%
Miner Village--Renewal Rate -- full meals4 Bedroom Apartments $1,535 $1,555 $20 1.3%2 Bedroom Apartments 1,495 1,510 15 1.0%
Miner Village--Renewal Rate -- partial meals4 Bedroom Apartments $1,430 $1,450 $20 1.4%2 Bedroom Apartments 1,390 1,405 15 1.1%
Miner Village--non-Renewal Rate--full meals4 Bedroom Apartments $2,525 $2,575 $50 2.0%2 Bedroom Apartments 2,420 2,470 50 2.1%
Miner Village--non-Renewal Rate--partial meals4 Bedroom Apartments $2,420 $2,470 $50 2.1%2 Bedroom Apartments 2,315 2,365 50 2.2%
14
Table 2d. UMSL, Approved Changes in Housing & Dining Contract Rates
Effective Beginning with the 2016 Summer Session
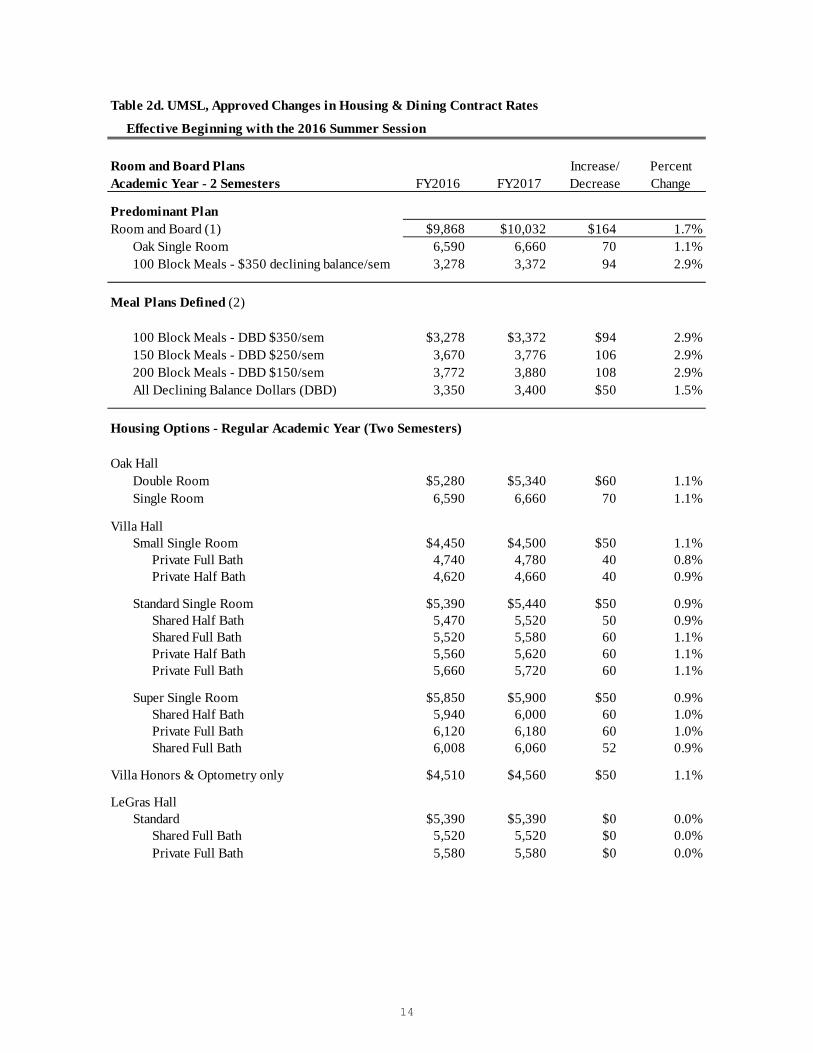
Room and Board Plans Increase/ PercentAcademic Year - 2 Semesters FY2016 FY2017 Decrease Change
Predominant PlanRoom and Board (1) $9,868 $10,032 $164 1.7%
Oak Single Room 6,590 6,660 70 1.1%100 Block Meals - $350 declining balance/sem 3,278 3,372 94 2.9%
Meal Plans Defined (2)
100 Block Meals - DBD $350/sem $3,278 $3,372 $94 2.9%150 Block Meals - DBD $250/sem 3,670 3,776 106 2.9%200 Block Meals - DBD $150/sem 3,772 3,880 108 2.9%All Declining Balance Dollars (DBD) 3,350 3,400 $50 1.5%
Housing Options - Regular Academic Year (Two Semesters)
Oak HallDouble Room $5,280 $5,340 $60 1.1%Single Room 6,590 6,660 70 1.1%
Villa HallSmall Single Room $4,450 $4,500 $50 1.1%
Private Full Bath 4,740 4,780 40 0.8%Private Half Bath 4,620 4,660 40 0.9%
Standard Single Room $5,390 $5,440 $50 0.9%Shared Half Bath 5,470 5,520 50 0.9%Shared Full Bath 5,520 5,580 60 1.1%Private Half Bath 5,560 5,620 60 1.1%Private Full Bath 5,660 5,720 60 1.1%
Super Single Room $5,850 $5,900 $50 0.9%Shared Half Bath 5,940 6,000 60 1.0%Private Full Bath 6,120 6,180 60 1.0%Shared Full Bath 6,008 6,060 52 0.9%
Villa Honors & Optometry only $4,510 $4,560 $50 1.1%
LeGras HallStandard $5,390 $5,390 $0 0.0%
Shared Full Bath 5,520 5,520 $0 0.0%Private Full Bath 5,580 5,580 $0 0.0%
15
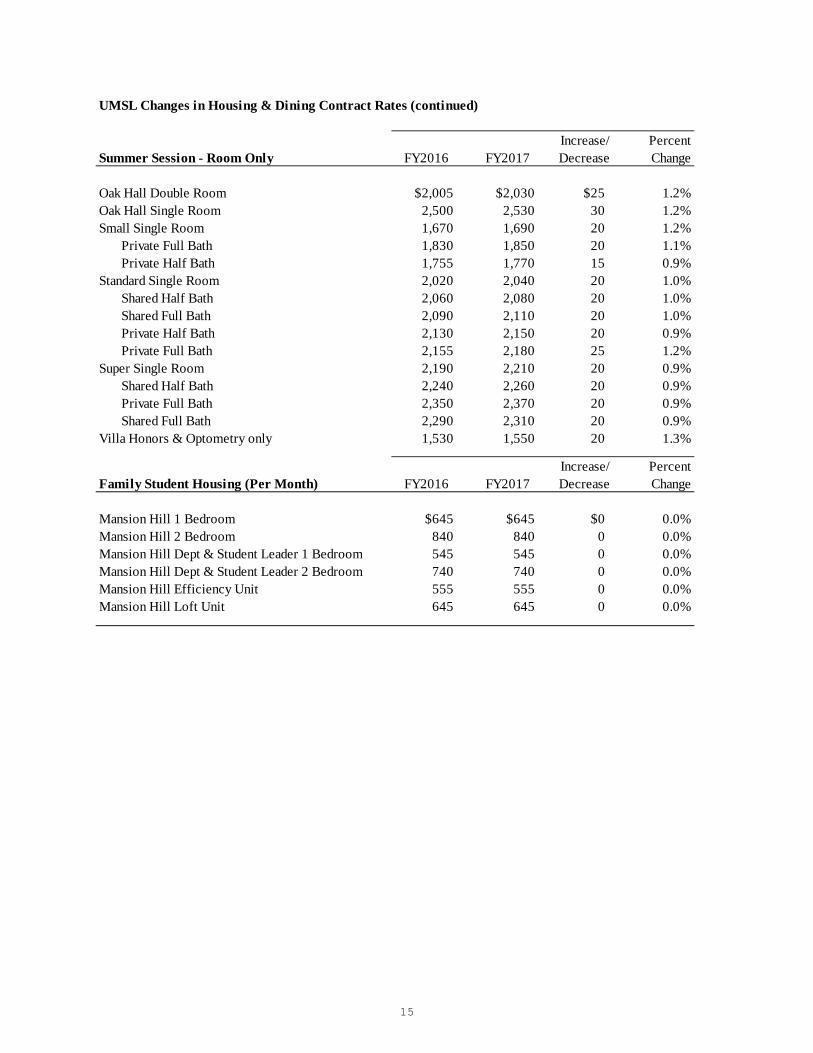
UMSL Changes in Housing & Dining Contract Rates (continued)
Increase/ PercentSummer Session - Room Only FY2016 FY2017 Decrease Change
Oak Hall Double Room $2,005 $2,030 $25 1.2%Oak Hall Single Room 2,500 2,530 30 1.2%Small Single Room 1,670 1,690 20 1.2%
Private Full Bath 1,830 1,850 20 1.1%Private Half Bath 1,755 1,770 15 0.9%
Standard Single Room 2,020 2,040 20 1.0%Shared Half Bath 2,060 2,080 20 1.0%Shared Full Bath 2,090 2,110 20 1.0%Private Half Bath 2,130 2,150 20 0.9%Private Full Bath 2,155 2,180 25 1.2%
Super Single Room 2,190 2,210 20 0.9%Shared Half Bath 2,240 2,260 20 0.9%Private Full Bath 2,350 2,370 20 0.9%Shared Full Bath 2,290 2,310 20 0.9%
Villa Honors & Optometry only 1,530 1,550 20 1.3%
Increase/ PercentFamily Student Housing (Per Month) FY2016 FY2017 Decrease Change
Mansion Hill 1 Bedroom $645 $645 $0 0.0%Mansion Hill 2 Bedroom 840 840 0 0.0%Mansion Hill Dept & Student Leader 1 Bedroom 545 545 0 0.0%Mansion Hill Dept & Student Leader 2 Bedroom 740 740 0 0.0%Mansion Hill Efficiency Unit 555 555 0 0.0%Mansion Hill Loft Unit 645 645 0 0.0%
16
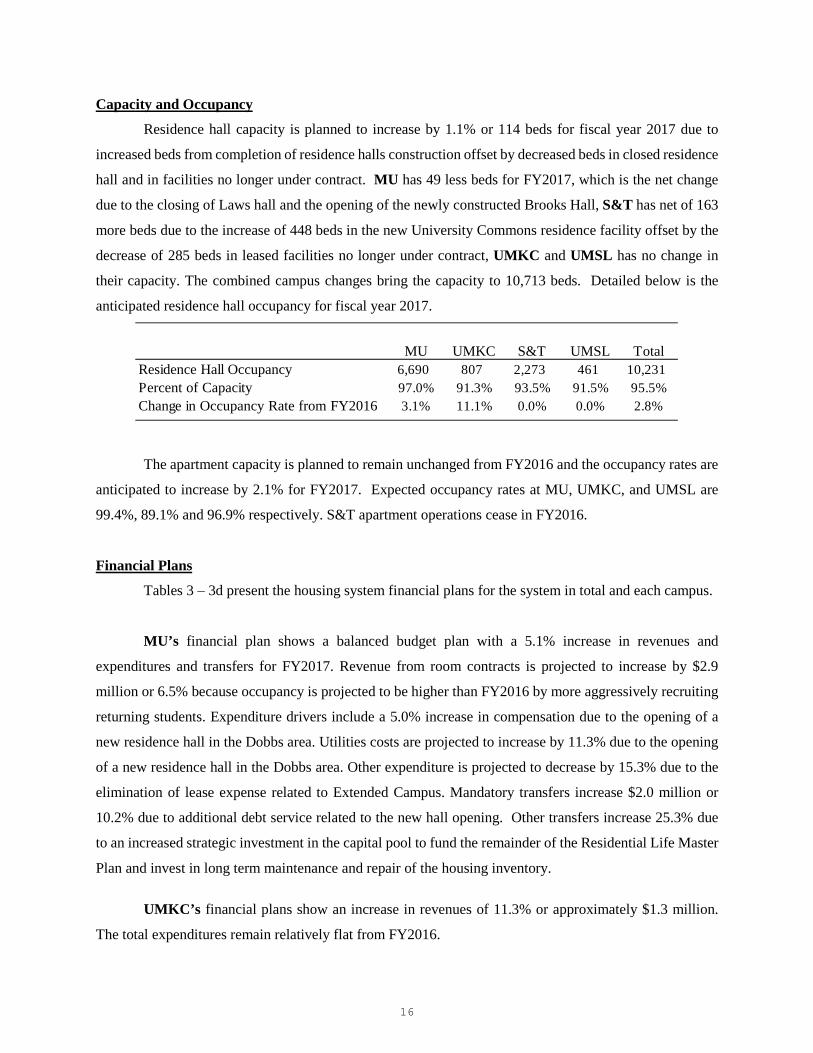
Capacity and Occupancy
Residence hall capacity is planned to increase by 1.1% or 114 beds for fiscal year 2017 due to
increased beds from completion of residence halls construction offset by decreased beds in closed residence
hall and in facilities no longer under contract. MU has 49 less beds for FY2017, which is the net change
due to the closing of Laws hall and the opening of the newly constructed Brooks Hall, S&T has net of 163
more beds due to the increase of 448 beds in the new University Commons residence facility offset by the
decrease of 285 beds in leased facilities no longer under contract, UMKC and UMSL has no change in
their capacity. The combined campus changes bring the capacity to 10,713 beds. Detailed below is the
anticipated residence hall occupancy for fiscal year 2017.
The apartment capacity is planned to remain unchanged from FY2016 and the occupancy rates are
anticipated to increase by 2.1% for FY2017. Expected occupancy rates at MU, UMKC, and UMSL are
99.4%, 89.1% and 96.9% respectively. S&T apartment operations cease in FY2016.
Financial Plans
Tables 3 – 3d present the housing system financial plans for the system in total and each campus.
MU’s financial plan shows a balanced budget plan with a 5.1% increase in revenues and
expenditures and transfers for FY2017. Revenue from room contracts is projected to increase by $2.9
million or 6.5% because occupancy is projected to be higher than FY2016 by more aggressively recruiting
returning students. Expenditure drivers include a 5.0% increase in compensation due to the opening of a
new residence hall in the Dobbs area. Utilities costs are projected to increase by 11.3% due to the opening
of a new residence hall in the Dobbs area. Other expenditure is projected to decrease by 15.3% due to the
elimination of lease expense related to Extended Campus. Mandatory transfers increase $2.0 million or
10.2% due to additional debt service related to the new hall opening. Other transfers increase 25.3% due
to an increased strategic investment in the capital pool to fund the remainder of the Residential Life Master
Plan and invest in long term maintenance and repair of the housing inventory.
UMKC’s financial plans show an increase in revenues of 11.3% or approximately $1.3 million.
The total expenditures remain relatively flat from FY2016.
MU UMKC S&T UMSL TotalResidence Hall Occupancy 6,690 807 2,273 461 10,231Percent of Capacity 97.0% 91.3% 93.5% 91.5% 95.5%Change in Occupancy Rate from FY2016 3.1% 11.1% 0.0% 0.0% 2.8%
17
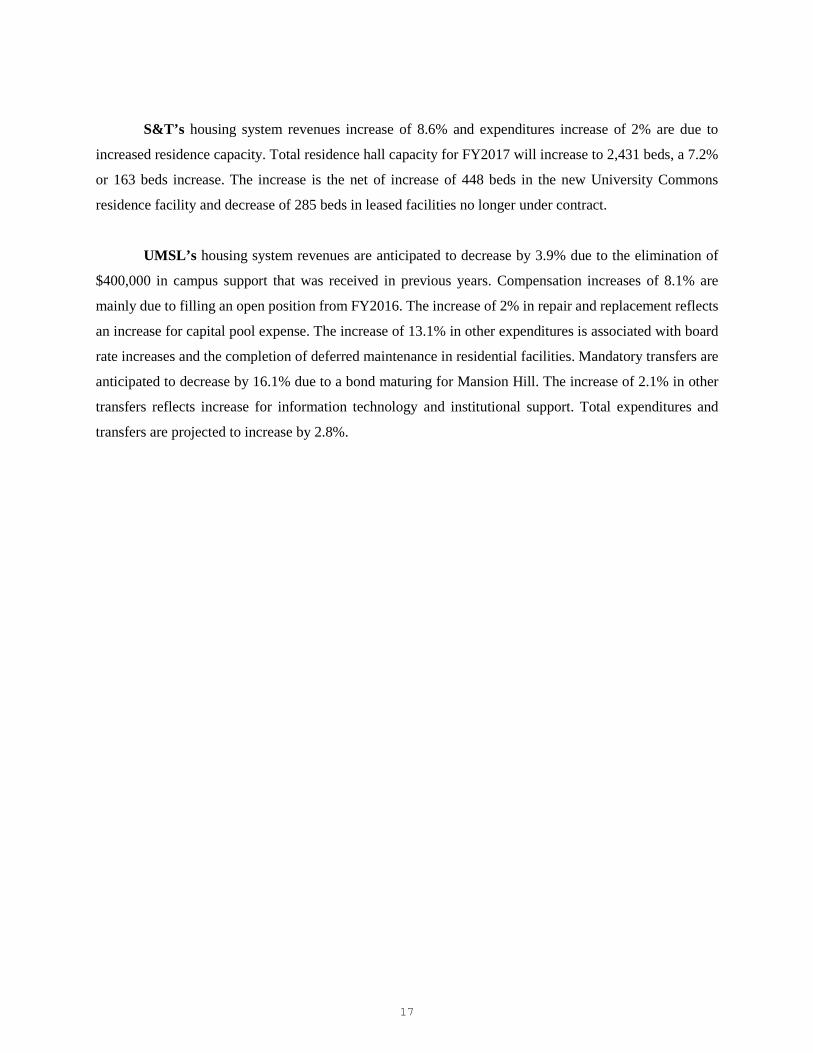
S&T’s housing system revenues increase of 8.6% and expenditures increase of 2% are due to
increased residence capacity. Total residence hall capacity for FY2017 will increase to 2,431 beds, a 7.2%
or 163 beds increase. The increase is the net of increase of 448 beds in the new University Commons
residence facility and decrease of 285 beds in leased facilities no longer under contract.
UMSL’s housing system revenues are anticipated to decrease by 3.9% due to the elimination of
$400,000 in campus support that was received in previous years. Compensation increases of 8.1% are
mainly due to filling an open position from FY2016. The increase of 2% in repair and replacement reflects
an increase for capital pool expense. The increase of 13.1% in other expenditures is associated with board
rate increases and the completion of deferred maintenance in residential facilities. Mandatory transfers are
anticipated to decrease by 16.1% due to a bond maturing for Mansion Hill. The increase of 2.1% in other
transfers reflects increase for information technology and institutional support. Total expenditures and
transfers are projected to increase by 2.8%.

18
Table 3. University of Missouri System Total, Housing System Financial Plans
FY2017FY2015 FY2016 FY2017 PercentActual Estimated Planned Change
RevenuesMeal Contracts $26,908,921 $27,886,178 $29,170,530 4.6%Room Contracts 64,152,705 66,239,257 71,001,924 7.2%Apartment Rental 9,678,341 9,031,143 9,775,272 8.2%Other 12,776,797 12,914,204 12,848,878 -0.5%
Total Revenues $113,516,764 $116,070,782 $122,796,603 5.8%
Expenditures & TransfersSalaries & Wages $20,133,742 $21,236,455 $22,335,765 5.2%Staff Benefits 6,404,963 7,138,837 7,461,760 4.5%In-kind Room & Board 579,027 14,499 26,600 83.5%
Subtotal $27,117,732 $28,389,791 $29,824,125 5.1%
COGS $8,576,151 $9,113,325 $9,495,516 4.2%Utilities 8,907,215 9,108,190 10,001,569 9.8%Repair and Replacement 5,308,825 5,232,212 5,201,182 -0.6%Other 21,287,903 23,991,665 22,646,926 -5.6% Total Expenditures $71,197,827 $75,835,183 $77,169,317 1.8%
Mandatory Transfers $29,770,452 $33,749,398 $36,293,634 7.5%Other Transfers 11,481,823 6,673,571 8,653,645 29.7%
Total Expenditures & Transfers $112,450,102 $116,258,152 $122,116,597 5.0%
Change in Net Assets $1,066,662 ($187,370) $680,006
Residence Hall Occupancy 9,848 9,844 10,231 3.9%Residence Hall Capacity 10,269 10,599 10,713 1.1%Percent of Capacity 95.9% 92.9% 95.5% 2.8%
Apartment Occupancy 1,273 1,203 1,228 2.1%Apartment Capacity 1,372 1,320 1,320 0.0%Percent of Capacity 92.8% 91.1% 93.0% 2.1%
19
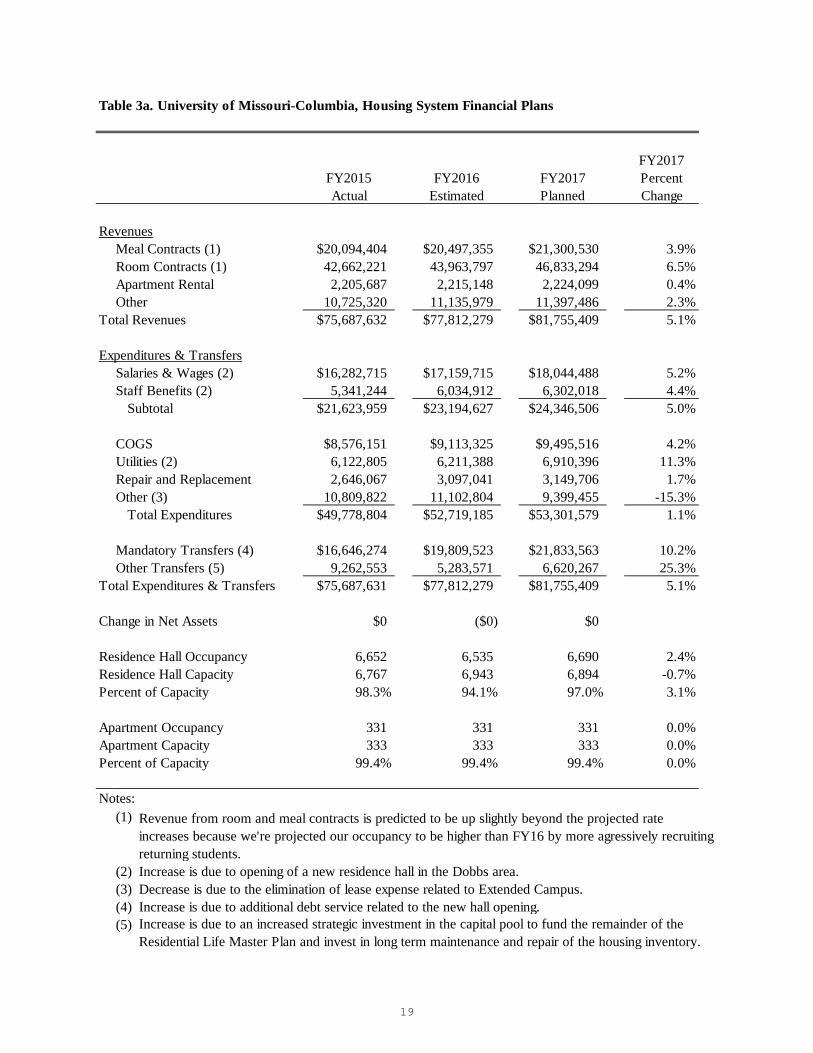
Table 3a. University of Missouri-Columbia, Housing System Financial Plans
FY2017FY2015 FY2016 FY2017 PercentActual Estimated Planned Change
RevenuesMeal Contracts (1) $20,094,404 $20,497,355 $21,300,530 3.9%Room Contracts (1) 42,662,221 43,963,797 46,833,294 6.5%Apartment Rental 2,205,687 2,215,148 2,224,099 0.4%Other 10,725,320 11,135,979 11,397,486 2.3%
Total Revenues $75,687,632 $77,812,279 $81,755,409 5.1%
Expenditures & TransfersSalaries & Wages (2) $16,282,715 $17,159,715 $18,044,488 5.2%Staff Benefits (2) 5,341,244 6,034,912 6,302,018 4.4% Subtotal $21,623,959 $23,194,627 $24,346,506 5.0%
COGS $8,576,151 $9,113,325 $9,495,516 4.2%Utilities (2) 6,122,805 6,211,388 6,910,396 11.3%Repair and Replacement 2,646,067 3,097,041 3,149,706 1.7%Other (3) 10,809,822 11,102,804 9,399,455 -15.3% Total Expenditures $49,778,804 $52,719,185 $53,301,579 1.1%
Mandatory Transfers (4) $16,646,274 $19,809,523 $21,833,563 10.2%Other Transfers (5) 9,262,553 5,283,571 6,620,267 25.3%
Total Expenditures & Transfers $75,687,631 $77,812,279 $81,755,409 5.1%
Change in Net Assets $0 ($0) $0
Residence Hall Occupancy 6,652 6,535 6,690 2.4%Residence Hall Capacity 6,767 6,943 6,894 -0.7%Percent of Capacity 98.3% 94.1% 97.0% 3.1%
Apartment Occupancy 331 331 331 0.0%Apartment Capacity 333 333 333 0.0%Percent of Capacity 99.4% 99.4% 99.4% 0.0%
Notes:(1)
(2)(3)(4)(5)
Revenue from room and meal contracts is predicted to be up slightly beyond the projected rate increases because we're projected our occupancy to be higher than FY16 by more agressively recruiting returning students.Increase is due to opening of a new residence hall in the Dobbs area. Decrease is due to the elimination of lease expense related to Extended Campus.Increase is due to additional debt service related to the new hall opening.Increase is due to an increased strategic investment in the capital pool to fund the remainder of the Residential Life Master Plan and invest in long term maintenance and repair of the housing inventory.

20
Tab 3b. University of Missouri-Kansas City, Housing System Financial Plans
FY2017FY2015 FY2016 FY2017 PercentActual Estimated Planned Change
RevenuesMeal Contracts (1)Room Contracts (2) $5,529,834 $5,224,240 $5,749,630 10.1%Apartment Rental 5,983,803 5,517,995 6,253,173 13.3%In-Kind R&B - 8,406 10,000 19.0%Conference revenue - 512,818 529,635 3.3%Other (3) 720,507 41,001 42,757 4.3%
Total Revenues $12,234,144 $11,304,460 $12,585,194 11.3%
Scholarships/Waivers $0 ($479,785) ($492,270) 2.6%Net Revenue $12,234,144 $10,824,675 $12,092,925 11.7%
Expenditures & TransfersSalaries & Wages $1,137,744 $1,216,740 $1,258,277 3.4%Staff Benefits 301,017 321,925 328,292 2.0%Pro Staff R&B Benefits 25,103 - - RA Room Benefits (4) 553,924 14,499 26,600 83.5% Subtotal $2,017,788 $1,553,164 $1,613,169 3.9%
Utilities $1,019,947 $1,038,802 $1,122,573 8.1%Repair and Replacement 839,109 918,043 769,985 -16.1%Other Operating 543,690 814,554 839,901 3.1% Total Expenditures $4,420,534 $4,324,563 $4,345,628 0.5%
Mandatory Transfers $6,271,662 $6,500,112 $6,587,799 1.3%Other Transfers 832,637 - 635,378
Total Expenditures & Transfers $11,524,833 $10,824,675 $11,568,806 6.9%
Change in Net Assets $709,311 $0 $524,119
Residence Hall Occupancy 785 727 807 11.0%Residence Hall Capacity 884 884 884 0.0%Percent of Capacity 88.8% 82.2% 91.3% 11.1%
Apartment Occupancy 679 650 675 3.8%Apartment Capacity 758 758 758 0.0%Percent of Capacity 89.6% 85.8% 89.1% 3.8%
Notes:(1) Meal contracts - Food Service is not considered a part of Residential Life financial operations. (2) FY16 Room Contracts includes newly established laundry fee at $35 ($17.50/semester) per resident(3) Includes mandatory programming fees, commission, allocations, and anticipated summer conference revenue.(4) FY16, 17 decrease in in-kind room expense for RAs due to a change in accounting, and is offset by increasein scholarships.

21
Table 3c. Missouri University of Science and Technology, Housing System Financial Plans
FY2017FY2015 FY2016 FY2017 PercentActual Estimated Planned Change
RevenuesMeal Contracts $5,325,321 $5,784,823 $6,200,000 7.2%Room Contracts 13,049,274 14,124,220 15,456,000 9.4%Apartment Rental 200,955 - - Other 624,290 550,000 560,000 1.8%
Total Revenues $19,199,840 $20,459,043 $22,216,000 8.6%
Expenditures & TransfersSalaries & Wages $2,524,162 $2,590,000 $2,744,000 5.9%Staff Benefits 709,852 732,000 $774,450 5.8%
Subtotal $3,234,014 $3,322,000 $3,518,450 5.9%
Utilities $1,511,142 $1,580,000 $1,690,600 7.0%Repair and Replacement 1,484,649 869,128 926,490 6.6%Other 7,189,498 8,550,522 8,472,300 -0.9% Total Expenditures $13,419,304 $14,321,650 $14,607,840 2.0%
Mandatory Transfers $5,181,642 $5,769,763 $6,471,272 12.2%Other Transfers 1,000,000 1,000,000 1,000,000 0.0%
Total Expenditures & Transfers $19,600,946 $21,091,413 $22,079,112 4.7%
Change in Net Assets ($401,106) ($632,370) $136,888
Residence Hall Occupancy 1,961 2,121 2,273 7.2%Residence Hall Capacity 2,118 2,268 2,431 7.2%Percent of Capacity 92.6% 93.5% 93.5% 0.0%
Apartment Occupancy 26 0 0Apartment Capacity 36 0 0Percent of Capacity 72.2%
Notes:In FY2017 the inventory of beds available will decrease 285 beds in leased facilities no longer under contract and increase 448 beds in the new University Commons residence facility. This net increase in capacity increases revenue and expense categories by amounts exceeding normal inflationary amounts.

22
Table 3d. University of Missouri-St. Louis, Housing System Financial Plans
FY2017FY2015 FY2016 FY2017 PercentActual Estimated Planned Change
RevenuesMeal Contracts (1) $1,489,197 $1,604,000 $1,670,000 4.1%Room Contracts (2) 2,911,376 2,927,000 2,963,000 1.2%Apartment Rental 1,287,896 1,298,000 1,298,000 0.0%Other (3) 706,680 666,000 309,000 -53.6%
Total Revenues 6,395,149$ 6,495,000$ 6,240,000$ -3.9%
Expenditures & TransfersSalaries & Wages (4) $189,121 $270,000 $289,000 7.0%Staff Benefits (4) 52,850 50,000 57,000 14.0% Subtotal 241,971$ 320,000$ 346,000$ 8.1%
Utilities $253,321 $278,000 $278,000 0.0%Repair and Replacement (5) 339,000 348,000 355,000 2.0%Other (6) 2,744,893 3,044,000 3,443,000 13.1% Total Expenditures 3,579,185$ 3,990,000$ 4,422,000$ 10.8%
Mandatory Transfers (7) $1,670,874 $1,670,000 $1,401,000 -16.1%Other Transfers (8) 386,633 390,000 398,000 2.1%
Total Expenditures & Transfers 5,636,692$ 6,050,000$ 6,221,000$ 2.8%
Change in Net Assets $758,457 $445,000 $19,000
Residence Hall Occupancy 450 461 461 0.0%Residence Hall Capacity 500 504 504 0.0%Percent of Capacity 90.0% 91.5% 91.5% 0.0%
Apartment Occupancy 237 222 222 0.0%Apartment Capacity (9) 245 229 229 0.0%Percent of Capacity 96.7% 96.9% 96.9% 0.0%
Notes:(1)
(2) FY2017 Increase associated with inflationary room rate increases.(3)
(4) FY2016 reflects an open position we are planning to fill in FY2017.(5) FY2017 reflects an increase of 2% for capital pool expenses.(6)
(7) FY2017 decrease associated with a bond maturing for Mansion Hill.(8) FY2017 reflects an increase of 2% for information technology and institutional support.(9)
A third party provider, Sodexo, provides the meal plans on campus. Sodexo utilized the current CPI Food-At-Home index, of 2.84%, to determine FY2017 rates.
FY2017 decrease associated with the elimination of $400,000 in campus support that was received in previous years.
FY2017 increase associated with board rate increases and the completion of deferred maintenance in residential facilities.
FY2016 apartment capacity reduction is a result of a change in a portion of our 2 bedroom units that were being utilized as 4 bedrooms, for a specified class of residents. These units returned to standard 2 bedrooms in FY2016.
23
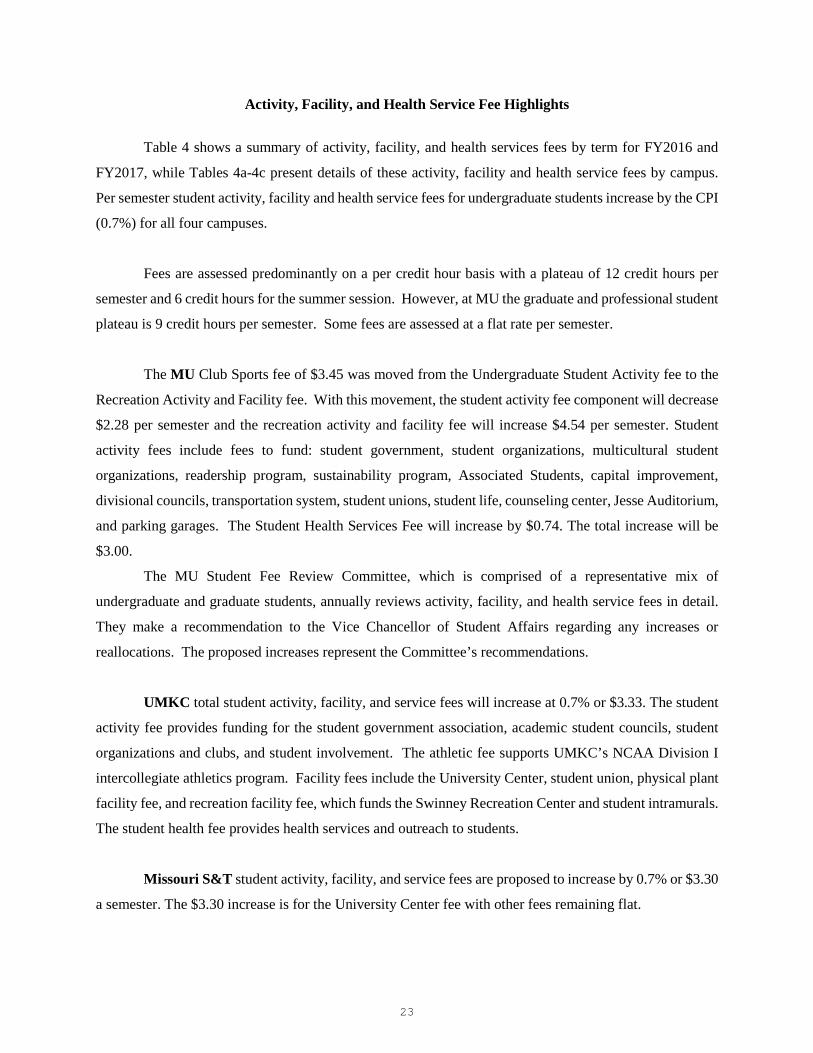
Activity, Facility, and Health Service Fee Highlights
Table 4 shows a summary of activity, facility, and health services fees by term for FY2016 and
FY2017, while Tables 4a-4c present details of these activity, facility and health service fees by campus.
Per semester student activity, facility and health service fees for undergraduate students increase by the CPI
(0.7%) for all four campuses.
Fees are assessed predominantly on a per credit hour basis with a plateau of 12 credit hours per
semester and 6 credit hours for the summer session. However, at MU the graduate and professional student
plateau is 9 credit hours per semester. Some fees are assessed at a flat rate per semester.
The MU Club Sports fee of $3.45 was moved from the Undergraduate Student Activity fee to the
Recreation Activity and Facility fee. With this movement, the student activity fee component will decrease
$2.28 per semester and the recreation activity and facility fee will increase $4.54 per semester. Student
activity fees include fees to fund: student government, student organizations, multicultural student
organizations, readership program, sustainability program, Associated Students, capital improvement,
divisional councils, transportation system, student unions, student life, counseling center, Jesse Auditorium,
and parking garages. The Student Health Services Fee will increase by $0.74. The total increase will be
$3.00.
The MU Student Fee Review Committee, which is comprised of a representative mix of
undergraduate and graduate students, annually reviews activity, facility, and health service fees in detail.
They make a recommendation to the Vice Chancellor of Student Affairs regarding any increases or
reallocations. The proposed increases represent the Committee’s recommendations.
UMKC total student activity, facility, and service fees will increase at 0.7% or $3.33. The student
activity fee provides funding for the student government association, academic student councils, student
organizations and clubs, and student involvement. The athletic fee supports UMKC’s NCAA Division I
intercollegiate athletics program. Facility fees include the University Center, student union, physical plant
facility fee, and recreation facility fee, which funds the Swinney Recreation Center and student intramurals.
The student health fee provides health services and outreach to students.
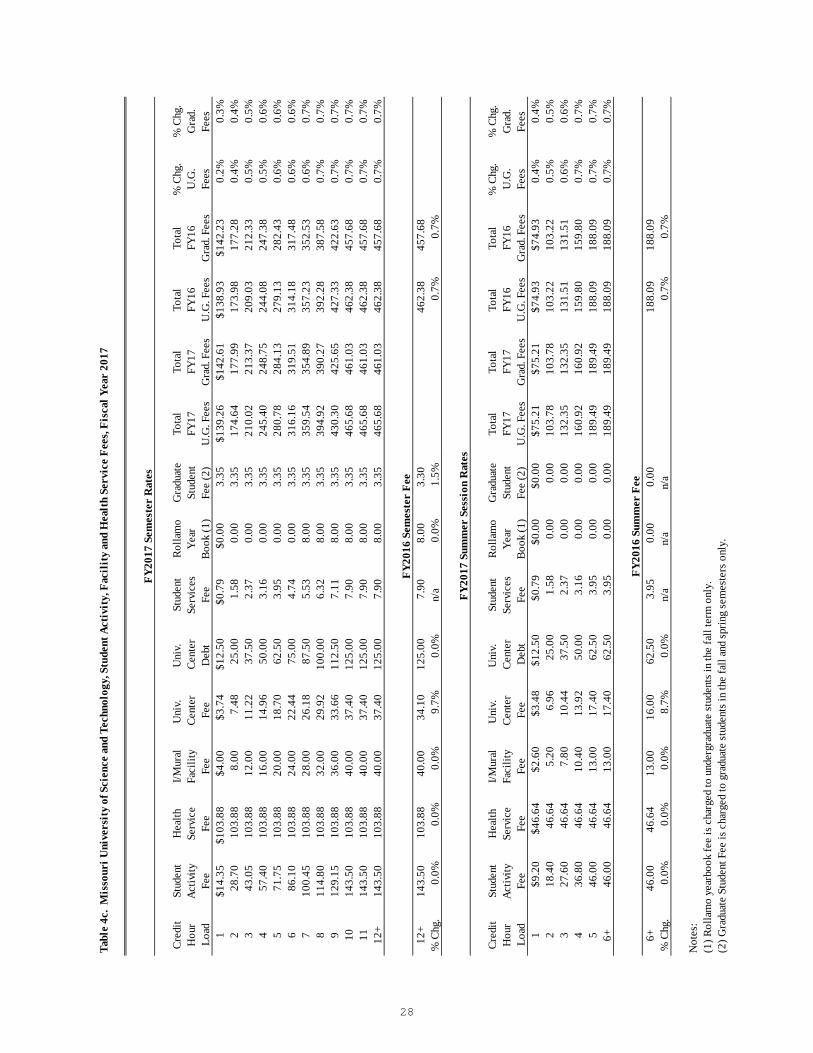
Missouri S&T student activity, facility, and service fees are proposed to increase by 0.7% or $3.30
a semester. The $3.30 increase is for the University Center fee with other fees remaining flat.

24
In an effort to simplify fees for students and their families, the UMSL campus adopted a
comprehensive base tuition rate that combined per credit hour tuition rates with information technology,
activity, facility, and health service fees which are charged to all students. The campus will no longer assess
their activity, facility and health service fees separately.

25
Table 4. Approved Changes in Student Activity, Facility, and Service Fees for FY2017, UM
Recommended Increase Recommended IncreaseMU FY2016 FY2017 Amount % change FY2016 FY2017 Amount % change
Maximum Fees per Term
Undergraduate StudentsStudent Activity Fee 171.84$ 169.56$ ($2.28) -1.3% 85.92$ 84.78$ ($1.14) -1.3%Recreation Activity and Facility 141.80 146.34 4.54 3.2% 70.90 73.17 2.27 3.2%Health Service Fee 101.47 102.21 0.74 0.7% 82.80 83.40 0.60 0.7% Total 415.11$ 418.11$ $3.00 0.7% 239.62$ 241.35$ $1.73 0.7%
Graduate and Professional StudentsStudent Activity Fee 151.29$ 149.94$ ($1.35) -0.9% 100.86$ 99.96$ ($0.90) -0.9%Recreation Activity and Facility 141.80 146.34 4.54 3.2% 70.90 73.17 2.27 3.2%Health Service Fee 101.47 102.21 0.74 0.7% 82.80 83.40 0.60 0.7% Total 394.56$ 398.49$ $3.93 1.0% 254.56$ 256.53$ $1.97 0.8%
Note - The Club Sports fee of $3.45 was moved from the Student Activity fee to the Recreation Activity and Facility fee.
Recommended Increase Recommended IncreaseUMKC FY2016 FY2017 Amount % change FY2016 FY2017 Amount % change
Maximum Fees per Term University Center Fee 82.94$ 83.50$ $0.56 0.7% 41.47$ 41.75$ $0.28 0.7%Student Union Fee 179.50 180.78 1.28 0.7% 89.75 90.39 0.64 0.7%Transportation Fee * 14.57 14.67 0.10 0.7% - - - - Athletic Fee 57.70 58.12 0.42 0.7% 28.85 29.06 0.21 0.7%Student Activity Fee 61.14 61.55 0.41 0.7% 30.72 29.56 (1.16) -3.8%Phys. Facility Fee 8.80 8.82 0.02 0.3% 4.40 4.41 0.01 0.3%Student Health Fee 50.08 50.39 0.31 0.6% 25.04 25.20 0.16 0.6%Rec. Facility Fee 31.93 32.15 0.22 0.7% 15.97 16.08 0.11 0.7% Total 486.65$ 489.98$ $3.33 0.7% 236.19$ 236.45$ $0.26 0.1%
* assessed only to new students in the summer semester at 50% of the fall rate
Recommended Increase Recommended IncreaseMissouri S&T FY2016 FY2017 Amount % change FY2016 FY2017 Amount % change
Maximum Fees per Term Undergraduate Students
Student Activity Fee 143.50$ 143.50$ $0.00 0.0% $46.00 $46.00 $0.00 0.0%Health Service Fee 103.88 103.88 - 0.0% 46.64 46.64 - 0.0%I/Mural Facility Fee 40.00 40.00 - 0.0% 13.00 13.00 - 0.0%University Center Fee 34.10 37.40 3.30 9.7% 16.00 17.40 1.40 8.7%University Center Debt 125.00 125.00 - 0.0% 62.50 62.50 - 0.0%Rollamo Year Book ** 8.00 8.00 - 0.0% - - - - Student Services Fee 7.90 7.90 - 0.0% 3.95 3.95 - 0.0% Total 462.38$ 465.68$ $3.30 0.7% 188.09$ 189.49$ $1.40 0.7%
** Rollmo Year Book Fee assessed Fall semester only
Graduate StudentsStudent Activity Fee 143.50$ 143.50$ $0.00 0.0% 46.00$ $46.00 $0.00 0.0%Health Service Fee 103.88 103.88 - 0.0% 46.64 46.64 - 0.0%I/Mural Facility Fee 40.00 40.00 - 0.0% 13.00 13.00 - 0.0%University Center Fee 34.10 37.40 3.30 9.7% 16.00 17.40 1.40 8.7%University Center Debt 125.00 125.00 - 0.0% 62.50 62.50 - 0.0%Graduate Student Fee 3.30 3.35 0.05 1.5% - - - - Student Services Fee 7.90 7.90 - 0.0% 3.95 3.95 - 0.0% Total 457.68$ 461.03$ $3.35 0.7% 188.09$ 189.49$ $1.40 0.7%
Note: UMSL restructured their tuition & required fees into a single tuition rate in FY2014 and will no longer be separately assessing required fees.
Semester Rates (12 or more credit hours) Summer Rates (7 or more credit hours)
Semester Rates (12 or more credit hours) Summer Rates (6 or more credit hours)
Semester Rates (12 or more credit hours) Summer Rates (6 or more credit hours)

26
Tab
le 4
a. U
nive
rsit
y of
Mis
sour
i-M
U, S
tude
nt A
ctiv
ity,
Fac
ilit
y an
d H
ealt
h Se
rvic
e Fe
es, F
isca
l Yea
r 20
17
FY20
17 S
emes
ter
Rat
es
Und
ergr
adG
rad/
Prof
Und
ergr
adG
rad/
Prof
Cred
itSt
uden
tSt
uden
tRe
crea
tion
Hea
lthH
ealth
Tota
lTo
tal
T ota
lTo
tal
% C
hg. *
% C
hg.
Hou
rAc
tivity
Activ
ityAc
tivity
&Se
rvic
eSe
rvic
eFY
17FY
17FY
16FY
16U
.G.
Gra
d/Pr
ofLo
adFe
eFe
eFa
cilit
yFe
eFe
eU
.G. F
ees
G/P
Fee
sU
.G. F
ees
G/P
Fee
sFe
esFe
es1
$14.
13$1
6.66
$0.0
0$0
.00
$0.0
0$1
4.13
$16.
66$1
4.32
$16.
81-1
.3%
-0.9
%2
28.2
633
.32
0.00
0.00
0.00
28.2
6
33.3
2
28.6
4
33.6
2
-1.3
%-0
.9%
342
.39
49.9
80.
000.
000.
0042
.39
49
.98
42
.96
50.4
3
-1.3
%-0
.9%
456
.52
66.6
40.
000.
000.
0056
.52
66
.64
57
.28
67.2
4
-1.3
%-0
.9%
570
.65
83.3
00.
000.
000.
0070
.65
83
.30
71
.60
84.0
5
-1.3
%-0
.9%
684
.78
99.9
60.
000.
000.
0084
.78
99
.96
85
.92
100.
86
-1.3
%-0
.9%
798
.91
116.
6214
6.34
102.
2110
2.21
347.
46
36
5.17
343.
5136
0.94
1.
1%1.
2%8
113.
0413
3.28
146.
3410
2.21
102.
2136
1.59
381.
83
35
7.83
377.
75
1.1%
1.1%
912
7.17
149.
9414
6.34
102.
2110
2.21
375.
72
39
8.49
372.
1539
4.56
1.
0%1.
0%10
141.
3014
9.94
146.
3410
2.21
102.
2138
9.85
398.
49
38
6.47
394.
56
0.9%
1.0%
1115
5.43
149.
94
14
6.34
102.
2110
2.21
403.
98
39
8.49
400.
7939
4.56
0.
8%1.
0%12
+16
9.56
149.
94
14
6.34
102.
2110
2.21
418.
11
39
8.49
415.
1139
4.56
0.
7%1.
0%
FY20
16 S
emes
ter
Fee
12+
171.
8415
1.29
141.
8010
1.47
101.
4741
5.11
394.
56%
Chg
.-1
.3%
-0.9
%3.
2%0.
7%0.
7%0.
7%1.
0%
FY20
17 S
umm
er S
essi
on R
ates
Und
ergr
adG
radu
ate
Und
ergr
adG
rad/
Prof
Cred
itSt
uden
tSt
uden
tRe
crea
tion
Hea
lthH
ealth
Tota
lTo
tal
Tota
lTo
tal
% C
hg.
% C
hg.
Hou
rAc
tivity
Activ
ityAc
tivity
&Se
rvic
eSe
rvic
eFY
17FY
17FY
16FY
16U
.G.
Gra
d/Pr
ofLo
adFe
eFe
eFa
cilit
yFe
eFe
eU
.G. F
ees
G/P
Fee
sU
.G. F
ees
G/P
Fee
sFe
esFe
es1
$14.
13$1
6.66
$0.0
0$0
.00
$0.0
0$1
4.13
$16.
66$1
4.32
$16.
81-1
.3%
-0.9
%2
28.2
633
.32
0.00
0.00
0.00
28.2
6
33.3
2
28.6
4
33.6
2
-1.3
%-0
.9%
342
.39
49.9
80.
000.
000.
0042
.39
49
.98
42
.96
50
.43
-1
.3%
-0.9
%4
56.5
266
.64
0.00
0.00
83.4
056
.52
15
0.04
57.2
8
150.
04
-1.3
%0.
0%5
70.6
583
.30
0.00
0.00
83.4
070
.65
16
6.70
71.6
0
166.
85
-1.3
%-0
.1%
684
.78
99.9
673
.17
83.4
083
.40
241.
35
25
6.53
239.
62
25
4.56
0.
7%0.
8%7
+84
.78
99.9
673
.17
83.4
083
.40
241.
35
25
6.53
239.
62
25
4.56
0.
7%0.
8%
FY20
16 S
umm
er F
ee7
+85
.92
100.
8670
.90
82.8
082
.80
239.
6225
4.56
% C
hg.
-1.3
%-0
.9%
3.2%
0.7%
0.7%
0.7%
0.8%
*Th
e Cl
ub S
port
s fe
e of
$3.
45 w
as m
oved
from
the
Stud
ent
Activ
ity f
ee to
the
Recr
eatio
n Ac
tivity
and
Fac
ility
col
umn.
Clu
b Sp
orts
are
man
aged
an
d su
ppor
ted
by M
izzou
Rec
alre
ady,
so
it m
akes
sen
se to
rear
rang
e th
e fu
ndin
g in
this
way
.

27
Tabl
e 4b
. U
nive
rsit
y of
Mis
sour
i-K
ansa
s Cit
y, S
tude
nt A
ctiv
ity,
Fac
ilit
y an
d H
ealt
h Se
rvic
e Fe
es, F
isca
l Yea
r 20
17
Cred
it H
our
Load
Uni
v. Ce
nter
Fe
e
Stud
ent
Uni
on
Fee
Tran
spor
tatio
n Fe
eAt
hlet
ic
Fee
A.S.
U.M
. Fe
e (1
)
Stud
ent
Activ
ity
Fee
(1)
Phys
. Fa
cilit
y Fe
e
Stud
ent
Hea
lth
Fee
Colle
giat
e Re
ader
ship
Fe
e (1
)
Rec.
Fa
cilit
y Fe
e
Tota
l FY
17
Fees
Tota
l FY
16
Fees
%Ch
g To
tal
Fees
1$6
.96
$15.
06$1
4.67
$4.8
4$0
.15
$4.7
7$0
.74
$4.2
0$2
.72
$32.
15$8
6.27
$85.
690.
7%2
13.9
230
.13
14.6
79.
690.
319.
551.
478.
402.
7232
.15
123.
0012
2.17
0.7%
320
.88
45.1
914
.67
14.5
30.
4614
.32
2.21
12.6
02.
7232
.15
159.
7315
8.64
0.7%
427
.83
60.2
614
.67
19.3
70.
6219
.09
2.94
16.8
02.
7232
.15
196.
4619
5.12
0.7%
534
.79
75.3
214
.67
24.2
20.
7723
.87
3.68
21.0
02.
7232
.15
233.
1923
1.59
0.7%
641
.75
90.3
914
.67
29.0
60.
9328
.64
4.41
25.2
02.
7232
.15
269.
9226
8.07
0.7%
748
.71
105.
4514
.67
33.9
11.
0833
.41
5.15
29.3
92.
7232
.15
306.
6530
4.54
0.7%
855
.67
120.
5214
.67
38.7
51.
2338
.19
5.88
33.5
92.
7232
.15
343.
3734
1.01
0.7%
962
.63
135.
5814
.67
43.5
91.
3942
.96
6.62
37.7
92.
7232
.15
380.
1037
7.49
0.7%
1069
.58
150.
6514
.67
48.4
41.
5447
.73
7.35
41.9
92.
7232
.15
416.
8341
3.96
0.7%
1176
.54
165.
7114
.67
53.2
81.
5452
.50
8.09
46.1
92.
7232
.15
453.
4045
0.28
0.7%
12+
83.5
018
0.78
14.6
758
.12
1.54
57.2
88.
8250
.39
2.72
32.1
548
9.98
486.
600.
7%
12+
82.9
417
9.50
14.5
757
.70
1.50
56.9
28.
8050
.08
2.72
31.9
348
6.65
%Ch
g.0.
7%0.
7%0.
7%0.
7%2.
7%0.
6%0.
2%0.
6%0.
0%0.
7%0.
7%
Cred
it H
our
Load
Uni
v. Ce
nter
Fe
e
Stud
ent
Uni
on
Fee
Tran
spor
tatio
n Fe
e (3
)At
hlet
ic
Fee
A.S.
U.M
. Fe
e
Stud
ent
Activ
ity
Fee
Phys
. Fa
cilit
y Fe
e
Stud
ent
Hea
lth
Fee
Colle
giat
e Re
ader
ship
Fe
e
Rec.
Fa
cilit
y Fe
e
Tota
l FY
17
Fees
Tota
l FY
16
Fees
%Ch
g To
tal
Fees
6+41
.75
90.3
90.
0029
.06
0.93
28.6
44.
4125
.20
0.00
16.0
823
6.45
236.
190.
1%
6+41
.47
89.7
50.
0028
.85
0.90
28.4
64.
4025
.04
1.36
15.9
723
6.19
%Ch
g.0.
7%0.
7%0.
0%0.
7%3.
3%0.
6%0.
2%0.
6%-1
00.0
%0.
7%0.
1%
(2)
All p
repa
red
fees
wer
e sh
ared
, dis
cuss
ed an
d su
ppor
ted
by th
e St
uden
t Gov
ernm
ent A
ssoc
iatio
n.
(3)
For S
umm
er, t
he T
rans
porta
tion
fee
will
only
be
char
ged
to n
ew st
uden
ts w
ho st
art i
n th
e Su
mm
er.
Like
oth
er fl
at ra
te fe
es, i
t will
be
char
ged
at 5
0% fo
r the
Sum
mer
.
(1)
Stud
ent a
ctiv
ity fe
es o
n su
mm
ary
sche
dule
also
incl
ude
the
ASU
M an
d Co
llegi
ate
Read
ersh
ip fe
es.
FY20
17 S
emes
ter
Rat
es
FY20
16 S
emes
ter
Fee
FY20
17 S
umm
er S
essi
on R
ates
FY20
16 S
umm
er F
ee
Not
es:
28
Tabl
e 4c
. M
isso
uri U
nive
rsit
y of
Sci
ence
and
Tec
hnol
ogy,
Stu
dent
Act
ivit
y, F
acil
ity
and
Hea
lth
Serv
ice
Fees
, Fis
cal Y
ear
2017
Cred
itSt
uden
tH
ealth
I/Mur
alU
niv.
Uni
v. St
uden
tRo
llam
oG
radu
ate
Tota
lTo
tal
Tota
lTo
tal
% C
hg.
% C
hg.
Hou
rAc
tivity
Serv
ice
Faci
lity
Cent
erCe
nter
Serv
ices
Year
Stud
ent
FY17
FY17
FY16
FY16
U.G
.G
rad.
Load
Fee
Fee
Fee
Fee
Deb
t Fe
eBo
ok (1
)Fe
e (2
)U
.G. F
ees
Gra
d. F
ees
U.G
. Fee
sG
rad.
Fee
sFe
esFe
es1
$14.
35$1
03.8
8$4
.00
$3.7
4$1
2.50
$0.7
9$0
.00
3.35
$139
.26
$142
.61
$138
.93
$142
.23
0.2%
0.3%
228
.70
10
3.88
8.
00
7.
48
25
.00
1.
58
0.
003.
3517
4.64
177.
9917
3.98
177.
280.
4%0.
4%3
43.0
5
103.
88
12.0
0
11.2
2
37.5
0
2.37
0.00
3.35
210.
0221
3.37
209.
0321
2.33
0.5%
0.5%
457
.40
10
3.88
16
.00
14
.96
50
.00
3.
16
0.
003.
3524
5.40
248.
7524
4.08
247.
380.
5%0.
6%5
71.7
5
103.
88
20.0
0
18.7
0
62.5
0
3.95
0.00
3.35
280.
7828
4.13
279.
1328
2.43
0.6%
0.6%
686
.10
10
3.88
24
.00
22
.44
75
.00
4.
74
0.
003.
3531
6.16
319.
5131
4.18
317.
480.
6%0.
6%7
100.
45
103.
88
28.0
0
26.1
8
87.5
0
5.53
8.00
3.35
359.
5435
4.89
357.
2335
2.53
0.6%
0.7%
811
4.80
10
3.88
32
.00
29
.92
10
0.00
6.
32
8.
00
3.
3539
4.92
390.
2739
2.28
387.
580.
7%0.
7%9
129.
15
103.
88
36.0
0
33.6
6
112.
50
7.11
8.00
3.35
430.
3042
5.65
427.
3342
2.63
0.7%
0.7%
1014
3.50
10
3.88
40
.00
37
.40
12
5.00
7.
90
8.
00
3.
3546
5.68
461.
0346
2.38
457.
680.
7%0.
7%11
143.
50
103.
88
40.0
0
37.4
0
125.
00
7.90
8.00
3.35
465.
6846
1.03
462.
3845
7.68
0.7%
0.7%
12+
143.
50
103.
88
40.0
0
37.4
0
125.
00
7.90
8.00
3.35
465.
6846
1.03
462.
3845
7.68
0.7%
0.7%
12+
143.
5010
3.88
40.0
034
.10
125.
007.
908.
003.
3046
2.38
457.
68%
Chg
.0.
0%0.
0%0.
0%9.
7%0.
0%n/
a0.
0%1.
5%0.
7%0.
7%
Cred
itSt
uden
tH
ealth
I/Mur
alU
niv.
Uni
v. St
uden
tRo
llam
oG
radu
ate
Tota
lTo
tal
Tota
lTo
tal
% C
hg.
% C
hg.
Hou
rAc
tivity
Serv
ice
Faci
lity
Cent
erC e
nter
Serv
ices
Year
Stud
ent
FY17
FY17
FY16
FY16
U.G
.G
rad.
Load
Fee
Fee
Fee
Fee
Deb
tFe
eBo
ok (1
)Fe
e (2
)U
.G. F
ees
Gra
d. F
ees
U.G
. Fee
sG
rad.
Fee
sFe
esFe
es1
$9.2
0$4
6.64
$2.6
0$3
.48
$12.
50$0
.79
$0.0
0$0
.00
$75.
21$7
5.21
$74.
93$7
4.93
0.4%
0.4%
218
.40
46.6
45.
206.
9625
.00
1.58
0.00
0.00
103.
7810
3.78
103.
2210
3.22
0.5%
0.5%
327
.60
46.6
47.
8010
.44
37.5
02.
370.
000.
0013
2.35
132.
3513
1.51
131.
510.
6%0.
6%4
36.8
046
.64
10.4
013
.92
50.0
03.
160.
000.
0016
0.92
160.
9215
9.80
159.
800.
7%0.
7%5
46.0
046
.64
13.0
017
.40
62.5
03.
950.
000.
0018
9.49
189.
4918
8.09
188.
090.
7%0.
7%6+
46.0
046
.64
13.0
017
.40
62.5
03.
950.
000.
0018
9.49
189.
4918
8.09
188.
090.
7%0.
7%
6+46
.00
46.6
413
.00
16.0
062
.50
3.95
0.00
0.00
188.
0918
8.09
% C
hg.
0.0%
0.0%
0.0%
8.7%
0.0%
n/a
n/a
n/a
0.7%
0.7%
Not
es:
(1) R
olla
mo
year
book
fee
is c
harg
ed to
und
ergr
adua
te st
uden
ts in
the
fall
term
onl
y.(2
) Gra
duat
e St
uden
t Fee
is c
harg
ed to
gra
duat
e st
uden
ts in
the
fall
and
sprin
g se
mes
ters
onl
y.
FY20
17 S
emes
ter
Rat
es
FY20
16 S
emes
ter
Fee
FY20
17 S
umm
er S
essi
on R
ates
FY20
16 S
umm
er F
ee