University of Miskolc Institute of World & Regional Economics Dániel Kuttor: REGIONAL CONVERGENCE...
19
University of Miskolc Institute of World & Regional Economics Dániel Kuttor: REGIONAL CONVERGENCE AND DIVERGENCE 02.10.2008 Herl’any, Slovakia Dániel KUTTOR Dániel KUTTOR REGIONAL CONVERGENCE AND DIVERGENCE IN THE VISEGRAD FOUR COUNTRIES DURING THE TRANSITION PERIOD University Of Miskolc Institute of World and Regional Economics 02 10 2008 Herl’any , Slovak ia
-
Upload
angelina-gertrude-daniel -
Category
Documents
-
view
216 -
download
0
Transcript of University of Miskolc Institute of World & Regional Economics Dániel Kuttor: REGIONAL CONVERGENCE...

University of Miskolc
Institute of World & Regional Economics
Dániel Kuttor:REGIONAL CONVERGENCE AND DIVERGENCE
02.10.2008 Herl’any, Slovakia
Dániel KUTTORDániel KUTTOR
REGIONAL CONVERGENCE AND DIVERGENCE IN THE VISEGRAD FOUR COUNTRIES DURING THE TRANSITION
PERIOD
University Of Miskolc
Institute of World and Regional Economics
02 10 2008
Herl’any, Slovakia

University of Miskolc
Institute of World & Regional Economics
Dániel Kuttor:REGIONAL CONVERGENCE AND DIVERGENCE
02.10.2008 Herl’any, Slovakia
ContentContent
• Definition of research topic and motivation
• Theoretical approach
• Limitation of the target area
• Analysis of the regional difference (based on GDP data)
• Measurement of disparities on NUTS 2 level
• Visualisation of inequalities
• Conclusion

University of Miskolc
Institute of World & Regional Economics
Dániel Kuttor:REGIONAL CONVERGENCE AND DIVERGENCE
02.10.2008 Herl’any, Slovakia
Definition of research topic and motivationDefinition of research topic and motivation
Measurement and visualization of territorial disparities (PhD)
The reasons, motivations for investigation: personal >>> partners, GIS; EU expansion >>> CRP; growing competition on the global market >>> CIP; EUROSTAT >>> data.

University of Miskolc
Institute of World & Regional Economics
Dániel Kuttor:REGIONAL CONVERGENCE AND DIVERGENCE
02.10.2008 Herl’any, Slovakia
V4 countries in EuropeV4 countries in Europe

University of Miskolc
Institute of World & Regional Economics
Dániel Kuttor:REGIONAL CONVERGENCE AND DIVERGENCE
02.10.2008 Herl’any, Slovakia
Western Europe Eastern Europe Ratio1900 2893 1438 49,71%1950 4579 2111 46,10%1960 6896 3070 44,52%1970 10195 4315 42,32%1980 13197 5786 43,84%1990 15966 5450 34,14%1995 16860 4998 29,64%2000 19002 5804 30,54%
GDP per capita (1990 G-K dollars)
V4 countries’ performance in 20th CenturyV4 countries’ performance in 20th Century
Convergence or divergence to Western Europe
Source: Angus Maddison

University of Miskolc
Institute of World & Regional Economics
Dániel Kuttor:REGIONAL CONVERGENCE AND DIVERGENCE
02.10.2008 Herl’any, Slovakia
V4 countries’ perfoV4 countries’ perforrmance in last decademance in last decade
Convergence or divergence to Western Europe
Source: EUROStat
15
20
25
30
35
40
45
Czech Republic
Hungary
Poland
Slovakia
What the tendencies on regional level?

University of Miskolc
Institute of World & Regional Economics
Dániel Kuttor:REGIONAL CONVERGENCE AND DIVERGENCE
02.10.2008 Herl’any, Slovakia
Theoretical approach or backgroundTheoretical approach or background
Contradictory approaches
the different theories of development and growth have traditions;
• the growth is a spatially cumulative process, which results increasing inequalities (Myrdal, Krugman);
• the regional differences disappear with the growth (Solow, Rostow);
• Spatial inequalities depend on the level of development (Williamson);
• „trade off” phenomenon.
? in V4

University of Miskolc
Institute of World & Regional Economics
Dániel Kuttor:REGIONAL CONVERGENCE AND DIVERGENCE
02.10.2008 Herl’any, Slovakia
Regions in V4 Regions in V4
Generally 35 regions (CZ:8; HU:7, PL: 16, SK: 4)
Source: MapInfo

University of Miskolc
Institute of World & Regional Economics
Dániel Kuttor:REGIONAL CONVERGENCE AND DIVERGENCE
02.10.2008 Herl’any, Slovakia
Measurement of disparities on NUTS 2 levelMeasurement of disparities on NUTS 2 level
Comparison on national level, based on GDP per capita (PPP)
Source: EUROStat
0,0
0,5
1,0
1,5
2,0
2,5
3,0
3,5
Cz Hu Pl Sk
Max/Min
1995
2005

University of Miskolc
Institute of World & Regional Economics
Dániel Kuttor:REGIONAL CONVERGENCE AND DIVERGENCE
02.10.2008 Herl’any, Slovakia
MeasurementMeasurement
of disparitiesof disparities
on NUTS 2 levelon NUTS 2 level
GDP per capita
(on PPS)
Source: EUROStat
Rank 1995 # Rank 2005 GDP per capita, 2005, PPS
cz01 Praha 1 cz01 Praha 35900,6
sk01 Bratislavský kraj 2 sk01 Bratislavský kraj 33124,1
hu10 Közép-Magyarország 3 hu10 Közép-Magyarország 23489,0
cz03 Jihozápad 4 pl12 Mazowieckie 18184,4
cz04 Severozápad 5 cz02 Strední Cechy 15792,4
cz06 Jihovýchod 6 cz03 Jihozápad 15671,5
cz05 Severovýchod 7 cz06 Jihovýchod 15252,2
cz07 Strední Morava 8 cz08 Moravskoslezsko 14633,2
cz08 Moravskoslezsko 9 cz05 Severovýchod 14539,0
cz02 Strední Cechy 10 hu22 Nyugat-Dunántúl 14274,9
pl12 Mazowieckie 11 cz04 Severozápad 13658,2
hu22 Nyugat-Dunántúl 12 hu21 Közép-Dunántúl 13528,7
pl22 Slaskie 13 cz07 Strední Morava 13393,1
hu21 Közép-Dunántúl 14 sk02 Západné Slovensko 12779,2
sk02 Západné Slovensko 15 pl22 Slaskie 12386,0
pl51 Dolnoslaskie 16 pl41 Wielkopolskie 12277,7
pl42 Zachodniopomorskie 17 pl51 Dolnoslaskie 11862,2
pl63 Pomorskie 18 pl63 Pomorskie 11280,9
hu33 Dél-Alföld 19 pl42 Zachodniopomorskie 10660,1
pl61 Kujawsko-Pomorskie 20 pl11 Lódzkie 10545,0
hu23 Dél-Dunántúl 21 sk03 Stredné Slovensko 10455,0
pl41 Wielkopolskie 22 pl43 Lubuskie 10357,1
pl43 Lubuskie 23 pl61 Kujawsko-Pomorskie 10012,9
pl52 Opolskie 24 hu23 Dél-Dunántúl 9982,9
pl11 Lódzkie 25 pl21 Malopolskie 9798,5
sk03 Stredné Slovensko 26 hu33 Dél-Alföld 9756,8
hu31 Észak-Magyarország 27 sk04 Východné Slovensko 9662,9
pl21 Malopolskie 28 pl52 Opolskie 9514,2
hu32 Észak-Alföld 29 hu31 Észak-Magyarország 9483,6
sk04 Východné Slovensko 30 hu32 Észak-Alföld 9153,4
pl62 Warminsko-Mazurskie 31 pl62 Warminsko-Mazurskie 8781,9
pl33 Swietokrzyskie 32 pl33 Swietokrzyskie 8586,2
pl31 Lubelskie 33 pl34 Podlaskie 8500,5
pl34 Podlaskie 34 pl32 Podkarpackie 7926,6
pl32 Podkarpackie 35 pl31 Lubelskie 7838,9

University of Miskolc
Institute of World & Regional Economics
Dániel Kuttor:REGIONAL CONVERGENCE AND DIVERGENCE
02.10.2008 Herl’any, Slovakia
Measurement of disparities on NUTS 2 levelMeasurement of disparities on NUTS 2 level
Comparison based on GDP per capita in % of the EU average
SPSS analysis of the regions
1995a00 1996a00 1997a00 1998a00 1999a00 2000a00 2001a00 2002a00 2003a00 2004a00 2005a00 N Valid 35 35 35 35 35 35 35 35 35 35 35 Missing 0 0 0 0 0 0 0 0 0 0 0 Mean 51,549 51,54857 52,76 53,44286 53,64 53,54571 53,40571 54,16571 55,20286 56,68857 58,00286 Std. Error of Mean 3,3938 3,393779 3,495089 3,492579 3,522826 3,56625 3,609895 3,921878 4,084462 4,246879 4,265203 Median 43,700 43,7 44,9 47 47,5 48,6 48,1 47,4 48,3 48,2 49,5 Mode 39,1(a) 39,1 41,5 35,6 36,7 42,8 36,4 36,2 64,2 34,6 45,3 Std. Deviation 20,0779 20,07787 20,67723 20,66237 20,84132 21,09822 21,35643 23,20214 24,164 25,12487 25,23328 Variance 403,121 403,1208 427,5478 426,9337 434,3607 445,1349 456,097 538,3394 583,8991 631,2593 636,7185 Range 92,8 92,8 94,6 94,9 98 101,6 103,3 112 114 119,7 119,7 Minimum 32,8 32,8 33,9 35,3 35,6 34,6 33,7 33,6 33,9 34,6 35,1 Maximum 125,6 125,6 128,5 130,2 133,6 136,2 137 145,6 147,9 154,3 154,8 Sum 1804,2 1804,2 1846,6 1870,5 1877,4 1874,1 1869,2 1895,8 1932,1 1984,1 2030,1
Source: EUROStat

University of Miskolc
Institute of World & Regional Economics
Dániel Kuttor:REGIONAL CONVERGENCE AND DIVERGENCE
02.10.2008 Herl’any, Slovakia
Measurement of disparities on NUTS 2 levelMeasurement of disparities on NUTS 2 level
Comparison based on GDP per capita in % of the EU average
SPSS analysis
Box plot figure
Source: EUROStat

University of Miskolc
Institute of World & Regional Economics
Dániel Kuttor:REGIONAL CONVERGENCE AND DIVERGENCE
02.10.2008 Herl’any, Slovakia
Source: GEODA & EUROStat
Measurement of disparities on NUTS 2 levelMeasurement of disparities on NUTS 2 level
Comparison based on GDP per capita in % of the EU average
GEODA analysis
Significant polarization!

University of Miskolc
Institute of World & Regional Economics
Dániel Kuttor:REGIONAL CONVERGENCE AND DIVERGENCE
02.10.2008 Herl’any, Slovakia
Measurement of disparities on NUTS 2 levelMeasurement of disparities on NUTS 2 level
Regions by change
of GDP (1995-2005)
Legend:
200% -
175 - 200 %
150 - 175 %
- 150 %Source: MapInfo & EUROStat

University of Miskolc
Institute of World & Regional Economics
Dániel Kuttor:REGIONAL CONVERGENCE AND DIVERGENCE
02.10.2008 Herl’any, Slovakia
Source: EUROStat
Measurement of disparities on NUTS 2 levelMeasurement of disparities on NUTS 2 level
The ”trade off” phenomenon (1996-2005):
Two cycles identifiable
0
1
2
3
4
5
6
1996
1997
1998
1999
2000
2001
2002
2003
2004
2005
0,98
1
1,02
1,04
1,06
1,08
1,1
1,12
Annual percentagechange in GDP
Annual percentagechange in Std.Deviation
University of Miskolc
Institute of World & Regional Economics
Dániel Kuttor:REGIONAL CONVERGENCE AND DIVERGENCE
02.10.2008 Herl’any, Slovakia
Source: EUROStat
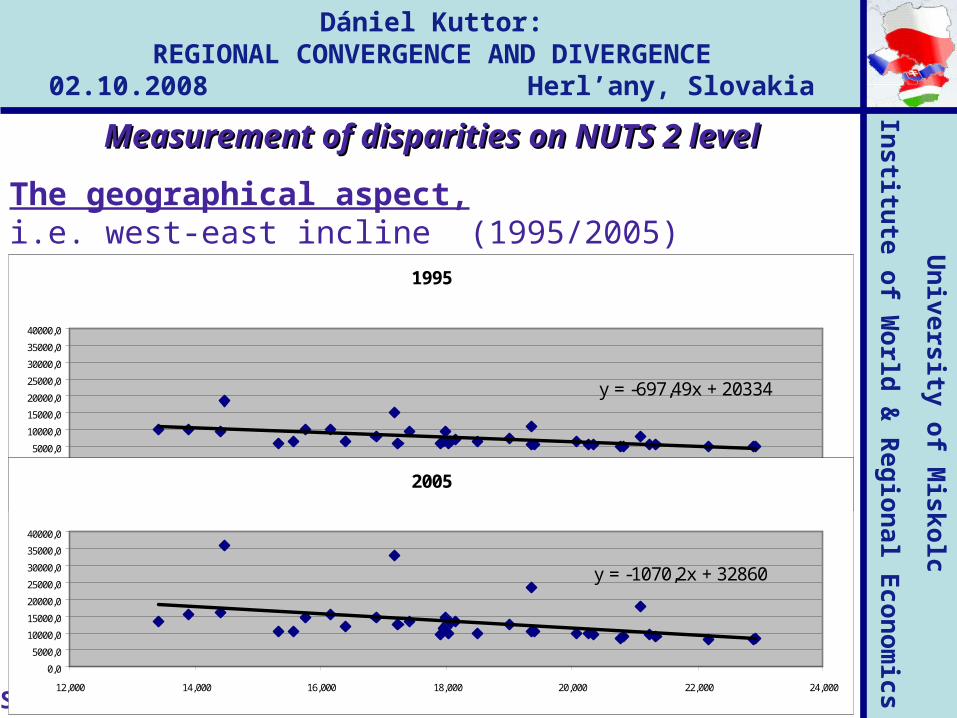
Measurement of disparities on NUTS 2 levelMeasurement of disparities on NUTS 2 level
The geographical aspect,i.e. west-east incline (1995/2005)
1995
y = -697,49x + 20334
0,0
5000,0
10000,0
15000,0
20000,0
25000,0
30000,0
35000,0
40000,0
12,000 14,000 16,000 18,000 20,000 22,000 24,0002005
y = -1070,2x + 32860
0,0
5000,0
10000,0
15000,0
20000,0
25000,0
30000,0
35000,0
40000,0
12,000 14,000 16,000 18,000 20,000 22,000 24,000

University of Miskolc
Institute of World & Regional Economics
Dániel Kuttor:REGIONAL CONVERGENCE AND DIVERGENCE
02.10.2008 Herl’any, Slovakia
Conclusions (1)Conclusions (1)
• the V4 countries could converge to Western European (EU) average measured on national level;
• at the same time the territorial disparities on regional level increased dramatically;
• the polarization in every country means that the capital region has significantly higher growth potential and a faster convergence;
• in contrast with the previous there are regions which although increased their GDP, but the GDP per capita values did not get closer the EU average;
• in many cases the national convergences were due to just the growing capital regions (for instance the Czech Republic in the late 90es);
University of Miskolc
Institute of World & Regional Economics
Dániel Kuttor:REGIONAL CONVERGENCE AND DIVERGENCE
02.10.2008 Herl’any, Slovakia
Conclusions (2)Conclusions (2)
• the under-developed regions react more sensitive to the national stagnation or slow down (for instance: Hungary in the recent years);
• Slovakia provide a good example, as the rapid economic growth has positive effect on the regions growth potentials;
• the „trade off” phenomenon can be observed in CEE countries.

University of Miskolc
Institute of World & Regional Economics
Dániel Kuttor:REGIONAL CONVERGENCE AND DIVERGENCE
02.10.2008 Herl’any, Slovakia
Thank for Your attention!Thank for Your attention!Dakujem!Dakujem!
www.uni-miskolc.hu/~euint