
University of Huddersfield Repositoryeprints.hud.ac.uk/10792/1/cokoriefinalthesis.pdf · thesis,...
281
University of Huddersfield Repository Okorie, Chukwuneke Value-Adding Services as Competitive Strategy: A Multiple Case-Study Analysis of Ports in Developing and Developed Economies Original Citation Okorie, Chukwuneke (2011) Value-Adding Services as Competitive Strategy: A Multiple Case- Study Analysis of Ports in Developing and Developed Economies. Doctoral thesis, University of Huddersfield. This version is available at http://eprints.hud.ac.uk/id/eprint/10792/ The University Repository is a digital collection of the research output of the University, available on Open Access. Copyright and Moral Rights for the items on this site are retained by the individual author and/or other copyright owners. Users may access full items free of charge; copies of full text items generally can be reproduced, displayed or performed and given to third parties in any format or medium for personal research or study, educational or not-for-profit purposes without prior permission or charge, provided: • The authors, title and full bibliographic details is credited in any copy; • A hyperlink and/or URL is included for the original metadata page; and • The content is not changed in any way. For more information, including our policy and submission procedure, please contact the Repository Team at: [email protected]. http://eprints.hud.ac.uk/
Transcript of University of Huddersfield Repositoryeprints.hud.ac.uk/10792/1/cokoriefinalthesis.pdf · thesis,...

University of Huddersfield Repository
Okorie, Chukwuneke
ValueAdding Services as Competitive Strategy: A Multiple CaseStudy Analysis of Ports in Developing and Developed Economies
Original Citation
Okorie, Chukwuneke (2011) ValueAdding Services as Competitive Strategy: A Multiple CaseStudy Analysis of Ports in Developing and Developed Economies. Doctoral thesis, University of Huddersfield.
This version is available at http://eprints.hud.ac.uk/id/eprint/10792/
The University Repository is a digital collection of the research output of theUniversity, available on Open Access. Copyright and Moral Rights for the itemson this site are retained by the individual author and/or other copyright owners.Users may access full items free of charge; copies of full text items generallycan be reproduced, displayed or performed and given to third parties in anyformat or medium for personal research or study, educational or notforprofitpurposes without prior permission or charge, provided:
• The authors, title and full bibliographic details is credited in any copy;• A hyperlink and/or URL is included for the original metadata page; and• The content is not changed in any way.
For more information, including our policy and submission procedure, pleasecontact the Repository Team at: [email protected].
http://eprints.hud.ac.uk/

VALUE-ADDING SERVICES AS COMPETITIVE STRATEGY:
A MULTIPLE CASE-STUDY ANALYSIS OF PORTS IN
DEVELOPING AND DEVELOPED ECONOMIES
By
Chukwuneke C. Okorie
Research Unit
Transport & Logistics
School of Applied Sciences
University of Huddersfield
‘‘A thesis submitted to the University of Huddersfield in partial fulfilment of the
requirements for the degree of Doctor of Philosophy’’
January, 2011

2
Copyright Statement
The following notes on copyright and the ownership of intellectual property rights are
included as written below:
i. The author of this thesis (including any appendices and/or schedules to this
thesis) owns any copyright in it (the “Copyright”) and he has given The
University of Huddersfield the right to use such Copyright for any
administrative, promotional, educational and/or teaching purposes.
ii. Copies of this thesis, either in full or in extracts, may be made only in
accordance with the regulations of the University Library. Details of these
regulations may be obtained from the Librarian.
This page must form part of any such copies made.
iii. The ownership of any patents, designs, trademarks and any and all other
intellectual property rights except for the Copyright (the “Intellectual
Property Rights”) and any reproductions of copyright works, for example
graphs and tables (“Reproductions”), which may be described in this
thesis, may not be owned by the author and may be owned by third parties.
Such Intellectual Property Rights and Reproductions cannot and must not
be made available for use without the prior written permission of the
owner(s) of the relevant Intellectual Property Rights and/or Reproductions.

3
Abstract Despite the fact that in a general logistics context, value-adding services (VAS) have
been acknowledged in various publications, there is a dearth of available empirical
works that have particularly investigated the competitive capacity of these services in
the formulation of port strategy. Hence, the development of models that are useful to
understanding and assessing the capacity of value-adding services in port strategies is
necessary to bridge this knowledge gap.
In the context of this study, value-adding services are defined as customised and
additional services which complement the core or main offerings of a firm.
A critical realist approach to research was deployed. Questionnaires were used to
survey port users, while in-depth interviews were carried out with port management
of the multiple case study ports. The case study ports were Rotterdam (The
Netherlands), PD Teesport (United Kingdom), Damietta (Egypt) and Apapa (Nigeria)
ports. Ten key value-adding services were identified. The research showed that value-
adding services may provide a useful input into the competitive strategy of attracting
and retaining port users to a port. The services were found to offer opportunities for
the diversification of business for port authorities and port operators.
Original contributions of the study include that it brings to the maritime logistics body
of knowledge an understanding of the importance of the different value-adding
services, principally based on port users‟ assessment. In sequence, the most important
value-adding services were transport service, warehousing, water supplies and
technical support, whilst the least important services were canteen/catering and
advertising support services. Hitherto, there is no published study that has provided
insight into the importance port users attach to various value-adding services.
In port strategy formulation by the deployment of value-adding services, there is a
stage in which dynamism sets in and the uniqueness of the services tend to wear-off,
requiring concerted rejuvenation to sustain the potential of value-adding services in
competitive strategies. The main challenging issues to port management in the
deployment of value-adding services in strategy were found to be concerned with
legislation, availability of traffic (cargo and vessel), duration of contracts, adequate
land and space availability.
The study also developed models, one to stimulate theoretical understanding of port
value-adding services, the other to facilitate informed decision-making on the
viability of offering value-adding services in ports.

4
Dedication
‘Halleluiah! – Glory to God’!!

5
Acknowledgement
I am grateful for all assistance and particularly owe appreciation to:
My father, Chief Walter Okorie for drawing strength from his prowess in
education; and Mother, Edith Okorie for her present strides in education that
have kept me encouraged.
Dr. Christian Unanwa and Wife (Akudo Unanwa), for their unrelenting cares
through my education; particularly for financial involvement in my education
in United Kingdom.
The University of Huddersfield, for the award of financial scholarship for this
research towards my doctorate degree.
Dr. Nicoleta S. Tipi, my research supervisor; for being very supportive in
directions and in giving objective attention to work in a most motivating
manner.
Dr. Nick Hubbard, for his meaningful and objective scrutiny of the research
work as a co-supervisor.
Others: Bill Oakes (FCILT) of the Chartered Institute of Logistics and
Transport (CILT) UK, for professional mentorship and resourceful assistance.
To My Love and fiancée – Obianuju for being there in support and prayers.
To all positive contributors and beloved ‘thanks a million’.

6
Contents
Dedication .................................................................................................................................................................. 4
Chapter 1- INTRODUCTION............................................................................................................................ 13
1.1 Introduction ............................................................................................................................................... 13
1.2 Research Background ....................................................................................................................... 13
1.3 Research Details ............................................................................................................................ 15
1.3.1 Title ........................................................................................................................................... 15
1.3.2 Research Aims ............................................................................................................................ 15
1.3.3 The research objectives .................................................................................................................. 16
Propositions 1 ....................................................................................................................................... 17
Proposition 2 ......................................................................................................................................... 18
1.5 Research Methodology ..................................................................................................................... 19
1.6 Secondary Data (Reviewing the Literature) ......................................................................................... 19
1.7 Questionnaire .................................................................................................................................. 20
1.8 Interviews ....................................................................................................................................... 20
1.9 Reasons for Selecting Case Study Ports .............................................................................................. 20
1.10 Research Structure in Relation to Research Aims Achievement ...................................................................... 21
1.11 Research Relevance ......................................................................................................................................... 22
Chapter 2 - Theoretical Perspective of Research ..................................................................................................... 23
2.1 Introduction ........................................................................................................................................................ 23
2.2 Focus on Strategy ............................................................................................................................................... 23
2.3 The 3-Dimensions of Strategy ........................................................................................................................... 25
2.3.1 Strategy Context ............................................................................................................................ 25
2.3.2 Strategy Content ............................................................................................................................ 26
2.3.3 Strategy Process ............................................................................................................................ 27
2.4 Maritime Ports Logistics Service Trends ........................................................................................................... 27
2.4.1 Integrated Port Logistics ................................................................................................................................. 28
2.4.2 Trends in Modern Shipping ............................................................................................................................ 28
2.5 Competition in the Global Maritime Ports ......................................................................................................... 31
2.5.1 Hierarchies of Port Competition ...................................................................................................... 33
2.5.2 Intra-Port Level Competition .......................................................................................................... 34
2.5.3 Terminal Level Inter-port Competition ............................................................................................ 35
2.5.4 Inter-Port Competition (Authority Level) ......................................................................................... 35
2.5.5 Privatisation of ports (concession) ................................................................................................... 36
2.5.6 Port Privatisation Trends ................................................................................................................................. 36
2.6 Main Influencing Factors in Choice of Ports ..................................................................................................... 37
2.6.1 Cost and Pricing ............................................................................................................................ 37
2.6.2 Cargo Handling Facilities ............................................................................................................... 38
2.6.3 Inland Infrastructural Network ........................................................................................................ 38
2.6.4 Size of Vessels .............................................................................................................................. 38
2.6.5 Location (Geography) .................................................................................................................... 39
2.7 Understanding Services...................................................................................................................................... 39
2.7.1 The Process of Services .................................................................................................................. 40
2.8 Value Added Concept and Value Adding Services ............................................................................................ 42
2.8.1 Value Added Concept .................................................................................................................... 42

7
2.8.2 Value-Adding Services (VAS) ........................................................................................................ 43
2.9 Value Adding Services in Port Logistics ........................................................................................................... 45
2.9.1 „Value Drops‟ ............................................................................................................................... 49
2.10 Summary .......................................................................................................................................................... 50
Chapter 3 - Research Methodology .......................................................................................................................... 51
3.1 Introduction ........................................................................................................................................................ 51
3.2 Philosophy and Approaches to Research ........................................................................................................... 52
3.2.1 Ontology ...................................................................................................................................... 52
3.2.2 Epistemology ................................................................................................................................ 52
3.2.3 The Research Project Perspective .................................................................................................... 55
3.2.4 Exploratory and Analytical Approaches ........................................................................................... 56
3.2.5 Research Strategy .......................................................................................................................... 57
3.3 Research Primary Data....................................................................................................................................... 58
3.3.2 The Choice of Questionnaire Technique .......................................................................................... 59
3.3.3 Collection of Data by Questionnaire ................................................................................................ 59
3.3.3a Questionnaire Design ................................................................................................................... 59
3.3.3b Questionnaire Questions ............................................................................................................... 60
3.4 Sample Size........................................................................................................................................................ 63
3.5 Probability/Randomised Sampling ..................................................................................................................... 65
3.5.1 Choice of Simple Random Sampling ............................................................................................... 66
3.6 Questionnaire Administration ............................................................................................................................ 68
3.7 Collection of Data by Interviews ....................................................................................................................... 69
3.7.1 The Choice of Interview Method and Interviewing Process ................................................................ 69
3.8 Validity and Reliability of Primary Data ........................................................................................................... 72
3.9 Summary ............................................................................................................................................................ 73
Chapter 4 -The Case Study Ports ............................................................................................................................. 74
4.1 Introduction ........................................................................................................................................................ 74
4.2 Reasons for Choosing the Case Study Ports ...................................................................................................... 74
4.3 Port of Rotterdam Authority (The Netherlands) ................................................................................................ 75
4.3.1 Traffic Management ...................................................................................................................... 76
4.3.2 Land Area Management ................................................................................................................. 77
4.3.3 Cargo Operations........................................................................................................................... 78
4.3.4 Ancillary Services ........................................................................................................................................... 82
4.4 PD Teesport Port (United Kingdom) ................................................................................................................. 83
4.4.1 Cargo Operations........................................................................................................................... 84
4.4.2 PD Ports in Immingham Port .......................................................................................................... 86
4.4.3 PD Ports in Hull Port ..................................................................................................................... 87
4.4.4 PD Ports in Grimsby Port ............................................................................................................... 87
4.4.5 PD ports Operations in inland ports ................................................................................................. 87
4.5 Damietta Port (Egypt) ........................................................................................................................................ 88
4.5.1 Damietta Port in relation to Suez Canal & Other Egyptian Ports ......................................................... 91
4.6 Apapa Port (Nigerian Port Authority- NPA, Nigeria) ....................................................................................... 92
4.6.1 Nigerian Port Authority (NPA) ....................................................................................................... 93
4.6.2 The Apapa port Operators .............................................................................................................. 95
4.6.3 Apapa Container Terminal.............................................................................................................. 96

8
4.6.4 General Cargo Operations .............................................................................................................. 97
4.6.5 Support Service Provision .............................................................................................................. 97
4.7 Summary ............................................................................................................................................................ 97
5.1 Introduction ........................................................................................................................................................ 98
5.2 Research Variables............................................................................................................................................. 99
5.3 Levels of Statistical Analysis ............................................................................................................................. 99
5.3.1 Univariate ..................................................................................................................................... 99
5.3.2 Bivariate Analysis ....................................................................................................................... 100
5.3.3 Chi-Square Test........................................................................................................................... 101
5.3.4 Multivariate Analysis .................................................................................................................................... 102
5.4 Test‟s Significance ......................................................................................................................... 103
5.5 Piloting of Primary Data Collection.................................................................................................. 104
5.6 Preliminary Analyses ....................................................................................................................................... 105
5.7 Survey Response Rate ...................................................................................................................................... 105
5.7.1 Response Rate 1 - (Ports in Developed Economies)......................................................................... 105
5.7.2 Response Rate 2 - (Ports in Developing Economies) .................................................................. 109
5.8 Research Data Reliability Assessment ............................................................................................................. 112
5.9 Summary ................................................................................................................................................. 114
Chapter 6 - Analytical Presentation and Discussion of Research Data .................................................................. 115
6.1 Introduction ................................................................................................................................... 115
6.2 Port Service Areas .......................................................................................................................... 116
6.3 Port-user respondents job designations ............................................................................................. 119
6.4: Investigation on Qualifications and Port Users years in Port Business ................................................. 120
6.5 Availability of value-adding services in Ports .................................................................................... 122
6.6 Key Value-adding Service Availability ........................................................................................................... 123
6.6.1 The Rotterdam and PD Ports‟ perspective ...................................................................................... 124
6.6.2 The Egyptian Port perspective ...................................................................................................... 126
6.6.3 The Nigerian Port‟s perspective .................................................................................................... 127
6.6.4 Synopsis for the availability status of key value-adding services .................................................................. 128
6.6.4 (a) Transport service - availability status ........................................................................................ 128
6.6.4 (b) Warehousing service - availability status ................................................................................... 129
6.6.4 (c) Packaging service - availability status ....................................................................................... 130
6.6.4 (d) Technical Support - availability status ...................................................................................... 130
6.6.4 (e) Advertisement Support - availability status ................................................................................ 131
6.6.4 (e)* Advertisement support proposal ............................................................................................. 131
6.6.4(f) Assembly of Cargo/product - availability status .......................................................................... 132
6.6.4 (g) Consultancy - availability status ............................................................................................... 133
6.6.4 (h) Canteen/Catering - availability status ........................................................................................ 133
6.6.4 (i) Water supplies - availability status ............................................................................................ 134
6.6.4 (j) Cold storage - availability status ............................................................................................... 134
6.6.5 Summary - value-adding services availability ................................................................................. 135
6.7 Importance of Value-adding Services .............................................................................................................. 136
6.7.1 Importance of value-adding services based on case study ports ........................................................ 138
6.7.2 Importance of Value-adding services - Rotterdam & PD Ports perspective ........................................ 139
6.7.3 Importance of value-adding services- Damietta Port perspective ....................................................... 140
9
6.7.4 Importance of Value-adding services – Apapa Nigerian Port‟s perspective ........................................ 142
6.7.5 Synopsis on importance of value-adding services ......................................................................................... 143
6.7.5 (a) Transport service – Importance ................................................................................................ 143
6.7.5 (b) Warehousing service – Importance ........................................................................................... 144
6.7.5 (c) Packaging service – Importance ............................................................................................... 144
6.7.5 (d) Technical Support- importance ................................................................................................ 144
6.7.5 (e) Advertisement Support – importance ........................................................................................ 145
6.7.5 (f) Assembly of cargo/product – importance ................................................................................... 145
6.7.5 (g) Consultancy – importance ....................................................................................................... 145
6.7.5 (h) Canteen/Catering - importance ................................................................................................. 146
6.7.5 (i) Water supplies - importance ..................................................................................................... 146
6.7.5 (j) Cold storage - importance ........................................................................................................ 147
6.7.6 Summary - value-adding services - importance ............................................................................... 147
6.8 Potential usage of value-adding services.......................................................................................................... 148
6.8.1 Potential usage of value-adding services based on case study ports ................................................... 149
6.8.3 The Egyptian Port perspective ...................................................................................................... 151
6.8.4 The Nigerian port‟s perspective..................................................................................................... 153
6.8.5 Synopsis on the Potential usage of value-adding services ............................................................................. 155
6.8.5 (a) Transport delivery service - potential usage ............................................................................... 155
6.8.5 (b) Warehousing - potential usage ................................................................................................. 156
6.8.5 (c) Packaging- potential usage ...................................................................................................... 157
6.8.5 (d) Technical Support- potential usage ........................................................................................... 159
6.8.5 (e) Advertisement support- potential usage ..................................................................................... 159
6.8.5 (f) Assembly of cargo/product- potential usage ............................................................................... 160
6.8.5 (g) Consultancy- potential usage ................................................................................................... 160
6.8.5 (h) Canteen/catering- potential usage ............................................................................................. 161
6.8.5 (i) Water supplies- potential usage ................................................................................................. 161
6.8.5 (j) Cold storage- potential usage .................................................................................................... 161
6.8.6 Strategic dynamics of value-adding services ................................................................................... 162
6.8.7 Summary - Potential usage of value-adding services ....................................................................... 164
6.9 Summary - Analytical Presentation and Discussion of Research Data ............................................................ 165
Chapter 7 - Further Analyses and Discussion of Research Issues .......................................................................... 166
7.1 Introduction ................................................................................................................................... 166
7.2 Port management interview summary ............................................................................................... 167
7.3 Port users‟ port selection criteria variables ........................................................................................ 169
7.3.1 Factor Analysis of Port users‟ port selection criteria variables ............................................................ 172
7.3.2 Examination of the extracted factors from port selection criteria ........................................................ 174
7.3.3 Summary - Port selection criteria ........................................................................................................ 175
7.4 Test of Research Propositions .......................................................................................................... 176
7.5 The Extent of offering value-adding services in the Ports ................................................................... 181
7.5.1 Summary- Extent of offering value-adding services ........................................................................ 183
7.6. Level of port users‟ value-adding services awareness ........................................................................ 184
7.6.1 Summary - level of port users‟ value-adding services awareness ........................................................ 185
7.7 VAS Strategy in ports ..................................................................................................................... 186
7.8 Port Value-adding Services (VAS) Strategy Model ............................................................................ 191

10
7.9 Summary ....................................................................................................................................... 193
Chapter 8 - Conclusions ......................................................................................................................................... 195
8.1 Introduction ................................................................................................................................... 195
8.2 The Research Discussions ............................................................................................................... 196
8.3 Research Perspective & Methodology .............................................................................................. 197
8.4 Achievement of Research Aims and Objectives ................................................................................. 197
8.5 Exploration and understanding of value-adding services concept ......................................................... 198
8.6 Deployment of value-adding services in ports of developing and developed economies ................. 198
8.6.1 Availability of value-adding services ............................................................................................. 198
8.6.2 The extent of deploying value-adding services in ports .................................................................... 199
8.6.3 Awareness of value-adding services .............................................................................................. 200
8.7 Evaluation of port users‟ port selection criteria ....................................................................................... 200
8.8 Assessment of value-adding services‟ competitiveness in port .................................................... 201
8.9 Potential usage of value-adding services ................................................................................... 201
8.10 Importance of value-adding services ........................................................................................ 202
8.11 Influences on port management in strategy formulation .............................................................. 203
8.12 Employability of value-adding services in port‟s strategy ................................................................. 204
8.13 Research Propositions: Association of VAS to attraction & retention of port users .............................. 204
8.14 Port VAS Strategy Model ....................................................................................................... 205
8.15 Evaluation of Research ................................................................................................................. 206
8.16 Research Contributions to knowledge ............................................................................................. 206
8.17 Study Limitation and Further Research Opportunities ...................................................................... 207
References.............................................................................................................................................................. 208
Appendix 2 - Interview Schedule .......................................................................................................... 229
Appendix 3- Interview Excerpts ............................................................................................................ 233
Appendix 4- Results of Statistical Data Exploration from Ports in Developed Economies ........................... 237
Appendix 5- Results of Data Exploration of Ports in Developing Economies (Egypt) ................................. 248
Appendix 6 - Results of Statistical Data Exploration from Ports in Developing Economies (Nigeria) ......... 263
Appendix 7- Port Service Area, Qualifications and Years in Port Business ................................................ 275
Appendix 8 - Chi-Square Test Crosstabulation Distribution of Data .......................................................... 279

11
Figures
Figure 1.1 Attraction Potential of value-adding services ......................................................................................... 17
Figure 1.2: Retention potentials of valu 1 ................................................................................................................ 18
Figure 1 2 Retention potential of value-adding services in ports ............................................................................. 18
Figure 1.3 : A Triangulation of Research Approach ................................................................................................ 19
Figure 2. 2:„Simple-Constituent Service‟ ................................................................................................................. 40
Figure 2. 3: „Multi-Constituent Service‟ ................................................................................................................. 41
Figure 2. 4: Value Added Concept and Value-adding Services .............................................................................. 42
Figure 2.5: Port value-adding services theoretical model ........................................................................................ 47
Figure 3. 1: Research Philosophy [Clarifying Ontological and Epistemological views].......................................... 53
Figure 3. 2: The Research Perspective ..................................................................................................................... 55
Figure 4. 2: World Ten Top Container Ports (Source: Kruck and Julian, 2007) ...................................................... 80
Figure 4. 3: Ancillary services in Rotterdam Port (Source: Port of Rotterdam, 2007) ............................................. 82
Figure 4. 4 PD Teesport‟s map and geographical location (Source: PD Ports, 2008) .............................................. 83
Figure 4. 5: Teesport operations in other key UK ports (Adapted from: PD ports, 2008)........................................ 85
Figure 4. 6: The map and geographical location of the Damietta port. (Source Damietta Port, 2009) ..................... 88
Figure 4. 7: Egyptian Commercial Ports (Source: Egyptian Maritime Data Service (2009) .................................... 91
Figure 4. 8: Geographical location Map of Apapa Lagos Port (Source: Oyibosonline, 2007) ................................. 92
Figure 6.1: Areas of port services .......................................................................................................................... 116
Figure 6.2: Areas of port services .......................................................................................................................... 117
Figure 6.3: Mapping of port-user respondents‟ job designations ........................................................................... 119
Figure 6.4: Indications of availability of value-adding services ............................................................................. 122
Figure 6.5: Availability of value-adding services (The Rotterdam & PD Ports‟ perspective) ............................... 124
Figure 6.7: Availability status of value-adding services (Nigerian perspective) .................................................... 127
Figure 6.8: Importance of Value-adding services (Rotterdam and PD Ports‟ perspective) .................................... 139
Figure 6.9: Importance of Value-adding services (Egyptian Port perspective) ..................................................... 140
Figure 6.10: Importance of value-adding services (Nigerian Port‟s perspective) .................................................. 142
Figure 6.11: Potential usage of value-adding services (Rotterdam & PD ports) .................................................... 149
Figure 6.12: Potential usage of value-adding services (Damietta Egyptian Port perspective) ............................... 151
Figure 6.13: Potential usage of value-adding services (Nigerian port‟s perspective) ............................................. 153
Figure 6.14: UK port Traffic by type 1998-2008 (Source: Department for Transport, 2009) ................................ 158
Figure 6.15: Strategic dynamics of value-adding services Strategy ....................................................................... 162
Figure 7.1: Factor Extraction Scree plot ................................................................................................................ 172
Figure 7. 2: Port VAS Strategy Model ................................................................................................................... 191

12
Tables
Table 1.1: Chapters and Achievements .................................................................................................................... 21
Table 3. 1: Research Strategy Outline ...................................................................................................................... 57
Table 4. 1: Containers in Port of Damietta (Period 2000 - 2004) ............................................................................. 89
Table 4.2: Function Areas for NPA and Private Operators ...................................................................................... 94
Table 4. 3: Apapa Port Operators (Source: Nigerian Port Authority, 2007) ............................................................ 95
Table 4.4: Apapa Port Container Throughput (NPA, 2003) ..................................................................................... 96
Table 5.1: Categorical Variables (CV) & Scale Variables (SV) .............................................................................. 99
Table 5.2: Availability of Value-Adding Services (Rotterdam & PD Teesport) .................................................... 107
Table 5.4: Impact of VAS on Port Usage Frequency (Rotterdam & PD Teesport) ................................................ 108
Table 5. 5: Availability of Value-Adding Services ................................................................................................ 110
Table 5.6: Impact of Value-Adding Services on Attracting Port Users ................................................................. 110
Table 5.7: Impact of Value-Adding Services on Port Usage Frequency (Retention) ............................................. 110
Table 5.8: Preference of VAS * Impact of VAS on Attracting Port Users Crosstabulation ................................... 112
Table 6 1: Qualifications and Port Users years in Port Business ........................................................................... 120
Table 6.2: Availability of value-adding services (The Rotterdam & PD Ports) ..................................................... 125
Table 6.3: Availability of value-adding services (Egyptian Port perspective) ....................................................... 126
Table 6.4: Availability status of value-adding services (Nigerian perspective) ..................................................... 128
Table 6.5: Importance of Value-adding Services: Overall Statistics ...................................................................... 136
Table 6. 6: Importance of Value-adding services (Rotterdam & PD Ports‟ perspective) ....................................... 139
Table 6.7: Importance of Value-adding services (Egyptian Port perspective) ...................................................... 141
Table 6.8: Importance of value-adding services (Nigerian Port‟s perspective) ...................................................... 142
Table 6.9: Value-adding services Likely Usage: Overall Statistics ........................................................................ 148
Table 6.10: Potential usage of value-adding services (Rotterdam & PD ports) ..................................................... 150
Table 6.11: Value-adding service usage (Egyptian Port perspective) .................................................................... 152
Table 6.12: Value-adding service usage (Nigerian port‟s perspective) .................................................................. 154
Table 7. 1: Summary of information gathered from interviews with port management ......................................... 168
Table 7.2: Port users‟ port selection criteria variables (overall Statistics) ............................................................. 170
Table 7.3: Rotated (resultant) Component Matrixa ............................................................................................... 173
Table 7.4: Chi-Square Tests (VAS‟ port-users attraction potentials) ..................................................................... 177
Table 7.5: Attention- Fisher‟s Exact Test .............................................................................................................. 177
Table 7.6: Chi-Square Test Result (VAS‟ port-users retention potentials) ............................................................ 179
Table 7. 8: Extent of offering Value-Adding Services in the Ports ....................................................................... 181
Table 7. 9: Summary for level of awareness .......................................................................................................... 184
Table 7.10: VAS port model table ......................................................................................................................... 191

13
Chapter 1- INTRODUCTION
1.1 Introduction
Globalisation of trade has led to an increased importance of ports in the logistics and
supply chain network. As the significance of ports increases, fierce competition
between ports also intensifies as a result of a scramble for the cargoes of the global
economic boom (Haralambides et al.1997; Lobo and Jain 2002). Changes in
international trade and shipping greatly contribute to the ever-increasing competition
between ports (Yeo et al., 2011). The offering of value-adding services (VAS) is
perceived to attract and retain port users to a port. It is acknowledged that
deployment of value-adding services has been considered by Bowersox and Closs
(1996) and Christopher (2005) as one of the significant strategies to gain competitive
advantage. Therefore, there exists the need to investigate the potential of VAS in port
strategies.
This study aims to investigate and analyse the views of port-users and port
management towards the use of value-adding services in the formulation of port
business strategy. According to Slack et al. (2007) business evaluations are carried out
to enable informed learning for future development. In this vein, this research will
examine the suitability of VAS as a means for competitive strategy in ports through
an analytical examination of ports situated in both developing and developed
economies.
1.2 Research Background
Dynamism in business environments results in competition and a continual search for
strategy development. Competitiveness has been extensively researched (Ma, 2004;
Johnson, et al. 2005) and is associated with the strength a firm builds for the purpose
of gaining a stronger position in its industry. The 21st century has witnessed
competition even among firms in industries where rivalry has previously been
regarded as being low. In this respect, Powell (2001) indicated that there is a need for

14
a thorough assessment and reassessment of strategies, geared to create or regenerate
competitive advantage. Understanding the business environment will enable a firm to
build a suitable strategy (Chan, et al., 2000). Consequently, the knowledge of the
changing demands of port-users‟ businesses might assist a port to thrive better in the
port competitive environment.
Currently, ports are becoming increasingly complex, forming what can be described
as the most important node in the global network of supply chains. Haralambides
(1997) indicated that European ports alone handled approximately 2.5 billion tonnes
of cargo annually and have progressively become major nodes in the production-
distribution-chain. Ports generally do not have immunity against competition. As with
most other businesses, they seek to attract and retain a greater number of customers
(i.e. port users). In this light, it is becoming increasingly important that over and
above the offer of traditional services, ports‟ management should seek other means to
attract and retain port users.
According to Christopher (2005) value-adding services are powerful means by which
a firm can be differentiated so as to achieve a defensible advantage in the
marketplace. This is concerned with the capacity of a firm to attract customers and
businesses. On the other hand, it is also concerned with the ability of a firm to retain
customers, which as addressed by Dyer (1997) has to do with the possibility of a
customer who has previously had business transactions with a firm to remain loyal to
the firm‟s future businesses.
Value-adding services in this context are extras, unique or specialized services;
different from the generic offers and are tailored to meeting a customer‟s specific
needs (Bowersox and Closs, 1996). These are pointers that the availability of value-
adding services might be a reason for customers to patronise a firm.
This study therefore attempts to understand the views of port users about value-adding
services and the extent to which the services are deployed as a competitive strategy in
ports situated in developing and developed economies. Preliminary work in this area
revealed a dearth of specific and thorough research on the potential of value-adding
services in a port‟s competitive strategy. Value-adding services in ports have been

15
acknowledged (Bichou and Gray 2004; Ugboma et al., 2004), however these studies
were broadly carried out in relation to other features, such as cargo handling
equipment, turnaround time, ship sailing frequency and port efficiency which tend to
overshadow value-adding services. UNESCAP (2003) reported an investigation of the
rise in logistics activities that has boosted the commercial strengths of some global
ports and discussed value-adding services in ports as a means of encouraging port
business growth. While the present study‟s focus is to give thorough empirical
attention to assessing the intrinsic worth of value-adding services in port strategy
formulation, the steps in the research process would in themselves prove to be useful
insights in steering innovative strategies for port businesses.
Developing an appropriate conceptual research framework is crucial and is founded
on clearly identified research problems (Worcester and Downham, 1986; Emory and
Cooper, 1991; Brown, 2006). Examination of these key areas of literature thus forms
the conceptual framework or background of this study on which the research aims,
objectives and propositions shall be reported.
1.3 Research Details
1.3.1 Title
„Value-Adding Services (VAS) as Competitive Strategy: A Multiple Case-Study
Analysis of Ports in Developing and Developed Economies‟
Note: This topic was chosen because the research investigation is on value-adding
services‟ capacity or potential in port business strategy. The reason for having the
second part of the topic is because in order to examine value-adding services, case
study ports were chosen from ports situated in developing and developed economies.
1.3.2 Research Aims
(1) To explore the knowledge and perspectives of the value-adding services‟
concept.
(2) To investigate and analyse how value-adding services are deployed in the
ports of developing and developed economies.
(3) To examine and evaluate the influences on port users‟ selection of ports.

16
(4) To assess the suitability of value-adding services as a means to achieving a
port‟s competitiveness.
(5) To evaluate decision-factors in port management formulation of strategy.
(6) To develop models for the deployment of value adding services in ports‟
strategy.
1.3.3 The research objectives
For each of the six (6) aims in section 1.3.2 above, the consequent means (objectives)
of achievement are presented as follows:
1. -To survey how value-adding services are carried out in ports (literature and
questionnaire)
2. -To examine and analyse value-adding services as offered in samples of port
representative of both developing and developed economies (literature,
questionnaire and interview, case study ports‟ database)
3. -To identify various other possible reasons for increased patronage to a port by
port-users (literature and questionnaire)
-To examine how logistics operations influence port users‟ selection of ports
(questionnaire, literature)
4. -To seek understanding of the adequacy of value-adding services in the port
system context (literature, questionnaire and interview, case study ports‟
database)
-To explore the importance of logistics services in the maritime sector
(literature)
- To critically assess data from literature, questionnaire, interview and case
study ports‟ database
5. -To examine factors affecting port management‟s formulation of strategy
(interviews, port database)
6. -Use of statistical packages to manage and support analysis of all
questionnaire quantitative data
-Thematic inferential analysis of qualitative data from interviews and
comments from semi-structured questionnaire
-Analytical integration of information from literature, questionnaire, interview,
case study ports‟ database, experience and intuition

17
1.4 Propositions
Propositions 1
Using figure 1.1, which illustrates the possibility of VAS pulling port-users to a port
from other ports‟ hinterlands, a proposition is hereby presented.
The first Research Proposition is: ‘‘the patronage level to a port by port-users is
associated with the value-adding services obtainable from that port’’.
*Note for figure 1: PU represents Port Users and the arrows show the „patronage pull‟
to either port A or B. This shows the possibility of VAS being able to pull port users
to a port from another port‟s hinterland. In this line, the null proposition would be that
„the patronage level to a port by port-users does not have any relationship to the
value-adding services obtainable in that port‟.
Figure 1.1 Attraction Potential of value-adding services (Source: Author)
„Value-
adding
services
‟
‘Focused
on basic
services‟
P U
P U
P U
P U
P U
P U
P
U
P U Port A Port B
P U

18
Proposition 2
Value-adding services and retention of port users in a port
The second Research Proposition is: ‘‘the capacity of a port to retain port-users is
associated with the value-adding services obtainable from that port’’.
* Note: The second research proposition is supported by figure 1.2, which depicts the
potential of retaining port users in a port as a result of the presence of value-adding
services. In this line, the null proposition would be that „„the capacity of a port to
retain port-users does not have any relationship to the value-adding services
obtainable from that port‟‟.
PORT
PORT Value-
adding
services
Value-adding
services
Figure 1.2:
Retention
potentials of valu
1
Value-adding
services
Value-adding
services
Value-adding
services
Port Users
Figure 1. 2 Retention potential of value-adding services in ports (Source: Author)

19
1.5 Research Methodology
In this research, both the objective (related to quantitative and hypothesis testing) and
subjective (qualitative related) approaches to research were used so as to gain from
their complementary benefits. Figure 1.3 illustrates the triangulation of research
strategy used, namely: the review of literature, use of questionnaires and interview.
The reason for research triangulation in this study is to reach informed and validated
research outcomes by thoroughly accessing, processing and assessing research data
from different sources, as encouraged by Boyer and Swink (2008).
With the aid of figure 1.3, the research methodology is explained under the following
headings:
1.6 Secondary Data (Reviewing the Literature)
The areas under review include an understanding of services, port services, value-
adding services, strategy, port competition, case study ports and strategy. The review
of literature was set out in a manner to help identify various key issues in the research
topic and also as a foundation in developing questionnaires and interview schedules
for the gathering of primary data.
Questionnaire Survey Interview process
Literature Review
Figure 1.3 : A Triangulation of Research Approach (Source: Author)

20
1.7 Questionnaire
The use of questionnaires is a versatile means of surveying the views of a research
population and can be in different formats (Saunders et al., 2007). It is an appropriate
method for this research because it can be designed in a way as to enhance the
drawing of data from accredited port users (shipping companies, shipping agents,
freight forwarders, stevedores, importers and exporters).
1.8 Interviews
Interviews provide an opportunity for gathering ideas from knowledgeable
professionals. The method offers a great deal of flexibility in obtaining the opinions
and experiences of practitioners. The choice of interviews was made so as to allow an
in-depth discussion of various research issues with port management and
professionals to support the cross-examination of opinions of port users from the
questionnaires. For further explanation on questions for gathering research data and
intended analysis techniques, see section 3.3.3
1.9 Reasons for Selecting Case Study Ports
Given the major aim of ensuring a reasonable opportunity to understand value-adding
services‟ potential, the study deployed multiple case studies of ports situated in
developing and developed economies. The use of multiple case studies in research can
offer a focused understanding of a subject from different sources (Yin and Heald,
1975; Yin, 2009). In a review of the use of case studies in logistics research,
Dinwoodie and Xu (2008) indicated that the deployment of multiple case studies in
this area of research is on the increase, with variations to suit different objectives. In
the present study, selected Nigerian and Egyptian ports in developing economies and
those from UK and The Netherlands in the developed economies will be investigated.
The main reason for the choice of countries is that they all have well recognised
maritime business history. The reasons for choosing the ports are mainly because they
all handle general (various) cargoes, face competition and are major ports in their
various countries and regions.

21
1.10 Research Structure in Relation to Research Aims Achievement
Table 1.1 presents the research structure in relation to the research aims achieved in
the various chapters.
Chapters & Achievements
1. Chapter one: Chapter 1 introduces the research with its details on
understanding value-adding services‟ potential in port strategy. It pointed to
areas to be covered in the research project.
2. Chapter Two: Chapter 2 presents various relevant issues and theory in this
topical area. While giving attention to other areas, it will particularly enable
the exploration of knowledge and perspectives of value-adding services.
3. Chapter Three: Chapter 3 presents relevant aspects of research methodology.
The critical realist approach to understanding reality will be adopted in this
study.
4. Chapter four: The four case study ports (Rotterdam, PD Teesport, Damietta
and Apapa) shall be given focused discussions in chapter 4. Investigations and
analyses in the chapter will support the understanding of how value-adding
services are deployed in ports situated in developing and developed
economies.
5. Chapter five: Chapter 5 primarily presents some of the preliminary analyses
carried out, with regards to data collection, piloting, validity, reliability and
other statistical perspectives.
6. Chapter six: Chapter 6 reports the results of various analyses carried out to
reach the set research aims. Discussions on findings will enable the
triangulation and integration of all collected research data.
7. Chapter seven: Chapter 7 discusses further in-depth and inferential analysis,
to enable analytical examination and informed recommendations. Areas to be
covered include testing of propositions, presenting of port VAS model,
assessing the suitability of value-adding services in ports and the evaluation of
other influences on port management in strategy formulation.
8. Chapter Eight: Chapter 8 concludes the research work by summarising the
findings of the study. Recommendations will be made based on findings.
Contributions of the study and areas for possible future research shall be
discussed.
Table 1.1: Chapters and Achievements
22
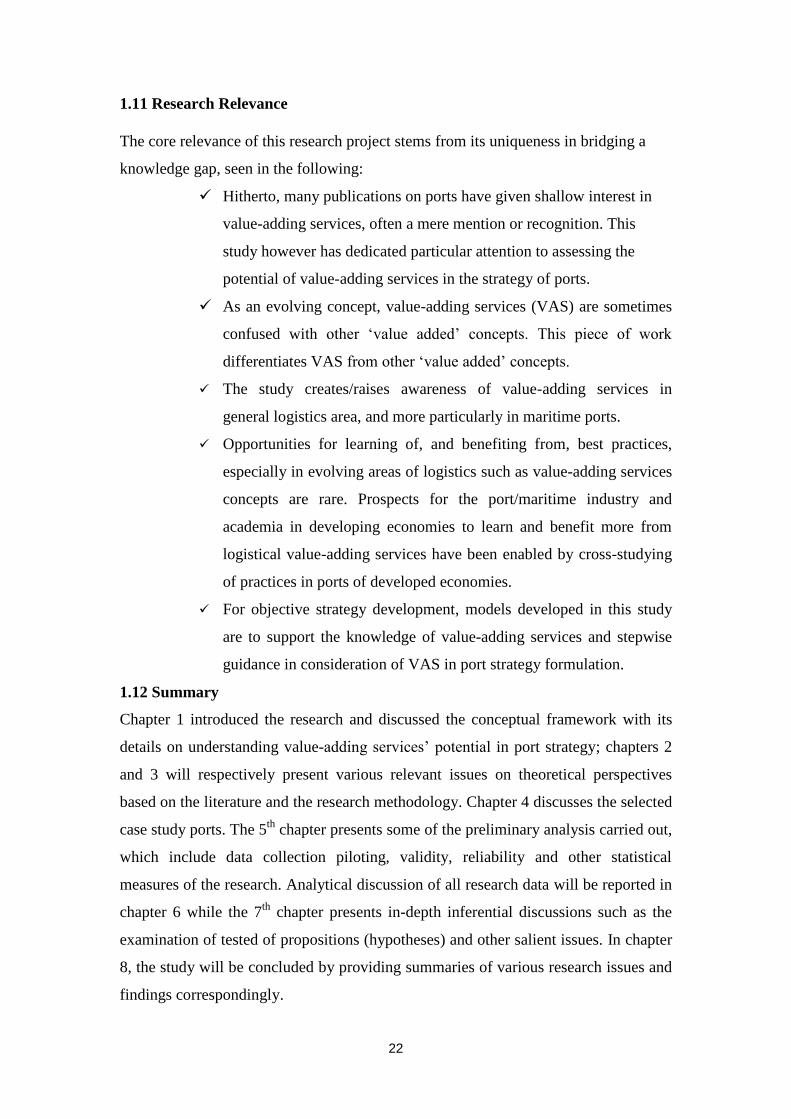
1.11 Research Relevance
The core relevance of this research project stems from its uniqueness in bridging a
knowledge gap, seen in the following:
Hitherto, many publications on ports have given shallow interest in
value-adding services, often a mere mention or recognition. This
study however has dedicated particular attention to assessing the
potential of value-adding services in the strategy of ports.
As an evolving concept, value-adding services (VAS) are sometimes
confused with other „value added‟ concepts. This piece of work
differentiates VAS from other „value added‟ concepts.
The study creates/raises awareness of value-adding services in
general logistics area, and more particularly in maritime ports.
Opportunities for learning of, and benefiting from, best practices,
especially in evolving areas of logistics such as value-adding services
concepts are rare. Prospects for the port/maritime industry and
academia in developing economies to learn and benefit more from
logistical value-adding services have been enabled by cross-studying
of practices in ports of developed economies.
For objective strategy development, models developed in this study
are to support the knowledge of value-adding services and stepwise
guidance in consideration of VAS in port strategy formulation.
1.12 Summary
Chapter 1 introduced the research and discussed the conceptual framework with its
details on understanding value-adding services‟ potential in port strategy; chapters 2
and 3 will respectively present various relevant issues on theoretical perspectives
based on the literature and the research methodology. Chapter 4 discusses the selected
case study ports. The 5th
chapter presents some of the preliminary analysis carried out,
which include data collection piloting, validity, reliability and other statistical
measures of the research. Analytical discussion of all research data will be reported in
chapter 6 while the 7th
chapter presents in-depth inferential discussions such as the
examination of tested of propositions (hypotheses) and other salient issues. In chapter
8, the study will be concluded by providing summaries of various research issues and
findings correspondingly.

23
Chapter 2 - Theoretical Perspective of Research
2.1 Introduction
This chapter is principally an analytical examination of relevant publications by other
scholars and organisations in connection with this research area. The relevance of
insights gained by thorough review of the literature in the quest to understand past and
present events or knowledge in a particular area of study cannot be overemphasised
(Kervin, 1992; Booth, 2003; Hofstee, 2006). By the review of the literature therefore,
this chapter presents the theoretical base and builds the conceptual framework of this
study, upon which further investigations to meet set research aims can be carried out.
Some of the main areas covered in this chapter include strategy, maritime ports
logistics trends, competition in global maritime ports, choice of port factors,
understanding services, value-adding services and „value-added concept‟, and value-
adding services in port logistics.
2.2 Focus on Strategy
Strategy is concerned with the direction and scope of an organisation over a long term
(Johnson et al. 2005). It encapsulates the logical setting and understanding of policies,
methods of control, goals and principles for which resources and competencies are
accordingly configured so as to attain the core purposes of the organisation in the ever
changing business environment (Jenkinson, 1995). A wide range of corporate
behaviour is described in the framework of an organisation‟s strategy. While
recognising the difficulty in reaching an all accepted definition of strategy, Wit and
Meyer (2004) put forward that it is conceived as a course of action for achieving an
organisation‟s purpose. Though strategy might be change-related, it is also about
stability and maintaining the status quo (Fletcher and Hardill, 1995). Porter (1980)
held that corporate strategy provides a coherent model for all business units and
ensures that all those involved in strategic planning and implementation follow
commons goals. The various ongoing opinions on strategy point to the fact that it has
a capacity to focus an organisation on the course of actions to achieve set goals.

24
The subject of strategy has received wide attention from scholars and practitioners
and has been subjected to varying perspectives and interpretations of meanings.
Hence, there really tends to be a „no fit for all‟ nomenclature and inclination to
strategy. As acknowledged by Professor Porter of the Harvard Business School:
„Strategy is a difficult word, but whatever people want to call it, there is something
out there which means positioning oneself more effectively than one‟s competitors to
meet customers‟ needs (Porter, 1980). This referred positioning is connected with
strides to reaching and maximising the purpose of being in business, reflected in the
aims and objectives of organisations. In practice, it is recognised that most
organisations do their businesses in a very dynamic market environment. Some of the
factors that have made the contemporary business arena increasingly complex include
technology, rapid changes in customer expectations, globalisation and competition.
As the business environment becomes more challenging, most players tend to
consider and reconsider the ways to steer their organisations to fulfilling the
expectations of their stakeholders. Consequently, organisations are given clear focus
on how to progress and the extent to which business activities can be run in a
particular period of time. For success in business, Frankel (1989) suggested that
meaningful strategic objectives must be developed to reflect the goals. Given
dynamism in business, Miles and Snow (1984) and Pfeffer and Salancik (1978)
advocated that the development of strategy should be an issue of high priority so as to
consistently align the direction of an organisation with the market environment.
This dynamism in the market environment necessitated the recommendation by Porter
(1985) that in order to maintain superior performance in an industry, firms amidst
strong competition should consider continual strategizing for competitive advantage.
As a prerequisite to attaining competitive position in an industry, Mattson et al.
(2006) argued that a pivotal feature of building strategy is in knowing how to
construct a successful mechanism to deliver value to the market. They maintained that
the knowledge of this mechanism is particularly found among those who operate at
the frontiers of firm-customer interface. This line of thought put customers and
awareness of customers in the front line of priorities, if a firm is to attain and sustain
competitive position in its market. An example of strategy which involved this sort of

25
direction alignment was found in a report by Parola and Musso (2007) about shipping
liners (carriers) resorting to the deployment of large vessels and multi-port as a result
of changing demands of customers.
Strategy therefore can be said to provide the driving force by which an organisation‟s
goals and objectives are pursued, giving a pattern of both proactive and reactive
policies and actions. There is a tendency to view corporate strategy as emanating from
the urge to give solutions to problems or challenges faced by an organisation at a
particular time. It might be preconceived, hence referred to as intended strategy or
somewhat ad hoc, in which case it can be described as emergent strategy (Wit and
Meyer, 2004; Johnson et al. 2005). Although it might seem like stating the obvious to
say that strategy involves innovative processes, however Lopez-Fernandez et al.
(2008) reported that the pattern and manner of innovation in the service sector have
received little research attention, while emphasising the fact that the service sector is
of great importance in the growth of economies. The logistics industry can be referred
to as an important aspect of any economy and hence requires continual research
attention.
2.3 The 3-Dimensions of Strategy
As a result of the divergence of the philosophy of strategy, many perspectives have
evolved. However, in order to further understand the notion of strategy some of the
fundamental aspects for discussion include the process, content and context of
strategy. These aspects of strategy process, content and context are distinguishable
three-dimensions of strategy (Wit and Meyer, 2004).
2.3.1 Strategy Context
Organisations do not exist in isolation but are embedded in an environment where
there is an exertion of phenomenal influence on their strategy and operations. The
notion of strategy context therefore is concerned with exploration of an organisation‟s
internal strength in relation to understanding the impact of the external environment
such as the industry, politics, economy, technology, legislation, geographical location
and the physical environment in the course of establishing a corporate direction

26
(Johnson et al. 2008, Wit and Meyer, 2004). As far as corporate strategy is
concerned, the components that make up the strategy context are becoming
increasingly complex, resulting in an ever dynamic rise of threats and opportunities to
an organisation.
For instance, in addressing strategy issues with regards to performance evaluation and
control, Johnson et al. (2001) reiterated that many firms have taken initiatives for
organisational change so as to sustain and improve their competitiveness. In this
sense, a firm can decide to play a significant proactive role in shaping the context in
which its strategy is formulated and business operated, thereby exercising leadership.
On the other hand, a firm can become more inclined to reactions in the context of its
strategy, responding to trends surrounding its existence.
2.3.2 Strategy Content
There are widespread alternatives in dealing with issues of strategy. In addressing any
particular organisational strategic issue, the chosen constituent(s) or the course of
action(s) that finally become the product of the formulated direction is referred to as
strategy content (Wit and Meyer, 2004; Johnson et al., 2008). These strategy-building
materials are thus different at the various strata of a firm, depending on the nature of
strategy being pursued.
In a related perspective, Grant (2010) encouraged objective appraisal of resources, to
enable effective decisions concerning choice of strategy constituents. Painstaking
research efforts should therefore be put in place in the development of strategy
content so as to achieve success in a particular endeavour of interest.

27
2.3.3 Strategy Process
There are literally several ways in which business issues can be addressed. In essence
therefore, strategy process is concerned with the approach or means by which an
organisation addresses strategic issues and puts into action the formulation and
management of its chosen strategies (Hill and Jones, 2007; Johnson et al., 2008).
Traditionally, strategy process is considered to be linear-stepwise stages of analysis,
formulation and implementation, but this view has received strong criticism by
strategy scholars who propagate imagination and judgement as being more important
than analysis and logic (Wit and Meyer, 2004). When viewed from another angle,
strategy development process falls into two approaches, the „classical‟ school of
thought or planning approach towards strategy formulation and the „emergent‟
approach (Mintzberg, 2007; Johnson et al., 2008; Kenny, 2006; Whittington, et al.,
2006; Bamford and Forester, 2003; Mintzberg, 1994).
Whereas the conventional view is a planned strategy process, arguments that strategy
does not necessarily follow such stereotypical stages have enhanced understanding of
an aspect of strategy process as being emergent. According to Johnson et al. (2008),
the strategies organisations actually pursue are mixtures of both planned (intended)
and emergent strategy processes.
2.4 Maritime Ports Logistics Service Trends
Re-engineering of an organisation‟s services is associated with strategy formulation
and has been identified as being very important (Edvardson, 1992; Mascio, 2007) as a
positive response to market competition and ever increasing customer demands. As
competition increases between ports, it becomes more meaningful to give categorical
attention to the various trades (businesses) of a port. Goss (1990) stated that the extent
and form of competition concerning port‟s trade might have considerable variations in
ports at different phases. For example, new ports would concentrate on new inland
links and the development of cargo-handling systems. The implication therefore is
that suitable and competitive strategies during the different stages of port

28
development should be dynamic and proactive in nature. In order to be able to
develop strategies in ports therefore, it is imperative to explore and have a profound
understanding of the services for which maritime ports are in business.
2.4.1 Integrated Port Logistics
According to Bichou and Gray (2004) the major concepts concerned with integration
of the supply chain are inter-modality and organisational aspects of integration.
Modern ports have generally experienced rapid developments in becoming inter-
linking points for different modes of transports, hence an accelerator of inter-modal
transport integration. Mangan et al. (2008) supported the view that in addition to the
traditional role of freight transhipment, there are various roles the ports can play
within the supply chain. Also, given the position of ports in the distribution of
materials and products, they have consequently become nodes for the integration of
various global supply chains. An example of a port that has a developed integrated
logistics system is the port of Singapore, which is one of the world‟s top hub ports for
the facilitation of distribution and related services (MPA, n.d).
The emergence of the containerisation of cargo, an innovation by Malcom McLean in
1956 (Cudahy, 2006), has increasingly contributed to modern ports‟ economic
importance, complexities and roles as major integration nodes for transportation
networks (Fetherston, 1984; Lowe, 2005). This has boosted the evolving notion of
„port centric logistics‟, advocating the potential of ports to be centres for the provision
of distribution and other supporting activities (Analytiqa, 2007; Wall, 2007). These
depict the advancement of ports from the integration of internal activities to the
integration of logistics activities beyond port boundaries to the network of transport
and supply chains.
2.4.2 Trends in Modern Shipping
Mega-ships have emerged to handle the transportation of cargoes of the global
economic boom. The use of larger vessels by shipping lines is mainly to take
advantage of the economies of scale created by the movement of large volumes of
goods. There has also been an appreciable rise in the number of small and medium

29
sized sea vessels, most of which are used for feeder-services to mega-ships whose
sizes oftentimes restrict them from sailing further into territorial waters, and hence
having to berth midstream. The prominence of shipping companies and their
involvement in various port logistics and inter-modal operations have consequently
put shipping lines forward as the prime actors in ports and choice of ports (Voorde
and Winkelmans, 2002).
Increasingly, various collaborations among shipping lines have evolved, making ship
operators very influential even in issues of port strategies. Martin and Thomas (2001)
supported this view, stating that the formation of global alliances and consortia among
shipping lines favours them in exerting considerable pressure on ports; not just to
improve productivity and provide new facilities, but also to renegotiate port charges
and terminal contracts. While Parola and Musso (2007) recognised the growing
influence of shipping lines on ports as a result the formation of consortia, they
reported changing trends among the top shipping lines players (e.g. Maersk,
Evergreen, MSC, CMA-CGM) in which the need for alliances as a competitive
strategy among the global carriers is disappearing.
These trends in shipping are largely directly concerned with the shipping lines; and
given the focus (aims and objectives) of this study, other port users and businesses
worth consideration include:
o Stevedores: Generally, stevedores are companies or units (traditionally small)
that are designated by shipping lines and ship agents to primarily engage dock
labour to stow or unload cargoes onboard marine vessels (Martin and Thomas,
2001; Branch, 1977, Soppe et al. 2009). Given the surge of international trade,
ports have increased in relevance in the global market, resulting in the
emergence of gigantic shipping lines as the major means for worldwide mass
cargo transport. In this light, it is only natural that other companies involved in
the activities of the ports would rise to the challenge by a corresponding
growth.
Parola and Musso (2007) reported that as new economic trends began to
surface in the ports (such as privatisation and merger of shipping lines),
globalisation of the stevedoring business began with global operators as

30
Hutchison Port Holding and PSA leaving the shores of their bases in Hong
Kong and Singapore, respectively, so as to strengthen their competitiveness in
the business. Today, a number of key shipping lines in the bid to facilitate
their interests and operations in ports have through different deals, become
active members of the stevedoring industry.
o Shipping Agents: It has been typically the case that shipping lines, given that
most of their operations are abroad, or rather global, appoint shipping agents
to act as representatives. Shipping agents services include making prior
arrangements for vessels‟ arrival and carrying out ship husbandry duties such
as load brokering, cargo booking, document handling and payment collection
from shipping lines‟ customers (Branch, 1977, Martin and Thomas, 2001).
Hence, it is recognized that shipping agents provide fundamental services for
the effective running of shipping line‟s businesses.
A particular strength of shipping agents, to the advantage of the shipping lines,
is the ability to use local knowledge to liaise and provide necessary
information about the call and departure of vessels to the customs,
immigration departments, port health, berth officers and others (ICS, 2007).
For improved efficiency, local knowledge of a particular market terrain is
crucial, especially in global businesses such as the shipping and port
industries.
o Freight Forwarders: For individual shippers or companies who do not have a
dedicated shipping department, freight forwarders act as their specialist
agents, coordinating the majority of maritime and inland transport operations
to facilitate cross border movement of goods for which a fee or commission is
paid (Murphy and Daley, 2001; Martin and Thomas, 2001). At times some of
the services of different port users could be seen as overlapping, as a result
there can be various slight offshoots in an attempt to define freight forwarding.
The freight forwarding business is typically global in nature, and in recent
times has become more and more diversified, offering various intermediary
services like freight payment, route recommendations and expedition of

31
shipments (Murphy and Daley, 2001). These are clear pointers that the freight
forwarding port business is rapidly expanding. MBD reported that in 2007 the
UK freight forwarding market reached an estimated value of £16.62 billion,
which represented a 3% increase (MBD, 2008). Also, the choice of port is
mostly determined by shippers and forwarders (Port of Rotterdam, 2009a).
More often than not, it is expected that shippers, being the owners of goods to
be exported to consignee(s) would have greater influence on the choice of
port. However, the report of the port on the increasing capacity of freight
forwarders in determining choice of port reiterates their increasing importance
in the port industry and indeed the maritime sector.
2.5 Competition in the Global Maritime Ports
Contrary to what used to be the case in the 19th
and first half of the 20th
centuries,
during which ports were regarded as instruments of states and colonial powers to
control markets resulting in minimal competition, most ports are today competing
tremendously on a global scale (The World Bank, 2007). There has been a unique
trend of business expansion and competitive strategy in the maritime sector, as
observed in the emergence of global ports operators, who in addition also run
shipping lines. Ports are fundamental bodies in global shipping and logistics (Bichou
and Gray, 2004), and the evolution of global port operators is viewed as an indicator
of the attempt of ports to gain further control of the supply chain. According to Cheon
(2009), the most distinguished issues that have necessitated port restructuring to the
intensification of global operators are the forces of intra- and inter-port competition.
By implication therefore, the relevance of ports in the global business chain has
exacerbated competition between ports.
It is crucial to point out that Haezendonck and Winkelmans (2002) viewed port
competitiveness as a reflection of the strengthening or weakening of market share in
various traffic categories. Increasingly, competition between ports has brought about
multifaceted demands on the management of ports to satisfy diverse customers and
remain in an enviable business position when compared to other ports. Different
forms of port competition are known to exist among operators in the same port,
between ports in a particular country, ports in different countries and ports in a range

32
or coastline (Mangan et al. 2008; Goss, 1990). An example of coastline or range port
competition is that which exists along the Le Havre-Hamburg range, which stretches
from France to Germany. According to Martin and Thomas (2001) ports‟ terminal
operators in Europe have experienced a highly competitive environment, in a tussle to
retain or attract shipping lines‟ businesses. Shipping lines are undoubtedly, the „chief‟
among port users.
The thrust to retain and attract port users has been a core goal of all maritime ports.
This therefore underscores the basis of the propositions (see section 1.4). This is in
line with the recognition that the competitive tussle between ports is mainly geared
towards attraction and retention of port users, and achievement of the most efficient
total service (Heaver, 2006; Voorde and Winkelmans, 2002). As is the case in other
businesses where customers are the vital focus for strategy, the attraction and
retention of port users are the main reasons for port competition.
Most ports therefore invest in the various aspects of their businesses in an attempt to
attract and retain port users. The level of returns received as a result of investment on
new port facilities depends on the investments made by competing ports (Anderson et
al., 2008), as there would tend to be a cargo shift from the old and less efficient
facilities to the newer and more efficient facilities. This is a pointer to the view that
investing for improved port facilities can be a formidable force in the attempt to
competitively draw more ports users and cargoes. Does it then imply that old facilities
are commonly inefficient? This might not be the case. As strides in international trade
and shipping encourage competition (Yeo et al., 2011), some of the factors that can
further influence the competitiveness of ports according to Voorde and Winkelmans
(2002) include the type of port management, the level of expertise of managers and
port authorities, good application of EDI, government intervention and added value.
Also as rightly observed by Carbon and Martino (2003), the competitive position of
ports is no longer determined by internal strengths alone, but is increasingly
dependent on the effectiveness of their integration with the supply chain. It is
understood in this light that the strategies of customers in the supply chain can hugely
affect port users‟ patronage to a port. Thus the entry of port users into business
contract with other supply chain stakeholders with different interests in choice of
ports can be enough to cost a port good proportion of its business.

33
2.5.1 Hierarchies of Port Competition
Similar to the complexities of modern ports, competition between ports has also
assumed a complex nature from various frontiers (Ducruet et al. 2010; Ircha, 2001).
The intensity of competition a particular port experiences varies widely according to
issues which include location and nature of goods handled. While some economies
have one or few dominating ports, others such as Great Britain, have many ports.
Competition therefore increases, as a result of numerous ports and also because of
other factors as good internal transport systems (Goss, 1990). In connection with port
competition, it is a well known principle of port geography and port economics that
no port is an isolated phenomenon, but belongs to a port group, hierarchy or complex
which is functionally interrelated on a local, national or international level (Hoyle and
Charlie, 1995).
A port therefore, has some natural or built features, for example location and a
developed integrated transport network, which largely determine its functional
hierarchical status, and in turn reflects the type of competition it might experience.
Since some of the features of a port are prone to changes, it thus implies that there is
an expectation of phenomenal dynamism in the level or hierarchy of competition a
port might face amidst other proactive ports.

34
Figure 2.1 identifies the different hierarchies of port competition.
Figure 2. 1: Hierarchies of Port Competition
2.5.2 Intra-Port Level Competition
Competition at intra-port level is viewed as the first level of port competition, where
different terminal operators in a particular port vie for goods. In this level (feature
„1‟) as illustrated in figure 2.1, the competition among operators ( A, B, C….) in the
same port is shown in various categories (i.e. Cat. 1, 2, 3). That applies to traffic for
ports X and Y respectively. Active intra-port competition is perceived to be beneficial
for a port‟s competitiveness, national and regional economic growth and ultimately
for shippers and consumers of goods and services (CEU, 2004; Langen and Pallis,
2007). The trend of intra-port competition is expected to continue as more and more
ports become privatised and with a greater participation of global port operators. It is
believed that rather than mar a port‟s position in the industry, well harnessed intra-
port competition could strengthen a port‟s prowess in attraction and retention of port
users.
[Source: Voorde & Winkelmans (2002)]

35
2.5.3 Terminal Level Inter-port Competition
A situation where terminals of different ports compete is referred to as terminal level
inter-port competition. Voorde and Winkelmans (2002) are of the view that this type
of competition mostly occurs between terminals in ports like Hamburg, Bremen,
Amsterdam, Rotterdam, Antwerp, Ghent, Zeebruges, Dunkirk and Le Havre (i.e. the
Hamburg – Le Havre range), which have common route and geographical areas
overlapping each other‟s hinterland. It is worthy of mention at this point that the
overlapping of seaports‟ hinterlands, as held by Goss (1990), has been grossly
encouraged by the development of inter-modal transfer systems and improved long-
distance land transportation network.
2.5.4 Inter-Port Competition (Authority Level)
With reference to the feature „3‟ in figure 2.1, inter-port competition is concerned
with competition between ports on a local, national or regional basis. It has a
significant influence on the type of infrastructure and superstructure provided in a
port, hence also impacts on terminal operations. Competition between ports in
different countries can result in significant effects on national policies, where some
kind of expansion support and publicity are given to ports, because of national pride
(Goss, 1990; Doonslaar and Kolkman, 2010).
Some other forms of competition that port authorities grapple with include:
Port Range Competition: Otherwise referred to as coastline competition; where
ports roughly situated along a common route engage in competition.
Maritime Ports versus other transport modes: Non-maritime transport modes that
mainly use other kind of terminals (nodes), for example airports, have
increasingly competed for cargoes that pass through seaports.
36
2.5.5 Privatisation of ports (concession)
One of the distinct strides that have contributed to the spurring of competition among
ports is privatisation. Privatisation of ports dates back to the early 1980s, with the
establishment of Associated British Ports (ABP) and its opening for private investors;
this move which began in Britain continued in many other countries such as Malaysia,
Philippines, Italy, Thailand, China and New Zealand (Parola and Musso, 2007). To a
great extent, it is believed that allowing private investors, instead of governments, to
be key players and leaders in businesses, not just in ports, would encourage market
forces that results in balanced competition in business. There have been extensive port
reforms in recent past decades, which led to many governments in both developing
and developed economies having to devolve less of port operations and assets to local
public entities, but increasingly to private and commercial driven entities (Brooks and
Pallis, 2008). These reforms are fundamentally about structural change, which
according to Citen and Cerit (2010) has also been encouraged by the need for ports to
retain competitiveness.
2.5.6 Port Privatisation Trends
One of the key recent strands of policies aimed at improving efficiency in the port
industry is privatisation, which among other reasons is primarily motivated by the
economic benefits (Cullinane and Song, 2002). The term privatisation has evolved to
be related to different facets of concepts such as liberalisation, deregulation and
denationalisation. Within an economic context, privatisation essentially means the
sale of publicly owned assets by the transference of ownership from public to private
sectors (Thiemeryer, 1986). The perspective or argument of privatisation advocates is
that the scheme will create greater operational efficiency. On the other hand, the usual
contention by opponents is that the profit drive of private firms will result in the
exploitation of customers. With these different arguments in view, a study of the
world‟s top 100 container ports by Baird (2002) reported that while there is no
particular approach to port privatisation, findings generally pointed to the public port
authority/private concession or lease model as being used more often than others.
Tongzon and Heng (2005) advocated that the landlord-operator‟s structure (public and
private) form of privatisation is more appropriate for improving port operation

37
efficiency, as opposed to full privatisation. Thus, they concluded that this form of
partial port privatisation is an effective means for port authorities and operators to
gain competitive advantage.
The privatisation of port initiative which started in a developed economy (Parola and
Musso, 2007), has since been considered as necessary for ports of developing
economies in order to achieve greater efficiency in port operations (Shashikumar,
1998; Neil, 2004). Therefore, the decision for privatisation and the model of
privatisation to be adopted in a port are substantially concerned with the port‟s
strategy and competitiveness.
2.6 Main Influencing Factors in Choice of Ports
This section is dedicated to considering some of the influencing factors in the choice
or preference of a port over others. Contemporary technological advances have
continued to have impacts on port users‟ choice of port. In fact, these advances have
and are expected to keep exerting influences on other port selection criteria. Some of
the major factors of influence in port selection are discussed below.
2.6.1 Cost and Pricing
There is an indispensable influence emanating from generalised cost on the choice of
port (Voorde and Winkelmans, 2002). These generalised costs include peril of loss,
cost of time, money expense and damages. For instance, ship turnaround time in a
particular port is a very important element in determining the choice of port. This
consideration of time is particularly crucial in order to avoid the costs of demurrage
and delays in meeting other schedules, especially for ships on time voyage charter.
The indication here is that shipping lines, shippers and other port users, make
assessments based on cost elements, and thereafter reach informed decisions.
For pricing however, Anderson et al. (2008) indicated that it can essentially be
determined by competitive market forces or by joint agreement between the ports to
maintain market shares, and check imperfect market competition. Competition is a
major factor that has stimulated the pressures of rising prices in the transport sector
(MBD, 2008).

38
2.6.2 Cargo Handling Facilities
The trend towards the use of larger ships makes it often the case that large ships can
only be received by larger ports which have well developed facilities (Department for
Transport, 2006). By inference, cargo handling facilities are of paramount importance
for port users‟ businesses. In a competitive game-theoretic analysis of Busan (Korea)
and Shanghai (China) ports, Anderson et al. (2008) indicated that an investment stage
would be reached where competing ports do not receive returns (attraction of cargoes)
on investments, because one port‟s investment would be counterbalanced by
another‟s. Ports can differentiate their services by paying attention to the speed of
loading and unloading of cargoes for ocean carriers and inland vehicle carriers
(Talley, 2006). The availability of superstructures in ports is one of the most
important port-rating factors; and their not being readily available contributes to
major delays in ports (Murphy et al., 1989).
2.6.3 Inland Infrastructural Network
Connectivity and accessibility with the hinterland is crucial for a port‟s business.
Haezendonck and Notteboom (2002) viewed the competitiveness of a port as being
only partly determined by its internal strengths and weakness, emphasising that
influences of the logistics network also affect its prosperity. For instance, ships are
likely to use ports which have railheads and good access to a major road system
(Department of Transport, 2006). Other types of relevant infrastructural needs in ports
include storage facilities, safety and security gadgets and administrative centres.
2.6.4 Size of Vessels
The latest generation of container ships have the capacity of almost 10,000 TEUs
(Twenty foot Equivalent Units), and as a result shipping lines have reduced the
number of ports they serve directly (Department of Transport, 2006). This can largely
be traced to constraints of manoeuvrability imposed by huge ship sizes in relation to
the routes and channels leading to ports that are further inland. Such emergence of
huge modern seagoing vessels has been possible given advancement in technology.

39
2.6.5 Location (Geography)
The geographical locations of ports are certainly important for port users while
considering ports to use for shipment of cargoes. For instance, a key advantage of
Dubai is that it is ideally positioned along the trade corridor between Europe and
Asia, thus the Dubai government has constantly sought to exploit this advantage in
competitive positioning DPW (Dubai Ports World) (Mangan et al., 2008). A port
might be located in an area of better proximity to main shipping routes or where
effects of tidal movement are more stable in a manner that turnaround time is
enhanced. There is a substantial tendency for the selection of a port to increase
because the port‟s location favours a shipment route of a particular cargo trade.
2.7 Understanding Services
Although there tends to be no unified perspective as to what service stands for
(Edvardson, 1992), given different perspectives; the word „service‟ is fundamentally
used to represent the offers of an industrial sector that does things and not the making
of things (Johns, 1999). Therefore, the end products of services are essentially
activities rather than total creation of tangible products. Generally, service is
considered to have constituents, which vary in complexity from one service to
another.
Understanding the meaning of „service specification‟ might prove beneficial in the
comprehension of the word „service'. Service specification is concerned with the
agreement between a customer and service-provider about the various features
expected in the rendered service (Galetzka, et al., 2006; Van-Raaji and Pruyn, 1998).
Again, Edvardsson and Olsson (1996) emphasised the need to seek understanding of
how to improve the quality of services, through academic research and action
learning. This is related to enhancing customers‟ expectations based on the service
specifications.
As a follow-up, attention will be given toward contributing to the development of the
meaning of „service‟, which would further assist the understanding of the term.

40
Although the meaning of „service‟ seems to be obvious, yet it does appear that the
development of a definition needs to be given more attention in the academic
literature.
2.7.1 The Process of Services
Gronroos (1990) associated service as being a series of activities of more or less
intangible nature, that usually though not necessarily, occurs in the interactions
between customers and the service providers‟ employees. By „simple-constituent
service‟ in figure 2.2, representation is made of services in which customers‟
requirements can be viewed as being straightforward or uncomplicated.
For instance, a customer at point ‘A’ may desire to know if containers of interest have
arrived in the port. He/she picks up the phone and dials the port‟s customer service
unit. ‘B’ represents an „interface‟ where the customer makes the intended inquiries for
the needed service. [Interfaces here symbolise stages at which there are interactions
between two or more parties (internal or external) to enable progression unto the next
level in the bid to render the necessary service]. As would be expected from the port,
the follow-up response to the request in question will be to key in the customer‟s
details into the computer database to reveal the status of the customer‟s containers.
This leads to the next stage depicted by ‘C’, in which the customer‟s container status
is made known to him/her from the port‟s inbound container database; hence the
requested service becomes a rendered service. Simple-constituent services therefore,
are those that tend to have less „interfaces‟ from the point of request for service to the
point of service receipt by the customer.
Desired
(Needed)
Service
Service
Rendered
B C A
Figure 2. 2:„Simple-Constituent Service‟ (Source: Author)
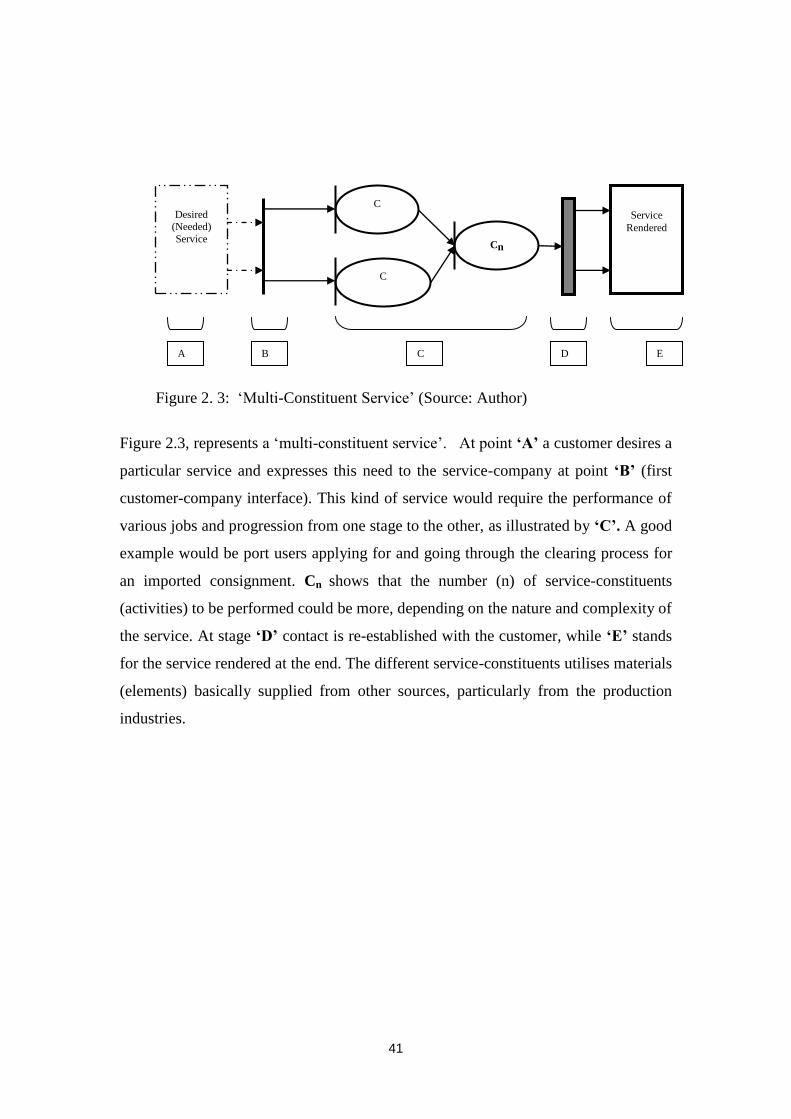
41
Figure 2.3, represents a „multi-constituent service‟. At point ‘A’ a customer desires a
particular service and expresses this need to the service-company at point ‘B’ (first
customer-company interface). This kind of service would require the performance of
various jobs and progression from one stage to the other, as illustrated by ‘C’. A good
example would be port users applying for and going through the clearing process for
an imported consignment. Cn shows that the number (n) of service-constituents
(activities) to be performed could be more, depending on the nature and complexity of
the service. At stage ‘D’ contact is re-established with the customer, while ‘E’ stands
for the service rendered at the end. The different service-constituents utilises materials
(elements) basically supplied from other sources, particularly from the production
industries.
Desired (Needed)
Service
C
Cn
C
A B C E D
Service
Rendered
Figure 2. 3: „Multi-Constituent Service‟ (Source: Author)

42
‘Value Added’ Concept
I II III IIII
(Incremental Process)
£ / $
(Cost-benefit outcome)
(Management and
Strategy)
Value-adding Services
Services
(Add-on services
Complementing majors)
(Customer- Tailored)
I I I I I I I I I I I I
2.8 Value Added Concept and Value Adding Services
Recognising diverse opinions, an attempt is hereby made using figure 2.4 to
illuminate the „value added concept‟ and also the „value-adding service‟ focus in this
research project.
2.8.1 Value Added Concept
As illustrated on the left-hand side of figure 2.4, the first perspective of „value added‟
concept is that of an incremental process. Implying that a sequence of progressive
activities carried out to satisfy customers are viewed as value added (Christopher et
al., 2002; Porter, 1986). To gain and build competitive advantage in creation of
customers‟ products, Porter (1986) held very strongly to the idea of value creation
activities.
In a characteristic analogy of how businesses have employed capacities offered by
shipping to transport goods and facilitate international trade, Stopford (2009)
portrayed that „value added‟ is a modern economic jargon that can be used in a
context to convey that the lives of recipients of goods and those who benefit from
global trade are made better. The connotation is that as an element (material or
Figure 2. 4: Value Added Concept and Value-adding Services (Source: Author)

43
function) of demand advances along the process to satisfy customers it acquires value.
This view of „value added‟ has a relationship with the constituents of „service‟ as
described in section 2.7.1.
The second aspect is the focus of „value added‟ as concerned with the input and
outcome of a particular business in relation to the cost, revenue or benefits as
perceived by the customers (Wilson, 1979; Walter et al., 2002; Edvardsson and
Olsson, 1996). Wood (1978) further stated that value added is a measure of output
divided by inputs of manpower and capital to express performance per head: hence it
is a profit on sales or return on capital/investment orientation (represented in figure
2.4 by the dollar and pound signs). Considering this, it can be observed that the
perception of value added is therefore based on efficiency and effectiveness in
resource utilisation.
The third point, depicted by „organisation structure symbol‟, is a view of „value
added‟ as related to enhanced strategies, management styles, technologies, special
projects or operations (Chernatony and Harris, 2000; Fletcher and Hardill, 1995). An
activity or new innovation that makes an organisation thrive becomes value added to
the business. For instance, Au and Ho (2002) viewed the use of technology to
facilitate supply chains as value added; and Haezendonck et al., (2000) analysed the
different perspectives of value added as a function of the value different ports ascribe
to different category of cargoes and also projected the opinion that value added aims
to measure the contribution of ports to the Gross Domestic Product (GDP) of a nation.
2.8.2 Value-Adding Services (VAS)
On the right-hand side of figure 2.4, features that would aid the understanding of
value-adding services (VAS) are pictorially represented. The first perspective is that
when discussing VAS, attention is drawn to the idea that they are services. As John
(1999) explained, the word service is essentially used to represent the offers of an
industrial sector that does things, and not the making of things. Consequently, an
integral aspect of VAS is about doing things or offering of some kind of activities to
customers rather than the total creation of tangible products.

44
The second feature of value-adding services is concerned with being conveyed as
additional services, which complement the majors‟. There are generic, standard or
basic services for which firms are in relationship with customers; however value-
adding services typically connote extra special services beyond the basics (Bowersox
et al., 2007). They are therefore „add-ons‟ (additional) services built into the major
offers.
In line with this, the third facet of value-adding services idea as associated with the
meter-rule symbol in figure 2.4 is that they are customer tailored. Value-adding
services are unique activities tailored to specific needs of customers; representing
extensions over and above a firm‟s basic services (Bowersox et al., 2007). Galetzka et
al. (2006) also acknowledged the opinion that standard services do not basically
constitute customer tailored specifications.
Logistics has since been in the frontiers of modern business, and most supply chains
have become customer-driven (Ainsworth, 1992). The strength of the customer-driven
concept has continually propelled expectations and demands for tailored or
customised services by customers. Recognising the growing desire for value-adding
services by customers, Christopher (2005) stated that rendering such tailored services
to customers offers a competitive differentiation strategy.
In the realisation that value-adding services are tailored to meeting customers‟ needs,
it therefore implies that often there will be a need for efforts to be joined together by
firms and their customers in developing value-adding services. Edvardsson and
Olsson (1996) are of the opinion that in the task of developing a new service, the
following should be ensured: (a) Fulfilling the prerequisite needs of customers (b)
Supporting customers to make their desires explicit (c) Understanding the customers‟
needs and (d) Incorporating customers in the process of service development. These
steps are unequivocally important, because ensuring that the right quality is built-in
from the very start is necessary even in the development and offering of value- adding
services. Again, it is only when value-adding services are carefully developed that the
intrinsic worth of their customised nature can be elicited. Based on this therefore, it
would be expected that an organisation make earnest searches to get acquainted with
the business needs of its customers, so as to render its services better.

45
2.9 Value Adding Services in Port Logistics
In order to understand value-adding services in the context of the port, it is very
important to have a sound grasp of what the port stands for in regards to its services.
According to the „Port Working Group of the Commission of European
Communities‟, the seaport can be defined as an area of land and water made up of
improvement works and equipment that principally permits the reception of ships,
loading and unloading of vessels, storage and transfer of goods to inland transport,
while being able to include the activities of businesses linked to sea transport
(UNCTAD, 1993). It is put by Janson and Shneerson (1982) that there are about seven
integral aspects of port processes, namely: approach; mooring and unmooring;
loading and unloading by the quay; storage; transit; export and import.
These descriptions of ports clearly bring to light the traditional and core services for
which ports, despite their present-day complexity and diversity, exist to offer to port
users. The seaport is defined by Cullinane and Talley (2006) as a place that provides
for the transfer of cargo and passengers to and from waterways and shores. These
buttress the common perspective of ports being in business for transference services.
However, the widening problems of port logistics have propelled port authorities and
other port-interest bodies into off-dock non-traditional activities (Heaver, 2006). The
port is an integral component of the global supply chain, where the influence of
customers has increasingly gained momentum leading to the proliferation of
tailored/customised services by organisations to their customers. This reflects the
widely acknowledged trend for logistics value-adding services. In agreement to the
core port services as found in the definitions, value-adding services refer to those
services which a port can develop for the benefit of port users, which are however not
essentially the main or traditional services offered by the port.
In the port context therefore, trends in the global supply chain point towards a need,
especially in the face of competition, for port management to understand the peculiar
business needs of their customers and exploit the same to the port‟s advantage by
offering value-adding services. However, a study carried out by Ugboma et al. (2004)
suggested that value-adding services ranked low in the perception and expectation of

46
services by customers (port users) from different Nigerian ports. With this suggestion
in view, it is believed that the extent to which port management has come to the
realisation of the potentials of developing and deploying value-adding services in the
formulation of port‟s strategies require further empirical investigation. This need for
investigation is encouraged given that in a study on port performance measurement,
Bichou and Gray (2004) indicated that the direction of a port to a strategy of value-
adding logistics activities could be a beneficial approach to the port business.
Additionally, the responsibility of ports surpasses just being the traditional water/land
interface for ships and cargo services to include value-adding logistics. Over and
above traditional services, Pettit and Beresford (2009) supported the idea that the
provision of tailor-made services within a port has become fundamental to the overall
effectiveness of the port within the supply chain.
These are all pointers to a view that value-adding services are activities to be taken
seriously in the port business. In a way of supporting this inclination, Haezendonck
and Notteboom (2002) advocated that in the 21st century‟s customer-led business
arena, seaports with a sound understanding of customers‟ needs are most likely to
succeed. In the same vein, Goss (1990) stated that rather than ports‟ marketing
departments concentrating merely on selling of services, they could also be useful
channels through which the views of shippers and consignees (port users) can be
communicated to the port management.
Song and Lee (2009) reiterated that the increasingly evolving demands of end users of
maritime transport, is one of the reasons that have led to the growth of maritime
logistics bringing up issues that require further elaboration and debate. Efforts toward
understanding customers‟ needs and becoming more end-user/customer-oriented
would promote service customisations which are in turn considered as value-adding
services.
In reporting the Herculean competitive tussle between Busan (Korea) and Shanghai
(China) ports for cargoes originating from the northern part of China, one of the
suggestions of Anderson et al. (2008) is that Busan‟s new strategic port (Yangshan)
may concentrate on cargoes requiring value-adding services, given that the services
can be more quickly provided in its hinterland park. Though investment in port
infrastructure was the major competitive issue considered in the report, their

47
proposition goes to indicate that there may be certain cargoes that might require more
value-adding services than others.
Again, there are also pointers to the need for good expanse of land and the
development of certain facilities to facilitate the offering of value-adding services
(Mangan et al., 2008). The need for value-adding services as a strategy for
differentiation is growing in potential, not only in the port industry, but also in the
entire maritime sector. As the global alliances between shipping lines increases,
individual ship operators will also continue to seek a means to differentiate their
products from other lines, even from their alliance partners, by the offering of value-
adding services (Martin and Thomas, 2001).
Figure 2.5: Port value-adding services theoretical model (Source: Author)
In figure 2.5 above, a model of port value-adding services is presented. The model is
founded on findings from the literature and industry experience on the core,
traditional and fundamental services which a typical port would provide. „„A model is
a simplified but organised and meaningful representation of an actual system or
process‟‟ (Zaltman, 1977, cited in Worcester and Downham, 1986; pp. 574).
Stevedoring
(Cargo)
Port Traditional
Services
Unloading Loading
Vessel Piloting
In-Port
Transit
Safety &
Communications
Multimodal
Facilitation
Documentation
(Clearance)
Mooring
Environment
Management
Advertisement Support
Technical Support
Packaging
Warehousing
Transport Service
Consultancy

48
Similarly, the port VAS theoretical model is a representation of value-adding services
and core port services which are explained as follows:
(1) Safety: Undeniably, safety in ports is mandatory under laws of different
nations and the international community‟s conventions. By the adoption of the
Geneva Convention in 1948, the United Nations established the International
Maritime Organisation (IMO) with one of its early and primary objectives
being safety in shipping. Since ports are integral nodes in global shipping,
some of the International Maritime Organisation‟s conventions and regulations
on safety are binding on ports. For example the PSC‟s (Port State Control)
obligations of destination ports. Ensuring safety therefore encompasses
different areas like safety mapping, development and maintenance of safety
gadgets, dissemination of real time information to port users on both the water
and land sides.
(2) Vessel Piloting: From the water-side of the port, as vessels call in, the
necessity to safely navigate ships to the dock becomes even more important.
Given on the one hand that navigation in water areas of close proximity to
ports requires a sound understanding of the local or territorial waters, and on
the other hand that most crew of calling vessels might not have this
knowledge, offering of piloting services has since graduated to being a
necessary statutory function of ports around the world. Consequently, ports
employ and train staff, usually designated as Captains, who have a
comprehensive knowledge of the port‟s waterways and competent nautical
skills to safely navigate different sizes of vessels into and out of the port on
return journeys.
(3) Mooring of Vessels: The service of safely docking or berthing a vessel and
then fastening it in place is associated with the term „mooring‟. Specialists in
this area in virtually all ports are readily available for the offering of mooring
services to incoming ships.
(4) Stevedoring: Having accomplished the mooring and berthing of the ships,
stevedoring operations follows. Principally, there are two sides of stevedoring
operations. One is concerned with the unloading or discharging of cargoes
from vessels, while the other is the loading and stowing of cargoes from the
landside into the holds of berthed vessels.

49
(5) In-port Transit: When materials and goods bound for transhipment or export
enter into the port, they go through a series of within-the-port transportation
which finally bring the goods to the quay ready for the water/sea-leg
movement. On the other hand, cargoes received from the seaside onto the quay
are moved within the port, from the quays to the transit sheds, and as the
clearance procedure is completed, the cargoes are moved out of the port. All
sorts of goods or cargoes movements within the port are commonly referred to
as in-port transit and have fundamentally become necessary and basic port
services.
(6) Inter-modal Facilitation: Though this phenomenon has increasingly become
the case in contemporary times, ports have historically been points of
convergence for different modes of transport. Therefore ports traditionally
serve to facilitate the transference of goods in the transport chain from marine
vessels onto land-based transport units like trucks, vans, cars; and as is
obtainable nowadays, onto rail or air transport means.
(7) Environment Stewardship: The responsibility of ports as environmental
stewards and guardians has since become increasingly pronounced. For
example the coming into force of IMO‟s MARPOL regulations in the 1970s to
combat marine pollution was aimed at the protection of the marine
environment. Thus, ensuring that ships meet set standards has remained core
duties of flag of states and port state control authorities.
(8) Documentation: Ensuring that users of ports undergo legitimate procedure or
have previously undergone necessary processes is the primary purpose of port
management‟s documentation service. Documentation remains one of the
orthodox services of the port that has remained a challenge given the unique
environment of port‟s operation and also its importance in influencing national
and international trade and transportation standards.
2.9.1 ‘Value Drops’
The core/traditional services of ports having provided the fundamental platform on
which a typical port operates its business, the model (figure 2.5) depicts „value drops‟
from value-adding services onto the core port services. Reinforcing the understanding
that logistics value-adding services as discussed in the context of this research are

50
actually complementary and unique/customised services above and beyond the
traditional services offered to port users in the port.
From the „value drop‟ end of the model, the value-adding services represented
include: warehousing, packaging, technical expertise support and delivery (transport).
Next in the strata of „value drops‟ section is the advertisement support, having a
dotted cycle different from those of other services. This difference suggests a special
attention this research gives to the service by proposing that advertisement support
might have potential in solving challenges of marketing port users‟ products and
services created by smuggling. Refer to section 6.6.5 (e)* for further discussion.
Finally, since there is no shortlist of services that can be categorised as value-adding
services, the top „empty‟ cycle in the model represents and presents the opportunity to
add more value-adding services onto the model. This represents opportunity for more
academic researchers and industry practitioners to develop more innovative and
customised value-adding services.
2.10 Summary
In this chapter a distinction has been made between value-adding services and other
perspectives of „value added‟ concepts. While some of the main perspective of „value-
added‟ include incremental processes/activities, cost-benefit accruals of a business
venture and management styles, value-adding services as in the context of this study
are additional and customised services which complement the core- service offers.
Service is typically the offer of an industrial sector that does things (activities) rather
than the making of things. Contribution is made in distinguishing services according
to constituents into „simple‟ and „multiple‟ constituent services. The logistics
customer-driven concept and the consequent intensification of competition between
ports were identified as some of the reasons that have made understanding the
potentials of value-adding services in the formulation of port strategy increasingly
important. Whereas value-adding services in ports have been identified in the
literature by some studies that largely gave attention to other port‟s operations, given
divergent views on the services, the need to particularly examine the potential of
value-adding services in port‟s strategy becomes even more compelling.

51
Chapter 3 - Research Methodology
3.1 Introduction
This chapter concentrates on understanding and presenting research methodology
relevant to this research project. The various perspectives and processes of the
research shall be sequentially reported. Discussion of the techniques deployed for the
collection of research data in the study is presented; these include questionnaires,
interviews and a search of ports‟ databases.
Firstly, the philosophy and approaches taken in this research will be explained. In this
light, the ontological and epistemological perspectives of the study will be discussed
in order to set out the research paradigm.
Secondly, the research strategy deployed based on the aims and objectives in this
study will be discussed. Areas to be covered include research aims and their methods
of achievement. This also introduces how primary and secondary sources of data will
enable achieving set research aims.
The chapter introduces the use of multiple case studies research, which will be
covered in detail in chapter four, dedicated for case study ports. Finally, there will be
discussion on the gathering of reliable primary research data. Thus, other areas
covered include the processes and steps taken in gathering data by questionnaires and
interview methods.

52
3.2 Philosophy and Approaches to Research
Research philosophy has to do with assumptions and perspectives about the
development of knowledge, thus allowing the identification and comprehension of the
logic of inquiry while providing the „rules‟ and ways of building knowledge of the
world (Maylor and Blackmon, 2005; Saunders et al., 2007). The philosophy explains
theory in doing research in a given field and describes the underlying assumptions of
approaches to research.
Assumptions are made in research concerning the nature of reality and how to
understand reality. There are two major broad philosophies, ontology and
epistemology, that are worthy of note in order to better comprehend research
philosophy. The two ideas of ontology and epistemology are differentiated as „the
theory of being‟ and „the theory of knowledge‟ respectively.
3.2.1 Ontology
This is concerned with accepted assumptions that underpin reality in a particular
research area. Therefore, the research philosophy in a particular a piece of research
defines the ontological assumptions, which are basically about what is accepted or
considered to exist or be real in a study area. While the objectivist ontology, for
example, is appropriate in research on physically real objects, subjectivist ontology
(constructed assumptions) is more appropriate for studying many business and
management phenomena, given that human behaviours differ significantly from
natural objects (Maylor and Blackmon, 2005).
3.2.2 Epistemology
The term epistemology is concerned with what is/is not considered as knowledge in a
particular area of study. It describes some fundamental assumptions, which have to be
followed consistently in research to develop knowledge. For instance, while the
opinions of persons furnish a social researcher with acceptable and useful data in a
study, a natural scientist would rather prefer objective data or evidence from nature.
In the literature, there are essentially two extreme and dominating epistemological
views about the ways in which knowledge can be developed: positivism and
subjectivism.

53
Positivism in research philosophy advocates an objective view that people‟s beliefs
have no significance on the facts or reality world. Alternatively, objectivism is an
ontological viewpoint that asserts that the social phenomena exist independent of the
social actors (Bryman and Bell, 2007). However, pure subjectivism ontology
suggests that there exists no reality that is independent of the perceptions of people.
The subjectivist epistemology therefore, perceives knowledge as being reality or in
existence if it can be experienced by human beings.
This pair of research philosophical views (objectivism and subjectivism) is on two
opposite points, and at about the middle of this pair is another view to research known
as critical realism. See figure 3.2 for clarifications of the differences and similarities
of these views.
Critical realism is founded on acknowledging the natural science view that there
exists a mind-independent and objective approach to understanding reality, however
given imperfections, it also recognises that cognition and human perception play
important roles in ascertaining reality (Lee and Lings, 2008; Wikgren, 2005).
Epistemology Ontology
Objectivist
Positivism
Realism
Objectivist
Objectivist
Critical realism
Interpretivism
Constructionism Subjectivist
Subjectivist
Subjectivism Subjectivist
Deduction Objectivist
Induction Subjectivist
Figure 3. 1: Research Philosophy [Clarifying Ontological and Epistemological views] (Source: Author)

54
Figure 3.1 is used to illustrate various aspects of research approaches based on their
epistemological and ontological standpoints which are further discussed as follows:
Deduction: Though predominantly used in natural science, deduction is also
deployed in business and social sciences. Laws provide foundation for explanation
and prediction of phenomena in deduction. Deduction essentially commences by
proposing and testing a hypothesis (proposition), by experiments or other empirical
methods, and then the results are examined so as to contribute to or impact on theory
(Robinson, 1993). Deductive approach essentially uses quantitative data in its
research methodology.
Induction: This approach seeks to form theory by understanding or making sense of
the data collected on issues being investigated. Induction gives flexibility that allows
the discovering of other issues of importance to the problem, rather than the limitation
of other explanation, as is the case in the deductive approach that tends to deploy a
rigid methodology construct based on proposition (hypothesis).
Realism: While recognising positivist belief, realism contends that reality might not
be directly observable and measurable. „In other words, just because we can‟t see
something, doesn‟t mean it does not exist‟ (Lee and Lings, 2008; pg.31). It allows the
postulation of unobservable entities (abstracts) in theory, which if related to
observable effects by empirical observation, are considered to actually exist.
Interpretivism: By interpretivism, social scientists seek to gain access to people‟s
„common sense of thinking‟ and thus interpret their actions in the social world point
of view (Bryman and Bell, 2007). Its focus essentially revolves around
acknowledging differences between human beings and objects (the subject of natural
science), so as to delve into producing explanations for meanings people attribute to
actions.
Constructionism: This is an ontological view that social phenomena in addition to
being the product of social interactions are also in constant revision, being built-up
continually (Bryman and Bell, 2007). Its epistemology (knowledge building pattern)

55
view is that social actors‟, e.g. researchers, own versions forms part of a specific
version of social reality.
3.2.3 The Research Project Perspective
The perspective of this research is that of a critical realist approach to understanding
reality. As illustrated in figure 3.2, a critical realist view implies that the research is
founded on an objective platform, while also incorporating principles of subjectivism.
This further translates to the integration of both quantitative and qualitative
approaches to the research, enabling the employment of deductive and inductive
contributions respectively.
Essentially, the critical realism perspective toward discovering knowledge is chosen
in this research project after due considerations of other approaches, because it gives
an opportunity to strike a necessary balance between objective and subjective views.
As a result, both deductive and inductive strengths are robustly used, permitting mind-
independent approach to comprehending reality while also infusing human
experiences and perceptions, which have been considered by many scholars to be
invaluable in the quest of unravelling reality in the social world.
Critical Realism
Objectivism
Induction Deduction
Qualitative Quantitative
Subjectivism +
+
Figure 3. 2: The Research Perspective (Source: Author)

56
3.2.4 Exploratory and Analytical Approaches
The research process is both exploratory and analytical in nature, channelled
particularly towards investigating the potential relationship between the dependent
and independent variables as outlined in both proposition (see section 1.4).
The exploratory aspect is geared toward identifying and understanding the various
facets and issues surrounding value-adding services as a topic and then, more
importantly, the extent to which this subject area has been researched and
implemented in the port strategy context.
On the other hand, the analytical part of the research is essentially a medium to
empirically test developed propositions and build other models. In this vein, various
variables under investigation will be analysed and therefore will contribute to
understanding the tested propositions and other resultant outcomes. This further
encompasses inferential and objective examination of various issues about the
relationship between the deployment of value-adding services in a port‟s strategy
formulation and the competitive advantage of attracting and retaining more port users.

57
3.2.5 Research Strategy
Drawing from the research perspective in section 1.3, the aims and objectives formed
the basis of the research strategy deployed in this project. In this regard, table 3.1
shows the details of the research strategy, tailored towards achieving set research
aims.
Table 3. 1: Research Strategy Outline
Research strategy guides the research design, which in turn provides a framework or
plan for the collection and analysis of data from the real world to explore and test
postulated theories (Lee and Lings, 2008; Bryman and Bell, 2007).
Research Aims
1. To explore the knowledge and
perspectives of value-adding services
(VAS) concept.
Achievement Method
Search to understand VAS in (a) Journals
(b) Textbooks (c) Websites/Databases (d)
Other relevant publications.
2. To investigate and analyse how
VAS are carried out in ports of
developing and developed economies.
(a) Field survey of port users in case study
ports to obtain data; (b) Analyse VAS rates,
impacts, characteristics in the case study
ports.
3. To examine and evaluate the
influences on port users‟ selection of
ports.
(a) Study the details of port selection criteria
in the literature. (b) Gathering the views of
port users via questionnaires on port
preferences. (c) Analyse and interpret data
from field survey.
4. To assess the suitability of value-
adding services as a means for port‟s
competitiveness.
(a) Literature review of VAS in port context.
(b) Survey port users by questionnaires (c)
Interview with port management on the
deployment of VAS.
5. To evaluate decision-factors for
Port Management in strategy
formulation.
(a) Critical assessment of factors in
publications that impact on port strategy (b)
Engage in in-depth interviews with Ports‟
Management.
6. To draw adequate inferences from
facts and research data, and proffer
models to facilitate understanding and
deployment of VAS in ports.
(a) Appraise literature review, questionnaire
and interview data. (b) Make deductions
based on informed details of findings (c)
Develop VAS port models based on research
data

58
In real life situations, investigative opportunities, research areas, resources and
objectives are more often not the same, hence there are a number of issues to consider
while making the decision on which research methods to use. Data are only as good as
the instruments by which they are collected, therefore, there is need to be meticulous
while designing the research data collection methods.
3.3 Research Primary Data
As earlier indicated the major means of gathering primary data in this research is by
the use of questionnaires, interviews and case studies. Questionnaires and interview
schedules were developed, validated and piloted before using them to gather data
through field surveys and interviews. This section is principally focused on explaining
the questions and issues contained in the questionnaire and interview schedule for
data gathering, and then to expound the intended analysis techniques and their goals
in the research. See appendices 1 and 2 for the samples of questionnaires and
interview checklist used in gathering data.
3.3.1 Multiple Case Studies Research Method
Case studies give focus on an example(s) of a subject of discussion in order to have an
in-depth insight. Zikmund and Babin (2007) described case studies as concerned with
documented history of a particular person, group, organisation or event, which are
examined and analysed based on important themes. In any case, a more compassing
view was stated by Cousin (2005) that case study research aims to explore and depict a
setting (subject) with a view to advancing understanding of it. The use of case studies
in research involves intensive examination of a few selected cases of the phenomenon
of interest (Malhotra, 2010). Case study research may take single or multiple case
study forms and may include qualitative and quantitative approaches (Bruns 1989;
Yin, 2009). Multiple case studies were used in this study in order to broaden the
understanding of value-adding services and produce in-depth comprehension of the
subject. Cousin (2005) used the term „collective case study‟ to describe an approach
where the researcher chooses more than one case in order to achieve some kind of
representation. The case study is an approach to research with the capacity to enable
the gathering of data from multiple levels and multiple organisations (Cameron and

59
Price, 2009). Another characteristic of case study research is that it offers the
opportunity to systematically aggregate research data in order to reach reliable results
(Yin and Heald, 1975). In this manner, the use of multiple case study approach gives
an opportunity for in-depth exploration of research issues, so as to lead to better
knowledge and provide basis for future research (Carrier et al., 2004).
3.3.2 The Choice of Questionnaire Technique
Sampling the opinions of port users is a fundamental aspect of this study. This is in
order to investigate if the rendering of value-adding services in a port could form
sufficient reason for port users to use a particular port instead of another.
After an objective evaluation of other methods of data collection, the questionnaire
method was chosen mainly because it offered good and flexible characteristics that
would enable the polling of port users‟ opinions, which in turn would support meeting
the research aims and objectives. Thus, the use of questionnaire offered a simple and
yet versatile means of obtaining data from port users.
3.3.3 Collection of Data by Questionnaire
Questionnaires are known for their versatility. As explained by Saunders et al.
(2007), collection of data by questionnaires can generally be sub-grouped as follows:
1. Self-administered Questionnaire: Postal questionnaires; Internet-mediated
questionnaires; Delivery and collection questionnaires.
2. Interviewer-administered: Questionnaires Structured Interview; Telephone
questionnaire.
3.3.3a Questionnaire Design
The following issues were taken into consideration while designing the questionnaire.
Brevity, wording and appearance; resulting in a total of 18 final questions.
Categorisation of questions: In designing the questions and opinion options in
the questionnaire, measures were taken in order not to push „forced answers‟

60
on respondents. For example, the „not sure‟ answer option was included in
certain questions to ensure that respondents give answers willingly and
assuredly. The questions include dichotomous, open-ended and multiple-
choice questions.
Analysis method: Analysis of the expected data was also taken into
consideration at this research design stage. The open-ended questions were
included to provide opportunities for respondents to include relevant
information, which would assist to further understand the issues of concern as
outlined by the aims in section 1.3.2 and to correctly interpret respondents‟
opinions.
3.3.3b Questionnaire Questions
The questions in the semi-structured questionnaire were constructed based on findings
from the literature review which are relevant to the research aims and objectives. This
formed one of the means of the research triangulation. The questions include:
Section A: Pre-Information
Section A is intended to obtain general information about the respondents (port users).
Refer to appendix 1 (page 223) for details of questions in the questionnaire. The
questions and their goals are set out as:
Question 1: This was to explore the different business specialisation areas of the
respondents in port services.
Question 2: Respondents job titles or positions, as obtained from this question enabled
the researcher to have a good knowledge of the hierarchy of the persons from whom
data were gathered.
Question 3: By this question, data were gathered on the respondents‟ years of
experience in port business.
Question 4: Data on the various training and education levels of the respondents were
gathered by this question. This might be a pointer of what to expect in the way
responses were made by different respondents, especially in regards to quality.

61
While designed to be anonymous, section A of the questionnaire was used to gather
general identity data of port users in the ports. The quest to understand value-adding
services and port logistics will definitely not be complete without a comprehensive
identification of the active players in the port industry.
Section B: Features of Port Services
As the literature showed, value-adding services in the context of this study are non-core
services in the port system. Hence this section was designed to explore and understand
the contemporary trends of different kinds of services offered in ports. Having observed
divergent views from use of terminologies on „value added‟ (Wilson, 1979; Walter et
al, 2002; Christopher et al 2002; Chernatony and Harris, 2000) and „value-adding-
services (Bowersox et al., 2007; Christopher, 2005), attention was given in section B to
ensure that the perspective of value-adding services being investigated in this research
project was clearly presented to the respondents (port users). Hence, value-adding
service was defined, and then followed by questions as explained below:
Question 5: This was to ascertain the availability or absence of value-adding services. It
also enabled an understanding of the types of value-adding services obtainable in the
ports.
Question 6: Through this question, key value-adding services as identified in the
literature were put forward, seeking to know the likelihood of customers (port users)
using the services if they were to be made available in the ports.
Question 7: This question was set out to provide an opportunity for respondents to
comment particularly on the availability of key value-adding services in the ports. From
a strategy perspective, there is an inherent implication of the availability or non-
availability of value-adding services in the ports.

62
Section C: Features of port users’ patronage
This section seeks the opinions of port users on the impacts of rendering or offering
value-adding services in ports. It is set in a manner to draw clear information about the
relevance of value-adding services to the businesses of port users, and therefore will
provide a platform to understand the extent to which such services, if at all, can be
incorporated into port strategy. It is the objective of section C to gather port
preferences data.
Question 8: The statement „„port users would prefer a port that renders value-adding
services (VAS)‟‟ was put forward and the reactions of respondents in this regard were
collated.
Question 9: For further investigation on the impact of value-adding services in ports,
data were obtained through this question on whether the availability of such services
would make a port more or less attractive to port users.
Question 10: As the research project also covers investigations of the capability of
value-adding services to retain port users, data were gathered from respondents by this
question, to understand if the services are able to make them continue using a particular
port.
Basically, questions in section C were designed in a way to gather data that would be
used in running various statistical tests related to the propositions set out in this
research.
Section D: Awareness of Value-adding Services (VAS)
Question 11: Data from this question gave the opportunity to assess port users‟
awareness of value-adding services in the context of this research.
Section E: Rating of Value-Adding Services (VAS)
Question 12: Ranking of some of the key value-adding services as identified from the
literature, according to importance, was made possible by data from this question. The
goal was to support analysis and knowledge of how important some value-adding
services are to port users in ports of developing and developed economies.
Question 13: By this question, port users were asked to give ratings to the extent of
offering value-adding services in the ports. While the question assisted in evaluating

63
the extent of value-adding services offered in the case study ports in developing and
developed economies, it also enabled the assessment of gathered data‟s reliability as
discussed in section 5.8.
Question 14: Given the diversity of value-adding services, this question gave an
opportunity for port users to make known any particular value-adding services which
they would like to be available in the ports. Data from this question shall support
meeting research aim 1, as outlined in section 1.3.2.
Section F: Criteria for Choice of Port
Question 15: This question sought to draw data on port users‟ opinions on the processes
necessary to develop value-adding services in ports.
Question 16: While the focus of this research project is on value-adding services, there
are many other core criteria that influence port users‟ selection of port. This question
therefore was set out for port users to evaluate some of the criteria that influence their
selection of ports.
Question 17: This question particularly inquired about port users‟ awareness of
advertisement support service in ports. There is a particular inclination of
advertisement support service postulated in this study and data obtained from this
question will furnish increased understanding of the proposition.
Question 18: Some respondents might have other related issues to discuss. This
question provided that opportunity for general comments and discussions.
3.4 Sample Size
The determination of a sample‟s size can be done by the calculation or rule of thumb
methods. Given the clarity that data would only be drawn from established port-user
companies, the rule of thumb method was used and decision made that selecting sixty
(60) port-user companies from each of the case-study ports, would form a substantial
representative sample of port users in the ports. In this light, lists of accredited port
users as published on the brochures and other databases of the four case-study ports
were obtained and used for the survey.

64
In a way of substantiating the sample size, it is pertinent to point out that scholars in
the area of research statistics suggests a minimum of thirty (30) entities as sample size
for a rule of thumb method to ensure a fairly distributed statistical analysis (Stutely
2003; Saunders et al, 2007). With this in view, it is therefore necessary to observe that
for this research project there was a 100% increase in the required minimum, bringing
the sample size to a total of sixty (60) accredited port-user companies in each case-
study port.
As a result, one hundred and twenty (120) port-user companies were selected in ports
situated in developing economies, and for ports in developed economies, another one
hundred and twenty (120) port-user companies were selected. On the whole therefore,
a total of two hundred and forty (240) port-user companies made up the sample size
from the four case study ports. The process of this selection will consequently be
reported.
Rule of thumb method in regards to determining the size of a sample is concerned
with the use of judgement in ascertaining the appropriate sample size. In agreement
with the views of Saunders et al. (2007), some of the issues put into consideration in
this research project while using the rule of thumb judgement method to decide on the
size of the sample include:
The level of confidence needed in data as being representative of the
population: It is expedient to observe that because this research is about
strategy, data were drawn from managers and senior officers of only
established and accredited port-user companies. On this basis, there is high
confidence in the source of data, which balances with the high level of
confidence needed to meet research aims. Consequently, there is a
commensurate high expectation that data drawn adequately represent the
population of port-user companies.
Error-tolerant limits: In most experiments as is the case in natural and social
science research, standards are set as to the limits errors can be tolerated in
the analysis of data. Higher precision is required for certain research than is
the case for others. It would therefore be logical to be of the mindset that in
research of this kind the larger the sample size, then the lower the data drawn
for analysis would be prone to errors.
65
3.5 Probability/Randomised Sampling
As a matter of necessity, it is imperative at this juncture to point out that social
science research since 1945 has found random sampling to be very useful. McDonald
and King (1996, pg 78) supported this particular view, reiterating that ‘according to
Moss, random sampling or probability sampling was used on almost all work done by
social survey from 1949 onwards. Random sampling is theoretically preferable to
other methods because it is based on known probabilities of selection, and has an
obvious appeal when the main requirement is to describe the population accurately;
as Moser and Kalton put it: although skilful quota sampling can succeed in practice,
it is not suitable for survey in which it is important that results are derived from
theoretically safe methods. Only random sampling fulfils this requirement’’
The described sampling types, referred to as probability or randomised sampling have
increasingly been deployed in contemporary research. Among sampling methods
available, the most preferred and widely used approach is randomised probability
sampling (Aaker et al., 2001; Chisnall, 2001). By way of elaboration, the different
methods of probability sampling are presented below:
Cluster sampling: Works in a manner that a population is divided into
subgroups, then a random sample of the subgroups is chosen to form the
sample included in the study. In this type of sampling not all the subgroups are
included in the final sample size but only the members of selected subgroups.
Cluster sampling is particularly useful where the population under survey is
widely dispersed and simple random sampling being impracticable (Chisnall,
2001). Such dispersion of population does not however exist in this present
research.
Systematic or Quasi-random Sampling: This technique proceeds in a manner
that the sample is formed by first drawing a member of the population and
then continuing by subsequently picking every nth
member until the sample
size is reached. It is systematic and quasi in nature because it entails obtaining
the nth
interval by calculation of the ratio „population: sample size‟.
For instance if population = 2000 and sample size = 300, then the integer
value of 2000÷300 = 7, becomes nth
the interval at which members of the

66
sample must be picked from the population. In this form of uniqueness and
strength, it is pertinent to observe that the systematic sampling method has a
downside in that it might produce sample members that are almost identical
(Schmidt and Hollensen, 2006), hence creating a situation where the
population might not be fully represented in certain circumstance.
Stratified Sampling: The population under investigation for this type of
sampling is divided into groups or strata of similar attributes. Selection is then
made for the sample either by random or systematic methods of choosing from
the groups. The stratified method is usually used when there are large
variations in the population, and groups or strata are considered to be more
homogenous than is the case in the total population. There is thus an
expectation of this process contributing to the accuracy of the sample in being
a true representative.
Simple random sampling is chosen for this research:
3.5.1 Choice of Simple Random Sampling
Simple random sampling being a fundamental form of probability sampling does offer
all members of a population a known and equal chance of being selected, hence
guaranteeing that the resultant sample, no matter the size would be a valid
representation of the population (Schmidt and Hollensen, 2006).
For this research, the simple random sampling technique was used, particularly as
outlined by Bryman and Bell (2007). This method of sampling was chosen over other
probability sampling methods (e.g. cluster, systematic, stratified) and non-probability
sampling (e.g. convenience, judgement, and quota) techniques because of its
simplicity and potential to minimise human bias.
It could be argued that stratified random sampling would have been a better option, so
as to reduce sampling errors, being a more effective method for a population of high
variation (Chisnall, 2001). In the case of the sampled port users population however,
industry experience, literature review and later outcomes of data showed that there
was no real variation in the population as in the circumstances where stratification
method would be strongly recommended. This statement stands true also in the

67
understanding that a considerable number of port-user companies would at the same
time have multi-faceted areas of operation. For instance, a particular port-user
company might be involved in different functions as a shipping line company, freight
forwarder, export and import agents.
As such the need for stratification because of very high variations in the population
does not exist for the present research and according to Chisnall (2001) and Schmidt
and Hollensen (2006) stratified random sampling, which is essentially an enhanced
simple random sampling, is necessitated if pre-knowledge of the population reveals
possible wide variations. Additionally, in some stratification sampling methods, such
as the inversely proportional stratified sampling as in Aaker et al. (2001), particular
groups are given more chance of being included in the sample than others based on a
researcher‟s informed decision.
The focus of this research however, is to enable all port users to contribute to the final
research outcome. Hence, giving an equal contribution opportunity to all port users in
the case study ports‟ population was deemed important. This is because the demand
for value-adding services can potentially arise from any port user, thus there should be
an equal opportunity for inclusion into the sample. Having ensured that the population
is composed of only established port-user companies on the accredited port list; the
simple random sampling method offered a valid and straight forward method of
reaching a representative sample of all port users.
Simple Random Sampling Exercise of Port Users
For each case study port (Rotterdam, PD Teesport, Damietta and Apapa), the
following steps were taken to randomly select port-user companies to be included in
the sample size:
(1) In order to ensure that those included in the sample were only established port
users, the list of accredited port users was obtained from websites, recent
publications and brochures of the ports.
(2) The port users (in 1 above) were then all numbered (i.e., 1, 2, 3, 4.. etc), being
over one hundred (100) for each case study port.

68
Having decided that the sample size would be a total of sixty (60) port-user
companies, a table of random numbers obtained from Cooper and Schindler (2006,
pg 681), was used to randomly select port users.
The manner of this selection exercise was that by cross-checking the random
numbers on the table together with the numbered list of port users in step 2 above,
port users with numbers tallying with those on the random number table were chosen
until a total of sixty (60) port users was reached for each case study port. As a result,
the entire sample size for all ports under investigation was made up of two hundred
and forty (240) established port-user companies. See sections (5.7) for details on
response rate analysis.
3.6 Questionnaire Administration
Having gone through the questionnaire development stage and determination of the
sample size as reported in sections 3.3.3 and 3.4 respectively, there followed the
administration of the questionnaires for field survey.
A multi-method of questionnaire administration was adopted chiefly because of
geographical and structural issues in the different case study ports. Processes taken:
The questionnaires were posted to the respondents. This mail approach was
chosen because the questionnaires were to be administered in dispersed
locations. Questionnaire field surveyors also supported the distribution and
collection of completed questionnaires from port users in ports in the
developing economies. Administration of questionnaires by e-mails or
electronic means was not carried out in the developing economies ports
because of the inherent infrastructural difficulty and internet accessibility
challenges.
For port users in developed economies‟ ports, where internet and e-mail
systems are well established, use was made of an electronic version of the
questionnaires, which were sent to designated port-user companies‟ personnel
by e-mail.

69
Telephone questionnaire survey method was another means used in order to
increase the response rate.
To facilitate responses and collection of data, telephone-calls, contact-persons,
e-mails and prepaid return envelopes were used to encourage responses from
the respondents.
For further details about response rate, refer to section 5.7.
It is important to note that researchers are able to creatively develop and use a
combination of survey methods in a particular research in a manner that the
methods in question complementarily strengthens and compensates each
other‟s weaknesses (Malhotra, 1999).
3.7 Collection of Data by Interviews
Interviews in this research were necessitated by the need to have a worthwhile
supplementary source of data and also basis to meeting some of the stated research
aims. Given that the research perspective is on strategy, this method enabled the
interviewing of port policy makers. Essentially, most of the interviews were carried
out prior the survey of port users by questionnaire. In this sequence, information from
interviews supported the development of survey questionnaires.
Interviews are purposeful dialogue between two or more people on a particular topic
of interest, to understand the views of the people involved. Interviews in research
projects have for a long time ago been indicated by Kahn and Cannell (1957) to be a
resourceful means of gathering valid and reliable data.
3.7.1 The Choice of Interview Method and Interviewing Process
The interview method used in this research was that of semi-structured interviews,
which gives a greater flexibility than the structured type by using a variety of
questions. Other interview methods include: unstructured approach, which allows
interviewees to freely talk on a topic (Healey and Rawlinson, 1994). In structured
interview, predetermined and standardised set of questions are used, having a
systematic approach to recording responses.

70
Interview guidelines which have since being validated by Rogers (1976) for
successful interview were followed, as recently supported by Bryman and Bell
(2007). In this manner, interviewees received e-mails and/or phone calls well in
advance explaining the purpose of the interview and asking for their cooperation.
Given mutual convenience, particularly those of the interviewees; telephone and face-
face interviews were carried out. Further details and discussions of interview data
collection and analysis will be presented in section 7.2.
The interview checklist was precisely developed, resulting in only ten questions,
while covering all required areas for drawing necessary data. During the interviews,
adequate level of formality was ensured while maintaining courtesy and keeping the
processes interesting. Data gathered were immediately transcribed in preparation for
analyses and not entrusted entirely to memory for latter recall.
In a bid to free the interviews from bias, thus strengthening reliability and validity of
data, in addition to the above, attention was given to create the needed conducive
environment for:
Trust/confidentiality
Sound understanding of questions
Interviewees‟ freedom of expression
Avoidance of unnecessary questions
Time management
There was an accurate recording of all dialogue
Also, prior to the commencement of the interviews, the exact telephone numbers,
times or venues to be used were agreed upon and confirmed. Interviews took place
during the interviewees‟ chosen time. These helped to ensure the establishment of
credibility needed for successful interviews.

71
3.7.2 Gathering Data by Interviews
Interview questions were designed to meet research aims 4 and 5 (see section 1.3.2)
and gather data from port management by in-depth discussion and cross-examination of
relevant issues. Given that some questions in the interview schedule were also in the
questionnaire, only the questions that are particularly concerned with port management
shall be explained below:
Reference should be made to appendix 2 for details of the interview checklist.
Pre-information: The pre-information questions were designed to understand the
roles/positions and how long the port management personnel have been in port
business.
Question 1: This question was to ascertain whether the port has got value-adding
services. It will support the research aim 1, which is about exploring the different
perspectives of what value-adding services stand for.
Question 2: Since no project can be carried out without resources, the reason for this
question was to understand some of the various resources necessary for the offering of
value-adding services by a port. Port management are in better position to give this
information.
Question 3a/3b: Questions 3a and 3b were developed to understand the perceptions of
port management in regards to the utilisation of value-adding services as strategy to
attract and retain more port users.
Question 4: The aim of this question was to delve into further discussion so as to better
understand the standpoint of port management on the issue of question 1. It encourages
more explanation as to why particular ports develop and use value-adding services,
where applicable.
Question 5: An inquiry on ports‟ strategic focus with regard to value-adding services
was sought after by this question.
Question 6: This question gives a basis to explore the problems and challenges that
ports could potentially encounter in the offering of value-adding services.

72
Question 10: Some outcomes from interview piloting necessitated the addition of this
question to gather the views of port management as to which party drives the
competitive strategy of a port in a landlord-port operator‟s structure.
3.8 Validity and Reliability of Primary Data
All primary data collection methods in this study, both questionnaire and interview,
were carefully validated and tested for reliability.
Validity
Validity is concerned with the integrity of conclusions drawn from data. It seeks to
understand whether or not the resultant indicators from the data measure the concept
they were actually designed to measure. For example, it was important during the
questionnaire surveys and interviews that participants clearly understood that, value-
adding services are additional or complementary services, as opposed to other
concepts of „value added‟. By this clarity in definition, it is believed that the opinions
of participants addressed the measure of concern (i.e value-adding services).
The panel of judges/experts‟ assessment is a way of ensuring that outcomes of
investigations are valid (Broonmell and Budescu, 2009). This method of content
validation was used in this study. In this sense, research experts carried out a thorough
evaluation of the questionnaire and interview checklist to ensure the integrity of the
primary data collection instruments. The panel of judges method was chosen over
others like concurrent, construct and predictive validation because of its detailed
attention in ensuring the inclusion of necessary and valid variables.
Reliability
For reliability of data in this study, internal consistency evaluation was carried out on
collected data. Reliability is concerned with the homogeneity of data measured and
can be tested by inter-item consistency (Gulliksen, 1945) or the split half methods
(Bryman and Bell, 2007). Another means for reliability evaluation can be through
stability check (Dillon, et al. 1994); however that of inter-item internal consistency
was used in this research. Refer to section 5.8 for the reliability assessment process as
carried out on data gathered in this research project.
73
3.9 Summary
While recognising the varieties of available research strategies, the critical realist
approach to understanding reality was chosen in this particular study. This approach
covers the integration of positivism and subjectivism means of conducting research.
On this basis, the research methodology supported the gathering of data from the
review of literature, questionnaires, interviews and port databases.
In this light, while in-depth interviews were carried out with port management,
questionnaires were administered to sixty (60) port-user companies‟ managers
selected by simple random sampling method in each case study port (i.e. total sample
size being 240). The sample size, sampling and data gathering methods were all
validated and supported by the literature. With these measures in place, there is a high
expectation that generated research data will prove very reliable and suitable to
meeting the set research aims.

74
Chapter 4 -The Case Study Ports
4.1 Introduction
The use of case studies in research is considered to be a veritable means of achieving
research aims in empirical investigations (Yin and Heald, 1975; Gummesson, 2000).
Single or multiple case studies can be used and may involve qualitative and
quantitative approaches (Bruns 1989; Yin, 2009). This chapter therefore discusses the
multiple case study ports used in this study, which are namely, Rotterdam port (The
Netherlands), PD Teesport port (United Kingdom), Damietta port (Egypt) and Apapa
port (Nigeria).
In the first instance, the reasons for the choice of the case study ports will be
discussed. This will then be followed by giving focus to each of the chosen ports. The
Rotterdam port shall be presented for discussion, and then followed by the PD
Teesport port. In the same line, Damietta Port and Apapa port shall be discussed
respectively. The essence of ensuring that investigations on the ports of the developed
economies (Rotterdam and PD Teesport) are discussed first is to give reference and
learning opportunities in the discussions of ports in developing economies.
Various aspects of the different ports‟ features shall be discussed. However, an
attempt will be made in harmonising areas covered in all the case study ports. Areas
covered for each of the case study ports include cargo operations, port projects, port
ownership structure and value-adding services available in the ports.
4.2 Reasons for Choosing the Case Study Ports
The reasons for the choice of these ports include:
They are major ports in their countries and regions
All the ports handle general and varied types of cargoes
Accessibility to data, port users and port managers
While samples from the case studies might not necessarily be the same in all cases of
the subject of value-adding services, however outcomes and inferences can support
theory generalisation in similar contexts.

75
4.3 Port of Rotterdam Authority (The Netherlands)
The Port of Rotterdam Authority is a public limited company with complex facets of
functions spanning the areas of managing, operating and developing of the Rotterdam
port and its industrial area (Port of Rotterdam Authority, 2009a). In figure 4.1 the
positions of European ports‟ classification and locations in relation to the port of
Rotterdam is shown.
Figure 4.1: Rotterdam and European Ports (Source: Port of Rotterdam Authority, 2009b)

76
Primarily, the municipality of Rotterdam and the Dutch government are the two
shareholders of the port of Rotterdam. While in gross terms, the Port of Rotterdam
ranked 1st among the top 20 European ports, it is the 4
th among world ports (Port of
Rotterdam Authority, 2009a). In the area of container traffic, Cargo System (2009)
reported that the Port of Rotterdam ranked 9th
amongst the top container ports in the
world.
It is important to point out that the grading of the European ports in figure 4.1 was
based on gross tonnages handled in the ports. There was a 2.9% increase to the gross
tonnage handled by the port of Rotterdam, resulting in a throughput of 421 million
tonnes in the year 2008.
In its developmental strides, the port of Rotterdam has a crucial drive to attract goods-
flow and industry activities, especially as it competes for cargoes with other ports in
the Hamburg-Le Havre (HLH) range (Port of Rotterdam Authority, 2009b).
As a pointer to its values, the Port of Rotterdam holds in its mission statement, that
„we attract businesses that strengthen the port and the industrial complex, our
spearheads being the throughput of containers, chemical and energy‟ (Port of
Rotterdam Authority, 2009b). This indicates that while the port gives focus to its core
traditional services of port cargo throughput (shipment), it is also interested in
attracting other related companies to boost its port complex business.
Port’s Core Activities
4.3.1 Traffic Management
As a covenant laid to the charge of the Harbour master, it is a principal role for the
Port Authority to ensure that there is smooth, safe, clean and secure handling of
shipping operations in the port.
The port reports it is actively involved in landside traffic flow management, and one
of the projects that epitomises this claim is participation of the port in Keyrail project
(a major rail operator) and also the establishment of a traffic management company to
manage traffic in the port areas and major motorways (Port of Rotterdam Authority,

77
2009b). As a result of such wider involvement, the competitiveness of the port and its
industrial complex has expanded, because the provision of transport infrastructure, as
reported, would inevitably enhance accessibility into the hinterland.
4.3.2 Land Area Management
Another area of core management interest for the port has to do with the management
of port land. The Port Authority is saddled with the responsibility of letting available
port land to businesses on contract a basis. It is paramount to the port therefore that
the port area is efficiently organised, in a manner that ensures good transport
infrastructure, facilities and maintenance of high quality environmental standards.
Strategically, the port is focused to providing space for existing clients, so as to enable
them to expand their businesses while supporting new clients to setup operations (Port
of Rotterdam Authority, 2009b). Attention is drawn to the fact that expansion of
businesses and offering of value-adding services require an extent of land availability.
Therefore, with respect to enhancing fast-growth of international traffic, some of the
port‟s land management projects include:
Reclamation Scheme: (Maasvlakte 2)
In its strategic drive to provide port-user companies with land and space for operation,
the Port of Rotterdam has a land reclamation project which is referred to by the Port
Authority as ‘Maasvlakte 2’ (Port of Rotterdam Authority, 2005). The project is for
about 1000 hectares which though would be accessible for other activities, but shall
particularly be utilised for container-related businesses. This represents a 20%
increase in the surface area of the port and its industrial complex. In accordance with
Port of Rotterdam Authority (2009b), the construction of „Maasvlakte 2‟ would mean
a tripling of the capacity of container handling in the port area.

78
4.3.3 Cargo Operations
As one of the leading ports in the world, the Port of Rotterdam Authority offers a
wide variety of excellent cargo operations which could be precisely summed as
follows:
Liquid Bulk
This group of cargoes are generally materials/products in liquid form that has not got
any particular packaging mechanism, but flows freely. Petroleum is one type of liquid
bulk cargo that stands out among others for the Port of Rotterdam.
Petroleum (Oil and Chemical)
Rotterdam has been home for many of the leading oil and chemical companies in the
world, usurping the port‟s strategic location for access to European markets. There are
four global-scale refineries and a diverse cluster of more than 40 modern world
leading oil and petrochemical companies operating in the port (Port of Rotterdam,
2009a). These operations are interconnected and supported by a complex network of
pipelines of more than 1,500 kilometres in length.
Dry Bulk
Dry bulk cargoes refer to those solid dry goods that are not usually cased or contained
in a special way, but can flow freely, thus often need mechanised means for loading
and discharging. For instance, coal, grain and similar cargoes are graded as dry bulk.
About 83 million metric tonnes of bulk cargoes are handled in the Port of Rotterdam,
of which agricultural bulk accounts for about 10 million metric tonnes and Rotterdam
is a recognised centre for European agri-business (Port of Rotterdam, 2009a). There
exists a diversity of service-provider-community in the dry agricultural bulk business,
for example crushers, processors, food manufacturers, packagers, transporters and
storage firms.

79
Break-Bulk and RORO
There are twenty seven break-bulk and RORO terminals in the Port of Rotterdam,
collectively handling a total of 25.6 million tonnes (Port of Rotterdam, 2009a). While
RORO (Roll-On-Roll-Off) are cargoes that basically have the ability to move on their
own, such as trucks, cars and other wheeled equipment, break-bulk are concerned
with cargoes that are free, but might not flow freely as they may have been organised
in some ways for better handling. Predominant break bulk cargoes handled by the Port
of Rotterdam include steel, non-ferrous metal, project cargo, paper, fruit, forest
products, automotive and others.
In view of the fact that the port is Europe‟s number 1 port, there exists modern
facilities, good hinterland connections and wide varieties of logistics service
providers. The port also reported that each of its terminals have specialities,
concerned with making sure that the port‟s clients are provided with services that are
tailored to their particular needs (Port of Rotterdam, 2009a). In this light, the break-
bulk and RORO firms in the Port of Rotterdam are focused to customers‟ satisfaction
through rendering of services that are „customised, client-oriented, quick and reliable
(i.e. a wide range of value-adding services).

80
Containers
The performance of the Port of Rotterdam among other world top 10 container ports
up to the year 2006 can be observed from figure 4.2, as prepared by maritime
specialists in the World Bank division of Transport (Port and Maritime Transport
Office).
Figure 4. 2: World Ten Top Container Ports (Source: Kruck and Julian, 2007)
The port of Rotterdam handles a throughput of about an average of 9.7 million TEUs
containers on annual basis (Port of Rotterdam, 2009a). Although the Port of
Rotterdam is outstanding in the area of European container freight, figure 4.2 shows
that other ports, such as Hamburg port, are vigorously competing for leadership in the
European container handling business (Kruck and Julian, 2007).

81
Some of the features that have contributed to the port of Rotterdam becoming a very
container-attractive-node include:
Capacity for Container Feeder Services
A unique endowment of the port according to Port of Rotterdam (2009a) is the
strategic location of the port on the North Sea (Northwest Europe), which in turn
gives the port an unlimited draft capacity and as such can accommodate modern
super-containerships and even the larger container vessels of the future. Users of the
port testify that it is able to effectively function as a feeder hub for cargoes that are
designated to different parts of Europe, making it a point of first or last call for many
Europe bound deep sea shipping lines. The Port therefore represents:
An intercontinental service provider for Mega container vessels
A major node in the global and European logistics chain
A provider of tailor-made offers for containerised cargoes (i.e. for pre-
transport and post-transport)
Reefer Containerisation
Reefers use specially designed forms of containers for the transportation of fresh
fruits and vegetables in a manner that preserves quality. The Port of Rotterdam
operates about 7,000 reefer points which have cold storage in the capacity of about
2.5 million cubic meters.

82
4.3.4 Ancillary Services
Ancillary services are in other words referred to as support or complementary
services.
Figure 4. 3: Ancillary services in Rotterdam Port (Source: Port of Rotterdam, 2007)
Illustration of figure 4.3 elucidates some of the offers of support and ancillary services
in the Port of Rotterdam and their providers. It is important to note that while this case
study on the Port of Rotterdam precisely covers some of its core operation areas, the
main subject of this research project is concerned with value-adding services, which
in turn are referred to as „support or complementary‟ services.

83
In response to and anticipation of international trade and logistics developments, the
Port of Rotterdam since the 1980s started developing „Distripacks‟ areas, to provide
space for product processing, warehousing, distribution and other logistical activities,
mainly for companies in need of a European hub (Pettit and Beresford, 2009). These
intended activities are ancillary or support services in relation to the core operations
of the port. Thus the project is considered as one of the strides towards provision of
value-adding services. The Port‟s three „Distripacks‟ are namely Maasvlakte, Botlek
and Eemhaven.
4.4 PD Teesport Port (United Kingdom)
The PD Teesport is one of the United Kingdom‟s leading ports in various logistics
service businesses and manages an extensive portfolio of properties. While its
headquarters is in the Tees valley (North East of England) with varied operations at
many of the key UK ports and logistics centres, PD Teesport is owned by Canadian-
based Brookfield, a global asset manager in property, renewable power and
infrastructure assets and is listed on the New York and Toronto Stock Exchanges (PD
ports, 2008). As a result of PD Teesport‟s significant operations of in other ports, the
name „PD Ports‟ is used to represent its port stakes and businesses in the United
Kingdom. Figure 4.4 shows Teesport map and geographical location.
Figure 4. 4 PD Teesport‟s map and geographical location (Source: PD Ports, 2008)

84
4.4.1 Cargo Operations
Facilities in PD Teesport include those of private wharves, offshore, ship repairs and
support services. Some core areas of the port‟s cargo operations are discussed below:
Containers (Lo/Lo)
PD Teesport has purpose built container terminals which are equipped for speedy
handling of container units. While there is focus on improving terminal
superstructures at different phases of development, each of the two container
terminals (TCT1 and TCT2) are equipped with two wide span gantry cranes
respectively operating at a rate in excess of 25 and 30 moves per hour (PD Ports,
2008). These are very important for the Lift-On and Lift-Off (LOLO) container
handling operations. TCT1 container terminal has a depth of 8.5 meters, whereas the
depth for TCT2 is 10.5 metres.
RORO Operations
In the recent times, PD Teesport has experienced major growth in the area of Roll-On
Roll-Off (RORO) operations, which is particularly concerned with the handling of
self-movable cargoes. This is applicable, for example, in the area of importation of
cars and other type of vehicles. The Teesport has achieved over 50% volume increase
in the area of RORO business since the last five (5) years (PD Ports, 2008). Some of
the port‟s major users of the RORO facilities and services are:
P&O Ferries: the firm has operated in the port for more than 15 years and with
6 established sailing schedules per week to both Rotterdam and Zeebrugge.
P&O has used the Teesport to access major routes to mainland Europe from
the UK.
Renault Cars: in conjunction with its partners, Renault cars imports over
100,000 trade cars each year using the 23 hectare storage facility. This level of
operation has resulted to a long term contract between the port and Renault on
vehicle enhancement work and import processing and preparation centre.

85
General Motors (GM): With a further lease of five (5) hectares of storage for
vehicles imported from European distribution centre in Zeebrugge, General
Motors seeks to boost its use of the Teesport.
PD Logistics
With headquarters at the Teesport, the PD Logistics unit offers warehousing and
distribution services at thirteen (13) UK locations throughout the North East,
Humberside, East Anglia and Felixstowe (PD Ports, 2008). In the stride to boost its
portcentric growth strategy, the offers of the PD Logistics enable port users to:
Circumvent the need for inland container movements
Eliminate demurrage bills and quay rent for containers
Reduce of inland movement by direct deliveries from the port premises
Provide cross-docking operations that supports quick response to market
Effectively manage and reduce inventory across the supply chain
Apart from Teesport, PD ports‟ operations in other UK ports are shown in figure 4.5.
● Container Terminal Operation
● Terminal Operation
● Transport/haulage services
● Bespoke services
● Warehousing
● Container Terminal Operation
● Stevedoring
●Research & Development
● Stock control
● Ship agency
PD Teesport
Immingham Port
Hull Port
Grimsby Port
Figure 4. 5: Teesport operations in other key UK ports (Adapted from: PD ports, 2008)

86
4.4.2 PD Ports in Immingham Port
In the port of Immingham, PD ports happen to be one of the key port service
providers. The port of Immingham is located on the south bank of the Humber
Estuary, and in cargo volume terms, it is the third largest UK port (PD Teesport and
Hartlepool, 2008; DfT, 2000; DfT, 2006). As illustrated in figure 4.5 above, the PD
ports are actively involved in:
The Operation of the terminal
PD ports run a stevedoring operation in the port of Immingham that handles about
700,000 tonnes per annum through dedicated terminals (PD ports, 2008). This is only
realistic given its diverse cargo handling equipment, enabling the loading,
discharging, stacking and releasing of cargoes for distribution by rail or roads. The
different cargoes handled by the PD terminal include minerals, forest products,
aluminium, animal feeds, timber, zinc, fruits, ores, project materials and steel.
Transportation Services
PD ports offers transportation services in the Immingham port using a small fleet of
vehicles dedicated to the port business. This transport service section achieves over
5,500 deliveries per annum.
Warehousing Services
Provision of storage and warehousing facilities and services is one area of PD ports
businesses in the Immingham port. The company has over 500, 000 square feet for its
covered warehousing services (PD ports, 2008). In addition, it also has 30 acres of
secure open storage compound and provides a custom bonded service.
Bespoke Services
By bespoke services, the implication is that the PD port renders services that are
directly tailored to the needs of any particular client at any given time. For instance, it
designed and built a manufacturing plant for coated ferrous sulphate and also has a
long term contract with a major Scandinavian chemical producer (PD ports, 2008). In
essence PD ports provide value-adding services in the port of Immingham.

87
4.4.3 PD Ports in Hull Port
PD ports run a terminal at the port of Hull, which is according to the Department for
Transport (DfT, 2006) the sixth busiest UK port in container handling as of 2004 and
all cargo traffic throughput in this particular year totalled 12 million tonnes. The port
of Hull is considered the fourth largest fishing port in England. Vessels that are up to
a capacity of thirty thousand (30,000) dead weight (dwt) can be handled and there is
the facility to handle about 250,000 TEUs on an annual basis by the PD port‟s
terminal (PD ports, 2008).
4.4.4 PD Ports in Grimsby Port
As is the case in the port of Hull, the PD ports operate a container terminal in the
Grimsby port. The Immingham and Grimsby ports are owned by Associated British
Ports (ABP) (Associated British Port, 2009). In a site of 2.5 hectare, PD ports offer
not only services for container handling, but also a range of other services like stock
control, stevedoring, and ship agency services (PD Tees and Hartlepool, 2008).
4.4.5 PD ports Operations in inland ports
Inland ports are important for economic growth and social issues, for example in
reducing road congestion. PD ports have stakes and operations in the following UK
inland ports:
Howden
Keadby
Cowes (Isle of Wight)

88
4.5 Damietta Port (Egypt)
Historically, Damietta port is one of the oldest ports in Egypt from which a large
volume of the country‟s commercial export operations are still carried out to different
foreign nations, however completion of the modern port came to being in the year
1982 (Damietta port, 2009).
With a total area of 11.8 Km2 of water to load area ratio 1:3, the Damietta port is
situated in a location that is connected to the transportation network of rail, roads and
rivers. In a further breakdown of these figures, Egyptian Maritime Data Service
(2007) reported that while the land area is 8.5 Km2, the water area is 3.3 km
2.
The port‟s maximum length and breadth are respectively 4km and 3km. Figure 4.6 is
a map showing the area and geographical location of Damietta port.
Figure 4. 6: The map and geographical location of the Damietta port. (Source Damietta Port, 2009)

89
There are different operations carried out in the port and these can be categorised
under the following terminals:
Container Terminal
The terminal has four berths on a length of 1.05km and in order to service third
generation or contemporary mega containerships, the berths are in the depths of 14.5
metres. The actual and available annual container throughput of Damietta port is
shown in the table 4.1.
Table 4. 1: Containers in Port of Damietta (Period 2000 - 2004)
Year 2000 2001 2002 2003 2004
Lan
ded
Full
TEU
222,150
227,183
238,592
329,651
413,534
Empty
TEU
85,100
88,807
104,636
139,493
207,032
Tonnage
1,080,571
2,328,097
2,544,076
3,567,940
4,284,022
Sh
ipp
ed
Full
TEU
199,201
218,696
253,096
353,255
465,784
Empty
TEU
110,308
104,639
115,812
132,646
176,596
Tonnage
1,691,380
2,472,612
2,647,968
3,930,453
4,896,724
Total TEU
616,759
639,325
712,136
955,045
1,262,946
Total
Tonnage
2,771,951
4,800,709
5,192,044
7,498,393
9,180,746
(Source: Containerisation International Year Book, 2003 & 2006)
In table 4.1, a careful observation of the „landed and shipped‟ tonnage rows showed
that, more shipment or export of goods/materials was progressively carried out over
the years in consideration, as opposed to goods „landed‟ or rather imported through
Damietta port. It is important to note however that both imported (landed) and
exported (shipped) containers respectively continued to increase between the year
2000 and 2004, showing a positive trend of traffic flow through the Damietta port.

90
General Cargo
Vessels of different cargoes of up to a capacity of 50,000 tonnes can be handled in the
general cargo terminal which with a total length of 0.8km has four dedicated berths.
The depth of the terminal is 12 metres, while its storage capacity and annual
throughput are 1 million and 2.1 million tonnes respectively.
Dry Bulk Terminal
Four berths in the total length of 900 metres are utilised for dry bulk cargo services
with a terminal water depth of 12 metres. The storage capacity of the terminal is about
500,000 tonnes and it can also handle vessels of up to 50,000 tonnes. It might suffice
to note that dry bulk products/ freight of concern are free flow cargoes such as
cement, dry sand or concrete, that are not packaged or contained in any particular
casing.
Liquefied Natural Gas (LNG)
LNG and other petroleum related chemicals happen to be among the major cargoes
that pass through the Damietta port on an annual basis. The key groups handling these
categories of freight are SEGAS, United Gas Derivatives Company and the Egyptian
Holding Company for Petrochemicals. The derivative and petrochemical companies
have established specialised petroleum jetties on BOT (Build Operate and Transfer)
contracts. As a result of the construction of various facilities, the production, storage,
transport and export of petrochemicals and LNG products are made possible in the
port area (Damietta port, 2009).
Other specialised terminals are:
Grains terminal
Liquid bulk terminal
With a maximum capacity to berth and handle vessels of 14 metres draft, the annual
throughput of the Damietta port is 19.75 million tonnes (Egyptian Maritime Data
Service, 2007).

91
4.5.1 Damietta Port in relation to Suez Canal & Other Egyptian Ports
In the relation other important Egyptian commercial ports, figure 4.7 shows the
geographical location of the Damietta port in proximity to the Suez Canal.
Figure 4. 7: Egyptian Commercial Ports (Source: Egyptian Maritime Data Service (2009)
According to the Egyptian Maritime Data Service (2007), the Suez Canal provides the
shortest sea link between the East and the West as a result of its unique geographic
location. The figure 4.7 illustrates the international importance of the Suez Canal in
providing an essential connectivity between the Mediterranean Sea and the Red Sea,
which respectively opens/widens into the Atlantic and Indian Oceans.

92
4.6 Apapa Port (Nigerian Port Authority- NPA, Nigeria)
Apapa port, which is also known as the Lagos Port Complex, is owned by the
Nigerian Ports Authority (NPA). The port is located in the South West of Nigeria and
occupies a land area of over 120 hectares (Nigerian Port Authority, 2007). Figure 3.8
shows the geographical location of Apapa port in Lagos Nigeria.
Figure 4. 8: Geographical location Map of Apapa Lagos Port (Source: Oyibosonline, 2007)
Apapa port is the country‟s biggest port, handling a wide range of commodities and
have specialized facilities in handling wheat, oil, cement, fish, dry cargo, and
containers (World Port Source, 2010).
The port concession policy of the Federal government of Nigeria on Nigerian Port
Authority (NPA) brought considerable changes in Nigerian ports, and Apapa port was
no exemption. In this light therefore, it is of interest to start by a concise examination
of the NPA (Nigerian Port Authority) and thereafter concentrate on Apapa port‟s
operations.
93
4.6.1 Nigerian Port Authority (NPA)
To a great extent, Nigerian ports were operated independently until the government
formed the Nigerian Ports Authority to coordinate the activities of all the ports.
In a bid to enhance the contribution of ports to the National economy, the Federal
government of Nigerian‟s repositioning and restructuring of ports project resulted in
the creation of NPA, enabling further provision of equipment for greater efficiency
and contribution to the country‟s growth. The concession of Nigerian ports under
NPA finally came into being in 2006. This journey toward port concession
commenced on the 3rd
December 2003 when the National Council for Privatisation
advertised for Expression of Interest (EOIs) and subsequently took prospective
bidders through due processes (Nigerian Port Authority, 2007).
The involvement of private business owners in the ports became clear, as seen in the
emergence of private terminal operators. It is however necessary to observe that the
Federal government of Nigeria did not fully privatise NPA, rather a landlord-operator
kind of structure has been established.
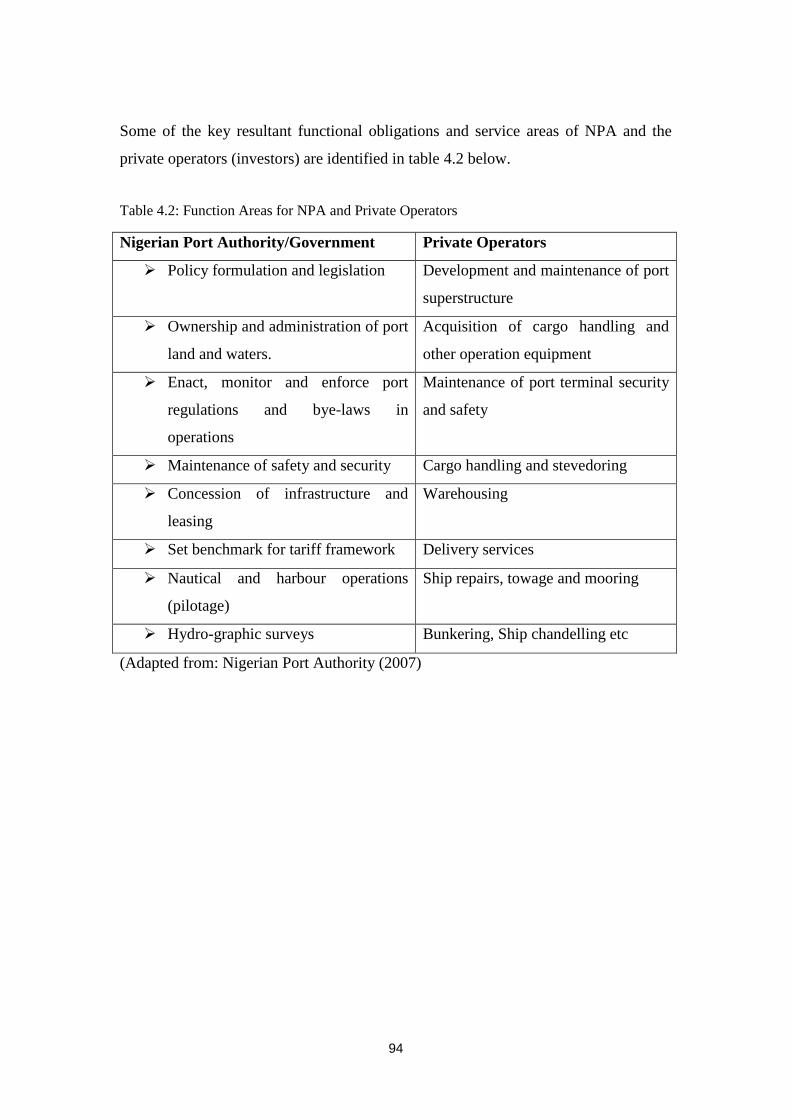
94
Some of the key resultant functional obligations and service areas of NPA and the
private operators (investors) are identified in table 4.2 below.
Table 4.2: Function Areas for NPA and Private Operators
Nigerian Port Authority/Government Private Operators
Policy formulation and legislation Development and maintenance of port
superstructure
Ownership and administration of port
land and waters.
Acquisition of cargo handling and
other operation equipment
Enact, monitor and enforce port
regulations and bye-laws in
operations
Maintenance of port terminal security
and safety
Maintenance of safety and security Cargo handling and stevedoring
Concession of infrastructure and
leasing
Warehousing
Set benchmark for tariff framework Delivery services
Nautical and harbour operations
(pilotage)
Ship repairs, towage and mooring
Hydro-graphic surveys Bunkering, Ship chandelling etc
(Adapted from: Nigerian Port Authority (2007)

95
4.6.2 The Apapa port Operators
The Nigerian Port Authority (2006) described Apapa port as the largest and most
important Nigerian port, given its status marked by the opening of the Lagos lagoon
for ocean going vessels in the early 1900s and contributions to the nation‟s economy.
As a result of the privatisation scheme by government, there was an infusion of port
operators into the Apapa port system. These operators are shown in table 4.3.
Table 4. 3: Apapa Port Operators (Source: Nigerian Port Authority, 2007)
Nigerian Port Authority/Government
Apapa Bulk Terminal limited (ABTL), operates terminals A and B on a 25 year
contract
ENL Consortium limited, operates terminals C and D on a 10-year contract
Greenview Development Nigeria Limited (GDNL) operates terminal E on a 25
year contract.
Eko Support services Ltd operates Bullnose 1, 2, 3 terminals on a 5-year
contract.
AP Mollar Terminals operates the container terminal on a 25-year contract.
Maersk line operates the Ijora Lylipond terminal on a 10-year contract.
Apapa port accommodates the handling operations of various kinds of general and
special cargoes. The Apapa quays alone covers a land area of 100 hectares on a quay
length of 2,459 metres, with berth facilities capable of servicing up to 20 vessels at
the same time in the depths (draught) ranging from 8.23 metres to 10 metres (Nigerian
Port Authority, 2006).

96
4.6.3 Apapa Container Terminal
Apapa port stands out among all other Nigerian ports in the handling of containers
and is a principal outlet for the country‟s exports (World Port Source, 2010). AP
Moller-Maersk Group is a major private operator of the Apapa container terminal.
Table 4.4 shows data on recent past years‟ container operations throughput in Apapa
port.
Table 4.4: Apapa Port Container Throughput (NPA, 2003)
Year
Lagos Port
Inward Outward Total Throughput
2002 11,546,260 208,279 11,754,539
2003 11,653,962 221,303 11,875,265
2004 12,109,451 185,189 12,294,640
2005 13,206,813 225,293 13,432,106
2006 16,904,996 203,864 17,108,860
TOTAL 65,421,482 1,043,928 66,465,410
The container terminal area covers 44 hectares, having the capacity to handle up to
twenty two thousand (22,000) TEUs of containerized cargo. On a total quay length of
950 meters the six container terminals have berths of 10 meters depths. There is a
covered storage of 6.4 thousand square meters in the Apapa container terminal, with a
container yard of 19.5 thousand TEUs capacity, and also contains 298 reefer plugs
(World Port Source, 2010).

97
4.6.4 General Cargo Operations
Apapa port has the capacity to handle other types of cargoes, such as liquid bulk, dry
bulk cargoes and break-bulk cargoes. Hence, the port is equipped to handle general
cargo traffic. Other types of operations and cargo handling areas in the Apapa port
include:
Apapa dockyard
Fish wharf
Petroleum wharf and Atlas Cove tanker jetties
Bulk vegetable oil
RORO cargoes
4.6.5 Support Service Provision
The port offers a wide array of complementary port services to support port users,
these include:
Bunkering: Supply of essential fuels to sea-going vessels.
Fresh-water: Adequate provision of portable water to the calling ships.
Ship stores: Can facilitate the supply of victuals for ship stores. etc.
4.7 Summary
The main reasons for selecting the case study ports include that they are major ports
in their countries and all handle general cargoes, also for easy accessibility of data.
While this chapter has given attention to examining the perspectives and approaches
to value-adding services in the ports, the core operations of the ports were also
discussed. The port of Rotterdam in Netherlands and PD Teesport in the UK are both
progressing in the modern portcentric practices, which increasingly support the
offering of distribution and logistics services from and within ports. Both ports
continue in their strides to attract service providers and individual companies to use
the ports as points for customisation of services and operations. Egyptian Damietta
port and the Apapa Nigerian port were reported to be major ports in their different
countries; they also render some support or value-adding logistics services. The
availability of land was found to be an essential strength in the capacity of a port to
offer value-adding services and some of the common types of value-adding services
discovered in the ports include: transport services, warehousing, fresh water supplies
and other bespoke services.

98
Chapter 5 - Data Analysis Perspective
5.1 Introduction
In business and social science research, the interest is to discover something about a
phenomenon that is theoretically assumed to be in actual existence in the „real world‟
(engaging human beings in their environment). An analogy to this statement with
regards to the present research project therefore would be that while the set
hypothetical aims (sections 1.3 and 1.4) and conceptual framework represent assumed
phenomena, the various ports in this study represent the real world.
Therefore, as in most research, data in this study were collected from the real world
(Rotterdam, PD Teesport, Damietta and Apapa ports) to understand the theoretical
phenomena of value-adding services. This quest to understand the phenomena in
question was made possible by using available data to develop models of value-
adding services that represent real world situations, which would then be further
tested for discoveries, upon which conclusions can be made about the real world.
Firstly, this chapter starts by examining the theoretical basis of data analysis
techniques that were carried out in this study. Aspects covered in this regards include
discussions on univariate, bivariate and multivariate analyses. It then proceeds to
report the processes of piloting primary data collection by questionnaire and interview
processes.
Secondly, given that the following chapters (6 and 7) are dedicated to the main data
analysis, preliminary data analyses will be presented in this chapter which primarily
covered evaluation of survey response rate. Also, reasons for the selected research
analyses and approach to organising case study ports‟ data are provided in this
chapter.
Finally, there will be a reliability assessment of all data obtained from the
questionnaire survey of all the case study ports using the internal consistency method.

99
5.2 Research Variables
The nature of variables employed in a given study will predominately direct the types
of analyses that can be carried out. As is the case in research measurements
(McGivern, 2009; Proctor, 2005), table 5.1 shows the two major ways in which
variables used for measurement can be grouped.
Table 5.1: Categorical Variables (CV) & Scale Variables (SV)
Categorical Variables (CV) Scale Variables (SV)
CV are types in which individual items can
be grouped (Easternby-Smith et al., 2008;
Cameron and Price, 2009); eg. marital status
(single, married, divorced); Ethnicity
(African, white, Asian). Categorical
variables (CV) are of two types:
These variables are discrete, not groupings,
and represent quantities of the measured
elements (Easternby-Smith et al., 2008;
Cameron and Price, 2009); e.g. age, scores
of football match. Scale variables (SV) are
of two types:
Ordinal Nominal Count Continuous
Related to ranking
or logical ordering,
e.g. for ship crew:
second mate, first
mate and master.
This group of CV
have no particular
ranking, e.g.
categories of ships:
dry cargo, passenger
and tanker.
These are whole
numbers; values that
show for example
„how many ports there
are in a country‟.
These can be both
whole and
fractional
numbers; as they
show „how
much‟.
Predominantly, data used in this study are categorical in nature, as they are
appropriate in carrying out analyses necessary to reach all set research aims.
5.3 Levels of Statistical Analysis
5.3.1 Univariate
Univariate analyses are concerned with examining trends or characteristics in
individual variables to be explored independently of other set of data (McGivern,
2009). Analyses covered under univariate category include descriptive distribution,
frequencies, tendencies and summaries, which are usually represented by bar and pie
charts, histograms and others. These types of analyses are very important and

100
informative, building the fundamental platform on which to carry out further
relational or associative analyses in order to fully understand the characteristics of
variables under investigation (Baker, 1991).
According to Sweet and Martin-Grace (2008), univariate analyses answer questions
such as „how much, how often?‟, and help to reveal limitations in data while giving
informed indications to researchers on the types of advanced statistical procedures
that can possibly be carried out as a result. In this research the univariate analyses
carried out were reported in the form of frequencies, summaries, percentages and
represented by tables, bar charts and pie charts. Baker (1991) cited Selltiz et al. (1959)
in support of the idea that research progression should naturally commence by
descriptive univariate analyses and proceed to more complex inferential analyses.
5.3.2 Bivariate Analysis
In bivariate, while „bi‟ stands for two, „variate‟ is associated with variable. Green et
al. (1988) strongly advocated the use of bivariate analysis in the examination of
relationships between two variables that are of particular interest in a given research
problem. They emphasised that the analysis provides a means of presentation of data
for easy interpretation, even to researchers and managers with less statistical
knowledge. The variables suitable for a bivariate analysis can either be categorical or
scale (Bryman and Bell, 2007).
When two or more variables are considered simultaneously, cross-tabulation enables
ascertaining the number of cases that fall into each of the several categories
(Churchill, 2001). Cross-tabulation with two variables is referred to as bivariate cross-
tabulation and there are also bivariate correlation and regression analyses (Green et al.
1988; Malhotra, 1999). Bivariate cross-tabulation can be used to show association
between two categorical variables. The observation of an association relationship
between two scale variables can be shown by bivariate correlation, while bivariate
regression develops a mathematical equation for the prediction of relationship
between variables.

101
Group Comparison by Bivariate Analysis
There are different classifications and categories in the world such as race, colour,
income, height and education. These produce both scale and categorical variables as
discussed in section 5.2. One of the ways to draw understanding from variables of
different structures is to analyse and compare their means by tests such as analysis of
variance, t-test, box plots and bar charts (Sweet and Martin-Grace, 2008).
One-Way Analysis of Variance (ANOVA): This is able to compare the mean
values of a categorical variable to measure how it differs to the mean of a
scale variable, and thereafter obtain the relationship‟s statistical significance.
This relationship is not a causal one, but one of association.
Regression Analysis: This evaluates both independent and dependent
variables that are ratio/scaled to ascertain the nature and degree of association
relationship between them, however does not imply a causality relationship
(Schmidt and Hollensen, 2006). For example, linear regression is theoretically
a bivariate analysis built on the assumption that for every unit change in the
independent variable, there is a corresponding change that is consistent and
proportionate in the dependent variable.
Although it was deemed necessary to highlight the fundamental mechanism of
both analyses (ANOVA and regression), they shall not be used in this study,
because meeting the research aims did not necessitate the use of scale data
needed to carry out the analyses.
5.3.3 Chi-Square Test
The chi-square test is a very widely acknowledged bivariate statistical test (Dillon, et
al, 1994; Easternby-Smith, et al. 2008). As explained by McGivern (2009), chi-square
is a measure of association that commences by computing the frequency distribution
expected in two variables to ascertain if there were no association between them, and
then compares these expected frequencies (E) with observed frequencies (O) in the
variables. Then it proceeds by squaring the differences between the observed and
expected frequencies and dividing them by expected frequencies (E) for every cell in
a contingency table. In essence, chi-square test enables the testing of relationship

102
between two categorical variables (Churchill, 2001; Cameron and Price, 2009; Crimp
and Wright, 1995); and would be used mainly in testing the propositions set out in this
research project.
The chi-square test analyses were carried out in section 7.4 in order to establish if
there were significant levels of relationships between some research variables.
5.3.4 Multivariate Analysis
Multivariate analysis describes an analysis where the relationship of multiple
independent variables and a dependent variable are tested. A fundamental concern of
multivariate analysis is the simultaneous relationship among two or more phenomena,
in order to create robust models that satisfy both mathematical and theoretical
assumptions (McDaniel and Gates, 1998; Malhotra, 1999; Sweet and Martin-Grace,
2008). An outline of examples of multivariate analysis was given by McDaniel and
Gates (1998) to include multiple regression analysis, multiple discriminant analysis,
cluster analysis, factor analysis, conjoint analysis and perceptual mapping. Factor
analysis is a type of multivariate analysis carried out in this study and its fundamental
features are hereby discussed.
Factor Analysis
The use of factor analysis is to explore and collate data in a way of summarisation
based on the interdependency of the variables in question has been widely
acknowledged (McGigivern, 2009; McDaniel and Gates, 1998). Typically, the goal is
to reduce a large set of data to manageable group sizes according to underlying
relationship in the data. Hence, it provides a basis to further understand the
interrelated group of data from a larger poll of data and to facilitate inferential
analysis and discussions. This view was also confirmed by Proctor (2005) and
Malhotra (1999) that factor analysis is a known multivariate statistical technique in
which a whole set of data‟s interdependent relationship is examined. While most
known statistical techniques that test relationships would clearly specify independent
and dependent variables, factor analysis does not have this kind of specification basis.

103
In this study, factor analysis was carried out on a poll of identified variables or criteria
for port selection in order to further understand them, in subgroups, based on their
interrelatedness. This is reported in section 7.3.
5.4 Test’s Significance
The inferential analyses carried out in this study, particularly those of chi-square and
factor analysis, shall be assessed mainly on the significance of the tests results. Hence,
it becomes necessary to have a brief theoretical understanding of test‟s significance.
When statistical tests are run on a given sample, relationship(s) between variables are
tested to ascertain if the resultant trend(s) would likely continue to exist in another
sample drawn from the same population or if it were possible to study the entire
population (Sweet and Martin-Grace; 2008). If a test‟s result reveals a consistent
trend, the relationship under examination is said to be statistically significant.
Observations on research variables (data) from a given sample might seem to show
relationships when it is actually a product of occurrence by chance, on the other hand,
there may be the existence of a discernable (real) relationship (Cameron and Price,
2009). It is as a result of this cloudy projection of relationships in variables that
establishing the degree or strength of relationships in tested variables has become
crucial in statistical analyses. This degree of relationship gives an indication of the
level of confidence that can be put on a test‟s result in reaching conclusions on
research aims.
Thus, significance levels in statistical tests offer the probability that observed trends
in data are produced by chance (Parasuraman, 1991, Dillon, 1994). It therefore
follows that given a set benchmark value (significance level) in a particular test, a
statistically significant relationship in variables can be determined if the significance
is sufficiently lower than the set benchmark value.
For the chi-square test in this study, the set significance level was 0.05 (section 7.4).
Bartlett‟s test and KMO are two types of tests that can be used to assess factor
analysis‟ test results. A KMO value in the range of 0.5-1.0 and a Bartlett‟s test value
significant at 0.05 confirm appropriateness of a factor analysis outcome (Malhotra,
1999). See section 7.3 for details of the tests‟ application in this study.

104
5.5 Piloting of Primary Data Collection
In order to assess the validity and reliability of questions in the questionnaire and
interview checklist, pilot tests were carried out. Piloting guidelines as validated by
Saunders et al. (2007) and Fink (2003) were utilised, ensuring that the exercise
included all major variations of the population of port users and port management
involved in the investigation by questionnaire survey and interview process.
In line with this process, initial questionnaires were administered to survey 7 (seven)
different port-user companies in case study ports, covering stevedores, freight
forwarders, shipping lines, importers, exporters and others. Data collected from this
preliminary survey were pilot-tested and the results showed that responses from
respondents produced information that was consistent and useful for measurement and
understanding of the intended research variables. These included, rightly giving
examples of value-adding services in the ports and appropriately indicating the likely
usage rate of value-adding services and ranking them according to importance. This
method of evaluating data and data collection medium by judgement and face
validation is supported by Hague et al. (2004) and Lunn et al. (1986).
For the interview aspect of data collection, the initial interview-checklist was used to
interview three (3) interviewees from the cadre of port management, as a way of test-
piloting to ensure clarity, reliability and validity.
Consequent upon the interview-pilot process, other relevant issues and lead questions
were identified, which enhanced understanding of core research variables.
Particularly, the need to explore the impact of „landlord-port operator‟ management
structure in ports with regards to port strategy development emerged during the pilot
test. As a result, this management structure issue received additional attention in the
final versions of the interview checklist.

105
By carrying out a pilot test of the questionnaire and interview checklist, the following
were achieved:
Better understanding of questions, which were updated for sequential
flow of issues being addressed
Identifications of questions which seemed to be differently understood
Changes deemed necessary in the final questionnaire and interview
checklist were made
Note that non-fully completed questionnaires were not used in the research so as to
ensure consistency of opinions. It is therefore believed that any possible problems
with respect to the respondents‟ understanding of the final refined questions were
minimised.
5.6 Preliminary Analyses
This section will assess the quality of all research data prior to the commencement of
the main aspects of data analysis, as reported in the following chapters (6 and 7).
Research data were assessed using preliminary data analyses. These analyses which
were carried out after the piloting of primary data collection process include response
rate evaluation and data reliability assessment.
5.7 Survey Response Rate
Survey response rate is concerned with the proportion of questionnaires that returned
in useable standards in relation to the total questionnaires used in surveying the
sample size of the research (Cameron and Price, 2009; Bryman and Bell, 2007).
5.7.1 Response Rate 1 - (Ports in Developed Economies)
1. A total of one hundred and twenty (120) port-user companies were sampled
and questionnaires were sent to them. (Refer to section 3.5.1 for full details of
the simple random sampling method used in the selection of the port users).
2. Of the total number of questionnaires sent out for survey in the ports
(Rotterdam and PD Teesport) in developed economies, 37 questionnaires
returned fully completed and acceptable/useable.

106
3. Only one (1) of the questionnaires was classified in the unsuitable/unreachable
category (see equation below).
4. The proportion of the returned questionnaires represented a response rate of
31% of the total number of questionnaires sent out for the survey.
5. The response rate above in (4) was obtained by:
Number of usable Questionnaires
Total Numbers – unsuitable/unreachable sample members
37
120-1
37
119
0.310924
31.0924 %
31%
At the receipt of twenty two (22) questionnaires, an intermediate or preliminary
analysis was carried out on the returned questionnaires. Though there were clear
trends of majority opinions to meet research aims, it was nonetheless deemed
important to increase questionnaire responses from the field survey. A second stage of
the preliminary analysis ensued when the total number of the returned questionnaires
reached 37 which yielded a response rate of 31% as calculated above.
While this response rate is quite acceptable in most social and business research, close
observation of results from the follow-up preliminary data analysis (reported below)
showed strong consistent trends.
Equation =
x 100
x 100
x 100
=
x 100
=
=
=
=

107
Note: Reason for Merging Rotterdam and PD Teesport Questionnaire Data –
It is important to point out that although the different stages of response rate analysis
showed strong consistency in data, a smaller number of responses were obtained from
Rotterdam and PD Teesport port users. Given this outcome and because analysis
revealed that case study information and primary data from both ports had no
discernable difference, collected questionnaire data from the Rotterdam and PD
Teesport ports were merged together. The significance of a response rate is in
ascertaining that those who did not participate do not considerably differ from those
who did participate (Bryman and Bell, 2007; Malhotra, 1999).
At the response rate of 31% the consistency shown in data trends indicated that a
significant rate has been reached. For example, consistency in data trends on two
research issues is reported by the aid of table 5.2, table 5.3, and table 5.4 which
showed that there would not be significant difference in continuing data collection.
These presentations illustrate clear and dominating opinions of port users on the
issues of: availability of value-adding services; impact of value-adding services in
attracting port users and impact of value-adding services in the retention of port users
respectively.
Table 5.2: Availability of Value-Adding Services (Rotterdam & PD Teesport)
Frequency Percent
Valid
Percent
Cumulative
Percent
Valid YES 31 83.8 83.8 83.8
NO 6 16.2 16.2 100.0
Total 37 100.0 100.0
(Note: „Yes‟ affirms the availability of value-adding services, while „No‟ indicates the
service is not available).
Table 5.3 : Impact of VAS on attracting port users (Rotterdam & PD Teesport)
Frequency Percent
Valid
Percent
Cumulative
Percent
Valid More
Attractive 22 59.5 59.5 59.5
Less
Attractive 9 24.3 24.3 83.8
Makes no
Difference 6 16.2 16.2 100.0
Total 37 100.0 100.0
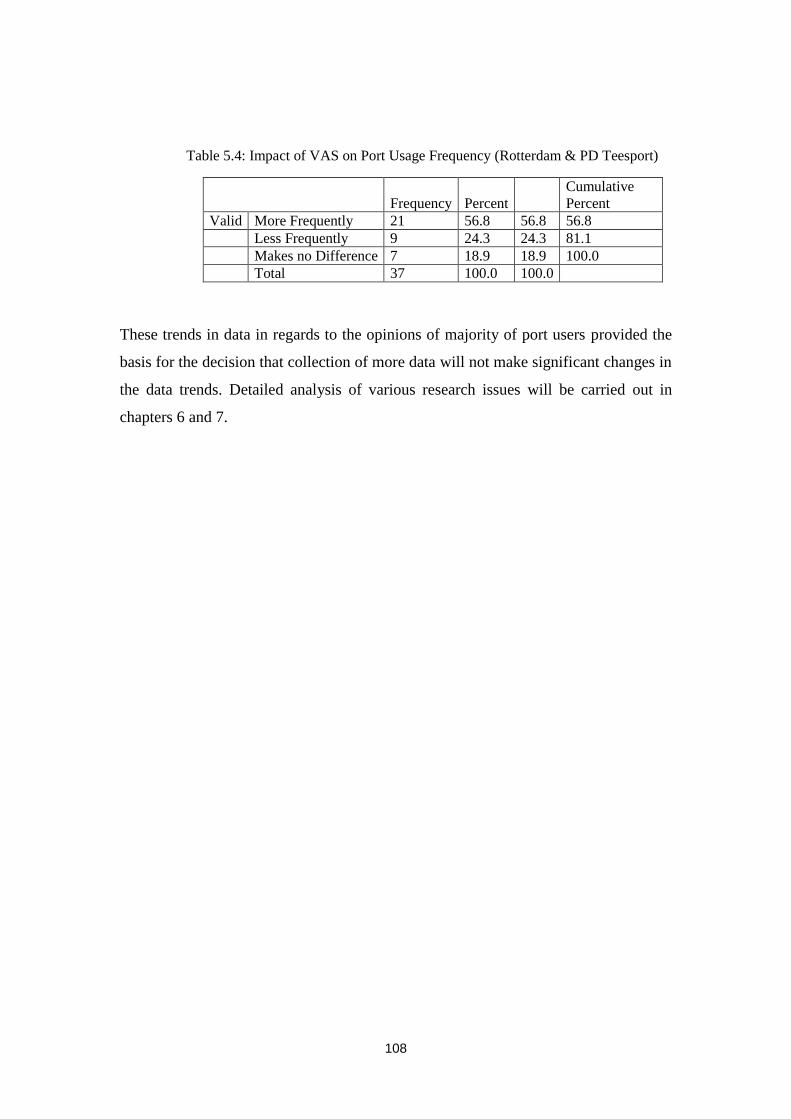
108
Table 5.4: Impact of VAS on Port Usage Frequency (Rotterdam & PD Teesport)
Frequency Percent
Cumulative
Percent
Valid More Frequently 21 56.8 56.8 56.8
Less Frequently 9 24.3 24.3 81.1
Makes no Difference 7 18.9 18.9 100.0
Total 37 100.0 100.0
These trends in data in regards to the opinions of majority of port users provided the
basis for the decision that collection of more data will not make significant changes in
the data trends. Detailed analysis of various research issues will be carried out in
chapters 6 and 7.

109
5.7.2 Response Rate 2 - (Ports in Developing Economies)
1. A total of one hundred and twenty (120) port-user companies were included in
the sample and questionnaires were sent to them. (Reference should be made
to section 3.5.1 for full details of the simple random sampling method used in
the selection of the port users).
2. Of the total number of questionnaires sent out for survey of ports in
developing economies, 74 questionnaires were returned fully completed and
useable.
3. Only two (2) of the questionnaires emerged to be classified as unsuitable (see
equation below).
4. The proportion of the returned questionnaires represented a response rate of
63% of the total number of questionnaires sent out for the survey.
5. The response rate above in (4) was obtained thus:
Number of usable Questionnaires
Total Numbers –unsuitable/unreachable sample members
74
120- 2
74
118
0.627112
62.7112 %
63%
On the receipt of forty six (46) questionnaires, an intermediate or preliminary analysis
carried out on the returned questionnaires showed strong consistent opinions amongst
Equation =
x 100
x 100
x 100
=
x 100
=
=
=
=

110
a majority of the respondents. Nevertheless, further field survey followed in order to
increase responses and gather more data.
Another preliminary analysis carried out for the second stage took place when the
total number of the returned questionnaires summed to 74. At this magnitude, the
calculation of the response rate of survey of port-user companies in developing
economies as shown above (5.7.2) resulted in 63%.
Overtly a response rate of this degree represents a significantly acceptable
representation in surveys of this kind. In addition, close observation of trends in the
preliminary analysis of data distributions, as represented by table 5.5, table 5.6 and
table 5.7 substantiates the strength of the response rate, thus supporting the view that
enough data had been collected.
Table 5. 5: Availability of Value-Adding Services
Frequency Percent
Valid
Percent
Cumulative
Percent
Valid YES 54 73.0 73.0 73.0
NO 20 27.0 27.0 100.0
Total 74 100.0 100.0
Table 5.6: Impact of Value-Adding Services on Attracting Port Users
Frequency Percent
Valid
Percent
Cumulative
Percent
Valid More Attractive 61 82.4 82.4 82.4
Less Attractive 8 10.8 10.8 93.2
Makes no
Difference 5 6.8 6.8 100.0
Total 74 100.0 100.0
Table 5.7: Impact of Value-Adding Services on Port Usage Frequency (Retention)
Frequency Percent
Valid
Percent
Cumulative
Percent
Valid More
Frequently 56 75.7 75.7 75.7
Less
Frequently 12 16.2 16.2 91.9
Makes no
Difference 6 8.1 8.1 100.0
Total 74 100.0 100.0

111
Note: Reason for Separately Analysing Damietta and Apapa Ports’ Data
Of the 74 completed useable questionnaires from port users in case study ports in the
developing economies, the proportions from the ports are:
Damietta port – 35
Apapa port – 39
For both Damietta and Apapa ports, the response rates were high. On this basis, data
from both ports were kept and analysed separately. In addition, another important
reason is that this study gives a particular focus to investigating how value-adding
services can competitively be used in ports of developing economies, supported by
the experience of ports in the developed economies.
Total Returned Questionnaire: The total of all questionnaires that were returned in
a useable condition from port users in both ports situated in developing and developed
economies amounted to one hundred and eleven (111), out of the total of two hundred
and forty (240) that were sent out. The breakdown being: 37 for Rotterdam and PD
Teesport, 35 for Damietta port and 39 for Apapa port. Data from these questionnaires
are organised and presented in chapter 6 for analysis.

112
5.8 Research Data Reliability Assessment
The term reliability is primarily a concept concerned with measuring consistency in
data. For reliability of data in this study, internal consistency was evaluated before
main data analysis was carried out. Internal consistency is concerned with data
homogeneity and can be tested by inter-item consistency or the split half methods
(Gulliksen, 1945; Bryman and Bell, 2007). It shows the degree of correlation in
different items that measure related underling principles.
Another means for reliability evaluation can be through a stability check; however
that of internal consistency was used in this research because it offered a
straightforward method. This method is essentially based on the approach of
measuring reliability by Cicourel (1964) as cited by Bryman and Bell, (2007). All
data collected by questionnaire were combined together in the test for reliability. This
can be better comprehended as explained below:
Table 5.8: Preference of VAS * Impact of VAS on Attracting Port Users Crosstabulation
Impact of Value-Adding Services on
Attracting Port Users Total
More
Attractive
Less
Attractive
Makes no
Difference
‘‘Port Users
Prefer
Value-Adding
Service Port’’
Strongly
Disagree
Count 1 2 0 3
% of
Total .9%
.0% 2.7%
Disagree
Count 1 6 1 8
% of
Total .9% .9% 7.2%
Makes no
Difference
Count 9 7 5 21
% of
Total 8.1% 6.3% 18.9%
Agree
Count 31 2 4 37
% of
Total 1.8% 3.6% 33.3%
Strongly
Agree
Count
41 0 1 42
% of
Total .0% .9% 37.8%
Total Count 83 17 11 111
% of
Total 74.8% 15.3% 9.9% 100.0%
1.8%
5.4%
4.5%
27.9%
36.9%

113
Cross-tabulation operation matches data from various variables of interest so as to
show the linkage between them (Churchill, 2001; Green et al. 1988). Table 5.8
showed the results of SPSS cross-tabulation of data from questions number 8 and 9 of
the questionnaire which are respectively concerned with opinions on „preference of a
port that offers value-adding service‟ and „the impact of value-adding services in
regards to attracting port users to a port.‟ A respondent‟s answer to the two questions
ought to be in synchronization, since both questions are basically the same but asked
in different ways.
At this juncture, consider table 5.8 row-wise for opinions to the statement „port users
prefer value-adding service port‟, having options: Strongly Agree, Agree, Makes no
Difference, Disagree, Strongly Disagree.
Essentially, the degree of consistency for each option should be a higher percentage
on the circled points (consider row and column interjections), as compared to the
corresponding total percentage on the „Total column’.
Beginning from the top part of table 5.8, observation across the row showed that of
the total 2.7% respondents who „strongly disagree’ that port users would prefer ports
that offer value-adding services, 1.8% retained a consistent opinion that the impact of
value-adding services on attracting port users would be ‘less attractive’ while
only 0.9% held the „more attractive‟ option.
In the same order, out of the total 7.2% respondents who ‘disagree’ with the view
that port users prefer ports offering value-adding services, a great proportion (5.4%)
(see as circled on table 5.8) of the respondents had a much more consistent view of
value-adding services being „less attractive‟.
For the ‘agree’ row, which showed that of the total 33.3% respondents who agreed to
the statement that „port users prefer ports that offer value-adding services‟, attention is
hereby drawn that 27.9% of them were of the consistent view that the services would
be ‘more attractive’ to port users in response to the question on the impact of value-
adding services.

114
Finally, of the total 37.8% respondents with the ‘strongly agree’ view that port users
prefer ports that offer value-adding services, a closer observation showed that 36.9%
of them gave a very consistent opinion, by reiterating that value-adding services
would ‘attract more’ port users while answering another question on the impact of
value-adding services. Opinions that cast some shadow were very negligible and are
nonetheless not surprising in a large scale survey response rate, as is the case in this
research. It is noteworthy that the different analyses of the cross-tabulation results on
table 5.8 revealed that a far greater percentage of respondents‟ data demonstrate
substantial consistency.
5.9 Summary
In this chapter, it has been shown that some of the analyses to be carried out in this
study include univariate, bivariate and multivariate analyses. Questionnaire and
interview methods of data collection were piloted and preliminary analyses carried
out in preparation for main data analysis in the following two chapters (6 and 7). The
data collection processes and collected data proved to be both valid and reliable to
reach research aims. One hundred and eleven (111) questionnaires were returned
useable, yielding response rates of 31% and 63% respectively from port-user
companies in developed and developing economies‟ ports. Given the level of response
rates and focus of the research on developing economy ports, in the chapters that
follow, data from ports of the developing economies will be analysed separately
whereas those of the developed economies will be analysed jointly. On the basis of
consistency of trends in data evidenced in the preliminary analyses, confidence was
established in the information for analyses and discussions of research data in the
following chapter 6.
All selected research analysis methods in this research are required in fulfilling the
research aims. The univariate analysis by generation of frequencies and percentages
enabled the exploration of data on the different issues of the research. Piloting of data
and response rate analyses respectively provided for establishing the quality of data
and evaluation of the level of useable returned questionnaire. Chi-square test and
cross-tabulation are bivariate analyses that supported the testing of propositions and
cross-examination of research issues. The factor analysis process is the multivariate
analysis needed to evaluate criteria for port selection by port users.

115
Chapter 6 - Analytical Presentation and Discussion of Research Data
6.1 Introduction
The primary objective of this chapter is to systematically present the analysis of
research data from a survey of port users by questionnaire. An overall view of data
exploration will be presented and discussion will be based on trends in data collected
from the case study ports.
In view of changes in present-day industries, the different port service areas shall be
analysed to understand services and trends of service development in ports. Also,
there shall be discussion on job designations, which will give insight into some of the
contemporary port users‟ job portfolio in the port industry. Another area which will be
covered in this chapter is investigation of qualifications in relation to port users‟ years
in port business.
The availability status of value-adding services in the case study ports shall be
presented as indicated by port users. Port users‟ opinions on the importance of the
various value-adding services will be discussed. This shall be followed by analysis of
the likelihood of using value-adding services.
These discussions shall largely be based on results of univariate analyses, for
example, covering the generation of frequencies and percentages. These analyses and
discussions in this chapter are set to provide overall exploration of value-adding
services. In addition, the chapter presents a fundamental foundation for more
inferential bivariate and multivariate analyses in chapter 7.

116
6.2 Port Service Areas
A profiling of port users is definitely important in order to comprehend the modern-
day port logistics profession. This therefore necessitated the quest for an examination
of the active players in the port industry. Who are port customers or users? Nettle
(1988) held the view that port users or customers are basically comprised of those
who bring goods into the port (deliverers) and those who take them away. While this
description adequately meets a general and traditional view, it is pertinent to observe
that the contemporary port has witnessed an increase in the types of port users
engaged in port businesses (Zondag et al, 2008).
Figure 6.1 depicts the major service areas of port-user companies in the port.
Figure 6.1: Areas of port services (Source: Author)
Freight
forwarding
Importing
of goods
Stevedoring
Others
Shipping services
(Lines)
Exporting of
goods

117
Results on the service areas based on the survey of one hundred and eleven (111)
port-user companies in the four case study ports (Apapa, Damietta, PD and
Rotterdam) are reported:
Figure 6.2: Areas of port services (Source: Author)
The figure 6.2 presents the analysis of business involvement of all port users
consulted, hence showing the port service areas investigated in the research project.
These service areas include stevedoring, imports, exports, freight forwarding,
shipping services and others. While stevedoring and freight forwarding, by
proportions, retained considerable service areas in port business, shipping line
business had the highest proportion of port users with 24.32% and by implication
represent the most important area of port services.
Alizadeh and Nomikos (2009) and Haralambides et al. (1997) in discussing the
contributions of shipping to the development of international trade, pointed out that
ports have experienced massive changes as a result of advances in ships and shipping

118
lines. Pettit and Beresford (2009) recognised that one of the fundamental influences
on the type of strategy adopted by a port is dependent on the requirements of the
shipping lines utilizing the port‟s facilities. In essence therefore, the throughput of
cargo handled in any port is largely dependent on the types of ships and frequencies
of calls to the port.
Of particular interest is the outcome that 21.62% of the services were categorised as
„others‟, which gave an indication of growth in services that are different from the
major services rendered in ports. This proportion of „other‟ services that are not core
port services can be said to point to an increasing opportunity for the offering of a
wide range of value-adding services in ports. Also, it signals the growing role of the
maritime sector, in particular the port industry in the modern global supply chain and
economy. According to information gathered from port users, some of the services in
the category of „others‟ include trucking, warehousing, commodity financing,
maritime/international trade consultancy, labour and specialist services.
In acknowledgement of these trends, Pettit and Beresford (2009) held that ports are
going through an evolutionary experience of being more responsive in offering
various tailoring services to customers. Again, it is the view of Carbon and Martino
(2003) that the changing roles of ports necessitated a move to offering varied services
and participation in supply chain management.
Figure 6.2 on the other hand depicts that data in this research were gathered from fair
representation of well established port users from different service areas. It thus
further validates the sampling methods used.
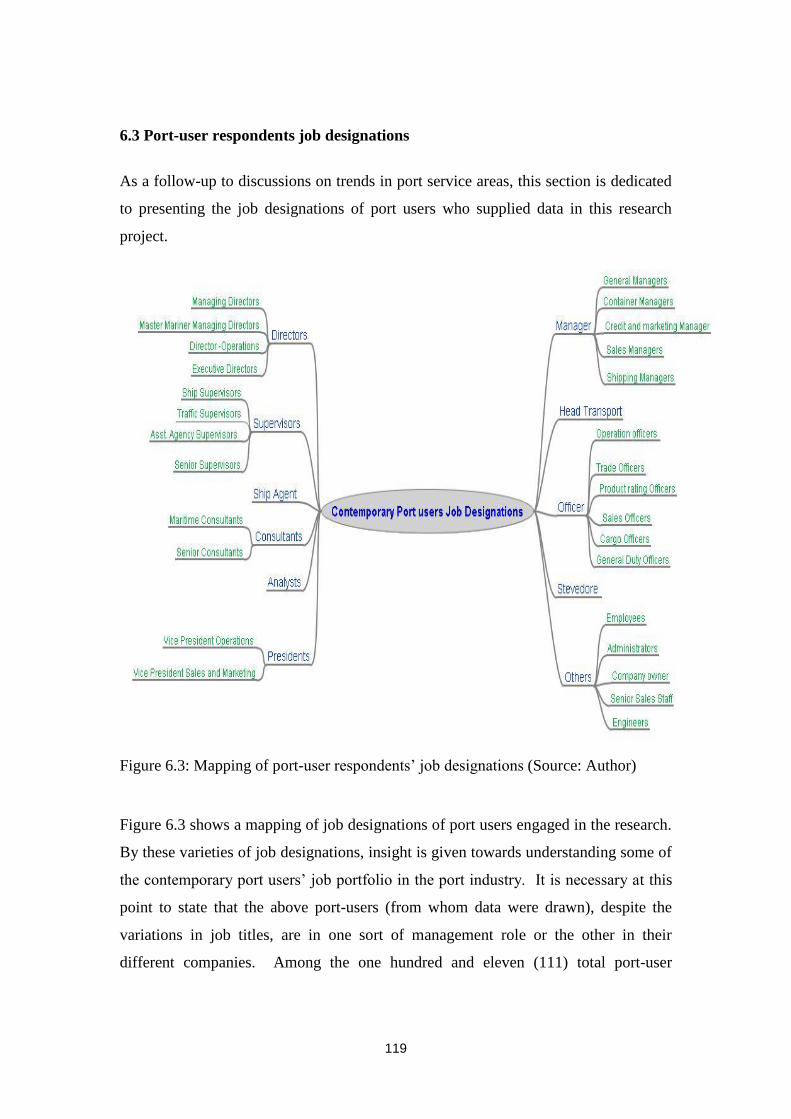
119
6.3 Port-user respondents job designations
As a follow-up to discussions on trends in port service areas, this section is dedicated
to presenting the job designations of port users who supplied data in this research
project.
Figure 6.3: Mapping of port-user respondents‟ job designations (Source: Author)
Figure 6.3 shows a mapping of job designations of port users engaged in the research.
By these varieties of job designations, insight is given towards understanding some of
the contemporary port users‟ job portfolio in the port industry. It is necessary at this
point to state that the above port-users (from whom data were drawn), despite the
variations in job titles, are in one sort of management role or the other in their
different companies. Among the one hundred and eleven (111) total port-user

120
respondents from the four case study ports were analysts, mangers, officers, directors,
ship agents and presidents. Others include administrators, engineers and consultants.
Understandably, the integrity of data and resultant study outcomes are largely
dependent on the sources of the data. With the need for data integrity in view,
painstaking efforts to reach the right personnel in the port-user companies yielded
dividend by effectively reaching and drawing data from the various designated
managers, as herein represented.
Job designations have direct relationship with responsibilities and roles in a given
firm and according to Carbon and Martino (2003), the position of ports as principal
nodes in the global transport network have resulted in the emergence of different roles
in response to the demands of supply chains. As opposed to a traditional setting where
port businesses predominantly revolved around shippers and importers of goods,
observation in the illustration of figure 6.3, showed that contemporary ports have
witnessed an increase in the varieties of port users, job designations and eventually
port business areas.
6.4: Investigation on Qualifications and Port Users years in Port Business
Table 6.1 shows some fundamental statistical information on interrelationship
between qualification and years in port business based on data collected from port
users of the four case study ports.
Table 6 1: Qualifications and Port Users years in Port Business
Yea
rs
of
exp
erie
nce
in
Po
rt b
usi
nes
s
Highest Qualification Categories
Lower than
High School
High
School
Bachelor
Degree
Post-
graduate
Degree
Others
N 3 18 55 32 3
Mean 21.00 12.53 11.62 16.39 27.33
Median 30.00 8.00 10.00 14.00 30.00
Std. Dev 16.462 8.110 8.790 11.692 6.429

121
The Chartered Institute of Logistics and Transport (United Kingdom) stressed the
dividends of gaining professional logistics specialised qualifications and the resultant
impact on enhancing the capability to reduce delays in operations, lower costs and
improve efficiency (CILT, 2009).
The overall average (mean) of years spent by port-user respondents in the port
industry was found to be 13.80. The frequency level of 55 (see table 6.1), showed that
most port user-respondents are qualified to bachelors degree level. Dinwoodie (2000)
while discussing issues on management careers and education in shipping and
logistics, reiterated that future employability, personal advancement and fulfilment of
organisational objectives are some of the motivating desires for undertaking studies at
university level for both bachelor‟s and postgraduate degrees. Hence, findings of this
study that most port users hold a first degree can be considered as being an
encouraging trend in logistics industry career. Reference should be made to appendix
7 for a summary of analysis and more details on years spent in port business as related
to port service areas and qualifications.

122
6.5 Availability of value-adding services in Ports
At the onset of the research survey, information on the availability status of value-
adding services was sought from port users and the results are hereby presented.
Figure 6.4: Indications of availability of value-adding services
This initial enquiry proceeded only after a precise definition of value-adding services
in the context of this research. Hence the main aim of the section is to report findings
on availability of value-adding services. Figure 6.4 and the subheadings below in this
section are used mainly to report the statistics on opinions of availability of value-
adding services, while in-depth discussion follows thereafter.
Value-adding services availability (Rotterdam & PD Tees ports’ perspective)
The availability of value-adding services in the ports was affirmed by 83.8% of all the
port user-respondents in the Rotterdam and PD Teesport ports. On the other hand,
16.2% of the respondents were of the view that the services do not exist in the ports.
0%
10%
20%
30%
40%
50%
60%
70%
80%
90%
100%
Developing
Economies (Egypt)
Developed
Economies
Developing
Economies (Nigeria)
NO
YES

123
Value-adding services availability (Egyptian Damietta Port perspective)
Of all the Egyptian Damietta port users that took part in the survey, 65.7% held that
there are value-adding services in Damietta port, while 34.3% were of the view that
the services were not available in the port.
Value-adding services availability (Nigerian port’s perspective)
While it was the view of 79.5% of the port user-respondents that value-adding
services are available in the Nigerian Apapa port, 20.5% of the respondents were of
the opinion that the services are not in existence in the port.
These give insight into the availability of value-adding services in the ports. The
availability of services for users, as required, is of immense importance for the
continuality of any firm. Providing products and services in a responsive manner to
end-users is a very important key performance indicator (KPI) for competitive
logistical edge in business (Fernie, and Sparks, 2004). In other words, a strategy of
ensuring products and services are readily available in the market strengthens the
prospects of a firm (Jeannet and Hennessey, 1998).
6.6 Key Value-adding Service Availability
While the earlier section 6.5 on „availability of value-adding services‟ gave attention
to discussing findings on the general availability status of value-adding services, this
section is particularly geared towards in-depth investigation on the availability status
of the 10 identified key value-adding services. This shall be done on case study port
basis.
Availability of value-adding services (Case study ports perspective)
The opinions of port users as concerned with availability status of VAS were
examined and hereby presented. Discussion shall take place given observable trends
in each case study port. Common parameters for the analysis and discussion of VAS
availability status include:
Available
Not available
Not sure

124
It is worthwhile to note that these are the response parameters, by which port users
gave their opinions on the investigative question-„are the following value-adding
services available in the port?‟ The value-adding services in question are transport
delivery service, warehousing, packaging, technical support, advertisement support,
assembly of cargo, consultancy, canteen/catering and water supplies.
6.6.1 The Rotterdam and PD Ports’ perspective
Presentation on figure 6.5 is a summary of the availability status of the value-adding
services based on the opinions of port users in the Rotterdam (The Netherlands) and
PD Teesport (United Kingdom) ports.
Figure 6.5: Availability of value-adding services (The Rotterdam & PD Ports‟ perspective)
An important observation is that while the „available‟ and „not available‟ indication
icons in figure 6.5 were present for all the value-adding services, the „not sure‟
indication icons only started from the packaging service column. Thus it implies that
all respondents were definitely sure of the availability status of warehousing and
transport services.
%

125
Except for canteen/catering and cold storage services, other services examined were
reported to be available by over 50.0% of the respondents. For instance some services
and proportions of port users indicating them to be available include: transport
(89.2%); warehousing (83.8%); packaging (64.9%); technical support (70.3%);
advertisement support (54.1%); assembly of cargo/product (75.7%); consultancy
(62.2%); and water supplies (78.4%).
The table 6.2 complements figure 6.5 in the illustration and presentation of port users‟
opinion on VAS status in the Rotterdam and PD ports.
Table 6.2: Availability of value-adding services (The Rotterdam & PD Ports)
Although the proportion of port users that considered some of the value-adding
services as „not available‟ is moderately low, there was rather a high ratio (56.8%)
who showed that canteen/catering services are not obtainable in the ports. This level
of opinion showed a near overwhelming view of the absence of canteen/catering
services in the ports.
% Transport
Delivery
Ware-
Housing
Pack-
aging
Technical
Support
Adverti-
sement
Support
Assembly
of Cargo/
Product
Consul-
tancy
Canteen/
Catering
Water
Supplies
Cold
Storage
Available 89.2 83.8 64.9 70.3 54.1 75.7 62.2 35.1 78.4 45.9
Not
Available 10.8 16.2 21.6 21.6 27.0 13.5 16.2 56.8 10.8 29.7
Not Sure 13.5 8.1 18.9 10.8 21.6 8.1 10.8 24.3

126
6.6.2 The Egyptian Port perspective
As a follow-up on this, it was observed as shown in figure 6.6 that five (5) out of the
ten (10) value-adding services were indicated to be „available‟ by over 60% of the
respondents. Transport service was declared to be „available‟ by 82.9% of the port
users, while the same declaration was made for warehousing by 85.7% of the
respondents.
Figure 6.6: Availability of value-adding services (Egyptian Port perspective)
Other tangible indications for service availability by port users were made for
packaging (80.0%), technical support (77.1%) and advertisement (68.1%).
Table 6.3: Availability of value-adding services (Egyptian Port perspective)
% Transport
Delivery
Ware-
housing
Pack-
aging
Technical
Support
Adverti-
sement
Support
Assembly
of Cargo/
Product
Consul-
tancy
Canteen/
Catering
Water
Supplies
Cold
Storage
Available 82.9 85.7 80.0 77.1 68.6 48.6 51.4 51.4 45.7 42.9
Not
Available 8.6 5.7 11.4 11.4 14.3 14.3 17.1 17.1 20.0 17.1
Not Sure 8.6 8.6 8.6 11.4 17.1 37.1 31.4 31.4 34.3 40.0
.0
10.0
20.0
30.0
40.0
50.0
60.0
70.0
80.0
90.0
Not Available
Not Sure
Available

127
The table 6.3 is intended to support information in figure 6.6 for more clarity in
presentation of data outcomes.
In a similar trend, though the plots for opinions of „not sure‟ of service availability
was moderately low, it peaked on cold storage; with 40% of the respondents not being
definitely sure of the service‟s availability in the port. It would be recalled that the
„not sure‟ option in the questionnaire, as elaborated in section 3.3.3 of the
methodology chapter 3, was primarily put included in order to avoid any „forceful‟
response circumstance where there exists scepticism.
6.6.3 The Nigerian Port’s perspective
Nigerian port users‟ opinions on availability status of value-adding services are
illustrated in the figure 6.7.
Figure 6.7: Availability status of value-adding services (Nigerian perspective)
As in the previous cases, the figure presents the icon plots of opinions on value-
adding services „availability‟ status, and table 6.4 stands to numerically enhance
comprehension of data.
.0
10.0
20.0
30.0
40.0
50.0
60.0
70.0
80.0
90.0
Not Available
Not Sure
Available

128
Table 6.4: Availability status of value-adding services (Nigerian perspective)
Water supplies and canteen/catering services received highest availability indications
by 82.1% and 74.4% of port users respectively. Other groups of services for which
port users indicated high levels of availability include transport (69.2%), warehousing
(69.2%) and cold storage services (53.8%).
Advertisement support is shown as the service for which there was the highest
indication of non-availability. The trend of outcomes for service availability was
observed to be lower in the Nigerian Apapa port in comparison to other ports
examined. However, value-adding services were considerably confirmed to be
available in the Nigerian port as is the case for other ports.
6.6.4 Synopsis for the availability status of key value-adding services
Substantially, it might be considered to be the case that the availability or non-
availability of value-adding services in a particular port is a reflection of the
importance attached to such services in a port‟s competitive strategies. The purpose of
this section is to provide an opportunity for a thorough investigation into the
availability status of each of the following value-adding services:
6.6.4 (a) Transport service - availability status
Findings revealed that transport service is the most available value-adding service.
For instance, 82.9% of respondents in Damietta Egyptian port and 69.2% of those in
Nigerian Apapa port indicated that transport service is available. Thus, it can be said
% Transport
Delivery
Ware-
housing
Pack-
aging
Technical
Support
Adverti-
sement
Support
Assembly
of Cargo/
Product
Consul-
tancy
Canteen/
Catering
Water
Supplies
Cold
Storage
Available 69.2 69.2 41.0 38.5 30.8 41.0 35.9 74.4 82.1 53.8
Not
Available 28.2 23.1 33.3 33.3 41.0 33.3 33.3 17.9 7.7 17.9
Not Sure 2.6 7.7 25.6 28.2 28.2 25.6 30.8 7.7 10.3 28.2

129
that the availability of transport service was indicated by many port users in the
Egyptian Damietta port than is the case in the Nigerian Apapa port. However, on a
general note, findings showed that for these ports situated in the developing
economies, transport service is one of the readily available types of value-adding
services.
As concerned with the ports located in the developed economies of The Netherlands
(Rotterdam) and United Kingdom (PD Teesport), 89.2% of the respondents affirmed
that transport delivery service is available in the ports. Another point of interest is that
no port user opted for the „not sure‟ of availability opinion for transport service. This
manner of availability attestation, consequently translates to transport service being
established and readily available in the ports in developed economies.
Transport service, as herein discussed is essentially concerned with the movement of
export/import goods to and fro the ports by direct port service provision or made
possible through 3PLs services.
6.6.4 (b) Warehousing service - availability status
In the Egyptian Damietta port, 85.75% of the port users signified that warehousing
service is available in the port. The significance of this proportion is outstanding,
thereby resulting in a very negligible percentage of respondents who opted for the
„not sure‟ or „not available‟ opinions. For the Nigerian Apapa port, 69.2% of
respondents held that warehousing service is available in the port. The ongoing
therefore, points to an important piece of information that warehousing services is one
of the predominantly affirmed services obtainable in the developing economies‟ ports.
Investigation on The Netherlands Rotterdam and United Kingdom PD Teesport ports
showed that 83.8% of respondents affirmed the availability of warehousing services in
the ports. Again, this symbolizes an outstanding standpoint to the availability of
warehousing services in the developed economies ports. In addition, it is also worthy
of note that as is the case for transport service, warehousing is another service for
which there was no „not sure‟ opinion from any of the port users in the developed
economies ports.

130
6.6.4 (c) Packaging service - availability status
Of all respondents from the Damietta port in Egypt, 80.0% upheld that packaging
service is obtainable in the port. On the other hand, data from the Nigerian port users
showed that 41.0% of respondents stated that packaging is available.
Whereas 21.6% of respondents were of the view that packaging service is „not
available‟ in the Rotterdam and PD Teesport ports, the most significant aspect of the
outcome is that 64.9% of the respondents indicated that the service does exist and is
available in the ports.
On the above premises, it is acknowledged that packaging service‟s availability is
stronger in the Egyptian Damietta port given a very high proportion of port users‟
affirmation. Although packaging service companies have been described as being of
less power in supply chain partnerships (Gattorna, 2003), many contemporary
logistical operations can hardly be effectively carried out if standardized packaging is
not available.
6.6.4 (d) Technical Support - availability status
In the Damietta port, 77.1% of respondents confirmed availability of technical support
and 38.5% of those in Nigerian Apapa port were of the same opinion. Although, the
service is established, its offering appears to be more pronounced in the Egyptian port
than in the Nigerian port.
Technical support service availability was confirmed by 70.0% of the respondents
from the Rotterdam and PD Teesport ports. On an average comparison, it could be
said that these outcomes point to an indication that the availability of technical
support service is well known in the ports of the developed economies and Damietta
port with a lesser availability in the Apapa port.

131
6.6.4 (e) Advertisement Support - availability status
Advertisement support is held to be available by 68.6% of the port-user respondents
from the Damietta Egyptian port. For their Nigerian counterparts, 30.8% also
considered the service as being „available‟. In the Nigerian case however, it was
found that a higher proportion of port users represented by 41.0% of its total
respondents were of the opinion that advertisement support is „not available‟, while
28.2% of the respondents opted for the „not sure‟ opinion. Based on the information
provided, it can be stated that advertisement support exists in the Egyptian port;
whereas such level of certainty does not exist in the Nigerian port.
In the Rotterdam and PD Teesport ports, it was observed that 54.1% of the
respondents were of the opinion that the service is „available‟. Although the
proportion of respondents who made this judgement on the availability of
advertisement support is not very high as is the case in some other services, it does
represent a substantial evidence to show service availability.
A meaningful insight on the availability of advertisement support service, both from
the literature (ABP, 2007; PD Teesport and Hartlepool, 2008), and as commented by
port users is that the service particularly takes the form of ports‟ involvement in
publicising port users‟ services in the port‟s brochures and publications, and hence
supporting in advertising port users‟ businesses.
6.6.4 (e)* Advertisement support proposal
This study hereby put forward a proposal for the possibility of ports developing
another form of advertisement support service which shall be made available as a
value-adding service for the mutual strategic benefits of ports and port users. The
possibility of this addition and re-shaping of advertisement support is the reason for
the service‟s different form in the model as presented in section 2.9.
Smuggling of goods into countries has increasingly become a global problem with
multi-faceted consequences. One of the negative consequences brought about by the

132
smuggling menace is a wide scepticism from end-user customers on whether
goods/products in the market are authentic and from ethical sources. Admittedly,
building trust as opposed to any doubtful signals to customers is fundamental to
meaningful sales of goods and services.
Advertisement support service proposal is birthed on the platform of building the trust
of customers in order to bridge the scepticism gap brought about by the smuggling of
goods into countries. As a possible solution, a port can develop an advertisement
support that regularly authenticates the goods of its port users as having undergone
due processes of importation clearance. It is strongly believed that such well
articulated practice can indeed provide meaningful support in publicising the
genuineness of port users‟ goods in regards to being „smuggle-free‟. This will
undoubtedly go a long way in building customers‟ trust and by so doing boost the
services and businesses of the port-user companies. „When consumers know that
something is authentic, they attach more esteem to that product or brand‟ (Zikmund
and Babin, 2007, pg 139).
This proposal is presented to promote sound and reasoned dialogue among
practitioners in the port industry to explore opportunities in developing services that
would uniquely advertise the goods and services of port users.
6.6.4(f) Assembly of Cargo/product - availability status
The availability status of assembly of cargo/product as examined showed that 48.6%
of the Egyptian port‟s respondents were of the opinion that the service is available in
the port. Findings from the Nigerian Apapa port showed that 41.0% of the
respondents were of the view that assembly of cargo/product service exist in the port.
As such the availability of the service in both ports is considered to be established.
While it is acknowledged that assembly of cargo/product service exists in the case
studies ports in developing economies, it is observed that affirmation of the service
availability in the ports is not comparatively very strong.

133
In The Netherlands‟ Rotterdam and United Kingdom‟s PD Teesport ports, it was
affirmed by 75.7% of the port users that the assembly of cargo/product service is
available in the ports. With this being the most remarkable opinion on the availability
of service status, the existence of assembly of cargo/product service in the developed
economies‟ case study port is therefore established.
6.6.4 (g) Consultancy - availability status
Correspondingly, it was the viewpoint of 51.4% and 35.9% of port-user respondents
respectively in Damietta port and Apapa port, that consultancy service is available in
the ports. Given these results, it is considered to be the case that consultancy service
exists in both ports in the developing economies.
Analysis of the availability status of consultancy service in the ports of the developed
economies of The Netherlands and United Kingdom showed that 62.2% of
respondents from the ports were of the view that the service exists in the ports.
6.6.4 (h) Canteen/Catering - availability status
While 51.4% of the respondents from the Egyptian Damietta port stated that
canteen/catering service is available in the port, an overwhelming 74.4% of those
from the Nigerian Apapa port have the same opinion. By implication therefore, the
availability of canteen/catering service in the developing economies is confirmed with
a pronounced presence in the Nigerian Apapa port.
Findings showed that among all the services examined, canteen/catering service is
declared as being unavailable by most port users in Rotterdam and PD Teesport ports.
This forms the view of 56.8% of the respondents.
While there was a higher opinion of the availability of canteen/catering service in the
ports situated in developing economies, for ports in the developed economies,
observation showed that there was a lesser confirmation of the availability of the
service.

134
6.6.4 (i) Water supplies - availability status
Of all the port-user respondents from Damietta port, 45.7% were of the opinion that
water supplies service is available. For the Nigerian port, water supplies service
received availability acknowledgement more than any other value-adding services in
this study. This view was founded on the position of 82.1% of the port users that
water supplies service is available in the Apapa port. Consequently, the existence of
water supplies as a value-adding service in both developing economies‟ ports was
confirmed, with the confirmation being outstanding in the Apapa Nigerian port.
For The Netherlands Rotterdam port and the United Kingdom PD Teesport port (see
figure 6.5 and table 6.2), it is shown that a significant proportion of port users
represented by 78.4% of the total respondents, declared that water supplies service is
available in the ports. As such, opinions of „not available‟ and „not sure‟ were
considered to be negligible. On this basis, it was established that water supplies
service is available in the ports.
Water supply as herein discussed is fundamentally concerned with the provision of
fresh water for the use of ships, crew and other port users.
6.6.4 (j) Cold storage - availability status
In the Damietta port, while 42.9% of respondents affirmed the availability of cold
storage service. For the Nigerian port, 53.8% of respondents signified that cold
storage service is available in the port. Inquiry into cold storage availability status in
The Netherlands Rotterdam and the United Kingdom PD Teesport ports revealed that
45.9% of the respondents declared that the service is available in the ports.
Thus, the service is concluded to be available in all the case study ports. For the
developing economies ports, examinations showed that the service is stronger in the
Nigerian Apapa port. Although the cold storage service exists in the developed
economies ports, opinions for the service availability are more remarkable for ports in
the developing economies.

135
6.6.5 Summary - value-adding services availability
Findings in this section showed that in both the developing and developed economies
ports, value-adding services are available. In the developing economies ports, the
services adjudged to be available by most users in Damietta port and Apapa port are
respectively warehousing and water supplies services. For the developed economies
ports (Rotterdam and PD Teesport ports), the service signified to be available by
majority of port users is transport service. In overall terms, results showed that the
most available service among the ten identified key value-adding services is transport
service, followed by warehousing, water supplies and technical support.

136
6.7 Importance of Value-adding Services
This section is concerned with examining the intrinsic importance of value-adding
services in ports, particularly as ranked by port users. Table 6.5 presents the summary
of all respondents‟ ranking of the ten (10) understudied value-adding services in
accordance with the perceived importance of each service. This gives an overall
indication of the importance of the services as ranked by all surveyed port users
before commencing analysis on case study basis. In order to maintain consistency in
the evaluation of service ranking, only the combinations of „high‟ and „very high‟
(„high importance‟) opinions are considered.
Table 6.5: Importance of Value-adding Services: Overall Statistics
Value-adding Services
Port Users’ Ranking
(Combination of
„High + Very High‟
Importance Rankings)
Frequency N Percentage (%)
Importance to Port Users: Transport Delivery
Services
96 111 86.5%
Importance to Port Users: Warehousing Services 82 111 73.8 %
Importance to Port Users: Water Supplies Services 76 111 68.4%
Importance to Port Users: Technical Support
Services
68 111 61.2%
Importance to Port Users: Packaging Services 62 111 55.8%
Importance to Port Users: Assembly of
Cargo/Product Services
57 111 51.3%
Importance to Port Users: Cold Store Services 54 111 48.6 %
Importance to Port Users: Consultancy Services 53 111 47.7%
Importance to Port Users: Advertisement Support
Services
53 111 47.7%
Importance to Port Users: Canteen/Catering
Services
50 111 45.0%
Total 111 111 100%
For transport delivery service, table 6.5 showed that 86.5% of all the port users rated
the service as one of „high importance‟ and it stands to have received the highest

137
ranking amongst all the listed value-adding services. This outcome suggests that of
all the ten (10) key value-adding adding services, transport service is the most
important service to port users.
In order of importance, other value-adding services that had high rankings and the
proportion of port users whose opinions support the assertion are; warehousing
(73.8%), water supplies (68.4%) and technical support (61.4%). It is actually a
remarkable observation that water supplies emerged in the third top position in the
ladder of importance among the key value-adding services.
On the other hand, with ranking by 45.0% of the port users, canteen/catering emerged
to be the least relevant service amongst all the ten (10) key value-adding services.
Other services that had lower importance rankings by port users include
advertisement support (47.7%), consultancy (47.7%) and cold storage services
(48.6%).
The acknowledgement that advertisement support service was ranked as one of the
least important services signifies that the service is not presently considered to be so
crucial in port users‟ businesses. This re-emphases the need to investigate the
potential of an aspect of advertisement proposal put forward in the study (see section
6.6.4 (e)*), which is primarily focused on contributing to solving a long known
challenge. This might enhance the importance of advertisement support service to port
users operations.

138
6.7.1 Importance of value-adding services based on case study ports
This section is dedicated to presenting and analysing port users‟ opinions on the
importance of value-adding services, which were discussed on the basis of observable
trends in the case study ports. As a general guide, analysis of importance shall be
based on the following:
„very high‟ (opinions)
„very low‟
„moderate‟
„low‟
„high‟
„very high‟ + „high‟ = „high-importance‟
„very low‟ + „low‟ = „low-importance‟ (opinions)
[Note: The above are keys necessary to understand the pattern of analyses and
discussions of opinions that follow. Attention is drawn to the fact that the
combination(s) of keys chosen in the analysis of a particular variable(s) will depend
on significant trends in the outcomes of the variable(s)].

139
6.7.2 Importance of Value-adding services - Rotterdam & PD Ports perspective
An examination of the opinions of port users from Rotterdam and PD Teesport ports
revealed that of the ten (10) value-adding services, there are some services that
substantially received ranking of „very high‟ importance. Figure 6.8 and table 6.6 both
serve to present outcomes from the analysed data.
Figure 6.8: Importance of Value-adding services (Rotterdam and PD Ports‟ perspective)
Transport service was ranked to be of „high-importance‟ by 89.2% of respondents,
whereas warehousing and water supplies services received the same level of ranking
respectively by 72.9% and 62.1% of respondents. Developments in this line of higher
ratings serve to reiterate the substantial importance of these three value-adding
services to port users in the developed economies ports.
Table 6. 6: Importance of Value-adding services (Rotterdam & PD Ports‟ perspective)
0%
10%
20%
30%
40%
50%
60%
70%
80%
90%
100%
Very High
High
Moderate
Low
Very Low
% Transport
Delivery
Ware-
housing
Pack-
aging
Technical
Support
Adverti-
sement
Support
Assembly
of Cargo/
Product
Consul-
tancy
Canteen/
Catering
Water
Supplies
Cold
Storage
Very Low 5.4 5.4 13.5 8.1 16.2 24.3 8.1 5.4
Low 2.7 2.7 13.5 24.3 32.4 18.9 29.7 43.2 10.8 16.2
Moderate 8.1 24.3 45.9 35.1 40.5 45.9 27.0 24.3 18.9 54.1
High 32.4 45.9 32.4 29.7 13.5 21.6 24.3 5.4 40.5 16.2
Very High 56.8 27.0 2.7 5.4 5.4 2.7 2.7 21.6 8.1

140
Results of „low-importance‟ (i.e. combination of „low‟ and „very low‟ opinions)
rankings by 67.5% of respondents showed canteen/catering service as the least
important service of all the ten (10) value-adding services. The other service that
follows as the next least relevant service is advertisement support with „low‟
importance opinion by 32.4% of the respondents.
6.7.3 Importance of value-adding services- Damietta Port perspective
In order to create synergies, figure 6.9 and table 6.7 are used to enhance
understanding of findings from Egyptian port users concerning the importance of
value-adding services.
Some services that received outstanding rankings of „high-importance‟ (i.e.
combination of „high and very high‟ opinions) and the proportions of port users who
gave their opinions to this effect include transport (91.4%), warehousing (91.4%),
technical support (91.4%) and assembly of cargo/products (91.4%).
0%
10%
20%
30%
40%
50%
60%
70%
80%
90%
100%
Very High
High
Moderate
Low
Very Low
Figure 6.9: Importance of Value-adding services (Egyptian Port perspective)
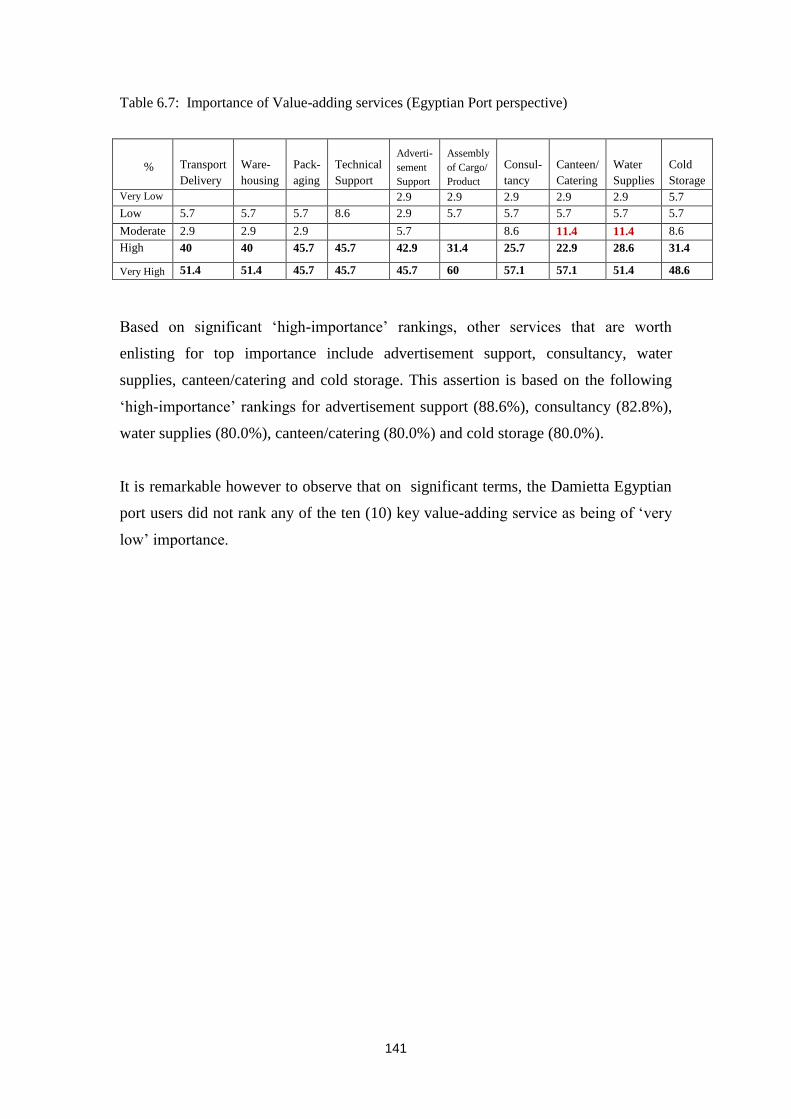
141
Table 6.7: Importance of Value-adding services (Egyptian Port perspective)
Based on significant „high-importance‟ rankings, other services that are worth
enlisting for top importance include advertisement support, consultancy, water
supplies, canteen/catering and cold storage. This assertion is based on the following
„high-importance‟ rankings for advertisement support (88.6%), consultancy (82.8%),
water supplies (80.0%), canteen/catering (80.0%) and cold storage (80.0%).
It is remarkable however to observe that on significant terms, the Damietta Egyptian
port users did not rank any of the ten (10) key value-adding service as being of „very
low‟ importance.
% Transport
Delivery
Ware-
housing
Pack-
aging
Technical
Support
Adverti-
sement
Support
Assembly
of Cargo/
Product
Consul-
tancy
Canteen/
Catering
Water
Supplies
Cold
Storage
Very Low 2.9 2.9 2.9 2.9 2.9 5.7
Low 5.7 5.7 5.7 8.6 2.9 5.7 5.7 5.7 5.7 5.7
Moderate 2.9 2.9 2.9 5.7 8.6 11.4 11.4 8.6
High 40 40 45.7 45.7 42.9 31.4 25.7 22.9 28.6 31.4
Very High 51.4 51.4 45.7 45.7 45.7 60 57.1 57.1 51.4 48.6

142
6.7.4 Importance of Value-adding services – Apapa Nigerian Port’s perspective
With regard to the Apapa Nigerian port, respondents significantly ranked transport
service, warehousing, technical support and water supplies as being „very high‟ in
importance, indicating that these particular services are relevant to the businesses of
the port users.
Figure 6.10: Importance of value-adding services (Nigerian Port‟s perspective)
In this manner, presentation of figure 6.10 and table 6.8 shows outcomes on services‟
importance ranking.
Table 6.8: Importance of value-adding services (Nigerian Port‟s perspective)
0%
10%
20%
30%
40%
50%
60%
70%
80%
90%
100%
Very High
High
Moderate
Low
Very Low
% Transport
Delivery
Ware-
housing
Pack-
aging
Technical
Support
Adverti-
sement
Support
Assembly
of Cargo/
Product
Consul-
tancy
Canteen/
Catering
Water
Supplies
Cold
Storage
Very Low 2.6 7.7 7.7 2.6 10.3 10.3 2.6 2.6 2.6 12.8
Low 0.0 10.3 23.1 10.3 28.2 28.2 25.6 17.9 7.7 17.9
Moderate 17.9 23.1 25.6 28.2 17.9 23.1 35.9 30.8 25.6 25.6
High 28.2 23.1 28.2 30.8 33.3 17.9 28.2 30.8 35.9 28.2
Very High 51.3 35.9 15.4 28.2 10.3 20.5 7.7 17.9 28.2 15.4

143
By the combination of „high‟ and „very high‟ importance opinions (i.e. „high-
importance‟), the proportions of respondents who made rankings of „high-importance‟
and the corresponding services include transport service (79.5%), warehousing
(59.0%), technical support (59.0%) and water supplies (64.1%). Interpretation of
these results points to the understanding that these services are in actual fact held in
high regards by the port users in the Nigerian Apapa port.
Substantially, no service was particularly ranked to be of very low importance.
However of the ten value-adding services understudied, advertisement support,
assembly of cargo/product and consultancy were found in the lower part of the ladder
of importance for port users in Apapa port.
6.7.5 Synopsis on importance of value-adding services
6.7.5 (a) Transport service – Importance
Of all the ten value-adding services investigated, transport service was ranked as the
most important by an overwhelming proportion of port users in the Egyptian Damietta
port, with 91.4% of the respondents giving a ranking of „high-importance‟. Amongst
thes Nigerian port users in Apapa port, it was also established by the rating of 79.5%
of respondents that transport service is the most important of all the considered value-
adding services. By implication therefore, transport service is a value-adding service
held in high esteem by port users in the developing economies.
In the developed economies ports of Rotterdam and PD Teesport, findings showed
that 89.2% of port-user respondents indicated that transport service is of „high-
importance‟ to their businesses.
The trends for importance-ratings of transport service by port users in all the case
study ports are remarkably significant. This is supported by the observations of
Martino and Morvillo (2008) that transport service is one of the traditional support
services offered in ports. Consequently, transport service is an exceptionally
important value-adding service for port users businesses.

144
6.7.5 (b) Warehousing service – Importance
Damietta port respondents in the proportion of 91.4% ranked warehousing value-
adding service to be of „high-importance‟. On the other hand, the service received a
59.0% grading of „high-importance‟ by port-user respondents in the Nigerian Apapa
port. While the service was considered important for port users in these developing
economies ports, this is particularly the case for those in Egypt. Warehousing service
was ranked to be of „high-importance‟ by 72.9% of the respondents from Rotterdam
and the PD Teesport ports.
6.7.5 (c) Packaging service – Importance
Packaging services also emerged as very important for port users in the Egyptian
Damietta port, given that 91.4% of the respondents confirmed that the service is of
„high-importance‟ to their businesses. Also, for the Nigerian Apapa port users, the
most significant outcome is that 43.6% of the respondents were of the opinion that
packaging service is of „high-importance‟.
Survey results from the Rotterdam and PD Teesport ports showed that while it is the
view of 35.1% of the port-users that packaging service is of „high-importance‟, a
greater proportion (45.9%) considered the service to be of „moderate‟ importance.
Putting all outcomes in perspective therefore, it can be observed that packaging
service is particularly important to the port users in the Egyptian port, much more
than is currently the case in any of the ports surveyed.
6.7.5 (d) Technical Support- importance
Technical support service was ranked to be of „high-importance‟ by 91.4% of the
respondents from the Damietta port, while 59.0% of those from Nigerian Apapa port
gave the same opinion. Thus, in the ports of developing economies, importance of the
service appears to be more pronounced among the Egyptian port users.

145
For ports in the developed economies, it was observed that 35.1% of the port-user
respondents were of the view that technical support is of „high-importance‟. It is
pertinent to note that another 35.1% of the port users were of the opinion that the
service is of „moderate‟ importance.
6.7.5 (e) Advertisement Support – importance
Advertisement support was substantially held as being of „high-importance‟
particularly by port users from the Damietta port represented by 88.6% of the
respondents. Results from the Nigerian Apapa port showed that 43.6% of the
respondents ranked the service to be of „high-importance‟. Only a mere 13.5% of
respondents from the developed economies ports gave the service a ranking of „high-
importance, indicating a greater tilt towards „moderate and low‟ importance.
Inferentially, more exploration of ways to enhance the beneficial impact of
advertisement support is crucial.
6.7.5 (f) Assembly of cargo/product – importance
While 91.4% of the respondents from Damietta port stated that assembly of
cargo/product is of „high-importance‟ only 38.4% of those in Apapa port ranked the
service as such. A closer observation provides a compelling pointer that assembly of
cargo is the most important in Damietta port, given that it received the highest ranking
of being „very high‟ in importance by 60% of port users. Similarly, 37.0% of
respondents from Rotterdam and PD Tees ports ranked assembly of cargo/products as
being of „high-importance‟, with a greater proportion opting for „moderate‟
importance level.
6.7.5 (g) Consultancy – importance
For Damietta port users, 82.8% of them (respondents) ranked consultancy at a „high-
importance‟ level. This showed that the service is held in high esteem by port users in
the port. 43.6% of port users in the Apapa port also classified consultancy service to
be of the same level of importance. With the case study ports in the developed
economies, it was the opinion of 45.9% of the respondents that consultancy is of „low-
importance‟ (i.e. combination of low and very low opinions), while the service is
considered as being of „high-importance‟ by 27.0% the respondents.

146
6.7.5 (h) Canteen/Catering - importance
Results showed that whereas 80.0% of respondents from the Egyptian Damietta port
ranked canteen/catering service to be of „high-importance‟, the service received the
same level of ranking by 48.7% from Apapa port‟s respondents. For ports in the
developed economies, the significant outcome is that 67.5% of the port users viewed
the canteen/catering service as being of „low-importance‟.
Summarily, these outcomes showed that while canteen/catering service is considered
important in the ports of the developing economies, its relevance for the port users in
the ports of the developed economies is much lower.
6.7.5 (i) Water supplies - importance
The importance of water supplies received overall high rankings by considerable
proportions of port users in all the understudied ports. Of the Damietta port-user
respondents, 80.0% gave the ranking of „high-importance‟ to water supplies and
64.1% of their Apapa counterparts held the same view. In a similar fashion, 62.1% of
respondents from the developed economies ports were also of the opinion that water
supplies service is of „high-importance‟.
Ships calling to various port locations are continually in need of constant supply of
fresh water, which can be arranged for through a branch of the shipping line in the
destination country, their agents or provided by the port of call. As a result, water
supplies service is one of the established support services rendered in ports. The
increase in the kinds of contemporary port users, undoubtedly mean more demand for
water supplies within and around ports. Thus, the importance of water supplies in
ports is pressing.

147
6.7.5 (j) Cold storage - importance
Cold storage was considered to be of „high-importance‟ by 80.0% of the respondents
in the Damietta Egyptian port, while 43.6% of Nigerian Apapa port respondents gave
a similar importance-ranking. There was tilt in opinions of port users in developed
economies, as the major outcome was that 54.1% of the respondents consider cold
storage as being of „moderate‟ importance. It is expected that increase in the varieties
of materials and products shipped around the world, as warranted by globalisation of
trade, would mean a corresponding rise in the volume of cargo shipping and port-
based operations that require cold storage for preservation.
6.7.6 Summary - value-adding services - importance
Admittedly, understanding the extent of importance customers attach to a given
service is resourceful information for the strategic positioning and re-positioning of
any customer-focused business. In the same vein, acquisition of knowledge on the
importance of different value-adding services to port users becomes crucial in the
formulation of a port‟s strategy. Findings showed that value-adding services in ports
are important for ports and port users businesses. Everyone of the ten identified key
value-adding service received some extent of importance ranking.
While closer observation showed that assembly of cargo/product is the most
important service for Egyptian Damietta port users, findings revealed water supplies
to be the most important for the Nigerian Apapa port users. Transport service emerged
as the most important for port users of Rotterdam and PD Teesport ports, whereas
canteen/catering service received ranking as the least important of the ten key value-
adding services in these developed economy ports. Overall for the four case study
ports, transport service emerged to be the most important, followed by warehousing,
water supplies and technical support.

148
6.8 Potential usage of value-adding services
In table 6.9, a summary of the opinions of all respondents from the four case study
ports is presented as concerning the likelihood of using some of the value-adding
services which are understudied in this research project.
Table 6.9: Value-adding services Likely Usage: Overall Statistics
Noteworthy trends for value-adding services listed in table 6.9 include observation
that 57.6% and 54.0% proportions of port users respectively showed interest in
potentially using transport and warehousing services at „high-usage‟ (combination of
„high and very high‟ opinions) levels. These indications are higher than as is the case
for other services. By implication therefore, these services are the most desired of all
the value-adding services investigated. With 50.4% of port users who showed interest,
technical support service emerged as the next in line of services with high-usage
potential.
Value-adding Services
Port Users‟ Ranking
(Combination of
„High + Very High‟
Usage Rates)
Frequency N Percentage (%)
Likely Usage Rate: Transport Delivery Services 64 111 57.6%
Likely Usage Rate: Warehousing Services 60 111 54.0%
Likely Usage Rate: Technical Support Services 56 111 50.4%
Likely Usage Rate: Water Supplies Services 41 111 36.9%
Likely Usage Rate: Assembly of Cargo/Product
Services
41 111 36.9%
Likely Usage Rate: Packaging Services 40 111 36.0%
Likely Usage Rate: Advertisement Support Services 40 111 36.0%
Likely Usage Rate: Canteen/Catering Services 34 111 30.6%
Likely Usage Rate: Cold Storage Services 29 111 26.1%
Likely Usage Rate: Consultancy Services 28 111 25.2%

149
On the other hand, cold storage and consultancy services generally received lower
usage indications, respectively having 26.1% and 25.2% of port users put forward
possible high-usage opinions. This means that port users‟ desires to use value-adding
services are weaker for cold storage and consultancy services.
6.8.1 Potential usage of value-adding services based on case study ports
Since value-adding services are not the core services of ports, an understanding of the
demand for such services therefore become even more important in order to enable
informed consideration in port‟s strategy formulation. The potential usage of the
value-adding services examined in this study is presented on port by port basis.
6.8.2 The Rotterdam and PD Ports’ perspective
For potential usage of the ten (10) identified key value-adding services, figure 6.11
and table 6.10 are used complementarily to present the opinions of port-user
respondents from Rotterdam and PD ports.
0%
10%
20%
30%
40%
50%
60%
70%
80%
90%
100%
Very High
High
Moderate
Low
Very Low
Figure 6.11: Potential usage of value-adding services (Rotterdam & PD ports)
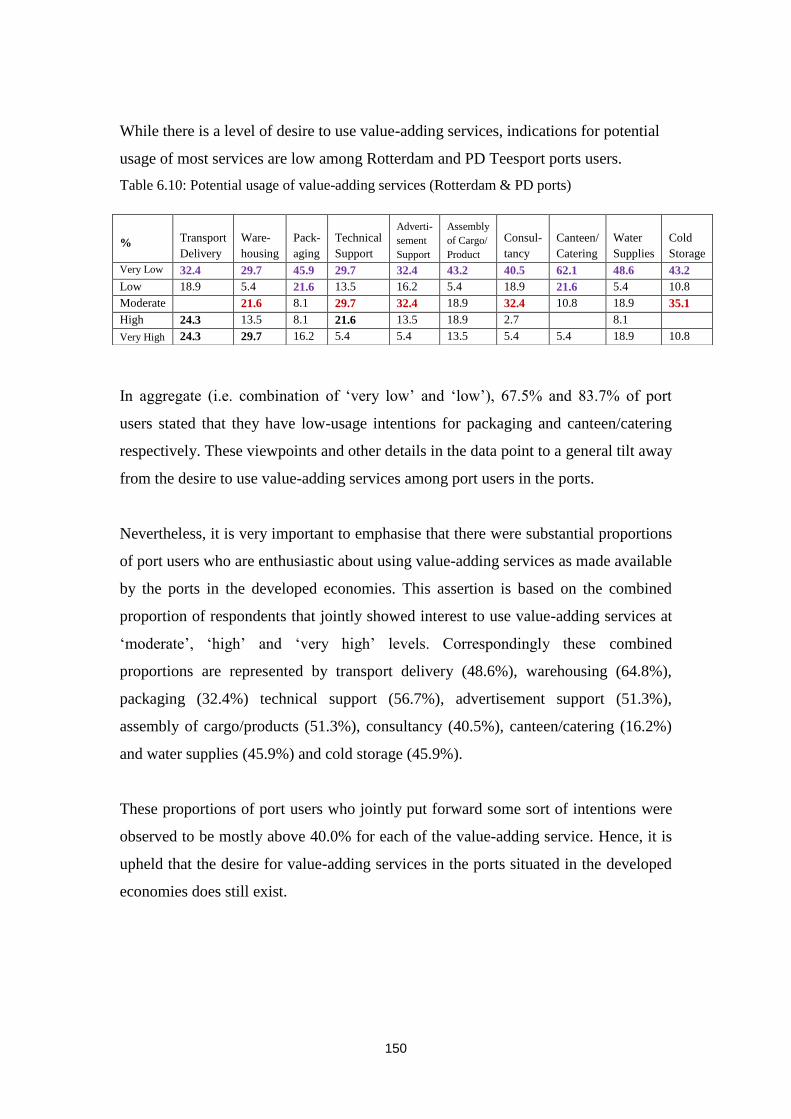
150
While there is a level of desire to use value-adding services, indications for potential
usage of most services are low among Rotterdam and PD Teesport ports users.
Table 6.10: Potential usage of value-adding services (Rotterdam & PD ports)
In aggregate (i.e. combination of „very low‟ and „low‟), 67.5% and 83.7% of port
users stated that they have low-usage intentions for packaging and canteen/catering
respectively. These viewpoints and other details in the data point to a general tilt away
from the desire to use value-adding services among port users in the ports.
Nevertheless, it is very important to emphasise that there were substantial proportions
of port users who are enthusiastic about using value-adding services as made available
by the ports in the developed economies. This assertion is based on the combined
proportion of respondents that jointly showed interest to use value-adding services at
„moderate‟, „high‟ and „very high‟ levels. Correspondingly these combined
proportions are represented by transport delivery (48.6%), warehousing (64.8%),
packaging (32.4%) technical support (56.7%), advertisement support (51.3%),
assembly of cargo/products (51.3%), consultancy (40.5%), canteen/catering (16.2%)
and water supplies (45.9%) and cold storage (45.9%).
These proportions of port users who jointly put forward some sort of intentions were
observed to be mostly above 40.0% for each of the value-adding service. Hence, it is
upheld that the desire for value-adding services in the ports situated in the developed
economies does still exist.
% Transport
Delivery
Ware-
housing
Pack-
aging
Technical
Support
Adverti-
sement
Support
Assembly
of Cargo/
Product
Consul-
tancy
Canteen/
Catering
Water
Supplies
Cold
Storage
Very Low 32.4 29.7 45.9 29.7 32.4 43.2 40.5 62.1 48.6 43.2
Low 18.9 5.4 21.6 13.5 16.2 5.4 18.9 21.6 5.4 10.8
Moderate 21.6 8.1 29.7 32.4 18.9 32.4 10.8 18.9 35.1
High 24.3 13.5 8.1 21.6 13.5 18.9 2.7 8.1
Very High 24.3 29.7 16.2 5.4 5.4 13.5 5.4 5.4 18.9 10.8

151
6.8.3 The Egyptian Port perspective
As observed in figure 6.12 below, transport delivery, warehousing, packaging and
technical support services are not ranked for „very high‟ possible usage rate.
However, these services generally received most of the „high‟ potential usage
rankings when compared to other value-adding services examined based on the
opinions of Damietta port users.
Egyptian port users in the proportions of 51.4%, 54.3%, 51.4% and 57.1%, showed
usage interest respectively for transport delivery, warehousing, packaging and
technical support services.
The table 6.11 serves to complement figure 6.12 in presenting the opinions of port
users on the potential usage of the different value-adding services.
0%
10%
20%
30%
40%
50%
60%
70%
80%
90%
100%
Very High
High
Moderate
Low
Very Low
Figure 6.12: Potential usage of value-adding services (Damietta Egyptian Port perspective)
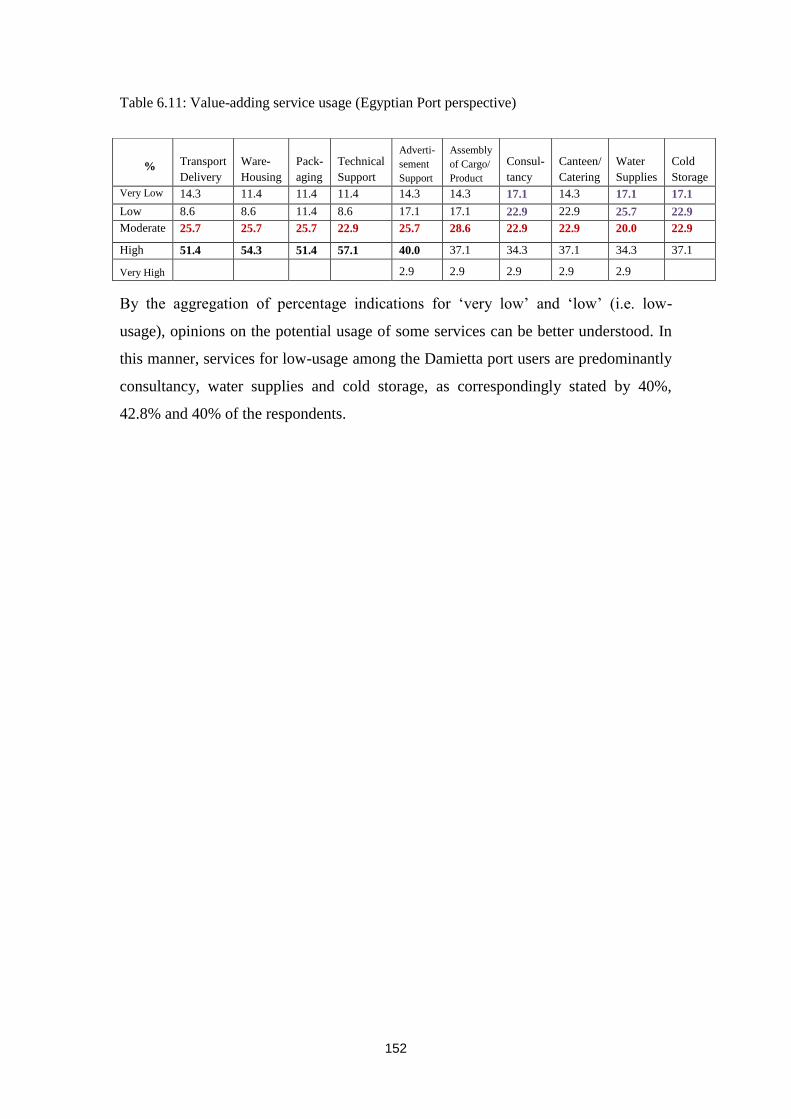
152
Table 6.11: Value-adding service usage (Egyptian Port perspective)
By the aggregation of percentage indications for „very low‟ and „low‟ (i.e. low-
usage), opinions on the potential usage of some services can be better understood. In
this manner, services for low-usage among the Damietta port users are predominantly
consultancy, water supplies and cold storage, as correspondingly stated by 40%,
42.8% and 40% of the respondents.
% Transport
Delivery
Ware-
Housing
Pack-
aging
Technical
Support
Adverti-
sement
Support
Assembly
of Cargo/
Product
Consul-
tancy
Canteen/
Catering
Water
Supplies
Cold
Storage
Very Low 14.3 11.4 11.4 11.4 14.3 14.3 17.1 14.3 17.1 17.1
Low 8.6 8.6 11.4 8.6 17.1 17.1 22.9 22.9 25.7 22.9
Moderate 25.7 25.7 25.7 22.9 25.7 28.6 22.9 22.9 20.0 22.9
High 51.4 54.3 51.4 57.1 40.0 37.1 34.3 37.1 34.3 37.1
Very High 2.9 2.9 2.9 2.9 2.9

153
6.8.4 The Nigerian port’s perspective
As in previous examinations, the table 6.12 below is intended to support information
on figure 6.13 for better understanding of the services. Affirmation for the possible
use of value-adding services by port users in the Nigerian case study port (Apapa)
showed higher usage intentions for most of the services.
Figure 6.13: Potential usage of value-adding services (Nigerian port‟s perspective)
The proportions of port users who opted to use the services at „high‟ levels are as
follows; for warehousing (35.8%), packaging (26.6%), technical support (38.4%),
advertisement support (35.8%) and canteen/catering (25.6%). Since these outcomes
are only for opinions on „high‟ usage intensions, they showed more enthusiasm for
value-adding services.
On a „high-usage‟ aggregate (i.e. combinations of „very high‟ and „high‟ opinions)
level, it is shown that transport service is the most sought after service with a total of
71.7% port-user respondents putting forward intentions for the service at „high-usage‟
0%
10%
20%
30%
40%
50%
60%
70%
80%
90%
100%
Very High
High
Moderate
Low
Very Low

154
level. A further remarkable revelation is that 46.1% of the Nigerian port users
indicated interest to potentially use transport delivery service at a „very high‟ level.
Table 6.12: Value-adding service usage (Nigerian port‟s perspective)
Further „high-usage‟ aggregation (i.e. „very high‟ and „high‟), resulted in
distinguished outcomes of having 64.0% respondents indicate usage intentions for
warehousing, 66.6% for technical support and 46.1% for canteen/catering service.
It is however necessary to observe that given the usage indication trends at „moderate‟
and „very high‟ levels, that water supplies service can be said to have a considerable
level of usage indications. When the aggregate of „very low‟ and „low‟ (low-usage)
was considered, it was found that packaging and consultancy were respectively
ranked for „low-usage‟ by 43.6% of the port users.
% Transport
Delivery
Ware-
housing
Pack-
aging
Technical
Support
Adverti-
sement
Support
Assembly
of Cargo/
Product
Consul-
tancy
Canteen/
Catering
Water
Supplies
Cold
Storage
Very Low 5.1 12.8 23.1 5.1 17.9 20.5 23.1 10.2 12.8 12.8
Low 7.6 7.6 20.5 10.2 25.6 12.8 20.5 15.3 10.2 25.6
Moderate 15.3 15.3 23.1 17.9 10.2 28.2 25.6 28.2 30.7 15.3
High 25.6 35.8 25.6 38.4 35.8 17.9 12.8 25.6 17.9 15.3
Very High 46.1 28.2 7.6 28.2 10.2 20.5 17.9 20.5 28.2

155
6.8.5 Synopsis on the Potential usage of value-adding services
6.8.5 (a) Transport delivery service - potential usage
The importance of transport services for businesses and overall economic growth of
any country is very significant. For instance, information from the British Chamber of
Commerce stated that poor transport costs UK businesses £15bn a year (Commercial
Motor, 2004). Consequently, the efficient and effective offer of transport delivery
services can contribute to the growth of ports businesses and the economy as a whole.
Investigation from this study revealed that transport delivery service is the most
desired type of service, among all the value-adding services examined. While a total
of 48.6% port-user respondents in the Rotterdam and PD Teesport ports affirmed
interest in the possibility of using transport delivery service at a „high-usage‟ level,
51.4% and 71.7% of those in the Damietta Egyptian port and the Nigerian Apapa port
respectively put forward the same level of usage interest for the service.
On the basis of these responses, it thus becomes evident that the desirability for
transport delivery as a value-adding service is stronger in the ports of the developing
economies of Egypt and Nigeria. This statement is particularly applicable to the
Nigerian port (Apapa) wherein 46.1% of respondents were of the opinion that they
will likely use transport service at a „very high‟ level (see table 6.12).
The desirability for port-provided transport services, as noticed in the reported
outcomes in the paragraphs above, is higher for port users in the ports in the
developing economies than for their counterparts in ports situated in the developed
economies. Nonetheless, the case study ports of The Netherlands (Rotterdam) and
United Kingdom (PD Teesport) are respectively known for having a significant level
of effective transport network and services, above those of developing economy ports.
Rodrigue and Notteboom (2006) acknowledged that the development of better
hinterland connections has redefined the functional roles of ports in the value chain,
while generating a new pattern of freight distribution. Therefore, it would be right to

156
infer that this changing trends in port hinterland connections and roles have
encouraged active participation of 3PLs (third party logistics) companies and in-house
logistics operations, given the provision of better transport networks. As a result, if
the port authorities/bodies are to provide transport services, port users in the
developed economies are less desirous to use such services given an established in-
house or 3PL provision of the services. This does not however imply the closure of
opportunity for port authorities/bodies in developed economies to deploy transport
services in port strategies, given dynamism in the port business environment.
On the basis of higher investments in logistical networks in developed economies,
ports are encouraged to, where necessary, consider taking advantage of the
opportunity to offer transport delivery and distribution services. The Port of Tyne
Distribution Ltd is owned by the Port of Tyne in Newcastle upon Tyne (UK), and
operates a full-functional and dedicated transport fleet and dispatches goods of
customers (Port of Tyne, 2006). Another good example is the offer of
transport/distribution services by the PD Logistics, based at the PD Teesport (PD
Ports, 2008). An alternative method available to ports is to provide an enabling
environment for 3PLs to render such services.
As competition between ports become tougher, transport delivery/distribution services
can give a possible sharp edge for a port to go for the „grab of cargoes‟ even in the
hinterland of other ports. The view of Haezendonk and Notteboom (2002) supported
this account, by outlining that the competitiveness of a port is increasingly becoming
dependent on the external co-ordination and control. Thus, partnerships or contracts
with clients (port users) to offer a dedicated transport delivery and distribution
services, to and from ports can provide such needed external link and also facilitate
the retention of port users.
6.8.5 (b) Warehousing - potential usage
As globalisation entrenches, with ports increasingly being major nodes in the global
supply chain for the flow of goods and services, the significance of general and
specialised warehouses in ports would be expected to increase correspondingly. This
view becomes more important even as more companies of global scale businesses

157
seek to determine suitable decoupling points to apply the „leagile‟ logistics concept.
Admittedly, ports can potentially offer suitable opportunities as leagile decoupling
points in the global supply chain for preparation of export goods through the seas or
putting finishing touches on goods bound inland towards the downstream.
Examination of the outcomes on warehousing services revealed that while there was a
„high-usage‟ level affirmation by 43.2% of port-user respondents in the developed
economies ports, 54.3% and 64.0% of those in the Egyptian and Nigerian ports
respectively put forward the same possible usage statements. Offering of
warehousing services was described by Martino and Morvillo (2008) as one of the
long standing support services offered within the port system and has facilitated the
creation of economies of scale and scope. This draws attention to the capacity of
warehousing services in ports to attract different types of cargoes into the port for
customisation in order to enhance a port‟s business portfolio.
Among all the case study ports, intention for the likely usage of warehousing services
is greatest in the Nigerian Apapa port. It was also observed that demand for the
service was much more indicated by port users in the developing economies‟ ports in
Egypt and Nigeria.
6.8.5 (c) Packaging- potential usage
Investigation on packaging service showed that it is one of the services for which
many port users in the Egyptian Damietta port declared their interest. While 51.4% of
port-user respondents in Damietta port indicated usage interest for packaging service
at „high-usage‟ level, 33.2% of those in the Nigerian Apapa port held the same view.
For the ports situated in The Netherlands (Rotterdam) and United Kingdom (PD
Teesport), confirmation of likely usage of packaging service was rather on the low
side, with 67.5% of port users putting forward intentions for „low-usage‟ level. There
were nonetheless 16.2% of port users that would want to use the service at a „very
high‟ level. Insight from port users‟ comments showed that despite the generally low
intention to use packaging service, if provided by the ports, there exist some group of

158
port users who are eager to extensively use packaging services in the ports situated in
developed economies.
Packaging operations and services would be expected to be in high demand in areas
where exports and imports are flourishing, necessitated by activities such as complete
or semi-manufacturing assembly or re-assembly of goods. This heightened desire for
packaging and re-packaging of goods in developing economies can be viewed to be
connected with the quest of merchants in developing economies to reach a
standardized packaging level, given the enforcement of stringent regulations in
destinations ports of developed economies. This statement is buttressed by CCICED
(2000), which reported a rigorous search for ways to improve the packaging of woods
for export from China to the USA, Japan, European states and Canada, so as to
resuscitate foreign trade that declined as a result of packaging legislations in these
countries.
Figure 6.14: UK port Traffic by type 1998-2008 (Source: Department for Transport, 2009)
On the other hand, figure 6.14 illustrates a declining trend in the volume of cargo
traffic throughput in UK ports, particularly concerning exports and domestic trades.
Thus, it would be expected that there would be a level of decline in the need for
packaging services that is normally encouraged by international exports and domestic

159
goods movements via ports. This finding about packaging and traffic throughput
relationship can be generalised for ports in similar situations.
6.8.5 (d) Technical Support- potential usage
57.1% of the respondents in Egyptian Damietta port would want technical support
service at „high‟ level, while for 66.6% of Nigerian Apapa port users the likely usage
rate is at „high-usage‟ level. These outcomes revealed a high desire for technical
support service by port users in the ports situated in the developing economies.
Ideally, technical support can be meaningful when provided by experts, who through
scholarship and years of maritime/ports industrial experience have accumulated
knowledge and expertise and thus can adequately offer technical support to others in
the industry.
Although the degree of desire to use technical service is higher from port users in the
developing economies‟ ports, there is in general terms, a fairly moderate desire for the
service in the developed economies ports. Perhaps, given the level of accessibility to
training and technological advancement in developed economies, more of the port-
user companies were of the view that subscribing to a port‟s technical support should
not be given high priority. However, results in this study make the importance of
expertise and technical support more pronounced. An instance to support this
statement was found in APC (2001), which stated that the Port of Amsterdam has an
established arm known as Amsterdam Port Consultants, which has continued to offer
knowledge-based and technical expertise services in the area of distribution and
logistics to various port users and even to port management around the world.
6.8.5 (e) Advertisement support- potential usage
Port users‟ indication for the use of advertisement service at „high‟ degree is strongest
among Egyptian port users. While 40.0% of port-users respondents were of the
opinion to use advertisement support at a „high‟ rate in Damietta port, 35.8% and
13.5% of those in Apapa Nigerian and Rotterdam and PD Teesport ports respectively
had the same interest. In this sense, advertisement support covers various activities

160
that can be explored by the ports in order to publicise the different businesses and
services of the port users.
6.8.5 (f) Assembly of cargo/product- potential usage
A total of 40.0% of the Damietta port-user respondents showed interest to use
assembly of cargo/product service at „high-usage‟ level, whereas 38.4% and 32.4% of
those in Nigerian Apapa and Rotterdam/PD Teesport ports put forward a likelihood of
using the service at the same usage level.
On the other hand, analysis showed that 31.4% and 33.3% of port users in Egyptian
Damietta and Nigerian Apapa ports did put forward opinion of potential use of
„assembly of cargo/product service‟ at a „low-usage‟ level. In regards to the ports in
The Netherlands (Rotterdam) and United Kingdom (PD) Teesport, intentions for the
use of „assembly of cargo/product‟ at „low-usage‟ level is rather higher, which stands
at a 48.6% of the total port-user respondents from both ports.
6.8.5 (g) Consultancy- potential usage
By a proportion of 37.2%, Damietta port users indicated a likely „high-usage‟ level of
consultancy services. They are thus shown to be particularly interested for
consultancy services when compared to their counterparts in Apapa, Rotterdam and
PD Teesport ports. A close examination of the outcomes revealed that while
desirability for consultancy services is not generally high, port users in the developed
economies ports particularly showed low interest.
Dr Johan Siebers, a Shell HR consultant made a statement to the effect that
consultancy training is able to provide explicit knowledge and ability to function
better in day-to- day business (Dawson, 2003). Since consultancy service has a lot to
do with speciality information and knowledge, a point of observation in an attempt to
better understand these outcomes, is that the level of information available to port
users in the developed economies might possibly be a reason for the plummeting
desire to use consultancy service.

161
6.8.5 (h) Canteen/catering- potential usage
If canteen/catering services were to be provided in the port, possible intentions to use
the service at „high-usage‟ level was put forward by 40.0% of respondents in
Damietta port (Egypt), while 46.1% of their counterparts in Apapa port (Nigeria) held
the same view. A balanced viewpoint would be that there is the desire to use the
service at „moderate‟ levels, and it is safe to infer that canteen/catering service is
saleable among port users in the ports situated in developing economies.
On the basis that a proportion (83.7%) of the port users were of the opinion that they
would merely use canteen and catering service at a „low-usage‟ level, the service thus
stands to be the least desired amongst all the value-adding services for port users in
the developed economies.
6.8.5 (i) Water supplies- potential usage
Results from the Egyptian Damietta port showed that 37.2% of port users were of the
interest to possibly use water supplies at a „high-usage‟ level. For this level of usage,
46.1% of respondents held the same view in the Nigerian Apapa port. Taking into
account the general trends in both ports, it can be said that the service is desired at
considerable levels in the ports.
Likely usage of water supplies service by port users in The Netherlands and United
Kingdom ports at a „high usage‟ level was the opinion of 17.0% respondents. This can
be seen as a pointer to a low level of intention to use water supplies service, resulting
in 54.0% port users opting for „low-usage‟.
6.8.5 (j) Cold storage- potential usage
While there were a 37.1% proportion of port users in the Damietta Egyptian port who
opted to use cold storage service at a „high‟ level, only 15.3% of those in Nigerian
Apapa port had the same usage opinion. In both ports, there were no indications to use
the service at „very high‟ levels. Although a high proportion of port users opted to use
the service at „low-usage‟ level, 10.8% of respondents in Rotterdam and PD Teesport
ports were interested in possibly using cold storage at a „very high‟ levels.

162
6.8.6 Strategic dynamics of value-adding services
To reiterate, the prime aim of this study is to thoroughly investigate the potential of
value-adding services in strategy formulation for a port‟s competitiveness. On this
basis, figure 6.15 supports further discussion in this section about some topical
findings relating to the strategic dynamics of value-adding services in competitive
strategy.
Port traditional services, in part „1‟ of figure 6.15 are generically represented in the
horizontal stripes by A, B, C. These represent the fundamental services for which
ports exist. Reference to the port value-adding service model in section 2.9 can assist
in recalling that some of these traditional services include safety, vessel piloting,
mooring, loading, unloading, in-port transit and environmental responsibilities.
Figure 6.15: Strategic dynamics of value-adding services Strategy (Source: Author)
C
B
A
2
Differentiation acceleration
zones
X YX
Z
Tra
dit
ion
al S
erv
ices
Value-adding Services
1
Tra
dit
ion
al S
erv
ices
X Y
X
Source of port‟s strategic thrust Z
C
B
A
Value-adding Services

163
Given the need to boost port competitiveness, value-adding services are introduced, as
represented by X, Y, Z vertical icons. These value-adding services provide spearheads
which are „sources of port‟s strategic thrust‟, offering support and enabling the port to
keep its traditional services afloat. Strategic thrust, as herein referred is used in the
sense to connote the idea of value-adding services having a substantial degree of
potential to propel and sustain a port‟s businesses competitively. This innovative view
of the strategic thrust of value-adding services is largely based on the findings
concerning the importance and potential usage of value-adding services and also
supported by results of tested set propositions (section 7.4).
In part „2‟ of figure 6.15 attention is called to trends that tend to develop along the
line as value-adding services provide the needed support and boost to a port‟s core or
traditional services. Bearing in mind that value-adding services are unique and special
offers to complement the core services, a stage is reached where it emerges to be the
case that the uniqueness of the services begins to wear off. This stage is represented
by the double arcs on the X, Y, Z stripes, which mark the commencement of
curvatures that pull the vertical strategic thrust-boosting stripes to the horizontal (see
figure 6.15 above). When these value-adding services‟ representative vertical stripes
are levelled to horizontal, there sets in a tendency for port users to merely equate or
consider the services as being standard or traditional services.
In this study, the idea of carrying out investigation by a multiple case study research
structure was to enable the infusion of various value-adding services perspectives and
to stimulate learning, particularly for ports and port users in developing economies
based on experiences of ports in the developed economies. It is thus relevant to
recollect that the survey on possible usage of value-adding services, if the services
were to be introduced and offered by the ports, resulted in a substantial proportion of
port users in the developed economies opting to use many of the services at „low-
usage‟ levels. One of the main reasons for this outcome is believed to be connected
with port users having had access to value-adding services for some time, thus the
dynamics sets in triggering an increase in the tendency for the services to be
considered and used just as standard or traditional port services.

164
The differentiation acceleration zone in figure 6.15 (part 2), presents renaissance
opportunities for value-adding services prior to the stage of full levelling up as
standard port services. In other words, as the deflection to the horizontal sets in, ports
deploying value-adding services in business strategies should put in place and
accelerate mechanisms to restore the uniqueness of the services. This would mean a
continual search for various innovative services that make a port standout as relevant
to port users. Therefore, the ability to determine when the „differentiation acceleration
zone‟ sets in becomes sine quo non in order for a port to remain active in the use of
value-adding services as competitive strategy. Acceleration of differentiation in this
zone shall consequently resuscitate the „strategic thrust‟ of value-adding services as
shown in part „1‟ of the figure (6.15). In logistical terms, differentiation is concerned
with inclusion or deployment of activities or products of recognisable uniqueness to
clients, which have the capacity to give a firm an outstanding competitive edge in the
market (Porter, 1985; Brassington and Pettitt, 2007; Christopher, 2005; Hooley et al,
2008).
6.8.7 Summary - Potential usage of value-adding services
Although there was a substantial opinion to use value-adding services (if provided by
ports) at „low-usage‟ levels by port users in ports of developed economies, it was
however the case that over 40.0% of the port users would want to use most of the
services at a somewhat considerable levels (i.e aggregate „moderate‟, „high‟ and „very
high‟). Rather than a paradox, this scenario of lesser enthusiasm for value-adding
services is deemed to have materialised on the basis that such services are currently in
existence at a satisfactory level, particularly by in-house operations or third party
logistics companies. Hence, any further provision of the services might not be so
desired. Transport and warehousing services were the most desired among port users
in ports of the developed economies.
Port users in the developing economies ports predominantly indicated strong interest
to use most of the value-adding services, if provided by the ports. While technical
support and transport services were the most desired by the Egyptian port users,
transport, technical support and warehousing were correspondingly the most desired
services by the Nigerian port users.

165
6.9 Summary - Analytical Presentation and Discussion of Research Data
While the summaries of the different sections have been presented, the summary of
the entire chapter (6) is hereby provided. In Damietta and Apapa ports, the most
available value-adding services are warehousing and water supplies services
respectively. For Rotterdam and PD Teesport ports, transport service is the most
available value-adding services. In overall terms for all the case study ports, the most
available service among the ten identified key value-adding services is transport
service, followed by warehousing, water supplies and technical support.
Findings showed that value-adding services in ports are important for ports and port
users businesses. For the Rotterdam and PD Teesport port users the most important
service is transport. Assembly of cargo/product is the most important service for port
users in Damietta, whereas for those in Apapa port it is water supplies. Concerning
potential usage, transport and warehousing services are the most desired by Rotterdam
and PD Teesport port users, while technical support and transport service are the most
desired respectively by Damietta and Apapa port users.
Variations in the rating of services‟ importance and likely usage can be explained in
the understanding that although a port user may consider a particular service to be
very important, higher priority of potential usage can be given to another service.
Some of the issues that can warrant such usage priority include in-house capabilities,
market and business environment challenges. The dynamism found in the desirability
of value-adding services, as discussed in section (6.8.6), emphasised the need to
understand when to rejuvenate the strategic thrust of value-adding services in port
strategy.

166
Chapter 7 - Further Analyses and Discussion of Research Issues
7.1 Introduction
This chapter provides an opportunity to carry out in-depth inferential analyses and to
delve into further discussions of research issues raised in the course of this study. In
the first instance, having commenced analysis and discussion of questionnaire data in
chapter 6, a summary of information from interviews with management of ports shall
be presented. On this basis, excerpts from the interviews will be drawn upon for
discussion in this chapter. See appendix 3 for more details of port management
opinions on issues about value-adding services in port strategy.
Although this research is particularly focused on investigating value-adding services
in ports, other port selection criteria shall be examined. These include port location,
cargo handling equipment, tide variations, skilled manpower and security. One of the
analyses that will be carried out on these criteria is factor analysis in order to evaluate
how they are interrelated.
For the testing of set propositions, all data collected by questionnaires from the case
study ports shall be combined together, in order to reach the main aim of evaluating
and understanding the impact of value-adding services. A new Port VAS model will
be developed and there will be discussion on the formulation of strategy by value-
adding services based on the outcomes of tested propositions and evaluation of value-
adding services prospects in attracting and retaining port users.
This chapter also presents discussions on the extent to which value-adding services
are deployed in the various case study ports as examined in this study. It concludes by
presenting discussions on the level of port users‟ awareness of value-adding services.

167
7.2 Port management interview summary
While research data collection was focused on the four case study ports, during
interviews with port management, some other ports apart from the case study ports
were included in order to broaden opinions on value-adding services. Most of the
interviews were carried out before the questionnaire survey, with information
received supporting the development of questionnaire. Other interviews took place
concurrently with the questionnaire survey or after.
On an average, the duration of the telephone and face-face interviews was about 55
minutes. The details of those interviewed and dates of interview are:
Advisor corporate Strategy - Port of Rotterdam (Date: 25/03/2009)
Assistant Chief Port Strategist - Apapa Port (Date: 07/04/2009)
Operations Manager - Damietta port (Date: 20/11/2010)
Business Development Manager - ABP Port of Hull (Date: 20/03/2009)
Port Manager - NPA Port Harcourt (Date: 27/12/2008)
„Anonymous‟ - NPA Port Harcourt (Date: 27/12/2008)
Executive Director - Port of Los Angeles, CA (Date: 08/06/2009)
Sales and Marketing Manager - PD Teesport (Date: 01/11/2010)

168
Table 7.1 presents a summary of salient management opinions on value-adding
services (VAS) in port‟s strategy.
Table 7. 1: Summary of information gathered from interviews with port management
Issues of discussion Presentation of port management opinions
1. VAS availability in
ports (examples of VAS):
Pre-Delivery Inspection (PDI) of cars; treatment of timber; fire
fighting, packaging
Distribution; facilitation of materials/products sales; cold
storage; consultancy etc.
2. Resources needed for
development and offering
of VAS:
LAND; trained workforce; stable flow of materials/cargo;
capital; good communication by roads and rails connections;
support from authorities; concession of port, enabling business
environment etc.
3. VAS Potentials in
Port‟s Strategy-
(Attraction of port users):
6 out of the 8 port management interviewees held definite
opinions that „VAS can form a strong means of competitive
differentiation to attract port users‟.
2 out of the 8 interviewees were of definite view that „VAS can
be used, but not a very strong competitive means of attracting
port users‟.
There were no opinions that „VAS cannot be used to
differentiate a port for competitive advantage‟.
3b. VAS Potentials in
Port‟s Strategy-
(Retention of port users):
6 out of the 8 interviewees held that „VAS can strongly increase
port users‟ retention in ports‟.
2 out of the 8 the interviewees were of the opinion that „offering
of VAS is not a very strong means of retaining port users‟.
There were no opinions that „VAS cannot be used for retention
of port users in ports‟.
4. Reasons for offering
VAS in the ports:
To secure port business for competitiveness; demands of
customers; to complement port services and
Profit maximisation
5. Possible expansion of
VAS range:
Expansion would generally be customer-driven.
There is an expectation to expand the range of VAS available.

169
Continuation of table 7.1 (Interview summary)
Issues of discussion Presentation of port management opinions
6. Major problems/
challenges to offering
value-adding services in
ports:
Ability to adequately match services with customers need.
Sufficient flow of cargo (i.e. long term traffic source).
Copying of strategy by competitors; lack of technical expertise
Government and other stakeholders‟ issues.
7. Recent port strategies: Long term project commitment, organic growth
Port concession (i.e. privatisation)
8. Other Reasons that
attract port users to Ports:
Geographical advantage (both from seaside and shore side);
proximity to free zones.
Land availability, shore site and hinterland connections (i.e.
good road and rail networks).
The influence of pricing policies on choice of a port.
Equipment and facilities availability; process simplification.
Vessel turnaround times in the port.
9. Other Comments Analysis of strength for each traffic category; e.g. the type of
cargo handled could be strength or weakness to offering some
value-adding services.
The viability of VAS; e.g. cost (efficiency) and sustainable
environment (green).
Social awareness of a port can differentiate it; e.g. assisting in
education can increase the proportion of skilled labour around
the port‟s community
Reference should be made to appendices 2 and 3 for the interview checklist and
detailed interview results with port management. With the summarisation of
information from interviews, attention shall be refocused to the analysis of data from
questionnaire.
7.3 Port users’ port selection criteria variables
There are various reasons or criteria by which port users can choose to use a port.
Although this study is particularly focused on investigating value-adding services‟
capacity to attract and retain port users to a port, this section is dedicated to examining
other criteria for port users to patronise a port. Given the need for an overall
evaluation of these criteria, all data collected by questionnaire survey were combined

170
together for this investigation. The criteria for port selection, as evaluated in table 7.2
were identified from the literature and then presented to port users for evaluation in
the questionnaire. These criteria are known to influence port users‟ decision in
making choice of a port.
Results presented in table 7.2 are products of data from questionnaire by port users
ranking the various criteria according to importance, from 1 (very low) to 5 (very
high). In order to maintain consistency in evaluating the ranking of these criteria, only
the combinations of „high‟ and „very high‟ (high-importance) rankings are presented
as follows:
Table 7.2: Port users‟ port selection criteria variables (overall Statistics)
The proportions of port users and the corresponding port selection criteria they
assigned top high importance ranking include: port location (86.5%), cargo handling
Selection Criteria
Port Users’ Ranking
(Combination of „High + Very
High‟ ranking)
Frequency N Percentage (%)
Port Location 96 111 86.5%
Cargo Handling Equipment 93 111 83.8%
Tide Variations 91 111 81.9%
Skilled Manpower 91 111 81.9 %
Security 91 111 81.9%
Infrastructure 90 111 81.0%
Service Quality 89 111 80.1%
Quick Response 88 111 79.2%
Stable Legislations 85 111 76.5%
Computerised/IT aided Operations 83 111 74.7%
Inter-modal Transport Facilitation 76 111 68.4%
Value-Adding Services (VAS) 75 111 67.5%
Management Structure of the Port (eg.
Landlord-Operator)
70 111 63.0%
Capital to Start Business with a Port 64 111 57.6%
Port Safety 60 111 54.1%
Port Charges 55 111 49.5%
Port Service Reliability 51 111 45.9%
Number of Berths 44 111 39.6%
Simplified Documentation Process 42 111 37.8%

171
equipment (83.8%), tidal variations (81.9%), skilled manpower (81.9 %), security
(81.9 %), infrastructure (81.0 %) and service quality (80.1%). These are therefore the
seven most important criteria or service features in selection of ports by port users. On
the other hand, the criteria that emerged with the lowest ranking, according to the
proportions of port users rating include simplified documentation process (37.8%),
number of berth (39.6%) and port service reliability (45.9%).
It is noteworthy that value-adding services neither emerged at the higher nor lower
ends, but in the middle of port users‟ ranking of port selection criteria. Hence, the
significance of this outcome is that among criteria for port users‟ selection of ports,
value-adding services are of moderate importance. Although Ugboma et al. (2004)
indicated a low importance ranking for value-adding services, the outcome in this
study is that value-adding services in ports are not necessarily of low importance to
port users. There is a natural expectation that core port services and features would be
placed in priority to value-adding services. This does not intrinsically imply that
value-adding services are low in importance to port users.

172
7.3.1 Factor Analysis of Port users’ port selection criteria variables
The reason for carrying out factor analysis on the identified port selection criteria was
to evaluate the criteria by investigating how they are interrelated. This technique
allows the reduction of criteria (variables) to comprehensible groupings. Factor
analysis summarises interrelated variables into component (factors) groupings, by
showing the most common variance among the variables using a correlation matrix
(Malhotra, 1999; Field, 2009).
Figure 7.1: Factor Extraction Scree plot
Figure 7.1 presents a factor analysis scree tree which showed that of the nineteen (19)
criteria (on the horizontal axis), four (4) factors of eigenvalues above one (1) were
extracted as shown in table 7.3 based on Kasier method, with an excellent KMO and
Bartlett's Test value of 0.9 and (p<0.001). Eigenvalue connotes the value of
interrelatedness in various variables, and generated factors (interrelated variables)
with eigenvalue more than one significantly stands out to represent others.
[Note: KMO is an index that indicates the appropriateness of factor analysis, where
there is high value between 0.5 and 1.0, while values below 0.5 reveal inaccuracies in
the analysis (Malhotra, 1999)].

173
Thus, the obtained result implies that four groupings (factors) were created according
to underlying interrelated features of the variables. In effect, factors do not correspond
perfectly with original variables, but are only a representation of common features in
various variables. Table 7.3 presents the four (4) extrapolated factors under the
heading „component‟, which were then subjected to analytical discussion in section
7.3.2.
Table 7.3: Rotated (resultant) Component Matrixa
Component (FACTOR)
1 2 3 4
Port Safety .871
Computerised/IT aided Operations .820
Simplified Documentation Process .772
Quick Response .722
Service Quality .699
Inter-modal Transport Facilitation .675
Cargo Handling Equipment .673
Security .635 .433
Skilled Manpower .557 .543
Port Service Reliability .535 .418
Management Structure of the Port (eg.
Landlord-Operator)
.783
Number of Berths
.758
Value-Adding Services (VAS) .485 .594
Capital to Start Business with a Port
.586
Tide Variations
.508
Port Location
.824
Port Charges
.807
Stable Legislations
.793
Infrastructure
.449
Extraction Method: Principal Component Analysis. Rotation Method: Varimax with Kaiser
Normalization. a. Rotation converged in 6 iterations.

174
7.3.2 Examination of the extracted factors from port selection criteria
This section presents discussions on the various criteria of port selection variables
categorised under each of the factor (component).
(1) Factor 1 - Port logistics operations facilitation
Predominantly, the port selection criteria under factor 1 had features which generally
can be described as related to „port logistics operations facilitation‟. As shown in table
7.3, these criteria (service enablers) include port safety, computerised/IT aided
operations, simplified documentation process, quick response (QR), service quality,
intermodal transport facilitation, cargo-handling equipment, security, skilled
manpower, port service reliability and value-adding services. By implication
therefore, these services and service-enablers categorised as „port logistics operations
facilitation‟, form one of the fundamental groups of port selection criteria.
(2) Factor 2 - Administrative/management related facilitation
Factor 2 largely represented an extrapolation of management and administrative
features of port users‟ port selection criteria. The services and service-enablers in this
factor include security, skilled manpower; service reliability, management structure of
the port, number berths, value-adding services and capital to start business with a port.
It is thus useful to observe that for port users, the manner of „administrative and
managerial related facilitation‟ obtainable, forms a significant issue for consideration
in the selection of port.
(3) Factor 3 - Hinterland related attributes
Industry knowledge of trends in maritime traffic flow and business shows that there is
a relationship between port selection criteria (variables) of factor 3 in table 7.3 with
the hinterland of a port. The two port selection criteria of concern are port location
and port charges. Fundamentally, a port‟s hinterland refers to a geographical area
wherein the port has dominant, if not exclusive share of the generated traffic flow
(Tsamboulas, 2008; Rodrigue and Notteboom, 2006). Though not directly
proportional to annual tonnage handled in a port, there is a tendency that a port with

175
large productive hinterland of active import and export stakeholders, would exercise
more leverage over port charges. This assertion is supported by economic principles
on proportional relationship between demand and prices (Abel et al. 2008, Lipczynski
and Wilson, 2004, Bamford, 2006).
When port users from a cargo-productive hinterland depend on the services of a
particular port, there sets in a situation where the port would be in a better position to
influence charges for the services. On the other hand, location is a major factor that
naturally determines the hinterland of a port. This indicates that hinterland related
features are core factors in port users‟ selection of ports.
(4) Factor 4 - Port fundamentals
Infrastructure and stable legislation port selection criteria, as grouped in „factor 4‟ can
reasonably be considered as fundamentals for a port setting or environ. By port
fundamentals, attention is called to the fact that there are some basic port
environmental needs, in form of hardware (physical) or software (non-physical)
features that are of importance to port users. As such, the provision of sound
infrastructural needs, stability in legislation, and other forms of port setting essentials
constitute vital port selection criteria for port users.
7.3.3 Summary - Port selection criteria
In fulfilment of research aim 3 (see 1.3.2), this section has analytically examined
other port-users‟ port selection criteria, apart from value-adding services, which
happen to be the principal subject of this study. Through factor analysis process, it has
been shown that there were four groupings of factors considered in port users‟
selection of ports, namely „port logistics operations facilitation,
administrative/management related facilitation, hinterland features and port
fundamentals‟. These factors correspond with some of the outcomes of Yeo et al.‟s
(2010) factor analysis of port competitiveness components, which include logistics
cost, hinterland condition and connectivity.
Although among other criteria, value-adding services were not ranked in the very top
criteria for selection of ports, the services were found to be integral parts of both „port

176
logistics operations facilitation‟ and „administrative/management related facilitation‟
factors. This indicated that value-adding services have underlying versatile potentials.
Port selection criteria that emerged as most important in port users‟ selection of ports
include port location, cargo handling equipment, tidal variations and service quality.
In comparison with other criteria, value-adding services emerged in the middle,
indicating moderate importance in port-users‟ port selection criteria.
7.4 Test of Research Propositions
In order to achieve the principal aims of this research project, with particular
reference to „aim number 4‟, propositions were postulated as set out in section 1.4.
Data for all tests of propositions were those of all port-users responses to certain
questions of the questionnaire. Using data this way ensured having a unified
standpoint of all port users concerning the use of value-adding services in port
strategy.
To test the research propositions, chi-square tests were carried out. According to
Proctor (2005) a simple inspection of the variables upon which chi-square tests are to
be carried out may suggest association between the variables in question. However,
the reason for carrying out the chi-square test in this research was to verify whether
observable association in the variables is statistically significant and not an
occurrence of chance. Additionally, in order to ensure that the right research
proposition is not rejected, the Fisher‟s exact test was also carried out in this section,
which gave compelling confirmation of the resultant outcomes.
With data collection and analyses having been carried out, results and discussions on
these propositions which are related to the potential of value-adding services in port
strategy formulation are hereby presented:
(a) Proposition 1 - VAS association with the attraction of port users to a port
The first proposition postulated in section 1.4 suggested an associative relationship
between the offering of value-adding services and attraction of port users to a port. A
chi-square test carried out by crosstabulation of data obtained from questionnaire
questions number 8 and 9, which were designed to examine the attraction effect of
value-adding services, resulted in a Pearson chi-square statistic value 47.979.
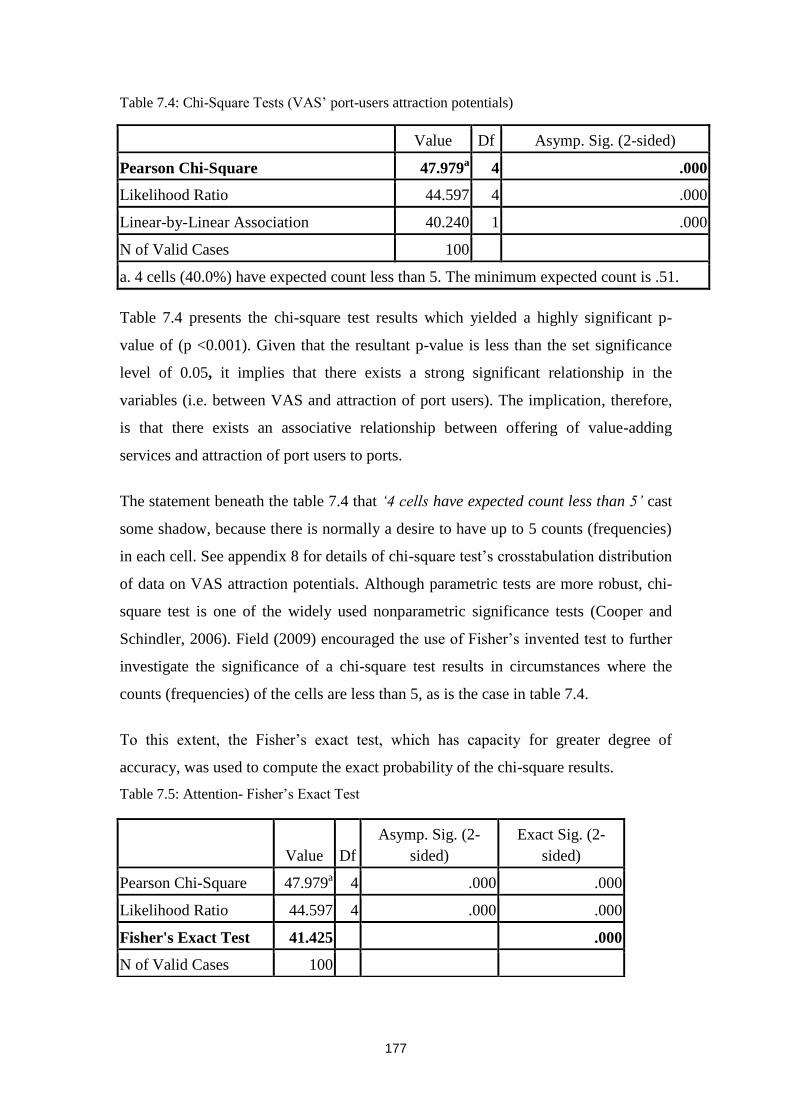
177
Table 7.4: Chi-Square Tests (VAS‟ port-users attraction potentials)
Value Df Asymp. Sig. (2-sided)
Pearson Chi-Square 47.979a 4 .000
Likelihood Ratio 44.597 4 .000
Linear-by-Linear Association 40.240 1 .000
N of Valid Cases 100
a. 4 cells (40.0%) have expected count less than 5. The minimum expected count is .51.
Table 7.4 presents the chi-square test results which yielded a highly significant p-
value of (p <0.001). Given that the resultant p-value is less than the set significance
level of 0.05, it implies that there exists a strong significant relationship in the
variables (i.e. between VAS and attraction of port users). The implication, therefore,
is that there exists an associative relationship between offering of value-adding
services and attraction of port users to ports.
The statement beneath the table 7.4 that ‘4 cells have expected count less than 5’ cast
some shadow, because there is normally a desire to have up to 5 counts (frequencies)
in each cell. See appendix 8 for details of chi-square test‟s crosstabulation distribution
of data on VAS attraction potentials. Although parametric tests are more robust, chi-
square test is one of the widely used nonparametric significance tests (Cooper and
Schindler, 2006). Field (2009) encouraged the use of Fisher‟s invented test to further
investigate the significance of a chi-square test results in circumstances where the
counts (frequencies) of the cells are less than 5, as is the case in table 7.4.
To this extent, the Fisher‟s exact test, which has capacity for greater degree of
accuracy, was used to compute the exact probability of the chi-square results.
Table 7.5: Attention- Fisher‟s Exact Test
Value Df
Asymp. Sig. (2-
sided)
Exact Sig. (2-
sided)
Pearson Chi-Square 47.979a 4 .000 .000
Likelihood Ratio 44.597 4 .000 .000
Fisher's Exact Test 41.425 .000
N of Valid Cases 100

178
In table 7.5, attention is particularly drawn to Fisher‟s exact test result with a statistic
value of 41.425, which yielded a very significant p-value of (p<0.001). The high
significance of this result goes to further substantiate the chi-square‟s results as being
very reliable, supporting reiteration that the results were not products of chance but of
statistical consistencies.
Of the port management interviewed, 6 out of the 8 were of the opinion that the use of
value-adding services is a strong means of competitive differentiation to attract port
users (see table 7.1).
An excerpt from interview statements affirming VAS attraction potentials is:
‘There is a saying that ‘services that prospered traded in cargo and physical items’.
In the future, institutions/firms must be prepared to trade in ideas. ‘Ideas rule the
world- the same is true for the port sector’ (Port Manager, NPA Port Harcourt,).
The need for ideas as communicated in this statement points to the inevitability of
innovative developments, which are in line with a core aspect of value-adding
services‟ customisation, as discussed in section 2.8 of the theoretical perspective
chapter. Just like the development of services should be followed stepwise
(Edvardsson and Olsson, 1996), even so the generation of ideas and offering of
customised value-adding services requires generating and implementing robust ideas.
Given these scrutinizing processes, the research „proposition 1‟ „the patronage level to
a port by port-users is associated with the value-adding services obtainable from that
port‟ was accepted.
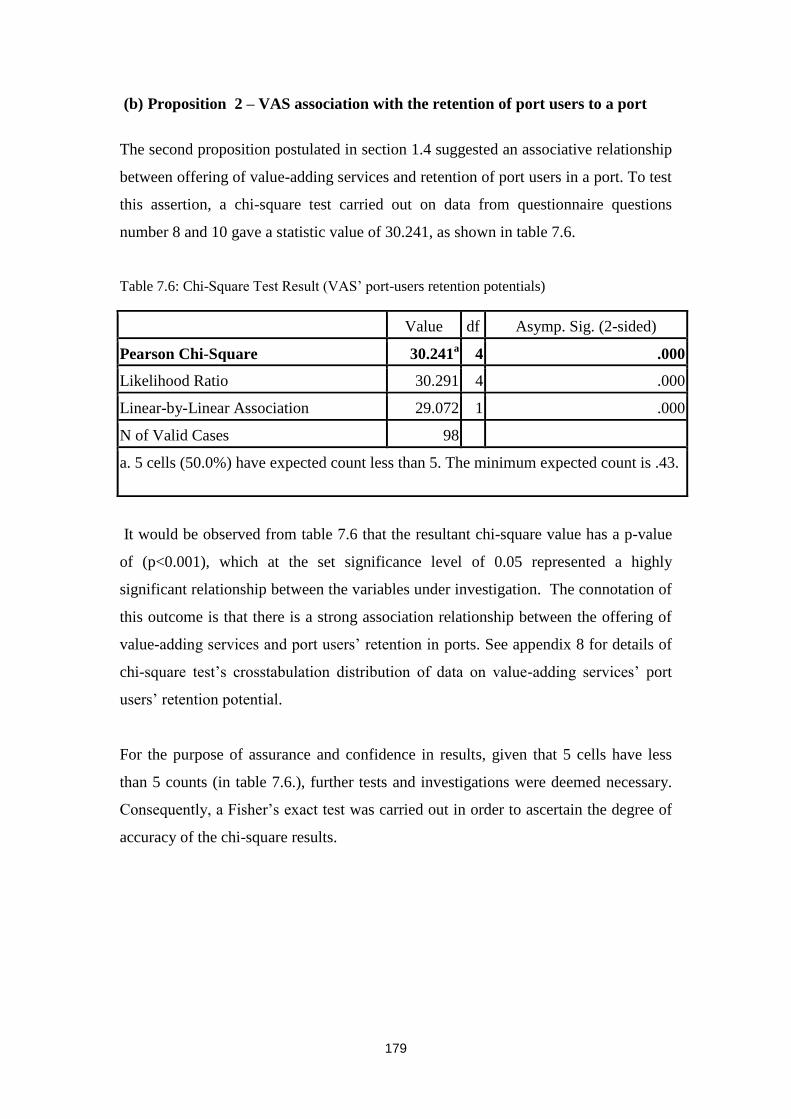
179
(b) Proposition 2 – VAS association with the retention of port users to a port
The second proposition postulated in section 1.4 suggested an associative relationship
between offering of value-adding services and retention of port users in a port. To test
this assertion, a chi-square test carried out on data from questionnaire questions
number 8 and 10 gave a statistic value of 30.241, as shown in table 7.6.
Table 7.6: Chi-Square Test Result (VAS‟ port-users retention potentials)
It would be observed from table 7.6 that the resultant chi-square value has a p-value
of (p<0.001), which at the set significance level of 0.05 represented a highly
significant relationship between the variables under investigation. The connotation of
this outcome is that there is a strong association relationship between the offering of
value-adding services and port users‟ retention in ports. See appendix 8 for details of
chi-square test‟s crosstabulation distribution of data on value-adding services‟ port
users‟ retention potential.
For the purpose of assurance and confidence in results, given that 5 cells have less
than 5 counts (in table 7.6.), further tests and investigations were deemed necessary.
Consequently, a Fisher‟s exact test was carried out in order to ascertain the degree of
accuracy of the chi-square results.
Value df Asymp. Sig. (2-sided)
Pearson Chi-Square 30.241a 4 .000
Likelihood Ratio 30.291 4 .000
Linear-by-Linear Association 29.072 1 .000
N of Valid Cases 98
a. 5 cells (50.0%) have expected count less than 5. The minimum expected count is .43.

180
Table 7. 7: Attention- Fisher‟s Exact Test
In table 7.7, attention is particularly called to the result of the Fisher‟s Exact test
which yielded a statistics value of 28.270, having a p-value of (p<0.001). This
resulting p-value depicts a highly significant outcome, and thus validated the chi-
square results for the tested proposition on retention of port users. As a result, it was
confirmed that the outcome of the test was not an occurrence of chance, but based on
consistent statistical trends in the examined data.
Additionally, 6 out of the 8 interviewed port management personnel were of the
opinion that value-adding services can strongly increase retention of port users in
ports (refer to table 7.1). In this regard, one of the experts commented:
‘If the port management decides that the VAS is important to retain certain
cargo/trade flows, they can give incentives to start up VAS companies and they can
take this into account for land lease strategy’ (Advisor corporate Strategy, Port of
Rotterdam)
While other issues raised by this comment shall be subjected to further scrutiny, at the
moment it suffices to acknowledge that it is one of the remarks put forward in favour
of value-adding services‟ potential in retention of port users.
Having critically subjected „proposition 2‟ to different levels of statistical analyses
and examinations, it was accepted that „the capacity of a port to retain port-users is
associated with the value-adding services obtainable from that port‟.
Value df Asymp. Sig. (2-sided) Exact Sig. (2-sided)
Pearson Chi-Square 30.241a 4 .000 .000
Likelihood Ratio 30.291 4 .000 .000
Fisher's Exact Test 28.270 .000
Linear-by-Linear Association 29.072b 1 .000 .000
N of Valid Cases 98
a. 5 cells (50.0%) have expected count less than 5. The minimum expected count is .43.

181
7.5 The Extent of offering value-adding services in the Ports
This section discusses the extent to which value-adding services are deployed in the
various case study ports as examined in this study. As a result, it is one of the sections
designed to meeting the number two (2) research aim outlined in section 1.3.2, in
regards to investigating how value-adding services are deployed in developing and
developed economies ports. Table 7.8 shows the outcomes of analysis of the extent of
offering value-adding services (VAS) in the ports. (Note: The „Total‟ column refers to
general indications for the options e.g. „VAS is not in existence‟, „offering of VAS is
very high‟, while the „Total‟ row refers to indications per port).
Table 7. 8: Extent of offering Value-Adding Services in the Ports
Developed
Economies
Developing
Economies
(Egypt)
Developing
Economies
(Nigeria)
Total
Ex
ten
t o
f o
ffer
ing
Val
ue-
Ad
din
g
S
erv
ices
in
th
e P
ort
Value-Adding
Services are not in
Existence
0 3 0 3
.0% 8.6% .0% 2.7%
Value-Adding
Services are Scarcely
Offered
6 2 9 17
16.2% 5.7% 23.1% 15.3%
Value-Adding
Services are
Moderately Offered
7 14 20 41
18.9% 40.0% 51.3% 36.9%
Value-Adding
Services are Offered
Considerably
15 14 6 35
40.5% 40.0% 15.4% 31.5%
Offering of Value-
Adding Services is
Very High
9 2 4 15
24.3% 5.7% 10.3% 13.5%
Total
Count & % within ports
37 35 39 111
100.0% 100.0% 100.0% 100.0%
Only significant outcomes in the investigation of the extent of offering value-adding
services (VAS), as summarised in table 7.8 were further analysed and presented as
follows:

182
Rotterdam & PD ports: Observation of opinion results on the statements:
„value-adding services are offered considerably‟ and „offering of value-adding
services is very high‟ as presented in table 7.8 showed that a combined 64.8%
of port-user respondents confirmed these statements as true. Hence, the extent
of offering value-adding services in these ports of developed economies is
considerably high. This conclusion was supported by a high percentage of port
users who held opinions that most of the ten (10) key value-adding services
were available in the ports (section 6.6.1).
Egyptian Damietta Port: Concerning proposals „value-adding services are
moderately offered‟ and „value-adding services are offered considerably‟, it
was found that a combined 80.0% of the port users in Damietta port confirmed
these assertions. Also, previous indication of value-adding services availability
by high proportion of port users (see section 6.6.2) strengthens the basis to
conclude that these services are offered at a considerable level in the Damietta
port.
Nigerian Apapa Port: For the assertions „value-adding services are scarcely
offered‟ and „value-adding services are moderately offered‟, a combined
74.4% of port-user respondents from Nigerian Apapa port affirmed these
statements as being true in the port. In essence therefore, this outcome pointed
to the fact that while spanning between „scarcely and moderately offered‟
ratings, the extent of offering value-adding services in the Nigerian port is
considered to be at a moderate level.
Offering of value-adding services was generally found to be higher in ports of the
developed economies than is the case for ports of the developing economies. The
services are therefore offered more readily in ports of the developed economies. For
the ports in the developing economies, opinions point to the fact the services are
moderately offered in general terms. However, value-adding services emerged to be
offered at a considerable level in the Damietta Egyptian port, while the services are
moderately offered in the Nigerian Apapa port.
Areas of logistical deficiency would possibly be hidden opportunities waiting to be
harnessed. The Economist (2009) stressed the importance of learning from

183
companies that have effectively harnessed business opportunities created by the
difficulties of economic recessions and scarcities. Consequently, the moderate levels
of offering value-adding services in the developing economies ports in conjunction
with the high likely usage indications in sections 6.8.3 and 6.8.4, point to the
existence of opportunities worthy of further exploration in the port industry.
The need for continual development in transport and logistics cannot be
overemphasised (Bowersox and Closs 1996; Dinwoodie, 2000; Christopher, 2005)
given the associated short and long term socioeconomic benefits. This runs in parallel
with Hoyle and Hillings (1970) observation that the gap between developed and
developing countries would certainly widen, except developing economies pay
attention to the technological developments in advanced nations. On this basis,
experiences of ports in developed economies in the extensive development and
deployment of value-adding services, as shown in this study should serve as case
studies from which ports and port users in the developing economies can learn from in
the bid to improve innovations in port value-adding services.
7.5.1 Summary- Extent of offering value-adding services
Following discussions in this section, the offering of value-adding services in the
ports based on findings in this study are summarised as:
Rotterdam and PD ports: value-adding services are readily offered at
considerably higher levels than is the case in the ports of developing
economies.
Egyptian Damietta port: value-adding services are offered at a considerable
level.
Nigerian Apapa port: value-adding services offered at a moderate level.
Finally, findings showed that there exist potential business opportunities in offering of
value-adding services in ports‟ strategies, particularly in the developing economies
ports where the extent of offering value-adding services was largely between scarce
and moderate levels.

184
7.6. Level of port users’ value-adding services awareness
Provision of adequate training and education can have far-reaching effect on the
development of logistics and transport industries (Morvillo, 2002; Vellecco, 2002).
While acknowledging the need to develop high calibre managers in the shipping
logistics profession as addressed by Dinwoodie (2000), another necessity is the
transference of logistics knowledge to third World by Dadzie (1998). Essentially,
these views are related to facilitating awareness acquisition about different aspects of
maritime business. In this light, this section reports investigation on the level of port
users‟ awareness of value-adding services. Intrinsically, awareness as herein referred
encompasses being conversant with the terminology, clarity in identifying value-
adding services and related features.
Table 7.9 provides a summary of the extent of port users‟ awareness of value-adding
services in the different case study ports.
Table 7. 9: Summary for level of awareness
Developed
economies Port
Egyptian
Port
Nigerian
Port
N
Percent
N
Percent
N
Percent
No Awareness of Value-Adding
Services
- - - - 2 5.1%
Slightly Aware of Value-Adding
Services
3 8.1% 2 8.1% 2 5.1%
Moderately Aware of Value-
Adding Services
7 18.9% 10 18.9% 23 59.0%
Considerably Aware of Value-
Adding Services
15 40.5% 13 40.5% 7 17.9%
Very Much Aware of Value-
Adding Services
12 32.4% 10 32.4% 5 12.8%
Total 37 100%
35 100% 39 100%
In the following discussion, attention is particularly focused on significant outcomes.
Rotterdam & PD ports: Significantly, port users in the Rotterdam and PD
Teesport ports rated their awareness of value-adding services to be between

185
„considerable‟ and „very much aware‟. Indications in this regard became
particularly pronounced with 40.5% of port users rating their awareness as
being „considerable‟. On this statistical basis, it is admitted that port users in
the Rotterdam and PD ports are considerably aware of value-adding services.
Egyptian Damietta Port: Based on port users‟ opinions, the extent of their
awareness of value-adding services in the Damietta port was in the range of
„moderate‟, considerable‟ and „very much aware‟. Given that the ratings
peaked with 37.1% of port users rating their VAS awareness as being
„considerable‟, it was thus appropriate to conclude that port users in the
Damietta port are considerably aware of value-adding services. However, the
awareness is lower than is the case for port users in the developed economies
ports.
Nigerian Apapa Port: The extent of port users‟ awareness of value-adding
services in the Apapa port was generally rated to be at a „moderate‟ level. It is
observed in table 7.9 that though there were ratings at various other levels, a
significant 59.0% of port-user respondents from Apapa port opted for being
„moderately aware‟ of value-adding services. As a result, it was considered
that Nigerian Apapa port users are moderately aware of value-adding services.
7.6.1 Summary - level of port users’ value-adding services awareness
Port users‟ value-adding services awareness in Rotterdam and PD Teeport ports was
found to be higher in comparison to that of their counterparts in the two developing
economies‟ ports. While this study contributes to enhancing understanding of the
awareness level of value-adding services in ports, it is important to state that these
levels of awareness are adequate for consideration and development of value-adding
services in port‟s strategy.

186
7.7 VAS Strategy in ports
Results and analysis of tested propositions on value-adding services‟ prospects in
attracting and retaining port users showed that the services have the capacity to be
used in the strategy of ports. These findings were profoundly based on port users‟
opinions, hence in coherence with the view of Chan et al. (2000) that a firm can opt to
formulate its strategies on the basis referred to as „customer fit‟. This implies the
ability to consider and adequately align a firm‟s strategy to fit in with customers‟
desires.
Based on preferences for ports that offer value-adding services (appendix 8), results
of the „impact‟ analysis illustrated significantly that offering these services has
potential to attract and retain port users. In a similar assessment, while acknowledging
accompanying intricacies, the majority of the interviewed port management personnel
reiterated that value-adding services can be a source of competitive advantage for
ports.
In the face of competition therefore, it is imperative to objectively assess deploying
value-adding services in the formulation of port‟s competitive strategies. Given
different levels of demands (potential) for value-adding services in the case study
ports, there would be differences in the viability of deploying VAS in the strategies of
ports. Karolefski (2007) in a scrutiny of the services of logistics providers companies
indicated that trends in the industry showed an increasing rise in the demand of
„value-adding services‟ and that this will continue to represent a greater percentage of
services offered by supply chain management companies. Stressing the prowess in
well articulated value-adding services, Bowersox (2007) and Christopher (2005)
pointed out that the services are able to differentiate a firm for competitiveness.
Findings that value-adding services are potential source of gaining competitive
advantage in ports, reinforced these authors‟ views which formed the major part of the
conceptual framework (background) of this study in chapter one. Hence, findings in
this study on the capability of value-adding services as a means of gaining
competitive advantage in ports become more compelling.

187
Admittedly, on the basis of desire for services, deploying value-adding services for
competitive port strategies at present and in the near future is more promising and
stronger in the ports of developing economies than is the case for ports in developed
economies where the services have existed at significant levels for a long period of
time. However, because value-adding services are customer-tailored and geared
towards meeting specific needs, it would be expected that different types of the
services would continually evolve in both developing and developed economies.
It would be expected that some ports around the world will exhibit inertia to the idea
of developing and offering value-adding services as a means for developing port
competitive strategy. To this extent, it should be noted that given dynamism in global
supply chains, patterns of port users‟ demands of traditional port services are prone to
change. As such, the awareness and capability of a port to, in the first instance, readily
carry out objective assessments of potential means of offering value-adding services
in the short term or long term, directly or indirectly is greatly encouraged.
Investigation results supported the observation that over time as value-adding services
are offered, the tendency of regarding them as basic services increases, hence diluting
the desire for the speciality of the services. It may therefore be predicted that as more
and more ports in the developing economies develop value-adding services, the
desirability of such services by port users would probably reach a turning point, as
was generally the case for the ports in developed economies. This goes to demonstrate
the dynamism in developing and deploying value-adding services in a port‟s
competitive strategy.
Diversification Potentials
Most experts in the maritime sector would agree that shipping services and ship liners
are the core sustainers of both the port and shipping industries. The recognition of
ongoing turbulence in the shipping market caused mainly by freight rates (Alizadeh
and Nomikos, 2009), exacerbates the urgency for enhanced and well founded business
risk management, not just for shipping business, but also for ports and other maritime
businesses. One of the core established methods of strategizing for competitive
growth and risk management for firms is by diversification (Lambin, 1997; Doyle,
2008; Soppe et al., 2009). While value-adding services can be deployed for immediate
188
and long term port business sustainability by attracting and retaining port users,
offering of the services can prove a veritable means by which ports can diversify their
businesses.
As key port operators continue to go global, it is imperative to recognise that skills
developed by offering some VAS can form a strong basis for business expansion and
competitiveness as the scramble for port business around the globe intensifies. For
example, the Amsterdam Port Consultants arm (APC, 2007), have not just supported
its founder (Port of Amsterdam), but also have had projects in many ports of the
world, especially in developing economies. Hence, expertise developed by the
Amsterdam port in consultancy is of benefit to its direct port users and also to other
ports and their users.
Resources and Challenges of VAS in ports
There are resources required for the offering of value-adding services in a port, which
are worth thorough consideration before investing in the services. As gathered from
research interviews (section 7.2 and appendix 3) and questionnaire comments, some
of the resources needed include land, steady availability of cargoes; investment in
logistical networks, skilled labour force and privatisation. It is pertinent that an
objective evaluation of resources and challenges of offering value-adding services
(VAS) be carried out.
In this regards, some questions requiring careful answers include: Are the services
really tailored to port users‟ needs? What are the possible reactions of our
competitors? To what degree do governments, pressure groups and other stakeholders
influence the projects? For example, a development project of Dibden Bay by ABP
ports in Southampton (UK) did not materialise as a result of legal protest by
environmental friendly pressure groups (NFDC, 2001).

189
In a quest to understand necessary steps in developing and offering of value-adding
services, port management opinions during the interviews include:
‘…identifying and putting in place robust structures to support Research and
Development (R&D); to explore the market and chart commercial policies to tap into
the market’ (Port Manager, NPA Port Harcourt).
‘…..and sometimes the problems of these projects can be the fact that you don’t get a
long enough contract from the customers to justify the skills and investments
required’ (Business Development Manager, ABP, Port of Hull).
These factual statements of port managers‟ point to the crucial needs to, in the first
instance, comb and explore the immediate and extended port market. This necessitates
setting up organised research unit(s) whose investigations can support the port in
tapping into market opportunities with regards to developing relevant value-adding
services. On the other hand, the need to secure or plan for long term contracts can not
be overemphasised. It implies therefore, that a viable value-adding service, with
stakeholders interested in long term contract, should be given development and
investment priority.
Driving Strategy in Landlord-Operators Port Model
Given the results of changes in market, ports adapt their structures and strategies in
order to retain competitive positions (Cetin and Cerit, 2010). As more and more
private operators enter into the port business by either full port privatisation or via the
landlord-operator‟s model of port concession, it becomes increasingly important to
understand how and who drives the port‟s strategies. In the case of a fully privatised
port, it is clear that strategizing for the port‟s growth is the core responsibility of the
port management. On the other hand, for a landlord-operator‟s port model,
discussions during interviews with port management increasingly reflected views that
the responsibilities of strategy concerning attracting and retaining customers and
businesses of a port has greatly passed on to port/terminal operators.

190
Nonetheless, the following port management opinion is worth consideration:
‘… as landlords would normally want to make sure that things are done right in their
houses, so also as landlords in the port we also would want things to be done right in
the port. The tenant is not the owner of the house; as such the responsibility will not
be left just for the terminal operators. There is therefore symbiotic actions and
relationship from both sides of landlords and operators’ (Assistant Chief Port
Strategist, Apapa Port).
This excerpt confirmed that there are great expectations and responsibilities on
terminal and/or port operators (tenants) in any particular port. However, it goes to
emphasise that Port Authorities as responsible landlords should not relent on pursuing
growth strides of the port. Attention to this statement becomes even more important
since port/terminal operators usually operate within specified contract duration, with
the possibility that such operation agreement might not be renewed. This line of
thought is supported by Baird (2002), who held that although there is a significant
participation of private sector in port operations and services, yet the public sector
takes more than just a passive interest in the port system.
To buttress the need for port authority‟s proactive involvement, it is worthwhile to
have the view that as long as the port landlord-operator‟s model continues, then there
exists the likelihood of having changes in operators but port landlords will remain the
same. While discussing port privatisation and competitiveness, Tongzon and Heng
(2005) cited that the Port of Singapore Authority (PSA) lost two major clients, and
stressed that success in the 21st century seaport is hinged on Port Authorities being
customer-focused and possessing the ability to realize important market trends. Given
the statutory structure of a landlord-operator port model, the growth of ports should be
spurred by active joint efforts of both the landlords and operators. For instance, the
consideration of value-adding services in a port‟s strategy can be jointly initiated and
assessed by Port Authorities and operator(s), with a profound understanding of the
needs of other customers (port users).

191
7.8 Port Value-adding Services (VAS) Strategy Model
In order to achieve research aim 6 (section 1.4), a new port VAS model, in addition to
the other one developed in section 2.8 (figure 2.5), is hereby presented as supportive
tool to enable port management to make informed decisions while considering value-
adding services (VAS) in the strategy of ports. This type of model is in the form of
models discussed by Lunn et al. (1986) as fundamentally modelling how things work
or in other words how things can be made possible. For an objective use of the
stepwise port VAS model (figure 7.2), the table 7.10 presents some of the core
parameters that should form the basis for „practicability‟ study and assessments to
reach informed decision of the type of value-adding services to offer at a given time.
Table 7.10: VAS port model table
I II III IV V
Service Availability Relevant Resource base VAS Importance VAS Usage level Contract duration
VAS
„A‟,„B‟
or „C‟
*Available
*Not
available
* High
* Low
* Moderate
* High
* Low
* Moderate
* High
* Low
* Moderate
* Long term
* Medium
* Short term
Figure 7. 2: Port VAS Strategy Model (Source: Author)
Port Market
Exploration
Data Analysis
Step 2 Tailored practicability
assessment of VAS
VAS C
VAS B
Identification of potential
VAS
VAS A
Step 1
Yes
Consultation with port
users
Step 4
Develop VAS based on outcome of
viable parameters on VAS model
table
Step 3 Viable
economically? No
Postpone or
abandon

192
The port VAS model is based on ideas and results of this study concerning issues and
steps in offering VAS, and other factors such as VAS availability, importance, usage
and contracts. For example, it should be assessed whether the resource base to offer
„VAS A‟ is high, low or moderate. The stepwise model is further discussed below.
Step 1- Port market exploration & analysis: Port management should carry out an
exploration and analysis of the port market with a view to understanding the potential
needs of port users. For example, the availability or non-availability of various value-
adding services should be investigated at this stage.
Step 2 - Identification of value-adding services: Identification of specific potential
value-adding services (e.g advertisement support) for development follows, as
enabled by step (1) above and preliminary opinion sample of port users. In some
cases, potential value-adding services can be identified directly without rigorous port
market exploration and analysis (as illustrated by the dashed connecting line on figure
7.2). Identification of value-adding services that are entirely new in port business
would require more developmental attention.
Step 3 - Resource base assessment: Given the type of VAS in consideration, a
thorough assessment of resources needed to offer the service(s) should be carried out.
This allows for the port to take stock of both short and long term resource
requirements necessary for developing and offering of the VAS in question. Direct
and indirect benefits and the overall economic viability of the service(s) are assessed.
Assessment of the relevant port resource portfolio will help determine whether the
project should be taken to the next level, postponed or abandoned.
Step 4 - Consultation: Survey, followed by detailed consultation with port users
about the particular value-adding service (s) is the next necessary step. Based on the
outcomes of parameters on the VAS model table (7.10), at the consultation stage more
deliberation of the value-adding service(s) should take place, on which basis decision
to develop and offer service(s) might be reached. Note that parameters in the table
7.10 are issues of value-adding services as discussed in this study.

193
On both the port and port users‟ side, making necessary trade-offs is very important in
reaching decisions to develop and offer value-adding services. However, high level of
importance, consistent usage, availability of needed resource base and long term
contract are often positive indications for having a competitive offering of value-
adding service(s).
Some other guidelines/ tips for a worthwhile VAS strategy in ports are:
Source of synergy for core services
Non-competitive with core services
Means of clear differentiation
Could sometimes be stand alone
In addition to these characteristics, some other useful ideas gathered from port-user
respondents and port management interviews include that VAS should be financially
affordable and actually tailored to meeting customers‟ specific needs. Rather than a
summative end product, the model is only part of other previously discussed
outcomes of this research to evaluate and facilitate strategy formulation in ports by
value-adding services.
7.9 Summary
As an overall summary, this chapter provided opportunity for an in-depth examination
and discussion of very important research issues, such as, port management opinions
of value-adding services, evaluation of port selection criteria and value-adding
services potential in port strategy. Interview results with port management largely
supported the research proposition that „value-adding services can form a strong
means for competitive differentiation to attract port users‟. Also it was shown that
some of the areas of challenges and relevant resources necessary for the offering of
value-adding services include government and stakeholders‟ issues, securing long
term contract and land availability. Port location, cargo handling equipment, tidal
variations and skilled manpower correspondingly emerged as the top ranked port
selection criteria.

194
Based on interrelatedness, factor analysis supported the categorization of port
selection criteria into four groupings: port logistics operations facilitation,
administrative/management related facilitation, hinterland related attributes and port
fundamentals.
Based on ideas and discussions of results in this study, a new „Port VAS strategy
model‟ was developed as a stepwise guide for the evaluation and facilitation of value-
adding services strategy in ports. Value-adding services were found to have suitable
potential in the formulation of port strategy and can also provide needed platforms for
diversification of port business.
The evaluation of results from both chi-square and Fisher‟s tests, as supported by port
management opinions from interviews, provided the platform for accepting both set
propositions that „the patronage level to a port by port-users is associated with the
value-adding services obtainable from that port‟ and „the capacity of a port to retain
port-users is associated with the value-adding services obtainable from that port‟.
While the extent of offering value-adding services in Rotterdam and PD Teesport
ports was found to be at considerably high levels, it was largely between moderate
and considerable levels for Apapa and Damietta ports respectively.
The level of port users‟ value-adding services awareness was higher in Rotterdam and
PD Teeport ports than that of those in Damietta and Apapa. However, there was a
very adequate level of awareness necessary for consideration and development of
value-adding services strategy in all the ports.
195
Chapter 8 - Conclusions
8.1 Introduction
This research project was mainly founded on the aim to contribute to existing
knowledge in the maritime logistics area, primarily by examining the potential of
deploying value-adding services in port strategy development. Findings from the
review of literature showed there was a dearth of available empirical works that have
particularly investigated the competitive capacity of value-adding services in the
formulation of port strategy. Shortage of works in this topical area is believed to be
connected with the fact that value-adding services in ports and logistics is a newly
evolving subject, with many ports having businesses concentrated on traditional port
services. Hence, the development of models, useful to understanding and assessing
the capacity of value-adding services in port strategies became necessary to bridge
this knowledge gap. This necessitated the developments and contributions of this
study.
Because of the versatility of value-adding services, the research involved case study
ports situated in different geographical locations, which include Apapa (Nigeria) and
Damietta (Egypt) in developing economies, Rotterdam (The Netherlands) and PD
Teesport (United Kingdom) in developed economies. The multiple case study
approach adopted in this study was to support a robust understanding of value-adding
services as offered in ports of different regions and economies.
In essence, findings were based on results and inferences from data gathered through
a questionnaire survey of port-user companies, interviews with port management and
the literature, as analysed and discussed. As many ports experience unprecedented
competition, novel port value-adding services models have been developed in this
study to enhance understanding and facilitate informed decision making while
assessing the potential of value-adding services in competitive strategy of a port.
The aim of this chapter is to summarise all aspects of the findings in accordance with
the research aims as set out in section 1.3.2. Contributions of this research to existing
knowledge in the maritime logistics area are also discussed. Since the present research

196
is focused on the potential of value-adding services as an aggregate, as opposed to a
particular value-adding service, future research areas are proposed.
8.2 The Research Discussions
The goal to assess the capacity of value-adding services in a port‟s strategy
necessitated commencement of the research by an in-depth review of the literature.
Findings from the literature enabled the differentiation of „value-adding services‟
from other „value-added‟ inclinations (see section 2.8.1). As a way of reiteration,
value-adding services in the context of this research represent additional and
complementary services, which are different from the core services of a firm, as
discussed by Bowersox and Closs (1996) and Christopher (2005). With regards to
ports, value-adding services identified in this area are transport services, warehousing,
packaging, consultancy, advertisement support, assembly of cargo, canteen/catering,
cold storage and water supplies
Despite the popular view that the use of logistical value-adding services could be a
means to differentiate a firm for competitive advantage, findings in the literature
revealed a dearth of available documentation that have assessed this acclaimed
potential in the area of port strategy. Related important publications in this area
include Pettit and Beresford (2009), Ugboma et al. (2004), Bichou and Gray (2004).
However their respective assessments were concerned with several port
services/attributes and various port performance measurement criteria, which did not
allow for a holistic examination of value-adding services‟ worth in port strategy. As a
result of this scenario, this study was embarked upon. This study examined this
evolving area by particularly assessing the potential of value-adding services in the
strategy of ports.

197
8.3 Research Perspective & Methodology
Whereas ontology has to do with what is accepted to constitute reality in a given
research area, epistemology is concerned with fundamental assumptions that are to be
followed consistently in the development of knowledge. The epistemological and
ontological bases of this study took the critical realist approach to understanding
reality. The main reason for this approach was to enable the utilisation of a robust
research strategy, involving quantitative and qualitative, deductive and inductive,
objective and subjective methodologies.
The use of case studies while carrying out investigations has proved to be a veritable
means to achieve the set aims in research. Multiple case study ports were used in this
research in order to allow for an in-depth understanding of value-adding services. The
ports are Nigerian Apapa port and Egyptian Damietta port, which are both major ports
situated in developing economies, while The Netherlands‟ Rotterdam port and United
Kingdom‟s PD Teesport are leading ports situated in developed economies.
Surveying the opinions of a total of one hundred and eleven (111) managers and
senior personnel from port-user companies in the four case study ports formed the
principal source of primary data from the industry. The surveying method employed
validated semi-structured questionnaire. In addition, information from literature
review and interviews with port management of the case study ports supported the
triangulation of research data sources, contributing to elucidation of various issues on
value-adding services in port strategy.
8.4 Achievement of Research Aims and Objectives
On the basis of findings from the literature and the decision to use a case study ports
approach, as discussed, the research aims and objectives set out in chapter one
(section 1.32) gave directions for the study. The achievement of these research aims
and objectives are hereby summarised under headings and subheadings that follows.

198
8.5 Exploration and understanding of value-adding services concept
Exploration of the knowledge and perspectives of value-adding services concept is the
research aim number one. In achieving this aim, the study made a contribution to
knowledge by supporting understanding of the meaning of „service‟, while
distinguishing some fundamental features of „value-added‟ and „value-adding
services‟ concepts based on findings from the literature (see section 2.8).
Whereas it was found in the literature that „service‟ is the offer of an industrial sector
that does things as opposed to the making of things, it was further expounded in this
study (section 2.7) that there can be simple or multiple-constituent services based on
the processes involved in meeting customer requirements. On the other hand, while
the „value-added‟ terminology or concept was found to have been used to represent
varied issues such as incremental processes, cost to benefit outcomes and
management styles, „value-adding services‟ as used in this study, were distinguished
to represent supplementary or additional services, which complement the core offers
or services.
8.6 Deployment of value-adding services in ports of developing and developed
economies
Another important aspect of investigation in this study is concerned with examining
the manner and extent of deploying value-adding services in the different ports
situated in developing and developed economies. Findings as summarised in this
section mainly fulfil the research aim number 2 and partly number 1, and are
presented under the following headings:
8.6.1 Availability of value-adding services
Value-adding services were found to be available in all the case study ports. It is
expedient to observe that according to port users‟ opinions, value-adding services‟
availability was much more pronounced in the ports of the developed economies, than
was obtainable in the ports of the developing economies.

199
In the developing economies‟ ports, the services indicated to be available by most port
users in Damietta port and Apapa port are warehousing and water supplies services
respectively. For ports situated in the developed economies‟ ports of Rotterdam and
PD Teesport, transport service emerged as the most available, according to majority a
of port users.
Third party logistics (3PL) companies were found to be actively involved in the
provision of value-adding services. Findings showed that in some circumstances,
ports offer the services directly; and in others, ports outsource or provide the
necessary facilities for other companies to offer value-adding services. An excerpt
from an interview with port management, held that:
‘We will get involved in cargo handling activities where it makes sense, but it is
unlikely that ABP itself will get involved in the bolt-on activities, but we can make it
possible by providing land for some other companies to do that on the port’ (Business
Development Manager, ABP, Port of Hull).
Value-adding services, referred to in the statement as „bolt-on activities‟ are much
more likely to be offered by other companies in the port. This statement stands true
for many ports proactively involved in making value-adding services available to port
users by the use of third party logistics (3PL). Consequent upon the surging increase
in the operations of many ports as a result of gains in economy of scale by the use of
lager ships and gigantic superstructures, there has been a rise in 3PLs‟ hunt for
involvement in port value-adding services. Third party logistics companies‟
involvement in ports is expected to continue increasing as more ports choose to use
value-adding services in port‟s strategy.
8.6.2 The extent of deploying value-adding services in ports
Deployment of value-adding services was generally found to be higher in ports of the
developed economies than was the case for ports of the developing economies. In
effect therefore, the services are offered more readily in the case study ports of the
developed economies. For the ports of the developing economies, while value-adding
services emerged to be considerably offered in the Damietta Egyptian port, the
services are moderately offered in the Nigerian Apapa port. By implication, findings
200
thus showed there exists potential business opportunities in considering offering of
value-adding services in ports‟ strategies, particularly in the developing economies.
8.6.3 Awareness of value-adding services
Contrary to being decisive objection, high inertia by ports management and port-user
companies to respond to some innovations, for example in relation to value-adding
services, could be as a result of their level of awareness. In the Rotterdam port and
PD Teesport, it was found that the level of port users‟ awareness of value-adding
services was higher in comparison to those of the port users in the two developing
economies‟ ports.
An input from port management that is worth recalling held that:
‘‘….life itself is competitive. VAS is offered for competitiveness, to do better than
others, people tend to change to respond to different challenges’’ (Assistant Chief
Port Strategist, Apapa Port).
This statement reinforced the need for port management and port users to be willing
to make necessary changes, learn and embrace new trends as necessary. In this light
therefore, the originality of study is again seen in the area of raising the profile of
knowledge among port managers and port users about value-adding services in port
strategy. However, it was deemed important to emphasise that the level of port
practitioners‟ awareness of the services, as found in this study, was adequate for the
development of value-adding services in ports.
8.7 Evaluation of port users’ port selection criteria
Nineteen (19) port selection criteria as identified in this study were ranked by port
users according to their importance in deciding on which port to patronize. This is
particularly to fulfil research aim number 3 as outlined in section 1.3.2, which is
concerned with carrying out an investigative evaluation of rationales for port users‟
selection of ports. Among the selection criteria that emerged as most important for
port users‟ decision include port location, cargo handling equipment, tidal variations
and service quality.

201
Findings, through the process of factor analysis, showed that there are four principal
groupings of factors for consideration in port users‟ selection of ports. These are
namely port logistics operations facilitation, administrative/management related
facilitation, hinterland features and port fundamentals. Value-adding services emerged
in the middle of the ranking, showing that the services are of moderate importance in
port-users‟ port selection criteria.
Although value-adding services were not ranked in the very top amongst criteria for
selection of ports, the services were found to be integral parts of both „port logistics
operations facilitation‟ and „administrative/management related facilitation‟ factors.
This, therefore, indicated that value-adding services have versatile underlying
potentials. While these outcomes are supported by UNESCAP (2003), Bichou and
Gray (2004) suggestion that value-adding services have beneficial direction for the
port business, it contradicted Ugboma et al.‟s (2004) indications that the services
ranked low in port-service attributes.
8.8 Assessment of value-adding services’ competitiveness in port
The competitiveness of a particular service or group of services would greatly depend
on their usefulness as assessed by the customers, in this case port users who will
ultimately be the consumers of the services. Hence, the following subheadings present
port users‟ opinions of the services, channelled towards meeting research aim number
4, to assess the suitability of value-adding services as a means for ports
competitiveness.
8.9 Potential usage of value-adding services
Port users in the case study ports of the developing economies were predominantly
more enthusiastic about using most of the examined value-adding services than their
counterparts in the developed economies, if the services were provided by the ports.
An important observation in regards to this outcome was that value-adding services
have existed in ports of the developed economies for a relatively long period of time,

202
while the services are generally in early stages in the ports of the developing
economies.
In general, transport and warehousing services were rated as the most desired among
port users in ports of the developed economies. While technical support and transport
services emerged as most desired for the Egyptian port users; transport, technical
support and warehousing were correspondingly graded as the most desired services
for the Nigerian port users.
8.10 Importance of value-adding services
For the purpose of strategy, understanding the intrinsic importance of value-adding
services to port users‟ businesses is considered to be crucial. Findings showed that at
varying degrees, each of the ten identified key value-adding services received
substantial ranking of importance. Overall however, the most important value-adding
services according to results of data from port users are correspondingly transport
service, warehousing, water supplies and technical support. The least important
services to port users are advertising support and canteen/catering services.
Whereas assembly of cargo emerged to be the most important value-adding service
for port users in the Egyptian Damietta port, for their counterparts in the Nigerian
Apapa port, water supplies service was considered to be the most important. On the
other hand, port users in The Netherland‟s Rotterdam and United Kingdom‟s PD
Teesport ports identified transport service as the most important of all the value-
adding services.
A possible explanation for these results is the understanding that markets in the
developed economies have attained stages where speedy response to customers
demand for goods and services has become a crucial aspect for business success.
Hence, efficient transport services to the market have become very important for port
users. The QR (Quick Response) logistics concept, which advocates readily and
proactively meeting customers‟ needs as quickly as possible (Fernie and Sparks,
2004) further substantiates this view.

203
It might be pertinent to observe that hitherto, there has been neglect in ranking value-
adding services in ports, with a near non-existence of publications that have graded
these services according to importance. Hence, it is expected that findings from this
study concerning the importance of the different value-adding services in ports would
furnish both the academia and industry with invaluable insights on the importance
port users attach to these value-adding services.
8.11 Influences on port management in strategy formulation
In the contemporary port system, the pressures of short and long term business
development issues have made strategy formulation more and more complex. In an
attempt to fulfil research aim number 6, assessing and understanding the influences on
port management in strategy formulation was considered to be very important. As
gathered mainly from managers of case study ports in developing and developed
economies, among these influencing issues include legislation, availability of traffic
(cargo and vessel) for short and long term contracts, economic viability of projects,
competitors‟ influence, personnel, adequate land and space availability.
For many ports, the trend towards having a hub port or portcentric logistics status, has
led to an ever increasing pressure on the availability and management of land. Hence,
the formulation of port strategies is significantly affected by land resources, and this is
particularly considered as a challenge in the development and offering of value-
adding services in ports. In a related manner, the issue of land availability and usage
is interlinked with port location which in turn largely determines the hinterland of a
port.
Although other means are worth consideration in offering value-adding services in
ports, the constraints posed by limited land resource within a port‟s vicinity can be
solved by the use of dedicated areas offsite of the port, as in cases where dry-ports
have been developed. However, effective mechanisms should be put in place to
ensure there is a responsive integration between the port and value-adding services‟
areas, so as to facilitate smooth flow of materials and related information.

204
8.12 Employability of value-adding services in port’s strategy
Value-adding services have been shown in section 7.7 to possess significant prospects
as a competitive means of attracting and retaining port users to a port. This conclusion
was based on the opinions of customers (port users), who naturally are the
predominant stakeholders to be considered in the formulation of strategy. However, at
the moment there exist greater possibilities that value-adding services would be more
competitively productive in ports of the developing economies, than is the case for
those in the developed economies where the services have existed for some time.
Even in situations where value-adding services cannot be used for strong competitive
differentiation of ports, they were found to have the capacity to provide necessary
foundations for diversification of business for port authorities and port operators. It is
predicted that in the future there would be more and more ports leaving their shores to
acquire and manage ports in other nations, and as competition get more intensified,
diversification of services would increasingly be a necessary option for consideration.
However, it is crucial to state that apart from having certain prerequisite resources for
the development and deployment of value-adding services in ports, there were various
challenges discovered concerning offering of the services. These include the impact of
external influences (section 7.2), the ability to adequately tailor services to customers‟
needs and reaction or copying by competitors.
There is dynamism in the deployment of value-adding services as a strategy. Trends
in findings showed that over time, a diminishing effect tends to set in, whereby value-
adding services would be regarded as basic offers or services. Thus, port management
should always devise a means to sustain the desirability of value-adding services as
being unique and special to port users.
8.13 Research Propositions: Association of VAS to attraction & retention of port
users
Concerning the potential of value-adding services to attract and retain port users to a
port, the opinion of port users (in both developed and developing economies) showed
a significant yearning to use ports that, in addition to the core services, also offer
205
value-adding services. In this regards, the two propositions tested by data from port
users‟ opinions yielded results that formed the basis for the acceptance of the
propositions (refer to section 7.4). The first accepted is ‘the patronage level to a port
by port-users is associated with the value-adding services obtainable from that port’.
The second accepted is ‘the capacity of a port to retain port-users is associated with
the value-adding services obtainable from that port’.
Similarly, the majority of port managers and senior personnel (6 out of the 8)
indicated that value-adding services are both capable of attracting and retaining port
users in ports (see section 7.2). In recognition of value-adding services‟ capacity,
statements were made to the fact that the services are likened to an „idea- based‟ way
of business transaction. In this perspective, the implication is that ports must be
prepared to think outside the box of merely being traditional custodians of transit
cargoes, to becoming proactive generators of additional services that would impact
not just the cargoes, but also other areas of port users‟ businesses. Given these
outcomes, it was established that value-adding services have the capacity to attract
port users to a port and also to retain port users to continually use a port.
8.14 Port VAS Strategy Model
The first value-adding service model (section 2.9) provided a theoretical framework to
enable a clear understanding of a typical port‟s core traditional services and value-
adding services. The model will be useful in academia, as well as industry in getting
acquainted and understanding of port value-adding services. The second model „port
value-adding services model‟ (section 7.8) presented a stepwise guidance in making
informed decisions on the viability of offering value-adding services as means for
competitive strategy. While this is not merely a quantitative model, but allows for
reasonable experience based subjective input, some of the parameters worth assessing
are the importance of value-adding services to port users, availability of required
resources, usage frequency and duration of contract. These parameters could be low,
moderate or high, as presented in table 7.10. It is to be noted that this study examined
these parameters. If the parameters tend to be high in a given assessment, then there is
a positive indication to the offering of that particular value-adding service in question.

206
8.15 Evaluation of Research
A critical realist approach to understanding reality was adopted, involving
both quantitative and qualitative research strategies.
Data by which models were built and the models themselves were validated by
computational techniques and experts in both the port industry and academia.
It is however important to note that the models should be used with a level of
flexibility that will allow for the input of experience.
Findings were based on successful engagement of ports, particularly the four
(4) case study ports as discussed in the research. Whilst these ports represent a
wide range of global ports and findings can be applicable to other ports, if
more case study ports were used, it is expected that only a negligible change
will be obtained. Processes leading to changes should be subjected to
evaluation.
Outcomes based on these case study ports can also be adopted by other ports
in strategy formulation. This is because findings from this study are consistent
with Bowersox and Closs (1996) and Christopher (2005) views on the
potential of value-adding services in a firm and also supported by few other
studies (e.g. UNCTAD,1992; Anderson et al., 2008; Bichou and Gray, 2004,
UNESCAP, 2003) that have acknowledged value-adding services and other
wide-ranging issues in ports.
8.16 Research Contributions to knowledge
Theoretical port value-adding services model developed in this study
presented a platform for easy comprehension of typical port‟s core services
and value-adding services. The model serves to enhance learning in
maritime logistics area both in the academia and industry. It also provided
a foundation upon which future customised value-adding services can be
built.
The „Port VAS Model‟ is a stepwise practical model, useful as a guide for
both port authorities and port users in facilitating objective assessment and
consideration of value-adding services in port‟s competitive strategy.

207
Focused empirical examination has been given to understanding the
potential of logistics‟ value-adding services concept in making and
keeping ports strategically competitive.
Key value-adding services in port logistics have been identified and ranked
according to importance by service users. Thus, outcomes provided
veritable insights, useful in determining services to deploy in strategy per
time.
8.17 Study Limitation and Further Research Opportunities
One limitation of the study is that though there are other means of gaining
competitive strategy, it focused only on the use of value-adding services. Also the
investigation covered examination of the potential of value-adding services as an
aggregate. As a result, foreseeable areas of further research include:
I. To carry out discrete (i.e. per service) further investigations for particular
value-adding service (s) of interest, with the view of implementing the
same in ports and other business areas of the maritime sector.
II. To examine the impacts of the presence or absence of value-adding
services in a port on the operations of various supply chain segments (e.g.
the sea leg transportation, destination ports, DCs, 3PL‟s business,
customers and consumers).
III. To investigate – „The Role of value-adding services in a port‟s capture
and development of Hinterlands for traffic sustainability‟.
IV. In relation to maritime port industry, investigation can be carried out to
compare how value-adding services can contribute to the strategies of
different other modes of transport (rail, land and air). It is known that
these other modes have greatly competed for maritime transport bound
cargoes and traffic.
Thus it is particularly important to continually carry out research in this area
because of:
The dynamism in strategy requirements.
There are no definite list of value-adding services, but are based on
innovation

208
References
Aaker D., Kumar V. and Day G. (2001) Marketing Research, 7th ed. USA: John
Wiley & Sons.
Abel A., Bernanke B., and Croushore D. (2008) Macroeconomics, 6th ed. USA:
Pearson Education Inc.
Ainsworth, S. (1992) The Impact of Information Technology on Warehouse
Operations, Cardiff: University of Cardiff.
Alizadeh A. and Nomikos N. (2009) Shipping Derivatives and Risk Management,
Great Britain: Palgrave Macmillan.
Analytiqa, (2007) Portcentric logistics- the supply chain of the future, [Online]
available at <www.analytiqa.com>, [Accessed on 15th
October, 2008].
Anderson, C., Park, Y., Chang, Y., Yang, C., Lee, T., Luo, M. (2008) „A Game-
Theoretic Analysis of Competition among hub ports: The Case of Busan and
Shanghai‟ Maritime Policy Management, vol. 35, (1) pp. 5-26.
APC, (2001) Amsterdam Port Consultants Introduction, [Online] Available at
<http://amsterdamportconsultants.com/smartsite9560.dws>, [Accessed 15th August,
2007].
ABP-Associated British Port (2007) Ports Handbook 2007: The UK’s number one
ports operator, United Kingdom: Associated British Port
Au, K. and Ho, D. (2002) „Electronic commerce and supply chain management:
Value- adding services for clothing manufacturers‟, Integrated manufacturing system,
vol. 13,(4) pp. 247-254
Bamford, C. (2006) Transport Economics, 4th ed. United Kingdom: Heinemann
Educational Publishers.
Bamford, D. and Forester, P. (2003) „Managing Planned and Emergent Change within
an Operations Management Environment‟, International Journal of Operations and
Production Management, vol. 23, (5) pp. 546-564
Baird, A. (2002) „Privatisation Trends at the World‟s top 100 Container Ports‟,
Maritime Policy and Management, vol. 29, (3) pp. 271-284
Bichou, K. and Gray, R. (2004) „A logistics and Supply Chain Management approach
to port performance measure‟, Maritime policy management, vol. 31, (1) pp. 47-67
Booth, C. (2003) „Does history matter in strategy? The possibilities and problems of
counterfactual analysis‟, Management Decision, vol. 41, (1) pp. 96-104

209
Bowersox, D., Closs, D., and Cooper, B. (2007) Supply chain Logistics management
2nd
ed., Singapore: McGraw-Hill Inc.
Bowersox, D. and Closs, D. (1996) Logistical Management- the integrated supply
chain process, Singapore: McGraw-Hill companies Inc.
Boyer, K. and Swink, M. (2008) „Empirical elephants-why multiple methods are
essential to quality research in operations and supply chain management‟, Journal of
Operations Management, vol. 26, (3) pp. 337–348.
Branch, A. (1977) The Elements of Shipping, England: Chapman and Hall.
Brassington, F. and Pettitt, S. (2007) Essentials of Marketing, 2nd ed. England:
Pearson Education Ltd.
Brooks, M. and Pallis, A. (2008) „Assessing Port Performance Models: Process and
Performance Components‟, Maritime Management Policy, vol. 35, (4) pp. 411-432.
Broonmell, S. and Budescu, D. (2009) „Why are experts correlated? Decomposing
Correlations between Judges‟, Psychometrika, vol. 74, (3) pp.531-553.
Brown, R. (2006) Doing Your Dissertation in Business and Management: The Reality
of Researching and Writing, London: Sage Publications.
Bruns, W. (1989) „A Review of Robert K. Yin‟s Case Study Research: Design and
Methods‟, Journal of Management Accounting Research, fall89, vol. 1, p. 157
Bryman, A. and Bell, E. (2007) Business Research Methods, 2nd ed. New York:
Oxford Press.
Cameron, S. and Price, D. (2009) Business Research Methods: A Practical Approach,
London: Chartered Institute of Personnel and Development.
Carbon, V. and Martino, M. (2003) „The Changing Role of Ports in Supply Chain
Management: An Empirical Analysis‟, Maritime Policy Management, vol. 30, (3) pp.
305-320
Cargo System (2009) The top 100 container ports by ranking, [Online], Available at
<www.cargosystem>, [Accessed on 30th
November 2009]
Carrier, C., Raymond, L. and Etaief, A. (2004) Cyberentrepreneurship: A multiple
Case study, International Journal of Entrepreneurial Behaviour and Research, vol.
10, (5) pp. 349-363
CCICED (2000) Improve outer packaging of export goods for sustainable growth of
china’s foreign trade, China ,4th
meeting of the 2nd
phase Chinese Academy of
International for Trade and Economic Development (CCICED), [Online] Available at
<http://www.iisd.org/pdf/cciced_packaging_exports_aug00.pdf>, [Accessed 12th
August, 2007].
210
Citen, C., and Cerit, A. (2010) „Organisational Effectiveness at Seaports: a Systems
Approach‟, Maritime Policy Management, vol. 37, (3) pp. 195-219.
Chan J., Burns N., and Yung, K. (2000) „Environmental –Strategy fit: a study of Hong
Kong manufacturing logistics‟ Logistics information management, vol. 13, (5) pp.
286-300.
Cheon, S. (2009) „Impact of Global Terminal Operators on Port Efficiency: A Tiered
Data Envelopment Analysis Approach‟, International journal of Logistics: Research
and Application, vol. 12, (2) pp. 85-101.
Chernatony, L and Harris, F. (2000) „Added Value: It Nature, Roles and
Sustainability‟, European Journal of Marketing, vol. 34, (1/2), pp. 39-56.
Chisnall, P. (2001) Marketing Research, England: McGraw-Hill Publishing
Company.
Christopher, M., Payne, A., Ballantyne, D. (2002) Relationship Marketing: Creating
Stakeholders Value, Oxford: Butterworth-Heinemann.
Christopher, M. (2005) Logistics and Supply chain management – creating value-
adding networks, 3rd ed. Great Britain: Pearson education limited.
Churchill, G. (2001) Basic Marketing Research, 4th ed. Orlando: Harcourt Inc.
Cicourel, A. (1964) Method and Measurement in Sociology, in Bryman, A. and Bell,
E. (2007) Business Research Methods, 2nd ed., New York: Oxford Press.
CILT (2009) „New Combined qualification for logistics and medical supply chain
professionals‟, Logistics & Transport Focus, Oct.,2009, vol. 11, (10) pp. 16-16
Commercial Motor (2004) ‘Untitled‟, Commercial Motor, February 26. p.7
Commission of the European Union (CEU) (2004) „Proposal for a Directive of the
European Council and the European Parliament on market access to port services‟,
Com (2004) final, October 13. p. 654.
Cooper, D. and Schindler, P. (2006) Business Research Methods, 9th ed. Singapore:
McGraw-Hill.
Cousin, G. (2005) 'Case Study Research', Journal of Geography in Higher Education,
vol. 29, (3) pp. 421-427
Crimp, M. and Wright, L. (1995) The Marketing Research Process, 4th ed.
Hertfordshire: Prentice Hall

211
Cudahy, B. (2006) The Containership Revolution, Transport Research Board of the
National Academies: Washington D. C [Online], Available at
<http://www.worldshipping.org/pdf/container_ship_revolution.pdf>, [Accessed on
20th
April, 2008].
Cullinane, K. and Song, D. (2002) „Port Privatisation Policy and Practice‟, Transport
Reviews, vol. 22, (1) pp. 55-75
.
Cullinane, K., and Talley, W. (2006) „Port Economics‟, Research Transportation
Economics, vol. 16, pp. 1-10.
Dadzie, K. (1998) „The transfer of Logistics Knowledge to third World Countries‟,
International Journal of Physical Distribution and Logistics Management, vol. 28, (4)
pp. 272-283.
Damietta Port Authority (2009) Damietta Port [Online], Available < http://damietta-
port.gov.eg/englishsite/ > [Accessed 1st October, 2009].
Dawson, M. (2003) „Developing Consultancy skills for Experienced HR specialist at
Shell Peoples Services‟, Human Resource Management International Digest, vol. 11,
(1) pp. 40-42.
Department for Transport (2009) Background to the UK port industry: Focus on ports
[Online], Available at
<http://www.dft.gov.uk/adobepdf/162469/221412/221658/223704/223710/focusonpo
rts2000edition> [Accessed on 17th
August, 2009].
Department for Transport (2006) National Statistics: Focus on Ports; New York:
Palgrave Macmillan.
Dillon, W., Madden, T. and Firtle, N. (1994) Marketing Research in a Marketing
Environment, 3rd
ed. USA: Richard D Irwin Inc.
Dinwoodie, J. (2000) Management Careers and Education in Shipping and Logistics,
England: Ashgate Publishing Company.
Dinwoodie, J. and Xu, J. (2008) „Case Studies in Logistics: A Review and Tentative
Taxonomy‟, International Journal of Logistics Research and Applications, vol. 11,
no. 5, pp. 393-408.
Doonslaar, P. and Kolkman, J. (2010) „Societal Costs and Benefits of Cooperation
between Port Authorities‟, Maritime Policy Management, vol.37, (3) pp. 271-284.
Doyle, P. (2008) Value-Based Marketing: Marketing Strategies for Corporate Growth
and Shareholder Value, England: John Wiley and Sons Ltd.
Ducruet, C., Lee, S., and NG, A. (2010) Centrality and Vulnerability of Ship liner
Shipping Network: Revisiting the Northeast Asian Hierarchy, Maritime Policy
Management, vol. 37, (1) pp. 17-36.

212
Dyer, R. (1997) „Customer Life Time Valuation to Support Marketing Decision
Making‟, Journal of Direct Marketing, vol. 11, (4), pp. 6-13
Easternby-Smith, M., Thorpe, R. and Jackson, P. (2008) Management Research, 3rd
ed. London: Sage Publications Ltd
Edvardsson, B. (1992) „Service breakdowns: a study of critical incidents in an airline‟
International Journal of Service Industry Management, vol. 3, (4) pp.17-29.
Edvardsson, B. and Olsson (1996) „Key Concepts for service development‟, The
Service Industries Journal, vol. 16, (2) pp. 140-160.
Egyptian Maritime Data Bank (2009) Suez Canal [Online] Available at
<http://www.emdb.gov.eg/english/inside_e.aspx?main=suezcanal&level1=totals>,
[Accessed on 28th
December, 2009].
Egyptian Maritime Data Bank (2007) Damietta Port [Online] Available at
<http://www.emdb.gov.eg/english/inside_e.aspx?main=ports&level1=commercial&le
vel2=damietta&level3=map >, [Accessed on 27th
August, 2009].
Emory, C. and Cooper, D. (1991) Business Research Methods, 4th ed. USA: Richard
D. Irwin, Inc.
Fernie, J. and Sparks, L. (2004) Logistics and Retail Management: Insights into
practice and trends from leading Experts, 2nd ed. London: Kogan page Ltd.
Fetherston, J. (1984) Understanding the Freight Business, London: Thomas Meadow
and Company Ltd.
Field, A. (2009) Discovering Statistics – using SPSS, 3rd ed. London: Sage.
Fink, A. (2003) The Survey Handbook, 2nd ed. California: Thousand Oaks.
Fletcher, D. and Hardill, I. (1995) „Value- adding Competitive Strategies: A
comparison of Clothing SMEs Case Studies in France and Great Britain‟,
International Small Business Journal, vol. 14, (1), pp. 33-52.
Frankel, E. (1989) „Strategic planning applied to shipping and ports‟, Maritime Policy
and Management, vol.16, (2) pp. 123-132.
Galetzka, M., Verhoeven, J., Pruyn, A. (2006) „Service Validity and Service
reliability of search, experience and credence services: A scenario study‟,
International Journal of Service Industry Management, vol. 17, (3), pp. 271-283.
Gattorna, J. (2003) Handbook of supply chain management, Gower Publishing,
England.
Goss, R. (1990) „Economic Policies and Seaports: 4 Strategies for Port Authorities‟,
Maritime Policy Management, vol. 17, (4) pp. 273-287.

213
Grant, R. (2010) Contemporary Strategy Analysis 7th ed. United Kingdom: John
Wiley and Sons ltd.
Green, P., Tull, D. and Albaum, G. (1988) Research for Marketing Decisions, 4th ed.
New Jersey: Prentice-Hill Inc.
Gronroos, C. (1990) Service Management and Marketing, Massachusetts: Lexington
Books.
Gulliksen, H. (1945) „The Relation of item difficulty and Inter-item Correlation to
Test Variance and Reliability‟, Psychometrika, vol. 10 (2) pp. 79-91
Gummesson, E. (2000) Qualitative Methods in Management Research, 2nd ed.
California: Sage Publications Inc.
Haezendonck, E. and Winkelmans, W. (2002) Strategic Positioning as an Instrument
for Competition Analysis in: Huybrechts, M; Meersman, H; Van de Voorde, E; Van
Hooydonk, E; Verbeke, A. and Winkelmans, W. (Eds.) Port Competitiveness: An
Economic and Legal Analysis of the Factors Determining the Competitiveness of
Seaports, pp. 67–87 (Antwerp: De Boeck).
Haezendonck, E. Coeck, C. and Verbeke, A. (2000) „The Competitive Position of
Seaports: Introduction of the Value Added Concept‟, International Journal of
Maritime Economics, vol. 2, (2) pp. 107-118.
Haezendonck, E. and Notteboom, T. (2002) The competitive advantage of seaports; in
Huybrechts M, Meersman H, Van de Voorde E, Van H. E, Verbeke A, and
Winkelmans, W. (eds.) Port Competitiveness: An economic and legal analysis of the
factors determining the competitiveness of seaports; Antwerp: De Boeck Ltd.
Hardy, M. and Bryman, A. (2009) Handbook of Data Analysis, London: Sage.
Hague, P., Hague, N., and Morgan, C. (2006) Market Research in Practice: A Guide
to the Basics, London: Kogan Page Limited.
Haralambides, H. (1997) Ports in the Framework of the EU Transport Policy, Centre
of Maritime Economics and Logistics (MEL), Rotterdam: University of Erasmus
[Online], Available at
<http://www.maritimeeconomics.com/downloads/papers/HH_GP_FINAL.pdf>
[Accessed June 26th, 2007].
Haralambides, H., Ma, S., Veenstra, A. (1997) Worldwide Experiences of Port
Reforms, In Meersman, H. and Voorde, E. (eds.) Transforming the port and
Transportation Business, Leueven: Acco Publishing. [Online] Available at
<http://www.maritimeeconomics.com/downloads/papers/HH_WORLDWIDE%20EX
P%20OF%20PORT%20REFORM%20ANTWERP.pdf > [Accessed June 16th 2007].

214
Healey, M. and Rawlinson, M. (1994) Interviewing Techniques in Business and
Management, in Wass V.J and Wells P.E (eds.), Principle and Practice in Business
and Management Research, Dartmouth: Aldershot.
Heaver, T. (2006) „The Evolution and Challenges of Port Economics‟, Research in
Transport Economics, vol. 16, pp. 11-41.
Hill, C. and Jones, G. (2007) Strategic Management: An integrated Approach, 7th ed,
New York: Houghton Mifflin Company.
Hofstee, E. (2006) Constructing a Good Literature Review: A Practical Guide to
Completing a Master’s, MBA or PhD on Schedule, [Online] Available at
<www.exactica.co.za>, [Accessed 3rd October, 2010].
Hooley, N., Piercy, N. and Nicoulaud, B. (2008) Marketing Strategy and Competitive
Positioning, 4th ed. England: Pearson Education Ltd.
Hoyle, B. and Charlier, J. (1995) „Inter-port Competition in Developing Countries:
An East African Case Study‟, Journal of Transport Geography, vol. 3. (2), pp. 87-
103.
Hoyle, B. and Hilling D, eds. (1970) Seaports and Development in Tropical Africa,
Great Britain: Macmillan.
Hutcheson, G. and Sofroniou, N. (1999) The Multivariate Social Scientist, London:
Sage.
Institute of Chartered Shipbrokers-ICS (2007) Port and Terminal Management,
England: Witherbys Publishing Ltd.
Ircha, M. (2001) Port Strategic Planning: Canadian Port Reform, Maritime Policy
Management, vol. 28, (2) pp. 125-140
Itami, H. (1987) Mobilising Invisible Assets, Cambridge: Harvard University press.
Jansson, J. and Shneerson, D. (1982) Port economics, Cambridge, Massachusetts and
London: The MIT Press.
Jeannet, J. and Hennessey, H. (1998) Global Marketing Strategies, 4th ed. USA:
Houghton Mifflin Company.
Jenkinson, A. (1995) Valuing Your Customers: From Quality Information to Quality
Relationship through Database Marketing, England: McGraw Hill Book Company.
Johns, N. (1999) „What is this thing called service?‟, European Journal of Marketing,
vol. 33, (9/10) pp. 958-973.
Johnson, G., Scholes, K., Whittington, R. (2008) Exploring Corporate strategy, 8th
ed. England: Pearson Education.

215
Johnson, G., Scholes, K., Whittington, R. (2005) Exploring Corporate strategy, 7th
ed. England: Pearson Education.
Johnson, P., Cassell C., Close P., and Duberley, J. (2001) „Performance evaluation
and control: supporting organisational change‟, Management Decision, vol. 39, (10),
pp. 841-850
Kahn, R., Cannell C. (1957) The Dynamics of Interviewing, New York: John Wiley
and Sons.
Karolefski, J. (2007) „Third party logistics: Coping with Today‟s Warehousing
Challenges‟, Food Logistics, (99), pp.18-22
Kenny, J. (2006) Strategy and the Learning Organisation: a maturity model for the
formation of strategy, The Learning Organisation vol.13 (4) pp. 353-368.
Kervin, J. (1992) Methods for Business Research, USA: HarperCollins Publishers Inc.
Kruck, C. and Julian, B. (2007) „Port and Maritime Transport Issues and Views‟,
World Bank, March 2007.
Lambin, J. (1997) Strategic Marketing Management, England: McGraw-Hill
Publishing Company.
Langen, P. and Pallis, A. (2007) Analysis of the benefits of intra-port competition,
Science Commons [Online] Available at < http://en.scientificcommons.org/995167>
[Accessed on 15th
November, 2010].
Lee, N. and Lings, I. (2008) Doing Business Research: A guide to Theory and
Practice, London: Sage Publications Ltd.
Lipczynski, J. and Wilson, J. (2004) The Economics of business strategy, England:
Pearson Education Limited.
Lobo, A. and Jain, V. (2002) „„Port Users‟ perspective of container transhipment
business: hierarchy of service attributes and dimensions‟, Singapore Maritime and
Port journal, pp 154-161.
Lopez-Fernandez, M., Serrano-Bedia, A., Garcia-Piqueres, G. (2008)‟Exploring
determinants of company-university R&D collaboration in Spain (A contrast between
manufacturing and service sectors)‟, Journal of manufacturing technology
management, vol. 19, (3) pp. 361-373.
Lowe, D. (2005) Intermodal Freight Transport, Oxford: Elsevier Ltd.
Lunn, T., Blamires, C., and Seaman, D. (1986) Market Modelling, in Worcester, R.,
and Downham, J., eds. Consumer Market Research Handbook, 3rd ed. London:
McGraw-Hill Book Company.

216
Ma, H. (2004) „Toward Global Competitive Advantage: Creation, Competition,
Cooperation and Co-Option‟, Management Decision, vol. 42, (7) pp. 907-924.
Malhotra, N. (2010) Marketing Research: An Applied Orientation, 6th ed. New
Jersey: Prentice Hall Inc.
Malhotra, N. (1999) Marketing research: An Applied Orientation, 3rd ed. New
Jersey: Prentice Hall Inc.
Mangan, J., Lalwani, C. and Fynes, B. (2008) „Port-Centric Logistics‟, The
International Journal of Logistics Management, vol. 19, (1), pp. 29-41
Maritime and Port Authority of Singapore –MPA (n.d) Singapore an International
Maritime Centre: A strategic Centre for Maritime Business, [Online] Available at
< http://www.mpa.gov.sg/sites/pdf/infokit4.pdf> [Accessed 13th
August, 2010].
Martin, J. and Thomas, B. (2001) „The Container Terminal Community‟, Maritime
Policy Management, vol. 28, (3) pp. 279-292.
Martino, M. and Morvillo, A. (2008) „Activities, Resources and Inter-organisational
Relationship: Key Factors in Port Competitiveness‟, Maritime Policy Management,
vol. 35, (6) pp. 571-589.
Mascio, R. (2007) „A Method to evaluate service delivery process quality‟,
International Journal of Service Industry Management, vol. 18, (4) pp. 418-442.
Mattsson, J., Ramaseshan, R., and Carson, D. (2006) „Let Marketers Reclaim
Corporate Strategy‟, Journal of Strategic Marketing, vol. 14, pp. 165-173.
Maylor, H. and Blackmon, K. (2005) Researching Business and Management, New
York: Palgrave Macmillan.
MBD (2008) „Freight forwarding (Industrial Report)‟, MINTEL, May, 2008.
McDaniel, C. and Gates, R. (1998) Marketing Research Essentials, 2nd, Ohio: South-
Western College, Publishing.
McDonald, C. and King, S. (1996) Sampling the Universe, United Kingdom: NTC
Publication Ltd.
McGivern, Y. (2009) The Practice of Market Research, 3rd ed. England: Pearson
Education Limited.
Miles, R. and Snow, C. (1984) „Fit, Failure and the Hall of Fame‟, California
Management Review, vol. 26, (3) pp.10-28.
Mintzberg, H. (2007) Tracking Strategies: Toward a General Theory, Great Britain:
Oxford Press.

217
Mintzberg, H. (1994) The Rise and Fall of Strategic Planning, New York: Free Press.
Morvillo, A. (2002) Trends in Logistics and Freight Transport in Italy: Implications
on Training Needs, in Ferrara and Morvillo, eds., Training in Logistics and the
Freight Industry: The Experience of the European Project ADAPT-FIT, England:
Ashgate Publishing Company.
Murphy, P. and Daley, J. (2001) „Profiling International Freight Forwarders: Update‟,
International Journal of Physical Distribution and Logistics Management, vol. 31, (3)
pp. 152-168.
Murphy, P., Dalenberg, D. and Daley, J. (1989) „Assessing International Ports
Operation‟, International Journal of Physical Distribution and Logistics
Management, vol. 19, (9) pp. 3-10.
Neil, F. (2004) „Ports Head for Privatisation‟, African Business, June, (299) pp. 52-53.
Nettle, A. (1988) Ports Operations and Shipping: A Guide to Ports and Related
Aspects of the Shipping Industry, Great Britain: Lloyd‟s of London Press Ltd.
NFDC (2001) Port Development Proposal at Dibden Bay: Further Assessment,
[Online] Available at <http://www.nfdc.gov.uk/committeedocs/pdcc/NFR10903.pdf>,
[Accessed 21st August, 2007].
Nigerian Ports Authority (2007) Nigerian Ports Authority [Online], Available at
<http://www.nigerianports.org/default.aspx >, [Accessed 24th of August 2009].
Nigerian Ports Authority (2006) Lagos Port Complex: 2006 Annual Report, Nigeria:
Realm Communication Ltd.
NPA (2003) Nigerian Ports Authority: Services, [Online], Available at
< http://www.nigerian-ports.net/flash/services/facilities.html> [Accessed 12th August,
2007].
Oyibosonline (2007) FG Decongests Apapa Petroleum Depot, [Online] Available at
<http://www.oyibosonline.com/cgi-bin/newsscript.pl?record=1669> [Accessed 5th
November, 2010].
Parasuraman, A. (1991) Marketing Research, 2nd ed., Massachusetts: Addison-
Wesley Publishing Company.
Parola, F. and Musso, E. (2007), „Market Structures and Competitive Strategies: The
Carrier-Stevedore Arm-wrestling in Northern European Ports‟ Maritime Policy
Management, vol. 34, pp. 259-278
PD Ports (2008) PD Ports, part of the Babcock & Brown Infrastructure Group
[Online], Available at <http://www.pdports.co.uk/>, [Accessed 14th
of August,
2009].

218
PD Teesport and Hartlepool (2008) PD Teesport and Hartlepool Handbook,
Opportunity knocks for the northern port community, United Kingdom: PD ports.
Pettit, S. and Beresford, A. (2009) „Port Developments from port gateways to hubs‟,
Maritime Policy Management, vol. 36, (3) pp. 253-267.
Pfeffer, J. and Salancik, G. (1978) The External Control of Organisations: A
Resource Dependence Perspective, New York: Harper & Row.
PKZ (2006) Port Klang Free Zone, [Online] Available at <http://www.pkfz.com/ >
[Accessed 20th August, 2007].
Port of Rotterdam (2005) Annual Report 2004: The Port of Rotterdam is Developing
the Definitive World Class Port Together with its Partners [Online] Available at <
http://www.portofrotterdam.com/mmfiles/annualreport2004UK_tcm26-9533_tcm26-
10545.pdf> [Accessed on 27th
December, 2009].
Port of Rotterdam Authority (2007) Facts and figures on Rotterdam’s Oil and
Chemical Industry, Netherlands: Port of Rotterdam.
Port of Rotterdam Authority (2009a) Port of Rotterdam: Rotterdam your world-class
Port [ONLINE], available at < http://www.portofrotterdam.com/en/home/> Accessed
on 21st December, 2009.
Port of Rotterdam Authority (2009b) Port Statistics, Netherlands: Port of Rotterdam.
Port of Tyne (2006) „Port of Tyne and the Riverside Renaissance: Making a
difference‟, The Journal, Friday December 8.
Porter, M. (1986) Competitive Advantage, New York: The Free Press.
Porter, M. (1985) The Value Chain and Competitive Advantage, New York: The Free
Press.
Porter, M. (1980) Competitive Strategy: Techniques for Analysing Industries and
Competitors, New York: The Free Press.
Powell, T. (2001) „Competitive advantage: Logical and philosophical considerations‟,
Strategic Management Journal, vol. 22, pp. 875- 888.
Proctor, T. (2005) Essentials of Marketing Research, 4th ed. England: Pearson
Education Limited.
Robinson, C. (1993) Real World Research, Oxford: Blackwell.
Rodrigue, J. and Notteboom, T. (2006), Challenges in the Maritime-Land Interface:
Port Hinterlands and Regionalization, Report prepared for the Korean Government,
Ministry of Maritime Affairs & Fisheries, The Master Development Plan for Port
Logistics Parks in Korea, [Online] Available at < www.hofstra.edu> [Accessed 3rd
August, 2010].

219
Rogers, T. (1976) „Interviews by Telephone and in Person: Quality of Responses and
Field Performance‟, Public Opinion Quarterly, vol. 40, (1) pp. 51-76.
Saunders, M., Lewis, P., Thornwill, A. (2007) Research Methods for Business
Students, 4th ed. England: Pearson education.
Schmidt, M. and Hollensen, S. (2006) Marketing Research: An International
Approach, England: Pearson Education Limited.
Selltiz, C., Marie, J., Morton, D. and Stuart, C. (1959) Research Methods in Social
Relations, in Baker, M. (1991) Research for Marketing, London: Macmillan
Education Ltd.
Shashikumar, N. (1998) „The Indian Port Privatisation Model: A Critique‟,
Transportation Journal, vol. 33. pp. 35-48.
Slack, N., Chambers, S., Johnson, R. (2007) Operations management, 5th ed.
England: Pearson Education Limited.
Song, D. and Lee, P. (2009) „Maritime Logistics in the Global Supply Chain‟,
International Journal of Logistics Research and Applications, vol.12, (2) pp. 83-84.
Soppe, M; Parola, F. and Fremon, A. (2009) „Emerging inter-industry partnerships
between shipping lines and Stevedores: from Rivalry to Cooperation?‟, Journal of
Transport Geography vol. 17, pp 10–20.
Stopford, M. (2009) Maritime Economics, 3rd ed. Great Britain: Routledge.
Stutely, M. (2003) Number guide: The Essentials of Business Numeracy, London:
Bloomberg Press.
Sweet, S. and Grace-Martin K. (2008) Data Analysis with SPSS: A first course in
Applied Statistics, 3rd ed. United States of America: Pearson Education.
Talley, W. (2006) „An Economic Theory of the Port‟, Research in Transport
Economics, vol. 16, pp. 43-65.
The Economist (2009) „Thriving on adversity‟, Economist, March, 10, vol. 392,
(8651) pp. 82-82.
The WORLD BANK (2007) Port Reform Toolkit, 2nd ed. The Evolution of Ports in a
Competitive World, Module 2; Washington: World Bank.
Thiemeryer, T. (1986) „Privatisation: on the many Senses in which this Word is used
in International discussion on Economic Theory‟, in Cullinane, K. and Song, D.
(2002) Port Privatisation Policy and Practice, Transport Reviews, vol. 22, (1) pp. 55-
75.

220
Tongzon, J. and Heng, W. (2005) „Port Privatisation, Efficiency and Competitiveness:
Some Empirical Evidence from Container Ports (Terminals), Transportation
Research, Part A 39, pp. 405-424.
Tsamboulas, D. (2008) Hinterland Connections of Seaports: The Role of Seaports As
A Link Between Inland and Maritime Transport, Paper Presented in UN Conference,
17th-18th September, 2008, Piraeus, Greece; [Online] Available at
<http://www.unece.org/trans/doc/2008/wp5/GE1_Piraeus_Item2_Tsamboulas.pdf>
[Accessed 3rd August, 2010].
Ugboma, C. and Ugoma, O. (2004) „Port Users’ Perception and Expectation of
Service Quality Attributes and Dimensions in Ports Of a Developing Economy- A
Case Study’ Journal of research in National Development, vol. 2, (2) pp. 23- 34.
Ugboma, C., Ibe, C., and Ugwude, I. (2004) „Service quality measurements in ports of
a developing economy: Nigerian ports survey‟, Managing Service Quality, vol.14, (6)
pp.487-495.
UNCTAD (1993) Legal aspect of port management, UNCTAD/SHIP/639; United
Nations Conference on Trade and Development [Online] Available at
<http://www.unctad.org/en/docs/poshipd639.en.pdf>, [Accessed 11th August 2008].
UNCTAD (1992) Port Marketing and the Challenge of the third Generation Ports,
TD/B/C.4/AC.7/14, Geneva, Available at <http://r0.unctad.org/ttl/ttl-docs-titles.htm>
[Accessed 14th October, 2010].
UNESCAP (2003) Commercial Development of Regional Ports as Logistics Centres,
New York: UNITED NATIONS.
Van-Raaji, W. and Pruyn, A. (1998) „Customer Control and Evaluation of Service and
Reliability‟, Journal of Psychology and Marketing, vol. 15, pp. 811-832.
Vellecco, I. (2002) Education and Training Provision in the Field of Logistics and
Transport in Italy, in Ferrara and Morvillo, eds., Training in Logistics and the Freight
Industry: The Experience of the European Project ADAPT-FIT, England: Ashgate
Publishing Company.
Voorde, E. and Winkelmans, W. (2002) A General Introduction to Port Competition
and Management, in Huybrechts M, Meersman H, Voorde E, Hooydonk E, Verbeke
A, Winkelmans (eds.), Port Competitiveness: An Economic And Legal Analysis Of
Determining The Competitiveness Of Seaports, Anterp: De Boeck Ltd.
Wall, G. (2007) „Heading for the Coast: is Port-Centric Logistics the Way Forward‟,
Focus, October, pp. 42-44.
Walters, D., Holladay, M. and Glaser, S. (2002) „Added Value, Enterprise and
Competitive Advantage‟, Management Decision, vol. 40, (9), pp. 823-833.

221
Whittington, R., Molloy, E., Mayer M., and Smith, A. (2006) „Practices of
Strategising/Organising: Broadening Strategy Work and Skills‟ Long range planning,
vol. 39, no. (6) pp. 615-629.
Wikgren, M. (2005) „Critical Realism as a Philosophy and Social Theory in
Information Science?‟, Journal of Documentation, vol. 61, (1) pp. 11-22.
Wilson, B. (1979) „Creating and Sharing Wealth: The added value approach (part 1)‟,
Employee Relations, vol. 1, (1) pp.7-10.
Wit, B. and Meyer, R. (2004) Strategy- Process, Content and Context: An
International Perspective, 3rd ed. Italy: Thompson Learning.
Wood, E. (1978) „Comments on a recent article on added value‟, Industrial and
Commercial Training, vol. 10, (8) pp. 332-333.
Worcester, R., and Downham, J. (1986) eds. Consumer Market Research Handbook,
3rd ed. London: McGraw-Hill Book Company.
World Port Source (2010) Port of Apapa, [Online] Available at
<http://www.worldportsource.com/ports/NGA_Port_of_Apapa_1725.php> [Accessed
on 5th
November, 2010].
Yeo, G., Roe, M. and Dinwoodie, J. (2011) „Measuring the Competitiveness of
Container Ports: Logisticians‟ Perspectives‟, European Journal of Marketing, vol. 45,
no. 3, pp. 455-470
Yeo, G., Song, D., Dinwoodie, J. and Roe, M. (2010) „Weighting the Competitiveness
for Container Ports under Conflicting Interests‟, Journal of Operational Research
Society, vol. 61 pp. 1249-1257
Yin, R. and Heald, K. (1975) „Using the Case Study Method to Analyse Policy
Studies‟, Administrative Science Quarterly, Sep75, vol. 20, (3) pp. 371-381.
Yin, R. (2009) Case Study Research: Design and Methods, 4th ed. California: Sage
Publications Inc.
Zaltman, G. (1977) The Structure of and Purpose of Marketing Models, Cited in
Worcester, R., and Downham, J. (1986) eds. Consumer Market Research Handbook,
3rd ed. London: McGraw-Hill Book Company, pp. 574.
Zikmund, W. and Babin, B. (2007) Exploring Marketing Research, 9th ed. China:
Thomson South-Western.
Zondag, B., Bucci, P., Gutzkow, P., and Gong, G. (2008) „A model for Maritime
Freight flows, Port Competition and Hinterland Transport‟, Paper presented at AET
European Transport Conference, 6th-8th October. 2008, Noordwijkerhout
(Netherlands).

222
Appendix 1 - Questionnaire
Transport & Logistics Division,
Huddersfield, HD1 3DH
United Kingdom
Dear Sir/Madam,
A Questionnaire On ‘Value-Adding Services as Competitive Strategy: A
Multiple Case-Study Analysis of Ports in Developing and Developed Economies’
This questionnaire is a major part of my PhD research project to understand the
views of port users about the use of value-adding services as a competitive strategy.
Your responses are crucial to reaching a full understanding of the research topic.
Names and addresses of respondents are not required as you will notice; hence you
can be assured you are free to give your opinion and all information provided will be
treated with strict confidence. It will take about 10 minutes to complete and am sure
you will find it interesting.
Please, the completed questionnaires will be collected on the (Date……….).
Alternatively, you can return it if completed before the date using the enclosed pre-
paid envelop or by email for the electronic version.
If you have any queries or would like to contact me for further information, please
feel free to use my email address: [email protected] or Tel:+44(0)1484471854
Thank you in anticipation of your assistance.
Chukwuneke Okorie

223
QUESTIONNAIRE
Section A: Pre-Information
1. Select your company‟s service(s) in the port?
(a)Stevedoring (b) Importing of goods (c) Freight forwarding
(d) Exporting of goods (e) Shipping services (Lines)
(f) Others (Specify). …………………………………………………………
2. What is your job title?.........…………………………………………………
3. How many years experience do you have in port business/service(s)?
……….. …………………………………………………....
4. In which category is your highest qualification? (please tick)
(a) Lower than high school (b) High School (c) Bachelor degree
(d) Post graduate degree (e.g. MA, MSc, MBA, PhD)
(e) If you have a certificate or professional qualification, please specify……………
Section B: Features of port services
Note: Value-adding services (VAS) represent services which are special and tailored
to customers‟ (port users) specific needs; they are complementary services different
from general services obtainable in any port, like loading, unloading, documentation,
piloting etc.
5. Are value adding services (VAS) available in this port?
(a) Yes (b) No
5b. If Yes, please list;
…………………………………………………………………………………………
…………………………………………………………………………………………
…………….……………………….…….……………………………………………..

224
Section B1: Key value-adding services identified in the literature
6. How likely are you to use the following services if they were to be provided by the
port? (Please select).
Very
low
Low Moderate High Very High
Transport delivery service 1 2 3 4 5
Warehousing 1 2 3 4 5
Packaging 1 2 3 4 5
Technical expertise support 1 2 3 4 5
Advertisement support
Service
1 2 3 4 5
Assembly of products/cargo 1 2 3 4 5
Consultancy service 1 2 3 4 5
Canteen/Catering Service 1 2 3 4 5
Water supplies 1 2 3 4 5
Cold Store Services 1 2 3 4 5
Give your comments ……………………………………….…………………………..
………………………………………………………………………………………….
…………………………………………………………………………………………..
7. Are the following value-adding services available in the port? (Select as
appropriate).
Available Not Available Not sure
Transport Delivery/Haulage Services 1 2 3
Warehousing Services 1 2 3
Packaging Services 1 2 3
Technical Expertise Support Services 1 2 3
Advertisement Support Service 1 2 3
Assembly of Products/Cargo 1 2 3
Consultancy Services 1 2 3
Canteen/Catering Services 1 2 3
Water Supplies 1 2 3
Cold Store Services 1 2 3
Others (specify) 1 2 3
1 2 3
1 2 3
* Give comments based on your choice here
…………………………………………………………………………………………..
……………………………...…………………………………………………………..
………………………………………………………………………………………….

225
Section C: Features of port users‟ patronage (select one answer to show your reaction
to the statements below).
8. „Port users would prefer a port that renders value-adding services (VAS)‟:
Strongly
Disagree
Disagree It makes no
difference
Agree Strongly Agree
1 2 3 4 5
9. Providing value-adding services to port users would make the port:
1. More Attractive
2. Less Attractive
3. Makes No Difference
Give reason(s) for your opinion……………………………………………………….
………………………………………………………………………………………….
………………………………………………………………………………………….
………………………………………………………………………………………….
10. The provision of value-adding services would result in the port being used:
(a) More Frequently
(b) Less Frequently
(c) Makes No Difference
Give reason (s) your opinion………………….……………………………...…………
……………………………………………………………………….…………………
………………………………………………………………………..…………………
Section D: Awareness of Value-adding Services (VAS)
11. How would you rate your awareness of value-adding services (VAS)?
No awareness
of VAS
Slightly aware of
VAS
Moderately
aware
Considerably
aware of VAS
Very much
aware of VAS
1 2 3 4 5

226
Section E: RATING OF VAS
12. Rank each of the following value-adding services according to their importance
to port users.
Very
low
Low Moderate High Very High
Transport Deliver service 1 2 3 4 5
Warehousing Services 1 2 3 4 5
Packaging Services 1 2 3 4 5
Technical expertise
support Services
1 2 3 4 5
Advertisement Support
Services
1 2 3 4 5
Assembly of
Products/Cargo
1 2 3 4 5
Consultancy services 1 2 3 4 5
Canteen/Catering
Services
1 2 3 4 5
Water Supplies 1 2 3 4 5
Cold Store Services 1 2 3 4 5
Others (specify) 1 2 3 4 5
1 2 3 4 5
1 2 3 4 5
1 2 3 4 5
13. Rate the extent of offering value-adding services (VAS) by the port.
Comments (if any)……………………………………………………………………..
…………………………………………………………………………………………
………………………………………………………………………………………
14. If you would like additional value-adding services to be offered this by port,
please list them:.……………………………………………………………………….
………………………………………………………………………………………….
…………………………………………………………………………………………..
VAS are not
in existence
VAS are Scarcely
offered
Moderately
Offered
Offered
Considerably
Offering of VAS is
Very High
1 2 3 4 5
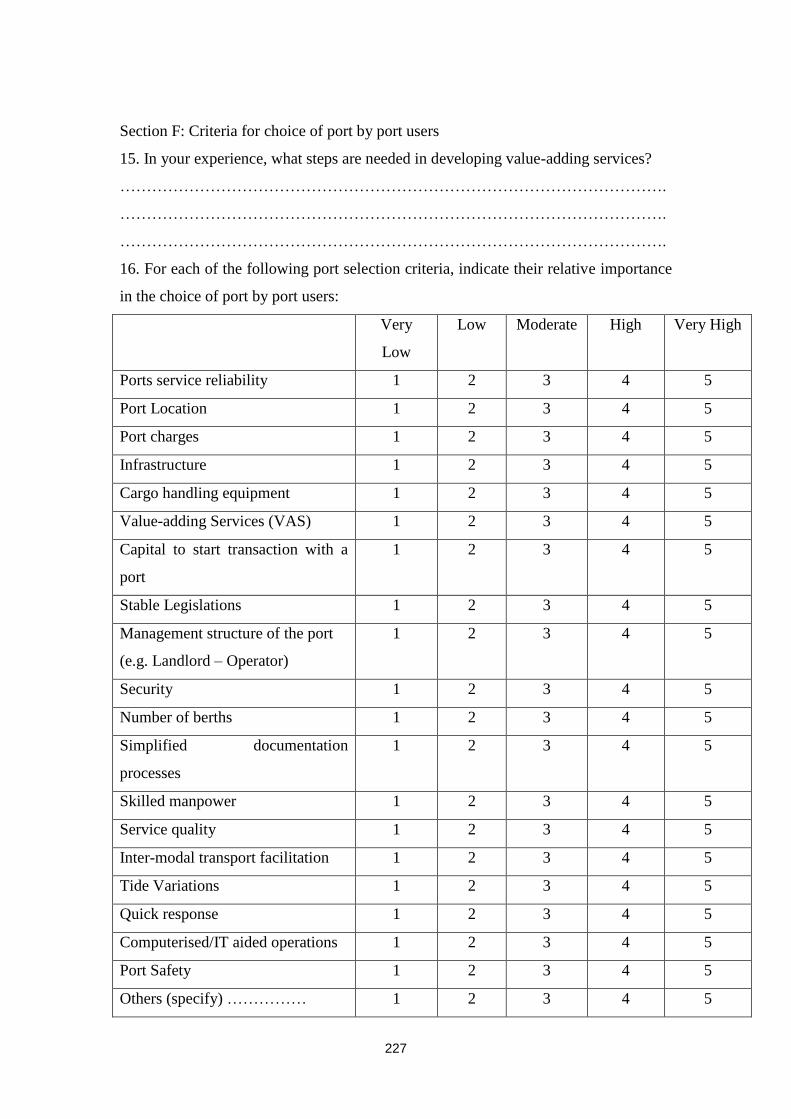
227
Section F: Criteria for choice of port by port users
15. In your experience, what steps are needed in developing value-adding services?
………………………………………………………………………………………….
………………………………………………………………………………………….
………………………………………………………………………………………….
16. For each of the following port selection criteria, indicate their relative importance
in the choice of port by port users:
Very
Low
Low Moderate High Very High
Ports service reliability 1 2 3 4 5
Port Location 1 2 3 4 5
Port charges 1 2 3 4 5
Infrastructure 1 2 3 4 5
Cargo handling equipment 1 2 3 4 5
Value-adding Services (VAS) 1 2 3 4 5
Capital to start transaction with a
port
1 2 3 4 5
Stable Legislations 1 2 3 4 5
Management structure of the port
(e.g. Landlord – Operator)
1 2 3 4 5
Security 1 2 3 4 5
Number of berths 1 2 3 4 5
Simplified documentation
processes
1 2 3 4 5
Skilled manpower 1 2 3 4 5
Service quality 1 2 3 4 5
Inter-modal transport facilitation 1 2 3 4 5
Tide Variations 1 2 3 4 5
Quick response 1 2 3 4 5
Computerised/IT aided operations 1 2 3 4 5
Port Safety 1 2 3 4 5
Others (specify) …………… 1 2 3 4 5

228
17. Do you know about the offering of advertisement support services by ports? (i.e.
ports render services to advertise (publicise) the port user's products/services)?
(a) Never heard of such services (b) Not sure (c) Very
aware of such services
If you have knowledge of advertisement support service offered by ports as in (17)
above, please give details:………………………………………………………………
…………………………………………………………………………………………
…………………………………………………………………………………………
18. For any other comments……………………………………………………….
…………………………………………………………………………………………
…………………………………………………………………………………………
Thank you for finding time to respond to these important questions. Please, do send
the questionnaire to me using one of the most appropriate medium (i.e. the enclosed
pre-paid envelop or email) or you can keep it to be collected on (Date……………).
Please, feel free to contact me via Email: [email protected] or Tel: +441484471854
for any queries. Once again, thank you.

229
Appendix 2 - Interview Schedule
Interview Schedule for the Research Topic:
‘Value-Adding Services as Competitive Strategy: A Multiple Case-Study
Analysis of Ports in Developing and Developed Economies’
Researcher (Interviewer) Chukwuneke Okorie
Date: ……………
Introduction: Your opinion is very important on the above research topic. This
interview is part of my research project to draw relevant data from port management
and experienced professionals in the port industry.
All information obtained is confidential and for research purposes only.
If you have any queries or would like to contact me for further information, please
feel free to contact me.
Thank you.
Chukwuneke Okorie
Tel: +441484471854
Email: [email protected].

230
Pre-Information
1. What is your job title?................................................................................................
2. How many years experience do you have in port business/service(s)?
……….. …………………………………………………...........................................
Features of Port Service
Note: Value-adding services (VAS) represent services which are special and
tailored to customers’ (port users) specific needs eg warehousing, consultancy;
they are complementary services different from the core/traditional services
obtainable in any port, like loading, unloading, documentation, piloting etc.
(1) Are there any value-adding services (VAS) in your port or port of interest?
…………………………………………………………………………………………
……………..…………………………………………………………………………..
(Please specify
………………………………………………………………………………………….
…………………………………………………………..………………………………
………………………………………………………………………………..…………
(3) What are some of the specific resources needed to enable the offering of value-
adding services?
……………………………………………………………………………………
……………………………………………………………………………………
……………………………………………………………………………………
……………………………………………………………………………………
……………………………………………………………………………………
……………………………………………………………………………………
(3a) For the formulation of strategy in the port, which of the following matches your
opinion?
(A) Value-adding services can form a strong means of differentiation for competitive
advantage.
(B) Value-adding services can be used, but are not a very strong means of gaining
competitive advantage.
(C) Value-adding services cannot be used to differentiate a port for competitive
advantage.

231
(3b)For the retention of port users in a port, which one of the following is your
opinion?
(A) The offering of value adding services is able to increase the retention of port users
in a port
(B) Offering of value adding services is not strong enough to retain port users in the
port
(C) Value-adding services cannot be used to retain port users in a port
(4) If there are value adding services in your port, why then does your port offer
value-adding services?
…………………………………………………………………………………………
…………………………………………………………………………………………
…………………………………………………………………………………………
…………………………………………………………………………………………
(5) Would your port or port of interest expect to expand on its value-adding
services?
…………………………………………………………………………………………
…………………………………………………………………………………………
…………………………………………………………………………………………
…………………………………………………………………………………………
…………………………………………………………………………………………
…………………………………………………………………………………………
…………………………………………………………………………………………
(6) What are the major problems or challenges encountered in offering value-adding
services in the port?
…………………………………………………………………………………………
…………………………………………………………………………………………
…………………………………………………………………………………………
…………………………………………………………………………………………
…………………………………………………………………………………………
…………………………………………………………………………………………
(7) What in your opinion would be the key steps in developing value adding services?
…………………………………………………………………………………………
…………………………………………………………………………………………
…………………………………………………………………………………………
…………………………………………………………………………………………
…………………………………………………………………………………………
…………………………………………………………………………………………
(8) What other reasons encourage port users too select a port instead of another?
…………………………………………………………………………………………
…………………………………………………………………………………………
…………………………………………………………………………………………
…………………………………………………………………………………………

232
…………………………………………………………………………………………
…………………………………………………………………………………………
(9) What are the recent strategies to keep the port competitive?
…………………………………………………………………………………………
…………………………………………………………………………………………
…………………………………………………………………………………………
…………………………………………………………………………………………
…………………………………………………………………………………………
(10) If your port has a Landlord & Port Operators structure, who drives competitive
strategies of the port?
…………………………………………………………………………………………
…………………………………………………………………………………………
…………………………………………………………………………………………
…………………………………………………………………………………………
…………………………………………………………………………………………
FOR ANY OTHER COMMENTS (PLEASE USE THE SPACE):
…………………………………………………………………………………………
…………………………………………………………………………………………
…………………………………………………………………………………………
…………………………………………………………………………………………
………………………………………………………………………………………….
Thank you very much for finding time to give attention to this research interview.
Please, feel free to contact me via email: [email protected] ; Tel: +441484471854
for any further information. Once again, thank you.

233
Appendix 3- Interview Excerpts
Excerpts
„We also as ABP, about 10 years ago, we bought a cold store and we operate that and
I will say that is value added. Another is in our relationship as a Landlord to the port
operators;….., they also offer their customers haulage, so they can also deliver the
cargoes as well. ABP, we do not necessarily wish get involved in adding value like
haulage or packaging or such like. We will get involved in cargo handling activities
where it makes sense, but it is unlikely that ABP itself will get involved in the bolton
activities, but we can make it possible by providing land for some other companies to
do that on the port.‟ (Business Development Manager, ABP, Port of Hull)
„So for VAS, like the Federal government we want to see a situation where customers
patronise the ports. They (port operators) have VAS, they compete among themselves
to woo customers (port users), and they reduce their tariff, improve facilities & offer
warehousing. So they now design what they bring to customers, moreover the cargoes
they handle are not the same.‟ („Anonymous‟, NPA Port Harcourt)
Attraction
„Highly depends on the port activities/ positioning of the port. Pure transhipments port
does not care about VAS‟. (Advisor corporate Strategy, Port of Rotterdam)
„I will agree with the first that VAS can perform strongly to differentiate ports,
because if a port has a lot of land available and another port do not have land
available and a customer want to have a large distribution centre built in the port, then
the port with large land will have better competitive advantage. Location is important.
Yes I will agree with that VAS can give a competitive advantage.‟ (Business
Development Manager, ABP, Port of Hull)
There is a saying that „services that prospered traded in cargo and physical items‟. In
the future, institutions/firms must be prepared to trade in ideas. „Ideas rule the world-
the same is true for the port sector‟. (Port Manager, NPA Port Harcourt)

234
Retention
„If the port management decide that the VAS is important to retain certain cargo/trade
flows, they can give incentives to start up VAS companies, and they can take this into
account for land lease strategy‟ (Advisor corporate Strategy, Port of Rotterdam).
„This is on a case to case basis, ……because VAS is able to increase retention, but
sometimes it is not enough to retain port users in a port. Sometimes port users do not
want any VAS, so if they want to go, they will go whether you offer any VAS or not‟
(Business Development Manager, ABP, Port of Hull)
„When the port was wholly run by NPA, it offered haulage services to port users at a
lower price rate and saved business time as a result. So the port users, considering the
condition of our environment and level of reliability in business, can decide to
continue to patronise the port because of availability of such service‟
(Assistant Chief Port Strategist, Apapa Port)
Why does your port offer VAS?
„…..because we are here for business and the more the customers, the better for the
system; is better for the company. So if there is anything we can do to add-value to
our services & that will attract customers, we will not look back, we will do it. So the
reason for offering VAS is to attract more customers which translate to more revenue
for us. The more the customers, the more the revenue, better for us, better for the
national economy because we are working for the government.‟ („Anonymous, NPA
Port Harcourt)
„…it is one for profitability. There is no point offering VAS if it can be profitable so
you have to view the money element. It may help to tie the business of customers to
the port by offering them facilities in the port for VAS. (Business Development
Manager, ABP, Port of Hull)
„„life itself is competitive‟‟. VAS is offered for competitiveness, to do better than
others. People tend to change to respond to different challenges. (Assistant Chief Port
Strategist, Apapa Port)

235
Possible Expansion of VAS
„Yes. No doubt we will. We are finding that we are getting more and more involved
in activities that do more than just handle a cargo‟. (Business Development Manager,
ABP, Port of Hull)
„Yes,…this shall come to implementation after research of relevant market‟ (Head of
Damietta port operation)
„It is known that „necessity is the mother of invention. We would want to look at how
to do things better to attract more customers‟. (Assistant Chief Port Strategist, Apapa
Port)
Resources for VAS
„now we are regulators & along the line we have to acquire new skills to be able to
regulate because you cannot regulate effectively if you do not know more than or your
knowledge base does not exceed that of the people you want to regulate‟. (Port
(Manager, NPA Port Harcourt)
Challenges of VAS
We find that the port gets quite congested if we dedicate a lot of the land for
something that won‟t bring a lot of business on the quay side, it may not be the best
use of the land. (Business Development Manager, ABP, Port of Hull)
„…..and sometimes the problems of these projects can be the fact that you don‟t get a
long enough contract from the customers to justify the skills and investments
required. (Business Development Manager, ABP, Port of Hull)
As a public corporation, the port might not enjoy the Quick Response flexibility that
private firm enjoys. Any service we render must be within the statutory provision.
(Port Manager, NPA Port Harcourt)

236
Identifying and putting in place robust structures to support Research and
Development (R & D); to explore the market and chart commercial policies to tap into
the market (Port Manager, NPA Port Harcourt)
Other issues of consideration to offering VAS
Sometimes the only thing that is quite frustrating is the length of time required to get
planning permission to build; that is a general UK policy issue. You want to be able to
get it quick; getting planning permission sometimes that can be lengthy. It can take
about 1 or 2 years to get land permission, so that is pretty too long. (Business
Development Manager, ABP, Port of Hull)
„..we are in a recession at the moment, a lot of people will move quite quickly if the
find it cheap to go to somewhere else‟ (Business Development Manager, ABP, Port of
Hull)
„If the tariff (price or amount paid to clear cargoes) are less in the nearby port of
Cotonou, then it is likely that people would use the port of lesser charge‟.
(Port Manager, NPA Port Harcourt)
Landlord-operator –driver of port
„The tenant is not the owner of the house‟, as such the responsibility will not be left
just for the terminal operators. There is therefore symbiotic actions and relationship
from both sides (landlords & port operators).‟ (Assistant Chief Port Strategist, Apapa
Port)
Comments on value-adding services
I forgot to say that another type of VAS is about NPA security, this is not just about
the basic security within and around the port, but going further inland to clear the
roads, making them free for port users to transport their freight and gain quick access
to the port (Assistant Chief Port Strategist Apapa Port)

Appendix 4- Results of Statistical Data Exploration from Ports in Developed Economies
Port Service Area
Frequency Percent Valid Percent Cumulative Percent
Valid Stevedoring 5 13.5 13.5 13.5
Importing 4 10.8 10.8 24.3
Freight Forwarding 4 10.8 10.8 35.1
Exporting 6 16.2 16.2 51.4
Shipping Services 5 13.5 13.5 64.9
Others 13 35.1 35.1 100.0
Total 37 100.0 100.0
Likely Usage Rate- Packaging Services
Frequency Percent Valid Percent
Cumulative
Percent
Valid Very Low 17 45.9 45.9 45.9
Low 8 21.6 21.6 67.6
Moderate 3 8.1 8.1 75.7
High 3 8.1 8.1 83.8
Very High 6 16.2 16.2 100.0
Total 37 100.0 100.0
Highest Qualification Category
Frequency Percent Valid Percent Cumulative Percent
Valid Lower than High School 2 5.4 5.4 5.4
High School 4 10.8 10.8 16.2
Bachelor Degree 17 45.9 45.9 62.2
Post Graduate Degree 11 29.7 29.7 91.9
Others 3 8.1 8.1 100.0
Total 37 100.0 100.0
Availability of Value-Adding Services
Frequency Percent Valid Percent Cumulative Percent
Valid YES 31 83.8 83.8 83.8
NO 6 16.2 16.2 100.0
Total 37 100.0 100.0
Likely Usage Rate- Assembly of Cargo/Product Services
Frequency Percent Valid Percent Cumulative Percent
Valid Very Low 16 43.2 43.2 43.2
Low 2 5.4 5.4 48.6
Moderate 7 18.9 18.9 67.6
High 7 18.9 18.9 86.5
Very High 5 13.5 13.5 100.0
Total 37 100.0 100.0
Likely Usage Rate- Transport Delivery Services
Frequency Percent Valid Percent Cumulative Percent
Valid Very Low 12 32.4 32.4 32.4
Moderate 7 18.9 18.9 51.4
High 9 24.3 24.3 75.7
Very High 9 24.3 24.3 100.0
Total 37 100.0 100.0

238
Likely Usage Rate- Warehousing Services
Frequency Percent Valid Percent
Cumulative
Percent
Valid Very Low 11 29.7 29.7 29.7
Low 2 5.4 5.4 35.1
Moderate 8 21.6 21.6 56.8
High 5 13.5 13.5 70.3
Very High 11 29.7 29.7 100.0
Total 37 100.0 100.0
Likely Usage Rate- Technical Support Services
Frequency Percent Valid Percent Cumulative Percent
Valid Very Low 11 29.7 29.7 29.7
Low 5 13.5 13.5 43.2
Moderate 11 29.7 29.7 73.0
High 8 21.6 21.6 94.6
Very High 2 5.4 5.4 100.0
Total 37 100.0 100.0
Likely Usage Rate- Consultancy Services
Frequency Percent Valid Percent Cumulative Percent
Valid Very Low 15 40.5 40.5 40.5
Low 7 18.9 18.9 59.5
Moderate 12 32.4 32.4 91.9
High 1 2.7 2.7 94.6
Very High 2 5.4 5.4 100.0
Total 37 100.0 100.0
Likely Usage Rate- Advertisement Support Services
Frequency Percent Valid Percent Cumulative Percent
Valid Very Low 12 32.4 32.4 32.4
Low 6 16.2 16.2 48.6
Moderate 12 32.4 32.4 81.1
High 5 13.5 13.5 94.6
Very High 2 5.4 5.4 100.0
Total 37 100.0 100.0
Likely Usage Rate- Canteen/Catering Services
Frequency Percent Valid Percent Cumulative Percent
Valid Very Low 23 62.2 62.2 62.2
Low 8 21.6 21.6 83.8
Moderate 4 10.8 10.8 94.6
Very High 2 5.4 5.4 100.0
Total 37 100.0 100.0

239
Likely Usage Rate- Cold Store Services
Frequency Percent Valid Percent Cumulative Percent
Valid Very Low 16 43.2 43.2 43.2
Low 4 10.8 10.8 54.1
Moderate 13 35.1 35.1 89.2
Very High 4 10.8 10.8 100.0
Total 37 100.0 100.0
Likely Usage Rate- Water Supplies Services
Frequency Percent Valid Percent Cumulative Percent
Valid Very Low 18 48.6 48.6 48.6
Low 2 5.4 5.4 54.1
Moderate 7 18.9 18.9 73.0
High 3 8.1 8.1 81.1
Very High 7 18.9 18.9 100.0
Total 37 100.0 100.0
Availability Status- Packaging Services
Frequency Percent
Valid
Percent
Cumulative
Percent
Valid Available 24 64.9 64.9 64.9
Not
Available
8 21.6 21.6 86.5
Not Sure 5 13.5 13.5 100.0
Total 37 100.0 100.0
Availability Status- Transport Delivery Services
Frequency Percent Valid Percent Cumulative Percent
Valid Available 33 89.2 89.2 89.2
Not Available 4 10.8 10.8 100.0
Total 37 100.0 100.0
Availability Status- Warehousing Services
Frequency Percent Valid Percent Cumulative Percent
Valid Available 31 83.8 83.8 83.8
Not Available 6 16.2 16.2 100.0
Total 37 100.0 100.0
Availability Status- Technical Support Services
Frequency Percent
Valid
Percent
Cumulative
Percent
Valid Available 26 70.3 70.3 70.3
Not
Available
8 21.6 21.6 91.9
Not Sure 3 8.1 8.1 100.0
Total 37 100.0 100.0

240
Availability Status- Advertisement Support Services
Frequency Percent Valid Percent Cumulative Percent
Valid Available 20 54.1 54.1 54.1
Not Available 10 27.0 27.0 81.1
Not Sure 7 18.9 18.9 100.0
Total 37 100.0 100.0
Availability Status- Assembly of Cargo/Product Services
Frequency Percent Valid Percent Cumulative Percent
Valid Available 28 75.7 75.7 75.7
Not Available 5 13.5 13.5 89.2
Not Sure 4 10.8 10.8 100.0
Total 37 100.0 100.0
Availability Status- Assembly of Cargo/Product Services
Frequency Percent Valid Percent Cumulative Percent
Valid Available 28 75.7 75.7 75.7
Not Available 5 13.5 13.5 89.2
Not Sure 4 10.8 10.8 100.0
Total 37 100.0 100.0
Availability Status- Consultancy Services
Frequency Percent Valid Percent Cumulative Percent
Valid Available 23 62.2 62.2 62.2
Not Available 6 16.2 16.2 78.4
Not Sure 8 21.6 21.6 100.0
Total 37 100.0 100.0
Availability Status- Canteen/Catering Services
Frequency Percent Valid Percent Cumulative Percent
Valid Available 13 35.1 35.1 35.1
Not Available 21 56.8 56.8 91.9
Not Sure 3 8.1 8.1 100.0
Total 37 100.0 100.0
Availability Status- Cold Store Services
Frequency Percent Valid Percent Cumulative Percent
Valid Available 17 45.9 45.9 45.9
Not Available 11 29.7 29.7 75.7
Not Sure 9 24.3 24.3 100.0
Total 37 100.0 100.0

241
Availability Status- Water Supplies Services
Frequency Percent Valid Percent Cumulative Percent
Valid Available 29 78.4 78.4 78.4
Not Available 4 10.8 10.8 89.2
Not Sure 4 10.8 10.8 100.0
Total 37 100.0 100.0
Port Users Prefer Value-Adding Service Port
Frequency Percent Valid Percent Cumulative Percent
Valid Strongly Disagree 1 2.7 2.7 2.7
Disagree 6 16.2 16.2 18.9
Makes no Difference 6 16.2 16.2 35.1
Agree 12 32.4 32.4 67.6
Strongly Agree 12 32.4 32.4 100.0
Total 37 100.0 100.0
Impact of Value-Adding Services on Attracting Port Users
Frequency Percent Valid Percent Cumulative Percent
Valid More Attractive 22 59.5 59.5 59.5
Less Attractive 9 24.3 24.3 83.8
Makes no Difference 6 16.2 16.2 100.0
Total 37 100.0 100.0
Port Users' Awareness of Value-Adding Services
Frequency Percent Valid Percent Cumulative Percent
Valid Slightly Aware of Value-Adding Services 3 8.1 8.1 8.1
Moderately Aware of Value-Adding Services 7 18.9 18.9 27.0
Considerably Aware of Value-Adding Services 15 40.5 40.5 67.6
Very Much Aware of Value-Adding Services 12 32.4 32.4 100.0
Total 37 100.0 100.0

242
Importance to Port Users: Warehousing Services
Frequency Percent Valid Percent Cumulative Percent
Valid Low 1 2.7 2.7 2.7
Moderate 9 24.3 24.3 27.0
High 17 45.9 45.9 73.0
Very High 10 27.0 27.0 100.0
Total 37 100.0 100.0
Impact of Value-Adding Services on Port Usage Frequency (Retention)
Frequency Percent Valid Percent Cumulative Percent
Valid More Frequently 21 56.8 56.8 56.8
Less Frequently 9 24.3 24.3 81.1
Makes no Difference 7 18.9 18.9 100.0
Total 37 100.0 100.0
Importance to Port Users: Transport Delivery Services
Frequency Percent Valid Percent Cumulative Percent
Valid Low 1 2.7 2.7 2.7
Moderate 3 8.1 8.1 10.8
High 12 32.4 32.4 43.2
Very High 21 56.8 56.8 100.0
Total 37 100.0 100.0
Importance to Port Users: Packaging Services
Frequency Percent Valid Percent Cumulative Percent
Valid Very Low 2 5.4 5.4 5.4
Low 5 13.5 13.5 18.9
Moderate 17 45.9 45.9 64.9
High 12 32.4 32.4 97.3
Very High 1 2.7 2.7 100.0
Total 37 100.0 100.0
Importance to Port Users: Assembly of Cargo/Product Services
Frequency Percent Valid Percent Cumulative Percent
Valid Very Low 3 8.1 8.1 8.1
Low 7 18.9 18.9 27.0
Moderate 17 45.9 45.9 73.0
High 8 21.6 21.6 94.6
Very High 2 5.4 5.4 100.0
Total 37 100.0 100.0
Importance to Port Users: Technical Support Services
Frequency Percent Valid Percent Cumulative Percent
Valid Very Low 2 5.4 5.4 5.4
Low 9 24.3 24.3 29.7
Moderate 13 35.1 35.1 64.9
High 11 29.7 29.7 94.6
Very High 2 5.4 5.4 100.0
Total 37 100.0 100.0

243
Importance to Port Users: Advertisement Support Services
Frequency Percent Valid Percent Cumulative Percent
Valid Very Low 5 13.5 13.5 13.5
Low 12 32.4 32.4 45.9
Moderate 15 40.5 40.5 86.5
High 5 13.5 13.5 100.0
Total 37 100.0 100.0
Importance to Port Users: Consultancy Services
Frequency Percent Valid Percent Cumulative Percent
Valid Very Low 6 16.2 16.2 16.2
Low 11 29.7 29.7 45.9
Moderate 10 27.0 27.0 73.0
High 9 24.3 24.3 97.3
Very High 1 2.7 2.7 100.0
Total 37 100.0 100.0
Importance to Port Users: Canteen/Catering Services
Frequency Percent Valid Percent Cumulative Percent
Valid Very Low 11 29.7 29.7 29.7
Low 2 5.4 5.4 35.1
Moderate 8 21.6 21.6 56.8
High 5 13.5 13.5 70.3
Very High 11 29.7 29.7 100.0
Total 37 100.0 100.0
Importance to Port Users: Cold Store Services
Frequency Percent Valid Percent Cumulative Percent
Valid Very Low 2 5.4 5.4 5.4
Low 6 16.2 16.2 21.6
Moderate 20 54.1 54.1 75.7
High 6 16.2 16.2 91.9
Very High 3 8.1 8.1 100.0
Total 37 100.0 100.0
Importance to Port Users: Water Supplies Services
Frequency Percent Valid Percent Cumulative Percent
Valid Very Low 3 8.1 8.1 8.1
Low 4 10.8 10.8 18.9
Moderate 7 18.9 18.9 37.8
High 15 40.5 40.5 78.4
Very High 8 21.6 21.6 100.0
Total 37 100.0 100.0

244
Extent of considering other port selection criteria by port users
Extent of Offering Value-Adding Services in the Port
Frequency Percent Valid Percent Cumulative Percent
Valid Value-Adding Services are Scarcely Offered 6 16.2 16.2 16.2
Value-Adding Services are Moderately Offered 7 18.9 18.9 35.1
Value-Adding Services are Offered Considerably 15 40.5 40.5 75.7
Offering of Value-Adding Services is Very High 9 24.3 24.3 100.0
Total 37 100.0 100.0
Port Service Reliability
Frequency Percent Valid Percent Cumulative Percent
Valid Low 1 2.7 2.7 2.7
Moderate 5 13.5 13.5 16.2
High 16 43.2 43.2 59.5
Very High 15 40.5 40.5 100.0
Total 37 100.0 100.0
Port Location
Frequency Percent Valid Percent Cumulative Percent
Valid Very Low 1 2.7 2.7 2.7
Low 3 8.1 8.1 10.8
Moderate 3 8.1 8.1 18.9
High 10 27.0 27.0 45.9
Very High 20 54.1 54.1 100.0
Total 37 100.0 100.0
Infrastructure
Frequency Percent Valid Percent Cumulative Percent
Valid Very Low 1 2.7 2.7 2.7
Low 2 5.4 5.4 8.1
Moderate 5 13.5 13.5 21.6
High 11 29.7 29.7 51.4
Very High 18 48.6 48.6 100.0
Total 37 100.0 100.0

245
Cargo Handling Equipment
Frequency Percent Valid Percent Cumulative Percent
Valid Very Low 1 2.7 2.7 2.7
Moderate 4 10.8 10.8 13.5
High 16 43.2 43.2 56.8
Very High 16 43.2 43.2 100.0
Total 37 100.0 100.0
Port Charges
Frequency Percent Valid Percent Cumulative Percent
Valid Moderate 6 16.2 16.2 16.2
High 18 48.6 48.6 64.9
Very High 13 35.1 35.1 100.0
Total 37 100.0 100.0
Value-Adding Services (VAS)
Frequency Percent Valid Percent Cumulative Percent
Valid Low 6 16.2 16.2 16.2
Moderate 9 24.3 24.3 40.5
High 13 35.1 35.1 75.7
Very High 9 24.3 24.3 100.0
Total 37 100.0 100.0
Capital to Start Business with a Port
Frequency Percent Valid Percent Cumulative Percent
Valid Very Low 2 5.4 5.4 5.4
Low 2 5.4 5.4 10.8
Moderate 17 45.9 45.9 56.8
High 14 37.8 37.8 94.6
Very High 2 5.4 5.4 100.0
Total 37 100.0 100.0
Stable Legislations
Frequency Percent Valid Percent Cumulative Percent
Valid Low 2 5.4 5.4 5.4
Moderate 9 24.3 24.3 29.7
High 18 48.6 48.6 78.4
Very High 8 21.6 21.6 100.0
Total 37 100.0 100.0
Security
Frequency Percent Valid Percent Cumulative Percent
Valid Moderate 5 13.5 13.5 13.5
High 19 51.4 51.4 64.9
Very High 13 35.1 35.1 100.0
Total 37 100.0 100.0

246
Management Structure of the Port (eg. Landlord-Operator)
Frequency Percent Valid Percent Cumulative Percent
Valid Very Low 2 5.4 5.4 5.4
Low 5 13.5 13.5 18.9
Moderate 17 45.9 45.9 64.9
High 7 18.9 18.9 83.8
Very High 6 16.2 16.2 100.0
Total 37 100.0 100.0
Number of Births
Frequency Percent Valid Percent Cumulative Percent
Valid Low 2 5.4 5.4 5.4
Moderate 12 32.4 32.4 37.8
High 16 43.2 43.2 81.1
Very High 7 18.9 18.9 100.0
Total 37 100.0 100.0
Simplified Documentation Process
Frequency Percent Valid Percent
Cumulative
Percent
Valid Low 1 2.7 2.7 2.7
Moderate 8 21.6 21.6 24.3
High 18 48.6 48.6 73.0
Very High 10 27.0 27.0 100.0
Total 37 100.0 100.0
Skilled Manpower
Frequency Percent Valid Percent
Cumulative
Percent
Valid Low 1 2.7 2.7 2.7
Moderate 4 10.8 10.8 13.5
High 25 67.6 67.6 81.1
Very High 7 18.9 18.9 100.0
Total 37 100.0 100.0
Inter-modal Transport Facilitation
Frequency Percent Valid Percent Cumulative Percent
Valid Low 1 2.7 2.7 2.7
Moderate 10 27.0 27.0 29.7
High 19 51.4 51.4 81.1
Very High 7 18.9 18.9 100.0
Total 37 100.0 100.0
Service Quality
Frequency Percent Valid Percent Cumulative Percent
Valid Moderate 3 8.1 8.1 8.1
High 19 51.4 51.4 59.5
Very High 15 40.5 40.5 100.0
Total 37 100.0 100.0

247
Quick Response
Frequency Percent Valid Percent Cumulative Percent
Valid Very Low 1 2.7 2.7 2.7
Moderate 4 10.8 10.8 13.5
High 21 56.8 56.8 70.3
Very High 11 29.7 29.7 100.0
Total 37 100.0 100.0
Tide Variations
Frequency Percent Valid Percent Cumulative Percent
Valid Very Low 1 2.7 2.7 2.7
Low 8 21.6 21.6 24.3
Moderate 17 45.9 45.9 70.3
High 8 21.6 21.6 91.9
Very High 3 8.1 8.1 100.0
Total 37 100.0 100.0
Port Safety
Frequency Percent Valid Percent Cumulative Percent
Valid Moderate 1 2.7 2.7 2.7
High 14 37.8 37.8 40.5
Very High 22 59.5 59.5 100.0
Total 37 100.0 100.0
Computerised/IT aided Operations
Frequency Percent Valid Percent Cumulative Percent
Valid Low 2 5.4 5.4 5.4
Moderate 2 5.4 5.4 10.8
High 15 40.5 40.5 51.4
Very High 18 48.6 48.6 100.0
Total 37 100.0 100.0
Knowledge of Port Advertisement Support Services
Frequency Percent Valid Percent Cumulative Percent
Valid Never heard of such Services 9 24.3 24.3 24.3
Not Sure 11 29.7 29.7 54.1
Very Aware of such Services 17 45.9 45.9 100.0
Total 37 100.0 100.0

248
Appendix 5- Results of Data Exploration of Ports in Developing Economies (Egypt)
Years of Port Business Experience
Frequency Percent Valid Percent Cumulative Percent
Valid 1 3 8.6 11.1 11.1
2 2 5.7 7.4 18.5
3 3 8.6 11.1 29.6
4 4 11.4 14.8 44.4
5 4 11.4 14.8 59.3
7 1 2.9 3.7 63.0
10 3 8.6 11.1 74.1
12 1 2.9 3.7 77.8
15 6 17.1 22.2 100.0
Total 27 77.1 100.0
Missing System 8 22.9
Total 35 100.0
Developing Economies (EGYPT)
Frequency Percent Valid Percent
Cumulative
Percent
Valid Developing
Economies
35 100.0 100.0 100.0
Port Service Area
Frequency Percent Valid Percent Cumulative Percent
Valid Stevedoring 4 11.4 11.4 11.4
Importing 5 14.3 14.3 25.7
Freight Forwarding 10 28.6 28.6 54.3
Exporting 1 2.9 2.9 57.1
Shipping Services 15 42.9 42.9 100.0
Total 35 100.0 100.0

249
Availability of Value-Adding Services
Frequency Percent Valid Percent Cumulative Percent
Valid YES 23 65.7 65.7 65.7
NO 12 34.3 34.3 100.0
Total 35 100.0 100.0
Highest Qualification Category
Frequency Percent Valid Percent Cumulative Percent
Valid High School 1 2.9 2.9 2.9
Bachelor Degree 23 65.7 65.7 68.6
Post Graduate Degree 11 31.4 31.4 100.0
Total 35 100.0 100.0
Likely Usage Rate- Warehousing Services
Frequency Percent Valid Percent Cumulative Percent
Valid Very Low 4 11.4 11.4 11.4
Low 3 8.6 8.6 20.0
Moderate 9 25.7 25.7 45.7
High 19 54.3 54.3 100.0
Total 35 100.0 100.0
Likely Usage Rate- Transport Delivery Services
Frequency Percent Valid Percent Cumulative Percent
Valid Very Low 5 14.3 14.3 14.3
Low 3 8.6 8.6 22.9
Moderate 9 25.7 25.7 48.6
High 18 51.4 51.4 100.0
Total 35 100.0 100.0

250
Likely Usage Rate- Packaging Services
Frequency Percent Valid Percent Cumulative Percent
Valid Very Low 4 11.4 11.4 11.4
Low 4 11.4 11.4 22.9
Moderate 9 25.7 25.7 48.6
High 18 51.4 51.4 100.0
Total 35 100.0 100.0
Likely Usage Rate- Technical Support Services
Frequency Percent Valid Percent Cumulative Percent
Valid Very Low 4 11.4 11.4 11.4
Low 3 8.6 8.6 20.0
Moderate 8 22.9 22.9 42.9
High 20 57.1 57.1 100.0
Total 35 100.0 100.0
Likely Usage Rate- Assembly of Cargo/Product Services
Frequency Percent Valid Percent Cumulative Percent
Valid Very Low 5 14.3 14.3 14.3
Low 6 17.1 17.1 31.4
Moderate 10 28.6 28.6 60.0
High 13 37.1 37.1 97.1
Very High 1 2.9 2.9 1000
Total 35 100.0 100.0
Likely Usage Rate- Consultancy Services
Frequency Percent Valid Percent Cumulative Percent
Valid Very Low 6 17.1 17.1 17.1
Low 8 22.9 22.9 40.0
Moderate 8 22.9 22.9 62.9
High 12 34.3 34.3 97.1
Very High 1 2.9 2.9 100.0
Total 35 100.0 100.0

251
Likely Usage Rate- Cold Store Services
Frequency Percent Valid Percent Cumulative Percent
Valid Very Low 6 17.1 17.1 17.1
Low 8 22.9 22.9 40.0
Moderate 8 22.9 22.9 62.9
High 13 37.1 37.1 100.0
Total 35 100.0 100.0
Likely Usage Rate- Advertisement Support Services
Frequency Percent Valid Percent Cumulative Percent
Valid Very Low 5 14.3 14.3 14.3
Low 6 17.1 17.1 31.4
Moderate 9 25.7 25.7 57.1
High 14 40.0 40.0 97.1
Very High 1 2.9 2.9 100.0
Total 35 100.0 100.0
Likely Usage Rate- Canteen/Catering Services
Frequency Percent Valid Percent Cumulative Percent
Valid Very Low 5 14.3 14.3 14.3
Low 8 22.9 22.9 37.1
Moderate 8 22.9 22.9 60.0
High 13 37.1 37.1 97.1
Very High 1 2.9 2.9 100.0
Total 35 100.0 100.0
Likely Usage Rate- Water Supplies Services
Frequency Percent Valid Percent Cumulative Percent
Valid Very Low 6 17.1 17.1 17.1
Low 9 25.7 25.7 42.9
Moderate 7 20.0 20.0 62.9
High 12 34.3 34.3 97.1
Very High 1 2.9 2.9 100.0
Total 35 100.0 100.0

252
Availability Status- Transport Delivery Services
Frequency Percent Valid Percent Cumulative Percent
Valid Available 29 82.9 82.9 82.9
Not Available 3 8.6 8.6 91.4
Not Sure 3 8.6 8.6 100.0
Total 35 100.0 100.0
Availability Status- Packaging Services
Frequency Percent
Valid
Percent
Cumulative
Percent
Valid Available 28 80.0 80.0 80.0
Not
Available
4 11.4 11.4 91.4
Not Sure 3 8.6 8.6 100.0
Total 35 100.0 100.0
Availability Status- Warehousing Services
Frequency Percent Valid Percent Cumulative Percent
Valid Available 30 85.7 85.7 85.7
Not Available 2 5.7 5.7 91.4
Not Sure 3 8.6 8.6 100.0
Total 35 100.0 100.0
Availability Status- Technical Support Services
Frequency Percent Valid Percent Cumulative Percent
Valid Available 27 77.1 77.1 77.1
Not Available 4 11.4 11.4 88.6
Not Sure 4 11.4 11.4 100.0
Total 35 100.0 100.0

253
Availability Status- Consultancy Services
Frequency Percent Valid Percent Cumulative Percent
Valid Available 18 51.4 51.4 51.4
Not Available 6 17.1 17.1 68.6
Not Sure 11 31.4 31.4 100.0
Total 35 100.0 100.0
Availability Status- Cold Store Services
Frequency Percent Valid Percent Cumulative Percent
Valid Available 15 42.9 42.9 42.9
Not Available 6 17.1 17.1 60.0
Not Sure 14 40.0 40.0 100.0
Total 35 100.0 100.0
Availability Status- Canteen/Catering Services
Frequency Percent Valid Percent Cumulative Percent
Valid Available 18 51.4 51.4 51.4
Not Available 6 17.1 17.1 68.6
Not Sure 11 31.4 31.4 100.0
Total 35 100.0 100.0
Availability Status- Assembly of Cargo/Product Services
Frequency Percent Valid Percent Cumulative Percent
Valid Available 17 48.6 48.6 48.6
Not Available 5 14.3 14.3 62.9
Not Sure 13 37.1 37.1 100.0
Total 35 100.0 100.0
Availability Status- Advertisement Support Services
Frequency Percent Valid Percent Cumulative Percent
Valid Available 24 68.6 68.6 68.6
Not Available 5 14.3 14.3 82.9
Not Sure 6 17.1 17.1 100.0
Total 35 100.0 100.0
Availability Status- Water Supplies Services
Frequency Percent Valid Percent
Cumulative
Percent
Valid Available 16 45.7 45.7 45.7
Not Available 7 20.0 20.0 65.7
Not Sure 12 34.3 34.3 100.0
Total 35 100.0 100.0

254
Importance to Port Users: Transport Delivery Services
Frequency Percent Valid Percent Cumulative Percent
Valid Low 2 5.7 5.7 5.7
Moderate 1 2.9 2.9 8.6
High 14 40.0 40.0 48.6
Very High 18 51.4 51.4 100.0
Total 35 100.0 100.0
Importance to Port Users: Warehousing Services
Frequency Percent Valid Percent Cumulative Percent
Valid Low 2 5.7 5.7 5.7
Moderate 1 2.9 2.9 8.6
High 14 40.0 40.0 48.6
Very High 18 51.4 51.4 100.0
Total 35 100.0 100.0
Importance to Port Users: Assembly of Cargo/Product Services
Frequency Percent Valid Percent Cumulative Percent
Valid Very Low 1 2.9 2.9 2.9
Low 2 5.7 5.7 8.6
High 11 31.4 31.4 40.0
Very High 21 60.0 60.0 100.0
Total 35 100.0 100.0
Importance to Port Users: Packaging Services
Frequency Percent Valid Percent Cumulative Percent
Valid Low 2 5.7 5.7 5.7
Moderate 1 2.9 2.9 8.6
High 16 45.7 45.7 54.3
Very High 16 45.7 45.7 100.0
Total 35 100.0 100.0
Importance to Port Users: Technical Support Services
Frequency Percent Valid Percent Cumulative Percent
Valid Low 3 8.6 8.6 8.6
High 16 45.7 45.7 54.3
Very High 16 45.7 45.7 100.0
Total 35 100.0 100.0
Importance to Port Users: Advertisement Support Services
Frequency Percent Valid Percent Cumulative Percent
Valid Very Low 1 2.9 2.9 2.9
Low 1 2.9 2.9 5.7
Moderate 2 5.7 5.7 11.4
High 15 42.9 42.9 54.3
Very High 16 45.7 45.7 100.0
Total 35 100.0 100.0

255
Importance to Port Users: Consultancy Services
Frequency Percent Valid Percent Cumulative Percent
Valid Very Low 1 2.9 2.9 2.9
Low 2 5.7 5.7 8.6
Moderate 3 8.6 8.6 17.1
High 9 25.7 25.7 42.9
Very High 20 57.1 57.1 100.0
Total 35 100.0 100.0
Importance to Port Users: Cold Store Services
Frequency Percent Valid Percent Cumulative Percent
Valid Very Low 2 5.7 5.7 5.7
Low 2 5.7 5.7 11.4
Moderate 3 8.6 8.6 20.0
High 11 31.4 31.4 51.4
Very High 17 48.6 48.6 100.0
Total 35 100.0 100.0
Importance to Port Users: Water Supplies Services
Frequency Percent Valid Percent Cumulative Percent
Valid Very Low 1 2.9 2.9 2.9
Low 2 5.7 5.7 8.6
Moderate 4 11.4 11.4 20.0
High 10 28.6 28.6 48.6
Very High 18 51.4 51.4 100.0
Total 35 100.0 100.0
Importance to Port Users: Canteen/Catering Services
Frequency Percent Valid Percent Cumulative Percent
Valid Very Low 1 2.9 2.9 2.9
Low 2 5.7 5.7 8.6
Moderate 4 11.4 11.4 20.0
High 8 22.9 22.9 42.9
Very High 20 57.1 57.1 100.0
Total 35 100.0 100.0
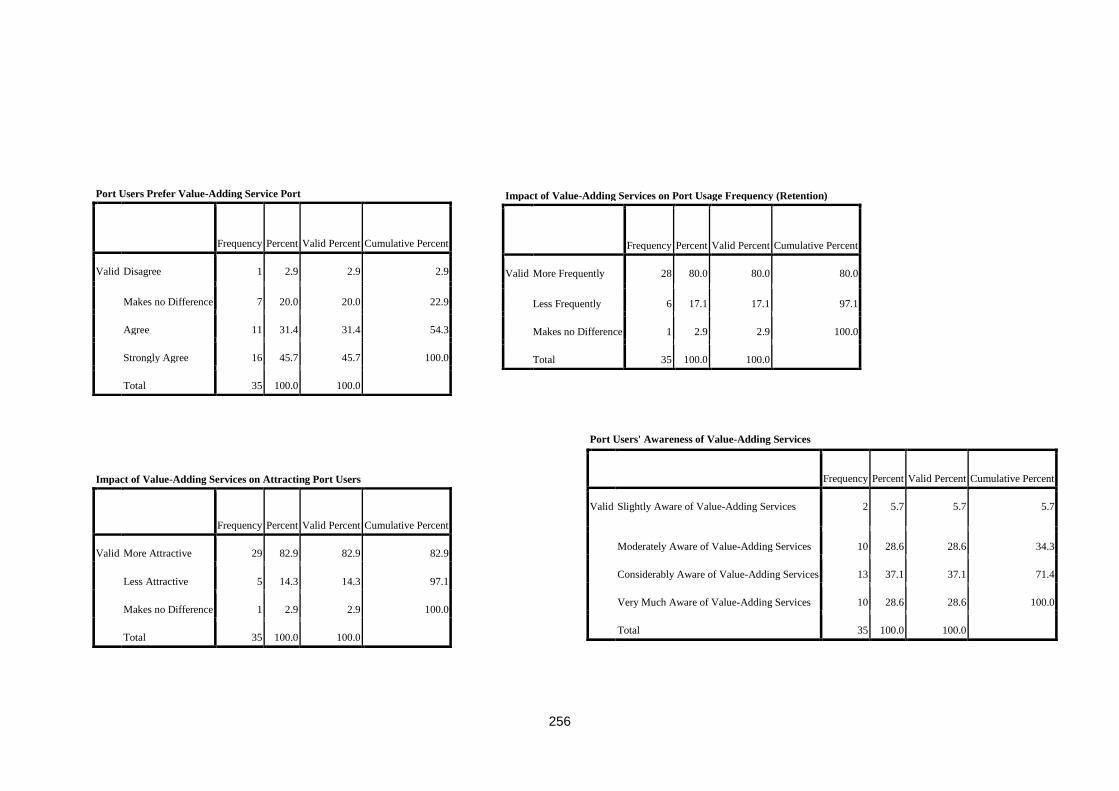
256
Port Users Prefer Value-Adding Service Port
Frequency Percent Valid Percent Cumulative Percent
Valid Disagree 1 2.9 2.9 2.9
Makes no Difference 7 20.0 20.0 22.9
Agree 11 31.4 31.4 54.3
Strongly Agree 16 45.7 45.7 100.0
Total 35 100.0 100.0
Impact of Value-Adding Services on Port Usage Frequency (Retention)
Frequency Percent Valid Percent Cumulative Percent
Valid More Frequently 28 80.0 80.0 80.0
Less Frequently 6 17.1 17.1 97.1
Makes no Difference 1 2.9 2.9 100.0
Total 35 100.0 100.0
Port Users' Awareness of Value-Adding Services
Frequency Percent Valid Percent Cumulative Percent
Valid Slightly Aware of Value-Adding Services 2 5.7 5.7 5.7
Moderately Aware of Value-Adding Services 10 28.6 28.6 34.3
Considerably Aware of Value-Adding Services 13 37.1 37.1 71.4
Very Much Aware of Value-Adding Services 10 28.6 28.6 100.0
Total 35 100.0 100.0
Impact of Value-Adding Services on Attracting Port Users
Frequency Percent Valid Percent Cumulative Percent
Valid More Attractive 29 82.9 82.9 82.9
Less Attractive 5 14.3 14.3 97.1
Makes no Difference 1 2.9 2.9 100.0
Total 35 100.0 100.0

257
Extent of considering other port selection criteria port users
Extent of Offering Value-Adding Services in the Port
Frequency Percent Valid Percent Cumulative Percent
Valid Value-Adding Services are not in Existence 3 8.6 8.6 8.6
Value-Adding Services are Scarcely Offered 2 5.7 5.7 14.3
Value-Adding Services are Moderately Offered 14 40.0 40.0 54.3
Value-Adding Services are Offered Considerably 14 40.0 40.0 94.3
Offering of Value-Adding Services is Very High 2 5.7 5.7 100.0
Total 35 100.0 100.0
Port Location
Frequency Percent Valid Percent Cumulative Percent
Valid High 11 31.4 31.4 31.4
Very High 24 68.6 68.6 100.0
Total 35 100.0 100.0
Port Service Reliability
Frequency Percent Valid Percent Cumulative Percent
Valid High 11 31.4 31.4 31.4
Very High 24 68.6 68.6 100.0
Total 35 100.0 100.0

258
Cargo Handling Equipment
Frequency Percent Valid Percent Cumulative Percent
Valid
Moderate 1 2.9 2.9 2.9
High 8 22.9 22.9 25.7
Very High 26 74.3 74.3 100.0
Total 35 100.0 100.0
Infrastructure
Frequency Percent
Valid
Percent
Cumulative
Percent
Valid High 12 34.3 34.3 34.3
Very
High
23 65.7 65.7 100.0
Total 35 100.0 100.0
Port Charges
Frequency Percent Valid Percent Cumulative Percent
Valid
Moderate 1 2.9 2.9 2.9
High 10 28.6 28.6 31.4
Very High 24 68.6 68.6 100.0
Total 35 100.0 100.0
Management Structure of the Port (eg. Landlord-Operator)
Frequency Percent Valid Percent Cumulative Percent
Valid Very Low 2 5.7 5.7 5.7
Moderate 1 2.9 2.9 8.6
High 10 28.6 28.6 37.1
Very High 22 62.9 62.9 100.0
Total 35 100.0 100.0
Value-Adding Services (VAS)
Frequency Percent Valid Percent Cumulative Percent
Valid Moderate 3 8.6 8.6 8.6
High 6 17.1 17.1 25.7
Very High 26 74.3 74.3 100.0
Total 35 100.0 100.0
Capital to Start Business with a Port
Frequency Percent Valid Percent
Cumulative
Percent
Valid Low 1 2.9 2.9 2.9
High 7 20.0 20.0 22.9
Very High 27 77.1 77.1 100.0
Total 35 100.0 100.0

259
Stable Legislations
Frequency Percent Valid Percent Cumulative Percent
Valid
Low 1 2.9 2.9 2.9
Moderate 1 2.9 2.9 5.7
High 8 22.9 22.9 28.6
Very High 25 71.4 71.4 100.0
Total 35 100.0 100.0
Simplified Documentation Process
Frequency Percent Valid Percent
Cumulative
Percent
Valid
Moderate 4 11.4 11.4 11.4
High 7 20.0 20.0 31.4
Very High 24 68.6 68.6 100.0
Total 35 100.0 100.0
Security
Frequency Percent Valid Percent Cumulative Percent
Valid
Low 1 2.9 2.9 2.9
Moderate 2 5.7 5.7 8.6
High 12 34.3 34.3 42.9
Very High 20 57.1 57.1 100.0
Total 35 100.0 100.0
Number of Births
Frequency Percent Valid Percent Cumulative Percent
Valid Low 4 11.4 11.4 11.4
Moderate 5 14.3 14.3 25.7
High 7 20.0 20.0 45.7
Very High 19 54.3 54.3 100.0
Total 35 100.0 100.0
Skilled Manpower
Frequency Percent Valid Percent Cumulative Percent
Valid Moderate 2 5.7 5.7 5.7
High 10 28.6 28.6 34.3
Very High 23 65.7 65.7 100.0
Total 35 100.0 100.0
Service Quality
Frequency Percent Valid Percent Cumulative Percent
Valid Moderate 1 2.9 2.9 2.9
High 8 22.9 22.9 25.7
Very High 26 74.3 74.3 100.0
Total 35 100.0 100.0

260
Inter-modal Transport Facilitation
Frequency Percent Valid Percent Cumulative Percent
Valid Moderate 2 5.7 5.7 5.7
High 8 22.9 22.9 28.6
Very High 25 71.4 71.4 100.0
Total 35 100.0 100.0
Tide Variations
Frequency Percent Valid Percent Cumulative Percent
Valid Low 1 2.9 2.9 2.9
Moderate 6 17.1 17.1 20.0
High 7 20.0 20.0 40.0
Very High 21 60.0 60.0 100.0
Total 35 100.0 100.0
Quick Response
Frequency Percent Valid Percent Cumulative Percent
Valid Moderate 1 2.9 2.9 2.9
High 9 25.7 25.7 28.6
Very High 25 71.4 71.4 100.0
Total 35 100.0 100.0
Computerised/IT aided Operations
Frequency Percent Valid Percent Cumulative Percent
Valid Moderate 4 11.4 11.4 11.4
High 11 31.4 31.4 42.9
Very High 20 57.1 57.1 100.0
Total 35 100.0 100.0
Port Safety
Frequency Percent Valid Percent Cumulative Percent
Valid High 11 31.4 31.4 31.4
Very High 24 68.6 68.6 100.0
Total 35 100.0 100.0
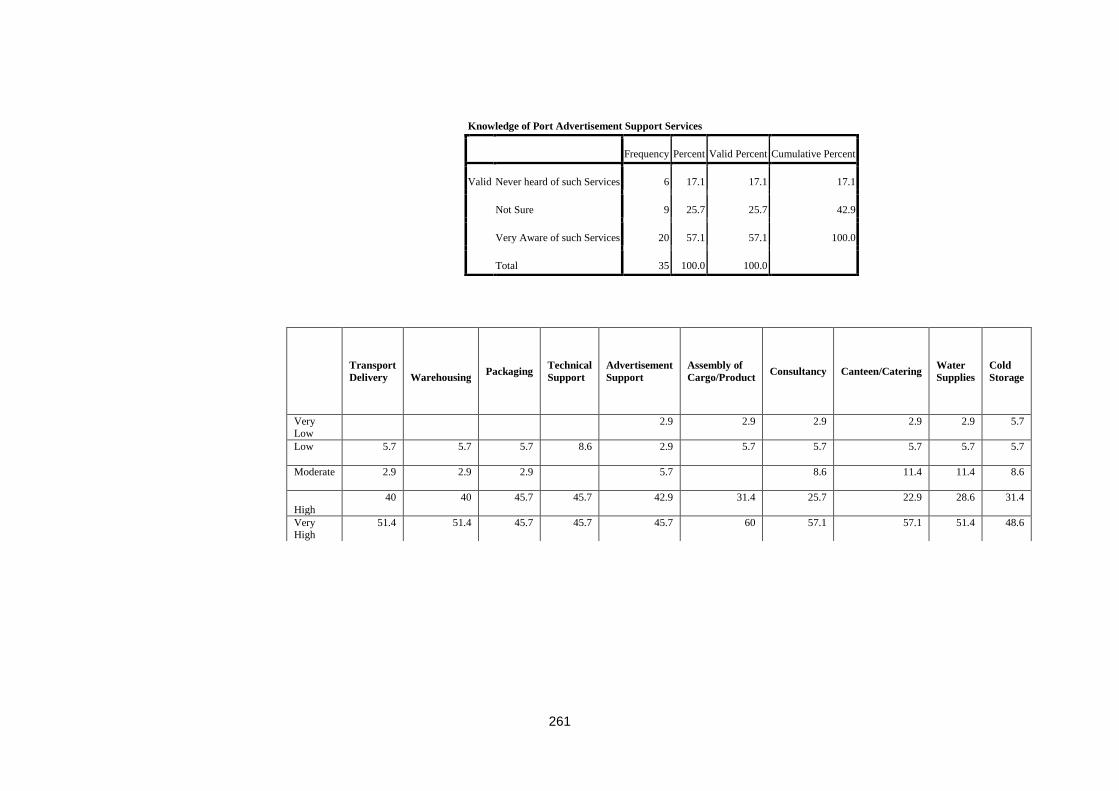
261
Knowledge of Port Advertisement Support Services
Frequency Percent Valid Percent Cumulative Percent
Valid Never heard of such Services 6 17.1 17.1 17.1
Not Sure 9 25.7 25.7 42.9
Very Aware of such Services 20 57.1 57.1 100.0
Total 35 100.0 100.0
Transport
Delivery
Warehousing
Packaging Technical
Support
Advertisement
Support
Assembly of
Cargo/Product Consultancy Canteen/Catering
Water
Supplies
Cold
Storage
Very Low
2.9 2.9 2.9 2.9 2.9 5.7
Low 5.7 5.7 5.7 8.6 2.9 5.7 5.7 5.7 5.7 5.7
Moderate 2.9 2.9 2.9
5.7
8.6 11.4 11.4 8.6
High
40 40 45.7 45.7 42.9 31.4 25.7 22.9 28.6 31.4
Very High
51.4 51.4 45.7 45.7 45.7 60 57.1 57.1 51.4 48.6

262
Extent of Offering Value-Adding Services in the Port based on Economies
Economies
Total
Developing Economies
(Egypt)
Developed
Economies
Developing Economies
(Nigeria) E
xte
nt
of
off
erin
g V
alue-A
dd
ing
Ser
vic
es i
n t
he
Po
rt
Value-Adding Services are not in
Existence
C
oun
t
& %
w
ith
in
Eco
no
mie
s
3 0 0 3
8.6% .0% .0% 2.7%
Value-Adding Services are Scarcely
Offered
2 6 9 17
5.7% 16.2% 23.1% 15.3%
Value-Adding Services are
Moderately Offered
14 7 20 41
40.0% 18.9% 51.3% 36.9%
Value-Adding Services are Offered
Considerably
14 15 6 35
40.0% 40.5% 15.4% 31.5%
Offering of Value-Adding Services
is Very High
2 9 4 15
5.7% 24.3% 10.3% 13.5%
Total Count
%
within Economies
35 37 39 111
100.0% 100.0% 100.0% 100.0%

263
Appendix 6 - Results of Statistical Data Exploration from Ports in Developing Economies (Nigeria)
Highest Qualification Category
Frequency Percent Valid Percent Cumulative Percent
Valid Lower than High School 1 2.6 2.6 2.6
High School 13 33.3 33.3 35.9
Bachelor Degree 15 38.5 38.5 74.4
Post Graduate Degree 10 25.6 25.6 100.0
Total 39 100.0 100.0
Port Service Area
Frequency Percent Valid Percent Cumulative Percent
Valid Stevedoring 11 28.2 28.2 28.2
Importing 4 10.3 10.3 38.5
Freight Forwarding 3 7.7 7.7 46.2
Exporting 3 7.7 7.7 53.8
Shipping Services 7 17.9 17.9 71.8
Others 11 28.2 28.2 100.0
Total 39 100.0 100.0
Availability of Value-Adding Services
Frequency Percent Valid Percent Cumulative Percent
Valid YES 31 79.5 79.5 79.5
NO 8 20.5 20.5 100.0
Total 39 100.0 100.0

264
Likely Usage Rate- Transport Delivery Services
Frequency Percent Valid Percent Cumulative Percent
Valid Very Low 2 5.1 5.1 5.1
Low 3 7.7 7.7 12.8
Moderate 6 15.4 15.4 28.2
High 10 25.6 25.6 53.8
Very High 18 46.2 46.2 100.0
Total 39 100.0 100.0
Likely Usage Rate- Packaging Services
Frequency Percent Valid Percent Cumulative Percent
Valid Very Low 9 23.1 23.1 23.1
Low 8 20.5 20.5 43.6
Moderate 9 23.1 23.1 66.7
High 10 25.6 25.6 92.3
Very High 3 7.7 7.7 100.0
Total 39 100.0 100.0
Likely Usage Rate- Warehousing Services
Frequency Percent Valid Percent Cumulative Percent
Valid Very Low 5 12.8 12.8 12.8
Low 3 7.7 7.7 20.5
Moderate 6 15.4 15.4 35.9
High 14 35.9 35.9 71.8
Very High 11 28.2 28.2 100.0
Total 39 100.0 100.0
Likely Usage Rate- Technical Support Services
Frequency Percent Valid Percent Cumulative Percent
Valid Very Low 2 5.1 5.1 5.1
Low 4 10.3 10.3 15.4
Moderate 7 17.9 17.9 33.3
High 15 38.5 38.5 71.8
Very High 11 28.2 28.2 100.0
Total 39 100.0 100.0
Likely Usage Rate- Consultancy Services
Frequency Percent Valid Percent Cumulative Percent
Valid Very Low 9 23.1 23.1 23.1
Low 8 20.5 20.5 43.6
Moderate 10 25.6 25.6 69.2
High 5 12.8 12.8 82.1
Very High 7 17.9 17.9 100.0
Total 39 100.0 100.0

265
Likely Usage Rate- Advertisement Support Services
Frequency Percent Valid Percent Cumulative Percent
Valid Very Low 7 17.9 17.9 17.9
Low 10 25.6 25.6 43.6
Moderate 4 10.3 10.3 53.8
High 14 35.9 35.9 89.7
Very High 4 10.3 10.3 100.0
Total 39 100.0 100.0
Likely Usage Rate- Canteen/Catering Services
Frequency Percent Valid Percent Cumulative Percent
Valid Very Low 4 10.3 10.3 10.3
Low 6 15.4 15.4 25.6
Moderate 11 28.2 28.2 53.8
High 10 25.6 25.6 79.5
Very High 8 20.5 20.5 100.0
Total 39 100.0 100.0
Likely Usage Rate- Assembly of Cargo/Product Services
Frequency Percent Valid Percent Cumulative Percent
Valid Very Low 8 20.5 20.5 20.5
Low 5 12.8 12.8 33.3
Moderate 11 28.2 28.2 61.5
High 7 17.9 17.9 79.5
Very High 8 20.5 20.5 100.0
Total 39 100.0 100.0
Likely Usage Rate- Cold Store Services
Frequency Percent Valid Percent Cumulative Percent
Valid Very Low 12 30.8 30.8 30.8
Low 5 12.8 12.8 43.6
Moderate 10 25.6 25.6 69.2
High 6 15.4 15.4 84.6
Very High 6 15.4 15.4 100.0
Total 39 100.0 100.0
Likely Usage Rate- Water Supplies Services
Frequency Percent Valid Percent Cumulative Percent
Valid Very Low 5 12.8 12.8 12.8
Low 4 10.3 10.3 23.1
Moderate 12 30.8 30.8 53.8
High 7 17.9 17.9 71.8
Very High 11 28.2 28.2 100.0
Total 39 100.0 100.0

266
Availability Status- Transport Delivery Services
Frequency Percent Valid Percent Cumulative Percent
Valid Available 27 69.2 69.2 69.2
Not Available 11 28.2 28.2 97.4
Not Sure 1 2.6 2.6 100.0
Total 39 100.0 100.0
Availability Status- Warehousing Services
Frequency Percent Valid Percent Cumulative Percent
Valid Available 27 69.2 69.2 69.2
Not Available 9 23.1 23.1 92.3
Not Sure 3 7.7 7.7 100.0
Total 39 100.0 100.0
Availability Status- Packaging Services
Frequency Percent Valid Percent Cumulative Percent
Valid Available 16 41.0 41.0 41.0
Not Available 13 33.3 33.3 74.4
Not Sure 10 25.6 25.6 100.0
Total 39 100.0 100.0
Availability Status- Advertisement Support Services
Frequency Percent Valid Percent Cumulative Percent
Valid Available 12 30.8 30.8 30.8
Not Available 16 41.0 41.0 71.8
Not Sure 11 28.2 28.2 100.0
Total 39 100.0 100.0
Availability Status- Technical Support Services
Frequency Percent Valid Percent Cumulative Percent
Valid Available 15 38.5 38.5 38.5
Not Available 13 33.3 33.3 71.8
Not Sure 11 28.2 28.2 100.0
Total 39 100.0 100.0
Availability Status- Consultancy Services
Frequency Percent Valid Percent
Cumulative
Percent
Valid Available 14 35.9 35.9 35.9
Not Available 13 33.3 33.3 69.2
Not Sure 12 30.8 30.8 100.0
Total 39 100.0 100.0

267
Availability Status- Water Supplies Services
Frequency Percent Valid Percent Cumulative Percent
Valid Available 32 82.1 82.1 82.1
Not Available 3 7.7 7.7 89.7
Not Sure 4 10.3 10.3 100.0
Total 39 100.0 100.0
Availability Status- Assembly of Cargo/Product Services
Frequency Percent Valid Percent Cumulative Percent
Valid Available 16 41.0 41.0 41.0
Not Available 13 33.3 33.3 74.4
Not Sure 10 25.6 25.6 100.0
Total 39 100.0 100.0
Availability Status- Canteen/Catering Services
Frequency Percent Valid Percent Cumulative Percent
Valid Available 29 74.4 74.4 74.4
Not Available 7 17.9 17.9 92.3
Not Sure 3 7.7 7.7 100.0
Total 39 100.0 100.0
Availability Status- Cold Store Services
Frequency Percent Valid Percent Cumulative Percent
Valid Available 21 53.8 53.8 53.8
Not Available 7 17.9 17.9 71.8
Not Sure 11 28.2 28.2 100.0
Total 39 100.0 100.0

268
Port Users Prefer Value-Adding Service Port
Frequency Percent Valid Percent Cumulative Percent
Valid Strongly Disagree 2 5.1 5.1 5.1
Disagree 1 2.6 2.6 7.7
Makes no Difference 8 20.5 20.5 28.2
Agree 14 35.9 35.9 64.1
Strongly Agree 14 35.9 35.9 100.0
Total 39 100.0 100.0
Port Users' Awareness of Value-Adding Services
Frequency Percent Valid Percent Cumulative Percent
Valid
No Awareness of Value-Adding Services 2 5.1 5.1 5.1
Slightly Aware of Value-Adding Services 2 5.1 5.1 10.3
Moderately Aware of Value-Adding Services 23 59.0 59.0 69.2
Considerably Aware of Value-Adding Services 7 17.9 17.9 87.2
Very Much Aware of Value-Adding Services 5 12.8 12.8 100.0
Total 39 100.0 100.0
Impact of Value-Adding Services on Attracting Port Users
Frequency Percent Valid Percent Cumulative Percent
Valid More Attractive 32 82.1 82.1 82.1
Less Attractive 3 7.7 7.7 89.7
Makes no Difference 4 10.3 10.3 100.0
Total 39 100.0 100.0
Impact of Value-Adding Services on Port Usage Frequency (Retention)
Frequency Percent Valid Percent Cumulative Percent
Valid More Frequently 28 71.8 71.8 71.8
Less Frequently 6 15.4 15.4 87.2
Makes no Difference 5 12.8 12.8 100.0
Total 39 100.0 100.0

269
Importance to Port Users: Transport Delivery Services
Frequency Percent Valid Percent Cumulative Percent
Valid Very Low 1 2.6 2.6 2.6
Moderate 7 17.9 17.9 20.5
High 11 28.2 28.2 48.7
Very High 20 51.3 51.3 100.0
Total 39 100.0 100.0
Importance to Port Users: Warehousing Services
Frequency Percent Valid Percent Cumulative Percent
Valid Very Low 3 7.7 7.7 7.7
Low 4 10.3 10.3 17.9
Moderate 9 23.1 23.1 41.0
High 9 23.1 23.1 64.1
Very High 14 35.9 35.9 100.0
Total 39 100.0 100.0
Importance to Port Users: Packaging Services
Frequency Percent Valid Percent Cumulative Percent
Valid Very Low 3 7.7 7.7 7.7
Low 9 23.1 23.1 30.8
Moderate 10 25.6 25.6 56.4
High 11 28.2 28.2 84.6
Very High 6 15.4 15.4 100.0
Total 39 100.0 100.0
Importance to Port Users: Consultancy Services
Frequency Percent Valid Percent Cumulative Percent
Valid Very Low 1 2.6 2.6 2.6
Low 10 25.6 25.6 28.2
Moderate 14 35.9 35.9 64.1
High 11 28.2 28.2 92.3
Very High 3 7.7 7.7 100.0
Total 39 100.0 100.0
Importance to Port Users: Advertisement Support Services
Frequency Percent Valid Percent Cumulative Percent
Valid Very Low 4 10.3 10.3 10.3
Low 11 28.2 28.2 38.5
Moderate 7 17.9 17.9 56.4
High 13 33.3 33.3 89.7
Very High 4 10.3 10.3 100.0
Total 39 100.0 100.0
Importance to Port Users: Technical Support Services
Frequency Percent Valid Percent Cumulative Percent
Valid Very Low 1 2.6 2.6 2.6
Low 4 10.3 10.3 12.8
Moderate 11 28.2 28.2 41.0
High 12 30.8 30.8 71.8
Very High 11 28.2 28.2 100.0
Total 39 100.0 100.0

270
Importance to Port Users: Assembly of Cargo/Product Services
Frequency Percent Valid Percent Cumulative Percent
Valid Very Low 4 10.3 10.3 10.3
Low 11 28.2 28.2 38.5
Moderate 9 23.1 23.1 61.5
High 7 17.9 17.9 79.5
Very High 8 20.5 20.5 100.0
Total 39 100.0 100.0
Importance to Port Users: Canteen/Catering Services
Frequency Percent Valid Percent Cumulative Percent
Valid Very Low 1 2.6 2.6 2.6
Low 7 17.9 17.9 20.5
Moderate 12 30.8 30.8 51.3
High 12 30.8 30.8 82.1
Very High 7 17.9 17.9 100.0
Total 39 100.0 100.0
Importance to Port Users: Water Supplies Services
Frequency Percent Valid Percent Cumulative Percent
Valid Very Low 1 2.6 2.6 2.6
Low 3 7.7 7.7 10.3
Moderate 10 25.6 25.6 35.9
High 14 35.9 35.9 71.8
Very High 11 28.2 28.2 100.0
Total 39 100.0 100.0
Extent of Offering Value-Adding Services in the Port
Frequency Percent Valid Percent Cumulative Percent
Valid Value-Adding Services are Scarcely Offered 9 23.1 23.1 23.1
Value-Adding Services are Moderately Offered 20 51.3 51.3 74.4
Value-Adding Services are Offered Considerably 6 15.4 15.4 89.7
Offering of Value-Adding Services is Very High 4 10.3 10.3 100.0
Total 39 100.0 100.0
Importance to Port Users: Cold Store Services
Frequency Percent Valid Percent Cumulative Percent
Valid Very Low 5 12.8 12.8 12.8
Low 7 17.9 17.9 30.8
Moderate 10 25.6 25.6 56.4
High 11 28.2 28.2 84.6
Very High 6 15.4 15.4 100.0
Total 39 100.0 100.0
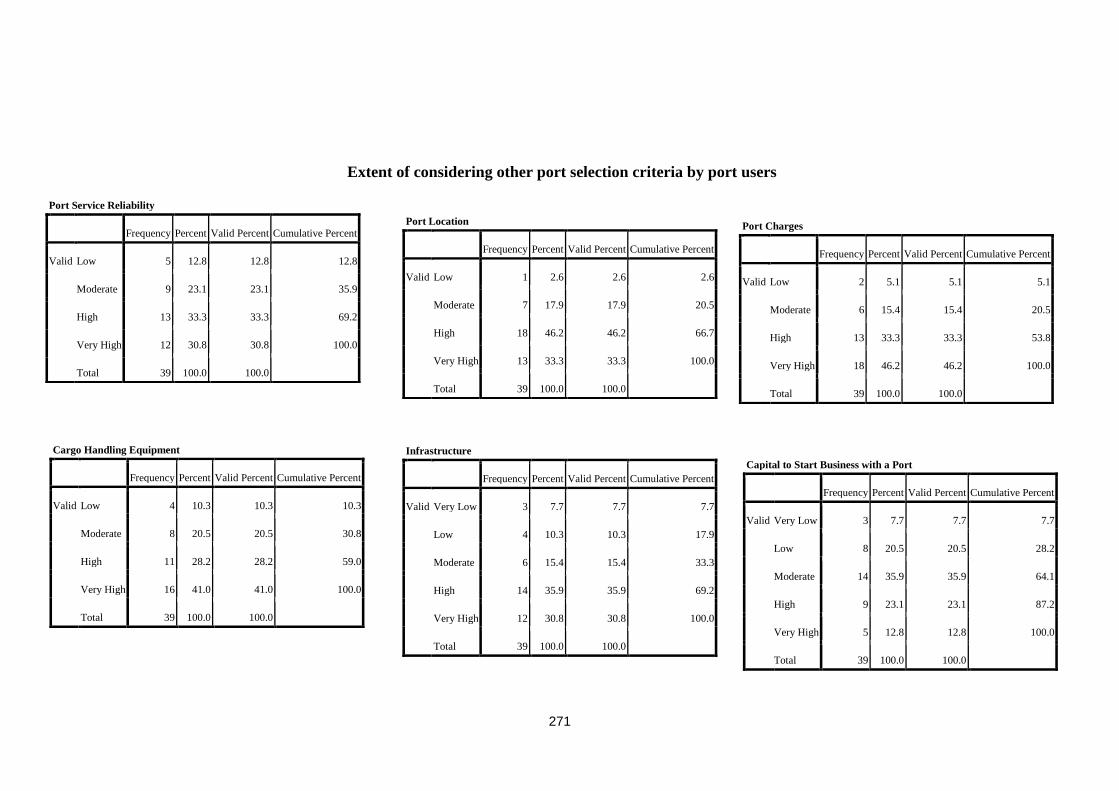
271
Extent of considering other port selection criteria by port users
Port Service Reliability
Frequency Percent Valid Percent Cumulative Percent
Valid Low 5 12.8 12.8 12.8
Moderate 9 23.1 23.1 35.9
High 13 33.3 33.3 69.2
Very High 12 30.8 30.8 100.0
Total 39 100.0 100.0
Port Location
Frequency Percent Valid Percent Cumulative Percent
Valid Low 1 2.6 2.6 2.6
Moderate 7 17.9 17.9 20.5
High 18 46.2 46.2 66.7
Very High 13 33.3 33.3 100.0
Total 39 100.0 100.0
Port Charges
Frequency Percent Valid Percent Cumulative Percent
Valid Low 2 5.1 5.1 5.1
Moderate 6 15.4 15.4 20.5
High 13 33.3 33.3 53.8
Very High 18 46.2 46.2 100.0
Total 39 100.0 100.0
Cargo Handling Equipment
Frequency Percent Valid Percent Cumulative Percent
Valid Low 4 10.3 10.3 10.3
Moderate 8 20.5 20.5 30.8
High 11 28.2 28.2 59.0
Very High 16 41.0 41.0 100.0
Total 39 100.0 100.0
Infrastructure
Frequency Percent Valid Percent Cumulative Percent
Valid Very Low 3 7.7 7.7 7.7
Low 4 10.3 10.3 17.9
Moderate 6 15.4 15.4 33.3
High 14 35.9 35.9 69.2
Very High 12 30.8 30.8 100.0
Total 39 100.0 100.0
Capital to Start Business with a Port
Frequency Percent Valid Percent Cumulative Percent
Valid Very Low 3 7.7 7.7 7.7
Low 8 20.5 20.5 28.2
Moderate 14 35.9 35.9 64.1
High 9 23.1 23.1 87.2
Very High 5 12.8 12.8 100.0
Total 39 100.0 100.0

272
Security
Frequency Percent Valid Percent Cumulative Percent
Valid Very Low 3 7.7 7.7 7.7
Low 1 2.6 2.6 10.3
Moderate 8 20.5 20.5 30.8
High 14 35.9 35.9 66.7
Very High 13 33.3 33.3 100.0
Total 39 100.0 100.0
Value-Adding Services (VAS)
Frequency Percent Valid Percent Cumulative Percent
Valid Very Low 4 10.3 10.3 10.3
Low 6 15.4 15.4 25.6
Moderate 8 20.5 20.5 46.2
High 14 35.9 35.9 82.1
Very High 7 17.9 17.9 100.0
Total 39 100.0 100.0
Stable Legislations
Frequency Percent Valid Percent Cumulative Percent
Valid Very Low 5 12.8 12.8 12.8
Low 5 12.8 12.8 25.6
Moderate 12 30.8 30.8 56.4
High 10 25.6 25.6 82.1
Very High 7 17.9 17.9 100.0
Total 39 100.0 100.0
Management Structure of the Port (eg. Landlord-Operator)
Frequency Percent Valid Percent Cumulative Percent
Valid Very Low 2 5.1 5.1 5.1
Low 3 7.7 7.7 12.8
Moderate 9 23.1 23.1 35.9
High 16 41.0 41.0 76.9
Very High 9 23.1 23.1 100.0
Total 39 100.0 100.0
Simplified Documentation Process
Frequency Percent Valid Percent Cumulative Percent
Valid Low 6 15.4 15.4 15.4
Moderate 5 12.8 12.8 28.2
High 20 51.3 51.3 79.5
Very High 8 20.5 20.5 100.0
Total 39 100.0 100.0
Number of Births
Frequency Percent Valid Percent Cumulative Percent
Valid Low 5 12.8 12.8 12.8
Moderate 5 12.8 12.8 25.6
High 11 28.2 28.2 53.8
Very High 18 46.2 46.2 100.0
Total 39 100.0 100.0

273
Service Quality
Frequency Percent Valid Percent Cumulative Percent
Valid Very Low 2 5.1 5.1 5.1
Low 7 17.9 17.9 23.1
Moderate 9 23.1 23.1 46.2
High 10 25.6 25.6 71.8
Very High 11 28.2 28.2 100.0
Total 39 100.0 100.0
Skilled Manpower
Frequency Percent Valid Percent Cumulative Percent
Valid Very Low 2 5.1 5.1 5.1
Low 1 2.6 2.6 7.7
Moderate 10 25.6 25.6 33.3
High 14 35.9 35.9 69.2
Very High 12 30.8 30.8 100.0
Total 39 100.0 100.0
Inter-modal Transport Facilitation
Frequency Percent Valid Percent
Cumulative
Percent
Valid Very Low 4 10.3 10.3 10.3
Low 6 15.4 15.4 25.6
Moderate 12 30.8 30.8 56.4
High 7 17.9 17.9 74.4
Very High 10 25.6 25.6 100.0
Total 39 100.0 100.0
Computerised/IT aided Operations
Frequency Percent Valid Percent Cumulative Percent
Valid Very Low 1 2.6 2.6 2.6
Low 8 20.5 20.5 23.1
Moderate 11 28.2 28.2 51.3
High 8 20.5 20.5 71.8
Very High 11 28.2 28.2 100.0
Total 39 100.0 100.0
Tide Variations
Frequency Percent Valid Percent Cumulative Percent
Valid Very Low 3 7.7 7.7 7.7
Low 7 17.9 17.9 25.6
Moderate 16 41.0 41.0 66.7
High 7 17.9 17.9 84.6
Very High 6 15.4 15.4 100.0
Total 39 100.0 100.0

274
Quick Response
Frequency Percent Valid Percent Cumulative Percent
Valid Very Low 2 5.1 5.1 5.1
Low 8 20.5 20.5 25.6
Moderate 7 17.9 17.9 43.6
High 13 33.3 33.3 76.9
Very High 9 23.1 23.1 100.0
Total 39 100.0 100.0
Port Safety
Frequency Percent Valid Percent Cumulative Percent
Valid Low 5 12.8 12.8 12.8
Moderate 8 20.5 20.5 33.3
High 12 30.8 30.8 64.1
Very High 14 35.9 35.9 100.0
Total 39 100.0 100.0
Knowledge of Port Advertisement Support Services
Frequency Percent Valid Percent Cumulative Percent
Valid Never heard of such Services 14 35.9 35.9 35.9
Not Sure 10 25.6 25.6 61.5
Very Aware of such Services 15 38.5 38.5 100.0
Total 39 100.0 100.0

Appendix 7- Port Service Area, Qualifications and Years in Port Business
Table A: Port Service Area * Highest Qualification Category Crosstabulation
Highest Qualification Category
Total
Lower than
High
School
High
School
Bachelor
Degree
Post
Graduate
Degree Others
Port
Service
Area
Stevedoring Count
% of
Total
0 5 12 3 0 20
.0% 4.5% 10.8% 2.7% .0% 18.0%
Importing Count
% of
Total
0 4 4 4 1 13
.0% 3.6% 3.6% 3.6% .9% 11.7%
Freight
Forwarding
Count
% of
Total
0 1 12 4 0 17
.0% .9% 10.8% 3.6% .0% 15.3%
Exporting Count
% of
Total
1 2 2 3 2 10
.9% 1.8% 1.8% 2.7% 1.8% 9.0%
Shipping
Services
Count
% of
Total
1 1 15 10 0 27
.9% .9% 13.5% 9.0% .0% 24.3%
Others Count
% of
Total
1 5 10 8 0 24
.9% 4.5% 9.0% 7.2% .0% 21.6%
Total Count
% of
Total
3 18 55 32 3 111
2.7% 16.2% 49.5% 28.8% 2.7% 100.0%
Port Service Areas and Port Qualification
Details of a cross-tabulation of port service areas and port users‟ qualification levels
carried out are found in the table A. The figure A (below) depicted the results of this
analysis, showing that many of the port users (49.5% in total) were qualified at
bachelor degree level.
In a breakdown of this analysis, except in the area of exporting service where with
2.7% there emerged more post graduate degree holders, port users with bachelor

276
degrees topped in the areas of stevedoring, freight forwarding, shipping and other
services by 10.8%, 10.8%, 13.5% and 9.0% respectively. There were fewer port users
with „lower than high school‟ qualification (2.7%), mainly in the areas of exporting,
shipping and „others‟.
The trend herein indicated that in regards to qualification, there were more port users
qualified to bachelor degree level, followed by those who have post graduate degrees,
and high school qualification, while is a tie in the proportion of port users with „lower
than high school‟ and „others‟ qualification
Summary- Port Users’ Qualifications and Years in Port Business
Figure A: Boxplot data exploration
Highest Qualification Category
Others Post Graduate Bachelor High School Lower than
High School
50
40
30
20
10
0
55
46
39
Ye
ars
of
Po
rt b
us
ine
ss
Ex
pe
rie
nc
e
Ex
pe
rie
nc
e

277
Mean Analysis for years in port Business
Table B
Highest Qualification Categories
Yea
rs of
exp
erie
nce
in P
ort
bu
sin
ess
Lower than
High School
High
School
Bachelor
Degree
Post-graduate
Degree
Others
Mean
21.00
12.53
11.62
16.39
27.33
Median
30.00
8.00
10.00
14.00
30.00
Std.
Dev
16.462 8.110 8.790
11.692
6.429
Mean values are models that stand as representatives of a given set of data under
investigation. Given the years of experience mean values of 12.53 and 11.62,
respectively for port users qualified at high school and bachelor degree levels, as
shown in table B, it thus translates that on average terms, port users in these
categories have so far spent about 13 and 12 years in port business. Indicating that
there was no great difference in terms of years spent in port business between port
users qualified at high school or bachelor degree levels.
The small difference in the two groups could suggest that furthering of education pays
good dividends in industrial career pursuit and job retention. For example, for those
seeking career paths in the port industry/maritime sector, it could be the case that
some of those qualified at high school level would search for job for a long time, only
to gain entrance into the industry along with their colleagues who opted to further
their educations to bachelor degree levels.
Other noteworthy trend is that the years of experience mean values for those in the
„lower than high school‟ and „post graduate degree‟ were 21.00 and 16.39
respectively.

278
Essentially, the indication is that these categories of port users have spent more years
in the port industry than those in other qualification groups. While in an overall sense,
port users qualified at the „lower than high school level‟ have the highest years of
industrial experience, it would be noted that there exists a gap in career experience in
the aspect of attending a higher institution.
Incidentally, all the outliers seen in figure A, (above) occurred within port users‟
categories qualified to bachelors and post graduate degree levels. Of the outliers, there
were port users with up to 40 and 50 years of port industry experience. Statistically,
outliers are values or points that lie far from the majority of the observations and have
the capacity of exerting strong influence on models (Hutcheson and Sofroniou, 1999).
Another point of interest is that despite the duration spent in formal education, few of
the port users who had the outstanding outliers values for years of experience hold
qualifications in the categories of bachelor and post graduate degrees. Given trends of
outcome, it implies that some of the few port-users who have spent the most number
of years in the port business (industry) have got at least a bachelors degree.
While port users with qualifications in the category of „others‟ have the highest mean
value of 27.33, it is expedient to point out that one of the main reasons for including
„others‟ qualification category was to have an indication of the extent port users
undertake other or additional qualifications.

279
Appendix 8 - Chi-Square Test Crosstabulation Distribution of Data
VAS ATTRACTION-
Table C- Value-adding services port preference vs. port users‟ attraction
Impact of Value-Adding Services on
Attracting Port Users
Total More Attractive Less Attractive
Port
Use
rs P
refe
r V
alu
e-A
dd
ing
Ser
vic
e
Port
Strongly
Disagree
C
ount
&
%
w
ith
in
Eco
nom
ies
1 2 3
1.0% 2.0% 3.0%
Disagree 1 6 7
1.0% 6.0% 7.0%
Makes no
Difference
9 7 16
9.0% 7.0% 16.0%
Agree 31 2 33
31.0% 2.0% 33.0%
Strongly Agree 41 0 41
41.0% .0% 41.0%
Total Count 83 17 100
% of
Total
83.0% 17.0% 100.0%
The distribution of data used in generating the chi-square test for the attraction of port
users to a port is shown in table C above. It is seen that 83.0% of the respondents
indicated that value-adding services has the potentials to attract more port users,
which far outweighs the 17.0% with a contrary view that the services would make a
port less attractive to port users. In a similar trend, 74.0% of respondents (i.e. who
indicated agree and strongly agree), confirmed the assertion „port users prefer value-
adding service port‟, as opposed to the 10.0% of respondents who jointly opted for the
„disagree‟ and „strongly disagree‟ options in opposition to the statement.

280
VAS RETENTION
Table D is presented to show the distribution of data used for the chi-square
crosstabulation test for retention of port users.
Table D : Port Users Prefer Value-Adding Service Port * Impact of Value-Adding Services
on Port Usage Frequency (Retention) Crosstabulation
Impact of Value-Adding Services on Port
Usage Frequency (Retention)
Total More Frequently Less Frequently
Port
Use
rs P
refe
r V
alue-
Addin
g S
ervic
e
Port
Strongly Disagree 0 2 2
C
ount
&
%
w
ithin
Eco
nom
ies
.0% 2.0% 2.0%
Disagree 1 4 5
1.0% 4.1% 5.1%
Makes no Difference 10 7 17
10.2% 7.1% 17.3%
Agree 26 7 33
26.5% 7.1% 33.7%
Strongly Agree 40 1 41
40.8% 1.0% 41.8%
Total Count 77 21 98
% of Total 78.6% 21.4% 100.0%
Observation showed that 78.6% of the respondents were of the opinion that value-
adding services have the impact of retaining port users, which opinion was only
opposed by 21.4% of respondents with contrary view. These are related to data on
using the ports „more frequently‟ or „less frequently‟. On a related consideration, a
total of 75.5% respondents jointly indicated the „agree‟ and „strongly agree‟ opinions
in affirmation to the statement „port users prefer value-adding service port‟. In total,
barely 7.1% of the respondents opted for the „disagree‟ and „strongly disagree‟
opinions to the same statement „port users prefer value-adding service port‟. These
were clear pointers that port users both prefer and would be retained in a port that
offers value-adding services.