
University of Groningen Molecular genetic studies in ... · For qRT-PCR, LDM was applied on 25 SCC...
21
University of Groningen Molecular genetic studies in epithelial cells of lung cancer and COPD patients Boelens, Mirjam Catharina IMPORTANT NOTE: You are advised to consult the publisher's version (publisher's PDF) if you wish to cite from it. Please check the document version below. Document Version Publisher's PDF, also known as Version of record Publication date: 2008 Link to publication in University of Groningen/UMCG research database Citation for published version (APA): Boelens, M. C. (2008). Molecular genetic studies in epithelial cells of lung cancer and COPD patients. s.n. Copyright Other than for strictly personal use, it is not permitted to download or to forward/distribute the text or part of it without the consent of the author(s) and/or copyright holder(s), unless the work is under an open content license (like Creative Commons). Take-down policy If you believe that this document breaches copyright please contact us providing details, and we will remove access to the work immediately and investigate your claim. Downloaded from the University of Groningen/UMCG research database (Pure): http://www.rug.nl/research/portal. For technical reasons the number of authors shown on this cover page is limited to 10 maximum. Download date: 23-07-2019
Transcript of University of Groningen Molecular genetic studies in ... · For qRT-PCR, LDM was applied on 25 SCC...

University of Groningen
Molecular genetic studies in epithelial cells of lung cancer and COPD patientsBoelens, Mirjam Catharina
IMPORTANT NOTE: You are advised to consult the publisher's version (publisher's PDF) if you wish to cite fromit. Please check the document version below.
Document VersionPublisher's PDF, also known as Version of record
Publication date:2008
Link to publication in University of Groningen/UMCG research database
Citation for published version (APA):Boelens, M. C. (2008). Molecular genetic studies in epithelial cells of lung cancer and COPD patients. s.n.
CopyrightOther than for strictly personal use, it is not permitted to download or to forward/distribute the text or part of it without the consent of theauthor(s) and/or copyright holder(s), unless the work is under an open content license (like Creative Commons).
Take-down policyIf you believe that this document breaches copyright please contact us providing details, and we will remove access to the work immediatelyand investigate your claim.
Downloaded from the University of Groningen/UMCG research database (Pure): http://www.rug.nl/research/portal. For technical reasons thenumber of authors shown on this cover page is limited to 10 maximum.
Download date: 23-07-2019
CH
APT
ER
Submitted
Mirjam C Boelens1,2, Klaas Kok3, Pieter van der Vlies3, Gerben van der Vries3, Hannie Sietsma1, Wim Timens1, Dirkje S Postma2, Harry J M Groen2, Anke van den Berg1
1Department of Pathology, 2Department of Pulmonology, 3Department of Genetics, University Medical Center Groningen, University of Groningen, Groningen, the Netherlands
SPECIFIC GENoMIC
ABERRATIoNS IN
PRIMARY SqUAMoUS
CELL LUNG CARCINoMA
WITH LYMPH NoDE oR
DISTANT ME TASTASIS
6

Abstract
Lung cancer is the most common type of cancer with the highest mortality worldwide. After surgical resection of the primary tumor, survival is especially low in patients presenting with distant metastases within the first two years after diagnosis. We analyzed a cohort of patients with primary squamous cell carcinoma (SCC) using array-based comparative genomic hybridization (aCGH) to identify chromosomal aberrations that are related to development of metastases. The cohort consisted of 34 patients with a follow-up of at least 5 years, including 15 without any metastases, 8 with metastases in regional lymph nodes only, and 11 with metastases exclusively in distant organs within two years after diagnosis. In the total group, several chromosomal aberrations were observed in at least 40%, i.e. genomic gains of 3q13-q29, 5p11-p15, 8q24, 19q13, 20p12-p13, and 22q11-q13, and losses of 3p12-p14, 3p24, 4p15, 4q33-q35, 5q14-q23, 5q31-q35, 8p21-p22, and 9p21-p24. Amplifications were observed at chromosomal regions 2p15-p16, 3q24-q29, 8p11-p12, 8q23-q24, and 12p12. These regions contain candidate oncogenes such as BCL11A, REL, ECT2, PIK3CA, ADAM9, MYC, and KRAS. Three out of eight SCC derived from patients with lymph node metastases showed a homozygously deleted region at 4q33-q34.1 in contrast to none of the 15 SCC derived from patients without metastases. In addition, SCC from patients with lymph node metastases had a significantly higher frequency of gains at 7q36, 8p12, 10q22, and 12p12, and loss at 4p14. Patients with SCC and distant metastases showed a significantly higher frequency of gain at 8q22-q24, and loss of 8p23 and 13q21. Significantly lower frequencies of gain at 2p12 and 2p16 and loss of 11q25 were observed in this patient group as compared to SCC from patients without metastases. In this study, we identified specific genomic aberrations in primary SCC that are related to lymph node and distant metastases. These loci can be further explored for their potential use as predictive or prognostic markers for patients with SCC.
chapter6
100
Introduction
Lung cancer is the most common type of cancer with the highest mortality worldwide and a 5-year overall survival of 15%. About 60 to 70% of lung cancer patients present with metastases at time of diagnosis. Furthermore, about 50% of the patients who present with resectable disease will develop metastases within 5 years. Squamous cell lung carcinoma (SCC) is one of the most common histological types of lung cancer. SCC patients may present already with regional lymph node metastases at the time of diagnosis and the risk of developing metastases in distant organs is particularly high in the first two years after diagnosis. Many patients develop metastases in bone, brains, contralateral lung, liver, and adrenal glands. It is generally assumed that disseminated lung tumor cells invade into regional lymph nodes via the lymphatic vessels and spread to distant organs via blood vessels. This difference in metastatic behavior may be caused by differences in genetic alterations in the primary SCC.
An increasing number of genomic aberrations has been observed in the progression from normal bronchial epithelium to invasive SCC1,2. Several recurrent chromosomal aberrations have been identified in SCC by CGH or array-based CGH (aCGH), including gains of 3q, 5p, and 8q and loss of 3p, 5q and 8p3-8. At the time of surgery, it is impossible to predict which primary tumor will develop metastases. Some (a)CGH-based studies investigated whether there is an association between genomic alterations in the primary lung tumor and its metastatic potential. In non-small cell lung cancer (NSCLC), associations were identified between gain on 1q and recurrence within 1 year5 and between gain on 7q and positive lymph nodes6. In SCC, associations were identified between gains on 2p, 7p, 7q, 20p, losses on 2q, 4q, 6p, 16p, 18q, 20q, 21q and metastases9. In most of these studies, no discrimination was made between adenocarcinoma (AC) and SCC or between lymph node and distant metastases.
To characterize genomic alterations in SCC associated with metastatic potential, we generated aCGH profiles from primary SCC obtained from patients with or without metastases. We selected SCC patients without any metastases and those with only lymph node metastases; both remained without distant metastases for at least 5 years. We also selected SCC patients who only developed metastases in distant organs within two years after diagnosis. The most common genomic aberrations in the total group and aberrations that were associated with metastatic potential were assessed.
metastasis-specificacghprofilesinscc
101
6

Methods
Patients and tissue specimensPatients were selected based on clinical follow-up data for at least 5 years and availability
of frozen tissue. Patients who were treated with chemotherapy before or directly after surgery were excluded. We selected a total of 34 patients who presented with centrally located primary squamous cell lung carcinoma (SCC) (Table 1, Supplementary table 1), including 15 patients without lymph node or distant organ metastases within 5 years after surgery; 8 patients with lymph node metastases at the time of surgery, but no distant metastases within 5 years after surgery; 11 patients presenting with distant metastases within 2 years after surgery (median 10 months, range 2-19) but without lymph node metastases. One patient of the ‘no metastases’ group died 3 years after surgery. In one patient of the distant metastases group, distant metastases presented at 28 months. Patients with both lymph node and distant metastases were excluded.
As a control for the qRT-PCR experiments we also collected bronchial tissues of the larger airways (bronchus diameter > 2 mm, surrounded by cartilage) from 15 patients during thoracotomy for NSCLC or lung transplantation. All tissue samples were snap frozen in liquid isopentane, and stored at -80 ºC until further processing. The study protocol was consistent with national ethical and professional guidelines (“Code of Good Conduct; Dutch Federation of Biomedical Scientific Societies”).
Laser microdissection microscopyFor SCC samples with more than 80% tumor cells in the tissue section, genomic DNA
was isolated from the total tissue, in all other cases laser microdissection microscopy
Table 1. Patients characteristics
no lymph node distant
sex male/female 15/0 5/3 11/0
age (years) median(range) 67 (47-83) 62 (51-76) 69 (48-75)
tumor status T1/T2/T3 2/13/0 1/5/2 0/7/4
stage I/II/III 15/0/0 0/5/3 8/3/0
survival (months) median(95%CI) 116 (80-152) 91 (80-126) 23 (11-35)
no, no lymph node metastases at time of surgery and no distant metastases developed within 5 years after surgery; lymph node, lymph node metastases at time of surgery, but no distant metastases developed within 5 years after surgery; distant, distant metastasis within 2 years after surgery, but no lymph node metastases. Characteristics per patient are listed in Supplementary table 1.
chapter6
102

(LDM) was performed to obtain pure cell populations10. Only vital tumor cells without apparent admixture of inflammatory cells through the tumor fields were selected for laser microdissection. An area of approximately 25 x106 μm2 was microdissected from frozen sections of 8 μm by the P.A.L.M. Microlaser Technology system, according to the manufacturer’s instructions (P.A.L.M., Bernried, Germany). Microdissected cells were immediately collected in SE buffer (75 mM NaCl, 0.1 mM EDTA) for DNA isolation.
For qRT-PCR, LDM was applied on 25 SCC samples and on 15 bronchus samples to isolate pure tumor cell populations and histologically normal epithelial cells. All cells were harvested directly in lysis buffer (Macherey-Nagel, Düren, Germany) for RNA isolation.
DNA isolationGenomic DNA was isolated and purified from the (laser-microdissected) cells using a
standard salt-chloroform extraction protocol. The DNA concentration was measured using a Nanodrop ND-1000 spectrophotometer (NanoDrop Technologies, Wilmington, DE). 100 ng DNA was used for whole genome amplification using the BioScore FFPE screening and amplification kit according to the manufacturer’s instructions (Enzo Life Sciences Inc., Farmingdale, NY) to yield sufficient DNA for hybridization on the arrays. Only SCC cases for which a high yield of amplified DNA was obtained in the amplification reaction were used for aCGH experiments, as recommended by the manufacturer.
Array-based Comparative Genomic Hybridization (aCGH)We started with a number of test hybridizations to determine if aCGH profiles of
amplified DNA were comparable to those of non-amplified total DNA. We observed consistent profiles for amplified and non-amplified DNA indicating that amplification does not affect the aCGH results (data not shown).
An amount of 600 ng of (amplified) genomic DNA was labeled with Cy3-dUTP (Perkin Elmer, Langen, Germany) using the BioPrima DNA labeling System (Invitrogen Inc., Carlsbad, CA)11. Samples were inversely sex-matched with a normal reference DNA (labeled with Cy5-dUTP) as an internal control for gain or loss at the X chromosome. Hybridizations were included for further analysis only if the calculated ratio for the X-chromosomal BACs were as expected. The design and construction of the BAC-microarray, containing 6465 BACs, has been previously described11. The array slides were processed according to the manufacturer’s instructions and as described previously12. Arrays were scanned using an Agilent scanner (Agilent, Santa Clara, CA).
metastasis-specificacghprofilesinscc
103
6
aCGH analysisThe scanned images were processed with Bluefuse v3.5 (BlueGnomeLtd, Cambridge,
UK). A block-median normalization excluding controls was applied to the 2log-transformed Cy3/Cy5 ratios. Subsequent exclusion criteria were: confidence < 0.3, quality < 1 and SD of replicates > 0.5. Finally, the log-ratios of the replicates were combined using the fusion algorithm. The resulting log-ratio files were imported into Nexus-CGH software (BioDiscovery, US) to visualize and analyze copy number changes within or between subsets of SCC. Thresholds for gains and losses were set at 2log-ratios of 0.3 (gain) and -0.3 (loss), respectively. Thresholds for amplifications were set at 2log-ratios of 0.8 and thresholds for homozygous deletions were set at -0.8. Threshold for assessment of a cluster of (high copy) gains or homozygous deletions were set at a p-value of 0.01 and maximal contiguous probe spacing of 4,000 Kb. A threshold of 35% difference in frequency with a p≤0.05 (Fisher exact test) was used to define significant differences in the number of aberrations for a specific chromosomal region in SCC samples between patients with or without metastases. Since SCC samples are often triploid, we decided to consider two as well as three copies of a chromosomal region as ‘normal’ and set the threshold of a gain in such a way that we could identify only four copies or more.
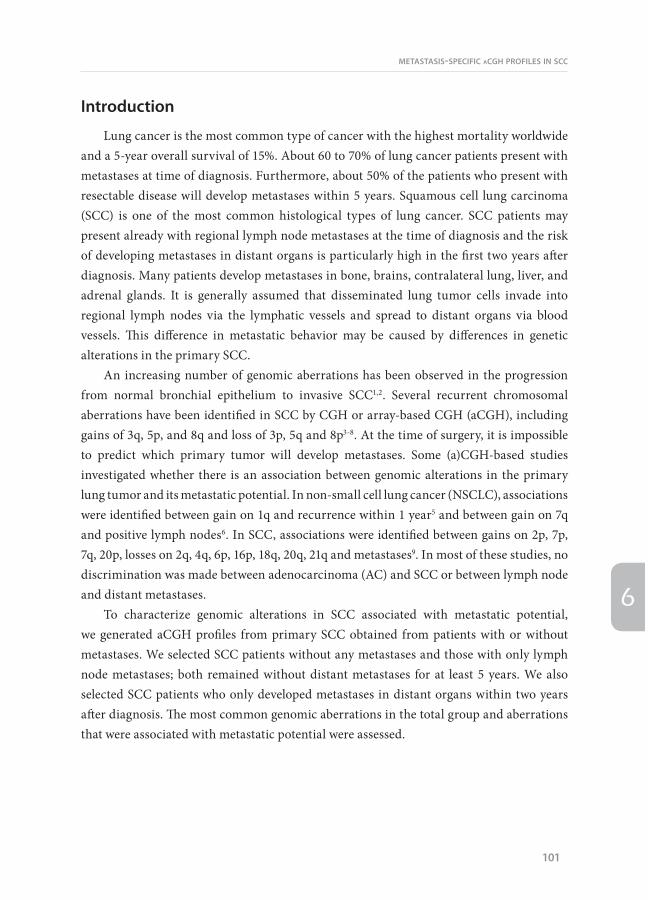
Table 2 Common gains and losses in SCC
Cytoband Region start (Mb) Length (Mb) Event Number of genes Frequency (%)
3q13.2-q29 112.9 86.6 Gain 475 41-94
5p15.33-p11 0 47.7 Gain 135 41-53
8q24.3 141.9 4.4 Gain 89 41-44
19q13.13 43.0 0.3 Gain 0 41
20p13-p12.3 1.3 4.0 Gain 56 41
22q11.21-q13.1 16.7 19.3 Gain 214 41-47
3p14.2-p12.3 59.3 21.1 Loss 39 41-53
3p24.3-p24.2 20.0 5.7 Loss 12 41-47
4p15.31 20.1 2.0 Loss 4 41
4q33-q34.1 171.7 0.8 Loss 0 41
4q34.3-q35.1 178.4 6.2 Loss 8 41
5q14.2-q23.3 82.2 45.8 Loss 110 41-68
5q31.1-q35.2 131.9 43.5 Loss 328 41-53
8p22-p21.3 18.2 2.4 Loss 9 41
9p21.2-p21.1 25.6 3.3 Loss 11 41
9p24.2-p21.3 7.0 15.7 Loss 50 41-44
9p24.3-p24.2 0 2.9 Loss 13 41
chapter6
104
RNA isolationTotal RNA was isolated and purified from the laser-dissected cells with a Nucleospin
RNA II kit (Macherey-Nagel), according to the manufacturer’s instructions, including DNase treatment. The quantity of DNA-free total RNA was measured using a Nanodrop ND-1000 spectrophotometer (NanoDrop Technologies, Wilmington, DE). RNA quality was assessed with RNA 6000 PicoChip (Agilent, Palo Alto, CA) on the 2100 bioanalyzer (Agilent) by the ratio of the 18S and 28S rRNA bands combined with a low baseline.
Quantitative RT-PCRQuantitative RT-PCR (qRT-PCR) was used to assess whether amplification of genomic
DNA correlates with increased gene expression levels comparing SCC with and without amplification to normal bronchus epithelium. Low density arrays were used in duplicate for a selection of genes located on amplified regions and RPII was selected as a housekeeping gene (Applied Biosystems, Foster City, CA). Assays for the low density array were chosen in such a way that the primers span exon junctions and were located close to the poly(A)-tail to enable efficient amplification. Sufficient quality RNA was obtained from 25 SCC and 15 normal bronchial epithelium samples. cDNA was synthesized using Superscript II Reverse Transcriptase (Invitrogen, Carlsbad, CA) with random primers (Invitrogen) according to the manufacturer’s instructions. Low density arrays were loaded according to the manufacturer’s instructions and measured using TaqMan (Applied Biosystems). The relative number of transcripts was calculated by subtracting the average Ct value of the reference
100%
50%
50%
0%
A
40%
10%0%
B
20%
10%20%
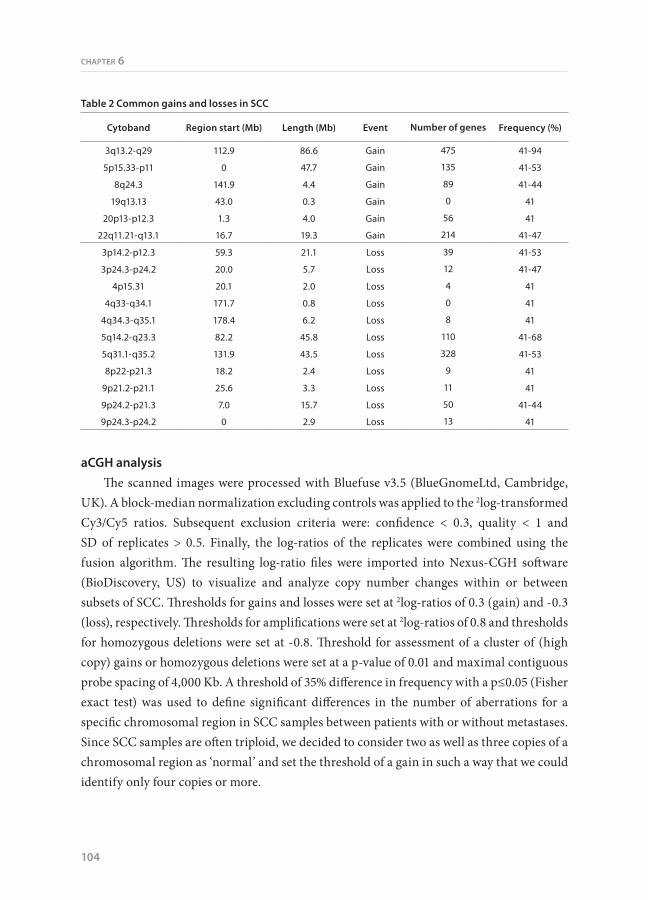
Figure 1. Frequency plot of chromosomal aberrations in SCC samples. A. Schematic presentation of the chromosomal aberrations in SCC. Gains and losses are shown in green en red colors, respectively, as percentage of the total group of 34 SCC cases. Dark green and dark red colors represent high copy amplification and homozygous deletions, respectively. B. Schematic overview of the high copy amplifications and homozygous deletions are shown in green and red colors, respectively. Regions present in at least 10% of the SCC samples are indicated by an arrow, together with a number of candidate (onco)genes located on these regions.
metastasis-specificacghprofilesinscc
105
6
gene RPII from the average Ct value of the individual selected genes (ΔCt). Next, relative expression levels were defined as 2−ΔCt, resulting in the factor of up- or downregulation between specific samples. Mann-Whitney test was used to assess significant differences in expression levels.
Results
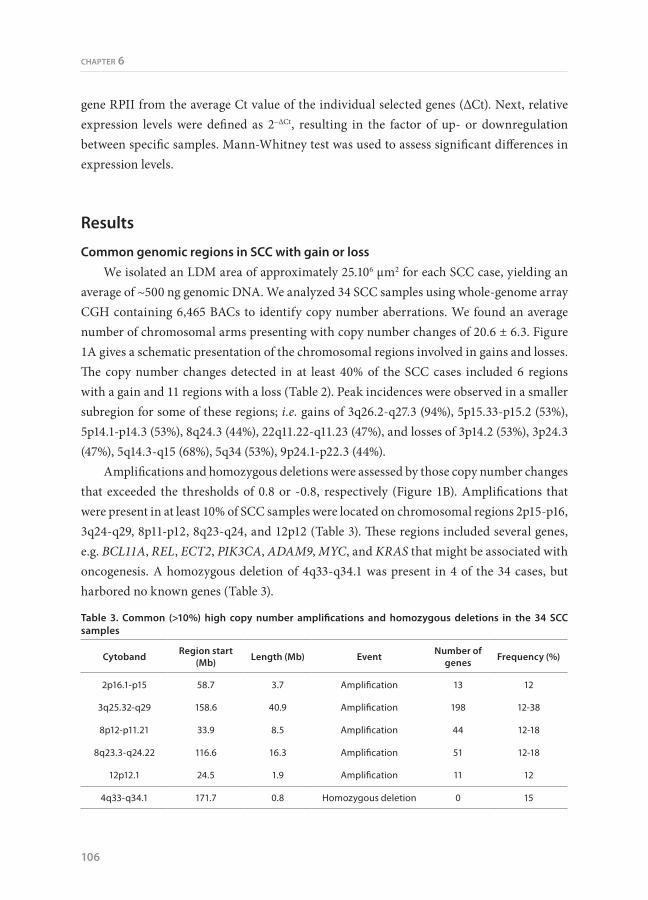
Common genomic regions in SCC with gain or lossWe isolated an LDM area of approximately 25.106 μm2 for each SCC case, yielding an
average of ~500 ng genomic DNA. We analyzed 34 SCC samples using whole-genome array CGH containing 6,465 BACs to identify copy number aberrations. We found an average number of chromosomal arms presenting with copy number changes of 20.6 ± 6.3. Figure 1A gives a schematic presentation of the chromosomal regions involved in gains and losses. The copy number changes detected in at least 40% of the SCC cases included 6 regions with a gain and 11 regions with a loss (Table 2). Peak incidences were observed in a smaller subregion for some of these regions; i.e. gains of 3q26.2-q27.3 (94%), 5p15.33-p15.2 (53%), 5p14.1-p14.3 (53%), 8q24.3 (44%), 22q11.22-q11.23 (47%), and losses of 3p14.2 (53%), 3p24.3 (47%), 5q14.3-q15 (68%), 5q34 (53%), 9p24.1-p22.3 (44%).
Amplifications and homozygous deletions were assessed by those copy number changes that exceeded the thresholds of 0.8 or -0.8, respectively (Figure 1B). Amplifications that were present in at least 10% of SCC samples were located on chromosomal regions 2p15-p16, 3q24-q29, 8p11-p12, 8q23-q24, and 12p12 (Table 3). These regions included several genes, e.g. BCL11A, REL, ECT2, PIK3CA, ADAM9, MYC, and KRAS that might be associated with oncogenesis. A homozygous deletion of 4q33-q34.1 was present in 4 of the 34 cases, but harbored no known genes (Table 3).
Table 3. Common (>10%) high copy number amplifications and homozygous deletions in the 34 SCC samples
Cytoband Region start (Mb) Length (Mb) Event Number of
genes Frequency (%)
2p16.1-p15 58.7 3.7 Amplification 13 12
3q25.32-q29 158.6 40.9 Amplification 198 12-38
8p12-p11.21 33.9 8.5 Amplification 44 12-18
8q23.3-q24.22 116.6 16.3 Amplification 51 12-18
12p12.1 24.5 1.9 Amplification 11 12
4q33-q34.1 171.7 0.8 Homozygous deletion 0 15
chapter6
106

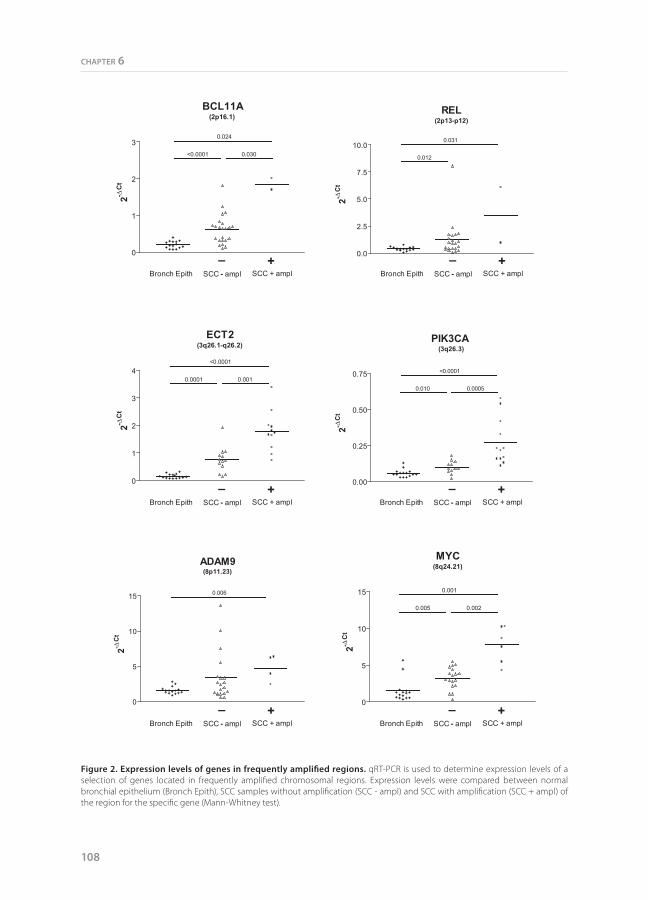
For 6 genes (BCL11A, REL, ECT2, PIK3CA, ADAM9, and MYC) we performed qRT-PCR using total RNA from laser microdissected SCC cells to assess if the amplifications were associated with increased expression levels in comparison to SCC without amplification and normal bronchus epithelium (Figure 2). A significantly higher average expression level was observed for four genes (BCL11A, ECT2, PIK3CA, and MYC) in the SCC samples with amplifications as compared to SCC without amplifications. The average expression level was also higher for the other two genes, but this did not reach significance. The expression level was significantly increased for all six genes when compared to normal bronchial epithelial cells.
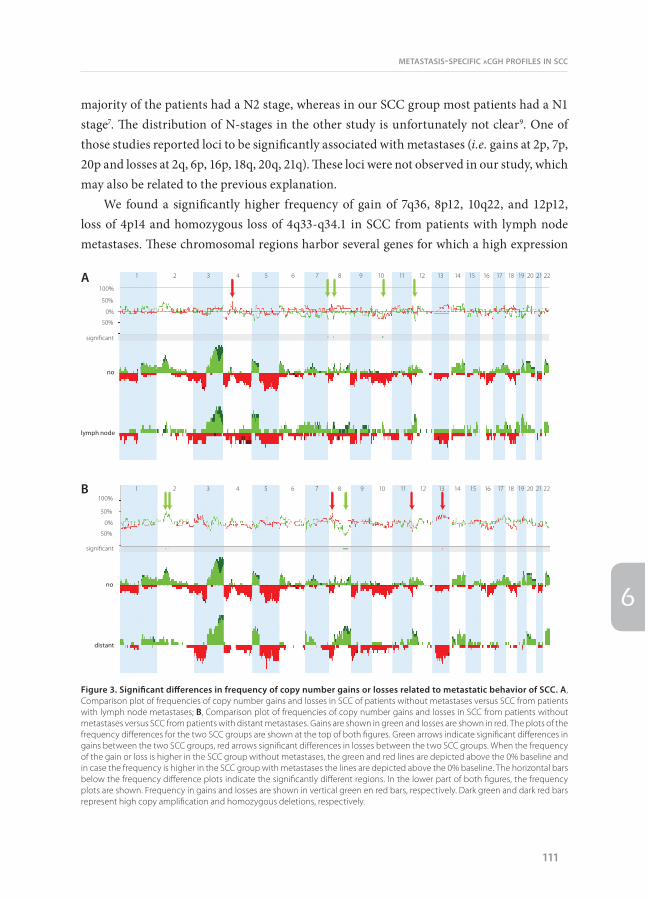
Chromosomal aberrations related to lymph node metastasesThe average number of chromosomal arms presenting with copy number changes was
not significantly different between SCC samples from patients with lymph node metastases (22.9 ± 7.0) and SCC samples from patients without metastases (21.4 ± 6.1). To assess whether there are differences in specific regions with chromosomal aberrations in the primary SCC that are related to the metastatic potential, we compared the aCGH profiles (Figure 3A). We observed significant differences in the prevalence of gains at 7q36, 8p12, 10q22 and 12p12. Gains at 7q36, 8p12, 10q22 were restricted to SCC from patients with lymph node metastases, whereas gain at 12p12 was not restricted, but more frequent (13 vs 63%) in SCC from patients with lymph node metastases (Table 4). Loss of 4p14 was observed significantly more frequent in SCC from patients with than without lymph node metastases. There was no significant difference in the prevalence of high copy number amplifications between the groups, whereas homozygous deletions of 4q33-q34.1 occurred in SCC samples of three out of eight patients with lymph node metastases and not in SCC without metastases (Table 5).
Chromosomal aberrations related to distant metastasisThe average number of chromosomal arms presenting with copy number changes was
not significant different between SCC samples from patients with distant metastases (17.7 ± 4.8) and SCC samples from patients without metastases (21.4 ± 6.1). A schematic overview of the chromosomal aberrations related to distant metastases is given in Figure 3B. Significant differences in frequency are observed for gains at 2p16, which is more frequently observed in SCC samples from patients without metastases, 2p12, which is restricted to SCC samples from patients without metastases, and 8q22-q24, which is more frequent in SCC from patients with distant metastases (Table 6). Loss of 11q25 was restricted to SCC from patients without metastases and loss of 8p23 and 13q21 occurred significantly more frequent in
metastasis-specificacghprofilesinscc
107
6
BCL11A(2p16.1)
0
1
2
30.024
<0.0001 0.030
2-C
tREL
(2p13-p12)
0.0
2.5
5.0
7.5
10.00.031
0.012
2-C
tECT2
(3q26.1-q26.2)
Bronch Epith SCC - ampl SCC + ampl
0
1
2
3
4<0.0001
0.0001 0.001
2-C
t
PIK3CA(3q26.3)
0.00
0.25
0.50
0.75 <0.0001
0.010 0.0005
2-C
t
ADAM9(8p11.23)
0
5
10
15 0.006
2-C
t
MYC(8q24.21)
0
5
10
15 0.001
0.005 0.002
2-C
t
– +Bronch Epith SCC - ampl SCC + ampl
– +
Bronch Epith SCC - ampl SCC + ampl– +
Bronch Epith SCC - ampl SCC + ampl– +
Bronch Epith SCC - ampl SCC + ampl– +
Bronch Epith SCC - ampl SCC + ampl– +
Figure 2. Expression levels of genes in frequently amplified regions. qRT-PCR is used to determine expression levels of a selection of genes located in frequently amplified chromosomal regions. Expression levels were compared between normal bronchial epithelium (Bronch Epith), SCC samples without amplification (SCC - ampl) and SCC with amplification (SCC + ampl) of the region for the specific gene (Mann-Whitney test).
chapter6
108

SCC from patients with distant metastases. No significant differences were observed when comparing frequencies of amplifications and homozygous deletions.
Discussion
Generally, patients with lung cancer have a very bad prognosis and many patients will die of metastases to distant organs. In this study, we investigated the presence of chromosomal aberrations in primary SCC in relation to its metastatic potential by using aCGH. We selected SCC patients who presented with either exclusively regional lymph node metastases at the time of surgery or who developed exclusively metastases in distant organs within two years after surgery. Several genomic aberrations were observed and, interestingly, some aberrations were significantly restricted to SCC of patients with lymph node metastases only or distant metastases exclusively as compared to SCC samples from patients without metastases. These chromosomal differences may be predictive for metastatic potential and may harbor genes involved in metastatic progression of SCC.
Previously, CGH based studies reported common aberration in SCC including gains of chromosomal arms 3q, 5p and 8q and losses of 3p, 5q and 8p3-7,13. These aberrations were also detected in our study, but at a much higher resolution by using aCGH thereby allowing direct identification of the candidate oncogenetic or tumor suppressor genes mapping to these regions12. Gains on 20p, 22q and losses on 4p, 4q, 9p were previously observed in part of these studies albeit at lower frequencies than in our study. The most likely explanation for this difference is that these in general smaller chromosomal aberrations (< 1 Mb) may have been missed in the studies that applied CGH which has a lower resolution. The fact that we found copy number changes in almost twice as much chromosomal arms as compared to previous studies is in agreement with the much higher resolution of the aCGH technique. Furthermore, laser microdissection applied for the vast majority of cases in our study results in a much higher percentage of tumor cells allowing a more reliable detection of copy number changes. So far, only one other aCGH study has been reported investigating specifically the SCC subtype8. The most striking difference is the relative high number of chromosomal arms presenting with copy number changes in our study as compared to the almost completely normal aCGH profiles in 7 out of 14 cases in their study. Besides the advantage of the use of LDM in our study, our aCGH has a higher resolution, i.e. over 6,000 BACs, in comparison with less than 1,500 BACs in their array.
We found several common high copy amplifications (2p15-p16, 3q24-q29, 8p11-p12, 8q23-q24, and 12p12) and one region that was homozygously deleted (4q33-q34.1) in SCC
metastasis-specificacghprofilesinscc
109
6

(Figure 1B, Table 3). Several amplifications have been described previously in NSCLC including amplifications on 3q, 8p12, 8q24, and 12p126,14. Although previously found as a genomic region with either gain or loss, amplification of 2p15-p16 and homozygous deletion at 4q33-q34.1 as observed in our study have not been reported previously in SCC. This may be related to the fact that most studies do not use LDM to enrich their samples for tumor cells. Admixture of normal cells will lead to less pronounced aberrations in the CGH profile leading to miss interpretation of amplifications or homozygous deletions as regular gain or loss. Furthermore, amplifications and homozygous deletions are relatively small regions, which may be missed by CGH techniques. Homozygous deletions on 3p14.2 and 3p21.3 as observed in several lung cancer derived cell lines and a low percentage of SCC samples were, however, not observed in our study15,16. Candidate (onco)genes located on the amplicons identified in our study include BCL11A (2p16.1), REL (2p15-2p16.1), epithelial cell transforming sequence 2 oncogene (ECT2) (3q26.31), PIK3CA (3q26.32), ADAM9 (8p11.23), MYC (8q24.21), and KRAS (12p12.1). A strength of our study is that we demonstrated a clear association between overexpression of six of these genes with high copy number amplifications of their corresponding genomic loci. Amplification and overexpression of PIK3CA and MYC has been reported previously in SCC, and of BCL11A and REL in lymphomas17-21. Demonstration of a significant association for ECT2 and a trend for ADAM9 between amplification and overexpression has not been reported previously in any type of cancer. Based on the significant association observed in SCC it seems plausible that ECT2 is an interesting candidate in SCC oncogenesis.
Previous studies described a higher number of chromosomal arms with copy number changes for SCC that developed lymph node metastases7,9. In our study, we did not observe significant differences in average number of altered chromosomal arms between SCC groups with lymph node metastasis and the group without any metastasis (22.9 versus 21.4). A possible explanation may be related to the fact that at least in one of these studies the
Table 4. Chromosomal aberrations occurring at significantly different frequencies between SCC from patients without and with lymph node metastases
Cytoband Region start (Mb)
Length (Mb) Event Number of
genes % in “no” % in “lymph node” p-value
7q36.2-q36.3 153.3 4.8 Gain 13 0 38 0.032
8p12 32.7 0.8 Gain 2 0 38 0.032
10q22.1-q22.3 72.6 6.4 Gain 46 0 38 0.032
12p12.3-p12.1 19.8 1.7 Gain 9 13 63 0.026
4p14.3-p14.2 57.9 1.4 Loss 0 7 50 0.033
chapter6
110
majority of the patients had a N2 stage, whereas in our SCC group most patients had a N1 stage7. The distribution of N-stages in the other study is unfortunately not clear9. One of those studies reported loci to be significantly associated with metastases (i.e. gains at 2p, 7p, 20p and losses at 2q, 6p, 16p, 18q, 20q, 21q). These loci were not observed in our study, which may also be related to the previous explanation.
We found a significantly higher frequency of gain of 7q36, 8p12, 10q22, and 12p12, loss of 4p14 and homozygous loss of 4q33-q34.1 in SCC from patients with lymph node metastases. These chromosomal regions harbor several genes for which a high expression
Figure 3. Significant differences in frequency of copy number gains or losses related to metastatic behavior of SCC. A, Comparison plot of frequencies of copy number gains and losses in SCC of patients without metastases versus SCC from patients with lymph node metastases; B, Comparison plot of frequencies of copy number gains and losses in SCC from patients without metastases versus SCC from patients with distant metastases. Gains are shown in green and losses are shown in red. The plots of the frequency differences for the two SCC groups are shown at the top of both figures. Green arrows indicate significant differences in gains between the two SCC groups, red arrows significant differences in losses between the two SCC groups. When the frequency of the gain or loss is higher in the SCC group without metastases, the green and red lines are depicted above the 0% baseline and in case the frequency is higher in the SCC group with metastases the lines are depicted above the 0% baseline. The horizontal bars below the frequency difference plots indicate the significantly different regions. In the lower part of both figures, the frequency plots are shown. Frequency in gains and losses are shown in vertical green en red bars, respectively. Dark green and dark red bars represent high copy amplification and homozygous deletions, respectively.
A100%
significant
50%
50%
0%
no
lymph node
1 2 3 4 5 6 7 8 9 10 11 12 13 14 15 16 17 18 19 20 21 22
B100%
50%
50%
0%
no
distant
1 2 3 4 5 6 7 8 9 10 11 12 13 14 15 16 17 18 19 20 21 22
significant
metastasis-specificacghprofilesinscc
111
6
has been correlated with general metastatic potential, i.e. SHH (7q36), PSAP (10q22), and PLAU (10q22)22-24. Gains on 7q have been described previously in relation to positive lymph nodes in NSCLC and gain of 7q and loss of 4q have been reported to be associated with general metastatic behavior of SCC6,9. Gains on 8p12, 10q22, and 12p12, and loss on 4p14 are novel genomic aberrations for SCC samples from patients presenting with lymph node metastases. Although loss on 4q has been described previously in relation to metastases in a CGH study, the homozygous loss on 4q33-q34.1 is a new observation in SCC samples from patients presenting with lymph node metastases9. The pathogenetic significance of this deletion remains uncertain since there are no currently known genes or microRNAs located in this region.
We found a significantly higher frequency of gains of 8q22-q24 and losses of 8p23 and 13q21 in SCC samples of patients developing metastases in distant organs within 2.5 years after resection. Gains of the 8q region have been described in several types of cancer in relation to metastasis, progression, poor prognosis, or survival25-28. In NSCLC, gains on 8q have been described to be related to a higher tumor stage which is generally associated with a poorer prognosis6. However, the primary SCC samples in our study obtained from patients who developed distant metastases have a similar tumor stage as the SCC samples from patients without metastases (Table 1), indicating that 8q is more directly related to the metastatic potential of the primary SCC. Overexpression of potential target genes on the 8q22-q24 region have been reported in several types of epithelial cancers in relation to metastatic potential (CDH17, SPAG1, RAD21, MTBP, and HAS2)29-33 and in relation to poor prognosis (LAPTM4B, RPL30, CCNE2, SPAG1, BAALC, WDSOF1, DCC1, and HAS2)27,30,33-37. For 4 genes, POLR2K, PABPC1, YWHA2 and LRP12, gain on 8q has been associated with overexpression38-40. Another potentially interesting gene in relation to an increased risk of distant metastases may be angiopoietin (ANGPT1), which is a positive regulator of angiogenesis. Although MYC expression has been previously described in relation to NSCLC metastatic potential, MYC is located just outside the 8q22-q24 region that is significantly related to distant metastases21,28. Losses of 8p23 and 13q21 have not been reported previously in relation to development of distant metastases in SCC. However, loss
Table 5. Homozygous deletion occurring at significantly different frequencies between SCC from patients without and with lymph node metastases
Cytoband Region start (Mb)
Length (Mb) Event Number
of genes % in “no” % in “lymph node” p-value
4q33-q34.1 171.7 0.8 Homozygous deletion 0 0 38 0.032
chapter6
112

of 8p is associated with the metastatic phenotype of AC of the lung41 and correlates with poor prognosis in head and neck SCC, which is closely related to SCC of the lung with respect to etiology and pathogenesis42. Previously described candidate metastasis suppressor genes on the 8p23 locus are PSD3 and LPL, both showing a reduced expression in breast cancers samples of patients with metastases43. Whether or not one of the two genes on 13q21 plays a role in development of distant metastases is currently unclear. Interestingly, there were also chromosomal aberrations that were significantly more frequent in SCC samples of patients without distant metastases within a period of five years, i.e. gains of 2p16.2-p16.1, 2p12, and loss of 11q25. These regions may possibly act as a predictor for a relatively good prognosis in patients presenting with SCC. Chromosome 1q has previously been reported to be associated with NSCLC recurrence within one year as compared to those with no recurrence after one year5. We also found differences in frequency of 1q between SCC samples from patients with or without metastases, although not significant. This discrepancy may be explained by differences related to histological subtype or the time of assessing the presence of distant metastasis. They chose a cut-off of 1 year, while we selected more extreme cut-off time points
Table 6. Chromosomal aberrations occurring at a significantly different frequency between SCC from patients with distant metastases and SCC without metastases
Cytoband Region start (Mb)
Length (Mb) Event Number of
genes % in “no” % in “distant” p-value
2p16.2-p16.1 54.4 4.8 Gain 15 53 9 0.036
2p16.1 59.1 0.6 Gain 0 60 9 0.014
2p12 75.8 1.9 Gain 1 40 0 0.024
8q22.1 94.0 3.7 Gain 21 7 55 0.021
8q22.1-q22.2 97.8 2.2 Gain 11 7 64 0.003
8q22.2-q23.1 100.0 8.9 Gain 34 13 64 0.014
8q23.1-23.2 108.9 3.0 Gain 11 7 64 0.003
8q23.2-q23.3 111.9 2.7 Gain 1 0 55 0.002
8q23.3 114.6 2.0 Gain 0 7 55 0.021
8q23.3-q24.13 116.6 7.5 Gain 22 20 64 0.043
8p23.3 18.2 2,8 Loss 9 20 64 0.043
11q25 133.9 0.5 Loss 0 40 0 0.024
13q21.32-q21.33 64.4 5.1 Loss 2 20 64 0.043
metastasis-specificacghprofilesinscc
113
6
for assessing development of metastasis, i.e. within 2 years after surgery or no metastases over a period of 5 years.
In summary, we provide a detailed overview of the chromosomal regions with copy number changes in SCC. Application of aCGH allows a direct coupling to the copy number changes with the potential target genes. In addition, this study demonstrates significant differences in genomic aberrations of SCC samples from patients presenting with solely lymph node metastasis or with distant metastases exclusively as compared to SCC from patients without any metastases. We found several chromosomal aberrations specific for SCC samples from patients developing distant metastases (gain of 8q23.2-q23.3), whereas others were specific for SCC samples from patients without metastases (gain of 2p12 and loss of 11q25). These loci can be further explored for their potential use as predictive markers in patients with SCC in relation to prognostic outcome. In addition, candidate genes on these loci may contribute to metastatic progression of SCC.
Acknowledgements
We thank Marnix Jonker, Tineke van der Sluis and Bea Rutgers for their help with laser microdissection. This study was financially supported by the J.K. de Cockstichting and the Spinoza award granted by the Dutch government to prof. D.S. Postma.
chapter6
114

ReferencesMa J, Gao M, Lu Y et al. Gain of 1q25-32, 12q23-24.3, and 17q12-22 facilitates tumorigenesis and progression of human squamous cell lung cancer. J Pathol 2006; 210(2):205-213.
Wistuba II, Behrens C, Milchgrub S et al. Sequential molecular abnormalities are involved in the multistage development of squamous cell lung carcinoma. Oncogene 1999; 18(3):643-650.
Sy SM, Wong N, Lee TW et al. Distinct patterns of genetic alterations in adenocarcinoma and squamous cell carcinoma of the lung. Eur J Cancer 2004; 40(7):1082-1094.
Yakut T, Schulten HJ, Demir A et al. Assessment of molecular events in squamous and non-squamous cell lung carcinoma. Lung Cancer 2006; 54(3):293-301.
Tai AL, Yan WS, Fang Y, Xie D, Sham JS, Guan XY. Recurrent chromosomal imbalances in nonsmall cell lung carcinoma: the association between 1q amplification and tumor recurrence. Cancer 2004; 100(9):1918-1927.
Pei J, Balsara BR, Li W et al. Genomic imbalances in human lung adenocarcinomas and squamous cell carcinomas. Genes Chromosomes Cancer 2001; 31(3):282-287.
Chujo M, Noguchi T, Miura T, Arinaga M, Uchida Y, Tagawa Y. Comparative genomic hybridization analysis detected frequent overrepresentation of chromosome 3q in squamous cell carcinoma of the lung. Lung Cancer 2002; 38(1):23-29.
Choi YW, Choi JS, Zheng LT et al. Comparative genomic hybridization array analysis and real time PCR reveals genomic alterations in squamous cell carcinomas of the lung. Lung Cancer 2007; 55(1):43-51.
Yan W, Song L, Liang Q, Fang Y. Progression analysis of lung squamous cell carcinomas by comparative genomic hybridization. Tumour Biol 2005; 26(3):158-164.
Emmert-Buck MR, Bonner RF, Smith PD et al. Laser capture microdissection. Science 1996; 274(5289):998-1001.
Atayar C, Kok K, Kluiver J et al. BCL6 alternative breakpoint region break and homozygous deletion of 17q24 in the nodular lymphocyte predominance type of Hodgkin’s lymphoma-derived cell line DEV. Hum Pathol 2006; 37(6):675-683.
Kok K, Dijkhuizen T, Swart YE et al. Application of a comprehensive subtelomere array in clinical diagnosis of mental retardation. Eur J Med Genet 2005; 48(3):250-262.
Petersen I, Bujard M, Petersen S et al. Patterns of chromosomal imbalances in adenocarcinoma and squamous cell carcinoma of the lung. Cancer Res 1997; 57(12):2331-2335.
Balsara BR, Sonoda G, du Manoir S, Siegfried JM, Gabrielson E, Testa JR. Comparative genomic hybridization analysis detects frequent, often high-level, overrepresentation of DNA sequences at 3q, 5p, 7p, and 8q in human non-small cell lung carcinomas. Cancer Res 1997; 57(11):2116-2120.
Todd S, Franklin WA, Varella-Garcia M et al. Homozygous deletions of human chromosome 3p in lung tumors. Cancer Res 1997; 57(7):1344-1352.
Yamakawa K, Takahashi T, Horio Y et al. Frequent homozygous deletions in lung cancer cell lines detected by a DNA marker located at 3p21.3-p22. Oncogene 1993; 8(2):327-330.
Martin-Subero JI, Gesk S, Harder L et al. Recurrent involvement of the REL and BCL11A loci in classical Hodgkin lymphoma. Blood 2002; 99(4):1474-1477.
Angulo B, Suarez-Gauthier A, Lopez-Rios F et al. Expression signatures in lung cancer reveal a profile for EGFR-mutant tumours and identify selective PIK3CA overexpression by gene amplification. J Pathol 2008; 214(3):347-356.
Racz A, Brass N, Heckel D, Pahl S, Remberger K, Meese E. Expression analysis of genes at 3q26-q27 involved in frequent amplification in squamous cell lung carcinoma. Eur J Cancer 1999; 35(4):641-646.
Kawano O, Sasaki H, Okuda K et al. PIK3CA gene amplification in Japanese non-small cell lung cancer. Lung Cancer 2007; 58(1):159-160.
1.
2.
3.
4.
5.
6.
7.
8.
9.
10.
11.
12.
13.
14.
15.
16.
17.
18.
19.
20.
metastasis-specificacghprofilesinscc
115
6

Volm M, Drings P, Wodrich W, van Kaick G. Expression of oncoproteins in primary human non-small cell lung cancer and incidence of metastases. Clin Exp Metastasis 1993; 11(4):325-329.
Bailey JM, Singh PK, Hollingsworth MA. Cancer metastasis facilitated by developmental pathways: Sonic hedgehog, Notch, and bone morphogenic proteins. J Cell Biochem 2007; 102(4):829-839.
Koochekpour S, Zhuang YJ, Beroukhim R et al. Amplification and overexpression of prosaposin in prostate cancer. Genes Chromosomes Cancer 2005; 44(4):351-364.
Krupitza G, Grill S, Harant H et al. Genes related to growth and invasiveness are repressed by sodium butyrate in ovarian carcinoma cells. Br J Cancer 1996; 73(4):433-438.
Tada K, Oka M, Tangoku A, Hayashi H, Oga A, Sasaki K. Gains of 8q23-qter and 20q and loss of 11q22-qter in esophageal squamous cell carcinoma associated with lymph node metastasis. Cancer 2000; 88(2):268-273.
Alers JC, Rochat J, Krijtenburg PJ et al. Identification of genetic markers for prostatic cancer progression. Lab Invest 2000; 80(6):931-942.
Chin SF, Teschendorff AE, Marioni JC et al. High-resolution aCGH and expression profiling identifies a novel genomic subtype of ER negative breast cancer. Genome Biol 2007; 8(10):R215.
Kubokura H, Tenjin T, Akiyama H et al. Relations of the c-myc gene and chromosome 8 in non-small cell lung cancer: analysis by fluorescence in situ hybridization. Ann Thorac Cardiovasc Surg 2001; 7(4):197-203.
Oue N, Hamai Y, Mitani Y et al. Gene expression profile of gastric carcinoma: identification of genes and tags potentially involved in invasion, metastasis, and carcinogenesis by serial analysis of gene expression. Cancer Res 2004; 64(7):2397-2405.
Neesse A, Gangeswaran R, Luettges J et al. Sperm-associated antigen 1 is expressed early in pancreatic tumorigenesis and promotes motility of cancer cells. Oncogene 2007; 26(11):1533-1545.
Yamamoto G, Irie T, Aida T, Nagoshi Y, Tsuchiya R, Tachikawa T. Correlation of invasion and metastasis of cancer cells, and expression of the RAD21 gene in oral squamous cell carcinoma. Virchows Arch 2006; 448(4):435-441.
Iwakuma T, Tochigi Y, Van Pelt CS et al. Mtbp haploinsufficiency in mice increases tumor metastasis. Oncogene 2008; 27(13):1813-1820.
Yamada Y, Itano N, Narimatsu H et al. Elevated transcript level of hyaluronan synthase1 gene correlates with poor prognosis of human colon cancer. Clin Exp Metastasis 2004; 21(1):57-63.
Zhou L, He XD, Cui QC et al. Expression of LAPTM4B-35: A novel marker of progression, invasiveness and poor prognosis of extrahepatic cholangiocarcinoma. Cancer Lett 2008; 264(2):209-217.
De Bortoli M, Castellino RC, Lu XY et al. Medulloblastoma outcome is adversely associated with overexpression of EEF1D, RPL30, and RPS20 on the long arm of chromosome 8. BMC Cancer 2006; 6:223.
Desmedt C, Ouriaghli FE, Durbecq V et al. Impact of cyclins E, neutrophil elastase and proteinase 3 expression levels on clinical outcome in primary breast cancer patients. Int J Cancer 2006; 119(11):2539-2545.
Langer C, Radmacher MD, Ruppert AS et al. High BAALC expression associates with other molecular prognostic markers, poor outcome and a distinct gene-expression signature in cytogenetically normal acute myeloid leukemia: a Cancer and Leukemia Group B (CALGB) study. Blood 2008.
Garnis C, Coe BP, Zhang L, Rosin MP, Lam WL. Overexpression of LRP12, a gene contained within an 8q22 amplicon identified by high-resolution array CGH analysis of oral squamous cell carcinomas. Oncogene 2004; 23(14):2582-2586.
Heidenblad M, Lindgren D, Jonson T et al. Tiling resolution array CGH and high density expression profiling of urothelial carcinomas delineate genomic amplicons and candidate target genes specific for advanced tumors. BMC Med Genomics 2008; 1:3.
van Duin M, van Marion R, Vissers K et al. High-resolution array comparative genomic hybridization of chromosome arm 8q: evaluation of genetic progression markers for prostate cancer. Genes Chromosomes Cancer 2005; 44(4):438-449.
21.
22.
23.
24.
25.
26.
27.
28.
29.
30.
31.
32.
33.
34.
35.
36.
37.
38.
39.
40.

Goeze A, Schluns K, Wolf G, Thasler Z, Petersen S, Petersen I. Chromosomal imbalances of primary and metastatic lung adenocarcinomas. J Pathol 2002; 196(1):8-16.
Bockmuhl U, Ishwad CS, Ferrell RE, Gollin SM. Association of 8p23 deletions with poor survival in head and neck cancer. Otolaryngol Head Neck Surg 2001; 124(4):451-455.
Thomassen M, Tan Q, Kruse TA. Gene expression meta-analysis identifies chromosomal regions and candidate genes involved in breast cancer metastasis. Breast Cancer Res Treat 2008.
41.
42.
43.
metastasis-specificacghprofilesinscc
117
6


![Open Bronchus Sign on CT: A Risk Factor for Hemoptysis ...€¦ · factors (biopsy needle size, pleura-to-target distance, blood test results, open bronchus unavoidability [OBU] index,](https://static.fdocuments.in/doc/165x107/5ebab9fb4bb626264836ae87/open-bronchus-sign-on-ct-a-risk-factor-for-hemoptysis-factors-biopsy-needle.jpg)


