INCIDENCE OF HISTOLOGICALLY DIAGNOSED CANCER IN SOUTH ... · INCIDENCE OF HISTOLOGICALLY DIAGNOSED...
62
INCIDENCE OF HISTOLOGICALLY DIAGNOSED CANCER IN SOUTH AFRICA, 1998 – 1999 Nokuzola Mqoqi, 1 MSc (University of Natal), M.Sc. (PHDC) (LSHTM, University of London) Patricia Kellett, 1 Dip.Med. Tech (Wits Technikon) Freddy Sitas, 2 D. Phil. (University of Oxford) Musa Jula, 1 N. Dip IT (Technikon SA) NATIONAL CANCER REGISTRY The National Cancer Registry is a co-operative venture of the Department of Health, the Cancer Association of South Africa, the National Health Laboratory Service and the University of the Witwatersrand Department of Anatomical Pathology, School of Pathology, Wits University 1 National Health Laboratory Service (Previously SAIMR) P O Box 1038, Johannesburg, 2000, South Africa The Cancer Council, New South Wales 2 P O Box 572, Kings Cross, New South Wales, 1340, Australia Published by the National Cancer Registry of South Africa, National Health Laboratory Service, Johannesburg. December 2004 cancer98_contents 4/4/05, 14:37 1
Transcript of INCIDENCE OF HISTOLOGICALLY DIAGNOSED CANCER IN SOUTH ... · INCIDENCE OF HISTOLOGICALLY DIAGNOSED...

INCIDENCE OF HISTOLOGICALLYDIAGNOSED CANCER IN
SOUTH AFRICA,1998 – 1999
Nokuzola Mqoqi,1MSc (University of Natal), M.Sc. (PHDC) (LSHTM, University of London)
Patricia Kellett,1Dip.Med. Tech (Wits Technikon)
Freddy Sitas,2
D. Phil. (University of Oxford)Musa Jula,1
N. Dip IT (Technikon SA)
NATIONAL CANCER REGISTRY
The National Cancer Registry is a co-operative venture of the Department of Health, the CancerAssociation of South Africa, the National Health Laboratory Service and the University of the
Witwatersrand
Department of Anatomical Pathology, School of Pathology, Wits University1
National Health Laboratory Service (Previously SAIMR)P O Box 1038, Johannesburg, 2000, South Africa
The Cancer Council, New South Wales 2
P O Box 572, Kings Cross, New South Wales, 1340, Australia
Published by the National Cancer Registry of South Africa, National Health Laboratory Service,Johannesburg.December 2004
cancer98_contents 4/4/05, 14:371

CONTENTS
LIST OF FIGURES iLIST OF TABLES iiNATIONAL CANCER REGISTRY iiiFOREWORD ivCHAIRPERSON’S COMMENT vACKNOWLEDGEMENTS viFUNDING viiEXECUTIVE SUMMARY viiiACRONYMS x1. INTRODUCTION 12 METHODS 6
2.1 Data collection and data flow 62.2 Reporting of cancer 62.3 Data quality and quality assurance 62.3.1 Completeness of data 62.3.2 Unique identification and use of names 72.4 Analysis 82.5 International comparison 102.6 Presentation of cancer incidence report 10
3. RESULTS 113.1 Data reported in 1998 and 1999 113.2 Frequency of new cancers in 1998 and 1999 123.3 Age distribution of cancer cases 133.3.1 Distribution of cancer sites by age group 143.4 Incidence of cancer in 1998 and 1999 173.5 Cancer by site 193.5.1 Cancer of the Bladder 193.5.2 Cancer of the Cervix 223.5.3 Colorectal cancer 243.5.4 Colon cancer 273.5.5 Female breast cancer 303.5.6 Kaposi sarcoma 323.5.7 Lung cancer 353.5.8 Melanoma 383.5.9 Non-Hodgkin lymphoma 413.5.10 Non-Melanoma skin cancers 443.5.11 Oesophagus cancer 473.5.12 Prostate cancer 503.5.13 Cancer of the Uterus 52
4. SUMMARY 545. REFERENCES 55
cancer98_contents 4/4/05, 14:382

i
LIST OF FIGURES
Figure 1: Map of South Africa 2Figure 2: South Africa’s population, 1999 4Figure 3: Percentage distribution of cancer cases by race and year of diagnosis 7Figure 4: Percentage distribution of cancer cases by diagnosing province and sex,
1998 and 1999 combined 12Figure 5: Percentage distribution of cancers by years of diagnosis and population group 12Figure 6: Percentage distribution of new cancer cases reported in 1998 and 1999 by
age groups and sex (includes BCC and SCC of skin) 13Figure 7: Percentage distribution of 10 most common cancers by sex, 1998 and 1999
– All ages 14Figure 8: Percentage distribution of 10 most common cancers by sex, 1998 and 1999
– Ages 0-14 years 14Figure 9: Percentage distribution of 10 most common cancers by sex, 1998 and 1999
– Ages 15-29 years 15Figure 10: Percentage distribution of 10 most common cancers by sex, 1998 and 1999
– Ages 30-54 years 15Figure 11: Percentage distribution of 10 most common cancers by sex, 1998 and 1999
– Ages 55-64 years 16Figure 12: Percentage distribution of 10 most common cancers by sex, 1998 and 1999
– Ages 65+ 16Figure 13: Age specific incidence rates for bladder cancer by population group, 1999 20Figure 14: Bladder cancer ASR per 100 000 for selected populations 21Figure 15: Age specific incidence rates for cervix cancer by population group, 1999 23Figure 16: Cervix cancer ASR per 100 000 for selected populations 23Figure 17: Age specific incidence rates for colorectal cancer by population group, 1999 25Figure 18: Colorectal cancer ASR per 100 000 for selected populations 26Figure 19: Age specific incidence rates for colon cancer by population group, 1999 28Figure 20: Colon cancer ASR per 100 000 for selected populations 29Figure 21: Age specific incidence rates for female breast cancer by population group, 1999 31Figure 22: Female breast cancer ASR per 100 000 for selected populations 31Figure 23: Age specific incidence rates for Kaposi sarcoma by population group, 1999 33Figure 24: Kaposi sarcoma ASR per 100 000 for selected populations 34Figure 25: Age specific incidence rates for lung cancer by population group, 1999 36Figure 26: Lung cancer ASR per 100 000 for selected populations 37Figure 27: Age specific incidence rates for melanoma by population group, 1999 39Figure 28: Melanoma ASR per 100 000 for selected populations 40Figure 29: Age specific incidence rates for non-Hodgkin lymphoma by population group, 1999 42Figure 30: Non-Hodgkin lymphoma ASR per 100 000 for selected populations 43Figure 31: Age specific incidence rates for non-melanoma skin cancers by population group, 1999 45Figure 32: Non-melanoma skin cancers ASR per 100 000 for selected populations 46Figure 33: Age specific incidence rates for oesophagus cancer by population group, 1999 48Figure 34: Oesophagus cancer ASR per 100 000 for selected populations 49Figure 35: Age specific incidence rates for prostate cancer by population group, 1999 51Figure 36: Prostate cancer ASR per 100 000 for selected populations 51Figure 37: Age specific incidence rates for uterus cancer by population group, 1999 53Figure 38: Uterus cancer ASR per 100 000 for selected populations 53
cancer98_prelim 4/4/05, 14:381

ii
LIST OF TABLES
Table 1: Direct Standardisation method for the cancer of the cervix in black females, 1999 8Table 2: Frequency distribution of cancer diagnosing laboratories and cancers diagnosed
in 1998 and 1999 by province 11Table 3: Frequency distribution of cancers by population group, sex and year of diagnosis 13Table 4: Summary rates for the leading five cancers by race group and sex, 1998 and 1999 17Table 5: Summary statistics for bladder cancer, 1998 and 1999 19Table 6: Summary statistics for cervix cancer, 1998 and 1999 22Table 7: Summary statistics for colorectal cancer, 1998 and 1999 24Table 8: Summary statistics for colon cancer, 1998 and 1999 27Table 9: Summary statistics for female breast cancer, 1998 and 1999 30Table 10: Summary statistics for Kaposi sarcoma, 1998 and 1999 32Table 11: Summary statistics for lung cancer, 1998 and 1999 35Table 12: Summary statistics for melanoma, 1998 and 1999 38Table 13: Summary statistics for non-Hodgkin lymphoma, 1998 and 1999 41Table 14: Summary statistics for non-melanoma skin cancers, 1998 and 1999 44Table 15: Summary statistics for oesophagus cancer, 1998 and 1999 47Table 16: Summary statistics for prostate cancer, 1998 and 1999 50Table 17: Summary statistics for cancer of the uterus, 1998 and 1999 52
cancer98_prelim 4/4/05, 14:382

iv
FOREWORD
The 1998-1999 cancer incidence report represents an important source of information for our understanding of cancerincidence patterns among the different race groups in South Africa. This report is a result of the dedication of theNational Cancer Registry staff and academicians in the fields of oncology, pathology, histology and Epidemiology. Thesupport from the private laboratory groups is acknowledged and represents a key aspect of public-private partnerships.The report is aimed at generating data on the important trends and patterns in histologically confirmed cancer amongthe South African population.
The National Cancer Registry makes it possible for us to monitor and quantify the burden of cancer disease in ourcountry by publishing cancer incidence nationally. We know that 25% of South African men and 20% of South Africanwomen will at some stage in their lifetime develop a cancer; and which cancers are most prevalent in which popula-tion groups, sex and age categories. Availability of this information has helped us to think more and focus our goalsconcerning cancer disease. Our goal is to reduce morbidity and mortality from cancer and improve the quality of lifeof cancer patients. Important initiatives to prevent and control cancer are being implemented by the Department ofHealth. These include the amendment of the Tobacco Products Control Act in 1999, a government effort to reducelung cancer and other upper respiratory tract conditions, of which tobacco smoking is known to account for a largeproportion. We are also implementing a cervical cancer screening programme amidst some logistical challenges inorder to ensure effective implementation of this programme.
I have also observed with alarm the increasing incidence of breast cancer that is catching up with that of cancer of thecervix in all population groups. These patterns are sending strong and bold messages for prevention and control.Whilst the Department of Health has to come up with cost-effective interventions, I am keen on future and more up-to-date trends on these cancers as an evaluation measure to evaluate our prevention initiatives.
My sincere wish is that these statistics will assists us in implementing our interventions and addressing issues ofinequity and inequality, particularly as we see large disparities and inequity in availability of diagnosing facilities inthe nine South African provinces. Furthermore these statistics should talk more to other areas of cancer prevention andcontrol including educating communities and creating awareness and clinical and palliative management of patients.This report mentions gaps in cancer knowledge in the African context and I would like to call upon all researchers inthe cancer field to engage in research that will consider resource limitations as well as other diseases competing forthe same resources. I would like to call upon all stakeholders to commit and participate in a comprehensive cancerprevention and control approach.
This report was made possible through the dedication and commitment of a number of individuals. I would like toextend my thanks to all who have made the completion of this report possible.
Dr ME Tshabalala- MsimangMinister of Health
cancer98_prelim 4/4/05, 14:384

v
CHAIRPERSON’S COMMENT
The National Cancer Registry, which was first established in 1986, was taken over and developed by Dr Freddy Sitaswho moulded it into its present shape between 1991 and 2002. It plays a critical role in maintaining and developingnational and international awareness of the enormous and growing problem of cancer among the South Africanpopulation.
Cancer is one of the major killers throughout the world, including South Africa. Indeed, South African males have alifetime risk of 1 in 4 of developing cancer, while South African females have a lifetime risk of 1 in 6 of developingcancer. This report, covering the years 1998-1999, will be widely used and quoted by many organisations both in thepublic and private sectors. Government bodies, including the Departments of Health, Home Affairs and Finance, needto know how many people develop and die from cancer, while this information is critical to many private sectorbodies including medical aids, insurance companies, pharmaceutical companies, private hospital groups and finan-cial institutions. Although this is a pathology-based registry, resulting in the under-reporting of many malignancies,some more than others, many critical decisions will be made based on its data. Future population based registries willbe vital, especially when decisions on screening, prevention, as well as treatment are made.
The latest 1998-1999 Registry data once again shows fascinating but worrying trends in the South African cancerstatistics when compared to its 1996-1997 predecessor. Males have a lifetime risk of 1 in 4 of getting cancer asopposed to 1 in 6 in the previous report, with cancers of the prostate, lung, oesophagus, bladder and colon/rectum stillpredominating. Prostate cancer remains the most common major cancer in men with lung and oesophagus cancerfollowing closely behind. In women the lifetime risk of getting cancer is now 1 in 6, as opposed to 1 in 7 in theprevious report, with cancer of the uterine cervix and cancer of the breast predominating with very similar incidences.Colorectal and oesophageal cancer follow, as was the case in 1996-1997.
Lung cancer remains a growing health problem in both sexes. Although males far exceed females, the long term effectsof smoking will result in an increasing incidence of lung cancer in females in years to come. It will be many yearsbefore recent anti-smoking drives and legislation reduce these figures.
As previously mentioned, the reporting of many cancers is inadequate due to a lack of tissue diagnoses. An importantexample is hepatocellular carcinoma which is grossly under-reported, due to the lack of tissue diagnoses, but whichnevertheless remains among the top 15 cancers. Well over a million new cases a year are diagnosed throughout theworld, and as southern Africa, along with the Far East, are endemic areas for the hepatitis B virus, the major causativeagent of this disease, hepatocellular carcinoma remains a major health problem in our country. Future population-based registries and better cancer diagnoses, especially in rural areas, will hopefully give us a more accurate pictureof this usually fatal malignancy, as well as many other under-reported cancers.
Funding remains a major problem for the registry, which relies on support mainly from the National Health LaboratoryService, and to a lesser extent, the Cancer Association of South Africa and the Department of Health. The task ofcollecting and analysing data from most pathology laboratories throughout South Africa is an enormous one andrequires a dedicated staff as well as advanced computer and statistical support. This is a costly exercise which requiresfunding from both the private as well as the public sectors to increase the efficiency of data collection and analysis,especially if population-based registration is to occur. We hope that we will soon be able to broaden our support baseto involve all role players in the health care sector; this will enable us to maintain and develop this national asset wellinto the future.
On behalf of the Scientific Advisory Committee, I would like to congratulate Ms Nokuzola Mqoqi, Ms Patricia Kellett,Mr Musa Jula and the rest of the NCR staff for their tremendous work in completing this report, as well as to thank themany state and private laboratories who have contributed data to the Registry, and without whom this report wouldnot have been possible.
Professor Paul Ruff,Chairperson, Scientific Advisory Committee and Head, Division of Medical Oncology, Department of Medicine,University of the Witwatersrand Faculty of Health Sciences.
cancer98_prelim 4/4/05, 14:385

viii
EXECUTIVE SUMMARY
Amidst the enormous burden of communicable diseases, non-communicable diseases are also emerging as a signifi-cant challenge competing for limited resources in developing countries. After 18 years in operation, the NCR contin-ues to measure and publish the incidence rates of pathology-confirmed cancers in South Africa in an attempt to informcancer control efforts nationally. Towards the end of 1999, the cancer registry started seeing the merger of smaller withbigger laboratories. The number of cases reported is not expected to decrease as a result of these mergers and it isimportant for the registry to monitor the laboratories closely in order to keep track of any changes.
The registry receives pathology reports from all public and private pathology laboratories nationally. In the absence ofany legislative framework of disease reporting, pathology laboratories have voluntarily provided data to the Registrysince its inception. This ongoing national collaboration of all the laboratories across private and public sectors isremarkable. In keeping with emerging concerns about privacy, ethical guidelines to receive and hold this informationare being developed. Since 1992, cancers have been coded and classified following the WHO/International Agencyfor Research on Cancer ICD-O-1 and were reported in ICD-10 following DOH reporting requirements. Changes inmethodologies were implemented and included coding of 1999 data using ICD-O second edition. The aim is to keepup with new research findings in the oncology field and update emerging cancers. Key variables collected includeprimarily the patient demographic data and tumor information. Missing information on population groups remains amajor concern, making it difficult to discern important cancer incidence patterns by population group. About two-thirds of the collected data in 1998 and three quarters of that in 1999 did not report on the population group of cases.Hot-deck imputation methods have been developed in an attempt to provide some continuity. Monitoring cancers bypopulation group would enable the registry to further extend and evaluate the effectiveness and equity of access of thenewly implemented cervical cancer and tobacco control policies, using the existing cancer registry data as a baselinefor these programs. Considering the differences in service delivery in the South African health system in the past,which influenced and dictated availability and access to health facilities and, directly or indirectly, the health seeking-behaviour patterns of different population group; monitoring of disease across different population groups is critical tomeasure the equity efforts in different parts of the country as well as health outcomes in different races.
The largest proportion (40%) of new cancer cases was diagnosed in the Gauteng Province which had the highestnumber of cancer diagnosing facilities (25), with KwaZulu-Natal and the Western Cape Provinces diagnosing 18.6%and 18% respectively.
A total of 59 592 and 59 908 new cancer cases were reported to the NCR in 1998 and 1999 respectively. Femalescomprised 50.5% and 50.9% of all cancer cases diagnosed in the two consecutive years and males comprised 49.5%and 49.1% of all cancer cases in 1998 and 1999 respectively. On average, the white population comprised 46% of allcancer cases (but this includes many basal and squamous cell skin cancers, which are normally excluded by otherregistries). In 1998, the black population comprised 39.4% of all cases and 36.8% of all cases reported in 1999. Asianscomprised the lowest proportion of all races, an average of 2.2%. The lifetime risk (ages 0 to 74 years) of developingcancer in South African males and females remained the same as that reported in 1997, with one in four males andone in five females when adjusted for under-reporting. Cancers of the prostate, lung, oesophagus, colorectal andbladder, in that order, were the five leading cancers in males. In 1999, one in 24 men was at risk of developing thecancer of the prostate and one in 59 men was at risk of developing cancer of the lung. In females, cancers of the breast,cervix, colorectum, oesophagus and uterus were, in order, the five leading cancers. In the two years, one in 27 womenwas likely to develop cancer of the breast in their lifetime and the lifetime risk of developing the cancer of the cervixwas one in 31.
Childhood cancers comprised on average 1% of all female cancers and 2% of all cancers in males reported in 1998and 1999. The top four common childhood cancers in males aged 0–14 years in order, were leukemia, brain, kidneyand non-Hodgkin lymphoma, constituting 53% of all male childhood cancers. In females in the same age categoryand in order, leukemia and cancers of the kidney, brain and bone were the four most common cancers constituting55% of all female childhood cancers.
Important population differences exist. Cancer of the cervix remained the leading cancer in black females in 1999,with lifetime risk of one in 25 black women compared to one in 21 in 1998, at risk of developing the cancer of thecervix. Cancer of the breast was the leading cancer in Asian, coloured and white females. One in 12 white women hada lifetime risk of developing the cancer of the breast. Overall, lower rates than those reported in 1997 and 1998 were
cancer98_prelim 4/4/05, 14:388

ix
reported for the cervix and prostate cancer. Variations in incidence rates were also observed for some sites, for exam-ple, cancer of the lung in males, whilst other sites sustained consistent rates over the years, for example, colorectalcancer in both males and females, and uterus cancer. In some of the leading cancers an increase in the risk ofdeveloping these cancers was observed. For example, the lifetime risk of developing breast cancer in all femalesincreased from 1 in 31 in 1997 to 1 in 27 in 1999, and in black females it increased from 1 in 57 in 1997 to 1 in 49 in1999. White men and women had the highest incidence rate for colon cancer of 16.5 and 11.8 per 100 000, respec-tively.
Amongst cancers known to be associated with HIV/AIDS, Kaposi sarcoma (KS) was the third most common cancer inboth males and females aged 15 – 29 years, and comprised on average nine percent of all female and male cancers inthis age group. Relative to other cancers, KS was still rare and low rates were observed, especially in Asians, colouredsand whites. Contrary to most cancers where the age specific incidence rates peak at older ages, the age standardizedincidence rates for KS showed a bimodal pattern in most race groups with the highest peaks occurring early in life atages 25-29 in females and 35-39 in males. Very little change occurred in Non-Hodgkin lymphoma in the two yearscompared to the previous years.
Cancer incidence rates in South Africa are among the highest rates reported in Africa. Monitoring cancer incidence isimportant in detecting changes in cancer patterns that might occur as a result of changes in environmental conditions,association with new diseases, to detect new cancers and to measure effectiveness of currently implemented cancercontrol programs. Increased efforts should concentrate on establishing comprehensive cooperative regional registra-tion systems and on ensuring long term sustainability of existing registries.
cancer98_prelim 4/4/05, 14:389

11
3. RESULTS
The distribution of the cancer burden in 1998 and 1999 is presented by age groups, sex and race. Detailed frequency distribu-tion tables and cancer site incidence rates are attached at the back of the report. Only the five leading cancers with the highestincidence rates (ASR) in males and females together with some cancers of particular interest are discussed below.
3.1 Data reported in 1998 and 1999A total of 120 515 new cancer cases in 1998 and 1999 combined, were reported to the cancer registry from 84 reportingunits from laboratories countrywide. The number of laboratories sending data has decreased since 1999 due to the mergerof smaller laboratories with larger laboratories. The cancer registry is closely monitoring such trends in order to explain anychanges that may occur in our data. Up to now, no significant changes have been observed as a result of these mergers.
The largest proportion of cases (40.8%) was reported from 25 laboratories in the Gauteng province (GP) (Table 2). Thesecond highest proportion of cases (18.6%) was reported from 11 laboratories in KwaZulu-Natal (KZN).
Table 2: Frequency distribution of cancer diagnosing laboratories and cancersdiagnosed in 1998 and 1999, by province
The Western Cape province (WC), with 16 laboratories, reported about 18% of all cancer cases. About five percent ofall cases were diagnosed from eight laboratories in four rural provinces including Limpopo (LP), Mpumalanga (MP),Northern Cape (NC) and the North-West (NW). There was no significant difference in the proportions of male andfemale cancer cases diagnosed in each province (Figure 4).
At present, the burden of cancer disease by province cannot be estimated from the available NCR data. This is due toa lack of information on patient addresses. Most clinicians are aware that patients cross provincial borders from less tobetter-resourced provinces to seek better treatment. Because of existing health policies governing provincial bounda-ries, patients tend to give local rather than their home addresses. In addition to patient movement, some healthpractitioners send their patient specimens to other provinces for diagnosis. All these factors reflect the services pro-vided by each province on cancer management rather than the true burden of cancer by province.
In an effort to get a better understanding of the burden of cancer cases by province, it is recommended that popula-tion-based cancer registries be established in the nine provinces. The Department of Health guidelines on cancerprevention and control (DOH, 2002) recognises this fact and has recommended the establishment of a rural and urbanpopulation-based cancer registry in each of the nine provinces. Until such recommendations come into effect, estima-tion of cancer incidence by province will remain a difficult task.
Province No. of labs % of labs *No. of cases % of cases
Eastern Cape 14 16.70 11 524 9.60
Free State 10 11.90 10 293 8.50
Gauteng 25 29.80 49 159 40.80
KwaZulu-Natal 11 13.10 22 452 18.60
Limpopo 1 1.20 330 0.30
Mpumalanga 3 3.60 1 904 1.60
Northern Cape 2 2.40 1 164 1.00
North-West 2 2.40 2 138 1.80
Western Cape 16 19.00 21 551 17.90
Total 84 100.00 120 515 100.00
*Please note: these figures reflect service provision rather than burden of cancer per province.

12
Figure 4: Percentage distribution of cancer cases by diagnosing province and sex, 1998 and 1999 combined
3.2 Frequency of new cancers in 1998 and 1999There were 60 172 new cancer cases reported to the cancer registry in 1998 and 60 343 new cases in 1999. In both1998 and 1999, female cancer cases comprised half of all reported cases. Overall, Whites comprised the highestproportion of all cancer cases, comprising 45.2% and 46.4% in 1998 and 1999 respectively (Figure 5). The secondhighest proportion of new cancer cases comprised Blacks, with 39.4% of all cancer cases in 1998 and 36.8% in 1999.
Figure 5: Percentage distribution of cancers by years of diagnosis and population group
n=2n=2n=3
n=1
n=11
n=25
n=16
n=14n=10
0
5
10
15
20
25
30
35
40
45
EC FS GP KZ LP MP NC NW WC
Province
Pe
rce
nta
ge
Males Females
2.3
39.4
8.3
45.1
4.82.1
36.8
5.6
9.1
46.3
0
5
10
15
20
25
30
35
40
45
50
Asian Black Coloured White Unknown
Population group
Pe
rce
nta
ge
1998 1999
Pe
rce
nta
ge
Pe
rce
nta
ge

13
Black women comprised the largest proportion of all female cancer cases, constituting 44.1% and 41.7% in 1998 and1999 respectively (Table 3). The second-highest proportion of all female cancer comprised white females who consti-tuted 40.3% of all female cancers in 1998 and 41.3% in 1999. One half of all male cancer cases in the two years werewhite males, whilst black males comprised about one third of all male cancer cases. In line with South Africandemographics, the Asian population had the lowest number of reported cases.
Table 3: Frequency distribution of cancers by population group, sex and year of diagnosis(% of the total in parentheses)
3.3 Age distribution of cancer casesChildren (0-14 years) comprised one percent of all female cancer cases, whilst young women aged between 15 and 29years comprised four percent of the total female cancer cases in 1998 and 1999. The largest proportion (37%) of cancersoccurred in women aged between 30 and 54. Elderly women aged 65 years and older comprised about one third of allfemale cancers. Two percent of all male cancers were reported in children, and three percent in young men aged between15 and 29 years old. The majority of cancers (40%) were reported in elderly men aged 65 years and older (Figure 6).
Figure 6: Percentage distribution of new cancer cases reported in 1998 and 1999 by age groups and sex(includes BCC and SCC of skin)
65+40%
55-6424%
Un-known
4%15-29
3%
00-142%
30-5427%65+
32%
55-6422%
Un-known
4%15-29
4%
00-141%
30-5437%
Females (N=58 1 11) Males (N=56 577)
1998 1999
Sex / Population No. of cases Percentage No. of cases Percentage
Females
Asian 826 2.74 741 2.43
Black 13 259 44.07 12 711 41.7
Coloured 2 553 8.48 2 798 9.18
White 12 111 40.25 12 573 41.25
Unknown 1 343 4.46 1 657 5.44
All females 30 092 100 (50.0) 30 480 100 (50.5)
Males
Asian 569 1.93 533 1.81
Black 10 239 34.71 9 346 31.76
Coloured 2 397 8.13 2 666 9.06
White 14 792 50.14 15 193 51.63
Unknown 1 503 5.09 1 690 5.74
All males 29 500 100 (49.0) 29 428 100 (48.8)
Unknown sex 580 (1.0) 435 (0.7)
TOTAL 60 172 (100) 60 343 (100)

14
3.3.1 Distribution of cancer sites by age groupThe frequency distribution of the top 10 cancers in all age groups is shown in Figure 7. Of all the cancers in females,breast, cervix and BCC cancers comprised more than half of those reported in 1998 and 1999. Cancer of the breastwas the most common cancer in females and comprised 19% of all female cancer cases in the two years. Cancer ofthe cervix was the second most common, comprising 18.6% of all female cancer cases. In males, BCC and prostatecancers remained the first and second most common cancers, with prostate comprising 13.6% of all male cancers.
Figure 7: Percentage distribution of 10 most common cancers by sex, 1998 and 1999, All ages
In children (ages 0-14 years), leukemia was the most common cancer comprising about a quarter of all cancers inmales and females. Leukemia, brain, kidney, non-Hodgkin lymphoma and eye cancers, (in that order), comprised thefive most common cancers in male children, with proportions of the total cancers in this age group ranging between6.7% and 24% (Figure 8). In female children, the five most common cancers (in that order), were leukemia, kidney,brain, bone and non-Hodgkin lymphoma, with proportions ranging between 5.3% for NHL and 24.7% for leukemia.
Figure 8: Percentage distribution of 10 most common cancers by sex, 1998 and 1999, 0-14 years
25.57
2.46
2.49
2.6
2.67
3.05
3.44
4.42
15.7
18.6
19
4.10
5.40
6.24
6.75
13.63
23.31
3.45
2.65
2.56
2.11
29.80
40.00 30.00 20.00 10.00 0.00 10.00 20.00 30.00
Males (n = 60 572) Females (n = 58 928)
26.91
1.58
1.72
1.72
3.03
4.62
5.28
6.07
9.76
14.64
24.00
11.50
9.40
7.85
6.66
4.93
3.01
3.01
2.46
1.82
25.36
30.00 20.00 10.00 0.00 10.00 20.00 30.00
Males (n = 1096) Females (n = 758)
BCC Breast
Prostate Cervix
SCC of skin BCC
Lung SCC of skin
Oesophagus Oesophagus
Colorectal Colorectal
Bladder Ovary
Stomach Uterus
Melanoma Lung
Larynx Melanoma
Other sites Other sites
Leukaemia Leukaemia
Brain Kidney
Kidney Brain
Non-Hodgkin lymphoma Bone
Eye Non-Hodgkinlymphoma
Bone Eye
Burkitt lymphoma Ovary
Connective tissue Burkitt lymphoma
Liver & Bile duct Breast
Naso-oropharynx Endocrine
Other sites Other sites
Percentage
Percentage

15
23.29
1.59
1.85
1.97
2.4
2.44
2.45
2.56
12.7
23.07
25.6824.07
7.06
6.68
5.05
3.63
3.37
3.34
3.32
3.01
2.76
37.71
50.00 30.00 10.00 10.00 30.00 50.00
Males (n = 16 152) Females (n = 22 498)
Cancer of the cervix was the most common cancer in young women aged 15-29 years old, comprising 12.5% of allcancers. The five most common cancers, in order, included the cervix, breast, Kaposi sarcoma, BCC and melanoma,with proportions of all cancers in this age group ranging between six percent for melanoma and 12.5% for the cervix(Figure 9). In young males in the same age group, leukemia remained the most common cancer, as in children. The fivemost common cancers in these males, in order, were leukemia, BCC, Kaposi sarcoma, non-Hodgkin lymphoma andbone. The proportions of all cancers in this age group ranged between 6.8% for bone and 9.8% for leukemia. This isthe only age group where Kaposi sarcoma ranks in the five most common cancers.
Figure 9: Percentage distribution of 10 most common cancers by sex, 1998 and 1999, 15-29 years
Cancer of the cervix was the most common and comprised one quarter of all cancers in females aged 30-54 years.Cancer of the cervix, the breast (the second most common cancer) and BCC together comprised about two-thirds of allfemale cancers in this age category (Figure 10). Included in the five most common cancers were melanoma andcancer of the oesophagus, each comprising 2.5% of all cancers in this age category. Breast and cervix cancer re-mained the most common cancers in females aged 55-64 years old comprising 19.7% and 18.6% of all cancers in thisage group respectively (Figure 11). In women 65 years and older, cancers of the breast and the cervix, comprising16.1% and 11.51% respectively were second and third most common cancers to BCC, which comprised 20.9% of allcancers in this age group (Figure 12).
Figure 10: Percentage distribution of 10 most common cancers by sex, 1998 and 1999, 30-54 years
34.93
3.42
3.84
3.93
4.14
4.94
5.95
8.02
8.87
9.50
12.469.77
9.34
9.28
7.77
6.80
5.77
5.77
5.45
4.05
3.94
32.06
40.00 30.00 20.00 10.00 0.00 10.00 20.00 30.00 40.00
Males ( n = 1853) Females (n = 2 368)
Leukaemia Cervix
BCC Breast
Kaposi Sarcoma Kaposi Sarcoma
Non-Hodgkin lymphoma BCC
Bone Melanoma
Hodgkin lymphoma Non-Hodgkin lymphoma
Melanoma Hodgkin lymphoma
Testis Thyroid
Liver & Bile duct Leukaemia
Connective tissue Ovary
Other sites Other sites
BCC Cervix
Oesophagus Breast
Lung BCC
SCC of skin Melanoma
Colorectal Oesophagus
Melanoma Ovary
Karposi sarcoma Colorectal
Prostate SCC of skin
Nod-Hodgkin lymphoma Lung
Stomach Non-Hodgkin lymphoma
Other sites Other sites
Percentage
Percentage

16
Figure 11: Percentage distribution of 10 most common cancers by sex, 1998 and 1999, 55-64 years
BCC was the most common cancer in males, comprising about one quarter of all cancers in age groups older than 30years. Although prostate cancer was the eighth most common cancer at ages 30 to 54, at ages 55 years and older, itbecame the second most common cancer comprising 15.2% in young elderly men (55-64 years) and 22.1% in elderlymen (65+) (Figures 10-12). Cancer of the prostate together with non-melanoma skin cancers comprised more than halfof all cancers in men 65 years and older.
Figure 12: Percentage distribution of 10 most common cancers by sex, 1998 and 1999, 65+ years
23.57
2.06
3.11
3.26
3.32
3.65
3.78
4.02
14.93
26.58
2.11
2.58
2.92
3.51
4.15
6.23
6.80
7.92
15.15
22.05
30.00 20.00 10.00 0.00 10.00 20.00 30.00
Males (n = 14 176) Females (n = 13 033)
23.7
2.26
2.58
2.99
3.39
3.45
5.2
7.86
11.51
16.12
20.94
18.76
1.67
2.00
2.86
3.97
4.66
4.72
5.64
8.70
22.06
24.96
30.00 20.00 10.00 0.00 10.00 20.00 30.00
Males (n = 23 300) Females (n = 19 454)
BCC Breast
Prostate Cervix
Lung BCC
Oesophagus Oesophagus
SCC of skin Uterus
Colorectal SCC of skin
Bladder Lung
Larynx Colorectal
Stomach Ovary
Melanoma Melanoma
Other sites Other sites
BCC BCC
Prostate Breast
SCC of skin Cervix
Lung SCC of skin
Colorectal Colorectal
Bladder Uterus
Oesophagus Oesophagus
Stomach Lung
Melanoma Ovary
Larynx Melanoma
Other sites Other sites
Percentage
Percentage

17
3.4 Incidence of cancer in 1998 and 1999This section presents the incidence of cancer and the ranking of leading cancers. This ranking is based on age stand-ardised rates rather than on the actual number or proportions of cancers on which the common cancers discussed insection 3.3.1 above were based. Basal cell carcinoma and SCC of skin are excluded from the ranking as these occurmost commonly with very high incidence rates, particularly in Whites, and therefore tend to overshadow all othercancers. Since the registry reports cancers by site, cancers whose primary site is not known or for which there is noindication of the primary site – particularly in the case of cancers that have metastasized to other sites – are classifiedas PSU (i.e. primary site unknown). These are also excluded from the ranking.
Table 4 presents a summary of the five leading cancers diagnosed in 1998 and 1999 for each population group inmales and females. In 1999, the risk of developing cancer in South African females between ages 0-74 years was 1 in6 females (1 in 5 females when adjusted for under-reporting). The ASR for cancer in females was 134.9 per 100 000(95% CI=133.1-136.58). Cancers of the breast, cervix, colorectal, oesophagus and uterus were, in order, the fiveleading cancers in females. The risk of developing cancer in a male’s lifetime in 1999 was 1 in 5 (1 in 4 when adjustedfor under-reporting). Cancer of the prostate, lung, oesophagus, colorectal and bladder were, in order, the leadingcancers with all cancers in males having an ASR of 148.9 per 100 000 (95% CI=146.8-151.0). Overall cancer ratesobserved in 1999 are lower than those reported for 1997 and 1998. The low rates observed in 1999 compared to theprevious years cannot be explained, a number of factors could be attributed. These might inlcude under-reporting, orthis might be reflecting real trends in cancer status. The changes in service delivery could not be ruled out but cancertime trends will be closely monitored. In addition, it is important to note that the NCR’s previous cancer reports werereporting the upper confidence limits (UCL) of the ASR and therefore, for comparison purposes with previous reports,one should use UCLs from the tables at the back of this report.
Table 4: Summary rates for the leading five cancers by race group and sex, 1998 and 1999
1998 1999
Pop / Sex Cancer ASR LR Cancer ASR LR
Asian Female Breast 45.26 18 Breast 49.62 18
Cervix 16.39 49 Cervix 11.02 81
Uterus 11.76 65 Colorectal 7.31 99
Colorectal 10.45 78 Uterus 7.13 106
Stomach 6.5 120 Ovary 6.29 121
All 164.59 6 All 143.24 7
Asian Male Prostate 20.41 46 Prostate 18.34 39
Stomach 12.8 64 Colorectal 14.28 51
Lung 12.18 59 Lung 12.93 63
Colorectal 11.01 94 Stomach 12.77 66
Leukaemia 7.69 170 Bladder 10.46 108
All 139.87 7 All 126.81 7
Black Female Cervix 42.1 21 Cervix 34.88 25
Breast 17.98 51 Breast 18.39 49
Oesophagus 7.36 108 Oesophagus 6.95 113
Uterus 3.92 193 Uterus 4.68 157
Ovary 3.07 257 Ovary 2.76 313
All 111.00 9 All 103.71 9
Black Male Prostate 20.64 42 Prostate 17.17 50
Oesophagus 15.59 53 Oesophagus 14.13 59
Lung 12.07 68 Lung 9.28 87
Larynx 4.37 193 Larynx 4.09 193
Stomach 3.6 233 Colorectal 2.96 286
All 109.94 9 All 97.11 10

18
Coloured Female Breast 45.21 19 Breast 49.77 18
Cervix 29.04 30 Cervix 26.35 34
Colorectal 7.99 109 Colorectal 9.66 89
Lung 7.55 100 Lung 9.65 76
Stomach 6.8 118 Uterus 6.61 107
All 158.98 6 All 171.04 6
Coloured Male Prostate 47.14 17 Prostate 47.98 19
Lung 20.15 38 Lung 23.48 32
Colorectal 13.76 58 Stomach 16.25 51
Stomach 13.55 63 Colorectal 14.09 56
Oesophagus 13.36 59 Bladder 12.53 66
All 202.59 5 All 214.79 4
White Female Breast 76.04 12 Breast 76.46 12
Melanoma 15 66 Colorectal 17.52 48
Colorectal 14.99 58 Melanoma 16.73 61
Cervix 14.5 67 Cervix 12.04 81
Ovary 10.81 78 Ovary 10.07 82
All 230.28 4 All 230.46 4
White Male Prostate 78.51 10 Prostate 74.38 10
Colorectal 23.74 35 Colorectal 25.44 31
Bladder 23.74 35 Bladder 23.69 35
Lung 21.7 35 Melanoma 20.94 43
Melanoma 19.27 48 Lung 20.74 37
All 284.55 3 All 277.13 4
All Females Cervix 34.43 26 Breast 33.41 27
Breast 32.70 27 Cervix 28.69 31
Colorectal 5.83 154 Colorectal 6.61 131
Oesophagus 5.95 136 Oesophagus 5.49 143
Ovary 4.91 166 Uterus 5.09 146
All 136.74 6 All 134.86 6
All Males Prostate 37.59 22 Prostate 34.12 24
Lung 15.18 52 Lung 13.56 59
Oesophagus 12.56 65 Oesophagus 11.33 73
Colorectal 9.44 92 Colorectal 9.74 83
Bladder 8.63 98 Bladder 8.24 104
All 156.18 4 All 148.87 5
ASR Age standardised incidence rate per 100 000 (World standard population)
LR Lifetime risk (0-74 years) of developing a cancer expressed as 1 in X number of people
Please note: ASR for all males and females excludes BCC and SCC of skin
Ranking excludes BCC, SCC of the skin, PSU and ill defined sites

19
3.5 Cancer by siteThis section presents a brief discussion of the five leading cancers in males and females. Included as well are sites thatare known to have shown increases in incidence rates as a result of their association with HIV and AIDS or are highlyprevalent in South African populations for example melanoma and non-melanoma skin cancers. These include Kaposisarcoma and Non-Hodgkin lymphoma.
3.5.1 Cancer of the Bladder
Cigarette smoking is the most important risk factor for bladder cancer and shows a linear increasing relationship with thenumber of cigarettes smoked per day and the duration of smoking. In developed countries it accounts for 65% of allbladder cancer cases in men and 30% of female bladder cancer cases (Parkin, Ferlay et al., 2003; Stewart and Kleihues,2003). Epidemiological studies establishing a relationship between smoking and bladder cancer and controlling forconfounders, showed that, relative to never-smokers, the strength of association (OR) ranged between 1.4 (CI=0.9 -2.3)
Table 5: Summary statistics for bladder cancer, 1998 and 1999
Pop / Sex N(Obs) N(Adj) Percent Crude ASR 95%LCL 95%UCL Cumrisk LR
Females, 1998
Asian 17 17 4.15 3.1 3.99 2.07 5.91 0.36 278
Black 153 160 37.32 0.93 1.33 1.12 1.55 0.15 667
Coloured 45 45 10.98 2.34 3.42 2.41 4.43 0.43 233
White 195 203 47.56 7.99 5.2 4.44 5.95 0.58 173
Total 410 425 100.00 1.92 2.55 2.52 2.58 0.28 353
Males, 1998
Asian 25 26 2.57 4.86 7.38 4.41 10.35 0.82 122
Black 184 193 18.89 1.17 2.25 1.92 2.58 0.26 385
Coloured 104 108 10.68 5.89 12 9.70 14.30 1.54 65
White 661 696 67.86 28.21 23.74 21.97 25.51 2.9 35
Total 974 1023 100.00 4.83 8.63 8.48 8.78 1.02 98
Females, 1999
Asian 9 9 2.39 1.62 1.81 0.60 3.02 0.21 477
Black 97 99 25.80 0.56 0.81 0.65 0.98 0.09 1112
Coloured 39 39 10.37 2 2.78 1.93 3.64 0.27 371
White 231 242 61.44 9.5 6.28 5.46 7.11 0.8 126
Total 376 389 100.00 1.78 2.45 2.42 2.48 0.29 350
Males, 1999
Asian 38 40 4.06 7.38 10.46 7.02 13.90 0.93 108
Black 123 130 13.16 0.77 1.52 1.25 1.79 0.19 527
Coloured 110 117 11.76 6.29 12.53 10.22 14.83 1.53 66
White 664 713 71.02 28.88 23.69 21.95 25.42 2.89 35
Total 935 1000 100.00 4.73 8.48 8.34 8.62 0.99 101
N(Obs) Number of cases observed
N(Adj) Observed cases adjusted for unknown population group
Percent Percentage of all site cancers
Crude Number of cases / population per 100 000
ASR Age standardised incidence rate per 100 000 (World standard population)
95%LCL 95% Lower condence limit for ASR
95%UCL 95% Upper condence limit for ASR
Cumrisk Cumulative lifetime incidence risk (0-74 years)
LR Lifetime risk (0-74 years) of developing a cancer expressed as 1 in X number of people
Please note: Ranking excludes BCC, SCC of the skin, PSU and ill dened sites

20
in males smoking 15g tobacco per day and 6.6(CI=3.1-13.9) for current smokers. The strength of asso-ciation depended on histology type, with the risk higherfor Transitional cell carcinoma (TCC), (OR = 9.1) thanother histologies (OR = 4.4), duration and magnitude ofsmoking relative to non-smokers. Relative to never-smokers, smokers smoking less than 20 cigarettes perday had a relative risk of 5.4 compared to 7.6 for thosehaving smoked 20 or more years. Higher risk (OR = 16.5)was observed among smokers who had smoked morethan 40 years (Vizcaino et al., 1994; Bedwani et al., 1997;Parkin, Ferlay et al., 2003). Infection with Schistosomahaematobium (urinary bilharziasis) is reported to be amajor risk factor in areas with high prevalence and, pos-sibly, urinary tract infections in women (Parkin, Ferlay etal., 2003; Stewart and Kleihues, 2003). Diets rich invitamin A and carotenoids have been associated withdecreased risk of bladder cancer. Some other known riskfactors for bladder cancers, which have not been investi-gated in Africa, are related to occupation. These includerubber and dyestuff industries, exposure to aromaticamines, polychlorinated biphenyls, polycyclic aromatichydrocarbons, formaldehyde, asbestos, leathermanufacturers and painters (Parkin, Ferlay et al., 2003).
Figure 13: Age specific incidence rates for bladder cancer by population group, 1999
Numbers and incidence
A total of 1028 and 1005 bladder cancer cases werereported in males in 1998 and 1999 respectively. Thesecomprised about 3.5% of all cancers reported in males.Bladder cancer was the fifth leading cancer in both 1998and 1999. The crude rate in males was 4.7 per 100 000 andthe ASR was 8 per 100 000 (Table 5). Males were at higherrisk of developing bladder cancer than females, as theirchances were three times that observed in women. The riskof developing bladder cancer increased with age. Incidencerates greater than 49 per 100 000 were observed in men 65years and older (Figure 13).
In 1998, one in 98 men and in 1999, one in 104 menaged 0 – 74 years were at risk of developing bladdercancer. In women, a total of 426 and 395 bladdercancers were reported in 1998 and 1999 respectivelyand these comprised 1.4% of all female cancers reported.Bladder cancer was the 11th leading cancer in womenin the two years, with a crude rate on average of 1.8 per100 000 and an ASR of 2.5 per 100 000. At ages 65years and older, ASIRs of 12 per 100 000 and higherwere observed in elderly women. The lifetime risk (ages0-74 years) of developing bladder cancer in women was1 in 353 and 1 in 362 in 1998 and 1999 respectively.
Bladder, 1999 - Females
0
10
20
30
40
50
60
00
-04
05
-09
10
-14
15
-19
20
-24
25
-29
30
-34
35
-39
40
-44
45
-49
50
-54
55
-59
60
-64
65
-69
70
-74
75
+
Age Group
AS
IR / 1
00 0
00
AF BF CF WF
Bladder, 1999 - Males
0
50
100
150
200
250
300
00
-04
05
-09
10
-14
15
-19
20
-24
25
-29
30
-34
35
-39
40
-44
45
-49
50
-54
55
-59
60
-64
65
-69
70
-74
75
+
Age Group
AS
IR / 1
00 0
00
AM BM CM WM

21
Population variation
Bladder cancer was the third leading cancer in whitemales, comprising 4.5% of all white male cancers in thetwo years. White males comprised 68% and 71% of allbladder cancer cases reported in 1998 and 1999 respec-tively. The lifetime risk of developing bladder cancer inwhite males was 1 in 35 with the highest incidence rateof 23.7 per 100 000. In both coloured and Asian males,bladder cancer ranked the sixth and fifth leading can-cers in 1998 and 1999 respectively. Coloured males wereat higher risk of developing bladder cancer than Asianmales, with an ASR of 12 per 100 000 compared to 7.4per 100 000 in 1998 and 10.5 in 1999 reported amongAsian males (Table 5). Bladder cancer comprised onaverage 1.5% of all cancers reported in black men andhad the lowest incidence rates of 2.3 per 100 000 andabout 1 per 100 000 in the two consecutive years (Table5). In 1999, the incidence rate in black men was about16 times lower than that observed in white men.
The bladder cancer incidence pattern in females wassimilar to that observed in males. It comprised on aver-age about 1.7% of all cancers in white females. Whitewomen also had the highest incidence rates of 5.2 per100 000 and 6.3 per 100 000 in the two consecutiveyears compared to other population groups. In 1998 and1999, bladder cancer ranked the ninth and eighth lead-ing cancer in white women and comprised 47.6% and61.4% of all bladder cancer cases respectively. Colouredfemales had the second highest ASR of 2.8 per 100 000,with the lowest rates reported among black females. Theincidence rate for bladder cancer in black women waseight times lower than that observed in white women.
(Data source: Parkin, Whelan et al., 2002)
International comparison
Worldwide, cancer of the bladder is the ninth commoncancer, with about 330 000 new cases reported per year(Stewart and Kleihues, 2003). In 2000, about 26 000 newbladder cancer cases were reported from Africa, withhigh incidence rates found in North Africa (Parkin, Ferlayet al., 2003). In 1999, bladder cancer incidence rates inWhite and Coloured South African men were among thehighest rates reported worldwide, particularly in devel-oped countries (Figure 14).
Incidence rates among South African Asians are doublethose reported in men in India (Bombay). Rates amongSouth African Black men are among the lowest rates re-ported. Parkin, Ferlay et al. (2003) argue that the limita-tions in comparability of bladder cancer include “differ-ent practices concerning cytoscopy, biopsy of lesions,the extent of histological examination of biopsy materialand the classification of malignant, non-invasive tu-mours”.
Incidence rates for bladder cancer in black women inZimbabwe (Harare) and South African white women wereamong the highest rates reported in women worldwide.Rates in South African Asian women and women in In-dia (Bombay) compare well. It is not clear whether thelow incidence rates observed in Uganda, South Africa(Black men and women) and The Gambia are a true re-flection of the status of bladder cancer or are due to thelimitations mentioned by Parkin, Ferlay et al., (2003).
Figure 14: Bladder cancer ASR per 100 000 for selected populations
Bladder - Females
0.5
0.8
1.2
1.3
1.8
2.3
2.7
2.8
4.2
4.6
5.8
6.1
6.2
6.3
8.3
0 2 4 6 8 10
The Gambia
SA, Black
Uganda (Kyadondo)
India (Bombay)
SA, Asian
Algeria (Algiers)
Brazil (Goiania)
SA, Coloured
USA, SEER (Black)
Australia (Tasmania)
Mali (Bamako)
UK, England
USA, SEER (White)
SA, White
Zimbabwe (Harare)
Age standardised rates per 100 000
Bladder - Males
1.2
1.5
2.9
4.6
8.3
10.5
10.8
11.2
11.3
11.3
12.5
19.9
22.3
23.3
23.7
0 5 10 15 20 25
The Gambia
SA, Black
Uganda (Kyadondo)
India (Bombay)
Zimbabwe (Harare)
SA, Asian
Algeria (Algiers)
Brazil (Goiania)
Mali (Bamako)
USA, SEER (Black)
SA, Coloured
Australia (Tasmania)
UK, England
USA, SEER (White)
SA, White
Age standardised rates (per 100 000)

22
3.5.2 Cancer of the Cervix
Infection with high-risk oncogenic human papilloma virus (HPV) types (including types 16, 18, 31, 33, 39, 45, 52 and35) is known to be a necessary cause of cervical cancer (IARC, 1995; Walboomers et al., 1999; Santos et al., 2001;Bosch et al., 2002; Munoz et al., 2003; Monsonego et al., 2004). The worldwide prevalence of HPV in cervicalcarcinomas is reported to be 99.7% (Walboomers et al., 1999). Some endogenous or exogenous factors are believedto act in conjunction with HPV infection to cause invasive cancer. Other risk factors known to be strongly associatedwith invasive cervical cancer include low social class, as well as sexual behaviour such as the lifetime number ofsexual partners, and early age at first intercourse (Green et al., 2003). Smoking had been associated with cervicalcancer. Evidence on the relationship between progestogen-only contraceptives and cervical cancer is, however, un-clear. In 1993 the cancer of the cervix was declared an AIDS defining condition because of its association with HIVand AIDS (Serraino, et al., 1999; Frisch et al., 2000). Data in Africa has been slow in demonstrating this associationand only lately that studies in Africa were able to demonstrate this association. There is to date good data showing anincreased incidence of invasive cervical cancer to HIV epidemic. Since 1960, a moderate increase in cervical cancerwas reported for all age groups in Uganda (Parkin, Ferlay, et al., 2003). In a case-control study in Johannesburg Sitas etal., (2000), showed a slight association between HIV and cancer of the cervix (OR=1.6, 95% CI 1.1-2.3), but a formerstudy appeared to contradict this finding (Sitas, et al., 1997). Similar relative risk was reported in Uganda and inRwanda (Newton et al., 1995; 1996; 2001). However, some studies have demonstrated an association between HIVand the increased prevalence of human papilloma virus (HPV) and cervical intraepithelial neoplasia (CIN) (Thomas,2001; Mbulaiteye, et al., 2003).
Table 6: Summary statistics for cervix cancer, 1998 and 1999
Pop / Sex N(Obs) N(Adj) Percent Crude ASR 95%LCL 95%UCL Cumrisk LR
Females, 1998
Asian 84 84 1.43 15.3 16.39 12.94 19.84 2.07 49
Black 4922 5069 83.64 29.54 42.1 40.93 43.28 4.82 21
Coloured 421 433 7.15 22.48 29.04 26.24 31.83 3.36 30
White 458 470 7.78 18.51 14.5 13.19 15.82 1.51 67
Total 5885 6056 100.00 27.33 34.43 34.04 34.81 3.84 26
Females, 1999
Asian 56 57 1.13 10.25 11.02 8.20 13.84 1.24 81
Black 4127 4342 83.48 24.71 34.88 33.83 35.93 4.09 25
Coloured 390 411 7.89 21.03 26.35 23.76 28.95 2.98 34
White 371 391 7.50 15.36 12.04 10.85 13.24 1.24 81
Total 4944 5201 100.00 23.46 29.72 29.39 30.06 3.37 30
N(Obs) Number of cases observed
N(Adj) Observed cases adjusted for unknown population group
Percent Percentage of all site cancers
Crude Number of cases / population per 100 000
ASR Age standardised incidence rate per 100 000 (World standard population)
95%LCL 95% Lower condence limit for ASR
95%UCL 95% Upper condence limit for ASR
Cumrisk Cumulative lifetime incidence risk (0-74 years)
LR Lifetime risk (0-74 years) of developing a cancer expressed as 1 in X number of people
Please note: Ranking excludes BCC, SCC of the skin, PSU and ill dened sites

23
Cervix - Females
6.8
8.2
9.1
10.2
11.02
12
12.5
17.1
26.4
29.8
34.9
35.9
38.2
41.7
55
0 10 20 30 40 50 60
USA, SEER (White)
UK, England
Australia (Tasmania)
USA, SEER (Black)
SA, Asian
SA, White
Algeria (Algiers)
India (Bombay)
SA, Coloured
The Gambia
SA, Black
Mali (Bamako)
Brazil (Goiania)
Uganda (Kyadondo)
Zimbabwe (Harare)
Age standardised rates (per 100 000)
Cervix, 1999 - Females
0
20
40
60
80
100
120
140
160
180
00
-04
05
-09
10
-14
15
-19
20
-24
25
-29
30
-34
35
-39
40
-44
45
-49
50
-54
55
-59
60
-64
65
-69
70
-74
75
+
Age Group
AS
IR / 1
00 0
00
AF BF CF WF
Figure 16: Cervix cancer ASR per 100 000 forselected populations
Well-implemented and successful cervical cancer screen-ing programs have been reported to reduce the incidenceof cervical cancer significantly. The South African cervi-cal cancer-screening policy and the program imple-mented since 2001 are attempts to reduce the incidenceof cervical cancer, which is the leading cancer amongSouth African women. Three smears per lifetime are rec-ommended for the program, commencing after the ageof 30 and with a 10-year interval between each smear.The ultimate goal is to reduce cervical cancer incidencerates by 60% (DOH, 2000).
Numbers and incidence
A total of 6 061 and 5 203 cervix cancer cases werereported to the cancer registry in 1998 and 1999 respec-tively. These comprised 20% and 17% of all cancer casesreported in females over the two years. Cervix cancerwas the leading cancer in women in 1998 and the sec-ond leading cancer after breast cancer in 1999. Cruderates for the cervix cancer were 27.3 per 100 000 and26.1 per 100 000, with corresponding ASR of 34.4 per100 000 and 28.7 per 100 000 in 1998 and 1999 re-spectively (Table 6). South African women had a lifetimerisk of developing cervix cancer of 1 in 26 in 1998 and 1in 31 in 1999. The risk of developing cancer of the cer-vix increased with age, peaking at 136.4 per 100 000 inwomen between the ages of 65 and 69 in 1999.
Population variation
Cancer of the cervix has, since the beginning of the NCR in1986, been the leading cancer in black women. A total of 5069 cancers were reported in black females in 1998, with4 342 reported in 1999, comprising on average about 84%of all cervix cancer cases reported in the two years, andabout 37% and 33% of all cancers reported in black womenin 1998 and 1999 respectively. Age standardised rates were42 per 100 000 in 1998 and 35 per 100 000 in 1999. In1998, 1 in 21 black women (0-74 years) was at risk of de-veloping cervix cancer and in 1999 this risk dropped to 1in 25 women. ASIR peaked at 152.5 per 100 000 in blackwomen aged between 65 and 69 years (Figure 15).The second highest rates of 29 per 100 000 and 26.4 per100 000 in the two consecutive years were recorded amongcoloured women. Coloured women comprised on average7.5% of all cervical cancer cases reported and 15% of allcoloured female cancer cases. Asian women had the low-est cervix cancer incidence rates of 11 per 100 000 in 1999with the risk of developing cervix cancer in coloured andwhite women threefold lower than that reported in blackwomen. Cervix cancer in white women peaked at a signifi-cantly lower ASIR rate (34.5 per 100 000) and at a youngerage (60-64) than in black and coloured women where ASIRpeaked between the ages of 65 and 69.
Figure 15: Age specific incidence rates for cervixcancer by population group, 1999
(Data source: Parkin, Whelan et al., 2002)
International comparison
Cancer of the cervix is the second most common canceramong women worldwide (Parkin, Ferlay et al., 2003).High cervical cancer incidence rates occur in developingcountries with Zimbabwean black women leading withincidence rates of 55 per 100 000 (Figure 16). South Afri-can rates in black women are high considering that thiscomparison is made against data that is gathered througha population-based and, therefore, a more comprehen-sive data collection system. One of the limitations of avoluntary and passive surveillance system is incompletesubmission of data on which the accuracy of rates de-pend. It is believed that the rates in this report are minimalrates and that more accurate rates could be achieved withimplementation of a more comprehensive data collectionsystem such as the population-based cancer registry.

24
3.5.3 Colorectal cancer
Diet and genetic factors play an important role in the development of colorectal cancer. The risk of developing colorectalcancer is determined by local environmental conditions within the bowel (Boyle and Zaridze, 1983). Diets high incalories, rich in animal fat and poor in vegetables and fibre are associated with increased risk. Smoking, meat andalcohol consumption are known risk factors whilst the consumption of vegetables and physical activity are known tobe protective (Winawer et al., 1997 and Potter, 1999). Some case-control studies investigating the effects of smokingand alcohol consumption on colorectal cancer have shown a positive association.
Table 7: Summary statistics for colorectal cancer, 1998 and 1999
Pop / Sex N(Obs) N(Adj) Percent Crude ASR 95%LCL 95%UCL Cumrisk LR
Females, 1998
Asian 46 47 5.09 8.56 10.45 7.44 13.46 1.29 78
Black 226 240 25.00 1.4 2.04 1.77 2.30 0.22 455
Coloured 102 109 11.28 5.66 7.99 6.46 9.51 0.92 109
White 530 564 58.63 22.21 14.99 13.70 16.28 1.73 58
Total 904 960 100.00 4.33 5.83 5.57 6.33 0.65 154
Males, 1998
Asian 44 44 3.97 8.22 11.01 7.83 14.19 1.07 94
Black 271 287 24.48 1.75 3.02 2.65 3.39 0.31 323
Coloured 130 138 11.74 7.52 13.76 11.40 16.12 1.75 58
White 662 699 59.80 28.34 23.74 21.97 25.51 2.89 35
Total 1107 1168 100.00 5.51 9.44 8.89 10.00 1.09 92
Females, 1999
Asian 35 35 3.31 6.29 7.31 4.87 9.75 1.02 99
Black 268 284 25.31 1.62 2.31 2.03 2.58 0.26 385
Coloured 125 132 11.80 6.75 9.66 8.00 11.33 1.13 89
White 631 668 59.58 26.23 17.52 16.16 18.88 2.09 48
Total 1059 1119 100.00 4.96 6.61 6.22 7.00 0.77 131
Males, 1999
Asian 53 56 4.57 10.33 14.28 10.40 18.16 1.98 51
Black 278 301 23.97 1.79 2.96 2.60 3.31 0.35 286
Coloured 128 138 11.03 7.42 14.09 11.70 16.48 1.8 56
White 701 752 60.43 30.46 25.44 23.64 27.23 3.27 31
Total 1160 1247 100.00 5.74 9.74 9.19 10.29 1.21 83
N(Obs) Number of cases observedN(Adj) Observed cases adjusted for unknown population groupPercent Percentage of all site cancersCrude Number of cases / population per 100 000ASR Age standardised incidence rate per 100 000 (World standard population)95%LCL 95% Lower condence limit for ASR95%UCL 95% Upper condence limit for ASRCumrisk Cumulative lifetime incidence risk (0-74 years)LR Lifetime risk (0-74 years) of developing a cancer expressed as 1 in X number of peoplePlease note: Ranking excludes BCC, SCC of the skin, PSU and ill dened sites

25
Colorectal, 1999 - Males
0
50
100
150
200
250
00
-04
05
-09
10
-14
15
-19
20
-24
25
-29
30
-34
35
-39
40
-44
45
-49
50
-54
55
-59
60
-64
65
-69
70
-74
75
+
Age Group
AS
IR / 1
00 0
00
AM BM CM WM
Ulcerative colitis, Crohn’s disease and therapeutic pelvicirradiation are known risk factors for colorectal cancers.In patients with Crohn’s disease, the risk of colorectal can-cer is threefold above normal (Gillen et al., 1994). Otherrisk factors that were significantly associated with a highrisk of colon cancer include the intestinal bacteria Bacter-oides vulgatus, Bacteroides stercoris, Bifidobacteriumlongum and Bifidobacterium angulatum. LactobacillusSO6 and Eubacterium aerofaciens are associated with lowrisk while total lactobacilli were found to be inversely re-lated to risk (Moore and Moore, 1995 and Parkin, Ferlay,et al., 2003). Certain inherited conditions like hereditarypolyposis coli are known to predispose people to largebowel cancer but the frequency of these conditions in theSouth African population is unknown.
Numbers and incidence
A total of 1 171 and 1 245 colorectal cancer cases werereported in 1998 and 1999. These comprised on average3.7% of all cancers reported in men over the two years.Colorectal cancer ranked the fourth leading cancer of allcancers in men. One in 83 men was at risk of developingcolorectal cancer in 1999. Crude rates for colon cancerin men were on average 5.6 per 100 000 and the ASR was9.6 per 100 000 (Table 7). Colorectal cancer occurredmost commonly after the ages of 50. The ASIR increasedfrom 21.2 per 100 000 at ages 55-59 to reach a high of 92per 100 000 at ages 75 years and older. In 1999, maleshad a 60% greater risk of developing colorectal cancerthan females.
In females, colorectal cancer ranked the third leadingcancer, with a total of 961 and 1 122 reported in 1998and 1999 respectively. Colorectal cancer comprised onaverage 3.4% of all cancers reported in females over thetwo years. One in 131 women was at risk of developingcolorectal cancer in 1999. The ASIR increased from 15.6per 100 000 at ages 55-59 to 68.5 per 100 000 at age 75years and older.
Population variation
Colorectal cancer was most common among white malesand females. It was the second leading cancer to pros-tate cancer in males and comprised 4.6% of all whitemale cancers. White males comprised on average 60%of all colorectal cancer cases reported in the two years.In 1999, white males had a lifetime risk of 1 in 31 ofdeveloping colorectal cancer. Crude incidence ratesranged between 28.3 per 100 000 in 1998 and 30.5 in1999 with an ASR of 23.7 and 25.4 per 100 000 respec-tively (Table 7). Colorectal cancer occurred most com-monly from 50-54 years, with an ASIR of 36.5 per100 000 at these ages, and peaking at 70-74 years withan ASIR of 218.9 per 100 000 (Figure 17). Although col-oured males had comparable incidence rates to those ofAsian men over the two years, on average coloured menhad a greater risk of developing colorectal cancer, withan average ASR of 13.9 per 100 000 and a lifetime riskof 1 in 56. The colorectal cancer risk in black males wasninefold lower than in white males.
Colorectal, 1999 - Females
0
20
40
60
80
100
120
140
160
00
-04
05
-09
10
-14
15
-19
20
-24
25
-29
30
-34
35
-39
40
-44
45
-49
50
-54
55
-59
60
-64
65
-69
70
-74
75
+
Age Group
AS
IR / 1
00 0
00
AF BF CF WF
Figure 17: Age specific incidence rates for colorectal cancer by population group, 1999
26
Figure 18: Colorectal cancer ASR per 100 000 for selected populations
Colorectal - Females
2.2
3.4
3.6
5.2
6.5
7.1
16.5
22.1
26.7
33.4
36.1
17.5
2.3
7.3
9.7
0 5 10 15 20 25 30 35 40
The Gambia
SA, Black
Algeria (Algiers)
Mali (Bamako)
India (Bombay)
Uganda (Kyadondo)
Zimbabwe (Harare)
SA, Asian
SA, Coloured
Brazil (Goiania)
SA, White
UK, England
USA, SEER (White)
USA, SEER (Black)
Australia (Tasmania)
Age standardised rates per 100 000
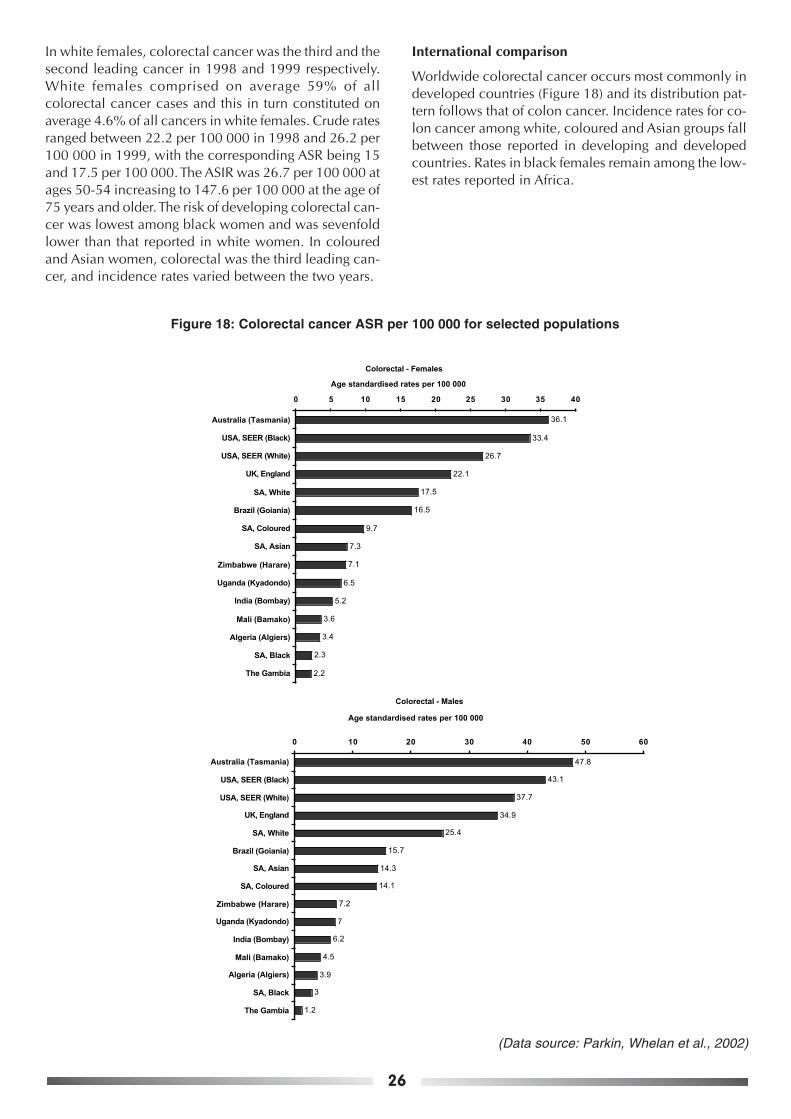
In white females, colorectal cancer was the third and thesecond leading cancer in 1998 and 1999 respectively.White females comprised on average 59% of allcolorectal cancer cases and this in turn constituted onaverage 4.6% of all cancers in white females. Crude ratesranged between 22.2 per 100 000 in 1998 and 26.2 per100 000 in 1999, with the corresponding ASR being 15and 17.5 per 100 000. The ASIR was 26.7 per 100 000 atages 50-54 increasing to 147.6 per 100 000 at the age of75 years and older. The risk of developing colorectal can-cer was lowest among black women and was sevenfoldlower than that reported in white women. In colouredand Asian women, colorectal was the third leading can-cer, and incidence rates varied between the two years.
International comparison
Worldwide colorectal cancer occurs most commonly indeveloped countries (Figure 18) and its distribution pat-tern follows that of colon cancer. Incidence rates for co-lon cancer among white, coloured and Asian groups fallbetween those reported in developing and developedcountries. Rates in black females remain among the low-est rates reported in Africa.
Colorectal - Males
1.2
3.9
4.5
6.2
7
7.2
15.7
34.9
37.7
43.1
47.8
25.4
3
14.1
14.3
0 10 20 30 40 50 60
The Gambia
SA, Black
Algeria (Algiers)
Mali (Bamako)
India (Bombay)
Uganda (Kyadondo)
Zimbabwe (Harare)
SA, Coloured
SA, Asian
Brazil (Goiania)
SA, White
UK, England
USA, SEER (White)
USA, SEER (Black)
Australia (Tasmania)
Age standardised rates per 100 000
(Data source: Parkin, Whelan et al., 2002)

27
Table 8: Summary statistics for colon cancer, 1998 and 1999
3.5.4 Colon cancer
Earlier data in the 1960s showed that a large proportion of colon cancers in Africa occurred mostly on the left side(Parkin, Ferlay, et al., 2003). Recent studies conducted at Pelonomi Hospital in South Africa, Ghana and Nigeria showthat most colorectal cancer patients presented late with advanced disease and a higher proportion presented withright-sided colon cancer (Naaeder and Archampong 1994, Bonnet and Grobbler 1997, and Akute 2000). In SouthAfrica during 1997–2001, excluding unspecified unnatural causes and ill-defined causes of mortality, cancers of thedigestive system ranked the 10th and the 12th leading underlying cause of death in males and females respectively(Statistics-SA, 2003). In 1996, 781 deaths in women and 770 in males were due to colorectal cancers.
Ulcerative colitis, Crohn’s disease and therapeutic pelvic irradiation are known risk factors for colon cancers. Inpatients with Crohn’s disease, the risk of colorectal cancer is threefold above normal (Gillen et al., 1994). Other riskfactors that were significantly associated with high risk of colon cancer include the intestinal bacteria Bacteroidesvulgatus, Bacteroides stercoris, Bifidobacterium longum and Bifidobacterium angulatum. Lactobacillus SO6 and Eu-bacterium aerofaciens are associated with low risk while total lactobacilli were found to be inversely related to risk(Moore and Moore, 1995 and Parkin, Ferlay, et al., 2003). Certain inherited conditions like hereditary polyposis coli
Pop / Sex N(Obs) N(Adj) Percent Crude ASR 95%LCL 95%UCL Cumrisk LR
Females, 1998
Asian 26 26 4.39 4.74 5.71 3.51 7.91 0.76 132
Black 125 134 21.11 0.78 1.15 0.95 1.35 0.14 715
Coloured 70 74 11.82 3.84 5.37 4.14 6.61 0.62 162
White 371 395 62.67 15.55 10.32 9.26 11.38 1.17 85
Total 592 629 100.00 2.85 3.83 3.53 4.13 0.43 234
Males, 1998
Asian 26 26 3.74 4.86 6.19 3.85 8.54 0.71 141
Black 153 161 22.01 0.98 1.65 1.38 1.92 0.17 589
Coloured 70 72 10.07 3.92 7.16 5.43 8.89 0.91 110
White 446 468 64.17 18.97 15.84 14.40 17.28 1.9 53
Total 695 727 100.00 3.44 5.92 5.48 6.36 0.68 148
Females, 1999
Asian 19 19 2.84 3.42 3.70 2.00 5.40 0.39 257
Black 143 149 21.41 0.85 1.24 1.04 1.44 0.13 770
Coloured 77 80 11.53 4.09 5.82 4.52 7.11 0.67 150
White 429 449 64.22 17.63 11.87 10.75 12.99 1.43 70
Total 668 697 100.00 3.1 4.16 3.85 4.46 0.48 209
Males, 1999
Asian 28 29 3.97 5.35 7.37 4.62 10.12 0.9 112
Black 163 174 23.12 1.04 1.67 1.41 1.94 0.19 527
Coloured 63 66 8.94 3.55 6.61 5.00 8.22 0.92 109
White 451 487 63.97 19.73 16.46 15.02 17.90 2.06 49
Total 705 756 100.00 2.23 3.82 3.48 4.17 0.49 206
N(Obs) Number of cases observed
N(Adj) Observed cases adjusted for unknown population group
Percent Percentage of all site cancers
Crude Number of cases / population per 100 000
ASR Age standardised incidence rate per 100 000 (World standard population)
95%LCL 95% Lower condence limit for ASR
95%UCL 95% Upper condence limit for ASR
Cumrisk Cumulative lifetime incidence risk (0-74 years)
LR Lifetime risk (0-74 years) of developing a cancer expressed as 1 in X number of people
Please note: Ranking excludes BCC, SCC of the skin, PSU and ill dened sites

28
are known to predispose people to large bowel cancerbut the frequency of these conditions in the South Afri-can population is unknown.
Numbers and incidence
A total of 727 and 756 new colon cancer cases werereported comprising on average 2.5% of all cancer casesreported in males in 1998 and 1999. Colon cancer cruderates ranged between 3.4 and 2.2 per 100 000 with cor-responding ASR of 5.9 and 3.8 per 100 000 in the twoconsecutive years (Table 8). In 1999, 1 in 206 South Af-rican men had a lifetime risk of developing colon can-cer. At ages 50-54, age-specific incidence rates were 49per 100 000, peaking at ages 70-74, with an ASIR of 253per 100 000. In 1999, males and females had about thesame risk of developing colon cancer.In females, 629 and 697 new colon cancer cases werereported, comprising on average 2.2% of all new femalecancers in 1998 and 1999. The colon cancer crude ratewas three per 100 000, with an ASR of four per 100 000(Table 8). One in 206 women had a lifetime risk of de-veloping colon cancer in 1999. The ASIR increased from36.7 per 100 000 at ages 50-54 to 194.7 at the age of 75years and older.
Population variation
White males and females comprised about two thirds ofall new colon cancer cases and had the highest coloncancer incidence rates of all population groups in SouthAfrica. Colon cancer comprised on average 3% of all can-cers reported in white males over the two years. Cruderates ranged between 19 and 19.7 per 100 000, with acorresponding ASR of 15.8 and 16.5 per 100 000 con-secutively in the two years (Table 8). One in 49 whitemen was at risk of developing colon cancer in 1999. TheASIR increased from 25.4 at ages 50-54, peaking at 144.8per 100 000 at 70-74 years (Figure 19). Coloured menwere more at risk of developing colon cancer than Asianmen, with a risk of one in 109 in their lifetime. The risk ofdeveloping colon cancer in black men was 10 times lowerthan that in white men.Colon cancer in females comprised on average 3.3% ofall female cancers. Crude rates ranged between 15.6 and17.6 with ASR of 10.3 per 100 000 and 11.9 per 100 000in 1998 and 1999 respectively. In 1999, 1 in 70 femaleswas at risk of developing colon cancer. At ages 50-54,the ASIR was 21.7 per 100 000, increasing to a high of
Colon, 1999 - Females
0
20
40
60
80
100
120
00
-04
05
-09
10
-14
15
-19
20
-24
25
-29
30
-34
35
-39
40
-44
45
-49
50
-54
55
-59
60
-64
65
-69
70
-74
75
+
Age group
AS
IR / 1
00 0
00
AF BF CF WF
Colon, 1999 - Males
0
20
40
60
80
100
120
140
160
00
-04
05
-09
10
-14
15
-19
20
-24
25
-29
30
-34
35
-39
40
-44
45
-49
50
-54
55
-59
60
-64
65
-69
70
-74
75
+
Age group
AS
IR / 1
00 0
00
AM BM CM WM
Figure 19: Age specific incidence rates for colon cancer by population group, 1999

29
102 at the age of 75 years and older. Following the inci-dence in white women, coloured women had the sec-ond-greatest risk of developing colon cancer, with 1 in150 at risk in 1999. Black women had the lowest riskcompared to all other population groups, with the risk11 times lower than that in white women.
International comparison
Colon cancer occurs most commonly in developed coun-tries with incidence rates among South African Whites,Coloureds and Asians ranging at the bottom of those ob-served in the developed countries but higher up, when
compared to those reported in developing countries par-ticularly in sub-Saharan Africa (Figure 20). However,Black South African males and females have the lowestrates reported in sub-Saharan Africa, and in this popula-tion group, rates were two times lower than those re-ported in Harare, Zimbabwe and in Kyadondo, Uganda.Rates in South African Asian males are twofold higherthan those reported in Bombay, India whilst comparablerates are observed for females.
Figure 20: Colon cancer ASR per 100 000 for selected populations
Colon - Females
1.1
1.7
2.8
3.1
3.3
3.7
3.7
10.8
15
19.4
25.8
26
1.2
5.8
11.9
0 5 10 15 20 25 30
The Gambia
SA, Black
Mali (Bamako)
Algeria (Algiers)
India (Bombay)
Zimbabwe (Harare)
Uganda (Kyadondo)
SA, Asian
SA, Coloured
Brazil (Goiania)
SA, White
UK, England
USA, SEER (White)
Australia (Tasmania)
USA, SEER (Black)
Age standardised rates per 100 000
Colon - Males
0.5
2.1
3.3
3.4
3.4
3.9
10.4
20.6
25.5
30
31.6
1.7
16.5
7.4
6.6
0 5 10 15 20 25 30 35
The Gambia
SA, Black
Mali (Bamako)
Algeria (Algiers)
India (Bombay)
Uganda (Kyadondo)
Zimbabwe (Harare)
SA, Coloured
SA, Asian
Brazil (Goiania)
SA, White
UK, England
USA, SEER (White)
Australia (Tasmania)
USA, SEER (Black)
Age standardised rates per 100 000
(Data source: Parkin, Whelan et al., 2002)

30
3.5.5 Female breast cancer
Reproductive and hormonal factors are the most important known risk factors for breast cancer (Parkin, Ferlay et al.,2003; Stewart and Kleihues, 2003; Tavassoli and Devilee, 2003;). Breast cancer is known to occur more frequentlyamong women with early mernache, who are either nulliparous, have few children or have their first birth at a late ageand late menopause. Available evidence shows no association between the use of injectable progestogen contracep-tives and the development of breast cancer (IARC, 1999 and Shapiro et al., 2000). A small but increased risk ofdeveloping breast cancer has been demonstrated in association with the use of combined oral contraceptives. Post-menopausal oestrogen therapy shows a small increase in risk with longer duration of use while hormone replacementtherapy (HRT) in postmenopausal women has been shown to increase risk by twofold in current users, compared tonever users (Beral et al., 2003). Other known risk factors for breast cancer include alcohol, diet, smoking, bodyweight, physical activity and genetic factors. Evidence of the effects of smoking on breast cancer remains inconclu-sive. Increased postmenopausal body weight has been found to increase the risk of getting breast cancer, whereasphysical activity has been found to be beneficial across all ages in reducing the breast cancer risk.Familial breast cancer characterised by the presence of BRCA1 and BRCA2 genes and a risk factor for breast cancernormally accounts for five percent of the breast cancer cases.
Numbers and incidence
A total of 5 606 and 5 901 breast cancer cases were reported to the NCR in 1998 and 1999, comprising 18.6% and19.4% of all the cancers reported in the two years. In 1998, cancer of the breast was the second leading cancer tocervix cancer and the leading cancer in 1999. Breast cancer crude rates were 25.3 and 26.1 per 100 000, withcorresponding age standardised incidence rates of 32.7 and 33.4 per 100 000 in 1998 and 1999 respectively. Thelifetime risk of developing breast cancer in South African women over the two years was 1 in 27 (Table 9). Age specificincidence rates greater than 80 per 100 000 were recorded in women older than 49 years, with an incidence of 161per 100 000 recorded in women of 75 years and older (Figure 21).
Table 9: Summary statistics for female breast cancer, 1998 and 1999
Pop / Sex N(Obs) N(Adj) Percent Crude ASR 95%LCL 95%UCL Cumrisk LR
Females, 1998
Asian 214 223 4.01 40.62 45.26 39.30 51.22 5.57 18
Black 2103 2210 39.40 12.88 17.98 17.21 18.74 1.99 51
Coloured 609 638 11.41 33.12 45.21 41.65 48.77 5.33 19
White 2412 2533 45.19 99.73 76.04 73.04 79.04 8.62 12
Total 5338 5604 100.00 25.28 32.70 32.32 33.09 3.65 27
Females, 1999
Asian 244 258 4.37 46.38 49.62 43.58 55.66 5.84 18
Black 2186 2307 39.11 13.13 18.39 17.62 19.15 2.06 49
Coloured 691 730 12.36 37.35 49.77 46.12 53.42 5.79 18
White 2468 2606 44.16 102.35 76.46 73.50 79.42 8.7 12
Total 5589 5901 100.00 26.61 34.61 34.21 35.01 3.88 26
N(Obs) Number of cases observed
N(Adj) Observed cases adjusted for unknown population group
Percent Percentage of all site cancers
Crude Number of cases / population per 100 000
ASR Age standardised incidence rate per 100 000 (World standard population)
95%LCL 95% Lower condence limit for ASR
95%UCL 95% Upper condence limit for ASR
Cumrisk Cumulative lifetime incidence risk (0-74 years)
LR Lifetime risk (0-74 years) of developing a cancer expressed as 1 in X number of people
Please note: Ranking excludes BCC, SCC of the skin, PSU and ill dened sites

31
Population variation
Breast cancer is the leading cancer and constitutes onaverage 20% of all cancers reported in white South Afri-can females. Of all the breast cancers reported in thetwo years, 2 412 and 2 468 cases were white women,comprising on average 45% of all breast cancer casesreported in a year. Breast cancer crude rates in whitewomen were 99.7 and 102.4 per 100 000 with an ASRof 76 per 100 000. In the two years, 1 in 12 white womenhad a lifetime risk of developing breast cancer. Age spe-cific incidence rates in white women were 126 per 100000 at age 40-44 peaking at 294 per 100 000 at ages 70-74 (Figure 21). Breast cancer is also the leading cancerin coloured and Asian women; almost similar incidencerates of 45 per 100 000 in 1998 and 49 per 100 000 in1999 were observed in both coloured and Asian women.In both population groups, the lifetime risk of develop-ing breast cancer was 1 in 18. Black women had thelowest incidence rates of all population groups. Cancer
of the breast is the second most common cancer aftercancer of the cervix and comprised 39% of all breastcancers reported in the two years.
International comparison
Breast cancer is the most common cancer in womenworldwide and accounts for 22% of all cancers in women(Ellis et al., 2003 and Parkin, Ferlay et al., 2003). It ismore common in industrialised countries (Figure 22) thanin developing countries, although the WHO/IARC reportsincreasing breast cancer trends worldwide. Incidencerates in white South African women are comparable withrates in industrialised countries and are among the high-est rates in the world. Incidence rates in black South Af-rican women are comparable with those reported in de-veloping countries. Rates in South African Asian womenare almost double those reported in India, Bombay.
Breast, 1999 - Females
0
50
100
150
200
250
300
350
00
-04
05
-09
10
-14
15
-19
20
-24
25
-29
30
-34
35
-39
40
-44
45
-49
50
-54
55
-59
60
-64
65
-69
70
-74
75
+
Age Group
AS
IR / 1
00 0
00
AF BF CF WF
Breast - Females
7
18.4
20
20.3
20.7
21.3
28.9
49.1
49.6
49.8
74.4
76.5
78.2
83.1
92.1
0 10 20 30 40 50 60 70 80 90 100
The Gambia
SA, Black
Mali (Bamako)
Zimbabwe (Harare)
Uganda (Kyadondo)
Algeria (Algiers)
India (Bombay)
Brazil (Goiania)
SA, Asian
SA, Coloured
UK, England
SA, White
Australia (Tasmania)
USA, SEER (Black)
USA, SEER (White)
Age standardised rates per 100 000
(Data source: Parkin, Whelan et al., 2002)
Figure 21: Age specific incidence rates for breast cancer by population group, 1999
Figure 22: Breast cancer ASR per 100 000 for selected populations

32
3.5.6 Kaposi sarcoma
Human herpesvirus-8 (HHV-8) is considered to be the main cause of Kaposi sarcoma (Newton et al., 2002). Otherfactors include immuno-suppression, hence its association with HIV infection and frequent occurrence among trans-plant patients. There is little evidence that HIV plays a direct oncogenic role in the development of any specific cancer.Infection with HIV is thought to facilitate the existence of other cancer-causing infectious agents due to its effect on theimmune system (Newton et al., 2002). Other known risk factors include male gender and increasing age. The trans-mission route of HHV-8 is not clear, but sexual intercourse between men is thought to be one likely route, and mightexplain high KS rates in men versus women even before the onset of HIV. Mother to child transmission is investigatedas a possible route as some studies in South Africa have shown the presence of anti HHV-8 antibodies in infants(Wilkinson et al., 1999), and about 30% of children younger than 10 years born to HHV-8 sero-positive mothers wereHHV-8 sero-positive (Bourboulia et al., 1998 and Newton et al., 2002).
Table 10: Summary statistics for Kaposi sarcoma, 1998 and 1999
Pop / Sex N(Obs) N(Adj) Percent Crude ASR 95%LCL 95%UCL Cumrisk LR
Females, 1998
Asian 4 4 2.00 0.73 0.64 0.01 1.27 0.04 2501
Black 178 181 89.00 1.05 0.99 0.84 1.13 0.07 1429
Coloured 7 7 3.50 0.36 0.42 0.10 0.74 0.04 2501
White 11 11 5.50 0.43 0.42 0.16 0.68 0.03 3334
Total 200 203 100.00 0.92 0.85 1.03 1.37 0.06 1602
Males, 1998
Asian 8 8 2.19 1.49 1.37 0.51 2.24 0.12 834
Black 330 358 90.41 2.18 2.43 2.16 2.69 0.21 477
Coloured 11 11 3.01 0.6 0.83 0.30 1.36 0.1 1001
White 16 16 4.38 0.65 0.55 0.29 0.82 0.05 2001
Total 365 393 100.00 1.87 1.95 2.52 3.08 0.18 564
Females, 1999
Asian 1 1 0.37 0.18 . . . . .
Black 259 269 95.57 1.53 1.48 1.30 1.66 0.12 834
Coloured 5 5 1.85 0.26 0.32 0.02 0.62 0.04 2501
White 6 6 2.21 0.24 0.19 0.04 0.34 0.01 10001
Total 271 281 100.00 1.25 1.18 1.04 1.32 0.09 1064
Males, 1999
Asian 3 3 0.68 0.55 0.45 -0.06 0.96 0.04 2501
Black 402 427 90.54 2.54 2.82 2.54 3.11 0.26 385
Coloured 11 11 2.48 0.59 0.62 0.24 1.00 0.06 1667
White 28 28 6.31 1.13 0.92 0.59 1.24 0.09 1112
Total 444 469 100.00 2.19 2.25 2.05 2.46 0.20 496
N(Obs) Number of cases observed
N(Adj) Observed cases adjusted for unknown population group
Percent Percentage of all site cancers
Crude Number of cases / population per 100 000
ASR Age standardised incidence rate per 100 000 (World standard population)
95%LCL 95% Lower confidence limit for ASR
95%UCL 95% Upper confidence limit for ASR
Cumrisk Cumulative lifetime incidence risk (0-74 years)
LR Lifetime risk (0-74 years) of developing a cancer expressed as 1 in X number of people
Please note: Ranking excludes BCC, SCC of the skin, PSU and ill defined sites

33
Numbers and incidence
A total of 397 and 474 new Kaposi sarcoma cases werereported in males, comprising on average 1.5% of allnew male cancer cases reported in 1998 and 1999 re-spectively. Kaposi sarcoma ranked the 14th and the 15thleading cancer in the two years. Both crude rates andASR in males were about 2 per 100 000 with a lifetimerisk of 1 in 496 in 1999 (Table 10). The risk of developingKS in males was two times that in females. A bimodalpattern in ASIR was observed, with the first peak at sixper 100 000 at ages 35-39, and a second peak of 4.8 per100 000 at ages 70-74 (see ASIR tables in appendices).
There were 204 and 283 female KS cases reported in1998 and 1999, comprising about 1 per 100 000 of allfemale cancer cases reported in these two years. In fe-males, KS was the 15th and the 17th leading cancer in1998 and 1999. Both crude and ASR were about 1 per100 000 in 1998 and 1.2 per 100 000 in 1999. In fe-males KS peaked early in life and was more common atages 25-29 with an ASIR of 3.1 per 100 000 and later, atages 70-74, an ASIR of 2.1 per 100 000.
Population variation
Black males and females constituted 90% and more ofall KS cases reported in the two years. KS was the 13thleading cancer in males in 1998 and it comprised 3.4%of all male cancer cases. In 1999, KS in black males wasthe seventh leading cancer, comprising 4.4 % of all can-cers in black males. The incidence rate was 2.8% in 1999with a lifetime risk of 385 per 100 000 (Table 10). Thebimodal pattern in ASIR occured in all race groups, par-ticularly in men. The first peak occurred early in life, af-ter age twenty in women and in the thirties in men. In1999, the ASIR peaked at 6.8 and 6.9 at 35-39 and 70-74 years respectively. In black women, KS was the 15thleading cancer in 1998 and was the 11th leading cancerin 1999, comprising 1.3% and 2% of all cancers in blackwomen in the two years. The age standardised rate in1999 was 1.5 per 100 000 and the lifetime risk of devel-oping KS in black women was 1 in 834. At ages 25-29,black females had a higher incidence rate than their malecounterparts, with an ASIR of 4 per 100 000. In olderblack women the second peak occurred at ages 70-74with an ASIR of 2.8 per 100 000 (Figure 23). Risk of de-veloping KS in black males and females is severalfoldhigher than in other population groups.
Figure 23: Age specific incidence rates for Kaposi sarcoma by population group, 1999
Kaposi Sarcoma, 1999 - Females
0.0
0.5
1.0
1.5
2.0
2.5
3.0
3.5
4.0
4.5
5.0
00
-04
05
-09
10
-14
15
-19
20
-24
25
-29
30
-34
35
-39
40
-44
45
-49
50
-54
55
-59
60
-64
65
-69
70
-74
75
+
Age Group
AS
IR / 1
00 0
00
AF BF CF WF
Kaposi Sarcoma, 1999 - Males
0
1
2
3
4
5
6
7
8
00
-04
05
-09
10
-14
15
-19
20
-24
25
-29
30
-34
35
-39
40
-44
45
-49
50
-54
55
-59
60
-64
65
-69
70
-74
75
+
Age Group
AS
IR / 1
00 0
00
AM BM CM WM

34
International comparison
Kaposi sarcoma was rare before the advent of HIV. Aseveralfold increase has been reported in countries wherethere is high prevalence of HIV due to its associationwith HIV. High KS incidence rates are reported in Harare,Zimbabwe and in Kyadondo, Uganda (Figure 24). In thesecountries, KS is reported to have become the leadingcancer since the HIV era. Although significantly lowerrates are observed in South Africa compared to Harare
Figure 24: Kaposi sarcoma ASR per 100 000 for selected populations
and Uganda, rates in black South African men andwomen are gradually increasing. For example, rates inblack men increased from 1.8 per 100 000 in 1997 to2.8 per 100 000 in 1999. Incidence rates for KS are mostlikely to depend on and reflect the clinical practices andthe extent to which affected individuals are biopsied andtheir specimens are sent to laboratories, as these are theonly source of registry data.
(Data source: Parkin, Whelan et al., 2002)
Kaposi sarcoma - Females
0.1
0.1
0.1
0.2
0.2
0.3
0.3
0.4
1
1.5
20.3
20.4
0
0
0
0 5 10 15 20 25
India (Bombay)
UK, England
SA, Asian
Algeria (Algiers)
Australia (Tasmania)
USA, SEER (White)
Brazil (Goiania)
SA, White
SA, Coloured
USA, SEER (Black)
The Gambia
Mali (Bamako)
SA, Black
Zimbabwe (Harare)
Uganda (Kyadondo)
Age standardised rates per 100 000
Kaposi sarcoma - Males
0.3
0.4
0.5
0.5
0.6
0.6
0.9
1.1
2.1
2.8
4.4
6.8
37.9
50.8
0
0 10 20 30 40 50 60
India (Bombay)
Australia (Tasmania)
Algeria (Algiers)
SA, Asian
UK, England
SA, Coloured
The Gambia
SA, White
Brazil (Goiania)
Mali (Bamako)
SA, Black
USA, SEER (White)
USA, SEER (Black)
Uganda (Kyadondo)
Zimbabwe (Harare)
Age standardised rates per 100 000

35
3.5.7 Lung cancer
Cancer of the lung is the most frequent cancer worldwide, with wide geographical variations in risk. The main causeof lung cancer is tobacco smoking, for which there is a clear dose-response effect, related to both the duration ofsmoking and the amount smoked. A case-control study conducted in Johannesburg showed an increased risk for lung
Table 11: Summary statistics for lung cancer, 1998 and 1999
Pop / Sex N(Obs) N(Adj) Percent Crude ASR 95%LCL 95%UCL Cumrisk LR
Females, 1998
Asian 21 21 2.77 3.83 4.64 2.67 6.61 0.54 186
Black 311 321 40.98 1.87 2.92 2.60 3.24 0.35 286
Coloured 93 95 12.25 4.93 7.55 6.05 9.04 1.01 100
White 334 343 44.01 13.51 9.86 8.79 10.93 1.3 77
Total 759 780 100.00 3.54 4.95 4.89 5.01 0.62 162
Males, 1998
Asian 48 48 2.59 8.96 12.18 8.59 15.78 1.7 59
Black 1021 1066 55.04 6.49 12.07 11.32 12.81 1.49 68
Coloured 192 201 10.35 10.95 20.15 17.30 23.00 2.7 38
White 594 619 32.02 25.09 21.7 19.99 23.41 2.92 35
Total 1855 1934 100.00 9.11 15.18 14.94 15.42 1.93 52
Females, 1999
Asian 25 25 3.61 4.49 5.15 3.09 7.21 0.67 150
Black 219 229 31.60 1.3 1.98 1.72 2.23 0.23 435
Coloured 124 129 17.89 6.6 9.65 8.01 11.29 1.32 76
White 325 338 46.90 13.27 9.65 8.60 10.69 1.26 80
Total 693 721 100.00 3.27 4.58 4.53 4.64 0.59 170
Males, 1999
Asian 49 50 2.98 9.23 12.93 9.31 16.54 1.59 63
Black 797 842 48.42 5.01 9.28 8.64 9.91 1.16 87
Coloured 228 242 13.85 13.01 23.48 20.51 26.44 3.16 32
White 572 604 34.75 24.47 20.74 19.11 22.38 2.72 37
Total 1646 1738 100.00 8.19 13.98 13.77 14.20 1.76 57
N(Obs) Number of cases observed
N(Adj) Observed cases adjusted for unknown population group
Percent Percentage of all site cancers
Crude Number of cases / population per 100 000
ASR Age standardised incidence rate per 100 000 (World standard population)
95%LCL 95% Lower condence limit for ASR
95%UCL 95% Upper condence limit for ASR
Cumrisk Cumulative lifetime incidence risk (0-74 years)
LR Lifetime risk (0-74 years) of developing a cancer expressed as 1 in X number of people
Please note: Ranking excludes BCC, SCC of the skin, PSU and ill dened sites

36
Figure 25: Age specific incidence rates for lung cancer by population group, 1999
Lung, 1999 - Females
0
10
20
30
40
50
60
70
80
00
-04
05
-09
10
-14
15
-19
20
-24
25
-29
30
-34
35
-39
40
-44
45
-49
50
-54
55
-59
60
-64
65
-69
70
-74
75
+
Age Group
AS
IR / 1
00 0
00
AF BF CF WF
Lung, 1999 - Males
0
20
40
60
80
100
120
140
160
180
00
-04
05
-09
10
-14
15
-19
20
-24
25
-29
30
-34
35
-39
40
-44
45
-49
50
-54
55
-59
60
-64
65
-69
70
-74
75
+
Age Group
AS
IR / 1
00 0
00
AM BM CM WM
cancer due to tobacco smoking in both men and women.Lung cancer was about 10 times more likely to be diag-nosed in current tobacco smoking men than in men notsmoking and 14 times in current smoking women; therisk increased in heavy smokers smoking 15g and moreper day (OR = 23.9, 95% CI=9.5-60.3 in men) and 50.9,95% CI= 12.6-204.6 in women) (Pacella-Norman et al,2002). In 1998, 58% of all lung cancer deaths in SouthAfrica were attributed to tobacco smoking. About eightpercent (> 20 000) of all adult deaths in South Africa in1998 were due to smoking (Sitas et al, 2004).
Overall estimates for smoking in South Africa vary con-siderably. The prevalence of tobacco smoking in adultsin South Africa in 1996 was 34%. (Reddy et al, 1996). In1997 and 1998, the South African Demographic HealthSurvey (DOH, 1998) and Meyer-Weitz et al., (1998 to2003) reported lower prevalence of 25% and 24% re-spectively. Smoking rates among South African youngpeople are high. Prevalence of cigarette smoking amonggrade 8-10 South African school goers was found to be23%; the highest rate was 37.3% among coloured youngmales and the lowest prevalence was reported amongblack students at 10.5% (Swart et al, 2003). Althoughsmoking rates are high in South Africa, the amount of
tobacco consumed per person, particularly in the blackcommunity, is considerably lower than in countries withthe highest lung cancer rates. Since peaking at 40 bil-lion in 1990, legal sales of commercial cigarettes havefallen every year.
Other known causes of lung cancer include domesticand industrial pollution. There is evidence that both ofthese contribute to lung cancer incidence in South Af-rica (Wyndeham et al., 1986; Mzileni, et al., 1999;Pacella-Norman, et al., 2002).
Numbers and incidence
A total of 1 938 and 1 742 new lung cancer cases werereported, comprising on average 6.3% of all new cancercases reported in 1998 and 1999. Lung cancer rankedthe second leading cancer in males. Crude rates rangedbetween 9.1 and 8 per 100 000 with a correspondingASR of 15.2 and 13.6 per 100 000 (Table 11). The life-time risk of developing lung cancer in South African mendropped from 1 in 52 in 1998 to 1 in 59 in 1999. Lungcancer was more common from the age of 50 with anASIR of 28 per 100 000 in the age 50-54 category andpeaking at ages 65-69 with an ASIR of 89 per 100 000.
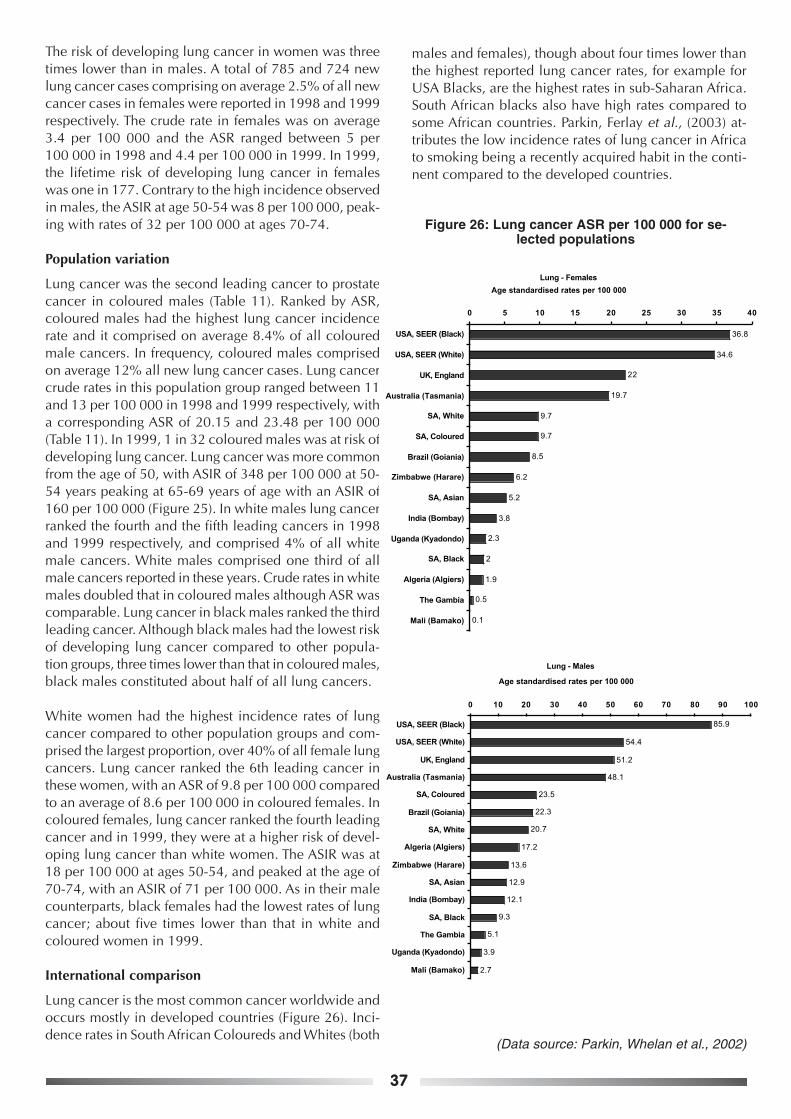
37
The risk of developing lung cancer in women was threetimes lower than in males. A total of 785 and 724 newlung cancer cases comprising on average 2.5% of all newcancer cases in females were reported in 1998 and 1999respectively. The crude rate in females was on average3.4 per 100 000 and the ASR ranged between 5 per100 000 in 1998 and 4.4 per 100 000 in 1999. In 1999,the lifetime risk of developing lung cancer in femaleswas one in 177. Contrary to the high incidence observedin males, the ASIR at age 50-54 was 8 per 100 000, peak-ing with rates of 32 per 100 000 at ages 70-74.
Population variation
Lung cancer was the second leading cancer to prostatecancer in coloured males (Table 11). Ranked by ASR,coloured males had the highest lung cancer incidencerate and it comprised on average 8.4% of all colouredmale cancers. In frequency, coloured males comprisedon average 12% all new lung cancer cases. Lung cancercrude rates in this population group ranged between 11and 13 per 100 000 in 1998 and 1999 respectively, witha corresponding ASR of 20.15 and 23.48 per 100 000(Table 11). In 1999, 1 in 32 coloured males was at risk ofdeveloping lung cancer. Lung cancer was more commonfrom the age of 50, with ASIR of 348 per 100 000 at 50-54 years peaking at 65-69 years of age with an ASIR of160 per 100 000 (Figure 25). In white males lung cancerranked the fourth and the fifth leading cancers in 1998and 1999 respectively, and comprised 4% of all whitemale cancers. White males comprised one third of allmale cancers reported in these years. Crude rates in whitemales doubled that in coloured males although ASR wascomparable. Lung cancer in black males ranked the thirdleading cancer. Although black males had the lowest riskof developing lung cancer compared to other popula-tion groups, three times lower than that in coloured males,black males constituted about half of all lung cancers.
White women had the highest incidence rates of lungcancer compared to other population groups and com-prised the largest proportion, over 40% of all female lungcancers. Lung cancer ranked the 6th leading cancer inthese women, with an ASR of 9.8 per 100 000 comparedto an average of 8.6 per 100 000 in coloured females. Incoloured females, lung cancer ranked the fourth leadingcancer and in 1999, they were at a higher risk of devel-oping lung cancer than white women. The ASIR was at18 per 100 000 at ages 50-54, and peaked at the age of70-74, with an ASIR of 71 per 100 000. As in their malecounterparts, black females had the lowest rates of lungcancer; about five times lower than that in white andcoloured women in 1999.
International comparison
Lung cancer is the most common cancer worldwide andoccurs mostly in developed countries (Figure 26). Inci-dence rates in South African Coloureds and Whites (both
males and females), though about four times lower thanthe highest reported lung cancer rates, for example forUSA Blacks, are the highest rates in sub-Saharan Africa.South African blacks also have high rates compared tosome African countries. Parkin, Ferlay et al., (2003) at-tributes the low incidence rates of lung cancer in Africato smoking being a recently acquired habit in the conti-nent compared to the developed countries.
Lung - Females
0.1
0.5
1.9
2
2.3
3.8
6.2
8.5
9.7
9.7
19.7
22
34.6
36.8
5.2
0 5 10 15 20 25 30 35 40
Mali (Bamako)
The Gambia
Algeria (Algiers)
SA, Black
Uganda (Kyadondo)
India (Bombay)
SA, Asian
Zimbabwe (Harare)
Brazil (Goiania)
SA, Coloured
SA, White
Australia (Tasmania)
UK, England
USA, SEER (White)
USA, SEER (Black)
Age standardised rates per 100 000
Lung - Males
2.7
3.9
5.1
9.3
12.1
12.9
13.6
17.2
20.7
22.3
23.5
48.1
51.2
54.4
85.9
0 10 20 30 40 50 60 70 80 90 100
Mali (Bamako)
Uganda (Kyadondo)
The Gambia
SA, Black
India (Bombay)
SA, Asian
Zimbabwe (Harare)
Algeria (Algiers)
SA, White
Brazil (Goiania)
SA, Coloured
Australia (Tasmania)
UK, England
USA, SEER (White)
USA, SEER (Black)
Age standardised rates per 100 000
Figure 26: Lung cancer ASR per 100 000 for se-lected populations
(Data source: Parkin, Whelan et al., 2002)

38
3.5.8 Melanoma
Melanoma is the third most common of all skin cancers worldwide, after the non-melanoma skin cancers. The majorrisk factors for melanoma are exposure to sunlight, fair skin, and naevi (freckles). Ethnic origin and weather conditionsplay an important role, as early age at first exposure to sunlight in fair-skinned population groups and cumulative sundamage may be important risk factors.
Numbers and incidence
There were 706 cases of melanoma skin cancers reported in males in 1998 and 800 cases in 1999, comprising onaverage 2.6% of all male cancers. In 1999, 1 in 150 South African males were at risk of developing melanoma. Thecrude rate for melanoma ranged between 3.3 per 100 000 in 1998 and 3.7 per 100 000 in 1999 with correspondingASR of 5.1 and 5.6 per 100 000 (Table 12). Melanoma in men most commonly developed at the ages of 60-64 with anASIR of 18 per 100 000 and peaking at an ASIR of 37.4 per 100 000 at 70-74 years. In 1999, men had a 52% greaterrisk of developing melanoma than the women.
Table 12: Summary statistics for melanoma, 1998 and 1999
Pop / Sex N(Obs) N(Adj) Percent Crude ASR 95%LCL 95%UCL Cumrisk LR
Females, 1998
Asian 8 8 1.17 1.46 1.49 0.43 2.55 0.16 626
Black 170 178 24.85 1.04 1.62 1.39 1.86 0.18 556
Coloured 38 38 5.56 1.97 2.48 1.66 3.29 0.29 345
White 468 490 68.42 19.29 15.00 13.65 16.35 1.53 66
Total 684 714 100.00 3.23 4.02 3.72 4.32 0.43 230
Males, 1998
Asian 4 4 0.59 0.75 1.25 -0.00 2.50 0.23 435
Black 88 89 13.02 0.54 0.91 0.71 1.11 0.11 910
Coloured 44 44 6.51 2.4 4.18 2.91 5.45 0.4 251
White 540 564 79.88 22.86 19.27 17.69 20.85 2.11 48
Total 676 701 100.00 3.32 5.07 4.69 5.46 0.58 173
Females, 1999
Asian 4 4 0.55 0.72 0.73 -0.00 1.46 0.05 2001
Black 166 174 22.62 0.99 1.55 1.32 1.78 0.19 527
Coloured 51 52 6.95 2.66 3.24 2.34 4.13 0.26 385
White 513 542 69.89 21.29 16.73 15.30 18.15 1.65 61
Total 734 772 100.00 3.42 4.17 3.88 4.47 0.44 228
Males, 1999
Asian 3 3 0.40 0.55 0.70 -0.13 1.53 0.09 1112
Black 114 121 15.26 0.72 1.32 1.09 1.56 0.15 667
Coloured 52 54 6.96 2.9 4.75 3.40 6.11 0.66 152
White 578 619 77.38 25.07 20.94 19.33 22.55 2.35 43
Total 747 797 100.00 3.69 5.55 5.16 5.94 0.67 150
N(Obs) Number of cases observed
N(Adj) Observed cases adjusted for unknown population group
Percent Percentage of all site cancers
Crude Number of cases / population per 100 000
ASR Age standardised incidence rate per 100 000 (World standard population)
95%LCL 95% Lower condence limit for ASR
95%UCL 95% Upper condence limit for ASR
Cumrisk Cumulative lifetime incidence risk (0-74 years)
LR Lifetime risk (0-74 years) of developing a cancer expressed as 1 in X number of people
Please note: Ranking excludes BCC, SCC of the skin, PSU and ill dened sites

39
There were 717 and 774 female cases of melanoma re-ported in 1998 and 1999 respectively, comprising on av-erage 2.4% of all cancers reported in women. One in228 South African women had a lifetime risk of develop-ing melanoma. The crude incidence rate was 3 per100 000 and the ASR was 4 per 100 000 in each of thetwo years. At the ages of 60-64, the ASIR was 12.5 per100 000, reaching a high incidence of 27.8 per 100 000at ages 75 years and older.
Population variation
Melanoma was highly prevalent amongst white men andwomen. It was the fifth leading cancer in 1998 and thefourth leading cancer in 1999 in white males; it com-prised on average 3.7% of all white male cancers re-ported in the two years. White men comprised more thanthree quarters of all melanoma cases reported in the twoyears (Table 12) and their lifetime risk of developingmelanoma was 1 in 43 in 1999. Crude rates in whitemen ranged between 22.9 per 100 000 in 1998 and 25.1per 100 000 in 1999 with an ASR of 19.3 and 20.9 per100 000 respectively. Melanomas developed early in life
with an ASIR of 20.3 per 100 000 at ages 30-34 increas-ing and peaking at a rate of 105 per 100 000 at ages 70-74 years (Figure 27). White males had a 40% greater riskof developing melanoma than white females and a 16times greater risk of developing melanoma than blackmales.
White women comprised about two-thirds of allmelanoma cases over the two years. Melanoma com-prised on average four percent of all cancer cases in whitewomen. One in 61 white women was at risk of develop-ing melanoma in 1999. In 1998, the crude rate in whitewomen was 19.3 per 100 000 with an ASR of 15 per100 000. The crude rate in 1999 was 21.3 per 100 000and the ASR was 16.7 per 100 000. The ASIR was 22 per100 000 increasing to a high of 52 per 100 000 at theage of 75 years and older (Figure 27). Coloured femaleshad the second highest incidence rate of 3.2 per100 000 in 1999, which was five times lower than thatin white women. Few melanoma cancers were reportedamong Asians (Table 12).
Melanoma, 1999 - Females
0
10
20
30
40
50
600
0-0
4
05
-09
10
-14
15
-19
20
-24
25
-29
30
-34
35
-39
40
-44
45
-49
50
-54
55
-59
60
-64
65
-69
70
-74
75
+
Age Group
AS
IR / 1
00 0
00
AF BF CF WF
Melanoma, 1999 - Males
0
20
40
60
80
100
120
00
-04
05
-09
10
-14
15
-19
20
-24
25
-29
30
-34
35
-39
40
-44
45
-49
50
-54
55
-59
60
-64
65
-69
70
-74
75
+
Age Group
AS
IR / 1
00 0
00
AM BM CM WM
Figure 27: Age specific incidence rates for melanoma by population group, 1999

40
International comparison
Melanoma is most prevalent in white-skinned populationsand high incidence rates are reported in Australia (Stewartand Kleihues, 2003). Melanoma rates in white South Af-ricans are among the highest rates in the world (Figure28) and are higher than those reported in most devel-oped countries in both males and females. Amongst whiteSouth Africans, the rates for men are about four times
higher than those reported for men in England in theUnited Kingdom, while the rates for women are two timeshigher than for women in the U.K. In sub-Saharan Af-rica, South African rates in population groups other thanthe Whites rank second highest to those reported inHarare, Zimbabwe.
Figure 28: Melanoma ASR per 100 000 for selected populations
(Data source: Parkin, Whelan et al., 2002)
Melanoma - Females
0.1
0.2
0.4
0.5
0.7
1.2
1.6
2
3.2
3.8
4.1
7.4
11.6
16.7
27
0 5 10 15 20 25 30
The Gambia
India (Bombay)
Algeria (Algiers)
USA, SEER (Black)
SA, Asian
Mali (Bamako)
SA, Black
Uganda (Kyadondo)
SA, Coloured
Brazil (Goiania)
Zimbabwe (Harare)
UK, England
USA, SEER (White)
SA, White
Australia (Tasmania)
Age standardised rates per 100 000
Melanoma - Males
0.3
0.3
0.6
0.7
1
1.3
1.3
2
4.8
5.1
5.8
15.4
20.9
28.7
0
0 5 10 15 20 25 30 35
Mali (Bamako)
India (Bombay)
The Gambia
Algeria (Algiers)
SA, Asian
USA, SEER (Black)
SA, Black
Uganda (Kyadondo)
Zimbabwe (Harare)
SA, Coloured
Brazil (Goiania)
UK, England
USA, SEER (White)
SA, White
Australia (Tasmania)
Age standardised rates per 100 000

41
3.5.9 Non-Hodgkin lymphoma
In the USA and Europe, between 5-10% of HIV-infected people are likely to develop NHL. Based on this increase afterthe onset of HIV, the Centre for Disease Control (CDC) included the NHL of B-cell or indeterminate phenotype in thecase definition of AIDS surveillance in the USA. Biological agents that are thought to be associated with NHL includeEpstein-Barr virus (EBV) exposure and this has been associated with the development of B-cell and Burkitts lympho-mas. The possible association of Hepatitis-C virus is not clear. Other likely risk factors for NHL include exposure tocertain chemicals including pesticides and/or herbicides and petrol products (Parkin, Ferlay et al., 2003).
Numbers and incidence
A total of 688 and 630 new non-Hodgkin lymphoma cases were reported in males in 1998 and 1999, comprising onaverage 2.2% of all new cancer cases in males. Non-Hodgkin lymphoma was the 8th and the 9th leading cancer inmales in the two consecutive years respectively. NHL crude rates ranged between 3.2 and 2.9 per 100 000, with a
Table 13: Summary statistics for non-Hodgkin lymphoma, 1998 and 1999
Pop / Sex N(Obs) N(Adj) Percent Crude ASR 95%LCL 95%UCL Cumrisk LR
Females, 1998
Asian 20 20 3.58 3.64 3.89 2.28 5.51 0.4 251
Black 248 258 44.44 1.5 1.98 1.73 2.24 0.23 435
Coloured 50 50 8.96 2.6 3.51 2.53 4.49 0.41 244
White 240 248 43.01 9.76 7.15 6.23 8.07 0.81 124
Total 558 576 100.00 2.61 3.31 3.03 3.58 0.37 270
Males, 1998
Asian 22 22 3.36 4.11 4.76 2.71 6.81 0.46 218
Black 291 305 44.43 1.86 2.55 2.24 2.86 0.25 401
Coloured 72 73 10.99 3.98 5.94 4.50 7.37 0.74 136
White 270 283 41.22 11.47 9.85 8.69 11.02 1.05 96
Total 655 683 100.00 3.24 4.51 4.49 5.26 0.49 206
Females, 1999
Asian 15 15 2.83 2.7 2.9 1.41 4.39 0.34 295
Black 212 216 40.00 1.23 1.53 1.31 1.74 0.15 667
Coloured 56 56 10.57 2.87 3.58 2.63 4.53 0.33 304
White 247 253 46.60 9.94 7.14 6.24 8.05 0.9 112
Total 530 540 100.00 2.41 3.01 2.75 3.26 0.34 297
Males, 1999
Asian 21 21 3.48 3.87 4.68 2.56 6.80 0.47 213
Black 262 273 43.45 1.62 2.22 1.93 2.50 0.22 455
Coloured 60 60 9.95 3.23 4.57 3.31 5.83 0.47 213
White 260 272 43.12 11.02 9.37 8.24 10.50 1.02 99
Total 603 626 100.00 2.91 4.06 3.73 4.40 0.43 234
N(Obs) Number of cases observed
N(Adj) Observed cases adjusted for unknown population group
Percent Percentage of all site cancers
Crude Number of cases / population per 100 000
ASR Age standardised incidence rate per 100 000 (World standard population)
95%LCL 95% Lower condence limit for ASR
95%UCL 95% Upper condence limit for ASR
Cumrisk Cumulative lifetime incidence risk (0-74 years)
LR Lifetime risk (0-74 years) of developing a cancer expressed as 1 in X number of people
Please note: Ranking excludes BCC, SCC of the skin, PSU and ill dened sites

42
corresponding ASR of 4.5 and 4.1 per 100 000 (Table 9).The lifetime risk of developing NHL in males was 1 in234 in 1999 and the ASIR increased four times from 6.7per 100 000 at the ages of 50-54 to 27 per 100 000 atages 75 and older.
In females, NHL ranked the 9th leading cancer. A totalof 578 and 545 new NHL cases were reported compris-ing on average 1.8% of all female cancers in 1998 and1999 respectively. In 1999, the risk of developing NHLin a woman’s lifetime was 1 in 297 with an ASR of 3 per100 000. The ASIR at the age of 50-54 was similar tothose observed in males, increasing about three times to18 per 100 000 at the ages of 75 and older.
Population variation
White males had the highest NHL incidence rates com-pared to other population groups. They constituted onaverage 42% of all NHL cases and NHL comprised 1.7%of all white male cancers. In 1998, crude incidence rates
of 11.5 and an ASR of 9.9 per 100 000 were reported. In1999, the crude incidence rate was 11 per 100 000 andthe ASR was 9.4 per 100 000 with 1 in 99 white men atrisk of developing NHL in their lifetime (Table 13). NHLin white men became more common after the age of 50increasing about threefold from an ASIR of 18 per100 000 at the ages of 50-54 to 75 per 100 000 at 75 andolder. Coloured men had the second highest rates, withthe lowest rates of 2.2 per 100 000 reported in black men.Among women, white women had higher incidence ratescompared to other population groups. White womencomprised 45% of all new NHL in females and com-prised on average 1.9% of all white female cancers. Thecrude incidence rate in white women was 9.9 per100 000 and the ASR was 7 per 100 000. In 1999, 1 in112 white women was at risk of developing NHL. Col-oured women had the second highest incidence rates in1999 with a lifetime risk of 1 in 304. ASIR increasedfrom 18 per 100 000 at 50-54 years to 36 per 100 000 atthe age of 75 years and older.
Figure 29: Age specific incidence rates for non-Hodgkin lymphoma by population group, 1999
Non-Hodgkin lymphoma, 1999 - Females
0
10
20
30
40
50
60
00
-04
05
-09
10
-14
15
-19
20
-24
25
-29
30
-34
35
-39
40
-44
45
-49
50
-54
55
-59
60
-64
65
-69
70
-74
75
+
Age Group
AS
IR / 1
00 0
00
AF BF CF WF
Non-Hodgkin lymphoma, 1999 - Males
0
10
20
30
40
50
60
00
-04
05
-09
10
-14
15
-19
20
-24
25
-29
30
-34
35
-39
40
-44
45
-49
50
-54
55
-59
60
-64
65
-69
70
-74
75
+
Age Group
AS
IR / 1
00 0
00
AM BM CM WM

43
Non-Hodgkin lymphoma - Males
2
2.2
2.4
3.6
4.5
4.6
4.7
5.7
5.8
6.8
9.4
10
12.7
15.4
16.8
0 2 4 6 8 10 12 14 16 18
Mali (Bamako)
SA, Black
The Gambia
Algeria (Algiers)
India (Bombay)
SA, Coloured
SA, Asian
Zimbabwe (Harare)
Uganda (Kyadondo)
Brazil (Goiania)
SA, White
UK, England
Australia (Tasmania)
USA, SEER (Black)
USA, SEER (White)
Age standardised rates per 100 000
International comparison
NHL is most common in developed countries, with thehighest rates reported in the USA and Australia (Figure30). Incidence rate in white South Africans for NHL areamong the highest and compare well with those fromdeveloped countries. Incidence rates in coloured womenare also among the highest and compare with those re-ported from other developing countries. In developedcountries, recent increases in NHL rates have been
Figure 30: Non-Hodgkin lymphoma ASR per 100 000 for selected populations
(Data source: Parkin, Whelan et al., 2002)
associated with increased HIV prevalence. In South Af-rica, as in many countries in sub-Saharan Africa and incontrast to clear increasing trends that are demonstratedby Kaposi sarcoma, there has been very little increaseobserved during the HIV era, even in HIV positive indi-viduals (Newton et al., 2002). There is no significant in-crease observed between incidence rates in 1997 (Mqoqiet al., 2003) and those reported in 1999.
Non-Hodgkin lymphoma - Females
1
1.5
2.2
2.4
2.9
3.3
3.6
4.2
5.3
5.9
6.6
7.1
7.3
10.5
10.6
0 2 4 6 8 10 12
The Gambia
SA, Black
Mali (Bamako)
Algeria (Algiers)
SA, Asian
India (Bombay)
SA, Coloured
Uganda (Kyadondo)
Zimbabwe (Harare)
Brazil (Goiania)
UK, England
SA, White
USA, SEER (Black)
Australia (Tasmania)
USA, SEER (White)
Age standardised rates per 100 000

44
3.5.10 Non-Melanoma skin cancers
Non-melanoma skin cancers include basal cell carcinoma (75%), squamous cell skin carcinoma (about 22%) andother skin carcinoma (about 3%). Basal cell carcinoma in men comprise on average 23.3%, squamous cell carcinomaof skin 6.7% and other skin cancers about one percent of all male cancers. In females, BCC comprise about 16%, SCC4% and other skin cancers about one percent of all female cancers. These cancers are very common among white andlight skinned populations but are rarely fatal. They occur as a result of depigmentation due to chronic scarring andhave been associated with tropical scars (Parkin, Ferlay, et al., 2003).
Numbers and incidence
There were 8 689 non-melanoma skin cancer cases that were reported in males in 1998 and 9 545 cases in 1999, comprisingon average 31% of all male cancers per year. In 1999, one in 12 South African men was at risk of developing non-melanomaskin cancers. The crude rate for non-melanoma in males ranged between 40.9 per 100 000 in 1998 and 44.1 per 100 000 in1999, with a corresponding ASR of 69.5 and 74.5 per 100 000 (Table 14). As opposed to melanoma which develops late in life,
Table 14: Summary statistics for non-melanoma skin cancers, 1998 and 1999
Pop / Sex N(Obs) N(Adj) Percent Crude ASR 95%LCL 95%UCL Cumrisk LR
Females, 1998
Asian 35 36 0.62 6.56 8.02 4.77 11.26 1.14 87
Black 474 505 8.41 2.94 4.37 4.30 4.45 0.47 213
Coloured 392 420 6.96 21.80 30.69 26.20 35.18 3.46 29
White 4734 5059 84.01 199.19 140.22 132.26 148.18 14.92 7
Total 5635 6020 100.00 4.23 5.95 5.88 6.02 0.74 136
Males, 1998
Asian 40 40 0.49 7.47 9.99 5.09 14.89 0.98 103
Black 615 654 7.55 3.98 7.41 7.24 7.59 0.83 121
Coloured 436 465 5.35 25.34 46.84 37.17 56.51 5.02 20
White 7057 7530 86.61 305.25 252.49 236.29 268.68 25.04 4
Total 8148 8689 100.00 7.74 12.56 12.36 12.75 1.54 65
Females, 1999
Asian 41 42 0.66 7.55 8.30 5.78 10.83 0.81 124
Black 600 649 9.71 3.69 5.41 5.00 5.83 0.58 173
Coloured 404 436 6.54 22.31 30.80 27.90 33.69 3.35 30
White 5136 5535 83.09 217.38 149.85 145.87 153.84 15.35 7
Total 6181 6662 100.00 29.45 38.62 37.71 39.54 4.06 25
Males, 1999
Asian 47 48 0.53 8.86 13.02 9.31 16.74 1.45 69
Black 665 708 7.44 4.21 7.75 7.16 8.35 0.88 114
Coloured 577 617 6.46 33.17 62.93 57.96 67.90 7.03 14
White 7647 8172 85.58 331.04 271.13 265.40 276.87 26.80 4
Total 8936 9545 100.00 44.06 74.53 73.04 76.02 8.05 12
N(Obs) Number of cases observed
N(Adj) Observed cases adjusted for unknown population group
Percent Percentage of all site cancers
Crude Number of cases / population per 100 000
ASR Age standardised incidence rate per 100 000 (World standard population)
95%LCL 95% Lower confidence limit for ASR
95%UCL 95% Upper confidence limit for ASR
Cumrisk Cumulative lifetime incidence risk (0-74 years)
LR Lifetime risk (0-74 years) of developing a cancer expressed as 1 in X number of people
Please note: Ranking excludes BCC, SCC of the skin, PSU and ill defined sites

45
Non-melanoma skin cancers, 1999 - Males
0
500
1000
1500
2000
2500
00
-04
05
-09
10
-14
15
-19
20
-24
25
-29
30
-34
35
-39
40
-44
45
-49
50
-54
55
-59
60
-64
65
-69
70
-74
75
+
Age group
AS
IR / 1
00 0
00
AM BM CM WM
non-melanoma skin cancers in both men and women mostcommonly developed at younger ages; at the age of 35-39the ASIR was 20 per 100 000 increasing to 884 per 100 000at the age of 75 and older. In 1999, the risk of developingnon-melanoma skin cancers in men was double that reportedin females.
There were 6 020 and 6 662 female cases of non-melanomaskin cancers reported in 1998 and 1999 respectively, com-prising on average 21% of all cancers reported in women.One in 25 South African women had a lifetime risk of devel-oping non-melanoma skin cancers in the two years. The crudeincidence rate was 27.2 per 100 000 with an ASR of 36.4 per100 000 in 1998. In 1999, a crude rate of 29.5 was recordedin women with an ASR of 38.6 per 100 000. In women, rateswere lower than in men and at 35-39 years, the ASIR was 15per 100 000 reaching incidence rates of 434.3 per 100 000 atthe age of 75 years and older.
(Data source: Parkin, Whelan et al., 2002)
Population variation
More than 80% of non-melanoma skin cancers reportedin 1998 and 1999 occurred in the white population, inboth males and females. These comprised 48.3% and50.7% of all cancers in white males in 1998 and 1999respectively. The lifetime risk of developing non-melanoma skin cancers in white males was 25%. Cruderates ranged between 305.3 per 100 000 and 331 per100 000. The ASR was 252.5 per 100 000 in 1998 and271.1 per 100 000 in 1999. These skin cancers occurredfairly early in life and among young white males aged25-29, ASIR was 29 per 100 000 and this rate increased81fold to 2 362.4 per 100 000 at the age of 75 years andolder (Figure 31).
Among white females, non-melanoma skin cancers comprisedon average 41% of all cancers. Crude rates ranged between
Figure 31: Age specific incidence rates for non-melanoma skin cancers by population group, 1999
Non-melanoma skin cancers, 1999 - Females
0
200
400
600
800
1000
1200
00
-04
05
-09
10
-14
15
-19
20
-24
25
-29
30
-34
35
-39
40
-44
45
-49
50
-54
55
-59
60
-64
65
-69
70
-74
75
+
Age group
AS
IR / 1
00 0
00
AF BF CF WF

46
199.2 per 100 000 and 217.4 per 100 000 in 1998 and 1999with an ASR of 140.2 and 149.9 respectively. In 1999, 1 in 7white females was likely to develop non-melanoma skin can-cers in their lifetime. Although the risk of developing non-melanoma skin cancers in white women was half that in whitemales, the incidence distribution pattern was similar with anASIR of 27.7 per 100 000 at the age of 25-29, increasing 39foldto 1 067 per 100 000 at the age of 75 years and older (Figure31). Coloured males and females had the second highest non-melanoma skin cancer rates ranging between 31 per 100 000in females and 63 in males in 1999. In 1999, the lifetime riskof developing non-melanoma skin cancers was 1 in 30 inmales and 1 in 14 in females (Table 14).
International comparison
In sub-Saharan Africa, high incidence rates of non-melanoma skin cancers mostly occur in countries with high
Non-melanoma skin cancers - Males
1
3.3
3.3
3.8
7.75
7.8
13.02
48.9
62.93
271.13
635.3
0 100 200 300 400 500 600 700
The Gambia
Mali (Bamako)
Zimbabwe (Harare, Black)
Uganda (Kyadondo)
SA, Black
Algeria (Algiers)
SA, Asian
UK, England
SA, Coloured
SA, White
Zimbabwe (Harare, White)
Age standardised rates per 100 000
Non-melanoma skin cancers - Females
1
2.4
2.5
2.7
3.5
8.3
30.8
33.9
363.3
5.4
149.9
0 50 100 150 200 250 300 350 400
Uganda (Kyadondo)
The Gambia
Zimbabwe (Harare, Black)
Mali (Bamako)
Algeria (Algiers)
SA, Black
SA, Asian
SA, Coloured
UK, England
SA, White
Zimbabwe (Harare, White)
Age standardised rates per 100 000
proportions of light skinned populations, including Hararein Zimbabwe and South Africa where the highest incidencerates are recorded. Non-melanoma incidence rates in whiteSouth Africans were fourfold higher than those reported inEngland, the UK and in France (Parkin, Ferlay et al., 2003)(Figure 32). South African Coloured female rates comparewell with those reported in the UK, England. The risk ofdeveloping non-melanoma skin cancer among South Afri-can coloured females is about 29% higher than that re-ported for the UK, England. The South African Black popu-lation had higher incidence rates than rates in other parts ofAfrica, probably due to the fairer skin in black South Afri-cans compared to a darker skin in other parts of Africa.
Figure 32: Non-melanoma skin cancers ASR per 100 000 for selected populations
(Data source: Parkin, Whelan et al., 2002)
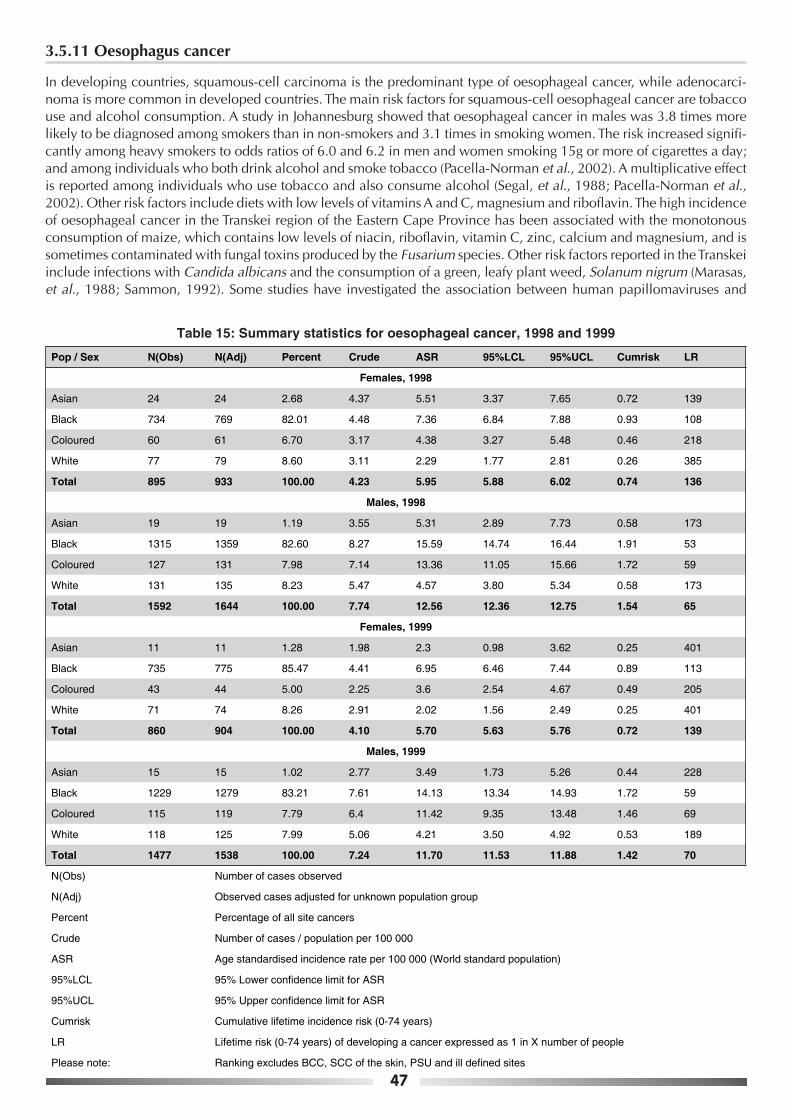
47
3.5.11 Oesophagus cancer
In developing countries, squamous-cell carcinoma is the predominant type of oesophageal cancer, while adenocarci-noma is more common in developed countries. The main risk factors for squamous-cell oesophageal cancer are tobaccouse and alcohol consumption. A study in Johannesburg showed that oesophageal cancer in males was 3.8 times morelikely to be diagnosed among smokers than in non-smokers and 3.1 times in smoking women. The risk increased signifi-cantly among heavy smokers to odds ratios of 6.0 and 6.2 in men and women smoking 15g or more of cigarettes a day;and among individuals who both drink alcohol and smoke tobacco (Pacella-Norman et al., 2002). A multiplicative effectis reported among individuals who use tobacco and also consume alcohol (Segal, et al., 1988; Pacella-Norman et al.,2002). Other risk factors include diets with low levels of vitamins A and C, magnesium and riboflavin. The high incidenceof oesophageal cancer in the Transkei region of the Eastern Cape Province has been associated with the monotonousconsumption of maize, which contains low levels of niacin, riboflavin, vitamin C, zinc, calcium and magnesium, and issometimes contaminated with fungal toxins produced by the Fusarium species. Other risk factors reported in the Transkeiinclude infections with Candida albicans and the consumption of a green, leafy plant weed, Solanum nigrum (Marasas,et al., 1988; Sammon, 1992). Some studies have investigated the association between human papillomaviruses and
Table 15: Summary statistics for oesophageal cancer, 1998 and 1999
Pop / Sex N(Obs) N(Adj) Percent Crude ASR 95%LCL 95%UCL Cumrisk LR
Females, 1998
Asian 24 24 2.68 4.37 5.51 3.37 7.65 0.72 139
Black 734 769 82.01 4.48 7.36 6.84 7.88 0.93 108
Coloured 60 61 6.70 3.17 4.38 3.27 5.48 0.46 218
White 77 79 8.60 3.11 2.29 1.77 2.81 0.26 385
Total 895 933 100.00 4.23 5.95 5.88 6.02 0.74 136
Males, 1998
Asian 19 19 1.19 3.55 5.31 2.89 7.73 0.58 173
Black 1315 1359 82.60 8.27 15.59 14.74 16.44 1.91 53
Coloured 127 131 7.98 7.14 13.36 11.05 15.66 1.72 59
White 131 135 8.23 5.47 4.57 3.80 5.34 0.58 173
Total 1592 1644 100.00 7.74 12.56 12.36 12.75 1.54 65
Females, 1999
Asian 11 11 1.28 1.98 2.3 0.98 3.62 0.25 401
Black 735 775 85.47 4.41 6.95 6.46 7.44 0.89 113
Coloured 43 44 5.00 2.25 3.6 2.54 4.67 0.49 205
White 71 74 8.26 2.91 2.02 1.56 2.49 0.25 401
Total 860 904 100.00 4.10 5.70 5.63 5.76 0.72 139
Males, 1999
Asian 15 15 1.02 2.77 3.49 1.73 5.26 0.44 228
Black 1229 1279 83.21 7.61 14.13 13.34 14.93 1.72 59
Coloured 115 119 7.79 6.4 11.42 9.35 13.48 1.46 69
White 118 125 7.99 5.06 4.21 3.50 4.92 0.53 189
Total 1477 1538 100.00 7.24 11.70 11.53 11.88 1.42 70
N(Obs) Number of cases observed
N(Adj) Observed cases adjusted for unknown population group
Percent Percentage of all site cancers
Crude Number of cases / population per 100 000
ASR Age standardised incidence rate per 100 000 (World standard population)
95%LCL 95% Lower confidence limit for ASR
95%UCL 95% Upper confidence limit for ASR
Cumrisk Cumulative lifetime incidence risk (0-74 years)
LR Lifetime risk (0-74 years) of developing a cancer expressed as 1 in X number of people
Please note: Ranking excludes BCC, SCC of the skin, PSU and ill defined sites

48
Oesophagus, 1999 - Males
0
10
20
30
40
50
60
70
80
90
00
-04
05
-09
10
-14
15
-19
20
-24
25
-29
30
-34
35
-39
40
-44
45
-49
50
-54
55
-59
60
-64
65
-69
70
-74
75
+
Age Group
AS
IR / 1
00 0
00
AM BM CM WM
Oesophagus, 1999 - Females
0
10
20
30
40
50
60
00
-04
05
-09
10
-14
15
-19
20
-24
25
-29
30
-34
35
-39
40
-44
45
-49
50
-54
55
-59
60
-64
65
-69
70
-74
75
+
Age group
AS
IR / 1
00 0
00
AF BF CF WF
oesophageal cancer, but none has shown strong epide-miological evidence of an association. Very little is knownof genetic factors and their association with the develop-ment of oesophageal cancer in Africa.
Numbers and incidence
Cancer of the oesophagus ranked the third leading cancer inmales. A total of 1 645 and 1 540 new cancer cases werereported in males, comprising 5.6% and 5.2% of all newcancer cases reported in 1998 and 1999 respectively. Thecrude rate for oesophageal cancer in men was on average7.4 per 100 000 with an ASR ranging between 12.6 and11.3 per 100 000 in 1998 and 1999 respectively (Table 15).The risk of developing cancer of the oesophagus droppedfrom 1 in 65 in 1998 to 1 in 73 in 1999. Oesophageal can-cer was more common after the age of 50, with the ASIR of29.4 per 100 000 doubling and peaking at the age of 70-74to an ASIR of 61 per 100 000. The risk of developing cancerof the oesophagus in men was two times that in women.
In women, cancer of the oesophagus ranked the fourthleading cancer. A total of 939 and 909 new cancer caseswere reported consecutively in the two years and com-prised 3% of all cancer cases reported in females. Thecrude rate in women was 4 per 100 000 and the ASRranged between 6 per 100 000 in 1998 and 5.5 per100 000 in 1999. The lifetime risk of developing oesopha-
geal cancer in women was one in 143 in 1999. At the ageof 50-54, the ASIR was 10.4 per 100 000, three times lowerthan that in males of the same age group and peaking at36.8 per 100 000 in women of 70-74 years.
Population variation
Cancer of the oesophagus was the second leading cancerin black men who comprised the largest proportion (83%)of all oesophageal cancer cases reported in men. Oesopha-geal cancer comprised 13% of all cancers reported in blackmen. Crude incidence rates ranged between 8.3 per100 000 in 1998 and 7.6 per 100 000 in 1999, with thecorresponding ASR of 15.6 and 14.1 per 100 000. The life-time risk for oesophageal cancer dropped from 1 in 53 in1998 to 1 in 59 in 1999. The risk of developing oesopha-geal cancer doubles from an ASIR of 36 per 100 000 at theage of 50-54 to an ASIR greater than 73 per 100 000 inmen older than 65 years (Figure 33). Coloured males hadthe second highest incidence rates for oesophagus cancerof 13.4 and 11.4 per 100 000 in 1998 and 1999. In thispopulation group, oesophagus cancer ranked the fifth lead-ing cancer in 1998 and ranked sixth in 1999.The risk ofdeveloping cancer of the oesophagus was four times lowerin Asian men than that in black men. In this group cancerof the oesophagus ranked eighth. Asian men had the low-est oesophageal cancer rates of 3.5 per 100 000 in 1999.
Figure 33: Age specific incidence rates for oesophageal cancer by population group, 1999

49
In black females, oesophageal cancer was the third leadingcancer and comprised on average 84% of all oesophagealcancer cases. Oesophageal cancer cases comprise on av-erage 5.7% of all black female cancers. The crude rate infemales was 4.4 per 100 000 in the two years, with an ASRof 7 per 100 000. In 1999, the lifetime risk of developingcancer of the oesophagus in black women was 1 in 113. Atthe ages of 50-54, the ASIR was 12.6 per 100 000, threetimes lower than that in black males of the same age grouppeaking at 51 per 100 000 at the ages of 70-74. In 1999,coloured females had the second highest rates of 3.6 per100 000. In this group, oesophageal cancer ranked eigth.The lowest rates were observed among white females, withan incidence rate of 2 per 100 000 in 1999.
Figure 34: Oesophagus cancer ASR per 100 000 for selected populations
Oesophagus - Males
0.9
1.4
3
3.5
4.2
4.7
6.9
8.4
8.4
10.7
10.8
11.4
13.2
14.1
19.3
0 5 10 15 20 25
Algeria (Algiers)
The Gambia
Mali (Bamako)
SA, Asian
SA, White
USA, SEER (White)
Australia (Tasmania)
India (Bombay)
UK, England
USA, SEER (Black)
Brazil (Goiania)
SA, Coloured
Uganda (Kyadondo)
SA, Black
Zimbabwe (Harare)
Age standardised rates per 100 000
International comparison
Oesophageal cancer is the eighth most common cancerworldwide (Parkin, Ferlay et al., 2003). High incidencerates are reported in some developing countries, particu-larly in black populations of Southern Africa (Zimbabweand South Africa) and in East Africa, in Uganda (Figure34). Rates in white South Africans compare with thosereported among white American (SEER rates). Rates inSouth African Asians are 2.5 times lower than those re-ported in India, Bombay, both in males and in females. Itshould be noted that oesophageal cancer occurrence couldbe highly focal, for example with some areas in the East-ern Cape Province of South Africa reporting incidence ratesas high as 37.5 and 26.5 per 100 000 in men and womenrespectively during the period 1996-1998 (Parkin, Ferlayet al., 2003, Somdyala et al., 2003).
Oesophagus - Females
0.5
1.1
1.2
1.7
2
2.3
3
3.1
3.5
3.6
3.7
6.6
7
8.8
12.2
0 2 4 6 8 10 12 14
Algeria (Algiers)
The Gambia
USA, SEER (White)
Mali (Bamako)
SA, White
SA, Asian
Brazil (Goiania)
Australia (Tasmania)
UK, England
SA, Coloured
USA, SEER (Black)
India (Bombay)
SA, Black
Zimbabwe (Harare)
Uganda (Kyadondo)
Age standardised rates per 100 000
(Data source: Parkin, Whelan et al., 2002)

50
3.5.12 Prostate cancer
Prostate cancer is one of the leading cancers in men worldwide. Risk factors for prostate cancer include diets high infat, especially red meat, and genetic factors (Parkin, Ferlay et al., 2003). Other factors thought to play a role includeenvironmental factors and infections, but scientific evidence to support these suspicions has not been established. Inmany western countries, the incidence of prostate cancer is increasing, possibly due to the increasing use of prostate-specific antigen (PSA) as a screening tool.
Numbers and incidence
A total of 4 171 and 3 860 prostate cancer cases were reported to the NCR in 1998 and 1999. In both years, prostate cancerwas the leading cancer, comprising 14% and 13% consecutively of all cancers reported in males. The lifetime risk ofdeveloping prostate cancer was 1 in 22 men in 1998 and 1 in 24 in 1999. The crude rate dropped from 19.6 to 17.8 per 100000 in 1999 and the ASR was 37.6 per 100 000 in 1998 and 34.1 per 100 000 in 1999 (Table 16). Prostate cancer was morecommon after the age of 55, with an ASIR of 56 per 100 000 at ages 55-59, reaching a high of 455 per 100 000 at the ageof 75 years and older.
Population variation
Prostate cancer was the leading cancer in all population groups over the two years. White men comprised more than half ofall prostate cancer cases reported during this period and had the highest incidence rate. Prostate cancer comprised onaverage 14% of all cancers reported in white males, with crude rates ranging between 87.9 and 92.3 per 100 000. Agestandardised incidence rates in white males were 78.5 per 100 000 in 1998 and 74.4 per 100 000 in 1999. One in 10 whitemen was at risk of developing prostate cancer. In 1999, the ASIR in white men aged 70-74 years was 738 per 100 000, fivetimes that reported at the ages of 55-59 (58 per 100 000) (Figure 35). The second highest incidence rates were observed in
Table 16: Summary statistics for prostate cancer, 1998 and 1999
Pop / Sex N(Obs) N(Adj) Percent Crude ASR 95%LCL 95%UCL Cumrisk LR
Males, 1998
Asian 61 64 1.54 11.95 20.41 15.41 25.42 2.2 46
Black 1360 1432 34.36 8.72 20.64 19.57 21.71 2.39 42
Coloured 375 396 9.47 21.58 47.14 42.53 51.76 6.17 17
White 2162 2277 54.62 92.31 78.51 75.28 81.73 10.35 10
Total 3958 4169 100.00 19.61 37.59 36.45 38.73 4.59 22
Males, 1999
Asian 55 59 1.52 10.89 18.34 13.65 23.03 2.6 39
Black 1143 1220 31.59 7.26 17.17 16.21 18.13 2.01 50
Coloured 386 410 10.67 22.04 47.98 43.33 52.62 5.43 19
White 2034 2169 56.22 87.86 74.38 71.25 77.52 10.05 10
Total 3618 3858 100.00 17.81 34.12 33.05 35.20 4.18 24
N(Obs) Number of cases observed
N(Adj) Observed cases adjusted for unknown population group
Percent Percentage of all site cancers
Crude Number of cases / population per 100 000
ASR Age standardised incidence rate per 100 000 (World standard population)
95%LCL 95% Lower confidence limit for ASR
95%UCL 95% Upper confidence limit for ASR
Cumrisk Cumulative lifetime incidence risk (0-74 years)
LR Lifetime risk (0-74 years) of developing a cancer expressed as 1 in X number of people
Please note: Ranking excludes BCC, SCC of the skin, PSU and ill defined sites

51
coloured men. These comprised on average 10% of all pros-tate cancer cases, with an ASR of 47 per 100 000 over thetwo years. In 1999, the lifetime risk of developing prostatecancer in coloured males was 1 in 19. Prostate cancer com-prised on average 15% of all coloured male cancers. Blackmen constituted about one third of all prostate cancers inthis period. Asian and black men had the lowest rates, andthe risk of developing prostate cancer in these two groupswas four times lower than that in white men.
International comparison
Globally, cancer of the prostate is the third most commoncancer in men (Parkin, Ferlay et al., 2003). Prostate cancer
occurs most commonly in developed countries (Figure 36).Prostate cancer rates for white South African men rankamong the highest rates in the world. South African inci-dence rates for prostate cancer are higher than rates re-ported in many developing countries, particularly those insub-Saharan Africa. Contrary to this, rates in South Africanblack men are about one half of those in Uganda and Zim-babwe. Prostate cancer rates are influenced largely byscreening and where screening is a common practice, pros-tate cancer rates are likely to increase. Further studies toconfirm the accuracy of prostate cancer rates among blackSouth Africans would help to resolve the doubt and specu-lations about under-reporting in this population group.
Figure 35: Age specific incidence rates for prostate cancer by population group, 1999
Figure 36: Prostate cancer ASR per 100 000 for selected populations
Prostate, 1999 - Males
0
100
200
300
400
500
600
700
800
900
00
-04
05
-09
10
-14
15
-19
20
-24
25
-29
30
-34
35
-39
40
-44
45
-49
50
-54
55
-59
60
-64
65
-69
70
-74
75
+
Age Group
AS
IR / 1
00 0
00
AM BM CM WM
Prostate - Males
4.7
5.4
7.4
7.6
17.2
18.3
30.7
37.1
39.6
48
74.4
92.4
103.3
107.8
185.4
0 20 40 60 80 100 120 140 160 180 200
The Gambia
Algeria (Algiers)
India (Bombay)
Mali (Bamako)
SA, Black
SA, Asian
Zimbabwe (Harare)
Uganda (Kyadondo)
UK, England
SA, Coloured
SA, White
Brazil (Goiania)
Australia (Tasmania)
USA, SEER (White)
USA, SEER (Black)
Age standardised rates per 100 000
(Data source: Parkin, Whelan et al., 2002)

52
3.5.13 Cancer of the Uterus
Ninety-five percent of uterine cancers are adenocarcinomas arising from the glandular endometrial lining of theuterus. Cancers of the uterine wall (leiomyosarcomas) and endometrial stroma (sarcomas) comprise the remaining5%. Known risk factors for uterine adenocarcinoma include age, prolonged exposure to oestrogen and obesity. Uter-ine adenocarcinomas develop primarily at postmenopausal and perimenopausal ages. Prolonged oestrogen-only regi-mens, for example, Tamoxifen, used to treat breast cancer patients, increase the risk of uterine cancer (but the risk ismuch smaller than the decrease in risk of breast cancer). Infertility, low parity, and oestrogen replacement therapy(unless taken with adequate progestogen) may also be risk factors for endometrial cancer. Other possible risk factorsinclude a history of breast and ovarian cancer, early age of menarche, late menopause, diabetes, hyperpertension,high socio-economic status and prior radiation therapy for pelvic cancer. Conditions that increase the influence ofprogesterone on the uterus (for example, pregnancy and oral contraceptives) appear to decrease the risk of uterinecancer. In developing countries a history of prior gestational trophoblastic disease and a diet low in vitamin A areimportant risk factors (Silverberg et al., 2003).
Numbers and incidence
A total of 765 and 811 cases with cancer of the uterus were reported in 1998 and 1999 respectively, comprising onaverage 2.6% of all female cancer cases. Uterine cancer ranked the 7th and the 5th leading cancer in females con-secutively in the two years. The crude rate for cancer of the uterus was 3.5 per 100 000 with an ASR of 5 per 100 000(Table 17). Uterine cancer was most common after the age of 55. The ASIR for the age group 55-59 was 14 per100 000, peaking at the age of 70-74, where the ASIR was 40 per 100 000. In 1999, 1 in 146 South African womenwas at risk of developing uterine cancer in their lifetime.
Table 17: Summary statistics for cancer of the uterus, 1998 and 1999
Pop / Sex N(Obs) N(Adj) Percent Crude ASR 95%LCL 95%UCL Cumrisk LR
Females, 1998
Asian 53 53 7.14 9.65 11.76 8.62 14.89 1.56 65
Black 394 406 53.10 2.37 3.92 3.54 4.30 0.52 193
Coloured 77 77 10.38 4 6.14 4.77 7.51 0.81 124
White 218 224 29.38 8.82 6.37 5.50 7.23 0.78 129
Total 742 760 100.00 3.45 4.89 4.54 5.23 0.63 159
Females, 1999
Asian 34 35 4.40 6.29 7.13 4.76 9.50 0.95 106
Black 477 500 61.79 2.85 4.68 4.26 5.09 0.64 157
Coloured 80 83 10.36 4.25 6.61 5.18 8.03 0.94 107
White 181 189 23.45 7.42 5.43 4.64 6.22 0.7 143
Total 772 807 100.00 3.58 5.09 4.74 5.44 0.69 146
N(Obs) Number of cases observed
N(Adj) Observed cases adjusted for unknown population group
Percent Percentage of all site cancers
Crude Number of cases / population per 100 000
ASR Age standardised incidence rate per 100 000 (World standard population)
95%LCL 95% Lower condence limit for ASR
95%UCL 95% Upper condence limit for ASR
Cumrisk Cumulative lifetime incidence risk (0-74 years)
LR Lifetime risk (0-74 years) of developing a cancer expressed as 1 in X number of people
Please note: Ranking excludes BCC, SCC of the skin, PSU and ill dened sites

53
Uterus - Females
1.7
2.1
2.2
2.9
3.3
4.7
5.3
5.4
6.3
6.6
7.1
9.9
12
13.3
18.4
0 2 4 6 8 10 12 14 16 18 20
Mali (Bamako)
The Gambia
Algeria (Algiers)
India (Bombay)
Uganda (Kyadondo)
SA, Black
Brazil (Goiania)
SA, White
Zimbabwe (Harare)
SA, Coloured
SA, Asian
Australia (Tasmania)
USA, SEER (Black)
UK, England
USA, SEER (White)
Age standardised rates per 100 000
Uterus, 1999 - Females
0
10
20
30
40
50
60
70
00
-04
05
-09
10
-14
15
-19
20
-24
25
-29
30
-34
35
-39
40
-44
45
-49
50
-54
55
-59
60
-64
65
-69
70
-74
75
+
Age Group
AS
IR / 1
00 0
00
AF BF CF WF
Population variation
Asian women had the highest uterine cancer incidence ratescompared to other population groups. Incidence rates amongthis group need to be interpreted with caution however, be-cause of small numbers. Cancer of the uterus was the thirdand the fourth leading cancer in Asian women and com-prised 6.3% and 4.6% of all cancers in Asian women in1998 and 1999 respectively. In 1998, the age standardisedincidence rate in these women was 12 per 100 000 and 7per 100 000 in 1999. In the same year, 1 in 106 Asian womenwas at risk of developing cancer of the uterus in their life-time. Coloured and white women had the second and thethird highest incidence rates respectively, ranging between6.1 per 100 000 in 1998 and 6.6 per 100 000 in 1999. In1999, uterine cancer ranked the fifth and the ninth leadingcancer in coloured and white female respectively. Among
black women, uterine cancer ranked the fourth leading can-cer. Black women comprised the largest proportion, on aver-age 57% of all uterine cancer cases, with the lowest inci-dence rate of 4.7 per 100 000.
International comparison
Worldwide, cancer of the uterus is the second most com-mon cancer of the female genital system (Tavassoli andDevilee, 2003). The incidence rates of the cancer of the uterusamong South African women are on average twofold lowerthan those reported in developed countries and are abouttwofold higher than those reported in most developing coun-tries (Figure 38). These include the incidence rates in blackSouth African women, which are lower than in other SouthAfrican population groups, but are higher than uterine ratesreported in most developing countries.
Figure 37: Age specific incidence rates for uterus cancer by population group, 1999
Figure 38: Uterus cancer ASR per 100 000 for selected populations
(Data source: Parkin, Whelan et al., 2002)
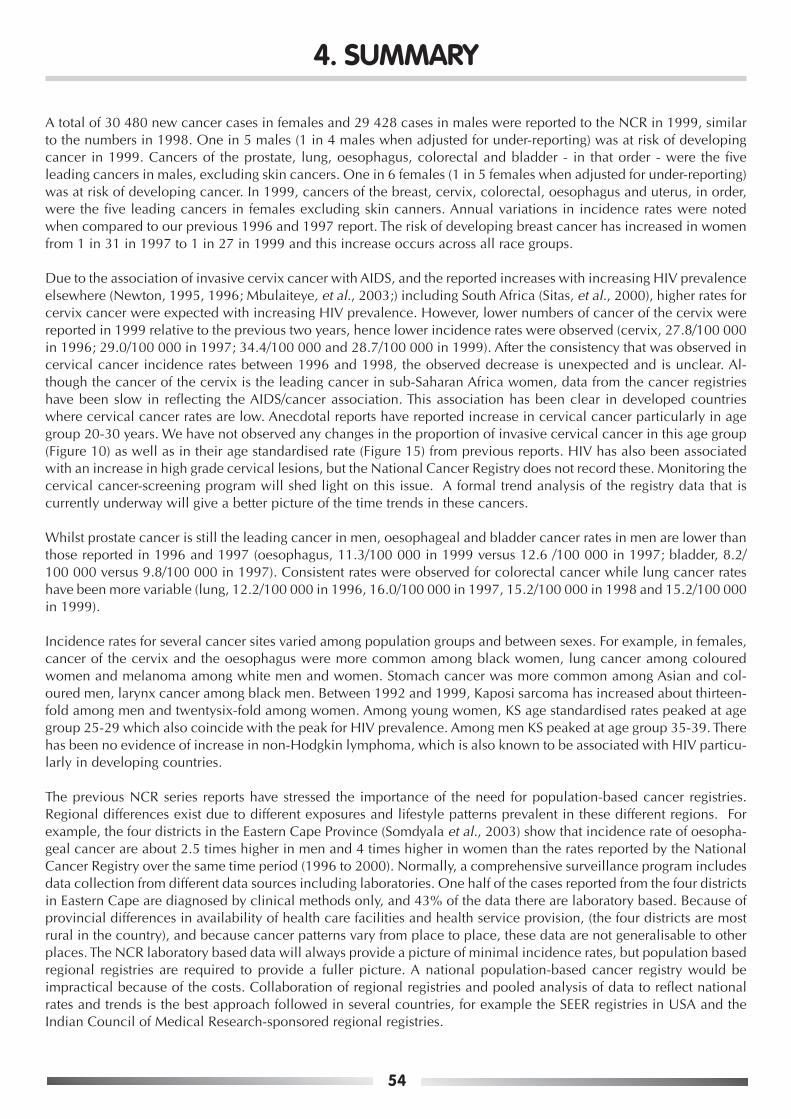
54
4. SUMMARY
A total of 30 480 new cancer cases in females and 29 428 cases in males were reported to the NCR in 1999, similarto the numbers in 1998. One in 5 males (1 in 4 males when adjusted for under-reporting) was at risk of developingcancer in 1999. Cancers of the prostate, lung, oesophagus, colorectal and bladder - in that order - were the fiveleading cancers in males, excluding skin cancers. One in 6 females (1 in 5 females when adjusted for under-reporting)was at risk of developing cancer. In 1999, cancers of the breast, cervix, colorectal, oesophagus and uterus, in order,were the five leading cancers in females excluding skin canners. Annual variations in incidence rates were notedwhen compared to our previous 1996 and 1997 report. The risk of developing breast cancer has increased in womenfrom 1 in 31 in 1997 to 1 in 27 in 1999 and this increase occurs across all race groups.
Due to the association of invasive cervix cancer with AIDS, and the reported increases with increasing HIV prevalenceelsewhere (Newton, 1995, 1996; Mbulaiteye, et al., 2003;) including South Africa (Sitas, et al., 2000), higher rates forcervix cancer were expected with increasing HIV prevalence. However, lower numbers of cancer of the cervix werereported in 1999 relative to the previous two years, hence lower incidence rates were observed (cervix, 27.8/100 000in 1996; 29.0/100 000 in 1997; 34.4/100 000 and 28.7/100 000 in 1999). After the consistency that was observed incervical cancer incidence rates between 1996 and 1998, the observed decrease is unexpected and is unclear. Al-though the cancer of the cervix is the leading cancer in sub-Saharan Africa women, data from the cancer registrieshave been slow in reflecting the AIDS/cancer association. This association has been clear in developed countrieswhere cervical cancer rates are low. Anecdotal reports have reported increase in cervical cancer particularly in agegroup 20-30 years. We have not observed any changes in the proportion of invasive cervical cancer in this age group(Figure 10) as well as in their age standardised rate (Figure 15) from previous reports. HIV has also been associatedwith an increase in high grade cervical lesions, but the National Cancer Registry does not record these. Monitoring thecervical cancer-screening program will shed light on this issue. A formal trend analysis of the registry data that iscurrently underway will give a better picture of the time trends in these cancers.
Whilst prostate cancer is still the leading cancer in men, oesophageal and bladder cancer rates in men are lower thanthose reported in 1996 and 1997 (oesophagus, 11.3/100 000 in 1999 versus 12.6 /100 000 in 1997; bladder, 8.2/100 000 versus 9.8/100 000 in 1997). Consistent rates were observed for colorectal cancer while lung cancer rateshave been more variable (lung, 12.2/100 000 in 1996, 16.0/100 000 in 1997, 15.2/100 000 in 1998 and 15.2/100 000in 1999).
Incidence rates for several cancer sites varied among population groups and between sexes. For example, in females,cancer of the cervix and the oesophagus were more common among black women, lung cancer among colouredwomen and melanoma among white men and women. Stomach cancer was more common among Asian and col-oured men, larynx cancer among black men. Between 1992 and 1999, Kaposi sarcoma has increased about thirteen-fold among men and twentysix-fold among women. Among young women, KS age standardised rates peaked at agegroup 25-29 which also coincide with the peak for HIV prevalence. Among men KS peaked at age group 35-39. Therehas been no evidence of increase in non-Hodgkin lymphoma, which is also known to be associated with HIV particu-larly in developing countries.
The previous NCR series reports have stressed the importance of the need for population-based cancer registries.Regional differences exist due to different exposures and lifestyle patterns prevalent in these different regions. Forexample, the four districts in the Eastern Cape Province (Somdyala et al., 2003) show that incidence rate of oesopha-geal cancer are about 2.5 times higher in men and 4 times higher in women than the rates reported by the NationalCancer Registry over the same time period (1996 to 2000). Normally, a comprehensive surveillance program includesdata collection from different data sources including laboratories. One half of the cases reported from the four districtsin Eastern Cape are diagnosed by clinical methods only, and 43% of the data there are laboratory based. Because ofprovincial differences in availability of health care facilities and health service provision, (the four districts are mostrural in the country), and because cancer patterns vary from place to place, these data are not generalisable to otherplaces. The NCR laboratory based data will always provide a picture of minimal incidence rates, but population basedregional registries are required to provide a fuller picture. A national population-based cancer registry would beimpractical because of the costs. Collaboration of regional registries and pooled analysis of data to reflect nationalrates and trends is the best approach followed in several countries, for example the SEER registries in USA and theIndian Council of Medical Research-sponsored regional registries.
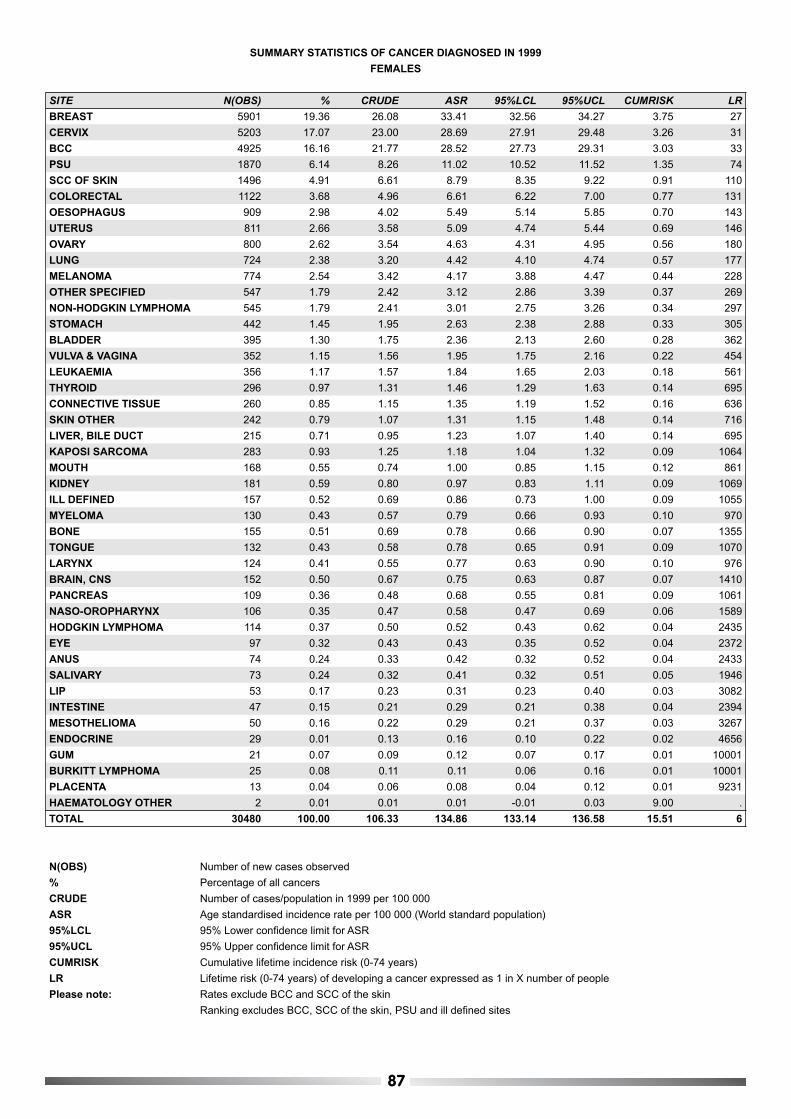
87
SUMMARY STATISTICS OF CANCER DIAGNOSED IN 1999
FEMALES
SITE N(OBS) % CRUDE ASR 95%LCL 95%UCL CUMRISK LR
BREAST 5901 19.36 26.08 33.41 32.56 34.27 3.75 27
CERVIX 5203 17.07 23.00 28.69 27.91 29.48 3.26 31
BCC 4925 16.16 21.77 28.52 27.73 29.31 3.03 33
PSU 1870 6.14 8.26 11.02 10.52 11.52 1.35 74
SCC OF SKIN 1496 4.91 6.61 8.79 8.35 9.22 0.91 110
COLORECTAL 1122 3.68 4.96 6.61 6.22 7.00 0.77 131
OESOPHAGUS 909 2.98 4.02 5.49 5.14 5.85 0.70 143
UTERUS 811 2.66 3.58 5.09 4.74 5.44 0.69 146
OVARY 800 2.62 3.54 4.63 4.31 4.95 0.56 180
LUNG 724 2.38 3.20 4.42 4.10 4.74 0.57 177
MELANOMA 774 2.54 3.42 4.17 3.88 4.47 0.44 228
OTHER SPECIFIED 547 1.79 2.42 3.12 2.86 3.39 0.37 269
NON-HODGKIN LYMPHOMA 545 1.79 2.41 3.01 2.75 3.26 0.34 297
STOMACH 442 1.45 1.95 2.63 2.38 2.88 0.33 305
BLADDER 395 1.30 1.75 2.36 2.13 2.60 0.28 362
VULVA & VAGINA 352 1.15 1.56 1.95 1.75 2.16 0.22 454
LEUKAEMIA 356 1.17 1.57 1.84 1.65 2.03 0.18 561
THYROID 296 0.97 1.31 1.46 1.29 1.63 0.14 695
CONNECTIVE TISSUE 260 0.85 1.15 1.35 1.19 1.52 0.16 636
SKIN OTHER 242 0.79 1.07 1.31 1.15 1.48 0.14 716
LIVER, BILE DUCT 215 0.71 0.95 1.23 1.07 1.40 0.14 695
KAPOSI SARCOMA 283 0.93 1.25 1.18 1.04 1.32 0.09 1064
MOUTH 168 0.55 0.74 1.00 0.85 1.15 0.12 861
KIDNEY 181 0.59 0.80 0.97 0.83 1.11 0.09 1069
ILL DEFINED 157 0.52 0.69 0.86 0.73 1.00 0.09 1055
MYELOMA 130 0.43 0.57 0.79 0.66 0.93 0.10 970
BONE 155 0.51 0.69 0.78 0.66 0.90 0.07 1355
TONGUE 132 0.43 0.58 0.78 0.65 0.91 0.09 1070
LARYNX 124 0.41 0.55 0.77 0.63 0.90 0.10 976
BRAIN, CNS 152 0.50 0.67 0.75 0.63 0.87 0.07 1410
PANCREAS 109 0.36 0.48 0.68 0.55 0.81 0.09 1061
NASO-OROPHARYNX 106 0.35 0.47 0.58 0.47 0.69 0.06 1589
HODGKIN LYMPHOMA 114 0.37 0.50 0.52 0.43 0.62 0.04 2435
EYE 97 0.32 0.43 0.43 0.35 0.52 0.04 2372
ANUS 74 0.24 0.33 0.42 0.32 0.52 0.04 2433
SALIVARY 73 0.24 0.32 0.41 0.32 0.51 0.05 1946
LIP 53 0.17 0.23 0.31 0.23 0.40 0.03 3082
INTESTINE 47 0.15 0.21 0.29 0.21 0.38 0.04 2394
MESOTHELIOMA 50 0.16 0.22 0.29 0.21 0.37 0.03 3267
ENDOCRINE 29 0.01 0.13 0.16 0.10 0.22 0.02 4656
GUM 21 0.07 0.09 0.12 0.07 0.17 0.01 10001
BURKITT LYMPHOMA 25 0.08 0.11 0.11 0.06 0.16 0.01 10001
PLACENTA 13 0.04 0.06 0.08 0.04 0.12 0.01 9231
HAEMATOLOGY OTHER 2 0.01 0.01 0.01 -0.01 0.03 9.00 .
TOTAL 30480 100.00 106.33 134.86 133.14 136.58 15.51 6
N(OBS) Number of new cases observed
% Percentage of all cancers
CRUDE Number of cases/population in 1999 per 100 000
ASR Age standardised incidence rate per 100 000 (World standard population)
95%LCL 95% Lower confi dence limit for ASR
95%UCL 95% Upper confi dence limit for ASR
CUMRISK Cumulative lifetime incidence risk (0-74 years)
LR Lifetime risk (0-74 years) of developing a cancer expressed as 1 in X number of people
Please note: Rates exclude BCC and SCC of the skin
Ranking excludes BCC, SCC of the skin, PSU and ill defi ned sites

88
SUMMARY STATISTICS OF CANCER DIAGNOSED IN 1999
MALES
SITE N(OBS) % CRUDE ASR 95%LCL 95%UCL CUMRISK LR
BCC 7085 24.08 32.69 54.84 53.56 56.11 6.01 17
PROSTATE 3860 13.12 17.81 34.12 33.05 35.20 4.18 24
SCC OF SKIN 2178 7.40 10.05 17.67 16.94 18.41 1.96 51
PSU 1889 6.42 8.72 13.92 13.29 14.55 1.71 58
LUNG 1742 5.92 8.04 13.56 12.93 14.20 1.70 59
OESOPHAGUS 1540 5.23 7.11 11.33 10.77 11.90 1.38 73
COLORECTAL 1245 4.23 5.74 9.74 9.19 10.29 1.21 83
BLADDER 1005 3.42 4.64 8.24 7.72 8.75 0.96 104
STOMACH 775 2.63 3.58 6.01 5.58 6.44 0.71 141
MELANOMA 800 2.72 3.69 5.55 5.16 5.94 0.67 150
LARYNX 622 2.11 2.87 4.71 4.33 5.08 0.60 168
NON-HODGKIN LYMPHOMA 630 2.14 2.91 4.06 3.73 4.40 0.43 234
MOUTH 441 1.50 2.03 3.19 2.89 3.49 0.39 254
OTHER SPECIFIED 413 1.40 1.91 3.02 2.72 3.31 0.36 275
LEUKAEMIA 499 1.70 2.30 2.85 2.59 3.11 0.28 362
NASO-OROPHARYNX 396 1.35 1.83 2.83 2.54 3.11 0.35 286
TONGUE 382 1.30 1.76 2.73 2.45 3.01 0.33 304
LIVER, BILE DUCT 360 1.22 1.66 2.34 2.09 2.59 0.27 369
KAPOSI SARCOMA 474 1.61 2.19 2.25 2.05 2.46 0.20 496
SKIN OTHER 286 0.97 1.32 2.02 1.78 2.26 0.20 507
CONNECTIVE TISSUE 303 1.03 1.40 1.87 1.65 2.09 0.20 508
KIDNEY 248 0.84 1.14 1.72 1.50 1.95 0.19 523
ILL DEFINED 209 0.71 0.96 1.45 1.25 1.65 0.17 578
BONE 229 0.78 1.06 1.34 1.16 1.53 0.14 733
BRAIN, CNS 232 0.79 1.07 1.24 1.07 1.40 0.11 874
MESOTHELIOMA 155 0.53 0.72 1.24 1.04 1.43 0.15 659
BREAST 142 0.48 0.66 1.06 0.88 1.24 0.12 810
PANCREAS 126 0.43 0.58 0.94 0.77 1.11 0.13 751
MYELOMA 127 0.43 0.59 0.92 0.76 1.09 0.12 867
PENIS 126 0.43 0.58 0.87 0.72 1.03 0.10 961
LIP 116 0.39 0.54 0.83 0.68 0.99 0.09 1054
SALIVARY 105 0.36 0.48 0.78 0.63 0.93 0.07 1361
HODGKIN LYMPHOMA 158 0.54 0.73 0.74 0.62 0.86 0.06 1646
EYE 142 0.48 0.66 0.73 0.60 0.85 0.05 1902
TESTIS 133 0.45 0.61 0.64 0.53 0.76 0.05 1985
THYROID 67 0.23 0.31 0.46 0.35 0.58 0.06 1543
ANUS 55 0.19 0.25 0.39 0.29 0.50 0.04 2364
INTESTINE 51 0.17 0.24 0.37 0.26 0.47 0.04 2451
GUM 38 0.13 0.18 0.31 0.21 0.41 0.04 2435
ENDOCRINE 27 0.09 0.12 0.14 0.08 0.20 0.01 10001
BURKITT LYMPHOMA 15 0.05 0.07 0.06 0.03 0.09 0.00 .
HAEMATOLOGY OTHER 2 0.01 0.01 0.02 -0.00 0.04 0.00 .
TOTAL 29428 100.00 93.05 148.87 146.75 150.99 21.04 5
SEX UNKNOWN 435
N(OBS) Number of new cases observed
% Percentage of all cancers
CRUDE Number of cases/population in 1999 per 100 000
ASR Age standardised incidence rate per 100 000 (World standard population)
95%LCL 95% Lower confi dence limit for ASR
95%UCL 95% Upper confi dence limit for ASR
CUMRISK Cumulative lifetime incidence risk (0-74 years)
LR Lifetime risk (0-74 years) of developing a cancer expressed as 1 in X number of people
Please note: Rates exclude BCC and SCC of the skin
Ranking excludes BCC, SCC of the skin, PSU and ill defi ned sites

89
SUMMARY STATISTICS OF CANCER DIAGNOSED IN 1999
ASIAN FEMALES
SITE N (OBS) N (ADJ) % CRUDE ASR 95% LCL 95% UCL CUMRISK LR
BREAST 244 258 33.99 46.38 49.62 43.58 55.66 5.67 18
PSU 74 75 9.88 13.48 14.41 11.20 17.63 1.76 57
CERVIX 56 57 7.51 10.25 11.02 8.20 13.84 1.23 81
COLORECTAL 35 35 4.61 6.29 7.31 4.87 9.75 1.01 99
UTERUS 34 35 4.61 6.29 7.13 4.76 9.50 0.95 106
OVARY 33 33 4.35 5.93 6.29 4.17 8.42 0.83 121
LUNG 25 25 3.29 4.49 5.15 3.09 7.21 0.67 150
BCC 24 25 3.29 4.49 5 3.05 6.95 0.45 223
STOMACH 24 24 3.16 4.31 4.66 2.75 6.57 0.64 157
LEUKAEMIA 23 23 3.03 4.14 4.46 2.64 6.28 0.42 239
OTHER SPECIFIED 21 21 2.77 3.78 4.19 2.36 6.02 0.64 157
NON-HODGKIN LYMPHOMA 15 15 1.98 2.7 2.9 1.41 4.39 0.34 295
MOUTH 13 13 1.71 2.34 2.8 1.30 4.29 0.35 286
SCC OF SKIN 12 12 1.58 2.16 2.43 1.03 3.83 0.24 417
OESOPHAGUS 11 11 1.45 1.98 2.3 0.98 3.62 0.25 401
THYROID 11 11 1.45 1.98 2.07 0.81 3.33 0.32 313
BLADDER 9 9 1.19 1.62 1.81 0.60 3.02 0.21 477
BONE 10 10 1.32 1.8 1.76 0.71 2.80 0.18 556
CONNECTIVE TISSUE 7 7 0.92 1.26 1.49 0.36 2.63 0.23 435
VULVA & VAGINA 8 8 1.05 1.44 1.44 0.42 2.46 0.16 626
ILL DEFINED 7 7 0.92 1.26 1.25 0.31 2.19 0.14 715
MYELOMA 4 4 0.53 0.72 0.93 0.01 1.85 0.15 667
TONGUE 5 5 0.66 0.9 0.89 0.10 1.68 0.09 1112
SKIN OTHER 5 5 0.66 0.9 0.88 0.08 1.68 0.12 834
MELANOMA 4 4 0.53 0.72 0.73 -0.00 1.46 0.05 2001
BRAIN, CNS 4 4 0.53 0.72 0.65 0.01 1.29 0.06 1667
LIVER, BILE DUCT 3 3 0.40 0.54 0.61 -0.09 1.31 0.02 5001
NASO-OROPHARYNX 3 3 0.40 0.54 0.6 -0.09 1.29 0.07 1429
MESOTHELIOMA 3 3 0.40 0.54 0.57 -0.08 1.22 0.07 1429
GUM 2 2 0.26 0.36 0.5 -0.19 1.19 0.04 2501
ANUS 3 3 0.40 0.54 0.49 -0.07 1.05 0.06 1667
SALIVARY 2 2 0.26 0.36 0.34 0.01 0.67 0.04 2501
LARYNX 2 2 0.26 0.36 0.33 -0.13 0.79 0.03 3334
ENDOCRINE 1 1 0.13 0.18 0.25 -0.24 0.74 0.04 2501
EYE 1 1 0.13 0.18 0.24 -0.23 0.71 0.01 10001
HODGKIN LYMPHOMA 1 1 0.13 0.18 0.23 -0.22 0.68 0.03 3334
PANCREAS 1 1 0.13 0.18 0.17 -0.17 0.51 0.02 5001
KAPOSI SARCOMA 1 1 0.13 0.18 . . . . .
TOTAL 741 759 100.00 129.80 143.24 132.99 153.49 15.16 7
N(OBS) Number of new cases observed
N(ADJ) Number of new cases adjusted for unknown population
% Percentage of all cancers
CRUDE Number of cases/population in 1999 per 100 000
ASR Age standardised incidence rate per 100 000 (World standard population)
95%LCL 95% Lower confi dence limit for ASR
95%UCL 95% Upper confi dence limit for ASR
CUMRISK Cumulative lifetime incidence risk (0-74 years)
LR Lifetime risk (0-74 years) of developing a cancer expressed as 1 in X number of people
Please note: Rates exclude BCC and SCC of the skin
Ranking excludes BCC, SCC of the skin, PSU and ill defi ned sites

90
SUMMARY STATISTICS OF CANCER DIAGNOSED IN 1999
ASIAN MALES
SITE N (OBS) N (ADJ) % CRUDE ASR 95% LCL 95% UCL CUMRISK LR
PROSTATE 55 59 10.85 10.89 18.34 13.65 23.03 2.57 39
COLORECTAL 53 56 10.29 10.33 14.28 10.40 18.16 1.96 51
PSU 52 52 9.56 9.59 13.42 9.74 17.11 1.68 60
LUNG 49 50 9.19 9.23 12.93 9.31 16.54 1.58 63
STOMACH 49 50 9.19 9.23 12.77 9.07 16.47 1.52 66
BLADDER 38 40 7.35 7.38 10.46 7.02 13.90 0.93 108
BCC 29 29 5.33 5.35 7.94 4.98 10.91 0.97 104
LEUKAEMIA 29 29 5.33 5.35 6.1 3.88 8.32 0.55 182
NON-HODGKIN LYMPHOMA 21 21 3.86 3.87 4.68 2.56 6.80 0.47 213
OESOPHAGUS 15 15 2.76 2.77 3.49 1.73 5.26 0.44 228
KIDNEY 11 11 2.02 2.03 2.87 1.19 4.55 0.42 239
SCC OF SKIN 9 9 1.65 1.66 2.4 0.86 3.93 0.26 385
SKIN OTHER 9 9 1.65 1.66 2.37 0.84 3.91 0.18 556
BRAIN, CNS 10 10 1.84 1.85 2.14 0.75 3.53 0.24 417
MYELOMA 6 6 1.10 1.11 1.93 0.35 3.51 0.2 501
NASO-OROPHARYNX 7 7 1.29 1.29 1.9 0.45 3.35 0.19 527
OTHER SPECIFIED 7 7 1.29 1.29 1.82 0.43 3.21 0.28 358
MOUTH 7 7 1.29 1.29 1.74 0.39 3.09 0.27 371
BREAST 7 7 1.29 1.29 1.72 0.39 3.05 0.27 371
LIVER, BILE DUCT 5 5 0.92 0.92 1.46 0.14 2.78 0.27 371
BONE 6 6 1.10 1.11 1.46 0.21 2.71 0.14 715
CONNECTIVE TISSUE 7 7 1.29 1.29 1.43 0.30 2.56 0.08 1251
ILL DEFINED 6 6 1.10 1.11 1.28 0.24 2.32 0.14 715
LARYNX 6 6 1.10 1.11 1.13 0.23 2.03 0.12 834
HODGKIN LYMPHOMA 6 6 1.10 1.11 0.96 0.19 1.73 0.08 1251
TESTIS 6 6 1.10 1.11 0.94 0.25 1.62 0.06 1667
MELANOMA 3 3 0.55 0.55 0.7 -0.13 1.53 0.09 1112
THYROID 3 3 0.55 0.55 0.62 -0.10 1.34 0.06 1667
EYE 3 3 0.55 0.55 0.61 -0.09 1.31 0.03 3334
ANUS 2 2 0.37 0.37 0.6 -0.24 1.44 0.09 1112
ENDOCRINE 2 2 0.37 0.37 0.54 -0.25 1.33 0.1 1001
INTESTINE 2 2 0.37 0.37 0.5 -0.26 1.26 0.1 1001
KAPOSI SARCOMA 3 3 0.55 0.55 0.45 -0.06 0.96 0.04 2501
TONGUE 2 2 0.37 0.37 0.38 -0.14 0.90 0.04 2501
PANCREAS 2 2 0.37 0.37 0.36 -0.14 0.86 0.03 3334
SALIVARY 2 2 0.37 0.37 0.34 -0.14 0.82 0.04 2501
LIP 1 1 0.18 0.18 0.2 -0.18 0.58 0.02 5001
GUM 1 1 0.18 0.18 0.18 -0.18 0.54 0.02 5001
MESOTHELIOMA 1 1 0.18 0.18 0.18 -0.18 0.54 0.02 5001
PENIS 1 1 0.18 0.18 0.18 -0.18 0.54 0.02 5001
TOTAL 533 544 100.00 93.36 126.81 115.32 138.30 13.84 7
SEX UNKNOWN 14 14
N(OBS) Number of new cases observed
N(ADJ) Number of new cases adjusted for unknown population
% Percentage of all cancers
CRUDE Number of cases/population in 1999 per 100 000
ASR Age standardised incidence rate per 100 000 (World standard population)
95%LCL 95% Lower confi dence limit for ASR
95%UCL 95% Upper confi dence limit for ASR
CUMRISK Cumulative lifetime incidence risk (0-74 years)
LR Lifetime risk (0-74 years) of developing a cancer expressed as 1 in X number of people
Please note: Rates exclude BCC and SCC of the skin
Ranking excludes BCC, SCC of the skin, PSU and ill defi ned sites

91
SUMMARY STATISTICS OF CANCER DIAGNOSED IN 1999
BLACK FEMALES
SITE N (OBS) N (ADJ) % CRUDE ASR 95% LCL 95% UCL CUMRISK LR
CERVIX 4127 4342 32.58 24.71 34.88 33.83 35.93 4.01 25
BREAST 2186 2307 17.31 13.13 18.39 17.62 19.15 2.04 49
PSU 858 899 6.75 5.12 7.61 7.11 8.12 0.9 112
OESOPHAGUS 735 775 5.82 4.41 6.95 6.46 7.44 0.89 113
UTERUS 477 500 3.75 2.85 4.68 4.26 5.09 0.64 157
OVARY 319 335 2.51 1.91 2.76 2.46 3.06 0.32 313
OTHER SPECIFIED 287 301 2.26 1.71 2.46 2.18 2.74 0.3 334
COLORECTAL 268 284 2.13 1.62 2.31 2.03 2.58 0.26 385
SCC OF SKIN 256 268 2.01 1.53 2.3 2.03 2.57 0.25 401
BCC 227 247 1.85 1.41 2.13 1.86 2.39 0.22 455
LUNG 219 229 1.72 1.3 1.98 1.72 2.23 0.23 435
VULVA & VAGINA 212 219 1.64 1.25 1.74 1.50 1.97 0.2 501
MELANOMA 166 174 1.31 0.99 1.55 1.32 1.78 0.19 527
NON-HODGKIN LYMPHOMA 212 216 1.62 1.23 1.53 1.31 1.74 0.15 667
KAPOSI SARCOMA 259 269 2.02 1.53 1.48 1.30 1.66 0.12 834
LEUKAEMIA 200 203 1.52 1.16 1.4 1.21 1.60 0.13 770
STOMACH 148 155 1.16 0.88 1.38 1.16 1.60 0.19 527
LIVER, BILE DUCT 139 146 1.01 0.83 1.26 1.05 1.46 0.15 667
CONNECTIVE TISSUE 142 149 1.12 0.85 1.06 0.88 1.24 0.12 834
THYROID 115 123 0.92 0.7 0.9 0.74 1.07 0.09 1112
SKIN OTHER 117 118 0.89 0.67 0.86 0.70 1.01 0.09 1112
BLADDER 97 99 0.74 0.56 0.81 0.65 0.98 0.09 1112
MYELOMA 77 84 0.63 0.48 0.74 0.58 0.90 0.09 1112
MOUTH 76 79 0.59 0.45 0.69 0.53 0.84 0.07 1429
ILL DEFINED 74 80 0.60 0.46 0.61 0.48 0.75 0.06 1667
KIDNEY 83 84 0.63 0.48 0.55 0.43 0.66 0.04 2501
LARYNX 60 60 0.45 0.34 0.54 0.40 0.68 0.07 1429
BONE 71 71 0.53 0.4 0.51 0.39 0.63 0.05 2001
EYE 83 85 0.64 0.48 0.5 0.39 0.61 0.04 2501
NASO-OROPHARYNX 58 61 0.46 0.35 0.48 0.36 0.61 0.06 1667
TONGUE 50 50 0.38 0.28 0.45 0.33 0.57 0.05 2001
PANCREAS 49 50 0.38 0.28 0.45 0.32 0.58 0.06 1667
SALIVARY 40 40 0.30 0.23 0.32 0.21 0.42 0.04 2501
HODGKIN LYMPHOMA 52 52 0.39 0.3 0.32 0.23 0.41 0.03 3334
ANUS 38 38 0.29 0.22 0.31 0.21 0.41 0.03 3334
BRAIN, CNS 48 48 0.36 0.27 0.29 0.21 0.37 0.02 5001
LIP 19 19 0.14 0.11 0.16 0.09 0.23 0.02 5001
INTESTINE 15 15 0.11 0.09 0.13 0.06 0.19 0.02 5001
MESOTHELIOMA 13 13 0.01 0.07 0.1 0.04 0.15 0.01 10001
BURKITT LYMPHOMA 16 16 0.12 0.09 0.09 0.04 0.14 0.01 10001
GUM 10 10 0.08 0.06 0.08 0.03 0.13 0.01 10001
ENDOCRINE 9 9 0.07 0.05 0.08 0.03 0.13 0.01 10001
PLACENTA 4 4 0.03 0.02 0.03 0.00 0.06 0 .
TOTAL 12711 13326 100.00 72.92 103.71 101.89 105.53 10.87 9
N(OBS) Number of new cases observed
N(ADJ) Number of new cases adjusted for unknown population
% Percentage of all cancers
CRUDE Number of cases/population in 1999 per 100 000
ASR Age standardised incidence rate per 100 000 (World standard population)
95%LCL 95% Lower confi dence limit for ASR
95%UCL 95% Upper confi dence limit for ASR
CUMRISK Cumulative lifetime incidence risk (0-74 years)
LR Lifetime risk (0-74 years) of developing a cancer expressed as 1 in X number of people
Please note: Rates exclude BCC and SCC of the skin
Ranking excludes BCC, SCC of the skin, PSU and ill defi ned sites

92
SUMMARY STATISTICS OF CANCER DIAGNOSED IN 1999
BLACK MALES
SITE N (OBS) N (ADJ) % CRUDE ASR 95% LCL 95% UCL CUMRISK LR
PROSTATE 1143 1220 12.42 7.26 17.17 16.21 18.13 1.99 50
OESOPHAGUS 1229 1279 13.03 7.61 14.13 13.34 14.93 1.71 59
PSU 968 1020 10.39 6.07 10.74 10.06 11.42 1.29 77
LUNG 797 842 8.58 5.01 9.28 8.64 9.91 1.15 87
LARYNX 337 360 3.67 2.14 4.09 3.66 4.52 0.52 193
SCC OF SKIN 285 302 3.08 1.8 3.31 2.93 3.70 0.4 251
BCC 260 278 2.83 1.65 3.23 2.83 3.62 0.35 286
COLORECTAL 278 301 3.07 1.79 2.96 2.60 3.31 0.35 286
STOMACH 247 261 2.66 1.55 2.84 2.49 3.20 0.33 304
KAPOSI SARCOMA 402 427 4.35 2.54 2.82 2.54 3.11 0.26 385
MOUTH 251 259 2.64 1.54 2.76 2.42 3.11 0.35 286
NASO-OROPHARYNX 240 251 2.56 1.49 2.65 2.30 2.99 0.32 313
LIVER, BILE DUCT 257 279 2.84 1.66 2.57 2.25 2.89 0.29 345
OTHER SPECIFIED 212 223 2.27 1.33 2.32 2.00 2.64 0.29 345
NON-HODGKIN LYMPHOMA 262 273 2.78 1.62 2.22 1.93 2.50 0.22 455
TONGUE 196 203 2.07 1.21 2.21 1.90 2.52 0.26 385
LEUKAEMIA 278 281 2.86 1.67 2.03 1.78 2.28 0.2 501
BLADDER 123 130 1.32 0.77 1.52 1.25 1.79 0.19 527
CONNECTIVE TISSUE 172 183 1.86 1.09 1.45 1.22 1.67 0.15 667
ILL DEFINED 124 133 1.35 0.79 1.34 1.10 1.57 0.15 667
MELANOMA 114 121 1.23 0.72 1.32 1.09 1.56 0.15 667
SKIN OTHER 120 124 1.26 0.74 1.16 0.94 1.38 0.1 1001
BONE 138 139 1.42 0.83 1.1 0.91 1.30 0.1 1001
BREAST 75 79 0.80 0.47 0.9 0.69 1.11 0.1 1001
MYELOMA 81 83 0.85 0.49 0.85 0.66 1.04 0.1 1001
KIDNEY 92 96 0.98 0.57 0.8 0.62 0.98 0.08 1251
PENIS 78 78 0.79 0.46 0.77 0.59 0.95 0.09 1112
EYE 101 102 1.04 0.61 0.64 0.51 0.76 0.05 2001
HODGKIN LYMPHOMA 94 94 0.96 0.56 0.57 0.44 0.69 0.04 2501
SALIVARY 52 52 0.53 0.31 0.55 0.40 0.70 0.05 2001
MESOTHELIOMA 50 53 0.54 0.32 0.54 0.39 0.69 0.06 1667
BRAIN, CNS 80 82 0.84 0.49 0.52 0.40 0.64 0.04 2501
PANCREAS 48 49 0.50 0.29 0.49 0.35 0.63 0.07 1429
THYROID 27 27 0.28 0.16 0.27 0.17 0.38 0.03 3334
ANUS 27 27 0.28 0.16 0.26 0.16 0.36 0.03 3334
GUM 20 20 0.20 0.12 0.23 0.12 0.34 0.03 3334
TESTIS 31 31 0.32 0.18 0.22 0.13 0.31 0.02 5001
INTESTINE 19 19 0.19 0.11 0.19 0.10 0.28 0.02 5001
LIP 16 16 0.16 0.1 0.16 0.08 0.24 0.02 5001
ENDOCRINE 12 12 0.12 0.07 0.07 0.03 0.11 0 .
BURKITT LYMPHOMA 9 9 0.09 0.05 0.05 0.02 0.08 0 .
HAEMATOLOGY OTHER 1 1 0.01 0.01 0.01 -0.01 0.03 0 .
TOTAL 9346 9819 100.00 54.99 97.11 95.05 99.17 10.22 10
UNKNOWN SEX 239 251
N(OBS) Number of new cases observed
N(ADJ) Number of new cases adjusted for unknown population
% Percentage of all cancers
CRUDE Number of cases/population in 1999 per 100 000
ASR Age standardised incidence rate per 100 000 (World standard population)
95%LCL 95% Lower confi dence limit for ASR
95%UCL 95% Upper confi dence limit for ASR
CUMRISK Cumulative lifetime incidence risk (0-74 years)
LR Lifetime risk (0-74 years) of developing a cancer expressed as 1 in X number of people
Please note: Rates exclude BCC and SCC of the skin
Ranking excludes BCC, SCC of the skin, PSU and ill defi ned sites

93
SUMMARY STATISTICS OF CANCER DIAGNOSED IN 1999
COLOURED FEMALES
SITE N (OBS) N (ADJ) % CRUDE ASR 95% LCL 95% UCL CUMRISK LR
BREAST 691 730 25.01 37.35 49.77 46.12 53.42 5.63 18
CERVIX 390 411 14.08 21.03 26.35 23.76 28.95 2.94 34
BCC 292 318 10.89 16.27 22.45 19.98 24.93 2.51 40
PSU 200 208 7.13 10.64 15.25 13.20 17.29 1.94 52
COLORECTAL 125 132 4.52 6.75 9.66 8.00 11.33 1.12 89
LUNG 124 129 4.42 6.6 9.65 8.01 11.29 1.31 76
SCC OF SKIN 97 101 3.46 5.17 7.19 5.80 8.58 0.78 129
UTERUS 80 83 2.84 4.25 6.61 5.18 8.03 0.94 107
STOMACH 78 82 2.81 4.2 6.03 4.73 7.34 0.64 157
OVARY 83 85 2.91 4.35 5.66 4.45 6.88 0.63 159
OESOPHAGUS 43 44 1.51 2.25 3.6 2.54 4.67 0.49 205
NON-HODGKIN LYMPHOMA 56 56 1.92 2.87 3.58 2.63 4.53 0.33 304
MELANOMA 51 52 1.78 2.66 3.24 2.34 4.13 0.26 385
OTHER SPECIFIED 44 44 1.51 2.25 2.98 2.08 3.88 0.35 286
BLADDER 39 39 1.34 2 2.78 1.93 3.64 0.27 371
LARYNX 27 27 0.93 1.38 2.02 1.28 2.76 0.25 401
VULVA & VAGINA 30 30 1.03 1.53 2.02 1.28 2.75 0.26 385
LEUKAEMIA 31 31 1.06 1.59 1.84 1.17 2.51 0.17 589
BRAIN, CNS 30 30 1.03 1.53 1.74 1.01 2.38 0.16 626
CONNECTIVE TISSUE 25 25 0.86 1.28 1.61 0.99 2.23 0.17 589
TONGUE 22 22 0.75 1.13 1.53 0.87 2.19 0.19 527
THYROID 26 26 0.89 1.33 1.51 0.91 2.10 0.16 626
KIDNEY 24 24 0.82 1.23 1.45 0.85 2.05 0.13 770
MOUTH 19 19 0.65 0.97 1.44 0.80 2.08 0.19 527
BONE 19 19 0.65 0.97 1.16 0.64 1.68 0.1 1001
MYELOMA 15 15 0.51 0.77 1.14 0.55 1.73 0.15 667
SKIN OTHER 15 15 0.51 0.77 1.02 0.49 1.55 0.08 1251
ILL DEFINED 16 16 0.55 0.82 0.98 0.49 1.47 0.12 834
NASO-OROPHARYNX 16 16 0.55 0.82 0.95 0.48 1.42 0.09 1112
LIVER, BILE DUCT 13 13 0.45 0.67 0.85 0.38 1.32 0.07 1429
PLACENTA 9 9 0.31 0.46 0.66 0.25 1.08 0.07 1429
MESOTHELIOMA 10 10 0.34 0.51 0.63 0.22 1.04 0.06 1667
HODGKIN LYMPHOMA 12 12 0.41 0.61 0.63 0.28 0.99 0.05 2001
PANCREAS 7 7 0.24 0.36 0.52 0.13 0.91 0.06 1667
ENDOCRINE 8 8 0.27 0.41 0.51 0.19 0.82 0.05 2001
ANUS 7 7 0.24 0.36 0.44 0.13 0.75 0.05 2001
INTESTINE 5 5 0.17 0.26 0.41 0.05 0.77 0.06 1667
LIP 6 6 0.21 0.31 0.36 0.07 0.65 0.03 3334
KAPOSI SARCOMA 5 5 0.17 0.26 0.32 0.02 0.62 0.04 2501
GUM 4 4 0.14 0.2 0.27 0.00 0.54 0.02 5001
SALIVARY 2 2 0.07 0.1 0.13 -0.06 0.32 0.01 10001
EYE 1 1 0.03 0.05 0.04 -0.03 0.11 0 .
BURKITT LYMPHOMA 1 1 0.03 0.05 0.04 -0.03 0.11 0 .
TOTAL 2798 2919 100.00 127.91 171.04 164.26 177.82 17.39 6
N(OBS) Number of new cases observed
N(ADJ) Number of new cases adjusted for unknown population
% Percentage of all cancers
CRUDE Number of cases/population in 1999 per 100 000
ASR Age standardised incidence rate per 100 000 (World standard population)
95%LCL 95% Lower confi dence limit for ASR
95%UCL 95% Upper confi dence limit for ASR
CUMRISK Cumulative lifetime incidence risk (0-74 years)
LR Lifetime risk (0-74 years) of developing a cancer expressed as 1 in X number of people
Please note: Rates exclude BCC and SCC of the skin
Ranking excludes BCC, SCC of the skin, PSU and ill defi ned sites
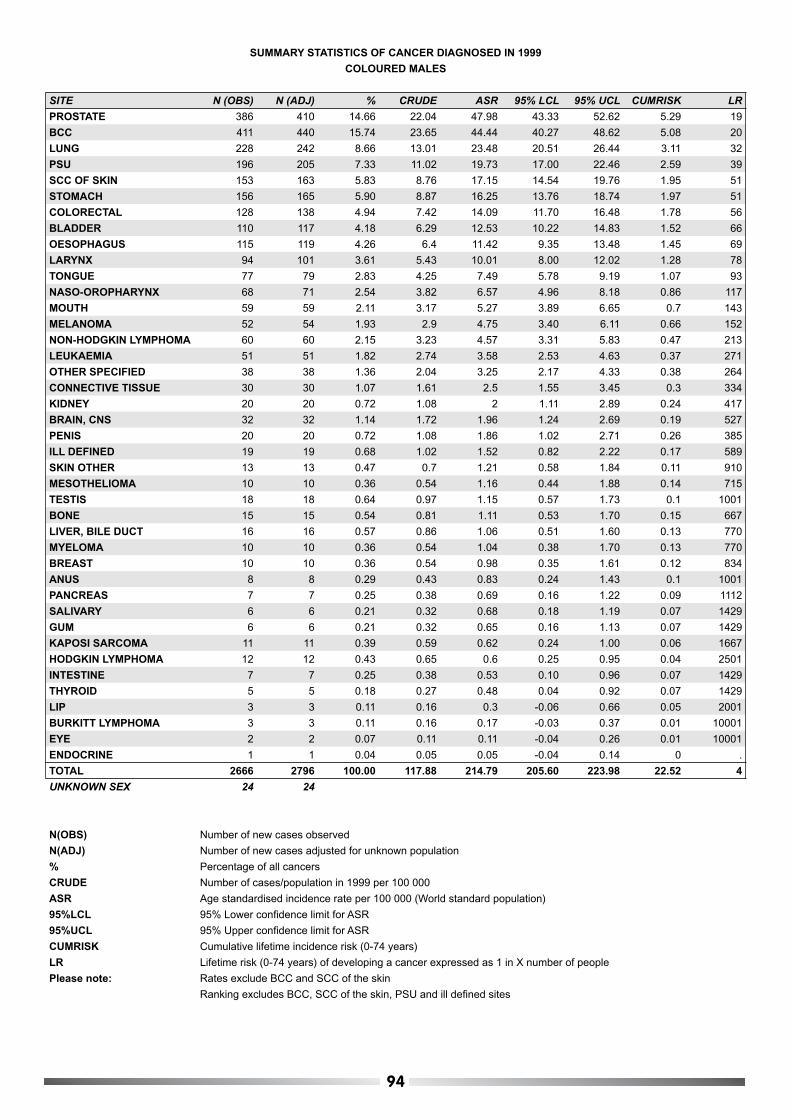
94
SUMMARY STATISTICS OF CANCER DIAGNOSED IN 1999
COLOURED MALES
SITE N (OBS) N (ADJ) % CRUDE ASR 95% LCL 95% UCL CUMRISK LR
PROSTATE 386 410 14.66 22.04 47.98 43.33 52.62 5.29 19
BCC 411 440 15.74 23.65 44.44 40.27 48.62 5.08 20
LUNG 228 242 8.66 13.01 23.48 20.51 26.44 3.11 32
PSU 196 205 7.33 11.02 19.73 17.00 22.46 2.59 39
SCC OF SKIN 153 163 5.83 8.76 17.15 14.54 19.76 1.95 51
STOMACH 156 165 5.90 8.87 16.25 13.76 18.74 1.97 51
COLORECTAL 128 138 4.94 7.42 14.09 11.70 16.48 1.78 56
BLADDER 110 117 4.18 6.29 12.53 10.22 14.83 1.52 66
OESOPHAGUS 115 119 4.26 6.4 11.42 9.35 13.48 1.45 69
LARYNX 94 101 3.61 5.43 10.01 8.00 12.02 1.28 78
TONGUE 77 79 2.83 4.25 7.49 5.78 9.19 1.07 93
NASO-OROPHARYNX 68 71 2.54 3.82 6.57 4.96 8.18 0.86 117
MOUTH 59 59 2.11 3.17 5.27 3.89 6.65 0.7 143
MELANOMA 52 54 1.93 2.9 4.75 3.40 6.11 0.66 152
NON-HODGKIN LYMPHOMA 60 60 2.15 3.23 4.57 3.31 5.83 0.47 213
LEUKAEMIA 51 51 1.82 2.74 3.58 2.53 4.63 0.37 271
OTHER SPECIFIED 38 38 1.36 2.04 3.25 2.17 4.33 0.38 264
CONNECTIVE TISSUE 30 30 1.07 1.61 2.5 1.55 3.45 0.3 334
KIDNEY 20 20 0.72 1.08 2 1.11 2.89 0.24 417
BRAIN, CNS 32 32 1.14 1.72 1.96 1.24 2.69 0.19 527
PENIS 20 20 0.72 1.08 1.86 1.02 2.71 0.26 385
ILL DEFINED 19 19 0.68 1.02 1.52 0.82 2.22 0.17 589
SKIN OTHER 13 13 0.47 0.7 1.21 0.58 1.84 0.11 910
MESOTHELIOMA 10 10 0.36 0.54 1.16 0.44 1.88 0.14 715
TESTIS 18 18 0.64 0.97 1.15 0.57 1.73 0.1 1001
BONE 15 15 0.54 0.81 1.11 0.53 1.70 0.15 667
LIVER, BILE DUCT 16 16 0.57 0.86 1.06 0.51 1.60 0.13 770
MYELOMA 10 10 0.36 0.54 1.04 0.38 1.70 0.13 770
BREAST 10 10 0.36 0.54 0.98 0.35 1.61 0.12 834
ANUS 8 8 0.29 0.43 0.83 0.24 1.43 0.1 1001
PANCREAS 7 7 0.25 0.38 0.69 0.16 1.22 0.09 1112
SALIVARY 6 6 0.21 0.32 0.68 0.18 1.19 0.07 1429
GUM 6 6 0.21 0.32 0.65 0.16 1.13 0.07 1429
KAPOSI SARCOMA 11 11 0.39 0.59 0.62 0.24 1.00 0.06 1667
HODGKIN LYMPHOMA 12 12 0.43 0.65 0.6 0.25 0.95 0.04 2501
INTESTINE 7 7 0.25 0.38 0.53 0.10 0.96 0.07 1429
THYROID 5 5 0.18 0.27 0.48 0.04 0.92 0.07 1429
LIP 3 3 0.11 0.16 0.3 -0.06 0.66 0.05 2001
BURKITT LYMPHOMA 3 3 0.11 0.16 0.17 -0.03 0.37 0.01 10001
EYE 2 2 0.07 0.11 0.11 -0.04 0.26 0.01 10001
ENDOCRINE 1 1 0.04 0.05 0.05 -0.04 0.14 0 .
TOTAL 2666 2796 100.00 117.88 214.79 205.60 223.98 22.52 4
UNKNOWN SEX 24 24
N(OBS) Number of new cases observed
N(ADJ) Number of new cases adjusted for unknown population
% Percentage of all cancers
CRUDE Number of cases/population in 1999 per 100 000
ASR Age standardised incidence rate per 100 000 (World standard population)
95%LCL 95% Lower confi dence limit for ASR
95%UCL 95% Upper confi dence limit for ASR
CUMRISK Cumulative lifetime incidence risk (0-74 years)
LR Lifetime risk (0-74 years) of developing a cancer expressed as 1 in X number of people
Please note: Rates exclude BCC and SCC of the skin
Ranking excludes BCC, SCC of the skin, PSU and ill defi ned sites

95
SUMMARY STATISTICS OF CANCER DIAGNOSED IN 1999
WHITE FEMALES
SITE N (OBS) N (ADJ) % CRUDE ASR 95% LCL 95% UCL CUMRISK LR
BCC 3984 4334 32.52 170.21 120.03 116.42 123.64 12.49 8
BREAST 2468 2606 19.56 102.35 76.46 73.50 79.42 8.33 12
SCC OF SKIN 1056 1110 8.33 43.59 27.34 25.72 28.96 3 33
PSU 652 684 5.13 26.86 19.52 18.04 21.00 2.44 41
COLORECTAL 631 668 5.01 26.23 17.52 16.16 18.88 2.07 48
MELANOMA 513 542 4.07 21.29 16.73 15.31 18.15 1.64 61
CERVIX 371 391 2.93 15.36 12.04 10.85 13.24 1.23 81
OVARY 325 341 2.56 13.39 10.07 9.00 11.13 1.21 82
LUNG 325 338 2.54 13.27 9.65 8.60 10.69 1.25 80
NON-HODGKIN LYMPHOMA 247 253 1.90 9.94 7.14 6.24 8.05 0.9 112
BLADDER 231 242 1.82 9.5 6.28 5.46 7.11 0.8 126
UTERUS 181 189 1.42 7.42 5.43 4.64 6.22 0.7 143
OTHER SPECIFIED 168 175 1.31 6.87 5.04 4.27 5.81 0.58 173
STOMACH 168 177 1.33 6.95 4.77 4.04 5.49 0.58 173
THYROID 123 131 0.98 5.14 4.24 3.50 4.98 0.36 278
LEUKAEMIA 91 91 0.68 3.57 3.08 2.42 3.73 0.31 323
SKIN OTHER 96 98 0.74 3.85 2.63 2.11 3.16 0.3 334
VULVA & VAGINA 90 91 0.68 3.57 2.56 2.02 3.09 0.27 371
CONNECTIVE TISSUE 74 74 0.56 2.91 2.37 1.82 2.91 0.23 435
BRAIN, CNS 63 63 0.47 2.47 2.23 1.66 2.80 0.2 501
KIDNEY 70 70 0.53 2.75 2.10 1.56 2.64 0.23 435
OESOPHAGUS 71 74 0.56 2.91 2.02 1.56 2.49 0.25 401
BONE 52 52 0.39 2.04 1.90 1.37 2.43 0.15 667
HODGKIN LYMPHOMA 44 44 0.33 1.73 1.72 1.20 2.24 0.12 834
MOUTH 51 53 0.40 2.08 1.52 1.10 1.94 0.19 527
TONGUE 53 53 0.40 2.08 1.51 1.09 1.92 0.18 556
PANCREAS 46 48 0.36 1.89 1.51 1.09 1.93 0.2 501
ILL DEFINED 46 48 0.36 1.89 1.44 1.02 1.87 0.16 626
LIVER, BILE DUCT 47 48 0.36 1.89 1.33 0.93 1.72 0.15 667
LARYNX 32 32 0.24 1.26 0.96 0.62 1.30 0.13 770
SALIVARY 25 25 0.19 0.98 0.74 0.44 1.04 0.09 1112
INTESTINE 26 26 0.20 1.02 0.74 0.45 1.03 0.09 1112
MYELOMA 24 25 0.19 0.98 0.68 0.41 0.95 0.08 1251
MESOTHELIOMA 22 22 0.17 0.86 0.67 0.38 0.96 0.08 1251
NASO-OROPHARYNX 21 21 0.16 0.82 0.66 0.37 0.95 0.06 1667
LIP 24 25 0.19 0.98 0.64 0.39 0.90 0.08 1251
ANUS 24 24 0.18 0.94 0.63 0.37 0.89 0.07 1429
ENDOCRINE 10 10 0.08 0.39 0.35 0.12 0.58 0.03 3334
EYE 8 8 0.06 0.31 0.29 0.08 0.49 0.02 5001
BURKITT LYMPHOMA 7 7 0.05 0.27 0.24 0.05 0.43 0.02 5001
KAPOSI SARCOMA 6 6 0.05 0.24 0.19 0.04 0.34 0.01 10001
GUM 5 5 0.04 0.2 0.16 0.02 0.30 0.02 5001
HAEMATOLOGY OTHER 2 2 0.02 0.08 0.05 -0.02 0.12 0 .
TOTAL 12573 13326 100.00 309.55 230.46 225.31 235.61 22.38 5
N(OBS) Number of new cases observed
N(ADJ) Number of new cases adjusted for unknown population
% Percentage of all cancers
CRUDE Number of cases/population in 1999 per 100 000
ASR Age standardised incidence rate per 100 000 (World standard population)
95%LCL 95% Lower confi dence limit for ASR
95%UCL 95% Upper confi dence limit for ASR
CUMRISK Cumulative lifetime incidence risk (0-74 years)
LR Lifetime risk (0-74 years) of developing a cancer expressed as 1 in X number of people
Please note: Rates exclude BCC and SCC of the skin
Ranking excludes BCC, SCC of the skin, PSU and ill defi ned sites

96
SUMMARY STATISTICS OF CANCER DIAGNOSED IN 1999
WHITE MALES
SITE N (OBS) N (ADJ) % CRUDE ASR 95% LCL 95% UCL CUMRISK LR
BCC 5918 6335 39.26 256.62 210.42 205.38 215.47 21.46 5
PROSTATE 2034 2169 13.44 87.86 74.38 71.25 77.52 9.56 10
SCC OF SKIN 1600 1702 10.55 68.95 56.19 53.58 58.80 6.35 16
COLORECTAL 701 752 4.66 30.46 25.44 23.64 27.23 3.22 31
BLADDER 664 713 4.42 28.88 23.69 21.95 25.42 2.85 35
MELANOMA 578 619 3.84 25.07 20.94 19.33 22.55 2.32 43
LUNG 572 604 3.74 24.47 20.74 19.11 22.38 2.68 37
PSU 575 605 3.75 24.51 20.63 18.99 22.26 2.56 39
STOMACH 279 294 1.82 11.91 9.81 8.69 10.93 1.16 86
NON-HODGKIN LYMPHOMA 260 272 1.69 11.02 9.37 8.24 10.50 1.01 99
LEUKAEMIA 132 132 0.82 5.35 5.2 4.29 6.11 0.46 218
LARYNX 143 153 0.95 6.2 5.15 4.34 5.96 0.65 154
OTHER SPECIFIED 136 142 0.88 5.75 4.8 4.01 5.58 0.56 179
SKIN OTHER 129 135 0.84 5.47 4.53 3.77 5.29 0.5 201
KIDNEY 113 119 0.74 4.82 4.23 3.45 5.01 0.45 223
OESOPHAGUS 118 125 0.77 5.06 4.21 3.50 4.92 0.53 189
MOUTH 111 113 0.70 4.58 3.77 3.08 4.46 0.46 218
BRAIN, CNS 100 100 0.62 4.05 3.77 3.02 4.52 0.33 304
LIP 93 93 0.58 3.77 3.13 2.51 3.76 0.36 278
TONGUE 94 95 0.59 3.85 3.12 2.50 3.74 0.35 286
MESOTHELIOMA 85 91 0.56 3.69 3.07 2.44 3.70 0.41 244
CONNECTIVE TISSUE 75 79 0.49 3.2 2.74 2.14 3.35 0.29 345
TESTIS 71 74 0.46 3 2.55 1.96 3.14 0.2 501
BONE 63 63 0.39 2.55 2.35 1.76 2.94 0.22 455
PANCREAS 63 65 0.40 2.63 2.24 1.70 2.78 0.32 313
NASO-OROPHARYNX 62 64 0.40 2.59 2.2 1.68 2.73 0.29 345
LIVER, BILE DUCT 51 54 0.33 2.19 1.91 1.40 2.42 0.22 455
ILL DEFINED 46 48 0.30 1.94 1.69 1.24 2.15 0.22 455
HODGKIN LYMPHOMA 42 42 0.26 1.7 1.54 1.07 2.01 0.14 715
SALIVARY 43 43 0.27 1.74 1.48 1.03 1.93 0.15 667
BREAST 42 43 0.27 1.74 1.43 1.01 1.86 0.17 589
EYE 32 32 0.20 1.3 1.15 0.75 1.54 0.09 1112
THYROID 29 29 0.18 1.17 1 0.64 1.35 0.13 770
KAPOSI SARCOMA 28 28 0.17 1.13 0.92 0.59 1.24 0.09 1112
MYELOMA 26 26 0.16 1.05 0.88 0.55 1.20 0.11 910
PENIS 24 24 0.15 0.97 0.82 0.51 1.13 0.1 1001
INTESTINE 21 21 0.13 0.85 0.72 0.41 1.03 0.08 1251
ANUS 15 15 0.09 0.61 0.49 0.24 0.74 0.05 2001
ENDOCRINE 12 12 0.07 0.49 0.49 0.20 0.78 0.04 2501
GUM 9 9 0.06 0.36 0.32 0.11 0.53 0.04 2501
BURKITT LYMPHOMA 3 3 0.02 0.12 0.14 -0.02 0.30 0.01 10001
HAEMATOLOGY OTHER 1 1 0.01 0.04 0.03 -0.03 0.09 . .
TOTAL 15193 16138 100.00 328.16 277.13 271.11 283.15 28.18 4
UNKNOWN SEX 125 130
N(OBS) Number of new cases observed
N(ADJ) Number of new cases adjusted for unknown population
% Percentage of all cancers
CRUDE Number of cases/population in 1999 per 100 000
ASR Age standardised incidence rate per 100 000 (World standard population)
95%LCL 95% Lower confi dence limit for ASR
95%UCL 95% Upper confi dence limit for ASR
CUMRISK Cumulative lifetime incidence risk (0-74 years)
LR Lifetime risk (0-74 years) of developing a cancer expressed as 1 in X number of people
Please note: Rates exclude BCC and SCC of the skin
Ranking excludes BCC, SCC of the skin, PSU and ill defi ned sites