University of Birmingham The effect of gas turbine ...
43
University of Birmingham The effect of gas turbine lubricant base oil molecular structure on friction Airey, Jake; Spencer, Matthew; Greenwood, Richard; Simmons, Mark DOI: 10.1016/j.triboint.2019.106052 License: Creative Commons: Attribution-NonCommercial-NoDerivs (CC BY-NC-ND) Document Version Peer reviewed version Citation for published version (Harvard): Airey, J, Spencer, M, Greenwood, R & Simmons, M 2019, 'The effect of gas turbine lubricant base oil molecular structure on friction', Tribology International. https://doi.org/10.1016/j.triboint.2019.106052 Link to publication on Research at Birmingham portal Publisher Rights Statement: © Elsevier 2019, all rights reserved. This manuscript version is made available under the CC-BY-NC-ND license. https://doi.org/10.1016/j.triboint.2019.106052 General rights Unless a licence is specified above, all rights (including copyright and moral rights) in this document are retained by the authors and/or the copyright holders. The express permission of the copyright holder must be obtained for any use of this material other than for purposes permitted by law. • Users may freely distribute the URL that is used to identify this publication. • Users may download and/or print one copy of the publication from the University of Birmingham research portal for the purpose of private study or non-commercial research. • User may use extracts from the document in line with the concept of ‘fair dealing’ under the Copyright, Designs and Patents Act 1988 (?) • Users may not further distribute the material nor use it for the purposes of commercial gain. Where a licence is displayed above, please note the terms and conditions of the licence govern your use of this document. When citing, please reference the published version. Take down policy While the University of Birmingham exercises care and attention in making items available there are rare occasions when an item has been uploaded in error or has been deemed to be commercially or otherwise sensitive. If you believe that this is the case for this document, please contact [email protected] providing details and we will remove access to the work immediately and investigate. Download date: 08. Dec. 2021
Transcript of University of Birmingham The effect of gas turbine ...

University of Birmingham
The effect of gas turbine lubricant base oilmolecular structure on frictionAirey, Jake; Spencer, Matthew; Greenwood, Richard; Simmons, Mark
DOI:10.1016/j.triboint.2019.106052
License:Creative Commons: Attribution-NonCommercial-NoDerivs (CC BY-NC-ND)
Document VersionPeer reviewed version
Citation for published version (Harvard):Airey, J, Spencer, M, Greenwood, R & Simmons, M 2019, 'The effect of gas turbine lubricant base oil molecularstructure on friction', Tribology International. https://doi.org/10.1016/j.triboint.2019.106052
Link to publication on Research at Birmingham portal
Publisher Rights Statement:© Elsevier 2019, all rights reserved. This manuscript version is made available under the CC-BY-NC-ND license.https://doi.org/10.1016/j.triboint.2019.106052
General rightsUnless a licence is specified above, all rights (including copyright and moral rights) in this document are retained by the authors and/or thecopyright holders. The express permission of the copyright holder must be obtained for any use of this material other than for purposespermitted by law.
•Users may freely distribute the URL that is used to identify this publication.•Users may download and/or print one copy of the publication from the University of Birmingham research portal for the purpose of privatestudy or non-commercial research.•User may use extracts from the document in line with the concept of ‘fair dealing’ under the Copyright, Designs and Patents Act 1988 (?)•Users may not further distribute the material nor use it for the purposes of commercial gain.
Where a licence is displayed above, please note the terms and conditions of the licence govern your use of this document.
When citing, please reference the published version.
Take down policyWhile the University of Birmingham exercises care and attention in making items available there are rare occasions when an item has beenuploaded in error or has been deemed to be commercially or otherwise sensitive.
If you believe that this is the case for this document, please contact [email protected] providing details and we will remove access tothe work immediately and investigate.
Download date: 08. Dec. 2021

1
The Effect of Gas Turbine Lubricant Base Oil Molecular Structure on Friction Jake Aireya, b, Matt Spencera, Mark Simmonsb, Richard W. Greenwoodb Mark J.H. Simmonsb
a Rolls-Royce plc, PO Box 31, Derby, DE24 8BJ, UK
b School of Chemical Engineering, University of Birmingham, Edgbaston, B15 2TT
University Email: [email protected] Rolls-Royce Email: [email protected]
1 ABSTRACT
The tribological behaviour of lLubricant base oils used in aviation gas turbine engines wasere
evaluated on their tribological behaviour to further understanding ofn how the molecular structure
of the group V polyol ester base oils influence friction. The frictional properties of the oils were
investigated using a Mini-Traction Machine (MTM) to produce Stribeck curves over the range of to
evaluate their performance across the range of lubrication regimes relevant to seen throughout a
gas turbine oil system. Whilst the viscosity of the lubricant plays an important role in governing the
tribological characteristics, the base oils were also examined independent of viscosity to reveal the
impact of the base oil molecular structure on friction. The effect of two molecular variables on the
measured traction coefficient were explored; the effect of chain length of the protruding alkyl chains
and the number of ester groups in the polyol ester. It was shown that friction decreases as the chain
length increases and as the number of ester groups increases (from neopentyl glycol (NPG) based
ester to trimethylol propane (TMP) based ester to mono-pentaerythritol (MONOPE) based esters).
The decrease in traction coefficient as the chain lengthsize increases was attributed to improved
packing efficiency and that larger chains can separate surfaces better since they take up more space
thus providing improved support. In addition, These findingsthis testing wereas further explored by
testing obtaining Stribeck curves for fully formulated gas turbine lubricants with different base oils,
but the same additive package. The results showed a reversal in the trend showing friction
increased as the number of ester groups in the polyol ester increased. The variable responsible was
the increased the amount of molecular branching giving rise to increased friction due to more
bulkier molecules hindering packing efficiency by interfering with neighbouring molecular layers.
Comment [MS1]: initials?
Comment [MS2]: The professor goes at the end!
Comment [MS3]: So why is not a valid explanation for the base oil stock alone?

2
2 INTRODUCTION
The formulation of a lubricant requires a careful balance of different chemistries to tailor the
lubricant to a specific environment thus ensuring optimal performance. The oil system of an
aerospace gas turbine engine presents highly challenging conditions for a lubricant, which requires a
sufficiently low pour point that it is still able to flow on start up in a cold climate at -40 C, and also
possess the chemical stability to resist degradation during take-off when the engine is at full thrust
with bulk oil temperatures over 200 C (1). There are many other requirements in which additives
are needed to boost capability in other areas and these additives include anti-wear additives, anti-
foamants, corrosion inhibitors, metal deactivators and anti-oxidants (2). However, the largest
proportion of the formulation of a gas turbine lubricant is the base oil; approximately 95% of the
total. Hence the base oil governs most of the lubricant’s physical characteristics of the lubricant and
is the focus of this study.
In most mechanical systems, low friction is desired to improve machine efficiency and limit
component wear. It has been highlighted in many industries that frictional losses are a major source
of energy loss and understanding of tribology can be implemented to conserve energy and therefore
efficiency (3). This is especially relevant within a gas turbine oil system where it is vital that the oil
lubricates the many different components such as bearings and gears to prolong the component life
and ensure the safe operation of the engine. Advances in gas turbine technology has resulted in an
increase in engine oil temperature as gas turbines run hotter to increase power and efficiency. This
is due to the Brayton cycle which shows thermodynamically that the power and gas turbine
efficiency is proportional pressure ratio, therefore by increasing the compression ratio, this increases
engine temperatures as expected from the ideal gas law (1).
Consequently, aviation lubricant technology has evolved to cope with the rise in oil system
temperatures. Specifically, the type of base oil has moved away from crude oil derived mineral oils
that were unstable at high temperatures resulting in excessive volatility and degradation and onto
entirely synthetic polyol esters (2,4). Base oils are categorized by the American Petroleum institute
(API) and are used in many lubricant specifications worldwide (5). The base oil categories are:
Group I – Mineral oil-based containing <90 % saturates and/ or >0.03 % sulphur with a
viscosity index ≥80 and <120.
Group II – Mineral oil-based containing ≥90 % saturates and/ or ≤0.03 % sulphur with a
viscosity index ≥80 and <120.
Comment [MS4]: Thermodynamics –mention here.
Comment [MS5]: Is this important or not, given the context of this study?
Comment [AJ(6]: Maybe not, just justifying use of polyols over mineral
Comment [AJ(7]:

3
Group III – Mineral oil-based containing ≥90 % saturates and/ or ≤0.03 % sulphur with a
viscosity index ≥80 and ≥120.
Group IV – Polyalphaolefin (PAO) base oils.
Group V – All other synthetic base stocks not included in the other groups. Therefore,
aviation polyol esters are part of this group.
Research on how the molecular structure of the latest generation of aviation base oils influences
friction is limited and inconclusive due to difficulty in acquiring base oils with a specific molecular
chemistry. This is because standard production produces base oils containing mixture of chain
lengths which would require a costly separation process. However, a mixture of chain lengths is
beneficial as it lowers the pour point giving enhanced lower temperature capabilities as. A a mixture
of molecule sizes hinders the close packing necessary for freezing to occur at low temperatures.
Previous research in this area has mostly been done with base oils containing a mixture of molecules
therefore resulting in generally assumed conclusions, especially as it is not always possible to
reproduce a base oil mixture exactly. Conversely, base oils with a mixture of chain lengths are more
relevant to lubricants used in real applications and hence, trends drawn from simplified single
molecule compounds have to be balanced with understanding how mixtures of different size base oil
molecules synergistically affect friction (6).
Previous trends in the effect of base oil types on friction have been reviewed. It is well known that a
higher kinematic viscosity results in higher elastohydrodynamic (EHD) friction due to the higher
viscosity fluid having more resistance to shear (2,7). However, this research focuses on the effect of
molecular chemistry on friction when the effect of viscosity is removed by testing the oils at the
same viscosity by varying the test temperature for each oil.
Most papers evaluating base oils relate the molecular characteristics to EHD friction as this is the
regime where additives have little influence and the properties of the base oil dominate. It is also
useful to understand how various fluids behave in high speed conditions (6,8–16). Conversely, there
has also been extensive work looking at how the molecular structure of fatty acid friction modifier
(FAFM) additives affect friction too, but this is mostly for the boundary regime as they are added as
boundary additives to reduce boundary and mixed friction beyond the capabilities of low viscosity
grade oils (3,17). Consequently, by considering the effect of base oil propertiess in the EHD regime
and FAFM in the boundary regime, these trends provide a useful insight into the expected behaviour
of polyol base oils across a range of lubrication regimes.
FAFM are believed to readily adsorb on to a surface either via dipole interactions (Frewing 1942 and
1944) or via hydrogen bonding interaction (Beltzer et al 1986 and 1988)(18–23). Friction trends for
Comment [MS8]: NOT really needed then? Unless you refer to them later (which you do..) So I guess it is!
Comment [MS9]: Which are?
Comment [MS10]: Not answered here. References needed at end of sentence.

4
FAFM are well documented and it has been shown that friction decreases as chain length increases
(24,25), in unsaturated chains, trans isomers give rise to lower friction than cis isomer due to
straighter chains (26) and that polarity is also a dominant factorr too (18,19). It has also been
demonstrated that branching leads to higher friction due to creating an irregular profile of molecular
repulsion and deep interaction zone that gives rise to high friction and has weak cohesive forces
between adjacent chains in the monolayer resulting in increased vulnerability to shear (18–22,26).
Consequently, some of the trends seen with friction modifiers may be synonymous to polyol ester
base oils, however due to the difference in structure, location of the polar functional group in the
molecule and the difference in reactivity between a carboxylic acid and an ester group, care needs to
be taken in how transferrable these trends are. Polyol esters associate with metal surfaces due to
their polarity as well and increasing chain length and decreasing branching also decreases boundary
friction. However, the shielding from attached carbon chains around the ester group will result in a
decrease in their surface activity and could hinder monolayer formation leading to a decrease in the
applicability of the branching trend seen with FAFMs (27).
Contrariwise, there has been a wide range of research investigating base oils, but this mostly related
to EHD performance. Tsubouchi proposed five molecular properties that are likely to increase
friction in traction fluids (28). The first is high molecular stiffness caused by structures with restricted
molecular mobility, due to a high proportion of unsaturated bonds, or complex ring structures as this
hinders molecular slip as molecules cannot deform and rotate easily, which can also give rise to
molecular entanglement. Through various studies, it is believed that EHD friction is influenced
mostly by the flexibility and structure of individual molecules as this will affect how molecular layers
shear over one another under high pressure. This was seen by Zhang et al 2017 [number]where it
was shown that flexible groups and linear molecules favoured low friction which allowed more free
movement and prevented molecular entanglement. Synthetic esters are an example of a flexible
molecule as the ester bond allows free rotation of substituents (6). Hentschel et al 1985 (9) also
discovered that bulkier and more irregular shaped cyclic structures gave rise to more steric
hindrance hindering fluidity due to neighbouring molecule interlocking resulting in higher friction in
comparison to regular spherical and ellipsoidal rings (9).
The second was large molecule size as it was believed this produces more steric hinderance. More
specifically, this is referring to the degree of branching and linearity of molecule, how much free
space a molecule occupies and how it interacts with neighbouring layers. Zhang et al [number]
showed that bulky cyclo-hexyl rings and methyl branches gave higher EHD friction due to hindering
movement against neighbouring layers. While linear chains favour low friction as they interact less
Comment [MS11]: reference number missing
Comment [MS12]: Wouldn’t start a sentence with whereas, looks fragmented

5
with neighbouring layers. An NPG based polyol ester with a branched substituent gave higher
friction than a linear one containing a double bond. It was also found that the friction of polyglycols
was strongly influenced by the amount of branching, with more propylene instead of ethylene units
resulting in more branching and therefore higher friction (6). This was confirmed by Hentschel who
suggested the low friction of polyglycols was caused by the low degree of branching resulting in a
thread-like structure which allowed the polyglycols chains to align which minimal interaction with
other layers (10). These results were backed up againconfirmed by Hirst and Moore 1979 (11).
Further confirming that bulkier molecules give a higher EHD friction, Hammann et al 1970 showed
that molecules with one or two cyclohexyl rings gave high EHD friction (29). Cecil et al 1973 backed
this upconfirmed this result by finding that paraffinic mineral oils gave a lower EHD friction than
naphthenic, the latter having more saturated rings substituents. The paper also showed that glycol
compounds produced a lower friction than the mineral oils tested (30). A similar study was also
performed by Hirst and Moore 1979 where EHD friction was higher for molecules containing
multiple side chains and saturated rings, but it was found to be lower for polyglycols. It was also
found that friction was found to be lower for benzene ring containing base oils where the
substituents were located para to one another as opposed to ortho and meta due to the molecule
being more linear (11). Another study discovered that EHD friction increased with increased degree
of branching. Friction data was analysed using a viscoelastic Eyring model and it was noted that the
Eyring stress decreased with the degree of branching and with molecular volume (31). LaFountain et
al 2001 measuredobserved the EHD friction properties of three base oils a found that the EHD
friction increased from PAO (polyalphaolefins) to diesters to alkylated aromatic base oils. This again
confirmed that bulkier molecules can give rise to higher friction (14). Zhang et al reported a general
trend with base oil group with group 1 having the highest friction, then group 2 and then groups 3
and 4 which also follows the trend of decreasing proportion of cyclic and branched components (6).
However, an increase in the size of the molecule can also decrease friction if the larger molecule can
pack more efficiently than the smaller molecule. With regards to base oils seen in aviation
lubricants, Chang utilized an in-contact temperature rise mapping method to measure the shear
stress properties of a range of ester base oils and it was found that pentaerythritol esters had a
lower shear stress than trimethylolpropane (TMP) based esters. The paper also noted that more
branching lead to an increase in shear stress (16).
The third molecular characteristic was short alkyl chains resultings in a poor molecular packing
efficiency. Zhang et al showed an increase in chain length from adipic to azelaic to sebacic acid
results in decreasing friction (6,28).
Comment [MS13]: mixed reference styles – choose either Harvard or Vancouver – not bits of both, depending on Trib Int style.!.
Comment [MS14]: ????!
Comment [MS15]: if you mention groups here then you need it in the text earlier then
6
The fourth factor was a high melting point, but this may just be due to larger molecules and
molecules with more polar atoms resulting in stronger intermolecular bonding as they inherently
have a higher melting point (28).
The fifth molecular characteristic is low molecular polarity as high polarity gives rise to repulsion
between neighbouring molecules preventing close packing and aiding the molecules sliding over one
another (28). It was found that solvent treated mineral base oils gave a higher friction than
hydrotreated oils and that the lowest friction was produced by group III and group IV base oils
therefore showing the introduction of polar water resulted in lower friction than those treated with
organic non-polar solvents (15).
There have also be other studies that observed the loss of torque and efficiency of real bearings and
gears and found that the synthetic base oils tested; PAOs, polyglycols and esters produced a
reduction in torque in comparison to other mineral oils. This could be due to a few characteristics
such as molecular packing efficiency, polarity or bulky substituents, but it is difficult to make further
deductions without more detail on the molecular chemistry of the mineral oils, but is likely to be due
to a higher proportion of cyclic and branched substituents (32–36). When compared the synthetic
base oils to each other, the literature sources found opposing results in that Yoshizaki et al found
PAO to give a lower friction than polyglycols whereas the opposite was found by Hӧhn et al. This
may be due to differences in the PAOs and polyglycols tested hence the reason for the difficulty in
understanding trend with base oils and the necessity for control of base oil production for research
purposes (32,33).
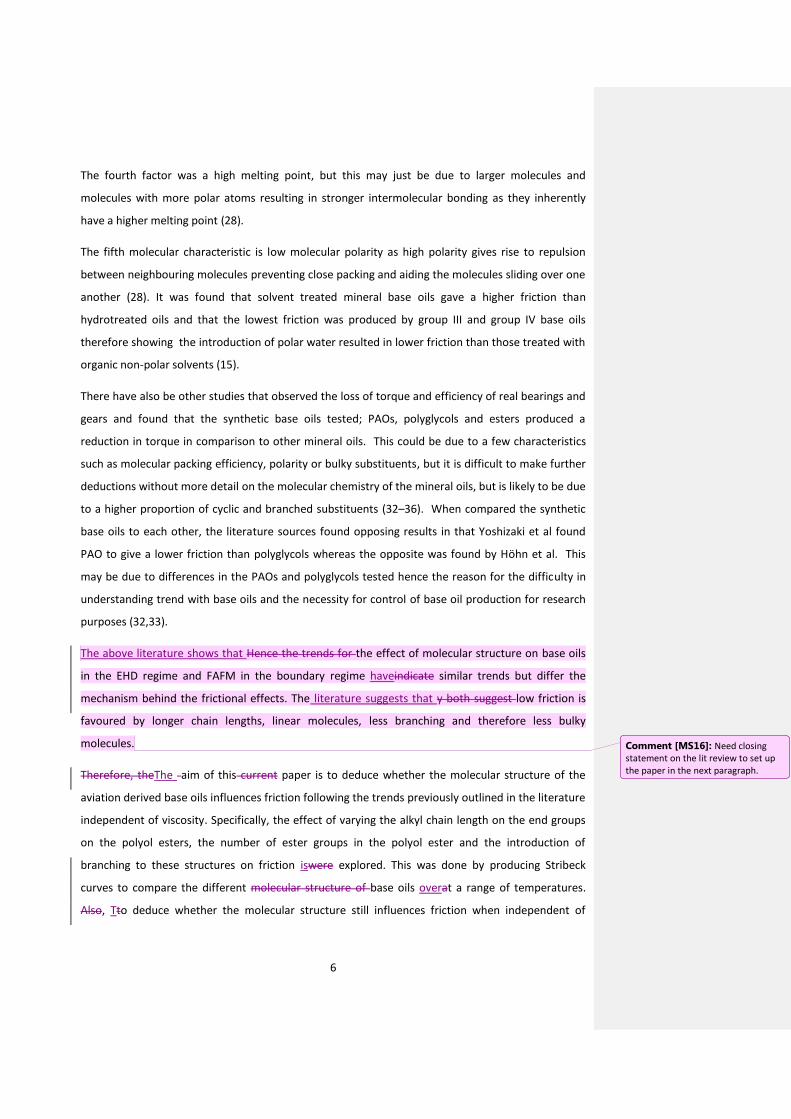
The above literature shows that Hence the trends for the effect of molecular structure on base oils
in the EHD regime and FAFM in the boundary regime haveindicate similar trends but differ the
mechanism behind the frictional effects. The literature suggests that y both suggest low friction is
favoured by longer chain lengths, linear molecules, less branching and therefore less bulky
molecules.
Therefore, theThe aim of this current paper is to deduce whether the molecular structure of the
aviation derived base oils influences friction following the trends previously outlined in the literature
independent of viscosity. Specifically, the effect of varying the alkyl chain length on the end groups
on the polyol esters, the number of ester groups in the polyol ester and the introduction of
branching to these structures on friction iswere explored. This was done by producing Stribeck
curves to compare the different molecular structure of base oils overat a range of temperatures.
Also, Tto deduce whether the molecular structure still influences friction when independent of
Comment [MS16]: Need closing statement on the lit review to set up the paper in the next paragraph.

7
viscosity, the different base oils were compared at the same kinematic viscosity by testing each base
oil at a specific temperature to attain the samea specific kinematic viscosity.

8
3 EXPERIMENTAL
3.1 MINI TRACTION MACHINE
A Mini Traction Machine (MTM2, developed by PCS instruments) was used to evaluate the
tribological performance of the oils. The MTM uses a ball on a disc configuration, each component
with a specific rotational speed and to achieve the defined slide-roll ratio (SRR).
The contact between the ball and the disc is submerged in a reservoir of lubricant (approximately 35
mL) and the ball rotates against the disc at an inclined axis to eliminate spin in the contact. The
speed of both ball and disc are controlled independently and driven by separate motors, which
allows different combinations of surface speeds and SRR to be set by the operator. The load and
lubricant temperature can also be controlled and the traction coefficient (friction) is measured.
Figure 1 - Configuration of the MTM showing the rotational directions of the ball and disc.
Specifications of the test specimens are shown in Table 1, both of which showed minimal wear
throughout the Stribeck tests.
Table 1– Specification of test specimens.
Property MTM Standard Disc MTM Drilled Ball
Dimensions (diameter) 46 mm ¾” (19.05 mm)
Material AISI 52100 AISI 52100
Surface Finish, Ra <0.01 µm <0.02 µm
Hardness, Hv 720-780 800-920
Comment [MS17]: define
Comment [MS18]: Schematic showing key parameters needed.
Comment [AJ(19]: I mentioned the key parameters in the text, doe it need any more than that?
Comment [MS20]: YOU need to draw a schematic.,i.e. a labelled diagram. You are an engineer!
9
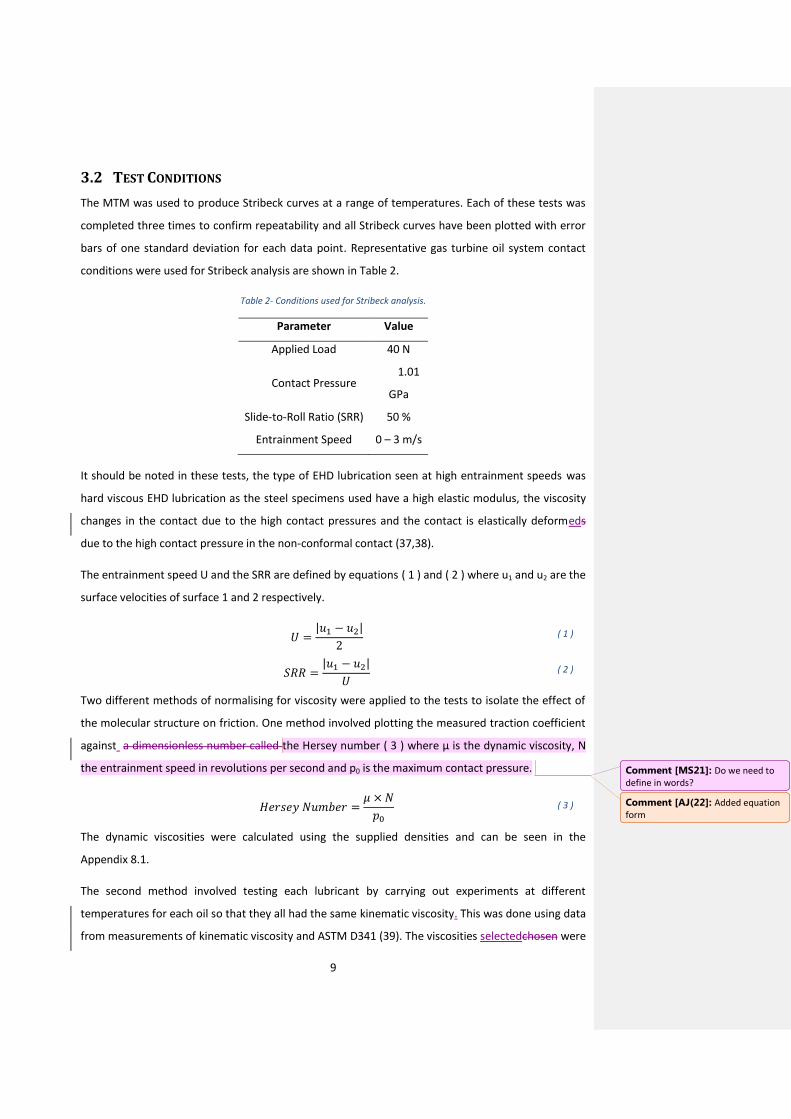
3.2 TEST CONDITIONS
The MTM was used to produce Stribeck curves at a range of temperatures. Each of these tests was
completed three times to confirm repeatability and all Stribeck curves have been plotted with error
bars of one standard deviation for each data point. Representative gas turbine oil system contact
conditions were used for Stribeck analysis are shown in Table 2.
Table 2- Conditions used for Stribeck analysis.
Parameter Value
Applied Load 40 N
Contact Pressure 1.01
GPa
Slide-to-Roll Ratio (SRR) 50 %
Entrainment Speed 0 – 3 m/s
It should be noted in these tests, the type of EHD lubrication seen at high entrainment speeds was
hard viscous EHD lubrication as the steel specimens used have a high elastic modulus, the viscosity
changes in the contact due to the high contact pressures and the contact is elastically deformeds
due to the high contact pressure in the non-conformal contact (37,38).
The entrainment speed U and the SRR are defined by equations ( 1 ) and ( 2 ) where u1 and u2 are the
surface velocities of surface 1 and 2 respectively.
𝑈 =
|𝑢1 − 𝑢2|
2 ( 1 )
𝑆𝑅𝑅 =
|𝑢1 − 𝑢2|
𝑈 ( 2 )
Two different methods of normalising for viscosity were applied to the tests to isolate the effect of
the molecular structure on friction. One method involved plotting the measured traction coefficient
against a dimensionless number called the Hersey number ( 3 ) where µ is the dynamic viscosity, N
the entrainment speed in revolutions per second and p0 is the maximum contact pressure.
𝐻𝑒𝑟𝑠𝑒𝑦 𝑁𝑢𝑚𝑏𝑒𝑟 =
𝜇 × 𝑁
𝑝0 ( 3 )
The dynamic viscosities were calculated using the supplied densities and can be seen in the
Appendix 8.1.
The second method involved testing each lubricant by carrying out experiments at different
temperatures for each oil so that they all had the same kinematic viscosity. This was done using data
from measurements of kinematic viscosity and ASTM D341 (39). The viscosities selectedchosen were
Comment [MS21]: Do we need to define in words?
Comment [AJ(22]: Added equation form

10
7.3 cSt, 5.0 cSt and 2.9 cSt, these values . These viscosities were chosen as the calculated test
temperature required for each oil was within the temperature range capability of the MTM. The
calculated temperatures for each base oil can be seen in Table 10.
Another consideration worth noting is shear stability of the base oil molecules. Walker et al (40)
showed by sampling the base oil through a small hole, that polymeric base oils can break down into
smaller molecules in EHD contacts. (40). TheyAn equation was suggested that polymeric scission
will begin to occur in linear hydrocarbon polymers if shear stress x molecular weight2 >1 x 10¹⁴
dyne/ cm2, but this is generally only a concern for much larger base oil molecules and hence, the
shear stability of the base oils tested in this study was assumed not to be an issue (41).
Also, due to the low roughness of the superfinished specimens (Ra <0.01 µm for the disc and Ra <0.02
µm for the ball), very minimal wear was produced for all tests and therefore the wear was not
investigated.
3.2.1 Test Lubrication Regimes
Using the supplied pressure-viscosity coefficients, the fluid film thickness and therefore lambda
ratio, the lubrication regimes can be estimated for each oil over the range of speeds seen in the
Stribeck test. The formulas equations used to calculate the contact pressure, film thickness and the
lambda ratio can be seen in Appendix 8.1. These calculations utilized the data provided by the
manufacturer to calculate the dynamic viscosity at each test temperature to give a more accurate
estimate of the film thickness and therefore the lambda ratio.
Hence from Figure 2, it can be seen from the plot of lambda ratio against the entrainment speed
that the NPG C7 base oil does not reach the EHD regime with the conditions used. Therefore, whilst
previous studies have only compared the effect of base oil structure on EHD friction, the results
presented in this paper observe the effect of the molecular structure across a range of lubrication
regimes as not all the oils will reach the EHD regime at higher entrainment speeds due to specific
lubricant properties and limitations of the test rig. However, the results across the range of
conditions seen in this study have given an insight into the behaviour of different base oils on
friction.

11
Figure 2 – Lambda ratio against the entrainment speed for the NPG C7 base oil showing that it does not reach the EHD at any test temperature for the test conditions used..
3.3 TEST FLUIDS
3.3.1 Pure base oil blends
A variety of group V base oils were acquired of known chemical composition and molecular structure
with no additives. The five pure base oils can be seen in Figure 3.
a. b. c.
d.
e.
Figure 3 - Molecular structure of the base oils tested. a. polyol ester made from pentaerythritol with chains of n-C9, b. polyol ester made from pentaerythritol with chains of n-C7, c. polyol ester made from pentaerythritol with chains of n-C5, d. polyol made from trimethylol propyl with chains of n-C7 and e. polyol ester made neopentyl glycol with chains of n-C7.
The base oils represent esters typically seen in aerospace lubricants and havewith representative
chain lengths. The two parameters considered are re are two variables being observed; the chain
length of the substituent end groups on the esters and the amount of ester groups on the molecule.
The chain lengths of the pentaerythritol base oils vary by increments of two carbons. These
variations were selected as they were readily available from the supplier.

12
Extra data for these base oils both measured and calculated can be seen in Extra Data for the Pure
Base oil blendsExtra Data for the Pure Base oil blends in Appendix 8.1. Tests have shown that the
base oils tested are Newtonian up to shear rates of 200 s-1 due to the lmeasurement imitation of the
cone andon plate rheometer centrifugally forcing out low viscosity fluids at high shear rates. But it is
assumed that these base oils are all Newtonian in the EHD regime as well as shown by Moore 1997
(Appendix Base Oil Rheology)(8).
3.3.2 Fully formulated pure base oil blends
Fully formulated lubricants based on a commercially available aviation lubricants were acquired
which all contain the same additive package but have different amounts and types of group V base
oils (A, B, C and D) to alter their viscosity.
The base oils used contain varying amounts of different polyol esters to vary the viscosity; they differ
in the proportion of base oils with a different number of ester groups (Figure 4). Typically, the alkyl
chain branching is 2-ethylhexyl but there may be some low level of iso C9 branching.
a.
b.
c.
Figure 4 – Molecular structure of the base oils used in the formulated oils tested. a. polyol ester made from pentaerythritol with chains of 2-ethylhexyl and some iso C9, b. polyol ester derived from neopentyl glycol with side chains of 2-ethylhexyl and c. polyol ester derived from trimethylol propane with side chains of 2-ethylhexyl.
The composition of each formulated lubricant tested in terms of additives and base oil can be seen
in Table 3Table 3. The High viscosity oil (made from base oil D) are predominantly pentaerythritol
based (4a) and the Low viscosity oils (from base oil A) are mostly neopentyl glycol (4b) based but
also contains some trimethylol-propane-based ester (4c).
Formatted: Font color: Text 1

13
Both Medium viscosity oils (made from base oils B, C and D) are a blend of polyol esters
(pentaerythritol and neopentyl glycol) with the Medium High containing more pentaerythritol esters
and less neopentyl glycol ester esters than Medium Low. Exact formulation details of oils are
unavailable. The composition of each formulated lubricant tested in terms of additives and base oil
can be seen in Table 3Table 3.
Table 3 – Table showing oil compositions.
Oil A
(v/v %)
Oil B
(v/v %)
Oil C
(v/v %)
Oil D
(v/v (%)
Additives
(v/v %)
Kinematic
Viscosity
@ 100°C
(cSt)
High - - - 94.8 5.2 8.0
Medium High - - 28.0 66.8 5.2 6.9
Medium Low - 10.0 84.8 - 5.2 5.0
Low 94.8 - - - 5.2 3.1
Field Code Changed
14
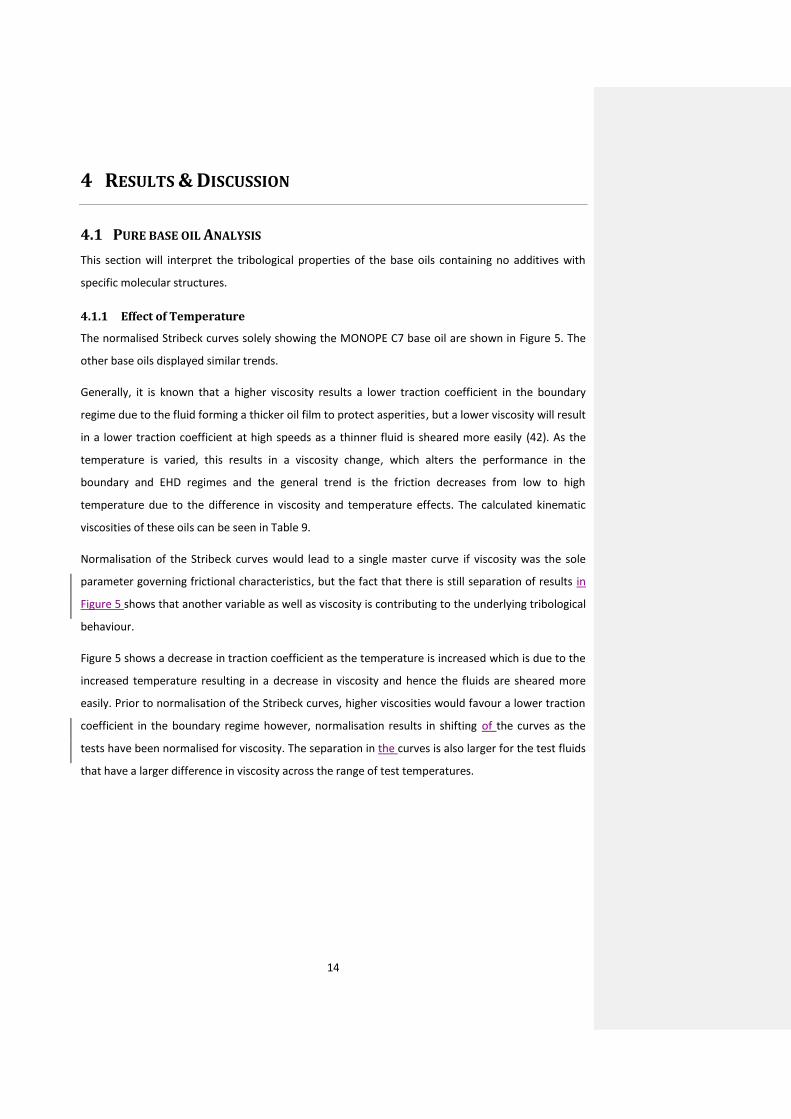
4 RESULTS & DISCUSSION
4.1 PURE BASE OIL ANALYSIS
This section will interpret the tribological properties of the base oils containing no additives with
specific molecular structures.
4.1.1 Effect of Temperature
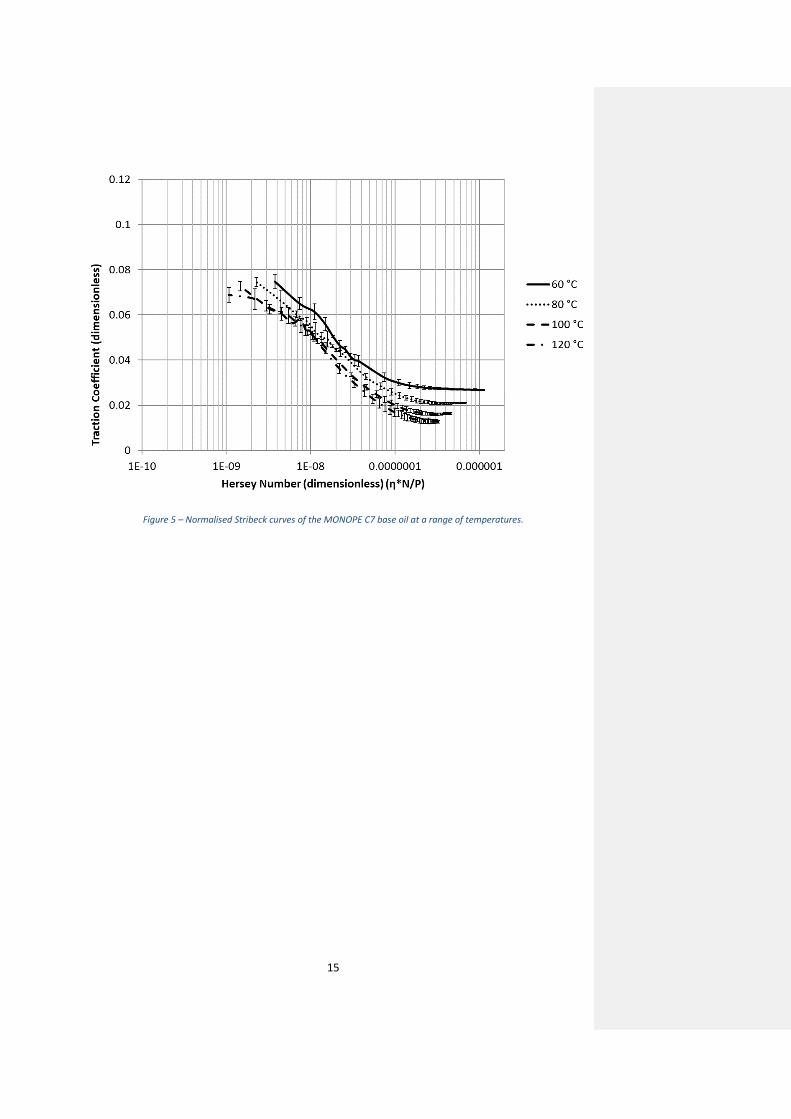
The normalised Stribeck curves solely showing the MONOPE C7 base oil are shown in Figure 5. The
other base oils displayed similar trends.
Generally, it is known that a higher viscosity results a lower traction coefficient in the boundary
regime due to the fluid forming a thicker oil film to protect asperities, but a lower viscosity will result
in a lower traction coefficient at high speeds as a thinner fluid is sheared more easily (42). As the
temperature is varied, this results in a viscosity change, which alters the performance in the
boundary and EHD regimes and the general trend is the friction decreases from low to high
temperature due to the difference in viscosity and temperature effects. The calculated kinematic
viscosities of these oils can be seen in Table 9.
Normalisation of the Stribeck curves would lead to a single master curve if viscosity was the sole
parameter governing frictional characteristics, but the fact that there is still separation of results in
Figure 5 shows that another variable as well as viscosity is contributing to the underlying tribological
behaviour.
Figure 5 shows a decrease in traction coefficient as the temperature is increased which is due to the
increased temperature resulting in a decrease in viscosity and hence the fluids are sheared more
easily. Prior to normalisation of the Stribeck curves, higher viscosities would favour a lower traction
coefficient in the boundary regime however, normalisation results in shifting of the curves as the
tests have been normalised for viscosity. The separation in the curves is also larger for the test fluids
that have a larger difference in viscosity across the range of test temperatures.
15
Figure 5 – Normalised Stribeck curves of the MONOPE C7 base oil at a range of temperatures.

16
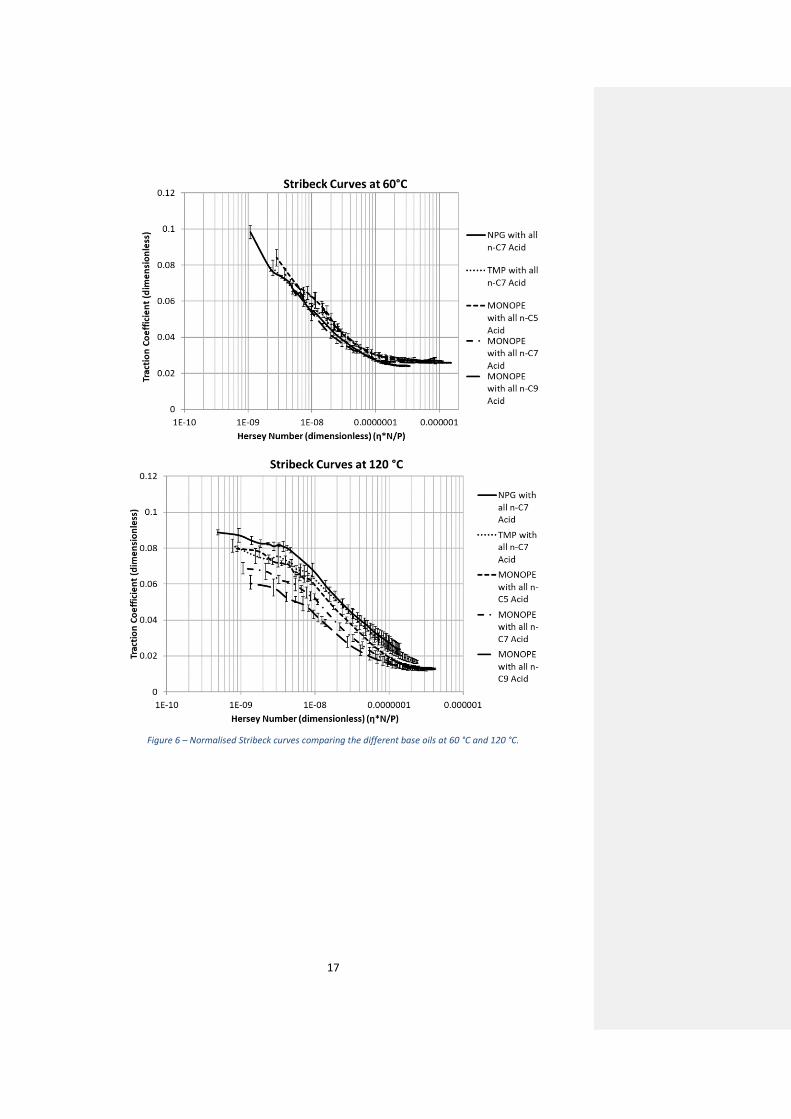
4.1.2 Effect of Base Oil Structure at Constant Temperature
Figure 6 shows that when the base oils are compared at a constant temperature, separation of the
Stribeck curves only emerges at the higher temperatures (120oC). At the lower test temperature of
60oC s there is no significant trend. But at higher test temperatures, the prominence of this
separation becomes more apparent. By considering the viscosities of each of these oils at each test
temperature, there is a larger difference in kinematic viscosity at the lower test temperatures.
Hence it can be seen that at the highest test temperature of 120 °C, this has the smallest range of
viscosities of 2.83 cSt whereas at 60 °C the range is 12.04 cSt. Consequently, at low temperatures,
viscosity dominates the behaviour leading to similar curves due to normalising for viscosity by
plotting the traction coefficient against the Hersey number. When the difference in viscosity in
minimised, a difference in friction emerges due to other underlying variables in the system, namely;
the difference in molecular structure.
The order of the friction decreased from NPG C7 to TMP C7 to MONOPE C5 to MONOPE C7 and then
to MONOPE C9. Hence, this indicates an effect of molecular structure on friction. The results shown
that friction decreases with an increase in both As the number of ester groups increases the friction
decreases and as thethe chain length increases the friction decreases too. It is likely this is due to
the larger molecules being able to pack more efficiently and separate the surfaces due to with their
larger size. LEssentially larger chains can better separate surfaces better since they take up more
space thus providing improved support, but this can often come with increased friction if larger
bulkier molecules have more difficulty moving which can mask this effect.
However, at high test temperatures at high entrainment speeds, the pentaerythritol base oils
converge, and the neopentyl and trimethylol base oils remain separated from them. This suggests
that the pentaerythritol base oils behave similarly at higher entrainment speeds regardless of their
difference in chain length as they reach the EHD regime and that the neopentyl and trimethylol base
oils require higher speeds to reach the same traction coefficient. Hence this shows that the effect of
the number of ester groups potentially has a larger impact on the molecular packing than
differences in substituent chain length.
Comment [TM23]: The section is a bit confusing – if you are not careful you imply smaller difference in viscosity means larger difference in friction, but what you should mean is that the viscosity dominates behaviour leading to not much difference but where you minimise that factor the effect of molecule on its own becomes apparent.
Comment [TM24]: Something like this as an extra? Essentially bigger chains can separate surfaces better since they support and separate more – they take up more space in between – often this comes with increased friction due to larger molecules having more difficulty moving which can mask the effect. (chain length effect is limited though sometimes just general size is important which fits your pattern nicely.
Comment [TM25]: If I am reading the graph right those 2 haven’t reached the end of the mixed regime, once viscosity corrected I would expect them to line up when they get there – I would remove this part if I were you or test those 2 at higher speed to prove they are different or say they appear not to collapse because they haven’t reached the EHD yet?
Comment [MS26]: But WHY???! Is there nothing in the literature to help you?
Comment [AJ(27]: I can’t find anything in the literature but think it should still be pointed out as an observation
17
Figure 6 – Normalised Stribeck curves comparing the different base oils at 60 °C and 120 °C.

18
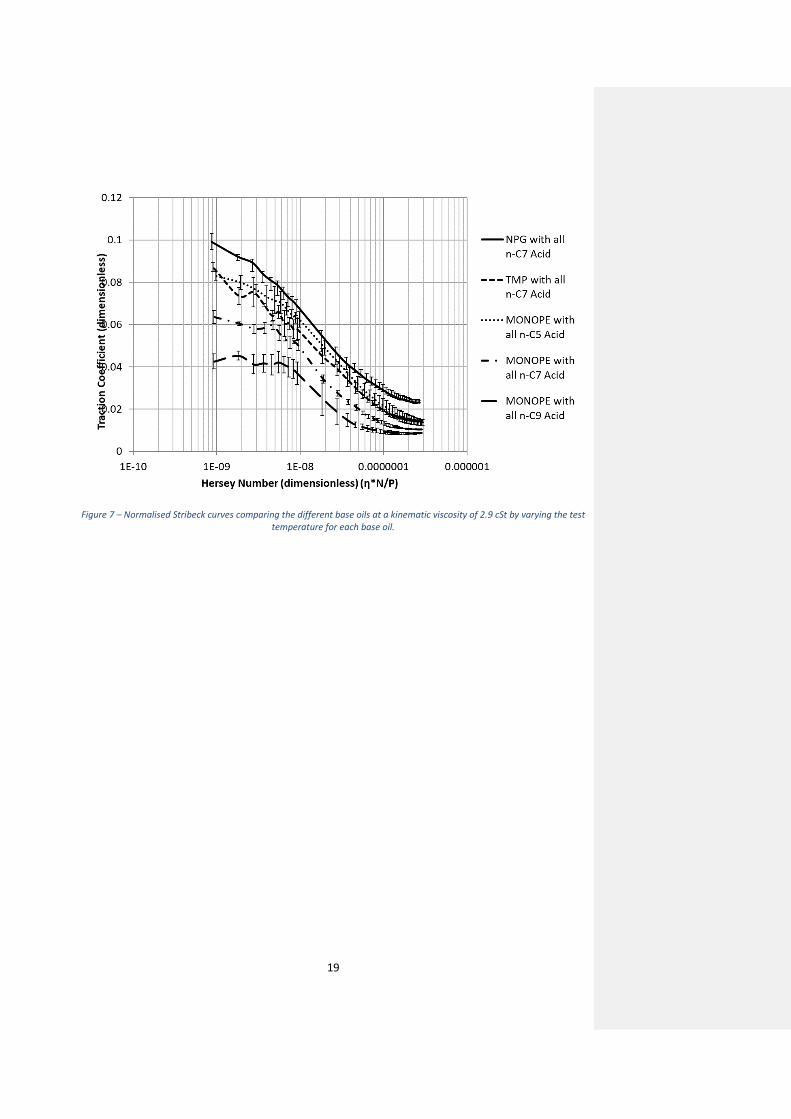
4.1.3 Effect of Base Oil Structure at Constant Viscosity
When tested at a constant viscosity, there is a clear separation of Stribeck curves across each of the
different test viscosities, but there appears to be a slightly larger separation on the lowest viscosity
graph; Figure 7. The order from high to low friction is marginally different to the same temperature
Stribeck curves as the trend now goes NPG C7, PE C5, TMP C7, PE C7 and then PE C9. Therefore, the
PE C5 and TMP C7 have swapped. However, this is due to the fact thatlikely as they have very similar
molecular weights and therefore viscosity (as shown in Table 5) and have performed very similarly
throughout all the tests.
Despite this marginal change in frictional order, the same trend can clearly be observed, showing
that as both chain length increases, and the number of ester groups increases, the friction decreases
can clearly be seen. This reinforces the theory that viscosity is not the only factor influencing friction
and that the molecular structure has a substantial effect too which is revealed after viscosity has
been eliminated as a variable. It is likely this is due to the larger molecules being able to pack more
efficiently, which results in less frictional resistance and be able to separate the rubbing surfaces
more effectively because of their increasing size.
Another observation is that the pentaerythritol base oils do not completely converge at high
entrainment speeds as they did when all compared at the same test temperature. This could be due
to increasing chain length effect being more apparent at the same viscosity and potentially requires
higher entrainment speeds to converge. Again, the effect of the number of ester groups potentially
has a larger impact on the molecular packing than differences in substituent chain length as there is
a larger separation between the NPG C7, TMP C7 and MONOPE C7 than each of the MONOPE
curves.
Comment [TM28]: This element needs to come in again I think but not what I wrote necessarily
Comment [MS29]: But WHY???! Is there nothing in the literature to help you?
Comment [AJ(30]: I can’t find anything in the literature but think it should still be pointed out as an observation
19
Figure 7 – Normalised Stribeck curves comparing the different base oils at a kinematic viscosity of 2.9 cSt by varying the test temperature for each base oil.
20
4.2 FULLY FORMULATED BASE OIL ANALYSIS
The section describes the results obtained for will show the results of the the fully formulated
lubricants each with the same additive package and all have a controlled mixture of different
structure base oils to vary viscosity.
4.2.1 Effect of Temperature
The Stribeck curves for the high viscosity formulation are shown in Figure 8 (the other formulations
are not shown as they show a similar trend). There is a trend showing that traction coefficient
decreases with increasing temperature as shown with the pure base oils.
The difference in traction coefficient in the boundary regime is smaller than the difference in
traction coefficient in the EHD regime. This is because the boundary region is affected much more by
additive performance and as all the oils contain the same additive package, similar performance is
expected. As it is the base oil which is being varied and not the additives, it is expected that the main
differences will be seen in the EHD regime and this is confirmed byin these presented results. T But
the differences that are seen in the boundary regime must be due to higher viscosity oils forming
thicker films and therefore they can separate the surface asperities more than lower viscosity blends
(7). It is likely that the additives will introduce some surface chemistry effects that could interact
with the base oils creating a different frictional response in comparison to the unadditised oils.
However, it is not expected these effects will be significantly different between each of the fully
formulated lubricants.
Figure 8 shows that the Stribeck curves for the higher viscosity oils do not flatten off. This could be a
possible effect of shear heating. Shear heating occurs when shearing of high viscosity fluids results in
friction which generates heat as the molecules shear over one another and as a result causes a
decrease in viscosity. Higher entrainment speeds may cause more shearing resulting in a thinner film
and therefore lower friction. But it is also possible that a higher entrainment is needed for the more
viscous oils to reach a minimum traction and hence these may not have reached the EHD regime yet. Comment [MS31]: Could this explain earlier results?
Comment [AJ(32]: I’m not sure, can’t think of an explanation that would fit

21
Figure 8 – Stribeck curves of the High Formulation at a range of temperatures.
22
4.2.2 Effect of Base Oil Structure at Constant Temperature
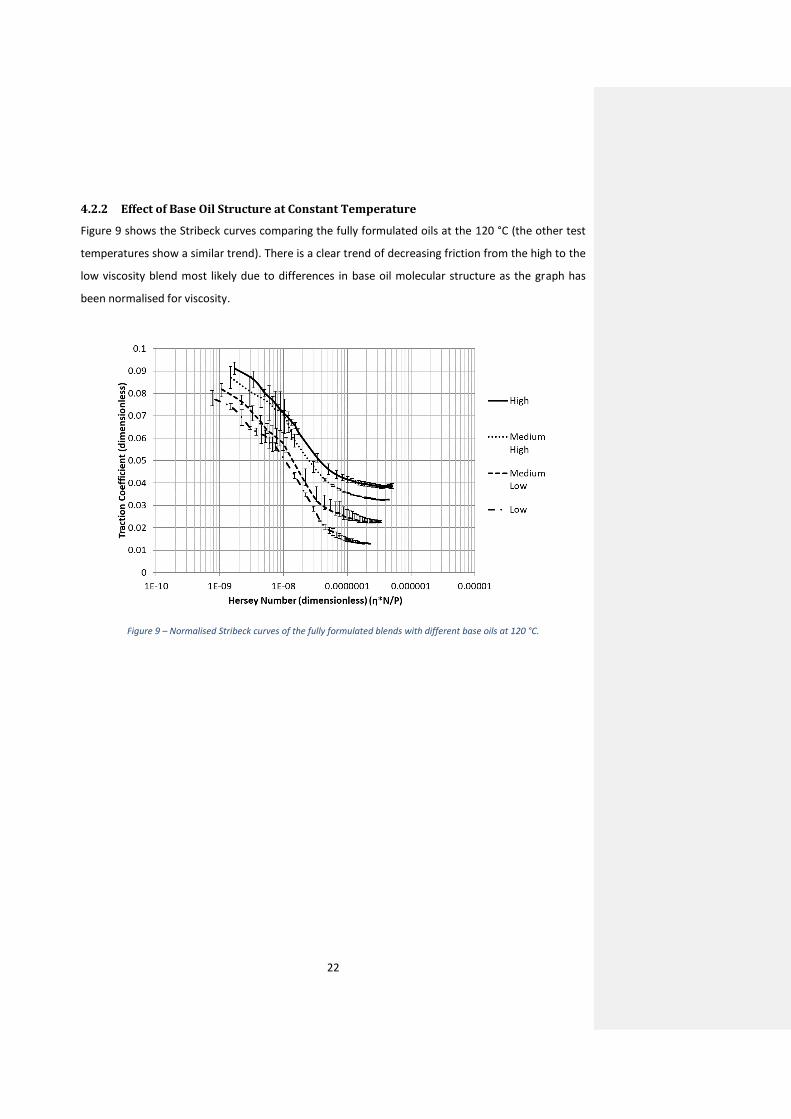
Figure 9 shows the Stribeck curves comparing the fully formulated oils at the 120 °C (the other test
temperatures show a similar trend). There is a clear trend of decreasing friction from the high to the
low viscosity blend most likely due to differences in base oil molecular structure as the graph has
been normalised for viscosity.
Figure 9 – Normalised Stribeck curves of the fully formulated blends with different base oils at 120 °C.
23
4.2.3 Effect of Base Oil Structure at Constant Viscosity
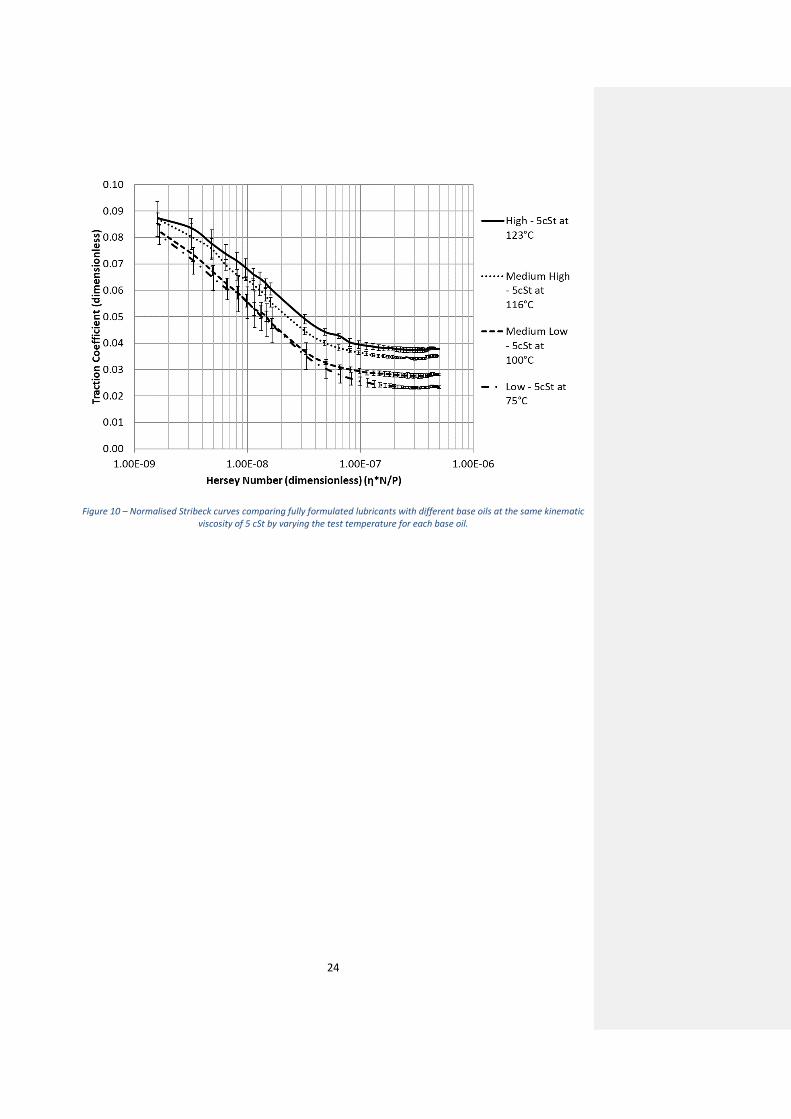
The Stribeck curves at 5 cSt and results shown are in Figure 10. There is a clear trend showing that
friction decreases moving from the high viscosity to the low viscosity formulations even when all of
them have the same kinematic viscosity. Therefore, if the viscosity is not the main influence behind
the tribological effects, the only other difference between the oils is difference in base oil chemistry.
This graph demonstrates the opposite to Figure 7 as the oils with a larger size now result in higher
friction.
As mentioned earlier, the low viscosity oil is mainly composed of polyol esters from NPG and TMP
and the high viscosity oil is predominantly polyol esters from pentaerythritol, but these esters are
now branched too. Therefore, from the low to the high viscosity formulations, there is an increase in
the number of esters with more branching. Consequently, this increase in branching, has led to more
interference with molecular packing giving rise to higher friction.
Hence this shows that the inclusion of branching may inverse the trends seen with the previous oils
where increasing chain length and increasing the number of ester groups decreased friction
potentially due to larger molecules being able to pack more efficiently. It may be that the inclusion
of branched side chain prevents the larger molecule packing as efficiently giving rise to more steric
hinderance as the molecules get larger with more branching. However, this effect of branching
needs to be further confirmed with branched base oils of a known molecular structure without the
added variable of additives. Comment [MS33]: It’s a bit unsatisfactory as you don’t know presumably the base oil structure in the fully formulated oils? If I was a reviewer I would criticise this as you can’t really explain your results...
24
Figure 10 – Normalised Stribeck curves comparing fully formulated lubricants with different base oils at the same kinematic viscosity of 5 cSt by varying the test temperature for each base oil.

25
5 CONCLUSIONS
In conclusion, Stribeck curves have been produced were produced for a range of base oils of specific
molecular structures and fully formulated oils to understand the effect of molecular structure on
friction. Whilst changes to molecular structure influence the viscosity of the fluid, the base oils were
also tested at the same viscosity by varying the temperature of each test.
The results showed the molecular structure has a substantial impact on the measured friction across
all lubrication regimes. It was shown from the results that Twhilst the viscosity behaviour is as
affects as expected with an increase in viscosity leading to an increase in friction as a higher viscosity
fluid incurs more resistance to shear. After viscosity was eliminated as a variable through plotting
Stribeck curves against the Hersey number and by conducting wears tests at the same viscosity, two
molecular variables were explored; the effect of chain length and the influence of the number of
ester groups on friction. It was shown that the friction decreases across all lubrication regimes as the
chain length increases and by increasing the number of ester groups which is most likely due to
larger molecules being able to pack more efficiently and separate the contacting surfaces. Essentially
Llarger chains can separate surfaces better since they take up more space thus providing improved
support, but this can often come with increased friction if larger bulkier molecules have more
difficulty moving which can mask this effect. It was also seen that the number of ester groups
potentially has more of an effect on friction that the substituent chain length as the pentaerythritol
base oils converge when compared at the same temperature, but the TMP and NPG oils remain
separated. This suggested that the pentaerythritol base oils behave very similarly at high
entrainment speeds regardless of their difference in chain length.
TheIn addition, fully formulated lubricants showed a reversal the friction trend such that the friction
was seen to increase as the number of ester groups was increased. This was attributed to the
increase in proportion of branching on the ester substituents. Consequently, the results show an
increase in friction as the amount of branching increases creating more interference with molecular
packing.
Overall, these results are in clear agreement with the literature in that low friction is favoured by
longer chain lengths, increasing the number of ester groups (within a polyol ester) and maintaining a
linear molecule. Branching leads to producing a bulkier molecule which gives rise to high friction
whereas, whilst increasing the chain length and the number of ester groups increases the size of the
molecule, the molecule remains linear and flexible giving rise to improved load carrying capacity and
packing efficiency which reduces friction.
Comment [MS34]: Need to start with a sentence or two summary of what was done. Some people will read conclusions without reading the rest of the paper.
Comment [TM35]: Maybe something here?
Comment [MS36]: But can you prove that?

26
6 ACKNOWLEDGMENTS
JA was funded by the EPSRC Centre for Doctoral Training in Formulation Engineering (EP/L015153/1)
at the University of Birmingham and The authors express their gratitude to the University of
Birmingham, Rolls-Royce Plc. The authors would like to acknowledge Dr Thomas Mills of Chemical
Engineering at the University of Birmingham for his helpful comments on the manuscript. and the
EPSRC (Engineering and Physical Sciences Research Council) for their funding and support toward
this research.
Formatted: Heading 1, Indent: Left:
0 cm, First line: 0 cm,
Widow/Orphan control, Adjust
space between Latin and Asian text,
Adjust space between Asian text
and numbers

27
67 REFERENCES
1. Rolls-Royce. The Jet Engine. Fifth edit. Rolls-Royce plc, editor. Chichester, West Sussex: John
Wiley, 2015.; 2015. p. 288.
2. Mortier RM, Fox MF, Orszulik S. Chemistry and Technology of Lubricants [Internet].
Dordrecht: Springer Netherlands; 2011. (SpringerLink: Springer e-Books). Available from:
https://books.google.co.uk/books?id=YTa5TsL0KnIC
3. Tung SC, McMillan ML. Automotive tribology overview of current advances and challenges for
the future. Tribol Int. 2004;37(7):517–36.
4. Shell Aviation Limited. The AeroShell Book. Aviation. 2003;196.
5. American Petroleum Institute. Engine Oil Licensing and Certification System, Annex E - API
base oil interchangeability guidelines for passenger car motor oils and diesel engine oils.
Washington; 2017.
6. Zhang J, Tan A, Spikes H. Effect of Base Oil Structure on Elastohydrodynamic Friction. Tribol
Lett. 2017;
7. Williams JA. Engineering tribology. Cambridge: Cambridge University Press; 2005.
8. Moore AJ. The behaviour of lubricants in elastohydrodynamic contacts. Proc Inst Mech Eng
Part J J Eng Tribol. 1997;
9. Hentschel KH. The influence of molecular structure on the frictional behaviour of lubricating
fluids. J Synth Lubr. 1985;2:143–74.
10. Hentschel KH. The influence of molecular structure on the frictional behaviour of lubricating
fluids 2: low coefficients of traction. J Synth Lubr. 1985;2:238–60.
11. Hirst W, Moore AJ. Elastohydrodynamic lubrication at high pressures. II. Non-Newtonian
behaviour. Proc R Soc A. 1979;365:537–65.
12. Gentle CR, Cameron A. An investigation of traction in elastohydrodynamic point contacts
using optical interferometry. ASLE Trans. 1975;
13. Biresaw G, Bantchev GB. Elastohydrodynamic (EHD) Traction Properties of Seed Oils. Tribol
Lubr Technol [Internet]. 2013;12. Available from: WWW.STLE.ORG
14. LaFountain AR, Johnston GJ, Spikes HA. The elastohydrodynamic traction of synthetic base oil

28
blends. Tribol Trans. 2001;
15. Gunsel S, Korcek S, Smeeth M, Spikes HA. The elastohydrodynamic friction and film forming
properties of lubricant base oils. Tribol Trans. 1999;
16. Chang H-S, Spikes HA, Bunemann TF. The shear stress properties of ester lubricants in
elastohydrodynamic contacts. J Synth Lubr. 1992;
17. Beeck O, Givens JW, Smith AE. On the Mechanism of Boundary Lubrication. I. The Action of
Long-Chain Polar Compounds. Vol. 177, Source: Proceedings of the Royal Society of London.
Series A, Mathematical and Physical Sciences. 1940.
18. Frewing JJ. The Influence of Temperature on Boundary Lubrication. Proc R Soc London.
1942;181:23–42.
19. Frewing JJ. The Heat of Adsorption of Long Chain Compounds and their Effect on Boundary
Lubrication. Proc R Soc London. 1944;182:270–85.
20. Beltzer M, Jahanmir S. Role of Dispersion Interactions Between Hydrocarbon Chains in
Boundary Lubrication. ASLE Trans. 1986;30(1):47–54.
21. Jahanmir S, Beltzer M. Effect of Additive Molecular Structure on Friction Coefficient and
Adsorption. J Tribol. 1986;108:550–74.
22. Beltzer M, Jahanmir S. Effect of Additive Molcular Structure on Friction. Lubr Sci. 1988;1(1):3–
26.
23. Davidson JE, Hinchley SL, Harris SG, Parkin A, Parsons S, Tasker PA. Molecular Dynamics
Simulation to Aid the Rational Design of Organic Friction Modifiers. J Mol Graph Model.
2006;25:495–506.
24. Hardy WB, Doubleday I. Boundary Lubrication - The Paraffin Series. In: Proceedings of the
Royal Society London. 1922. p. 49–68.
25. Okabe H, Masuko M, Sakurai K. Dynamic Behaviour of Surface Adsorbed Molecules Under
Boundary Lubrication. ASLE Trans. 1980;24(4):476–473.
26. Askwith TC, Cameron A, Crouch RF. Chain Length of Additives in Relation to Lubricants in Thin
Film and Boundary Lubrication. In: Proceedings of the Royal Society of London Series A,
Mathematical and Physical. London: Royal Society; 1966. p. 500–19.
27. Housel T. Synthetic Esters: Engineered to Perform [Internet]. Machinery Lubrication, Noria

29
Corporation. 2019. p. 1. Available from:
https://www.machinerylubrication.com/Read/29703/synthetic-esters-perform
28. Tsubouchi T, Hata H, Yoshida Y. Optimisation of molecular structure for traction fluids. Lubr
Sci. 2004;16:393–403.
29. Hammann WC, Schisla RM, Groenweghe L. C. D., Gash VW. Synthetic Fluids for High-capacity
Traction Drives. ASLE Trans. 1970;13(2):105–16.
30. Cecil R, Pike WC, Raje NR. Development of methods for evaluating traction fluids. Wear.
1973;
31. Muraki M. Molecular structure of synthetic hydrocarbon oils and their rheological properties
governing traction characteristics. Tribol Int. 1987;
32. Yoshizaki M, Naruse C, Nemoto R, Haizuka S. Study on frictional loss of spur gears
(Concerning the influence of tooth form, load, tooth surface roughness, and lubricating oil).
Tribol Trans. 1991;
33. Höhn B-R, Michaelis K, Doleschel A. Frictional Behaviour of Synthetic Gear Lubricants. Tribol
Res. 2001;10.
34. Martins R, Seabra J, Brito A, Seyfert C, Luther R, Igartua A. Friction coefficient in FZG gears
lubricated with industrial gear oils: Biodegradable ester vs. mineral oil. Tribol Int. 2006;
35. Michaelis K, Höhn B-R, Hinterstoißer M. Influence factors on gearbox power loss. Ind Lubr
Tribol. 2011;63(1):46–55.
36. Fernandes CMCG, Amaro PMP, Martins RC, Seabra JHO. Torque loss in cylindrical roller thrust
bearings lubricated with wind turbine gear oils at constant temperature. Tribol Int. 2013;
37. Hamrock BJ, Schmid SR, Jacobson BO. Elastohydrodynamic Lubrication of Elliptical
Conjunctions. In: Fundamentals of Fluid Film Lubrication. 2nd ed. CRC Press; 2004. p. 35.
38. Hamrock BJ, Schmid SR, Jacobson BO. Film Thicknesses for Different Regimes of Fluid Film
Lubrication. In: Fundamentals of Fluid FIlm Lubrication. 2nd ed. CRC Press; 2004. p. 23.
39. ASTM D341-09. Standard Practice for Viscosity-Temperature Charts for Liquid Petroleum.
ASTM Int West Conshohocken, PA. 2009;
40. Walker DL, Student G, Sanborn ; D M, Winer AO. Molecular Degradation of Lubricants in
Sliding Elastohydrodynamic Contacts [Internet]. 1975. Available from:
30
https://asmedigitalcollection.asme.org
41. Mackenzie K, Jemmett AE. Polymer shear stability. Wear. 1971;
42. Hutchings IM. Tribology : Friction and Wear of Engineering Materials. Oxford: Butterworth-
Heinemann; 1992.
Acknowledgments
The authors express their gratitude to the University of Birmingham, Rolls-Royce Plc and the EPSRC
(Engineering and Physical Sciences Research Council) for their funding and support toward
this research.
Formatted: Indent: Left: 0 cm,
Hanging: 1.13 cm, No
widow/orphan control, Don't adjust
space between Latin and Asian text,
Don't adjust space between Asian
text and numbers
31
78 APPENDIX
7.18.1 EXTRA DATA FOR THE PURE BASE OIL BLENDS
7.1.18.1.1 Kinematic Viscosities of the base oils
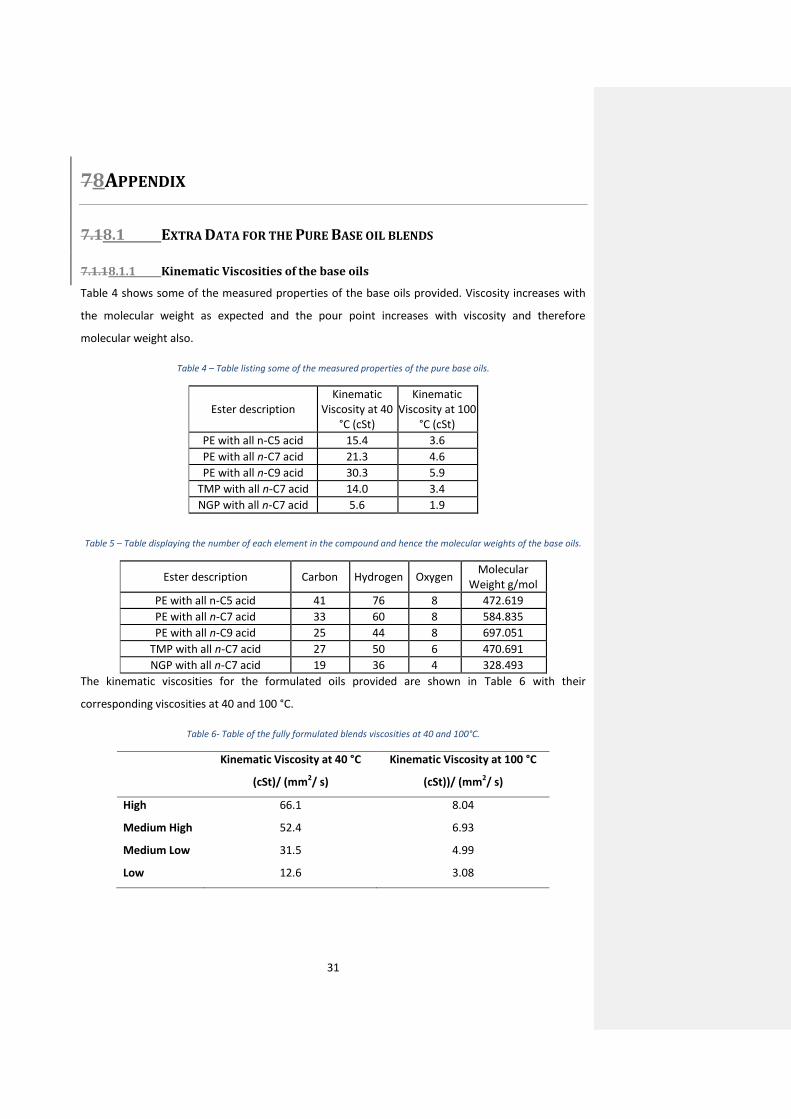
Table 4 shows some of the measured properties of the base oils provided. Viscosity increases with
the molecular weight as expected and the pour point increases with viscosity and therefore
molecular weight also.
Table 4 – Table listing some of the measured properties of the pure base oils.
Ester description Kinematic
Viscosity at 40 °C (cSt)
Kinematic Viscosity at 100
°C (cSt)
PE with all n-C5 acid 15.4 3.6
PE with all n-C7 acid 21.3 4.6
PE with all n-C9 acid 30.3 5.9
TMP with all n-C7 acid 14.0 3.4
NGP with all n-C7 acid 5.6 1.9
Table 5 – Table displaying the number of each element in the compound and hence the molecular weights of the base oils.
Ester description Carbon Hydrogen Oxygen Molecular
Weight g/mol
PE with all n-C5 acid 41 76 8 472.619
PE with all n-C7 acid 33 60 8 584.835
PE with all n-C9 acid 25 44 8 697.051
TMP with all n-C7 acid 27 50 6 470.691
NGP with all n-C7 acid 19 36 4 328.493
The kinematic viscosities for the formulated oils provided are shown in Table 6 with their
corresponding viscosities at 40 and 100 °C.
Table 6- Table of the fully formulated blends viscosities at 40 and 100°C.
Kinematic Viscosity at 40 °C
(cSt)/ (mm2/ s)
Kinematic Viscosity at 100 °C
(cSt))/ (mm2/ s)
High 66.1 8.04
Medium High 52.4 6.93
Medium Low 31.5 4.99
Low 12.6 3.08

32
7.1.28.1.2 Temperature and viscosity prediction using ASTM D341
The ASTM method D341 was used to calculate the temperature at which each oil has certain
viscosity (1). The example shown here is for the fully formulated blends, but the same method was
done for the pure baseoil blends. To predict the temperature at which the oils are 5 cSt, at least two
measured viscosities are needed for each oil at known temperatures. Using equations ( 4 ), ( 5 ) and (
6 ), the kinematic viscosities can be calculated by plotting a line of LogT against LogLogZ as shown in
Figure 11.
𝐿𝑜𝑔𝐿𝑜𝑔𝑍 = 𝐴 − 𝐵𝐿𝑜𝑔𝑇 ( 4 )
𝑍 = 𝑣 + 𝑒(−1.47−1.84𝑣−0.51𝑣2) ( 5 )
𝑣 = (𝑍 − 0.7) + 𝑒(0.7487−3.295(𝑍−0.7)+0.6119(𝑍−0.7)2−0.3193(𝑍−0.7)3) ( 6 )
Temperature (°C) LogT (T converted
into K)
Kinematic Viscosity
(cSt)
LogLogZ
40 2.4958 66.1 0.2612
100 2.5719 8.04 -0.0262
150 2.6265 3.19 -0.2289
Table 7 - Table showing the measured kinematic viscosities and at measured temperatures and the calculated values for LogT and LogLogZ.
The kinematic viscosities at 40 and 100°C were provided by the supplier and the viscosity at 150°C
was measured using ASTM D445.
Figure 11 - Graph of LogT against LogLogZ to predict kinematic viscosities at certain temperatures using ASTM D341.

33
From the graph the values of A and B in equation ( 4 ) are the intercept and gradient of the line
created respectively. Using this, the temperatures at which each oil is 5 cSt were calculated and are
shown in Table 8.
Table 8 - Table showing the temperatures at which each oil has a kinematic viscosity of 5 cSt and the measured viscosity at that temperature to confirm the viscosity (measured by Intertek West Thurrock using method IP 71 REF).
Oil
Temperature at which the
oil has a kinematic viscosity of 5
cSt (°C)
Measured viscosity at
the corresponding
temperature (cSt)
High 122.8 5.036
Medium High 115.9 5.021
Medium Low 100.6 5.130
Low 74.9 5.187
From the provided kinematic viscosities, the kinematic viscosity can be estimated at the test
temperatures using ASTM D341 and these can be seen in Table 9.
Table 9 – The estimated kinematic viscosities using ASTM D341 of the base oils at the temperatures tested.
Ester description Kinematic Viscosity cSt
60 °C 80 °C 100 °C 120 °C
PE with all n-C5 acid
8.48 5.29 3.92 2.65
PE with all n-C7 acid
11.40 6.95 4.66 3.36
PE with all n-C9 acid
15.65 9.33 6.14 4.35
TMP with all n-C7 acid
7.82 4.94 3.41 2.51
NGP with all n-C7 acid
3.61 2.54 1.91 1.52
The lubricants were also tested at the same viscosity by varying the test temperature for each base
oil. These temperatures were also calculated using ASTM D341 and can be seen in Table 10.
Table 10 – Table showing the calculated temperatures at which the base oils have the following viscosities.
Ester description
Temperature at which the lubricant has a kinematic viscosity of (°C)
2.9 cSt 5 cSt 7.3 cSt
PE with all n-C5 acid
113.8 82.5 65.9
PE with all n-C7 acid
130.2 96.2 77.8

34
PE with all n-C9 acid
149 111.5 91.3
TMP with all n-C7 acid
110.1 79.4 62.7
NGP with all n-C7 acid
71.9 44.8 30
7.1.38.1.3 Calculation of the dynamic viscosities required for the Hersey Number
The density of these fluids was also required such that their dynamic viscosity could be calculated
which was needed to calculate the Hersey number.
Table 11 –Densities pure base oils.
NPG, all C7 acids
TMP, all C7 acids
PE, all C5 acids
PE, all C7 acids
PE, all C9 acids
Density of Liquids, 15.6 °C 0.9291 0.9628 1.022 0.9809 0.9569
The dynamic viscosity has been calculated from the density multiplied by the kinematic viscosities in
Table 9 and then converted from cP to Pa. s by multiplying by 10-3. These dynamic viscosities can be
seen in Table 12. The density will change with temperature, but only the density at 15.6 °C could be
acquired and hence the dynamic viscosities have been estimated using this.
Table 12 – Dynamic viscosities at of the pure base oils at a range of temperatures.
Pa. s Dynamic Viscosity Pa. s
60 °C 80 °C 100 °C 120 °C
NPG, all C7 acids 0.003354 0.00236 0.001775 0.001412
TMP, all C7 acids 0.007529 0.004756 0.003283 0.002417
PE, all C5 acids 0.008667 0.005406 0.004006 0.002708
PE, all C7 acids 0.011182 0.006817 0.004571 0.003296
PE, all C9 acids 0.014975 0.008928 0.005875 0.004163
Hence the dynamic viscosities can also be calculated for when they were all tested at different
temperature to achieve the same kinematic viscosity, these can be seen in Table 13.
Table 13 - Dynamic viscosities calculated from the kinematic viscosity.
Ester description
Dynamic viscosities calculated from the kinematic viscosity (Pa. s)
2.9 cSt 5 cSt 7.3 cSt
NPG, all C7 acids 0.00269439 0.0046455 0.0074606
TMP, all C7 acids 0.00279212 0.004814 0.00702844
35
PE, all C5 acids 0.0029638 0.00511 0.0074606
PE, all C7 acids 0.00284461 0.0049045 0.00716057
PE, all C9 acids 0.00277501 0.0047845 0.00698537
7.1.48.1.4 Estimation of the pressure viscosity coefficient at different test
temperatures
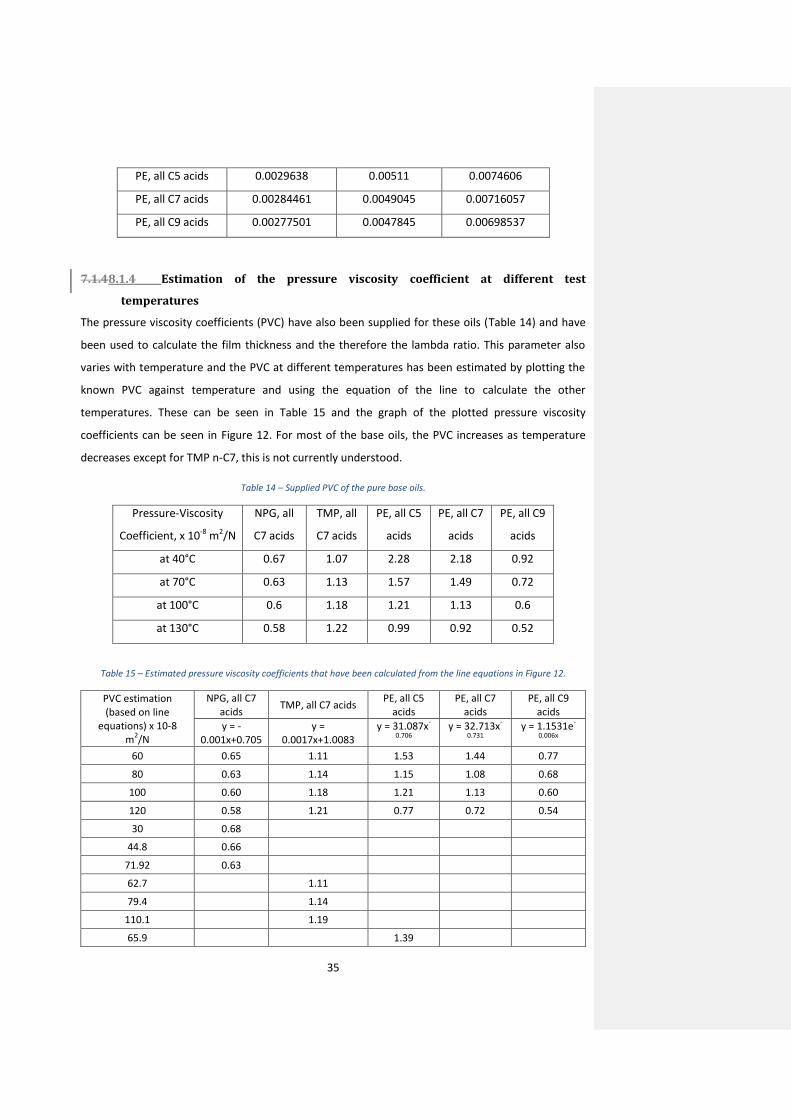
The pressure viscosity coefficients (PVC) have also been supplied for these oils (Table 14) and have
been used to calculate the film thickness and the therefore the lambda ratio. This parameter also
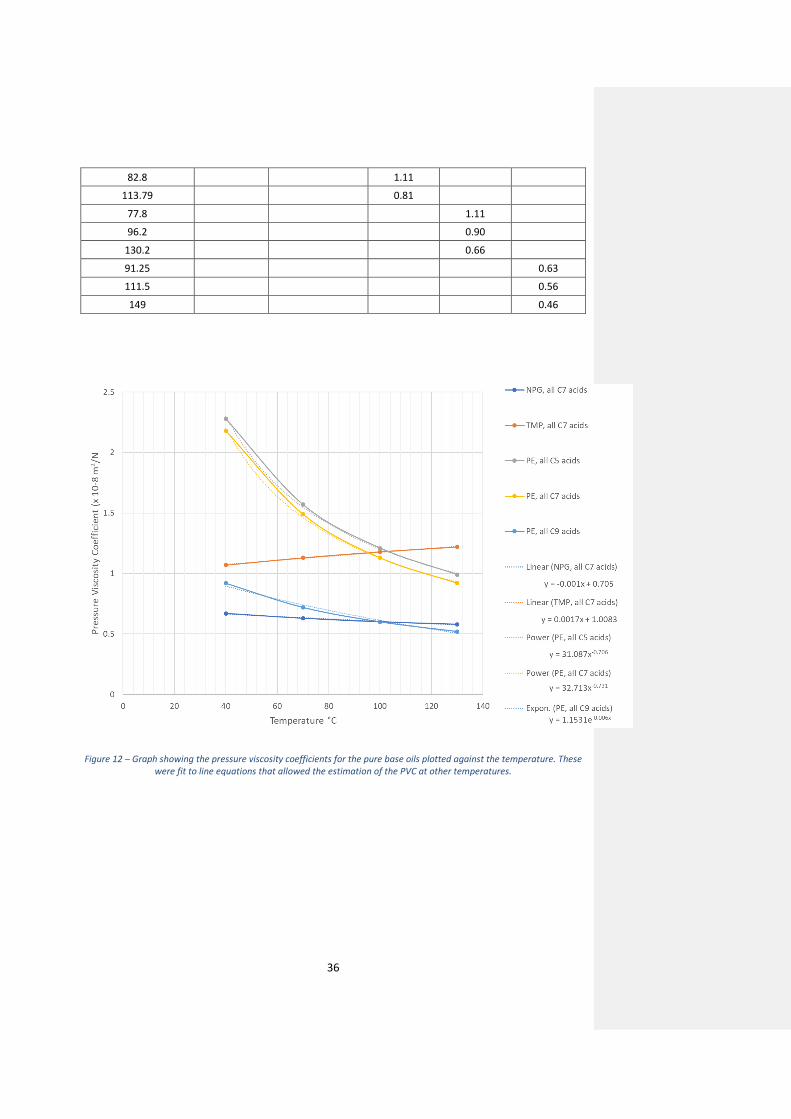
varies with temperature and the PVC at different temperatures has been estimated by plotting the
known PVC against temperature and using the equation of the line to calculate the other
temperatures. These can be seen in Table 15 and the graph of the plotted pressure viscosity
coefficients can be seen in Figure 12. For most of the base oils, the PVC increases as temperature
decreases except for TMP n-C7, this is not currently understood.
Table 14 – Supplied PVC of the pure base oils.
Pressure-Viscosity
Coefficient, x 10-8 m2/N
NPG, all
C7 acids
TMP, all
C7 acids
PE, all C5
acids
PE, all C7
acids
PE, all C9
acids
at 40°C 0.67 1.07 2.28 2.18 0.92
at 70°C 0.63 1.13 1.57 1.49 0.72
at 100°C 0.6 1.18 1.21 1.13 0.6
at 130°C 0.58 1.22 0.99 0.92 0.52
Table 15 – Estimated pressure viscosity coefficients that have been calculated from the line equations in Figure 12.
PVC estimation (based on line
equations) x 10-8 m
2/N
NPG, all C7 acids
TMP, all C7 acids PE, all C5
acids PE, all C7
acids PE, all C9
acids
y = -0.001x+0.705
y = 0.0017x+1.0083
y = 31.087x-
0.706 y = 32.713x
-
0.731 y = 1.1531e
-
0.006x
60 0.65 1.11 1.53 1.44 0.77
80 0.63 1.14 1.15 1.08 0.68
100 0.60 1.18 1.21 1.13 0.60
120 0.58 1.21 0.77 0.72 0.54
30 0.68
44.8 0.66
71.92 0.63
62.7
1.11
79.4
1.14
110.1
1.19
65.9
1.39
36
82.8
1.11
113.79
0.81
77.8
1.11
96.2
0.90
130.2
0.66
91.25
0.63
111.5
0.56
149
0.46
Figure 12 – Graph showing the pressure viscosity coefficients for the pure base oils plotted against the temperature. These were fit to line equations that allowed the estimation of the PVC at other temperatures.
37
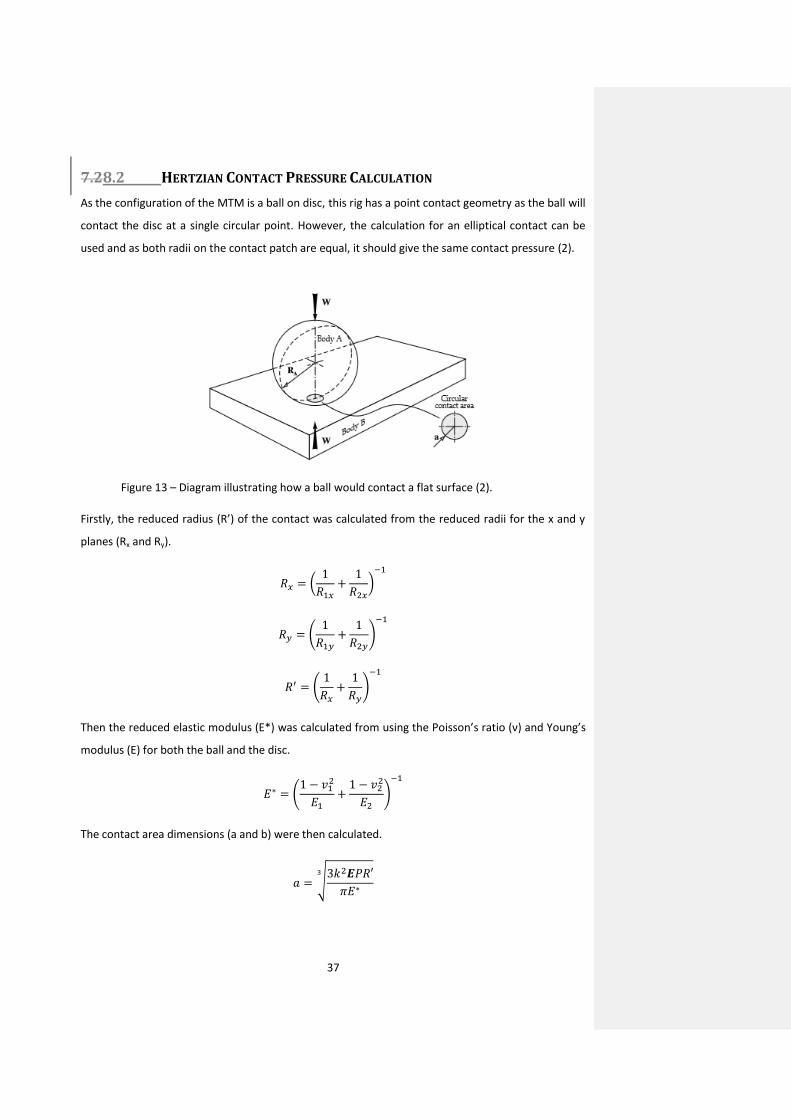
7.28.2 HERTZIAN CONTACT PRESSURE CALCULATION
As the configuration of the MTM is a ball on disc, this rig has a point contact geometry as the ball will
contact the disc at a single circular point. However, the calculation for an elliptical contact can be
used and as both radii on the contact patch are equal, it should give the same contact pressure (2).
Figure 13 – Diagram illustrating how a ball would contact a flat surface (2).
Firstly, the reduced radius (R’) of the contact was calculated from the reduced radii for the x and y
planes (Rx and Ry).
𝑅𝑥 = (1
𝑅1𝑥+
1
𝑅2𝑥)
−1
𝑅𝑦 = (1
𝑅1𝑦+
1
𝑅2𝑦)
−1
𝑅′ = (1
𝑅𝑥+
1
𝑅𝑦)
−1
Then the reduced elastic modulus (E*) was calculated from using the Poisson’s ratio (ν) and Young’s
modulus (E) for both the ball and the disc.
𝐸∗ = (1 − 𝑣1
2
𝐸1+
1 − 𝑣22
𝐸2)
−1
The contact area dimensions (a and b) were then calculated.
𝑎 = √3𝑘2𝑬𝑃𝑅′
𝜋𝐸∗
3
38
𝑏 = √3𝑬𝑃𝑅′
𝜋𝑘𝐸∗
3
Where P is the normal load, k is the ellipticity parameter and E is the elliptic integral of the second
kind.
𝑘 = 1.0339 (𝑅𝑦
𝑅𝑥)
0.6360
𝑬 = 1.0003 +0.5968𝑅𝑥
𝑅𝑦
Then finally the maximum contact pressure (p0) can be calculated.
𝑝0 =3𝑃
2𝜋𝑎𝑏
39
7.38.3 DOWSON & HIGGINSON FILM THICKNESS AND LAMBDA RATIO
CALCULATION
The lubrication regimes defined by the lambda ratio are derived from film thickness calculations,
these equations were derived empirically by Dowson and Higginson in 1977 (3; 2; 4).
The minimum film thickness (hmin) was calculated from the individually calculated material
parameter (G), speed parameter (U) and the parameter (W).
ℎ𝑚𝑖𝑛
𝑅′= 2.65𝐺0.54𝑈0.7𝑊−0.13
𝑊 =𝑃
2𝐸∗𝑅′𝐿
𝑈 =𝜂0𝑢
2𝐸∗𝑅′
𝐺 = 2𝛼𝐸∗
The length of the contact area (L) is the diameter of the contact area (2 times a), η0 is the dynamic
viscosity of the lubricant at ambient pressure, u is the entrainment speed and α is the pressure -
viscosity coefficient.
After the film thickness was calculated, the lambda ratio can be deduced using the roughnesses both
the ball and the disc.
𝜆 =ℎ
√𝜎12 + 𝜎2
2
The lambda ratio gives an indication of the lubrication regime that a contact is operating in and can
be simplified into the following.
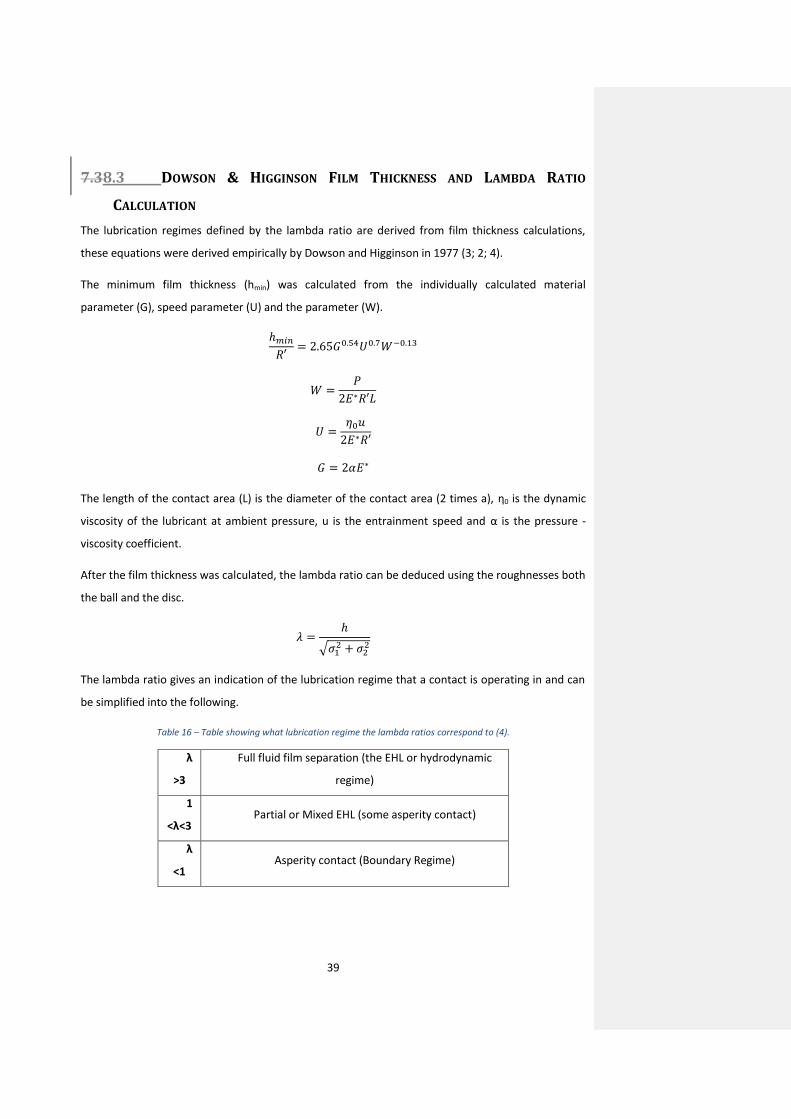
Table 16 – Table showing what lubrication regime the lambda ratios correspond to (4).
λ
>3
Full fluid film separation (the EHL or hydrodynamic
regime)
1
<λ<3 Partial or Mixed EHL (some asperity contact)
λ
<1 Asperity contact (Boundary Regime)
40
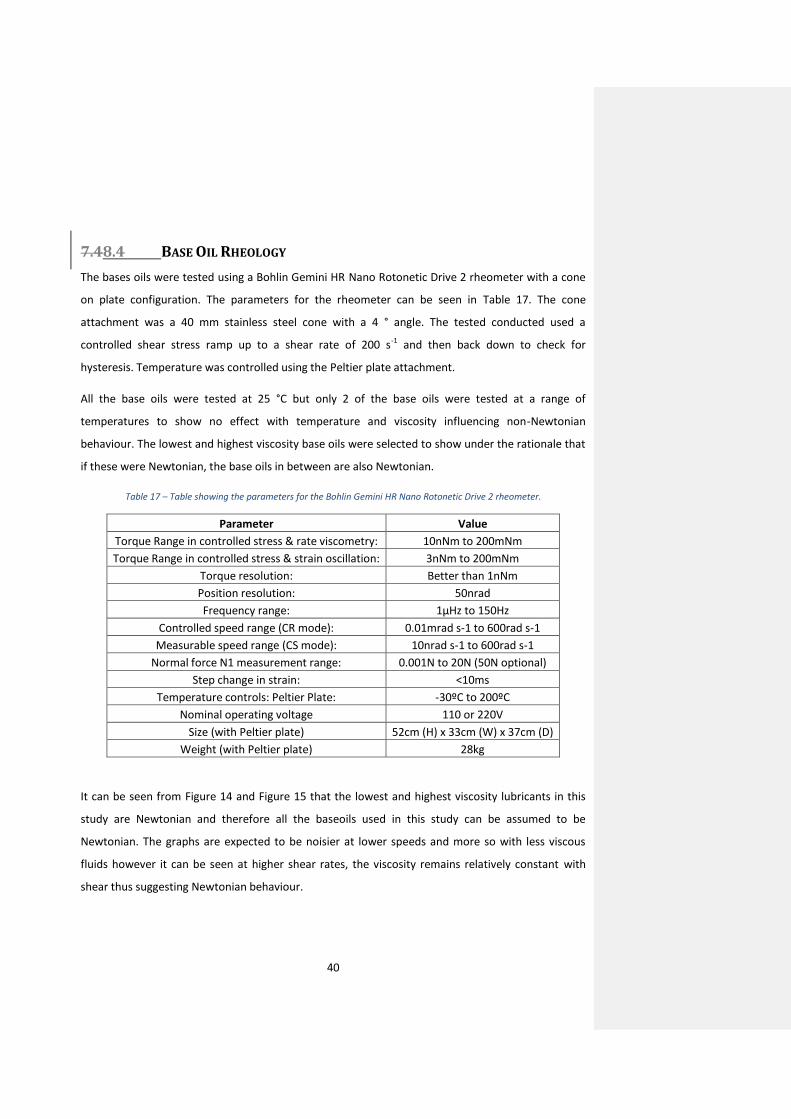
7.48.4 BASE OIL RHEOLOGY
The bases oils were tested using a Bohlin Gemini HR Nano Rotonetic Drive 2 rheometer with a cone
on plate configuration. The parameters for the rheometer can be seen in Table 17. The cone
attachment was a 40 mm stainless steel cone with a 4 ° angle. The tested conducted used a
controlled shear stress ramp up to a shear rate of 200 s-1 and then back down to check for
hysteresis. Temperature was controlled using the Peltier plate attachment.
All the base oils were tested at 25 °C but only 2 of the base oils were tested at a range of
temperatures to show no effect with temperature and viscosity influencing non-Newtonian
behaviour. The lowest and highest viscosity base oils were selected to show under the rationale that
if these were Newtonian, the base oils in between are also Newtonian.
Table 17 – Table showing the parameters for the Bohlin Gemini HR Nano Rotonetic Drive 2 rheometer.
Parameter Value
Torque Range in controlled stress & rate viscometry: 10nNm to 200mNm
Torque Range in controlled stress & strain oscillation: 3nNm to 200mNm
Torque resolution: Better than 1nNm
Position resolution: 50nrad
Frequency range: 1µHz to 150Hz
Controlled speed range (CR mode): 0.01mrad s-1 to 600rad s-1
Measurable speed range (CS mode): 10nrad s-1 to 600rad s-1
Normal force N1 measurement range: 0.001N to 20N (50N optional)
Step change in strain: <10ms
Temperature controls: Peltier Plate: -30ºC to 200ºC
Nominal operating voltage 110 or 220V
Size (with Peltier plate) 52cm (H) x 33cm (W) x 37cm (D)
Weight (with Peltier plate) 28kg
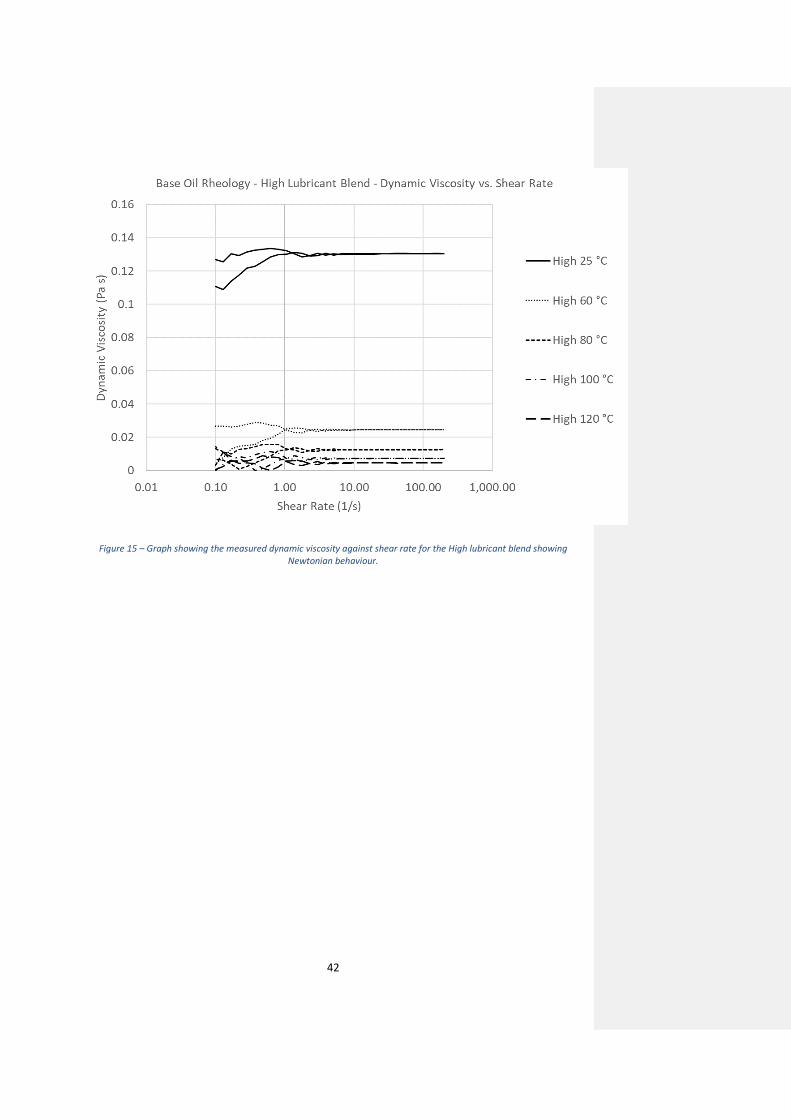
It can be seen from Figure 14 and Figure 15 that the lowest and highest viscosity lubricants in this
study are Newtonian and therefore all the baseoils used in this study can be assumed to be
Newtonian. The graphs are expected to be noisier at lower speeds and more so with less viscous
fluids however it can be seen at higher shear rates, the viscosity remains relatively constant with
shear thus suggesting Newtonian behaviour.

41
Figure 14 – Graph showing the measured dynamic viscosity against shear rate for NPGC7 showing Newtonian behaviour.
42
Figure 15 – Graph showing the measured dynamic viscosity against shear rate for the High lubricant blend showing Newtonian behaviour.