University of Arkansas Annual Financial Report 2011-2012
99
University of Arkansas Annual Financial Report 2011-2012
Transcript of University of Arkansas Annual Financial Report 2011-2012

University of Arkansas Annual Financial Report 2011-2012

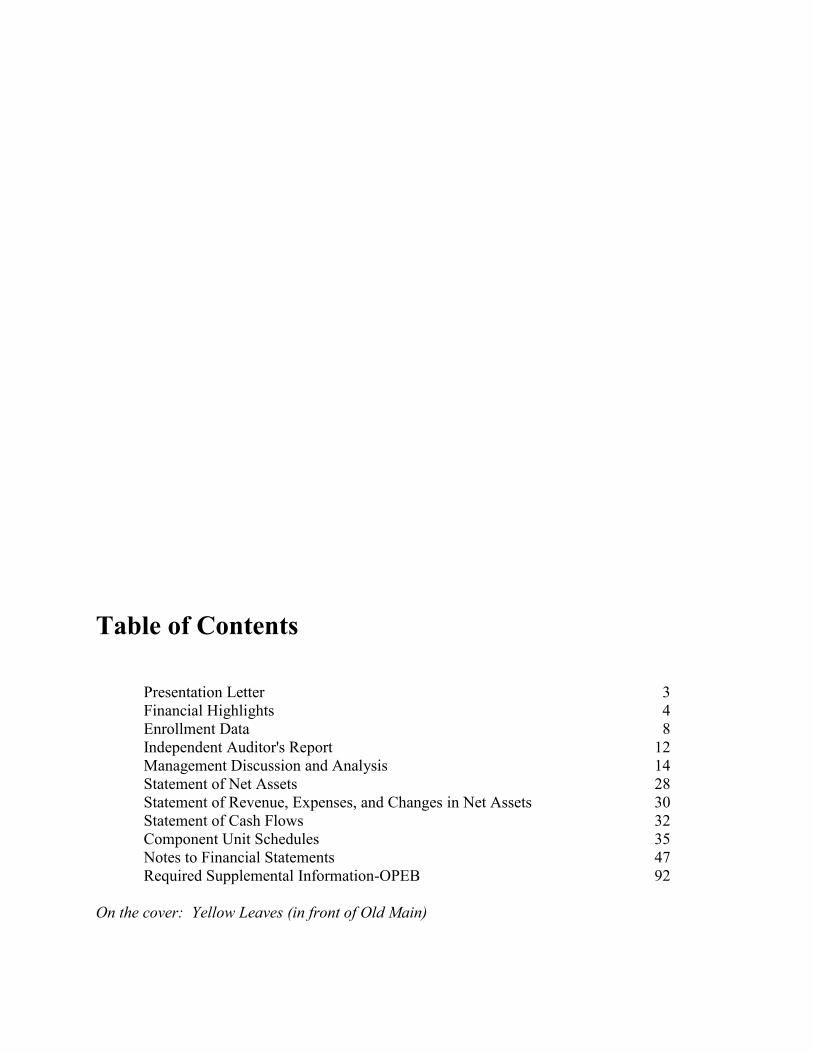
Table of Contents Presentation Letter 3 Financial Highlights 4 Enrollment Data 8 Independent Auditor's Report 12 Management Discussion and Analysis 14 Statement of Net Assets 28 Statement of Revenue, Expenses, and Changes in Net Assets 30 Statement of Cash Flows 32 Component Unit Schedules 35 Notes to Financial Statements 47 Required Supplemental Information-OPEB 92 On the cover: Yellow Leaves (in front of Old Main)

3

FISCAL YEAR 2012 OPERATING REVENUES
Student tuition and fees
130,571,742 Federal appropriations
11,615,106
County appropriations
3,383,149 Federal grants and contracts
38,448,980
State and local grants and contracts
17,502,653 Non-governmental grants and contracts
18,256,503
Sales and services of educational departments
22,394,961 Auxiliary enterprises
119,122,412
Other operating revenues
8,364,263
Total operating revenues
369,659,769
FISCAL YEAR 2012 NONOPERATING REVENUES
State appropriations
201,724,363 Gifts
66,051,112
Investment income
5,997,430 Federal grants (non-exchange)
24,822,337
State & local grants (non-exchange)
33,249,890 Non-governmental grants (non-exchange)
831,557
Other nonoperating revenues
2,980,378
Total nonoperating revenues
335,657,067
4
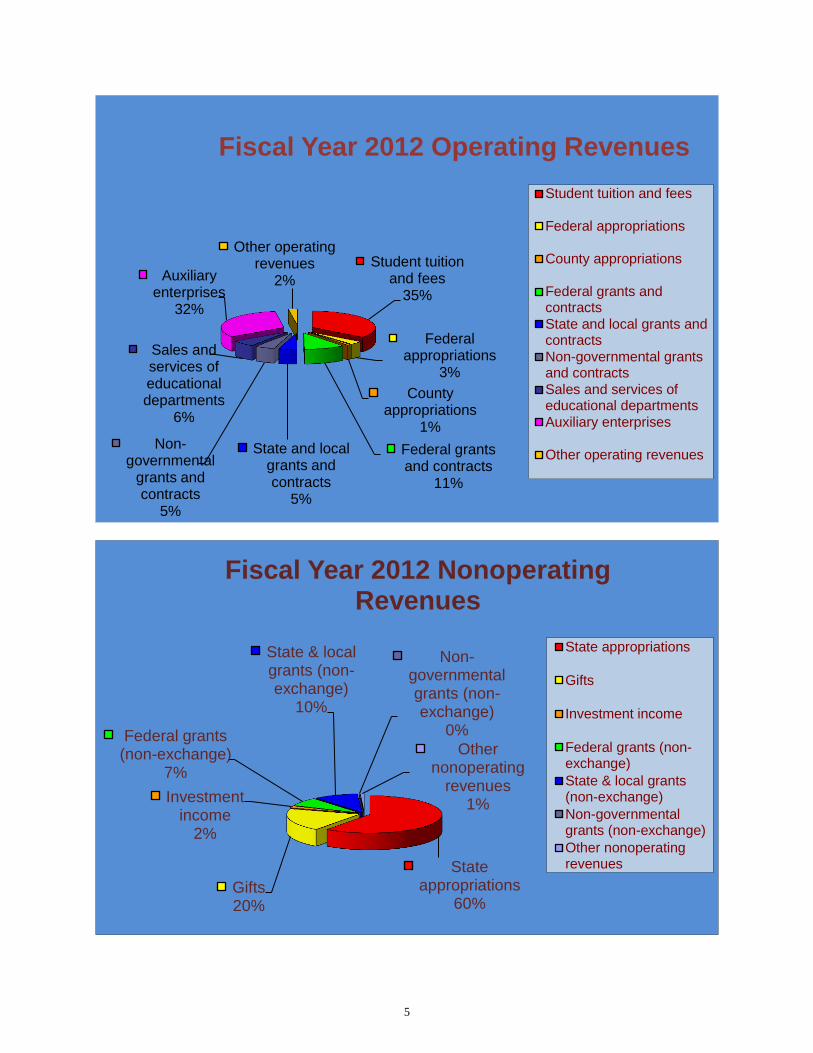
Student tuition and fees
35%
Federal appropriations
3%
County appropriations
1%
Federal grants and contracts
11%
State and local grants and contracts
5%
Non-governmental
grants and contracts
5%
Sales and services of educational departments
6%
Auxiliary enterprises
32%
Other operating revenues
2%
Fiscal Year 2012 Operating Revenues
Student tuition and fees
Federal appropriations
County appropriations
Federal grants andcontracts
State and local grants andcontracts
Non-governmental grantsand contracts
Sales and services ofeducational departments
Auxiliary enterprises
Other operating revenues
State appropriations
60% Gifts 20%
Investment income
2%
Federal grants (non-exchange)
7%
State & local grants (non-exchange)
10%
Non-governmental grants (non-exchange)
0%
Other nonoperating
revenues 1%
Fiscal Year 2012 Nonoperating Revenues
State appropriations
Gifts
Investment income
Federal grants (non-exchange)
State & local grants(non-exchange)
Non-governmentalgrants (non-exchange)
Other nonoperatingrevenues
5
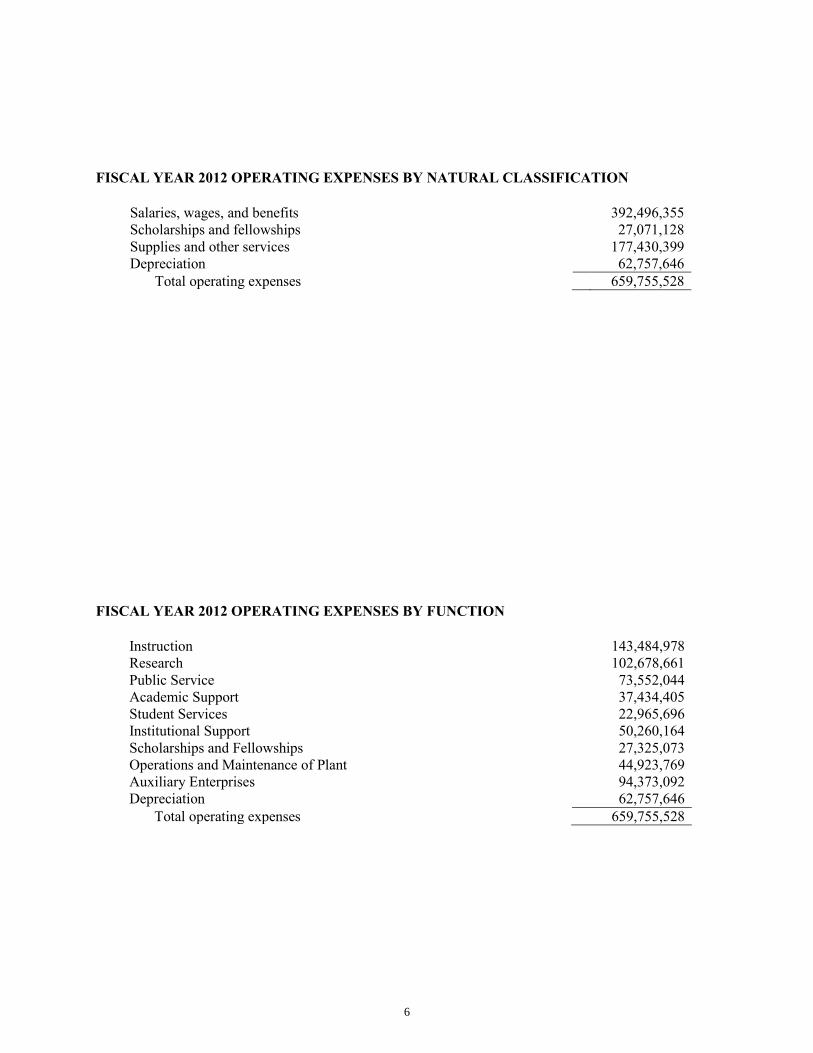
FISCAL YEAR 2012 OPERATING EXPENSES BY NATURAL CLASSIFICATION
Salaries, wages, and benefits
392,496,355 Scholarships and fellowships
27,071,128
Supplies and other services
177,430,399 Depreciation
62,757,646
Total operating expenses
659,755,528
FISCAL YEAR 2012 OPERATING EXPENSES BY FUNCTION
Instruction
143,484,978 Research
102,678,661
Public Service
73,552,044 Academic Support
37,434,405
Student Services
22,965,696 Institutional Support
50,260,164
Scholarships and Fellowships 27,325,073 Operations and Maintenance of Plant 44,923,769 Auxiliary Enterprises
94,373,092
Depreciation
62,757,646
Total operating expenses
659,755,528
6

Salaries, wages, and
benefits 59%
Scholarships and fellowships
4%
Supplies and other services
27%
Depreciation 10%
Fiscal Year 2012 Operating Expenses by Natural
Classification Salaries, wages,and benefits
Scholarships andfellowships
Supplies andother services
Depreciation
Instruction 22%
Research 16%
Public Service 11% Academic
Support 6%
Student Services 3%
Institutional Support
8%
Scholarships and Fellowships
4%
Operations and Maintenance of
Plant 7%
Auxiliary Enterprises
14% Depreciation
9%
Fiscal Year 2012 Operating Expenses by Function
Instruction
Research
Public Service
Academic Support
Student Services
Institutional Support
Scholarships andFellowships
Operations andMaintenance of Plant
Auxiliary Enterprises
Depreciation
7

14,948 15,426 15,835
17,247
19,027
3,297 3,370 3,616 3,770 3,759
403 398 398 388 413 0
2,000
4,000
6,000
8,000
10,000
12,000
14,000
16,000
18,000
20,000
2007 2008 2009 2010 2011
ENROLLMENT TREND OVER LAST FIVE YEARS (FALL SEMESTER)
Undergraduate
Graduate
Law
8

IN-STATE ENROLLMENT BY COUNTY OF ORIGIN
9
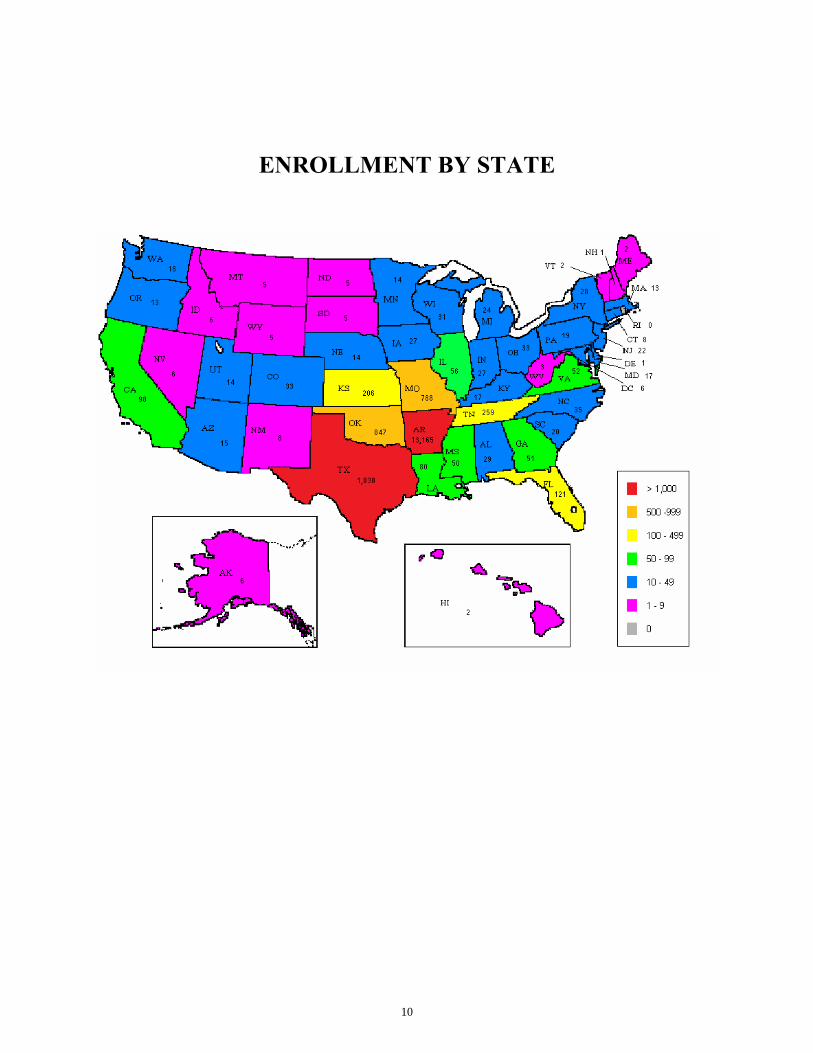
ENROLLMENT BY STATE
10
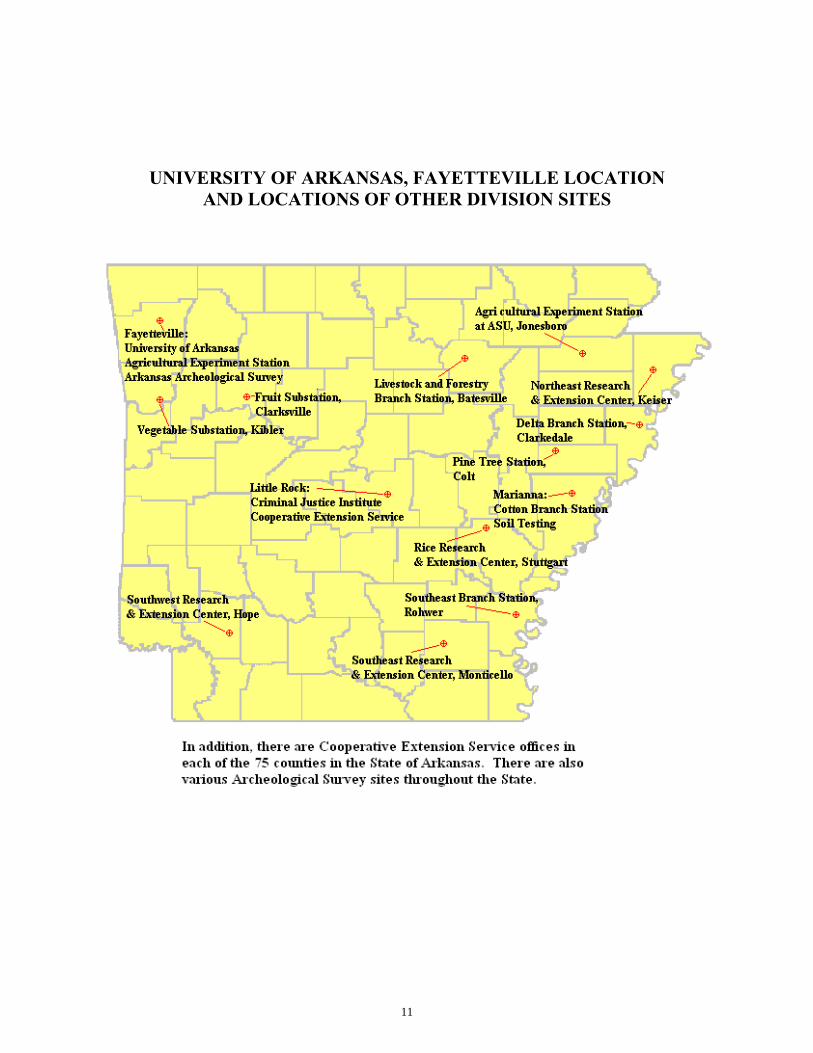
UNIVERSITY OF ARKANSAS, FAYETTEVILLE LOCATION AND LOCATIONS OF OTHER DIVISION SITES
11

12

13

MANAGEMENT’S DISCUSSION AND ANALYSIS The following discussion and analysis provides an overview of the financial position of the University of Arkansas, Fayetteville (the University) for the year ended June 30, 2012, with fiscal year ended June 30, 2011 data presented for comparative purposes. The emphasis of the discussion concerning the financial statements will be for the current year. Management has prepared this discussion, along with the financial statements and related note disclosures, and it should be read in conjunction with financial statements and notes to the financial statements. The financial statements, notes and discussion are the responsibility of management. All references to “2012”, “2011” or another year refer to the fiscal year ended June 30, unless otherwise noted. The University is the largest and oldest state institution of higher education in Arkansas. Established in 1871 under the provisions of the Morrill Act, it is the state’s first land-grant institution and the flagship of the University of Arkansas System. Recognized as a Carnegie Research University, the university is classified as a ‘very high research activity’ institution, the highest classification possible. As the state’s only comprehensive research university, and one of a select group of institutions nationwide with the highest Carnegie classification, the University is positioned to be a nationally and internationally influential research university. The continued productivity in advancing higher learning and stimulating economic opportunity reflects the return on investment the University is producing for Arkansas, our nation and our many public and private sector partners. The University’s growing reputation for academic excellence and student-centeredness was underscored in the U.S. News & World Report’s “Best Colleges 2013” publication. A national survey of higher education leaders selected the University as one of the nation’s top ten ‘up and coming’ public universities. All programs and activities of the University are governed by the University of Arkansas Board of Trustees, which has delegated to the System President the administrative authority for all aspects of operations. The System President has further delegated administrative authority to the Chancellor and Vice President for Agriculture, who have responsibility for the programs and activities of the colleges, schools and divisions presented in this financial report. Overview of the Financial Report and Financial Analysis The University’s financial report includes three primary financial statements: the Statement of Net Assets, the Statement of Revenues, Expenses, and Changes in Net Assets and the Statement of Cash Flows. The financial statements of three component units are presented discretely from the University. The notes to the financial statements provide additional information that is essential to understanding the primary financial statements. Other required supplementary information provides additional information related to other post employment benefits. Financial statements are presented in accordance with Governmental Accounting Standards Board (GASB) Statement No. 35, Basic Financial Statements-and Management’s Discussion and Analysis-for Public Colleges and Universities. The statement establishes standards for
14

financial reporting of public colleges and universities and requires that financial statements be presented on an entity-wide basis to focus on the University as a whole. Statements are prepared using the accrual basis of accounting, which is consistent with the accounting method used by private-sector entities. All of the current year’s revenues and expenses are recognized when earned or incurred, regardless of when cash is received or paid. The University has identified three foundations as component units subject to inclusion in the financial report: the University of Arkansas Fayetteville Campus Foundation, Inc., the Razorback Foundation, Inc., and the Arkansas 4-H Foundation, Inc. As component units, their financial information is included in our financial report in accordance with GASB Statement No. 39, Determining Whether Certain Organizations Are Component Units. This statement provides criteria for determining which related organizations should be reported as component units based on the nature and significance of their relationship to the primary government, which is the University. Additional information regarding this reporting requirement is provided at Notes to the Financial Statements (Note) No. 1 “Summary of Significant Accounting Policies”, under the “Component Units” heading. Note 17, “Other Entity” refers to the University of Arkansas Foundation, Inc., (the Foundation). The University is the beneficiary of only 50.7% of the net assets of the Foundation; therefore the Foundation does not meet the requirements of a component unit. Statement of Net Assets The Statement of Net Assets presents the assets, liabilities and net assets (assets minus liabilities) of the University. The purpose of the statement is to provide a fiscal snapshot of the University as of the end of the fiscal year. Assets and liabilities are presented in the order of their relative liquidity, and are identified as current or noncurrent. Current assets are those assets that can be realized, with relative ease, such as cash, in the coming year. Current liabilities are expected to be paid within the next year. Noncurrent assets and liabilities are not expected to be realized as cash or paid in the subsequent year. Net Assets are presented in four categories. The first category, Invested in capital assets, net of related debt, provides the University’s equity in property, plant and equipment net of depreciation. The next category is Restricted net assets – non-expendable. The corpus of non-expendable and restricted resources (endowments) is only available for investment purposes. The third category, Restricted net assets - expendable, are available for expenditure by the University, but must be spent for purposes as determined by donors and/or external entities that have placed time or purpose restrictions on the use of the resources. The final category, Unrestricted net assets, is the net assets available to the University for any lawful purpose of the University.
15
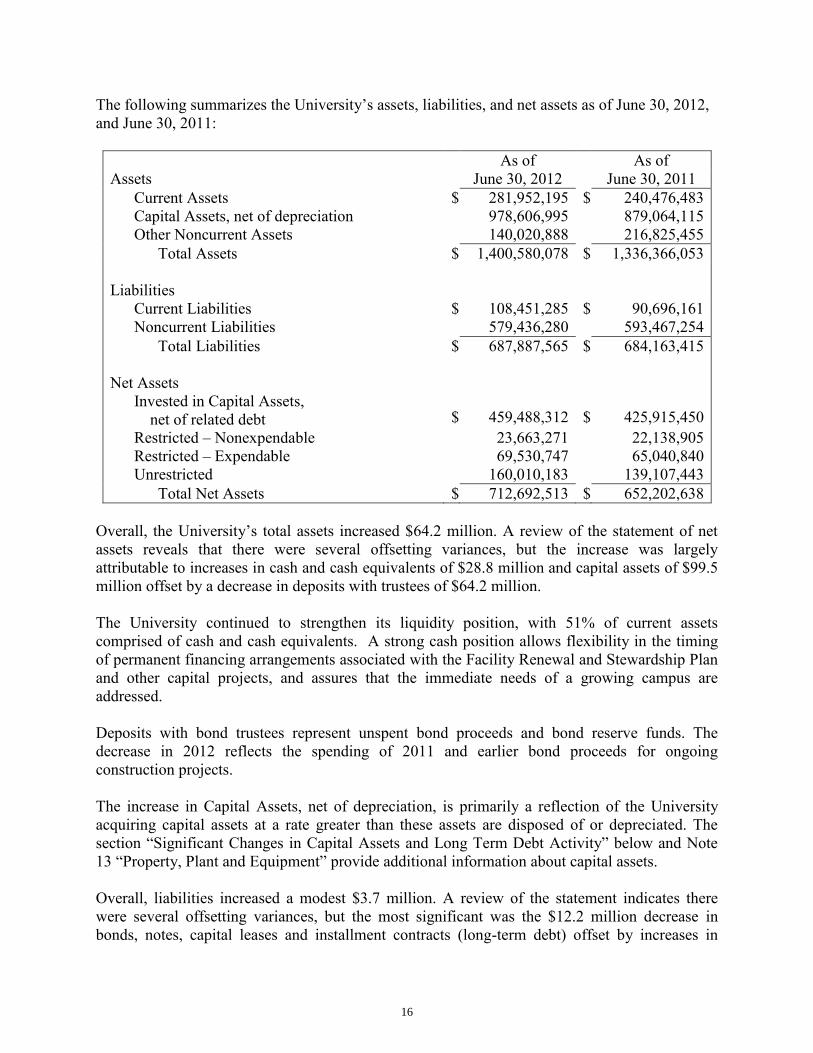
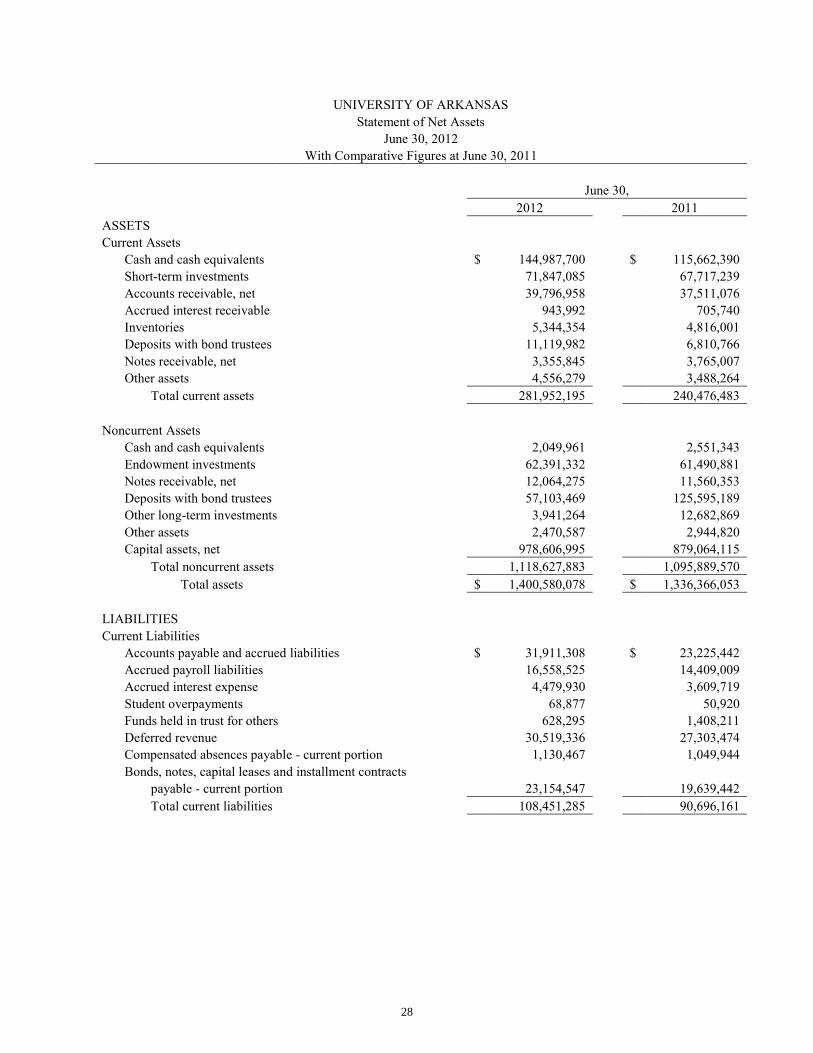
The following summarizes the University’s assets, liabilities, and net assets as of June 30, 2012, and June 30, 2011:
As of As of Assets June 30, 2012 June 30, 2011
Current Assets $ 281,952,195 $ 240,476,483 Capital Assets, net of depreciation 978,606,995 879,064,115 Other Noncurrent Assets 140,020,888 216,825,455
Total Assets $ 1,400,580,078 $ 1,336,366,053 Liabilities
Current Liabilities $ 108,451,285 $ 90,696,161 Noncurrent Liabilities 579,436,280 593,467,254
Total Liabilities $ 687,887,565 $ 684,163,415 Net Assets
Invested in Capital Assets, net of related debt $ 459,488,312 $ 425,915,450 Restricted – Nonexpendable 23,663,271 22,138,905 Restricted – Expendable 69,530,747 65,040,840 Unrestricted 160,010,183 139,107,443
Total Net Assets $ 712,692,513 $ 652,202,638 Overall, the University’s total assets increased $64.2 million. A review of the statement of net assets reveals that there were several offsetting variances, but the increase was largely attributable to increases in cash and cash equivalents of $28.8 million and capital assets of $99.5 million offset by a decrease in deposits with trustees of $64.2 million. The University continued to strengthen its liquidity position, with 51% of current assets comprised of cash and cash equivalents. A strong cash position allows flexibility in the timing of permanent financing arrangements associated with the Facility Renewal and Stewardship Plan and other capital projects, and assures that the immediate needs of a growing campus are addressed. Deposits with bond trustees represent unspent bond proceeds and bond reserve funds. The decrease in 2012 reflects the spending of 2011 and earlier bond proceeds for ongoing construction projects. The increase in Capital Assets, net of depreciation, is primarily a reflection of the University acquiring capital assets at a rate greater than these assets are disposed of or depreciated. The section “Significant Changes in Capital Assets and Long Term Debt Activity” below and Note 13 “Property, Plant and Equipment” provide additional information about capital assets. Overall, liabilities increased a modest $3.7 million. A review of the statement indicates there were several offsetting variances, but the most significant was the $12.2 million decrease in bonds, notes, capital leases and installment contracts (long-term debt) offset by increases in
16
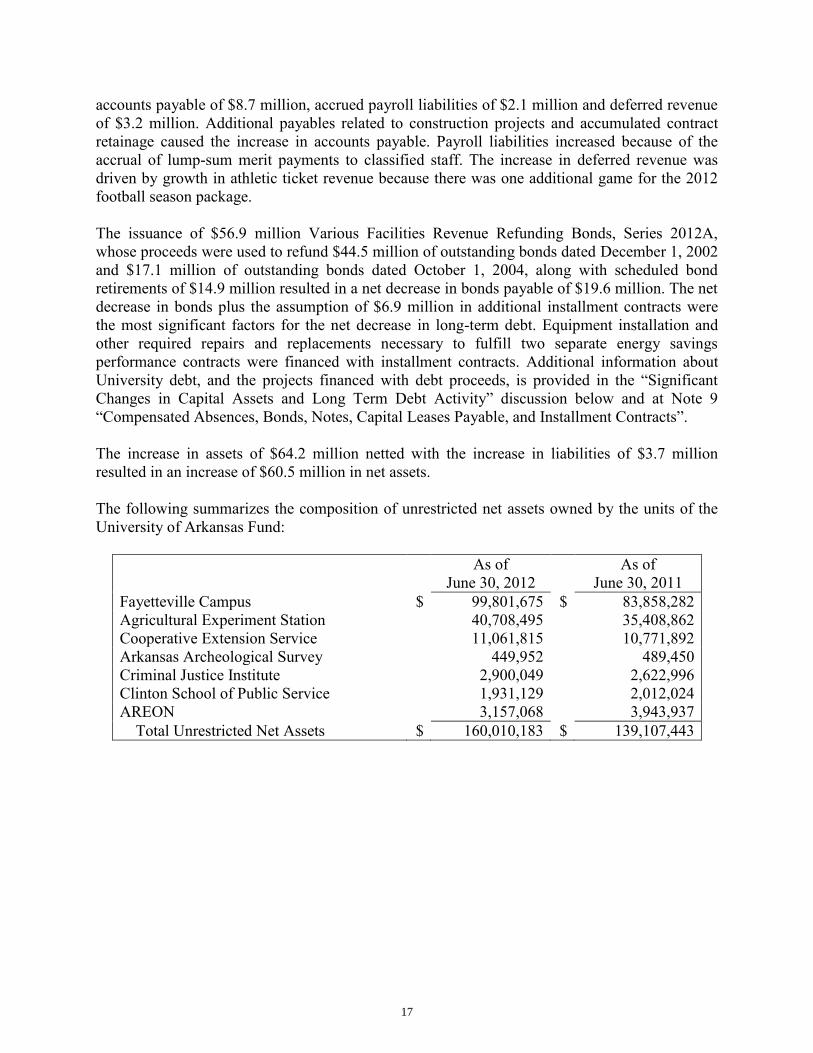
accounts payable of $8.7 million, accrued payroll liabilities of $2.1 million and deferred revenue of $3.2 million. Additional payables related to construction projects and accumulated contract retainage caused the increase in accounts payable. Payroll liabilities increased because of the accrual of lump-sum merit payments to classified staff. The increase in deferred revenue was driven by growth in athletic ticket revenue because there was one additional game for the 2012 football season package. The issuance of $56.9 million Various Facilities Revenue Refunding Bonds, Series 2012A, whose proceeds were used to refund $44.5 million of outstanding bonds dated December 1, 2002 and $17.1 million of outstanding bonds dated October 1, 2004, along with scheduled bond retirements of $14.9 million resulted in a net decrease in bonds payable of $19.6 million. The net decrease in bonds plus the assumption of $6.9 million in additional installment contracts were the most significant factors for the net decrease in long-term debt. Equipment installation and other required repairs and replacements necessary to fulfill two separate energy savings performance contracts were financed with installment contracts. Additional information about University debt, and the projects financed with debt proceeds, is provided in the “Significant Changes in Capital Assets and Long Term Debt Activity” discussion below and at Note 9 “Compensated Absences, Bonds, Notes, Capital Leases Payable, and Installment Contracts”. The increase in assets of $64.2 million netted with the increase in liabilities of $3.7 million resulted in an increase of $60.5 million in net assets. The following summarizes the composition of unrestricted net assets owned by the units of the University of Arkansas Fund:
As of June 30, 2012
As of June 30, 2011
Fayetteville Campus $ 99,801,675 $ 83,858,282 Agricultural Experiment Station 40,708,495 35,408,862 Cooperative Extension Service 11,061,815 10,771,892 Arkansas Archeological Survey 449,952 489,450 Criminal Justice Institute 2,900,049 2,622,996 Clinton School of Public Service 1,931,129 2,012,024 AREON 3,157,068 3,943,937 Total Unrestricted Net Assets $ 160,010,183 $ 139,107,443
17
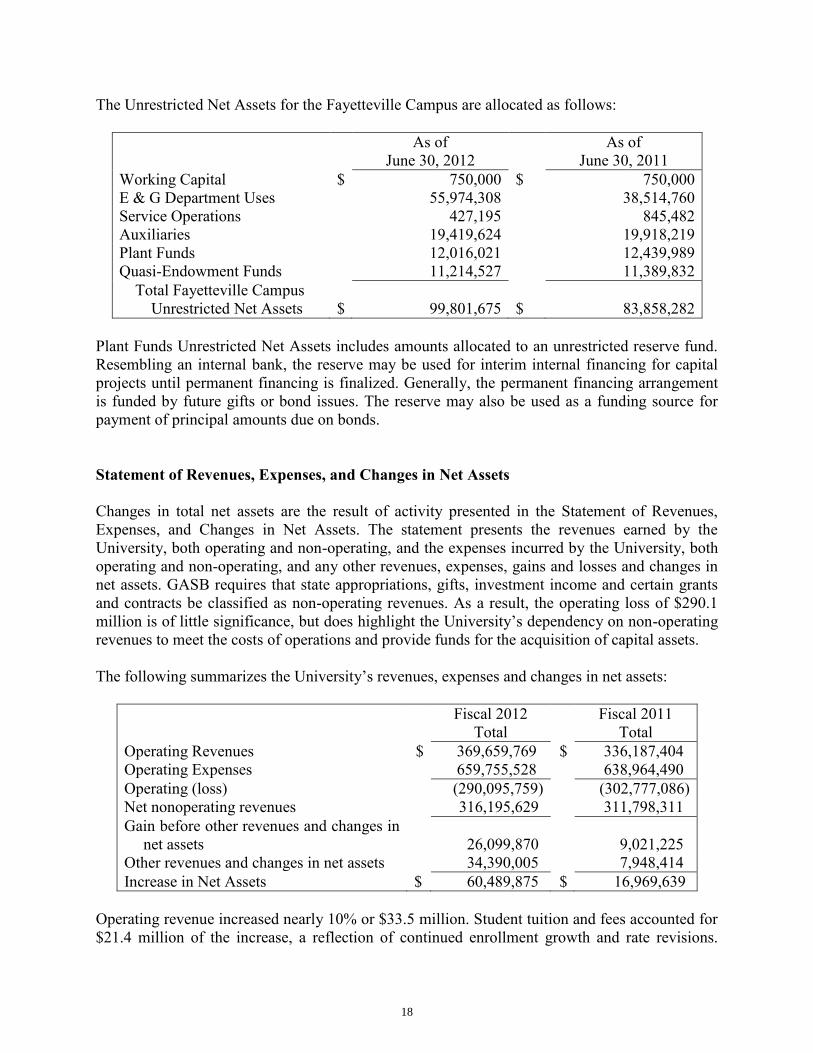
The Unrestricted Net Assets for the Fayetteville Campus are allocated as follows:
As of June 30, 2012
As of June 30, 2011
Working Capital $ 750,000 $ 750,000 E & G Department Uses 55,974,308 38,514,760 Service Operations 427,195 845,482 Auxiliaries 19,419,624 19,918,219 Plant Funds 12,016,021 12,439,989 Quasi-Endowment Funds 11,214,527 11,389,832 Total Fayetteville Campus Unrestricted Net Assets
$
99,801,675
$
83,858,282
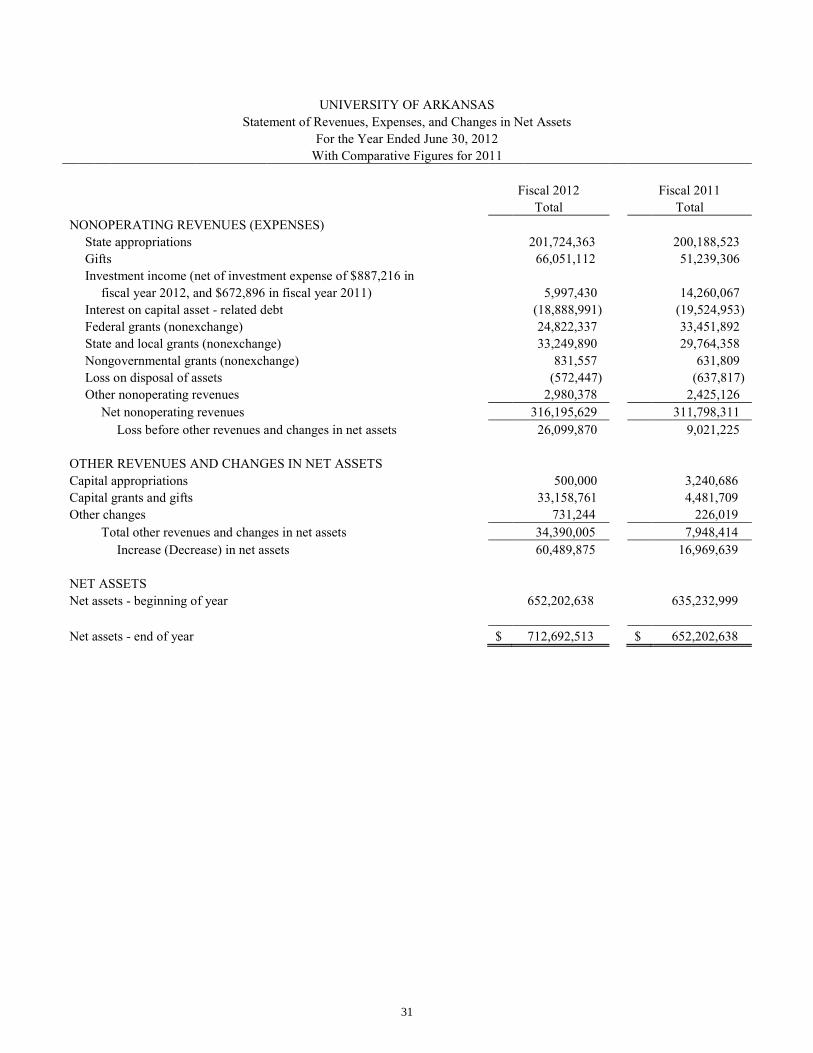
Plant Funds Unrestricted Net Assets includes amounts allocated to an unrestricted reserve fund. Resembling an internal bank, the reserve may be used for interim internal financing for capital projects until permanent financing is finalized. Generally, the permanent financing arrangement is funded by future gifts or bond issues. The reserve may also be used as a funding source for payment of principal amounts due on bonds. Statement of Revenues, Expenses, and Changes in Net Assets Changes in total net assets are the result of activity presented in the Statement of Revenues, Expenses, and Changes in Net Assets. The statement presents the revenues earned by the University, both operating and non-operating, and the expenses incurred by the University, both operating and non-operating, and any other revenues, expenses, gains and losses and changes in net assets. GASB requires that state appropriations, gifts, investment income and certain grants and contracts be classified as non-operating revenues. As a result, the operating loss of $290.1 million is of little significance, but does highlight the University’s dependency on non-operating revenues to meet the costs of operations and provide funds for the acquisition of capital assets. The following summarizes the University’s revenues, expenses and changes in net assets:
Fiscal 2012 Fiscal 2011 Total Total Operating Revenues $ 369,659,769 $ 336,187,404 Operating Expenses 659,755,528 638,964,490 Operating (loss) (290,095,759) (302,777,086) Net nonoperating revenues 316,195,629 311,798,311 Gain before other revenues and changes in
net assets
26,099,870
9,021,225 Other revenues and changes in net assets 34,390,005 7,948,414 Increase in Net Assets $ 60,489,875 $ 16,969,639
Operating revenue increased nearly 10% or $33.5 million. Student tuition and fees accounted for $21.4 million of the increase, a reflection of continued enrollment growth and rate revisions.
18
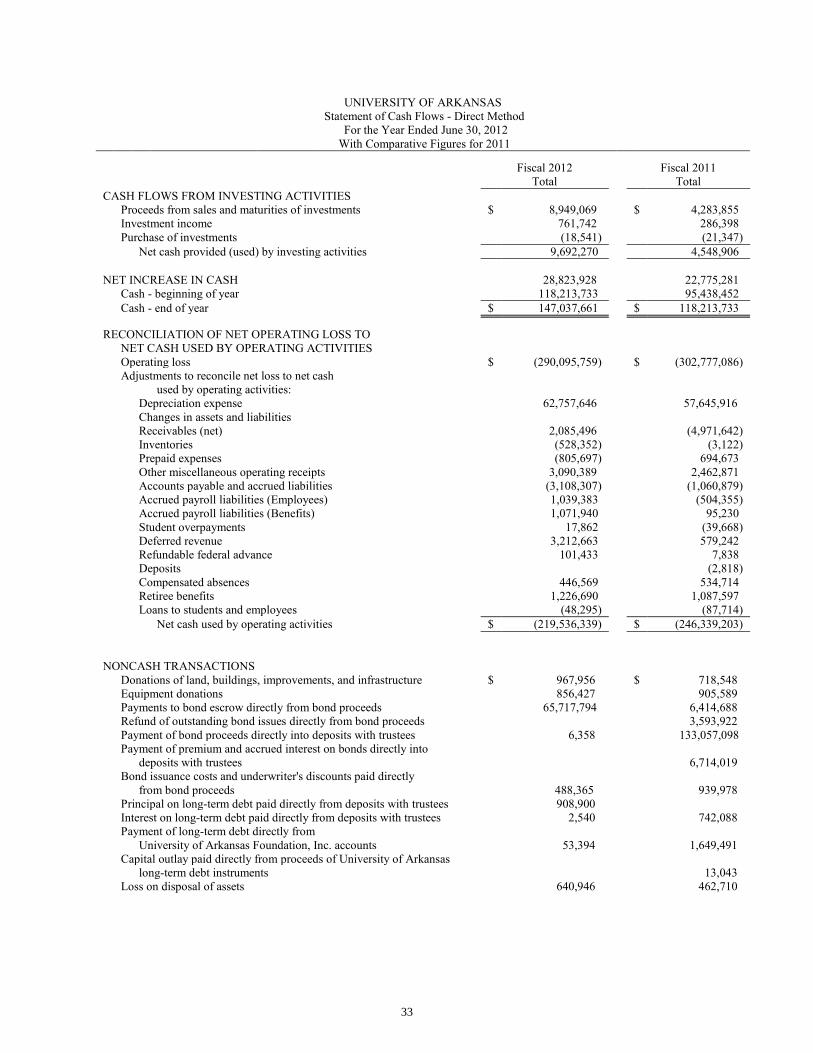
Sales and services of educational departments also increased $3.9 million demonstrating an overall growth in programs. Auxiliary enterprises revenue attributable to Athletics increased $4.1 million, largely due to growth in ticket revenue associated with increased attendance at men’s football and basketball events, and conference distributions for media revenue. Residence life, Bookstore and Transit and Parking also realized increases totaling $4.6 million collectively, demonstrating the impact of enrollment growth to demand for these services. Modest rate increases for housing and parking also contributed to auxiliary revenue growth. Federal research awards decreased $2.5 million, reflecting the receipt of American Recovery and Reinvestment Act (ARRA) stimulus funds in 2011. Operating expenses increased $20.8 million or 3.25% over 2011. Compensation and benefits costs grew $18.7 million, due in part to necessary increases in faculty to support enrollment growth, along with accruing an additional $1.2 million for retiree healthcare expenses. Supplies and other services remained virtually flat when compared to 2011, demonstrating the continued emphasis on cost containment and efficiency for the campus. Overall, net nonoperating revenues increased $4.4 million. There were several offsetting variances, with increases in gifts of $14.8 million and state grants of $3.4 million offset by decreases in investment income of $8.2 million and federal grants of $8.6 million being the most significant. Increased support from private sources to meet the challenges of record growth is displayed with the increase in gifts. Arkansas Academic Challenge Grants, funded by the Arkansas State Lottery, continued to grow with an increase of $3 million. The volatility of returns in the equity markets impacted the overall performance of university investments, and was the major contributor to the decrease in investment income. The decrease in federal grants illustrates the receipt of federal stimulus (ARRA) funds in 2011 to support university operating expenses. Gifts reported on the Statement of Revenues, Expenses and Changes in Net Assets only reflect a portion of the gifts available to the University. Most gifts for the benefit of the University are made to the University of Arkansas Foundation, Inc. whose financial information is presented in summary form at Note 17 “Other Entity”. The overall increase in Other Revenues and Changes in Net Assets of $26.4 million is primarily a reflection of the continued work in 2012 on an AREON construction project funded with federal Broadband Opportunities Technology Program (BTOP) grant funds awarded in 2011. Additional information about the AREON project is provided in the “Significant Changes in Capital Assets and Long Term Debt Activity” discussion below and at Note 9 “Compensated Absences, Bonds, Notes, Capital Leases Payable, and Installment Contracts”. Statement of Cash Flows The Statement of Cash Flows provides information about the cash receipts and disbursements of the University for the year. The statement aids in the assessment of the University’s ability to meet obligations as they become due, the need for external financing, and the ability to generate future cash flow. It is prepared using the “direct method” as required by the GASB. The direct
19

method reports all major gross cash inflows and outflows, differentiating these activities into operating activities, noncapital financing, such as state appropriations and nonexchange grants; capital and related financing, including bond proceeds from debt issued to construct or purchase capital assets; and investing activities. The following summarizes the University’s cash flows:
Fiscal Year Fiscal Year 2012 2011 Net cash used by operating activities $ (219,536,339) $ (246,339,203) Net cash provided by noncapital financing
activities
324,937,023
314,522,932 Net cash provided by operating and
noncapital financing activities
105,400,684
68,183,729 Net cash used by capital financing activities (86,269,026) (49,957,354) Net cash provided (used) by investing
activities
9,692,270
4,548,906 Net increase in cash $ 28,823,928 $ 22,775,281
The University used $219.5 million of cash for operating activities in 2012 offset by cash provided by noncapital financing activities of $324.9 million. Similar to the operating loss on the Statement of Revenues, Expenses and Changes in Net Assets, net cash provided by operating activities is of little significance to the University. The net cash provided by the combination of operating activities and noncapital financing activities is a much more meaningful number for the University. The positive amount of $105.4 million for 2012 indicates that these activities contributed to cash and liquidity for the year. Cash used by capital financing activities reflects the University’s continued use of bonded debt to finance the acquisition of capital assets. The increase in net cash provided by investing activities illustrates the positioning of the cash component of matured investments to other university accounts during 2012. Significant Changes in Capital Assets and Long-Term Debt Activity The university continues to implement an aggressive facility renewal and stewardship plan, with new projects initiated in 2012, along with continuation of projects begun in previous years. A dedicated facilities fee, instituted in 2009 with planned annual incremental increases, provides a revenue stream that is used to leverage bonded debt for financing of a large-scale, long-range facilities renewal plan. Several new projects were initiated in 2012, including the re-purposing of Hotz Hall back to a residence facility, the acquisition and renovation of property for Uptown Campus, Housing Administration Building, Founders Hall and an extension of Brough Commons, and the John A. White Jr. Engineering Hall renovation phase 1. The Division of Agriculture also began
20

renovation of the existing laboratory and office facility, along with construction of a new Soil Testing Laboratory. To accommodate the increased demand for housing resulting from record growth, conversion of Hotz Hall from an administrative building back to its original purpose of residence hall began in 2012. The renovation, which includes upgrades to building infrastructure systems such as fire protection, plumbing and power distribution, will provide an additional 416 beds. Total project cost is estimated at $17.2 million, funded with a mix of bond proceeds and reserves. The building will be ready for occupancy for the Fall 2013 semester. In order to re-locate the administrative services housed in Hotz Hall, the University began two separate projects during 2012. A commercial building complex located on 9.34 acres off campus was purchased to convert into space for various academic and campus support services whose presence was not required on the main campus. Purchase price was $6 million and renovations costing $1.9 million bring the total cost of the Uptown Campus to $7.9 million. A 20,000 gsf Housing Administration Building is also being constructed to replace Housing offices located in Hotz Hall and to serve as a welcome and resource center for parents and students. Total project cost is $5 million with completion expected in spring 2014. Interim internal financing was used to initiate both projects which will be permanently funded with bond proceeds. Construction of Founders Hall and an extension of the Brough Commons dining facility includes 78,500 gsf of space on five floors to add several additional street-level retail food outlets, an additional 250 seats of dining connected to the existing Brough Commons at the second floor and 214 new beds in the remaining space. Total project cost is estimated at $26.6 million with completion expected in summer 2013. The project is funded with a mix of bond proceeds, dining and housing reserves and other available resources. The John A. White Jr. Engineering Hall project consists of full design for renovation and a planned addition to the building and renovation of the first floor as Phase 1 of the full project. Renovation of the 9,200 gsf first floor includes new mechanical, electrical and plumbing systems and life safety systems upgrades. The $4.4 million project will be funded by bond proceeds and university reserves, with completion expected in summer 2013. The Eastern Arkansas Soil Testing and Research Laboratory located at the Lon Mann Cotton Research Station in Marianna, Arkansas, is undergoing renovation and a new Soil Testing Laboratory is being constructed. Total project cost is estimated at $2.3 million with completion expected in summer 2014. The project is funded by Agriculture sales and reserves. Projects completed in 2012 include renovations at the Arkansas Union to re-purposed space vacated by the University Bookstore into an information technology center and a satellite fitness center. This $5.7 million project, completed in summer 2012, was funded in part with bond proceeds. The Hazardous Waste Storage Facility was also completed in 2012 at a total project cost of just under $1 million funded by bond proceeds. This facility is used primarily by occupants of the Arkansas Research and Technology Park to properly handle waste materials generated by their research. Work associated with the energy savings performance contracts negotiated with Energy Systems Group, LLC was also completed in summer 2012. The
21

University has now begun the first year of measurement and verification. These contracts were financed with two separate long term debt obligations, negotiated in 2009 and 2010 to provide total resources of $33.5 million to finance the improvements and equipment necessary to fulfill the obligations of the contract. The debt will be serviced with realized guaranteed energy costs savings. Several projects that were initiated in 2011 continue in 2012 including renovations and/or additions to Vol Walker Hall, Ozark Hall, Science Building, various classrooms and laboratories and various housing facilities; construction of two new auditoria, child development study center and football operations center; and utility infrastructure capacity expansions. Construction also continues on the Nanoscale Science and Engineering Building and the Arkansas Research and Education Optical Network. A 34,320 gsf addition is planned for Vol Walker Hall, along with a whole building renovation. When complete, the building will house all programs of the School of Architecture. Total project cost is now estimated at $36.6 million, funded with bond proceeds of $19.9 million, Donald W. Reynolds Foundation grant of $10 million and the remainder with private funds. The Ozark Hall project includes a whole building renovation along with an 18,310 gsf addition. When complete, the building will house the Honor’s College, Graduate School and the J. William Fulbright College of Arts and Sciences Geosciences Department. Total project cost is now estimated at $27.6 million, funded with bond proceeds of $18.5 million and the remainder with private funds. Construction started on both projects during summer 2011 with completion expected in summer 2013. Science Building renovations include updates to infrastructure as well as life safety upgrades. The multi-phase, multi-year $11 million project is funded by bond proceeds and completion is scheduled for summer 2014. A multi-year program to modernize up to 160 classrooms and 35 general teaching labs continued in 2012. The $7.6 million Phase II upgrade began in spring 2011, with completion of this phase expected in summer 2014. The project is funded with bond proceeds. Refurbishments are planned for several residence halls to accommodate demand for student housing created by continued enrollment growth. Projects totaling $24.8 million for Futrall, Pomfret, Humphries and Yocum Halls got underway during summer 2011 with completion expected in summer 2012. A $3.76 million renovation to the Phi Gamma Delta fraternity house began in 2011 with completion and occupancy in fall 2011. Residence hall and the Greek house projects are funded with a mix of bond proceeds, reserves and private funds. A significant improvement for large capacity teaching space will be achieved with the construction of Hillside Auditorium. The 36,500 gsf building will accommodate two modern, multi-function auditoriums (487 seats and 290 seats) for teaching, fine arts presentations and other campus uses. The outdated Science Engineering Auditorium (372 seats) and Geology Building (6,413 gsf) were razed to accommodate the new structure. Total project cost is $14.6 million, funded with bond proceeds. Construction began in summer 2011 with completion in spring 2012. The Jean Tyson Child Development Study center will replace two outdated structures and increase capacity from 40 children to 144 children, all housed in a single, multi-use facility. Total project cost is $8.5 million, funded with a mix of bond proceeds, private funds and reserves. Construction began in summer 2011 with completion in summer 2012.
22
Utility infrastructure capacity expansions are associated with many of the projects described above. The projects primarily address heating and cooling service extensions as well as a major improvement in core campus domestic water capacity for additional fire protection capability. Total project cost is estimated at $9.2 million funded with a mix of bond proceeds and reserves. Completion is expected during summer 2013. Construction of a football operations center began in fall 2011 with completion expected in summer 2013. The $42 million project will include an operations center, practice field and parking facility. The operations center will provide space for a coaching staff suite and other administrative space; team meeting rooms and locker room; equipment room, athletic training area and other operations space as well as public space with museum quality displays and lighting. The project is funded in part with $25.2 million Athletic Facilities Revenue Bonds and a $10 million grant from the Donald W. Reynolds Foundation. The practice fields and associated parking beneath them was completed summer 2012. The scope of the Nanoscale Science and Engineering Building project has evolved as additional funding has become available. The project was originally planned as a phased construction, with phase one financed in part by $16 million from Arkansas Department of Higher Education bonds and $5.5 million from state general improvement funds. Various Facility Revenue bonds issued in 2010 provided additional funding that made it possible to complete the initial project, leaving a shelled out third floor and clean room for future expansion. An additional $2 million capital appropriation received in 2011 provided resources partially finish out the third floor area and provide equipment. Total estimated cost for the project is $44 million. Project completion is expected in 2013. Construction continues on the Arkansas Research and Education Optical Network (AREON), a high-speed, fiber-based optical communication network established and operated by a consortium of public four-year universities in Arkansas, with cooperation of the Arkansas Department of Higher Education. The multi-year project launched in 2006 is serving as a catalyst to develop and apply advanced communications technologies to support and enhance education, research, public service and economic development in Arkansas. Current infrastructure in place includes 90% of the four year higher education institutions in Arkansas. A partnership led by University of Arkansas for Medical Sciences, and including, the Arkansas Association of Two Year Colleges, and AREON competed for, and received a $102 million federal Broadband Opportunities Technology Program (BTOP) grant in 2011 to construct and/or secure infrastructure to provide high speed connectivity to over 400 healthcare facilities, and to all 22 two year campuses. AREON is managing the connectivity to the two year campuses and was awarded $41.2 million as a subrecipient of the BTOP grant. When completed, the AREON network will enable true collaboration, resource sharing, and economies of scale in higher education. Leveraging investments in technical infrastructure as a shared asset will significantly impact the Governor’s goal of creating more citizens with higher education credentials in Arkansas. Funding for the project comes from Arkansas Department of Higher Education bonds, state general improvement funds, mineral lease rights, federal stimulus funds and consortium members.
23
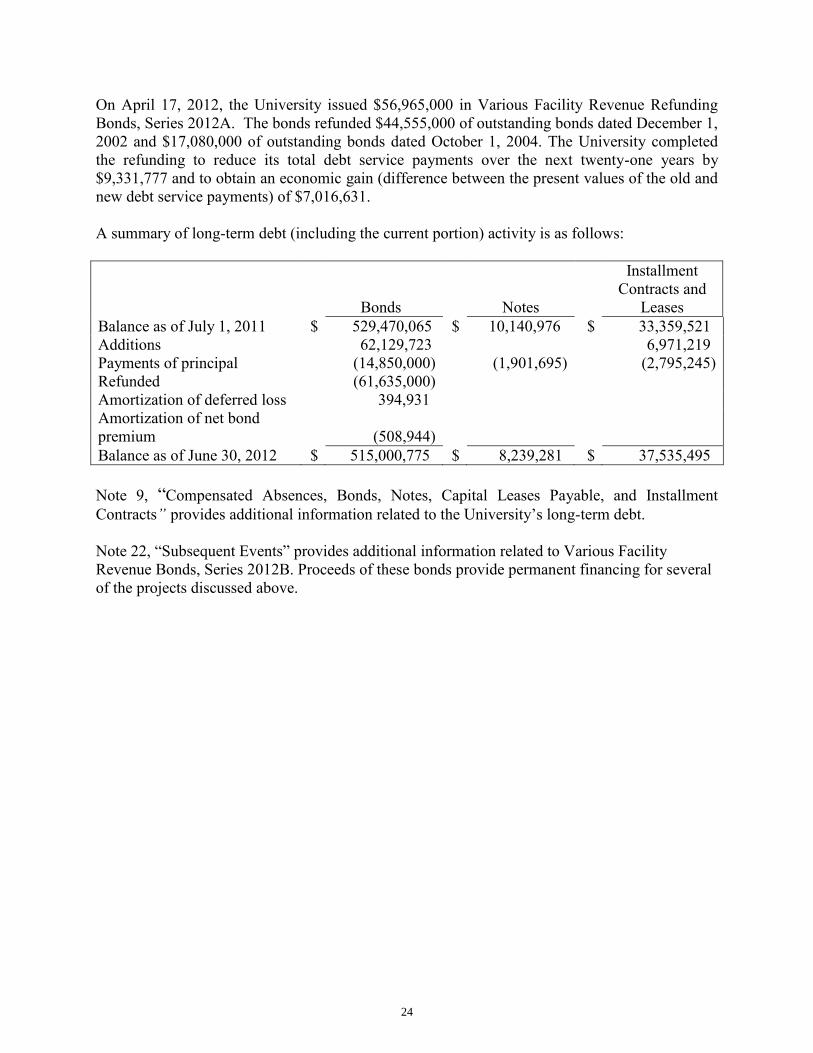
On April 17, 2012, the University issued $56,965,000 in Various Facility Revenue Refunding Bonds, Series 2012A. The bonds refunded $44,555,000 of outstanding bonds dated December 1, 2002 and $17,080,000 of outstanding bonds dated October 1, 2004. The University completed the refunding to reduce its total debt service payments over the next twenty-one years by $9,331,777 and to obtain an economic gain (difference between the present values of the old and new debt service payments) of $7,016,631. A summary of long-term debt (including the current portion) activity is as follows:
Bonds
Notes
Installment Contracts and
Leases Balance as of July 1, 2011 $ 529,470,065 $ 10,140,976 $ 33,359,521 Additions 62,129,723 6,971,219 Payments of principal (14,850,000) (1,901,695) (2,795,245) Refunded (61,635,000) Amortization of deferred loss 394,931 Amortization of net bond premium
(508,944)
Balance as of June 30, 2012 $ 515,000,775 $ 8,239,281 $ 37,535,495 Note 9, “Compensated Absences, Bonds, Notes, Capital Leases Payable, and Installment Contracts” provides additional information related to the University’s long-term debt. Note 22, “Subsequent Events” provides additional information related to Various Facility Revenue Bonds, Series 2012B. Proceeds of these bonds provide permanent financing for several of the projects discussed above.
24

A summary of the change in Net Assets invested in capital assets, net of depreciation and net of related debt is as follows: Net Assets Invested in capital assets, net of related debt and
depreciation as of June 30, 2011 $
425,915,450
Land Additions and Disposals (net) 5,033,288 Buildings Additions and Disposals, net of depreciation 53,649,178 Improvements/Infrastructure Additions, net of depreciation 4,934,947 Equipment Additions and Disposals, net of depreciation (435,614) Construction In Progress Additions net of transfers to buildings,
improvements/infrastructure, and intangible assets
53,128,301 Livestock Additions/deductions 422,007 Library Holdings Additions and Disposals, net of depreciation (1,493,917) Intangible Assets, net of amortization (4,513,666) Bond debt moved to Net Assets invested in capital assets (132,785,551) Bond Principal Paid in 2012 14,850,000 Bond debt refinanced 61,635,000 Deferred loss on refinanced bond issues, amortized 3,687,863 Unamortized bond issuance costs 390,336 Net unamortized bond issue premium (8,738,573) Capital Leases and Installment Contracts assumed in 2012 (20,865,202) Note, Capital Lease and Installment Contract Principal Paid in 2012 4,696,940 Prepaid maintenance contract on equipment and other (22,475) Net Assets Invested in capital assets, net of related debt and
depreciation as of June 30, 2012 $
459,488,312
Conditions and other factors having a significant effect Financial and political support from state government remains a critical element to the continued financial health of the University. Arkansas appears to be successfully managing the effects of the national economic crisis, with general revenue forecasts remaining positive and a balanced budget. Only minor fluctuations in general revenue distributions occurred during 2012. Conservative budgeting and an emphasis on cost containment continue to allow the University to meet the operational needs of a growing student enrollment without eliminating programs or instituting lay-offs. The total general revenue distribution from the State for 2012 was $197.5 million, a slight increase over 2011. Estimated total general revenue distribution from the State for 2013 will remain flat at $197.1 million. Management will continue to institute both internal and external efforts to minimize the effect of state funding levels not keeping pace with growth. Additional support in the form of Federal stimulus, (ARRA) funds was limited to ongoing funding for existing commitments, with no new projects funded in 2012. As discussed in the Significant Changes in Capital Assets and Long-Term Debt Activity section above, the AREON project received a $41.2 million stimulus-funded grant in 2011 to continue construction of the state-wide optical network. Approximately $31.4 million of the grant funds were used in 2012,
25

bringing the total used to $32.3 million with the remainder to be utilized as construction continues. The University continues to seek ways to manage the cost of attendance so that it remains affordable while achieving necessary revenue to fund operations. The economic downturn has intensified the need to hold the cost of higher education as low as possible so it remains accessible to students. Tuition and mandatory fee increases totaling 5% were necessary in 2012 in order to maintain the facilities, faculty and other support necessary to fulfill our mission. Because State funding is projected to remain flat, increases in tuition rates and mandatory fees is expected for 2013.
The University set a new enrollment record in 2012 with a 5.8% increase over the record 2011 enrollment. Preliminary numbers for Fall 2012 indicate that enrollment is 24,537 representing an increase of 1,338 students. Total undergraduate enrollment is up 6.9% to 20,349 students, and marks the first time there have been more than 20,000 undergraduates on the Fayetteville campus. Graduate enrollment is up 0.5% to 3,778 students, while enrollment at the School of Law slightly decreased .7% to 410 students. A record-setting incoming freshman class of 4,571 students validates that the university has become a school of first choice for Arkansans and students from around the nation. Equally exciting is the 10.8% increase in the number of continuing undergraduates. The academic quality of University of Arkansas students has steadily improved over the past several years and continues to improve with each freshman class. With an intentional effort to recruit students who will succeed, it is expected that continued growth through retention will be experienced for the next several years. The impact of the Arkansas Academic Challenge Scholarships, funded by the Arkansas State Lottery, appears to have stabilized with a total of 5,616 students receiving the “lottery scholarships” for the Fall 2012 semester compared to 5,449 recipients for the Fall 2011 semester. While it is encouraging to see record enrollment, further increases in undergraduate enrollment must occur to ensure continued increases in the revenue generated by tuition and to ensure continued support from state government.
The University is preparing for its next comprehensive fundraising campaign and positive momentum continues to build in private support. The University recorded $108.1 million of private gift support in 2012, surpassing its goal of $103 million. Private gift support is critical to ensure success for students and faculty, and is a fundamental component in meeting budgetary needs. Support received from alumni, friends, organizations and faculty and staff of the University have an impact on a wide variety of areas including academic and need-based scholarships; classroom technology enhancements; new and renovated facilities; undergraduate, graduate and faculty research; and study abroad opportunities.
The condition of the University’s capital assets is another important measure of the University’s overall financial health. Providing and maintaining facilities that create an attractive environment in which to learn and live is vital to attracting new students, as well as recruiting excellent faculty and staff. Management continues to implement a long-range plan (Facility Renewal & Stewardship Plan) to modernize and expand teaching, research and student facilities with small, targeted amounts of new construction, coupled with a primary focus on renewal and renovation and stewardship of existing facilities.
26
Facilities Management prepared an initial estimate in 2003 of the condition of capital assets in order to accumulate the necessary data to develop an optimized facility renewal and stewardship plan. The University’s goal is to update twenty percent of the assessment of square footage contained in the index annually on a rolling basis, addressing all facilities on a five year cycle. A Facilities Condition Index (FCI) between zero, indicating no deficiencies in building systems such as interiors and services, and 1.0, indicating the cost of a building's deficiencies equals its plant replacement value, has been assigned to each building. A building with deficiencies estimated at more than the plant replacement value will have an FCI greater than 1.0. The gross square footage weighted average for all Educational and General Facilities was 0.23 for 2003 compared to 0.22 in 2007. The relatively large improvement from 0.22 in 2007 to 0.17 in 2008 was the result of an across the board updating of plant replacement values, all of which increased. The index has declined steadily over time with indexes of 0.16 in 2009, 0.15 in 2010, 0.11 in 2011 and 0.10 for 2012. An effective method of assessing the management of capital assets is to track the average facility score over time. Factors contributing to the downward trend include renovations and deferred maintenance to campus infrastructure and educational and general buildings as directed by the Facilities Renewal and Stewardship Plan, ongoing work as a part of Energy Savings Performance Contracts, the demolition of certain old structures and the addition of new structures. Facilities Management’s effort to perform scheduled preventative maintenance also contributes to the improving FCI. Although the downward trend is expected to continue, the University will likely never achieve an FCI of zero.
27
UNIVERSITY OF ARKANSAS Statement of Net Assets
June 30, 2012 With Comparative Figures at June 30, 2011
June 30,
2012
2011
ASSETS Current Assets
Cash and cash equivalents
$ 144,987,700
$ 115,662,390
Short-term investments
71,847,085
67,717,239
Accounts receivable, net
39,796,958
37,511,076
Accrued interest receivable
943,992
705,740
Inventories
5,344,354
4,816,001
Deposits with bond trustees
11,119,982
6,810,766
Notes receivable, net
3,355,845
3,765,007
Other assets
4,556,279
3,488,264
Total current assets
281,952,195
240,476,483
Noncurrent Assets
Cash and cash equivalents
2,049,961
2,551,343
Endowment investments
62,391,332
61,490,881
Notes receivable, net
12,064,275
11,560,353
Deposits with bond trustees
57,103,469
125,595,189
Other long-term investments
3,941,264
12,682,869
Other assets
2,470,587
2,944,820
Capital assets, net
978,606,995
879,064,115
Total noncurrent assets
1,118,627,883
1,095,889,570
Total assets
$ 1,400,580,078
$ 1,336,366,053
LIABILITIES Current Liabilities
Accounts payable and accrued liabilities
$ 31,911,308
$ 23,225,442
Accrued payroll liabilities
16,558,525
14,409,009
Accrued interest expense
4,479,930
3,609,719
Student overpayments
68,877
50,920
Funds held in trust for others
628,295
1,408,211
Deferred revenue
30,519,336
27,303,474
Compensated absences payable - current portion
1,130,467
1,049,944
Bonds, notes, capital leases and installment contracts
payable - current portion 23,154,547 19,639,442
Total current liabilities
108,451,285
90,696,161
28

UNIVERSITY OF ARKANSAS Statement of Net Assets
June 30, 2012 With Comparative Figures at June 30, 2011
June 30,
2012
2011
Noncurrent Liabilities
Refundable federal advance - Perkins loans
14,022,433
13,921,000
Compensated absences payable
17,248,439
16,897,420
Liability for other post employment benefits
10,539,604
9,312,914
Bonds, notes capital leases and installment contracts payable
537,621,004
553,331,120
Other noncurrent liabilities
4,800
4,800
Total noncurrent liabilities
579,436,280
593,467,254
Total liabilities
$ 687,887,565
$ 684,163,415
NET ASSETS Invested in capital assets, net of related debt
$ 459,488,312
$ 425,915,450
Restricted for
Nonexpendable
Scholarships and fellowships
8,118,497
7,974,721
Research
5,739,659
5,739,659
Instructional department uses
8,644,839
7,644,839
Loans
887,560
779,686
Other 272,716
Expendable
Scholarships and fellowships
9,125,347
9,514,103
Research
22,550,281
24,890,369
Public service
10,267,413
9,369,450
Instructional department uses
9,923,320
10,004,794
Loans
2,484,714
2,574,457
Capital projects
12,876,730
4,587,105
Debt service
211,843
1,116,793
Other
2,091,099
2,983,769
Unrestricted
160,010,183
139,107,443 Total net assets
$ 712,692,513
$ 652,202,638
29

UNIVERSITY OF ARKANSAS Statement of Revenues, Expenses, and Changes in Net Assets
For the Year Ended June 30, 2012 With Comparative Figures for 2011
Fiscal 2012
Fiscal 2011
Total
Total
REVENUES Operating Revenues
Student tuition and fees (net of scholarship allowances of $58,580,598 in
fiscal year 2012, and $50,625,836 in fiscal year 2011)
$ 130,571,742
$ 109,167,102
Federal appropriations
11,615,106
11,062,386
County appropriations
3,383,149
2,912,870
Federal grants and contracts
38,448,980
40,940,355
State and local grants and contracts
17,502,653
17,261,150
Nongovernmental grants and contracts
18,256,503
17,601,040
Sales and services of educational departments
22,394,961
18,491,367
Auxiliary enterprises
Residence Life (net of scholarship allowances of $8,132,005 in
fiscal year 2012, and $7,829,551 in fiscal year 2011)
24,915,952
22,388,640
Athletics
69,793,575
65,697,039
Bookstore (net of scholarship allowances of $118,422 in
fiscal year 2012, and $111,200 in fiscal year 2011)
13,265,776
11,351,278
Arkansas Union
301,464
Student Health Services
569,714
851,385
Transit and Parking
6,591,747
6,387,653
Student Organizations/Activities
203,093
172,448
Other Auxiliary Enterprises
3,782,555
2,933,376
Other operating revenues
8,364,263
8,667,851
Total operating revenues
369,659,769
336,187,404
EXPENSES
Operating Expenses
Salaries, wages, and benefits
392,496,355
373,790,938 Scholarships and fellowships
27,071,128
29,557,381
Supplies and other services
177,430,399
177,970,255 Depreciation
62,757,646
57,645,916
Total operating expenses
659,755,528
638,964,490
Operating loss
(290,095,759)
(302,777,086)
30
UNIVERSITY OF ARKANSAS Statement of Revenues, Expenses, and Changes in Net Assets
For the Year Ended June 30, 2012 With Comparative Figures for 2011
Fiscal 2012
Fiscal 2011
Total
Total
NONOPERATING REVENUES (EXPENSES)
State appropriations
201,724,363
200,188,523
Gifts
66,051,112
51,239,306
Investment income (net of investment expense of $887,216 in
fiscal year 2012, and $672,896 in fiscal year 2011)
5,997,430
14,260,067
Interest on capital asset - related debt
(18,888,991)
(19,524,953)
Federal grants (nonexchange)
24,822,337
33,451,892
State and local grants (nonexchange)
33,249,890
29,764,358
Nongovernmental grants (nonexchange)
831,557
631,809
Loss on disposal of assets
(572,447)
(637,817)
Other nonoperating revenues
2,980,378
2,425,126
Net nonoperating revenues
316,195,629
311,798,311
Loss before other revenues and changes in net assets
26,099,870
9,021,225
OTHER REVENUES AND CHANGES IN NET ASSETS
Capital appropriations
500,000
3,240,686
Capital grants and gifts
33,158,761
4,481,709 Other changes
731,244
226,019
Total other revenues and changes in net assets
34,390,005
7,948,414
Increase (Decrease) in net assets
60,489,875
16,969,639
NET ASSETS
Net assets - beginning of year
652,202,638
635,232,999
Net assets - end of year
$ 712,692,513
$ 652,202,638
31

UNIVERSITY OF ARKANSAS Statement of Cash Flows - Direct Method
For the Year Ended June 30, 2012 With Comparative Figures for 2011
Fiscal 2012
Fiscal 2011
Total
Total
CASH FLOWS FROM OPERATING ACTIVITIES
Student tuition and fees
$ 130,723,176
$ 108,282,670
Federal appropriations
12,996,469
9,723,337
County appropriations
3,383,149
2,912,870
Grants and contracts
74,527,891
73,871,519
Payments to suppliers
(181,532,353)
(178,797,934)
Payments to employees
(307,098,005)
(292,715,329)
Payments for benefits
(81,614,153)
(79,709,178)
Payments for scholarships and fellowships
(26,947,157)
(29,608,257)
Loans issued to students and employees
(2,523,538)
(2,162,105)
Collections of loans to students
2,372,266
2,014,225
Collections of interest on loans to students
116,807
11,353
Auxiliary enterprise charges
Residence Life
25,370,514
22,111,455
Athletics
73,191,812
66,336,074
Bookstore
13,021,445
11,063,642
Arkansas Union
318,064
Student Health Services
798,704
637,554
Transit and Parking
6,489,727
6,703,777
Student Organizations/Activities
200,803
181,400
Other Auxiliary Enterprises
3,885,123
3,061,488
Sales and services of educational departments
22,112,452
18,289,729
Other receipts
10,988,529
11,134,443
Net cash used by operating activities
(219,536,339)
(246,339,203)
CASH FLOWS FROM NONCAPITAL FINANCING ACTIVITIES
State appropriations
201,724,362
200,188,524
Gifts and grants for other than capital purposes
65,005,056
50,292,693
Federal grants (nonexchange)
24,899,908
33,374,321
State and local grants (nonexchange)
33,232,632
29,764,358
Nongovernmental grants (nonexchange)
835,181
656,169
Direct Lending, and private loan receipts
96,205,456
84,522,043
Direct Lending, and private loan payments
(96,975,441)
(84,438,892)
Net agency fund transactions
9,869
163,716
Net cash provided by noncapital financing activities
324,937,023
314,522,932
Net cash provided by operating activities and noncapital
financing activities
105,400,684
68,183,729
CASH FLOWS FROM CAPITAL FINANCING ACTIVITIES
Realized proceeds related to capital debt transactions
70,250,078
64,199,506
Capital appropriations
500,000
3,240,686
Capital grants and gifts received
28,007,493
1,040,514
Purchases of capital assets
(143,375,809)
(81,781,256)
Principal paid on capital debt and leases
(18,557,020)
(16,832,904)
Interest paid on capital debt and leases
(23,093,768)
(19,823,900)
Net cash used by capital financing activities
(86,269,026)
(49,957,354)
32
UNIVERSITY OF ARKANSAS Statement of Cash Flows - Direct Method
For the Year Ended June 30, 2012 With Comparative Figures for 2011
Fiscal 2012
Fiscal 2011
Total
Total
CASH FLOWS FROM INVESTING ACTIVITIES
Proceeds from sales and maturities of investments
$ 8,949,069
$ 4,283,855
Investment income
761,742
286,398
Purchase of investments
(18,541)
(21,347)
Net cash provided (used) by investing activities
9,692,270
4,548,906
NET INCREASE IN CASH
28,823,928
22,775,281
Cash - beginning of year
118,213,733
95,438,452
Cash - end of year
$ 147,037,661
$ 118,213,733
RECONCILIATION OF NET OPERATING LOSS TO
NET CASH USED BY OPERATING ACTIVITIES
Operating loss
$ (290,095,759)
$ (302,777,086)
Adjustments to reconcile net loss to net cash
used by operating activities:
Depreciation expense
62,757,646
57,645,916
Changes in assets and liabilities
Receivables (net)
2,085,496
(4,971,642)
Inventories
(528,352)
(3,122)
Prepaid expenses
(805,697)
694,673
Other miscellaneous operating receipts
3,090,389
2,462,871
Accounts payable and accrued liabilities
(3,108,307)
(1,060,879)
Accrued payroll liabilities (Employees)
1,039,383
(504,355)
Accrued payroll liabilities (Benefits)
1,071,940
95,230
Student overpayments
17,862
(39,668)
Deferred revenue
3,212,663
579,242
Refundable federal advance
101,433
7,838
Deposits
(2,818)
Compensated absences
446,569
534,714
Retiree benefits
1,226,690
1,087,597
Loans to students and employees
(48,295)
(87,714)
Net cash used by operating activities
$ (219,536,339)
$ (246,339,203)
NONCASH TRANSACTIONS
Donations of land, buildings, improvements, and infrastructure $ 967,956
$ 718,548
Equipment donations
856,427
905,589
Payments to bond escrow directly from bond proceeds
65,717,794
6,414,688
Refund of outstanding bond issues directly from bond proceeds
3,593,922
Payment of bond proceeds directly into deposits with trustees
6,358
133,057,098
Payment of premium and accrued interest on bonds directly into
deposits with trustees
6,714,019
Bond issuance costs and underwriter's discounts paid directly
from bond proceeds
488,365
939,978
Principal on long-term debt paid directly from deposits with trustees 908,900
Interest on long-term debt paid directly from deposits with trustees
2,540
742,088
Payment of long-term debt directly from
University of Arkansas Foundation, Inc. accounts
53,394
1,649,491
Capital outlay paid directly from proceeds of University of Arkansas
long-term debt instruments
13,043
Loss on disposal of assets
640,946
462,710
33

THIS PAGE INTENTIONALLY LEFT BLANK
34

UNIVERSITY OF ARKANSAS FAYETTEVILLE CAMPUS FOUNDATION, INC.
Statements of Financial Position June 30, 2012 and 2011
2012
2011 Assets
Investments
$ 435,890,065
$ 448,201,276
Liabilities and Net Assets Accounts payable
$ 85,612
$ 21,380
Net Assets:
Temporarily restricted
$ 24,653,951
$ 23,045,505
Permanently restricted
411,150,502
425,134,391
Total net assets
435,804,453
448,179,896
Total liabilities and net assets
$ 435,890,065
$ 448,201,276
35
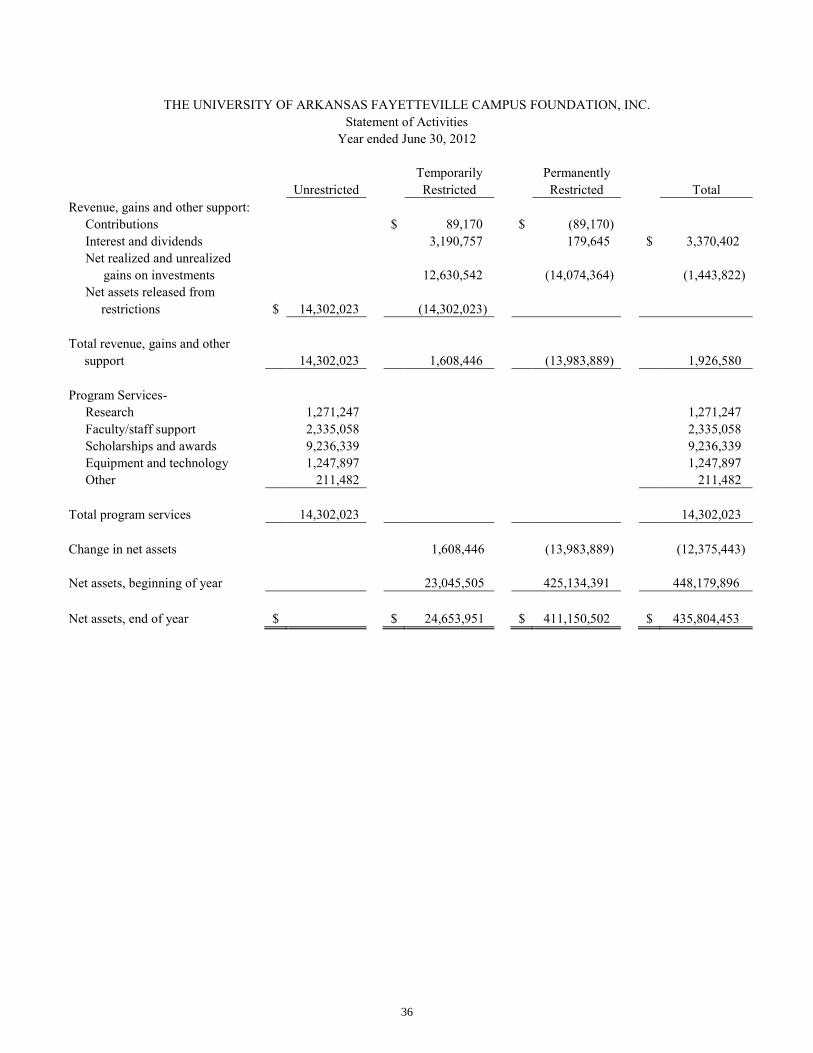
THE UNIVERSITY OF ARKANSAS FAYETTEVILLE CAMPUS FOUNDATION, INC. Statement of Activities
Year ended June 30, 2012
Temporarily
Permanently
Unrestricted
Restricted
Restricted
Total
Revenue, gains and other support:
Contributions
$ 89,170
$ (89,170)
Interest and dividends
3,190,757
179,645
$ 3,370,402
Net realized and unrealized
gains on investments
12,630,542
(14,074,364)
(1,443,822) Net assets released from
restrictions $ 14,302,023
(14,302,023)
Total revenue, gains and other support 14,302,023
1,608,446
(13,983,889)
1,926,580
Program Services-
Research
1,271,247
1,271,247
Faculty/staff support
2,335,058
2,335,058
Scholarships and awards
9,236,339
9,236,339
Equipment and technology
1,247,897
1,247,897
Other
211,482
211,482
Total program services
14,302,023
14,302,023
Change in net assets
1,608,446
(13,983,889)
(12,375,443)
Net assets, beginning of year
23,045,505
425,134,391
448,179,896
Net assets, end of year
$
$ 24,653,951
$ 411,150,502
$ 435,804,453
36

THE UNIVERSITY OF ARKANSAS FAYETTEVILLE CAMPUS FOUNDATION, INC. Statement of Activities
Year ended June 30, 2011
Temporarily
Permanently
Unrestricted
Restricted
Restricted
Total
Revenue, gains and other support:
Contributions
$ 180,421
$ (180,421)
Interest and dividends
3,204,275
187,414
$ 3,391,689
Net realized and unrealized
gains on investments
12,485,128
56,748,532
69,233,660 Net assets released from
restrictions $ 14,225,026
(14,225,026)
Total revenue, gains and other support 14,225,026
1,644,798
56,755,525
72,625,349
Program Services-
Research
1,132,750
1,132,750
Faculty/staff support
1,819,281
1,819,281
Scholarships and awards
8,844,244
8,844,244
Equipment and technology
2,023,264
2,023,264
Other
405,487
405,487
Total program services
14,225,026
14,225,026
Change in net assets
1,644,798
56,755,525
58,400,323
Net assets, beginning of year
21,400,707
368,378,866
389,779,573
Net assets, end of year
$
$ 23,045,505
$ 425,134,391
$ 448,179,896
37

THE RAZORBACK FOUNDATION, INC. Consolidated Statement of Financial Position
June 30, 2012 Assets Cash and cash equivalents $ 17,293,862 Contributions receivable, net 17,337,982 Investments, at fair value 15,702,869 Prepaid rent 1,444,904 Other 242,361 Property and equipment, net of accumulated depreciation of $2,362,363 50,242 Total assets $ 52,072,220 Liabilities and Net Assets Liabilities: Accounts payable and accrued liabilities $ 1,079,927 Deferred compensation 3,904,448 Total liabilities 4,984,375 Net assets: Stockholder’s deficit of for-profit subsidiary (9,840) Unrestricted net assets of nonprofit parent 21,846,120 Total unrestricted net assets 21,836,280 Temporarily restricted net assets 22,984,129 Permanently restricted net assets 2,267,436 Total net assets 47,087,845 Total liabilities and net assets $ 52,072,220
38
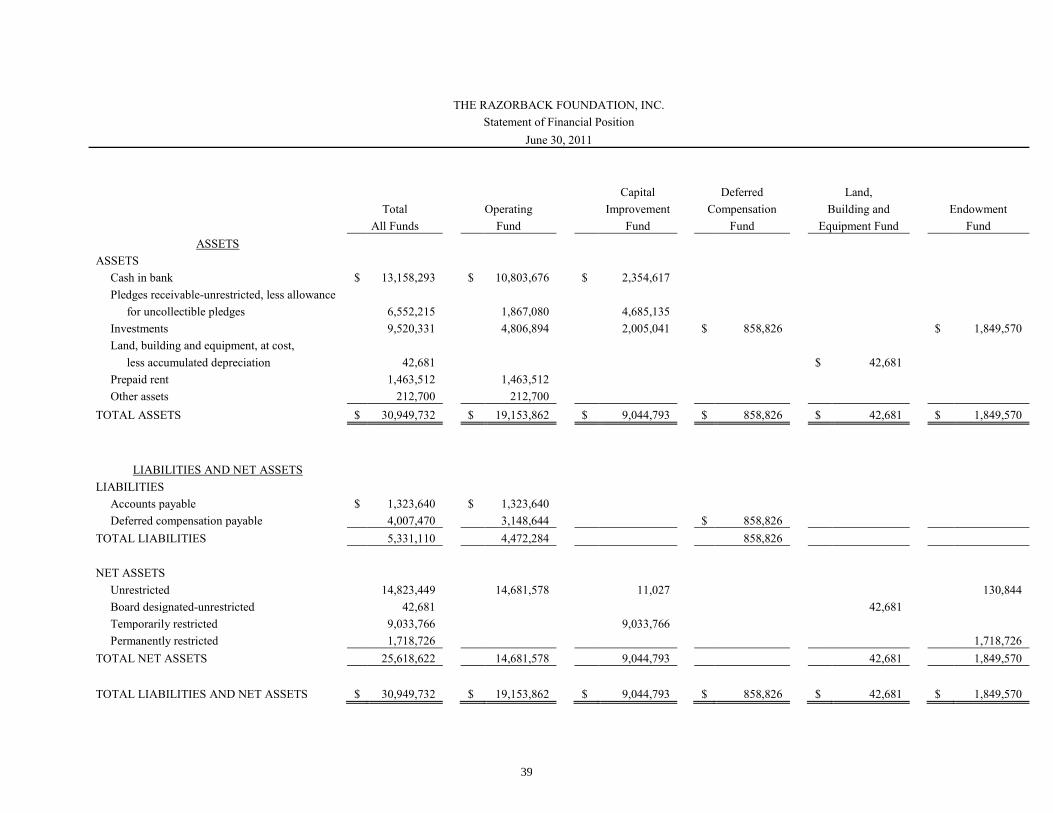
THE RAZORBACK FOUNDATION, INC. Statement of Financial Position
June 30, 2011
Capital
Deferred
Land,
Total
Operating
Improvement
Compensation
Building and
Endowment
All Funds
Fund
Fund
Fund
Equipment Fund
Fund
ASSETS ASSETS
Cash in bank $ 13,158,293
$ 10,803,676
$ 2,354,617
Pledges receivable-unrestricted, less allowance
for uncollectible pledges
6,552,215
1,867,080
4,685,135
Investments
9,520,331
4,806,894
2,005,041
$ 858,826
$ 1,849,570
Land, building and equipment, at cost,
less accumulated depreciation
42,681
$ 42,681
Prepaid rent
1,463,512
1,463,512
Other assets 212,700
212,700
TOTAL ASSETS $ 30,949,732
$ 19,153,862
$ 9,044,793
$ 858,826
$ 42,681
$ 1,849,570
LIABILITIES AND NET ASSETS
LIABILITIES
Accounts payable $ 1,323,640
$ 1,323,640
Deferred compensation payable
4,007,470
3,148,644
$ 858,826
TOTAL LIABILITIES 5,331,110
4,472,284
858,826
NET ASSETS
Unrestricted
14,823,449
14,681,578
11,027
130,844
Board designated-unrestricted
42,681
42,681
Temporarily restricted
9,033,766
9,033,766
Permanently restricted 1,718,726
1,718,726
TOTAL NET ASSETS 25,618,622
14,681,578
9,044,793
42,681
1,849,570
TOTAL LIABILITIES AND NET ASSETS $ 30,949,732
$ 19,153,862
$ 9,044,793
$ 858,826
$ 42,681
$ 1,849,570
39

THIS PAGE INTENTIONALLY LEFT BLANK
40
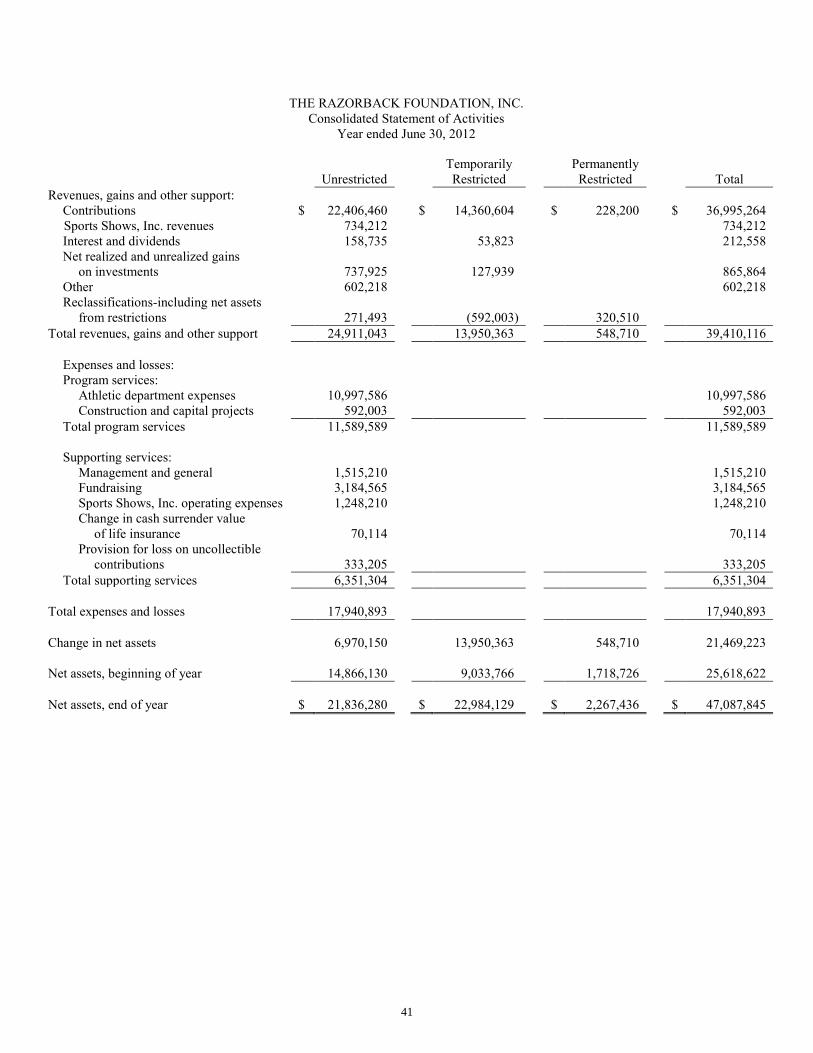
THE RAZORBACK FOUNDATION, INC. Consolidated Statement of Activities
Year ended June 30, 2012
Temporarily
Permanently
Unrestricted
Restricted
Restricted
Total
Revenues, gains and other support:
Contributions $ 22,406,460
$ 14,360,604
$ 228,200
$ 36,995,264
Sports Shows, Inc. revenues 734,212
734,212
Interest and dividends
158,735
53,823
212,558
Net realized and unrealized gains on investments 737,925 127,939 865,864 Other 602,218 602,218 Reclassifications-including net assets from restrictions 271,493 (592,003) 320,510 Total revenues, gains and other support 24,911,043
13,950,363
548,710
39,410,116
Expenses and losses:
Program services:
Athletic department expenses
10,997,586
10,997,586
Construction and capital projects
592,003
592,003
Total program services
11,589,589
11,589,589
Supporting services:
Management and general
1,515,210
1,515,210
Fundraising
3,184,565
3,184,565
Sports Shows, Inc. operating expenses
1,248,210
1,248,210
Change in cash surrender value
of life insurance
70,114
70,114 Provision for loss on uncollectible
contributions
333,205
333,205
Total supporting services 6,351,304
6,351,304
Total expenses and losses 17,940,893 17,940,893 Change in net assets 6,970,150 13,950,363 548,710 21,469,223 Net assets, beginning of year 14,866,130 9,033,766 1,718,726 25,618,622 Net assets, end of year $ 21,836,280 $ 22,984,129 $ 2,267,436 $ 47,087,845
41
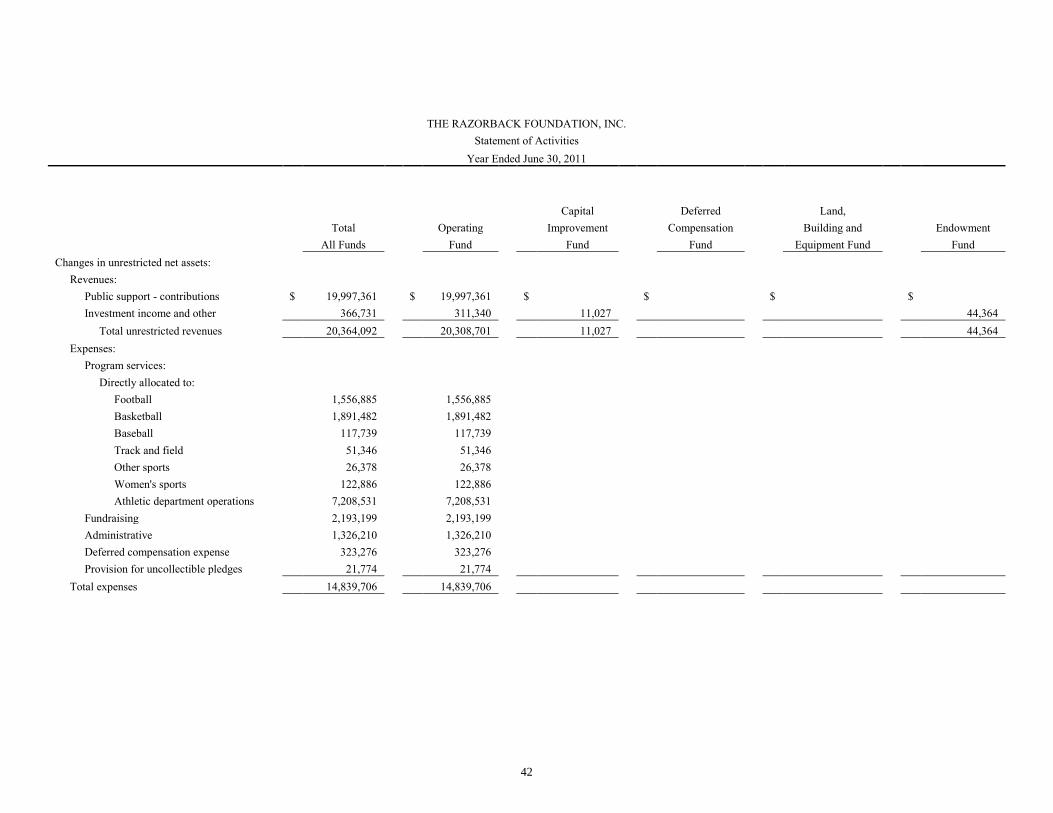
THE RAZORBACK FOUNDATION, INC.
Statement of Activities Year Ended June 30, 2011
Capital
Deferred
Land,
Total
Operating
Improvement
Compensation
Building and
Endowment
All Funds
Fund
Fund
Fund
Equipment Fund
Fund
Changes in unrestricted net assets:
Revenues:
Public support - contributions $ 19,997,361
$ 19,997,361
$
$
$
$
Investment income and other
366,731
311,340
11,027
44,364
Total unrestricted revenues 20,364,092
20,308,701
11,027
44,364
Expenses:
Program services:
Directly allocated to:
Football
1,556,885
1,556,885
Basketball
1,891,482
1,891,482
Baseball
117,739
117,739
Track and field
51,346
51,346
Other sports
26,378
26,378
Women's sports
122,886
122,886
Athletic department operations
7,208,531
7,208,531
Fundraising
2,193,199
2,193,199
Administrative
1,326,210
1,326,210
Deferred compensation expense
323,276
323,276
Provision for uncollectible pledges
21,774
21,774
Total expenses 14,839,706
14,839,706
42
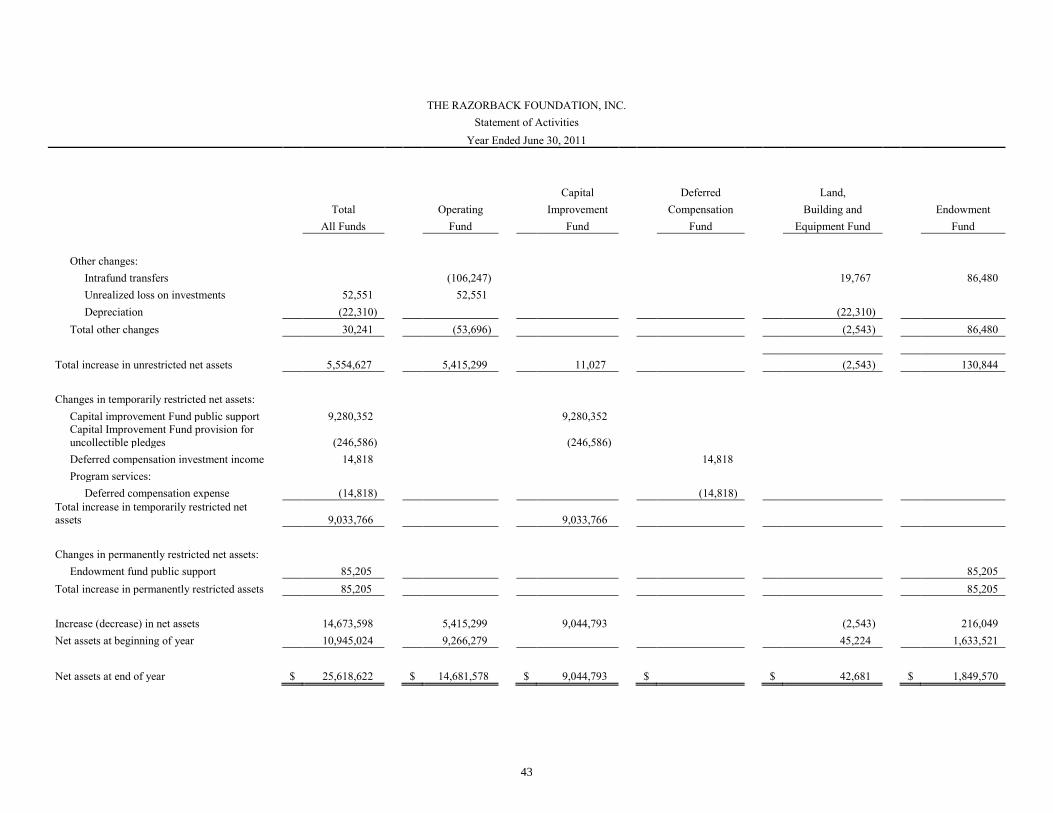
THE RAZORBACK FOUNDATION, INC. Statement of Activities
Year Ended June 30, 2011
Capital
Deferred
Land,
Total
Operating
Improvement
Compensation
Building and
Endowment
All Funds
Fund
Fund
Fund
Equipment Fund
Fund
Other changes:
Intrafund transfers
(106,247)
19,767
86,480
Unrealized loss on investments
52,551
52,551
Depreciation
(22,310)
(22,310)
Total other changes 30,241
(53,696)
(2,543)
86,480
Total increase in unrestricted net assets 5,554,627
5,415,299
11,027
(2,543)
130,844
Changes in temporarily restricted net assets:
Capital improvement Fund public support
9,280,352
9,280,352
Capital Improvement Fund provision for uncollectible pledges
(246,586)
(246,586)
Deferred compensation investment income
14,818
14,818
Program services:
Deferred compensation expense
(14,818)
(14,818)
Total increase in temporarily restricted net assets 9,033,766
9,033,766
Changes in permanently restricted net assets:
Endowment fund public support 85,205
85,205
Total increase in permanently restricted assets 85,205
85,205
Increase (decrease) in net assets
14,673,598
5,415,299
9,044,793
(2,543)
216,049 Net assets at beginning of year 10,945,024
9,266,279
45,224
1,633,521
Net assets at end of year $ 25,618,622
$ 14,681,578
$ 9,044,793
$
$ 42,681
$ 1,849,570
43
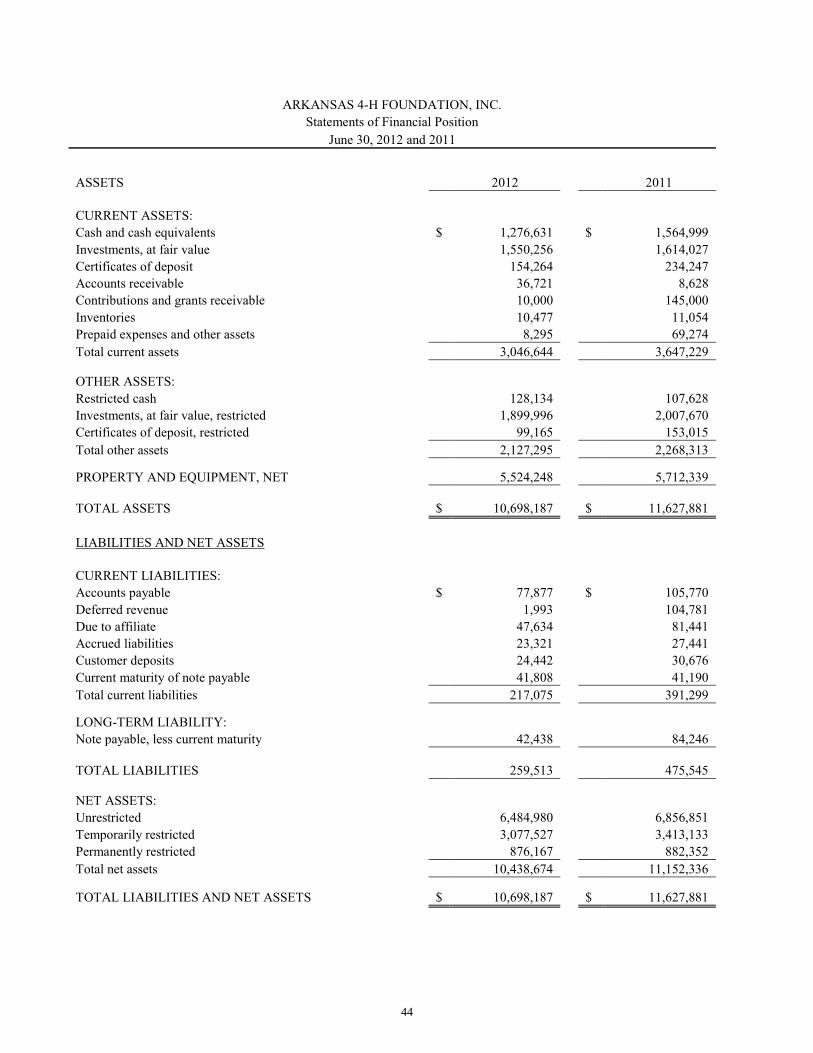
ARKANSAS 4-H FOUNDATION, INC. Statements of Financial Position
June 30, 2012 and 2011
ASSETS 2012
2011
CURRENT ASSETS: Cash and cash equivalents $ 1,276,631
$ 1,564,999
Investments, at fair value
1,550,256
1,614,027 Certificates of deposit
154,264
234,247
Accounts receivable
36,721
8,628 Contributions and grants receivable
10,000
145,000
Inventories
10,477
11,054 Prepaid expenses and other assets
8,295
69,274
Total current assets 3,046,644
3,647,229
OTHER ASSETS: Restricted cash
128,134
107,628 Investments, at fair value, restricted
1,899,996
2,007,670
Certificates of deposit, restricted 99,165
153,015 Total other assets 2,127,295
2,268,313
PROPERTY AND EQUIPMENT, NET 5,524,248
5,712,339
TOTAL ASSETS $ 10,698,187
$ 11,627,881
LIABILITIES AND NET ASSETS
CURRENT LIABILITIES: Accounts payable $ 77,877
$ 105,770
Deferred revenue
1,993
104,781 Due to affiliate
47,634
81,441
Accrued liabilities
23,321
27,441 Customer deposits
24,442
30,676
Current maturity of note payable
41,808
41,190 Total current liabilities 217,075
391,299
LONG-TERM LIABILITY: Note payable, less current maturity 42,438
84,246
TOTAL LIABILITIES 259,513
475,545
NET ASSETS: Unrestricted
6,484,980
6,856,851 Temporarily restricted
3,077,527
3,413,133
Permanently restricted 876,167
882,352 Total net assets 10,438,674
11,152,336
TOTAL LIABILITIES AND NET ASSETS $ 10,698,187
$ 11,627,881
44

ARKANSAS 4-H FOUNDATION, INC. Statement of Activities
For the Years Ended June 30, 2012
Temporarily
Permanently
Unrestricted
Restricted
Restricted
Total SUPPORT AND REVENUES:
Program service revenue $ 1,606,250
$ 6,553
$ 1,612,803 Grants and contributions
126,195
63,702
$ 100
189,997
Interest and dividends
18,065
119,800
9,164
147,029 Net unrealized and realized appreciation
(depreciation) on investments
(30,458)
(201,987)
(15,449)
(247,894) Other revenues (expenses), net
7,395
(3,176)
4,219
Net assets released from restrictions 320,498
(320,498)
Total support and revenues 2,047,945
(335,606)
(6,185)
1,706,154
EXPENSES: Program
2,063,693
2,063,693 Management and general
235,593
235,593
Fundraising
120,530
120,530 Total expenses 2,419,816
2,419,816
CHANGE IN NET ASSETS
(371,871)
(335,606)
(6,185)
(713,662)
NET ASSETS, BEGINNING OF YEAR 6,856,851
3,413,133
882,352
11,152,336
NET ASSETS, END OF YEAR $ 6,484,980
$ 3,077,527
$ 876,167
$ 10,438,674
45

ARKANSAS 4-H FOUNDATION, INC. Statement of Activities
For the Years Ended June 30, 2011
Temporarily
Permanently
Unrestricted
Restricted
Restricted
Total SUPPORT AND REVENUES:
Program service revenue $ 1,718,064
$ 4,755
$ 1,722,819 Grants and contributions
149,140
614,493
$ 175
763,808
Interest and dividends
22,119
106,365
6,032
134,516 Net unrealized and realized appreciation
(depreciation) on investments
75,746
364,251
20,891
460,888 Other revenues
623
(2,256)
(1,633)
Net assets released from restrictions 285,322
(285,322)
Total support and revenues 2,251,014
802,286
27,098
3,080,398
EXPENSES: Program
2,161,497
2,161,497 Management and general
158,068
158,068
Fundraising
53,459
53,459 Total expenses 2,373,024
2,373,024
INCREASE (DECREASE) IN NET ASSETS
(122,010)
802,286
27,098
707,374
NET ASSETS, BEGINNING OF YEAR 6,978,861
2,610,847
855,254
10,444,962
NET ASSETS, END OF YEAR $ 6,856,851
$ 3,413,133
$ 882,352
$ 11,152,336
46

UNIVERSITY OF ARKANSAS, FAYETTEVILLE NOTES TO THE FINANCIAL STATEMENTS
FOR THE YEAR ENDED JUNE 30, 2012
(1). Summary of Significant Accounting Policies The financial statements for the University of Arkansas, Fayetteville (“the University”) for the fiscal year ended June 30, 2012, have been prepared in accordance with generally accepted accounting principles accepted in the United States of America, as prescribed by the Governmental Accounting Standards Board (GASB). Basis of Presentation and Measurement Focus For financial reporting purposes, the University is considered a special-purpose government engaged in business-type activities. Accordingly, the financial statements of the University have been prepared using the economic resources measurement focus and the accrual basis of accounting. Revenues are recognized in the accounting period in which they are earned and become measurable. Expenses are recognized in the period in which they are incurred, if measurable, including depreciation. Net Assets The University’s net assets are classified as follows: Invested in capital assets, net of related debt: Capital assets, net of accumulated depreciation
and outstanding principal balances of debt attributable to the acquisition, construction or improvement of those assets.
Restricted:
Nonexpendable – Net assets subject to externally-imposed stipulations that they be maintained permanently by the University. Such assets include the University’s permanent endowment funds. Expendable – Net assets whose use by the University is subject to externally-imposed stipulations that can be fulfilled by actions of the University pursuant to those stipulations or that expire by the passage of time. There is no formal policy requiring restricted net assets to be used either before or after unrestricted net assets are used for the same purpose. Responsible officials determine at the time funds are expended to use any unrestricted net assets that may be available.
Unrestricted: Net assets that are not subject to externally imposed stipulations. Unrestricted net assets may be designated for specific purposes by action of management or the Board of Trustees or may otherwise be limited by contractual agreements with outside parties. Substantially all unrestricted net assets are designated for academic and research programs and initiatives as well as capital programs.
The University has the option to apply all Financial Accounting Standards Board (FASB) pronouncements issued after November 30, 1989, unless FASB conflicts with GASB. The University has elected to not apply FASB pronouncements issued after the applicable date.
47
UNIVERSITY OF ARKANSAS, FAYETTEVILLE NOTES TO THE FINANCIAL STATEMENTS
FOR THE YEAR ENDED JUNE 30, 2012
Component Units In May 2002, GASB issued Statement No. 39, Determining Whether Certain Organizations Are Component Units, which amends GASB Statement No. 14 to provide additional guidance to determine whether certain organizations for which the primary government is not financially accountable should be reported as component units based on the nature and significance of their relationship with a primary government. Under the statement, which became effective with the fiscal year ending June 30, 2004, the financial activities of qualifying foundations are to be included in the financial statements of the primary government, through discrete presentations. There were three qualifying foundations for the University of Arkansas, Fayetteville: the University of Arkansas Fayetteville Campus Foundation, Inc., the Razorback Foundation, Inc., and the Arkansas 4-H Foundation, Inc. The University of Arkansas Fayetteville Campus Foundation, Inc. (“the Foundation”) is a charitable organization described in Section 501 (c) (3) of the Internal Revenue Code of 1986, as amended, and was established by the Walton Family Charitable Support Foundation, Inc., for the exclusive benefit of the University of Arkansas, Fayetteville campus. The Foundation was established on March 11, 2003, and exists primarily to support the Honors College, the Graduate School and the University’s library. The Board of Trustees of the Foundation is made up of seven (7) members, including three (3) members who are also employees of the University. Although the University does not control the timing or amount of receipts from the Foundation, the majority of resources or income thereon that the Foundation holds and invests are restricted to the activities of the University by the donors. Because these restricted resources held by the Foundation can only be used by, or for the benefit of, the University, the Foundation is considered a component unit of the University and is discretely presented in the University’s financial statements. The Foundation distributed $15,833,989 and $15,404,399 to the University during the fiscal years ended June 30, 2012, and June 30, 2011, respectively, for both restricted and unrestricted purposes. Complete financial statements for the Foundation can be obtained from the administrative office at 700 Research Center Boulevard, Fayetteville, AR 72701. The Razorback Foundation, Inc. (“the Razorback Foundation”) was incorporated on October 17, 1980. It is a non-for-profit organization whose sole purpose is to support intercollegiate athletics at the University. Although the University does not control the timing or amount of receipts from the Razorback Foundation, the majority of resources, or income thereon that the Razorback Foundation holds and invests are restricted to the activities of the University by the donors. Because these restricted resources held by the Razorback Foundation can only be used by, or for the benefit of, the University, the Razorback Foundation is considered a component unit of the University and is discretely presented in the University’s financial statements. The Razorback Foundation distributed $9,342,604 to the University, and provided equipment, facilities, improvements and supplies in the amount of $592,003 during the fiscal year ended June 30, 2012. During the fiscal year ended June 30, 2011, the Razorback Foundation distributed $7,693,021 to the University, and provided equipment, facilities, improvements and supplies in the amount of $14,708. Complete financial statements for the Razorback Foundation
48

UNIVERSITY OF ARKANSAS, FAYETTEVILLE NOTES TO THE FINANCIAL STATEMENTS
FOR THE YEAR ENDED JUNE 30, 2012
can be obtained from the administrative office at 91 North Razorback Road, Fayetteville, AR 72701. The Arkansas 4-H Foundation, Inc. (“the 4-H Foundation”) was incorporated under the laws of the State of Arkansas in 1951. The purposes and objectives of the 4-H Foundation are exclusively educational. The 4-H Foundation was formed to encourage and support such educational purposes, as in the judgment of the 4-H Foundation, will best meet the needs and advance the interests of 4-H youth programs throughout the State of Arkansas. The 4-H Foundation is organized into approximately 160 distinct funds that are used to account for various educational or administrative activities. The 4-H Foundation made no distributions directly to the University during the fiscal years ended June 30, 2012, or June 30, 2011, other than to reimburse the University for expenses incurred on their behalf. Complete financial statements for the 4-H Foundation can be obtained from the administrative office at 2301 S. University Avenue, P.O. Box 391, Little Rock, AR 72203. New Accounting Pronouncements In June 2011, GASB issued Statement No. 64, Derivative Instruments: Application of Hedge Accounting Termination Provisions – an amendment of GASB Statement No. 53, which became effective with the fiscal year ending June 30, 2012. The University has determined that the requirements of the Statement have no effect on current reporting and disclosures. GASB issued the following four statements which become effective with the fiscal year ending June 30, 2013: Statement No. 60, Accounting and Financial Reporting for Service Concession Arrangements, which addresses partnerships with private and other public entities; Statement No. 61, The Financial Reporting Entity: Omnibus, an amendment of No. 14 and No. 34, which modifies certain requirements for inclusion of component units; Statement No. 62, Codification of Accounting and Financial Reporting Guidance Contained in Pre-November 30, 1989 FASB and AICPA Pronouncements, which incorporates pre-November 30, 1989 pronouncements into GASB’s authoritative language from FASB, APB and AICPA; and Statement No. 63, Financial Reporting of Deferred Outflows of Resources, Deferred Inflows of Resources, and Net Position, which redefines some assets and liabilities. Management has not yet determined the effects on the University’s financial statements when these statements are implemented. GASB issued the following three statements which become effective with the fiscal year ending June 30, 2014: Statement No. 65, Items Previously Reported as Assets and Liabilities, Statement No. 66, Technical Corrections – 2012 – an amendment of GASB Statements No. 10 and No. 62, and Statement No. 67, Financial Reporting for Pension Plans – an amendment of GASB Statement No. 25. GASB issued Statement No. 68, Accounting and Financial Reporting for Pensions – an amendment of GASB Statement No. 27, which becomes effective for the fiscal year ending June 30, 2015. Management has determined that the requirements of Statement No. 66 will not have an effect on current reporting and disclosures, but has not yet determined the effects on the University’s financial statements when the other three statements become effective.
49

UNIVERSITY OF ARKANSAS, FAYETTEVILLE NOTES TO THE FINANCIAL STATEMENTS
FOR THE YEAR ENDED JUNE 30, 2012
Cash and Cash Equivalents The University considers all highly liquid investments with an original maturity of three months or less to be cash equivalents. Funds held in the custody of the Treasurer of the State of Arkansas and other state agencies are considered cash equivalents. Inventories Inventories are valued at cost with costs being determined using several generally accepted inventory valuation methods depending on the best practices of the University department to which the inventory belongs. The following summarized the cost of inventories with the method of valuation:
Inventories Valuation Method June 30, 2012 June 30, 2011 Athletics Inventory Retail $ 260,986 $ 347,596 Bookstore Retail 3,234,147 2,538,977 CES Warehouse Weighted Average 84,197 77,768 Garvan Woodland Gardens Shop Weighted Average 91,067 145,114 Facilities Management FIFO 495,731 507,919 Printing Services Weighted Average 169,380 164,525 Research Services Weighted Average 51,795 52,229 Residence Life LIFO 394,679 395,671 University Press LCM 562,372 586,202 Total Inventories $ 5,344,354 $ 4,816,001 Accounts Receivable Accounts receivable are stated at estimated net realizable values; that is, the gross amount of the receivable is reduced by allowances for estimated uncollectible accounts. Accounts receivable represent charges due the University from various student fees, room and board, student fines, and other charges. Accounts receivable also consist of unreimbursed expenses relating to research contracts with federal, state, and private agencies. Accounts receivable totaling $285,791 and $950,578 were written off during the fiscal years ended June 30, 2012, and June 30, 2011, respectively. Accounts receivable at June 30, 2012, totaled $45,895,365. The allowance for doubtful accounts was computed to be $6,098,407, resulting in net accounts receivable totaling $39,796,958. Accounts receivable at June 30, 2011, totaled $43,837,111. The allowance for doubtful accounts was computed to be $6,326,035, resulting in net accounts receivable totaling $37,511,076.
50
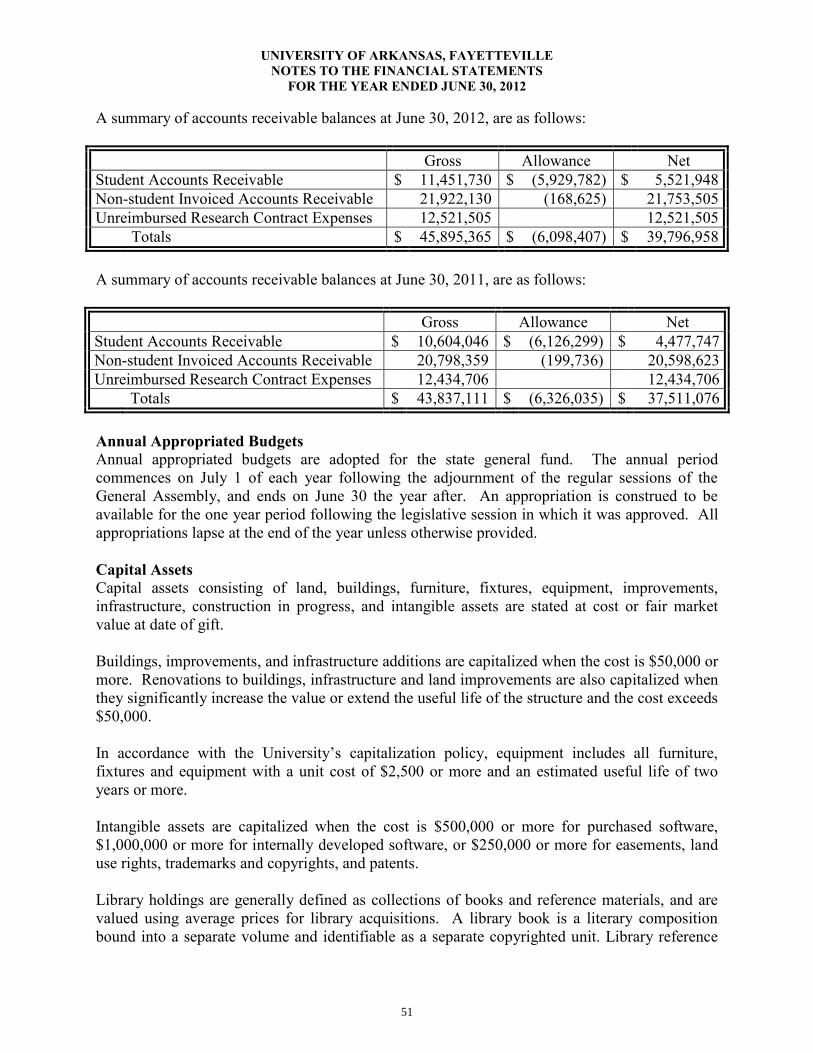
UNIVERSITY OF ARKANSAS, FAYETTEVILLE NOTES TO THE FINANCIAL STATEMENTS
FOR THE YEAR ENDED JUNE 30, 2012
A summary of accounts receivable balances at June 30, 2012, are as follows: Gross Allowance Net Student Accounts Receivable $ 11,451,730 $ (5,929,782) $ 5,521,948 Non-student Invoiced Accounts Receivable 21,922,130 (168,625) 21,753,505 Unreimbursed Research Contract Expenses 12,521,505 12,521,505 Totals $ 45,895,365 $ (6,098,407) $ 39,796,958 A summary of accounts receivable balances at June 30, 2011, are as follows: Gross Allowance Net Student Accounts Receivable $ 10,604,046 $ (6,126,299) $ 4,477,747 Non-student Invoiced Accounts Receivable 20,798,359 (199,736) 20,598,623 Unreimbursed Research Contract Expenses 12,434,706 12,434,706 Totals $ 43,837,111 $ (6,326,035) $ 37,511,076 Annual Appropriated Budgets Annual appropriated budgets are adopted for the state general fund. The annual period commences on July 1 of each year following the adjournment of the regular sessions of the General Assembly, and ends on June 30 the year after. An appropriation is construed to be available for the one year period following the legislative session in which it was approved. All appropriations lapse at the end of the year unless otherwise provided. Capital Assets Capital assets consisting of land, buildings, furniture, fixtures, equipment, improvements, infrastructure, construction in progress, and intangible assets are stated at cost or fair market value at date of gift. Buildings, improvements, and infrastructure additions are capitalized when the cost is $50,000 or more. Renovations to buildings, infrastructure and land improvements are also capitalized when they significantly increase the value or extend the useful life of the structure and the cost exceeds $50,000. In accordance with the University’s capitalization policy, equipment includes all furniture, fixtures and equipment with a unit cost of $2,500 or more and an estimated useful life of two years or more. Intangible assets are capitalized when the cost is $500,000 or more for purchased software, $1,000,000 or more for internally developed software, or $250,000 or more for easements, land use rights, trademarks and copyrights, and patents. Library holdings are generally defined as collections of books and reference materials, and are valued using average prices for library acquisitions. A library book is a literary composition bound into a separate volume and identifiable as a separate copyrighted unit. Library reference
51
UNIVERSITY OF ARKANSAS, FAYETTEVILLE NOTES TO THE FINANCIAL STATEMENTS
FOR THE YEAR ENDED JUNE 30, 2012
materials are information sources other than books which include journals, periodicals, microforms, audio/visual media, computer-based information, manuscripts, maps, documents, and similar items. Livestock is under the control of the Department of Animal Sciences and is maintained primarily for research purposes with any other benefits derived from the operations considered as incidental to the primary mission of the Department. The inventory value placed on the animals is determined by department heads utilizing current market prices and breeding and research intangibles. Depreciation is computed using the straight-line method over the estimated useful lives of the assets, generally 15 to 30 years for buildings, 15 to 20 years for infrastructure and land improvements, 3 to 10 years for equipment and 10 years for library holdings. Amortization of intangible assets, except for those determined to have indefinite useful lives, is computed using the straight-line method over the estimated useful lives of the assets, generally 5 years for purchased software; 10 years for internally developed software; 15 years for easements, land use rights, trademarks, and copyrights; and 20 years for patents. Capitalization of Interest The University capitalizes interest involving qualifying assets, if material. The amount of interest cost to be capitalized is interest cost on borrowings netted against any interest earned on temporary investments of the proceeds of those borrowings from the date of borrowing until the specified qualifying assets acquired with those borrowings are ready for their intended use. Classification of Revenues The University has classified its revenues as either operating or nonoperating revenues according to the following criteria: Operating revenues: Operating revenues include activities that have the characteristics of
exchange transactions, such as (1) student tuition and fees, net of scholarship discounts and allowances, (2) sales and services of auxiliary enterprises, net of scholarship discounts and allowances, and (3) most federal, state and local grants and contracts.
Nonoperating revenues: Nonoperating revenues include activities that have the
characteristics of nonexchange transactions, such as gifts and contributions, and other revenue sources that are defined as nonoperating revenues by GASB Statement No. 9, Reporting Cash Flows of Proprietary and Nonexpendable Trust Funds and Governmental Entities That Use Proprietary Fund Accounting, and GASB Statement No. 34, Basic Financial Statements – and Management’s Discussion and Analysis – for State and Local Governments, such as state appropriations and investment income.
Scholarship Discounts and Allowances Scholarship discounts and allowances are the difference between the stated charge for goods and services provided by the University and the amount that is paid by students and/or third parties making payments on the students’ behalf. Certain governmental grants and nongovernmental programs are recorded as either operating or nonoperating revenues in the University’s financial
52

UNIVERSITY OF ARKANSAS, FAYETTEVILLE NOTES TO THE FINANCIAL STATEMENTS
FOR THE YEAR ENDED JUNE 30, 2012
statements. To the extent that revenues from such programs are used to satisfy tuition and fees and other student charges, the University has recorded a scholarship discount and allowance. (2). Reporting Entity The University of Arkansas, Fayetteville (“the University”) was established at Fayetteville in 1871 under the provisions of the Morrill Act as both a state university and the land-grant college of Arkansas. The University of Arkansas, Fayetteville includes the Agricultural Experiment Station, the Cooperative Extension Service, the Arkansas Archeological Survey, the Criminal Justice Institute, and the Clinton School of Public Service, as well as the academic units. The academic units in Fayetteville include ten colleges, schools and divisions: the Dale Bumpers College of Agricultural, Food, and Life Sciences, the Fay Jones School of Architecture, the J. William Fulbright College of Arts and Sciences, the Sam M. Walton College of Business, the College of Education and Health Professions, the College of Engineering, the School of Law, the Honors College, the Graduate School, and the School of Continuing Education and Academic Outreach. The University is one of eleven campuses of the University of Arkansas System. The governing body is the Board of Trustees which is comprised of ten members. GASB No. 14 addresses the issue of the financial reporting entity. According to GASB No. 14, the financial reporting entity consists of (a) the primary government; (b) organizations for which the primary government is financially accountable, and (c) other organizations for which the nature and significance of their relationship with the primary government are such that exclusion would cause the reporting entity’s financial statements to be misleading or incomplete. Under the provisions of this statement, the University is a component unit of the State of Arkansas (primary government). GASB No. 14 defines a component unit as a legally separate organization for which the elected officials of the primary government are financially accountable. Although this statement is written from the perspective of the primary government, its requirements apply to the separately issued financial statements of a component unit, and therefore, the component unit should apply the provisions of GASB No. 14 as if it was a primary government. (3). Compensated Absences
In June 2005, GASB issued Statement No. 47, Accounting for Termination Benefits, which became effective with the fiscal year ending June 30, 2006. The Statement established guidance for accounting and reporting of the costs and liabilities associated with termination benefits, such as those associated with early retirement incentives. The University has not extended a large-scale or age-related early retirement offering during the fiscal year ended June 30, 2012. The University has, from time to time, negotiated early retirement agreements with faculty which may include the provision of healthcare or other benefits for future periods. The number of early retirement agreements is small and the obligation for future benefits is considered immaterial. Arkansas Code Annotated §21-4-501 authorized the compensation for accumulated unused sick leave for certain employees upon retirement. The University has accrued a liability for these amounts in Compensated Absences Payable.
53

UNIVERSITY OF ARKANSAS, FAYETTEVILLE NOTES TO THE FINANCIAL STATEMENTS
FOR THE YEAR ENDED JUNE 30, 2012
Employees accrue and accumulate annual and sick leave in accordance with policies established by the Board of Trustees. Full time, non-classified, University employees accrue annual leave at the rate of fifteen hours per month, classified employees at a variable rate (from 8 to 15 hours per month) dependent upon number of years of employment in state government. Under the University’s policy, an employee may carry accrued leave forward from one calendar year to another, up to a maximum of 240 hours (30 working days). Employees who terminate their employment are entitled to payment for all accumulated annual leave, up to the maximum allowed. Classified employees who meet the conditions to be considered retirees at the time of termination of employment are entitled to a partial payment of accumulated, unused sick leave in accordance with the provisions of Arkansas Code Annotated §21-4-501. The University recognizes a liability for compensated absences. The liability is based on the value of unused employee vacation and compensatory time as of year-end, including the associated benefits: contributions to Retirement, Social Security, Medicare, Workers’ Compensation, and Unemployment Insurance. The liability also includes amounts paid to eligible classified employees for unused sick leave. A classified employee who has accumulated at least fifty (50) days, but less than sixty (60) days of sick leave upon retirement shall receive an amount equal to fifty percent (50%) of the number of accrued sick leave days (rounded to the nearest day) times fifty percent (50%) of the employee’s daily salary. A classified employee who has accumulated at least sixty (60) days, but less than seventy (70) days of sick leave upon retirement shall receive an amount equal to sixty percent (60%) of the number of accrued sick leave days (rounded to the nearest day) times 60 percent (60%) of the employee’s daily salary. A classified employee who has accumulated at least seventy (70) days, but less than eighty (80) days of sick leave upon retirement shall receive an amount equal to seventy percent (70%) of the number of accrued sick leave days (rounded to the nearest day) times seventy percent (70%) of the employee’s daily salary. A classified employee that has accumulated at least eighty (80) or more days of sick leave upon retirement shall receive an amount equal to eighty percent (80%) of the number of accrued sick leave days (rounded to the nearest day) times eighty percent (80%) of the employee’s daily salary. In no event shall an employee receive a sick leave incentive amount that exceeds $7,500. The University recognizes the estimated amount of the liability that will be incurred within the next year as a current liability and the balance as noncurrent. (4). Cash, Cash Equivalents, and Investments
Cash and cash equivalents – The University uses commercial banks for its cash deposits. Board of Trustees policy requires that all cash deposits be either insured by the Federal Deposit Insurance Corporation (FDIC) or collateralized by securities held at a third party financial institution (preferably the cognizant Federal Reserve Bank) in the University’s name. Cash deposits are carried at cost. Cash balances in excess of current requirements are pooled and invested in highly liquid, short-term investments with the funds available on a daily basis.
54

UNIVERSITY OF ARKANSAS, FAYETTEVILLE NOTES TO THE FINANCIAL STATEMENTS
FOR THE YEAR ENDED JUNE 30, 2012
The following summarizes the University’s cash position:
June 30, 2012 June 30, 2011 Bank Balance Bank Balance Insured (FDIC) $ 3,371,791 $ 23,789,790 Uninsured, Collateralized 151,094,821 80,959,787 Uninsured, Uncollateralized Total Deposits $ 154,466,612 $ 104,749,577
Deposits are exposed to custodial risk if they are not covered by depository insurance (FDIC) and are uncollateralized, collateralized with securities held by the pledging institution or collateralized with securities held by the pledging institution’s agent but not in the University’s name. At June 30, 2012, none of the University’s bank balance of $154,466,612 was exposed to custodial credit risk. The University of Arkansas System Administration (System Administration) does not maintain separate bank accounts. System Administration deposits are commingled in University of Arkansas, Fayetteville bank accounts. The carrying value of the System Administration funds was $2,327,154 at June 30, 2012, and $2,324,433 at June 30, 2011. The above deposit schedule does not include cash on hand in various imprest funds maintained by the University of $69,180 or short-term investments (cash equivalents) of $18,433,153 at June 30, 2012. At June 30, 2011, these amounts were $79,221 and $18,254,815, respectively. Adjustments necessary to convert from Bank Balance to Total Cash and Cash Equivalents are:
June 30, 2012 June 30, 2011 Bank Balance $ 154,466,612 $ 104,749,577 Less: Items in Transit (25,767,574) (5,492,419) Less: Nonnegotiable Certificates of Deposit
(280,686)
(281,369)
Cash on Books $ 128,418,352 $ 98,975,789 State Treasury Cash $ 2,513,310 $ 3,307,562 Cash Equivalents 18,433,153 18,254,815 Less: System Cash (2,327,154) (2,324,433) Cash and Equivalents 18,619,309 19,237,944 Total Cash and Equivalents $ 147,037,661 $ 118,213,733
Investments Investments, other than deposits held with trustees, are recorded at fair value. Fair value for reporting purposes is market value if a market price or quote is readily available. Investments that are not recorded at fair value are reported at cost or amortized cost.
55
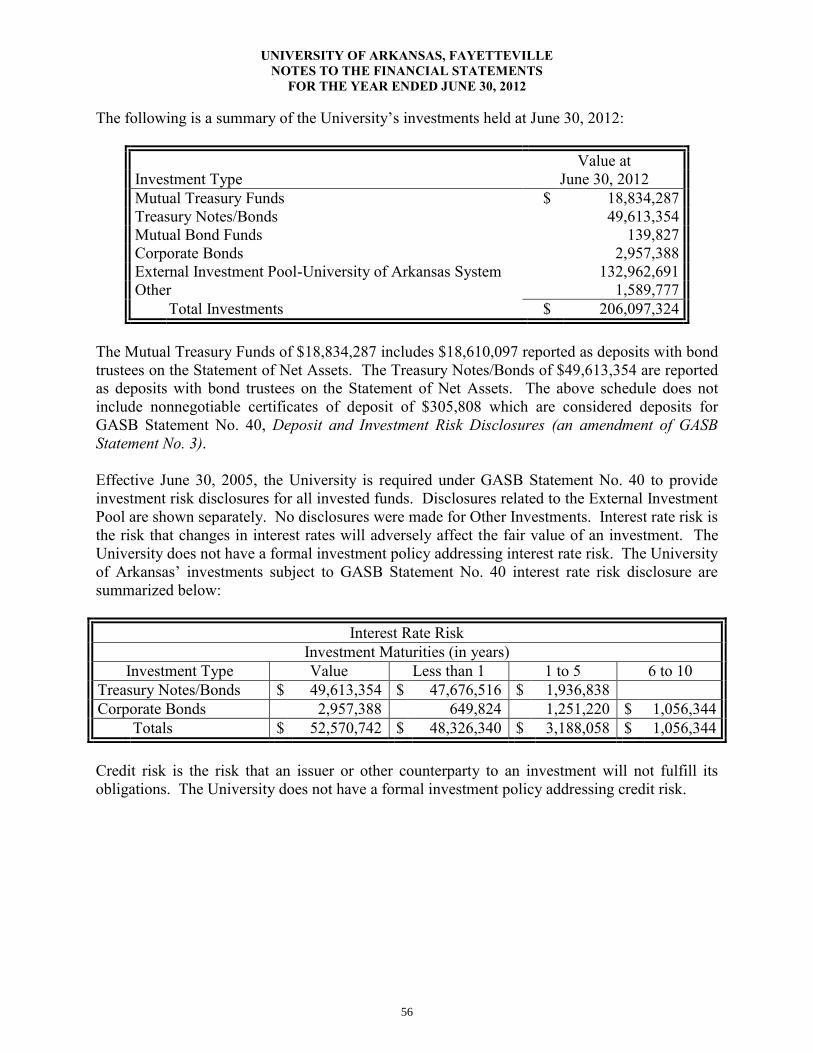
UNIVERSITY OF ARKANSAS, FAYETTEVILLE NOTES TO THE FINANCIAL STATEMENTS
FOR THE YEAR ENDED JUNE 30, 2012
The following is a summary of the University’s investments held at June 30, 2012:
Value at June 30, 2012 Investment Type
Mutual Treasury Funds $ 18,834,287 Treasury Notes/Bonds 49,613,354 Mutual Bond Funds 139,827 Corporate Bonds 2,957,388 External Investment Pool-University of Arkansas System 132,962,691 Other 1,589,777 Total Investments $ 206,097,324
The Mutual Treasury Funds of $18,834,287 includes $18,610,097 reported as deposits with bond trustees on the Statement of Net Assets. The Treasury Notes/Bonds of $49,613,354 are reported as deposits with bond trustees on the Statement of Net Assets. The above schedule does not include nonnegotiable certificates of deposit of $305,808 which are considered deposits for GASB Statement No. 40, Deposit and Investment Risk Disclosures (an amendment of GASB Statement No. 3). Effective June 30, 2005, the University is required under GASB Statement No. 40 to provide investment risk disclosures for all invested funds. Disclosures related to the External Investment Pool are shown separately. No disclosures were made for Other Investments. Interest rate risk is the risk that changes in interest rates will adversely affect the fair value of an investment. The University does not have a formal investment policy addressing interest rate risk. The University of Arkansas’ investments subject to GASB Statement No. 40 interest rate risk disclosure are summarized below:
Interest Rate Risk Investment Maturities (in years)
Investment Type Value Less than 1 1 to 5 6 to 10 Treasury Notes/Bonds $ 49,613,354 $ 47,676,516 $ 1,936,838 Corporate Bonds 2,957,388 649,824 1,251,220 $ 1,056,344 Totals $ 52,570,742 $ 48,326,340 $ 3,188,058 $ 1,056,344 Credit risk is the risk that an issuer or other counterparty to an investment will not fulfill its obligations. The University does not have a formal investment policy addressing credit risk.
56

UNIVERSITY OF ARKANSAS, FAYETTEVILLE NOTES TO THE FINANCIAL STATEMENTS
FOR THE YEAR ENDED JUNE 30, 2012
The University of Arkansas’ investments subject to GASB Statement No. 40 credit risk disclosure are summarized below:
Credit Risk
Investment Type Fair Value Aaa-Aa3 A1-A3 Baa1-Baa3 Below Baa3 Not Rated Mutual Treasury Funds $ 18,834,287 $ 18,610,098 $ 224,189 Treasury Notes/Bonds 49,613,354 49,613,354 Mutual Bond Funds 139,827 139,827 Corporate Bonds 2,957,388 $ 1,848,533 $ 829,985 $ 278,870 Totals $ 71,544,856 $ 68,223,452 $ 1,848,533 $ 829,985 $ 278,870 $ 364,016
The ratings are assigned by the Moody’s investment ratings service. Concentration of Credit Risk The University places no limit on the amount that may be invested with any one issuer. There were no investments, other than U.S. Treasuries/Notes, with any one issuer that represented 5% or more of the total funds invested on June 30, 2012. External Investment Pool-University of Arkansas System Effective June 30, 1997, the University of Arkansas adopted Governmental Accounting Standards Board Statement No. 31, Accounting and Financial Reporting for Certain Investments and for External Pools. GASB No. 31 requires that investments be carried at fair value and all changes in fair value be reported in revenue as a component of investment income. In 1997, the University of Arkansas and the University of Arkansas Foundation established an external investment pool. This arrangement commingles (pools) the moneys of more than one legally separate entity and invests, on the participants’ behalf, in an investment portfolio. During 1998, the Walton Arts Foundation joined the pool and during 2003, the Fayetteville Campus Foundation joined the pool. During 2007, the University of Arkansas Community College at Hope Foundation joined the pool. The governmental external investment pool is exempt from registration with the Securities and Exchange Commission. The University of Arkansas Board of Trustees and the University of Arkansas Foundation Board of Trustees are the sponsors of this investment pool and are responsible for operation and oversight for the pool. All participation in this investment pool is voluntary.
In January 2010, the University of Arkansas Investment Committee approved an agreement which delegated authority to the UA Foundation to manage University funds held in the Pool. The agreement included delegation of all responsibility for all investment guidelines and performance objectives for accounts within the Pool. The agreement also delegated to the UA Foundation authority for further delegation of portfolio implementation decisions to one or more investment managers. In January 2010, the UA Foundation entered into such an agreement with Cambridge Associates, LLC.
The following tables contain information on the risk disclosure of the Pool, which includes the Total Return Pool and the Intermediate Pool. The University of Arkansas, Fayetteville owns 9.23% of the Pool’s net assets.
57

UNIVERSITY OF ARKANSAS, FAYETTEVILLE NOTES TO THE FINANCIAL STATEMENTS
FOR THE YEAR ENDED JUNE 30, 2012
UNIVERSITY OF ARKANSAS EXTERNAL INVESTMENT POOL Statement of Invested Assets
June 30, 2012
Investment Type Fair Value* Equity $ 331,649,344
Common Stock
49,762,773
Funds – Common Stock 281,825,964
Preferred Stock
58,373
Rights/Warrants
2,234
Fixed Income
432,670,824
Government Bonds
31,440,381
Corporate Bonds
73,025
Funds – Corporate Bond 24,671,498
Government Mortgage Back Securities 143
Non-Government Backed C.M.O.s
1
Other Fixed Income
376,485,776
Venture Capital and Partnerships
565,297,542
Partnerships
565,297,542
Hedge Fund
74,460,336
Hedge Equity
74,460,336
All Other
72,873
Recoverable Taxes
72,873
Cash/Cash Equivalents
36,594,103
Short Term Investment Funds
66,858,005
Cash
(30,288,792)
Invested Cash
24,890
TOTAL $ 1,440,745,022
*Includes accrued income
58

UNIVERSITY OF ARKANSAS, FAYETTEVILLE NOTES TO THE FINANCIAL STATEMENTS
FOR THE YEAR ENDED JUNE 30, 2012
UNIVERSITY OF ARKANSAS EXTERNAL INVESTMENT POOL Credit Risk - S&P Quality Ratings
June 30, 2012
US GOVN. Investment Type and Fair Value* TOTAL A BBB NR GUAR Corporate Bonds $ 73,025
$ 73,025
Funds – Corporate Bond 24,548,330 24,548,330 Funds – Other Fixed Income 376,190,996 376,190,996 Funds – Short Term Investment 66,857,267 66,857,267 Government Bonds
31,439,343
$ 38,643 $ 31,400,700
Govn Mortgage Backed Securities 142
142 Non-Govn Backed C.M.O.s
1 $ 1
Total $ 499,109,104 $ 1 $ 38,643 $ 467,669,618 $ 31,400,842
*Does not include accrued income
UNIVERSITY OF ARKANSAS EXTERNAL INVESTMENT POOL Years to Maturity
June 30, 2012
Investment Maturities (in years) Investment Type(1) Fair Value* Less than 1 1 to 5 6 to 10 More than 10 Corporate Bonds $ 73,025 $ 73,025 Funds – Corporate Bond 24,548,330 Funds – Other Fixed Income 376,190,996 Funds – Short Term Investment 66,857,267 Government Bonds
31,439,343
$ 31,400,700
38,643
Govn Mortgage Backed Securities 142
142 Non-Govn Backed C.M.O.s
1
Total $ 499,109,104 $ $ 31,400,700 $ $ 111,810
*Does not include accrued income (1)Pooled and Mutual Fund/Commingled Fund values displayed for Fair Value Totals only.
59

UNIVERSITY OF ARKANSAS, FAYETTEVILLE NOTES TO THE FINANCIAL STATEMENTS
FOR THE YEAR ENDED JUNE 30, 2012
UNIVERSITY OF ARKANSAS EXTERNAL INVESTMENT POOL Interest Rate Sensitivity - Effective Duration
June 30, 2012
Effective Investment Type(1) Fair Value* Duration Corporate Bonds
$ 73,025
Funds – Corporate Bond 24,548,330 Funds – Other Fixed Income 376,190,996 Funds – Short Term Investment 66,857,267 Government Bonds
31,439,343
1.99
Govn Mortgage Backed Securities
142
3.32 Non-Govn Backed C.M.O.s
1
Total
$ 499,109,104
*Does not include accrued income (1)Pooled and Mutual Fund/Commingled Fund values displayed for Fair Value Totals only
UNIVERSITY OF ARKANSAS EXTERNAL INVESTMENT POOL Foreign Currency Risk By Investment Type
June 30, 2012
Other Currency By Investment and Fair Value* Cash Equity Assets Australian Dollar
$ 2,651
Swiss Franc
33,242 Danish Krone
3,729
Euro $ 10,212 $ 22,335 26,673 British Pound Sterling
1,230 780
Hong Kong Dollar
5,552 Japanese Yen
7,053
Polish Zloty
6,578 Swedish Krona
466
$ 18,961 $ 28,667 $ 72,873
*Includes accrued income
60

UNIVERSITY OF ARKANSAS, FAYETTEVILLE NOTES TO THE FINANCIAL STATEMENTS
FOR THE YEAR ENDED JUNE 30, 2012
The activities during fiscal year 2012 affecting the University’s investments in the external pool are summarized below:
Total Return Pool
Intermediate Pool
Intermediate Pool
CES
Total June 30, 2011, Balances $ 60,465,127 $ 57,298,639 $ 10,171,231 $ 127,934,997 Income 604,689 1,559,916 276,904 2,441,509 Realized Gains/(Losses) 674,977 1,170,838 207,839 2,053,654 Unrealized Gains/(Losses) (154,082) 826,608 146,733 819,259 Expenses Paid from Pool (228,419) (49,519) (8,790) (286,728) June 30, 2012, Balances $ 61,362,292 $ 60,806,482 $ 10,793,917 $ 132,962,691
The activities during fiscal year 2011 affecting the University’s investments in the external pool are summarized below:
Total Return Pool
Intermediate Pool
Intermediate Pool
CES
Total June 30, 2010, Balances $ 52,127,478 $ 54,724,479 $ 9,714,285 $ 116,566,242 Income 770,894 1,508,010 267,691 2,546,595 Realized Gains/(Losses) 1,172,120 1,000,048 177,521 2,349,689 Unrealized Gains/(Losses) 8,648,127 97,105 17,237 8,762,469 Expenses Paid from Pool (253,492) (31,003) (5,503) (289,998) Transfers In/(Out) of Pool (2,000,000) (2,000,000) June 30, 2011, Balances $ 60,465,127 $ 57,298,639 $ 10,171,231 $ 127,934,997
Endowment Funds – Assets of endowed funds, except where donor restrictions prohibit commingling of investments, are pooled on a fair value basis, with each fund subscribing or disposing of units on the basis of the unit fair value. The unit fair value is recalculated each month. The following summarizes the relationship between the pooled assets and their earnings:
61
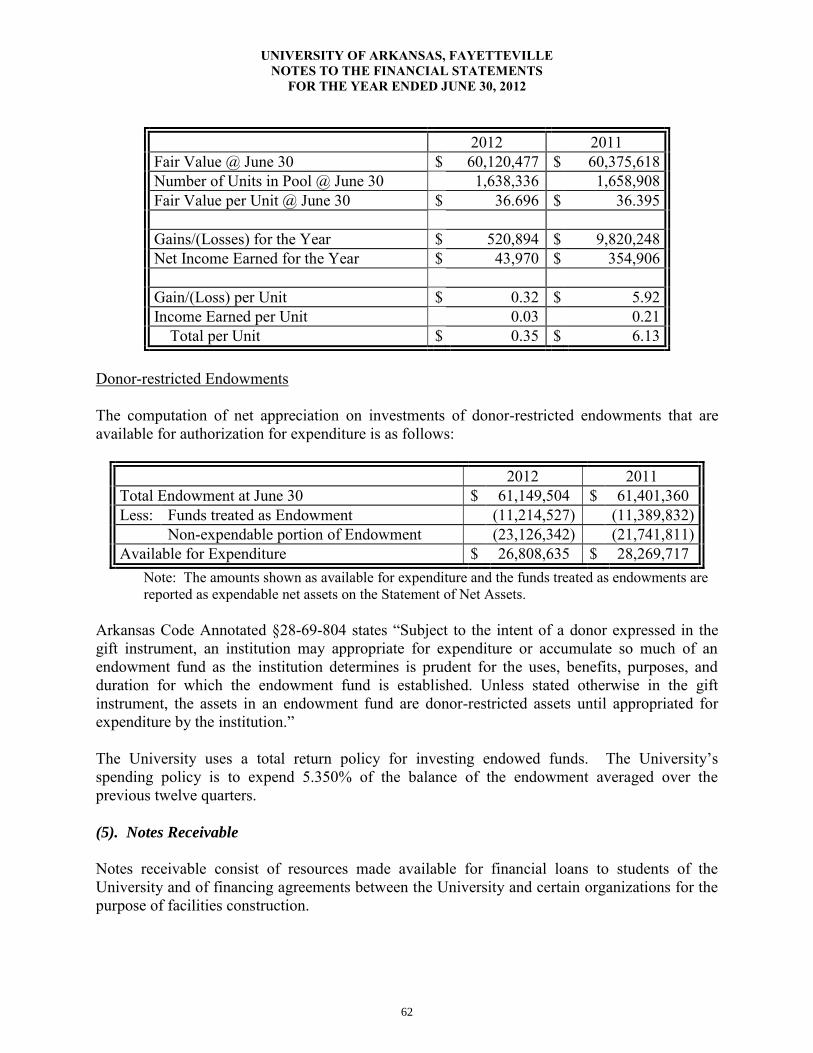
UNIVERSITY OF ARKANSAS, FAYETTEVILLE NOTES TO THE FINANCIAL STATEMENTS
FOR THE YEAR ENDED JUNE 30, 2012
2012 2011 Fair Value @ June 30 $ 60,120,477 $ 60,375,618 Number of Units in Pool @ June 30 1,638,336 1,658,908 Fair Value per Unit @ June 30 $ 36.696 $ 36.395 Gains/(Losses) for the Year $ 520,894 $ 9,820,248 Net Income Earned for the Year $ 43,970 $ 354,906 Gain/(Loss) per Unit $ 0.32 $ 5.92 Income Earned per Unit 0.03 0.21 Total per Unit $ 0.35 $ 6.13
Donor-restricted Endowments The computation of net appreciation on investments of donor-restricted endowments that are available for authorization for expenditure is as follows:
2012 2011 Total Endowment at June 30 $ 61,149,504 $ 61,401,360 Less: Funds treated as Endowment (11,214,527) (11,389,832) Non-expendable portion of Endowment (23,126,342) (21,741,811) Available for Expenditure $ 26,808,635 $ 28,269,717
Note: The amounts shown as available for expenditure and the funds treated as endowments are reported as expendable net assets on the Statement of Net Assets.
Arkansas Code Annotated §28-69-804 states “Subject to the intent of a donor expressed in the gift instrument, an institution may appropriate for expenditure or accumulate so much of an endowment fund as the institution determines is prudent for the uses, benefits, purposes, and duration for which the endowment fund is established. Unless stated otherwise in the gift instrument, the assets in an endowment fund are donor-restricted assets until appropriated for expenditure by the institution.” The University uses a total return policy for investing endowed funds. The University’s spending policy is to expend 5.350% of the balance of the endowment averaged over the previous twelve quarters. (5). Notes Receivable Notes receivable consist of resources made available for financial loans to students of the University and of financing agreements between the University and certain organizations for the purpose of facilities construction.
62

UNIVERSITY OF ARKANSAS, FAYETTEVILLE NOTES TO THE FINANCIAL STATEMENTS
FOR THE YEAR ENDED JUNE 30, 2012
The resources for loans to students include federal funds, funds from other external sources, and University funds. New student loans totaling $2,463,097 and $1,873,057 were issued under the Student Loan Programs for the years ended June 30, 2012, and June 30, 2011, respectively. Of total campus-based loans processed, the majority were from Perkins funds provided by the federal government. The federal student loan default rate based on the U.S. Department of Education Cohort default rate was 12.03% for the year ended June 30, 2012, and 12.05% for the year ended June 30, 2011. Notes receivable totaling $28,642 and $7,574 were written off during the fiscal year ended June 30, 2012, and June 30, 2011, respectively. The following summarizes the balance of notes receivable at June 30, 2012:
Type of Note Gross Balance Allowance Net Balance Current Portion Student loans $ 15,408,524 $ 881,123 $ 14,527,401 $ 3,235,790 Loans to Greek organizations 892,719 892,719 120,055 Totals $ 16,301,243 $ 881,123 $ 15,420,120 $ 3,355,845
The following summarizes the balance of notes receivable at June 30, 2011:
Type of Note Gross Balance Allowance Net Balance Current Portion Student loans $ 15,210,254 $ 892,159 $ 14,318,095 $ 3,650,461 Loans to Greek organizations 1,007,265 1,007,265 114,546 Totals $ 16,217,519 $ 892,159 $ 15,325,360 $ 3,765,007
(6). Pledges Receivable The University did not have any material amounts pledged that were receivable at June 30, 2012 or 2011. (7). Income Taxes The University is tax exempt from federal income taxes except for tax on unrelated business income. The University had no significant unrelated business income for the year ended June 30, 2012. It is also exempt from state income taxes under Arkansas law. Accordingly, no provision for income taxes is made in the financial statements.
63

UNIVERSITY OF ARKANSAS, FAYETTEVILLE NOTES TO THE FINANCIAL STATEMENTS
FOR THE YEAR ENDED JUNE 30, 2012
(8). Accounts Payable and Accrued Liabilities
Accounts payable balances are summarized as follows: June 30, 2012 June 30, 2011 Payable to Outside Vendors $ 27,173,130 $ 19,164,946 Retainage on Construction Contracts 4,513,307 3,946,085 Property Taxes Payable 224,871 114,411 Total $ 31,911,308 $ 23,225,442
Accrued payroll liabilities are summarized as follows: June 30, 2012 June 30, 2011 Net Salaries and Wages Payable $ 3,645,205 $ 2,245,306 Employee Withholdings Payable 7,175,609 6,746,738 Employer Payroll Taxes and Benefits Matching Payable 5,737,711 5,416,965 Total $ 16,558,525 $ 14,409,009
(9). Compensated Absences, Bonds, Notes, Capital Leases Payable, and Installment Contracts Debt service payments on existing bonds amounted to $35,684,264 for the fiscal year ended June 30, 2012. The amount of $6,921,215 was expended for principal and interest on notes payable, installment contracts and capital leases for the same period. On April 17, 2012, the University issued $56,965,000 in Various Facility Revenue Refunding Bonds, Series 2012A. The bonds, with interest rates of 1.0% to 5.0% were issued to refund $44,555,000 of outstanding bonds dated December 1, 2002 with an interest rate of 4.75% to 5.50%, and $17,080,000 of outstanding bonds dated October 1, 2004 with interest rates of 3.25% to 4.75%. Net bond proceeds and premiums of $65,717,794 were deposited into the advance refunding fund to retire the bonds. The combined refunding resulted in a difference between the reacquisition price and the net carrying amount of the old debt of $4,082,794. This difference, reported in the accompanying financial statements as a deduction from bonds payable, will be amortized through the fiscal year 2033 using the straight-line method. The University completed the refunding to reduce its total debt service payments over the next twenty-one years by $9,331,777 and to obtain an economic gain (difference between the present values of the old and new debt service payments) of $7,016,631. The escrow balance as of June 30, 2012 was $64,248,522. The bonds dated December 1, 2002 will be refunded on December 1, 2012. The bonds dated October 1, 2004 will continue to have regularly scheduled principal and interest payments made from the escrow account until the bond call date of November 1, 2014, at which time the remaining balance will be refunded. On June 29, 2011, the University issued $101,225,000 in Various Facility Revenue Bonds, Series 2011A and $8,895,000 in Various Facility Revenue Bonds, Refunding Series 2011B. The Series
64

UNIVERSITY OF ARKANSAS, FAYETTEVILLE NOTES TO THE FINANCIAL STATEMENTS
FOR THE YEAR ENDED JUNE 30, 2012
2011A bonds were issued to provide funds to finance various construction and renovation projects on the University campus. Projects include renovation and construction of and additions to Vol Walker and Ozark Halls, construction of Hillside Auditorium, renovations to various classrooms and teaching labs, renovation to the Science Building, construction of the Child Development Study Center, improvements to the Arkansas Union, construction of a hazardous waste facility, renovation and improvements to various student housing and dining facilities, and various infrastructure improvements. The Various Facility Revenue Bonds, Refunding Series 2011B, with interest rates of 3.0% to 5.0% were issued to refund $3,580,000 of outstanding bonds dated October 15, 1997 with an interest rate of 5.0%, and $6,270,000 of outstanding bonds dated November 1, 2001 with interest rates of 4.10% to 4.75%. Bond proceeds of $3,593,922 were used to redeem the 1997 bonds. Bond proceeds of $6,414,688 were deposited into the advance refunding fund to retire the 2001 bonds. The combined refunding resulted in a difference between the reacquisition price and the net carrying amount of the old debt of $158,610. This difference, reported in the accompanying financial statements as a deduction from bonds payable, will be amortized through the fiscal year 2023 using the straight-line method. The University completed the refunding to reduce its total debt service payments over the next eleven years by $1,496,871 and to obtain an economic gain (difference between the present values of the old and new debt service payments) of $1,130,158. The bonds dated October 15, 1997 were redeemed on July 29, 2011. The bonds dated November 1, 2001 were refunded on December 1, 2011. The escrow account has been closed as of June 30, 2012. On June 29, 2011, the University issued $23,575,000 in Athletic Facilities Revenue Bonds, Series 2011. The bonds were issued to provide funds to finance a portion of a football center, football practice fields and parking facilities. On June 30, 2010, the University issued $23,965,000 in Athletic Facilities Revenue Refunding Bonds, Series 2010 (Taxable) with interest rates of 1.00% to 4.82% to refund $19,145,000 of outstanding bonds dated May 1, 1999 with interest rates of 3.35% to 5.05%, and $4,000,000 of outstanding bonds dated November 1, 2001 with an interest rate of 4.20%. Bond proceeds of $19,460,189 were deposited into the current refunding fund to retire the 1999 bonds. Bond proceeds of $4,229,298 were deposited into the advance refunding fund to retire the 2001 bonds. The combined refunding resulted in a difference between the reacquisition price and the net carrying amount of the old debt of $544,487. This difference, reported in the accompanying financial statements as a deduction from bonds payable, will be amortized through the fiscal year 2021 using the straight-line method. The University completed the refunding to reduce its total debt service payments over the next eleven years by $1,319,864 and to obtain an economic gain (difference between the present values of the old and new debt service payments) of $355,490. The bonds dated May 1, 1999 were refunded on July 16, 2010. The bonds dated November 1, 2001 were refunded on December 1, 2011. The escrow account has been closed as of June 30, 2012. On April 8, 2010, the University entered into a financing agreement with Banc of America Public Capital Corp. to finance the acquisition and installation of equipment, together with all
65
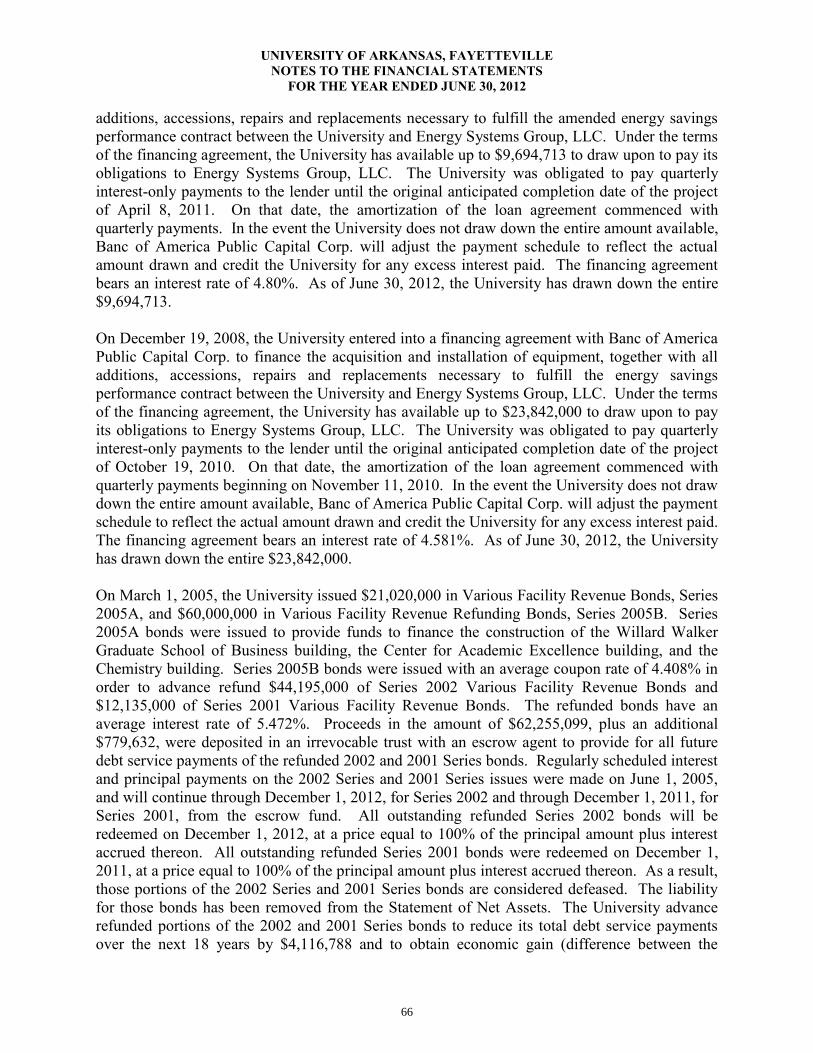
UNIVERSITY OF ARKANSAS, FAYETTEVILLE NOTES TO THE FINANCIAL STATEMENTS
FOR THE YEAR ENDED JUNE 30, 2012
additions, accessions, repairs and replacements necessary to fulfill the amended energy savings performance contract between the University and Energy Systems Group, LLC. Under the terms of the financing agreement, the University has available up to $9,694,713 to draw upon to pay its obligations to Energy Systems Group, LLC. The University was obligated to pay quarterly interest-only payments to the lender until the original anticipated completion date of the project of April 8, 2011. On that date, the amortization of the loan agreement commenced with quarterly payments. In the event the University does not draw down the entire amount available, Banc of America Public Capital Corp. will adjust the payment schedule to reflect the actual amount drawn and credit the University for any excess interest paid. The financing agreement bears an interest rate of 4.80%. As of June 30, 2012, the University has drawn down the entire $9,694,713. On December 19, 2008, the University entered into a financing agreement with Banc of America Public Capital Corp. to finance the acquisition and installation of equipment, together with all additions, accessions, repairs and replacements necessary to fulfill the energy savings performance contract between the University and Energy Systems Group, LLC. Under the terms of the financing agreement, the University has available up to $23,842,000 to draw upon to pay its obligations to Energy Systems Group, LLC. The University was obligated to pay quarterly interest-only payments to the lender until the original anticipated completion date of the project of October 19, 2010. On that date, the amortization of the loan agreement commenced with quarterly payments beginning on November 11, 2010. In the event the University does not draw down the entire amount available, Banc of America Public Capital Corp. will adjust the payment schedule to reflect the actual amount drawn and credit the University for any excess interest paid. The financing agreement bears an interest rate of 4.581%. As of June 30, 2012, the University has drawn down the entire $23,842,000. On March 1, 2005, the University issued $21,020,000 in Various Facility Revenue Bonds, Series 2005A, and $60,000,000 in Various Facility Revenue Refunding Bonds, Series 2005B. Series 2005A bonds were issued to provide funds to finance the construction of the Willard Walker Graduate School of Business building, the Center for Academic Excellence building, and the Chemistry building. Series 2005B bonds were issued with an average coupon rate of 4.408% in order to advance refund $44,195,000 of Series 2002 Various Facility Revenue Bonds and $12,135,000 of Series 2001 Various Facility Revenue Bonds. The refunded bonds have an average interest rate of 5.472%. Proceeds in the amount of $62,255,099, plus an additional $779,632, were deposited in an irrevocable trust with an escrow agent to provide for all future debt service payments of the refunded 2002 and 2001 Series bonds. Regularly scheduled interest and principal payments on the 2002 Series and 2001 Series issues were made on June 1, 2005, and will continue through December 1, 2012, for Series 2002 and through December 1, 2011, for Series 2001, from the escrow fund. All outstanding refunded Series 2002 bonds will be redeemed on December 1, 2012, at a price equal to 100% of the principal amount plus interest accrued thereon. All outstanding refunded Series 2001 bonds were redeemed on December 1, 2011, at a price equal to 100% of the principal amount plus interest accrued thereon. As a result, those portions of the 2002 Series and 2001 Series bonds are considered defeased. The liability for those bonds has been removed from the Statement of Net Assets. The University advance refunded portions of the 2002 and 2001 Series bonds to reduce its total debt service payments over the next 18 years by $4,116,788 and to obtain economic gain (difference between the
66
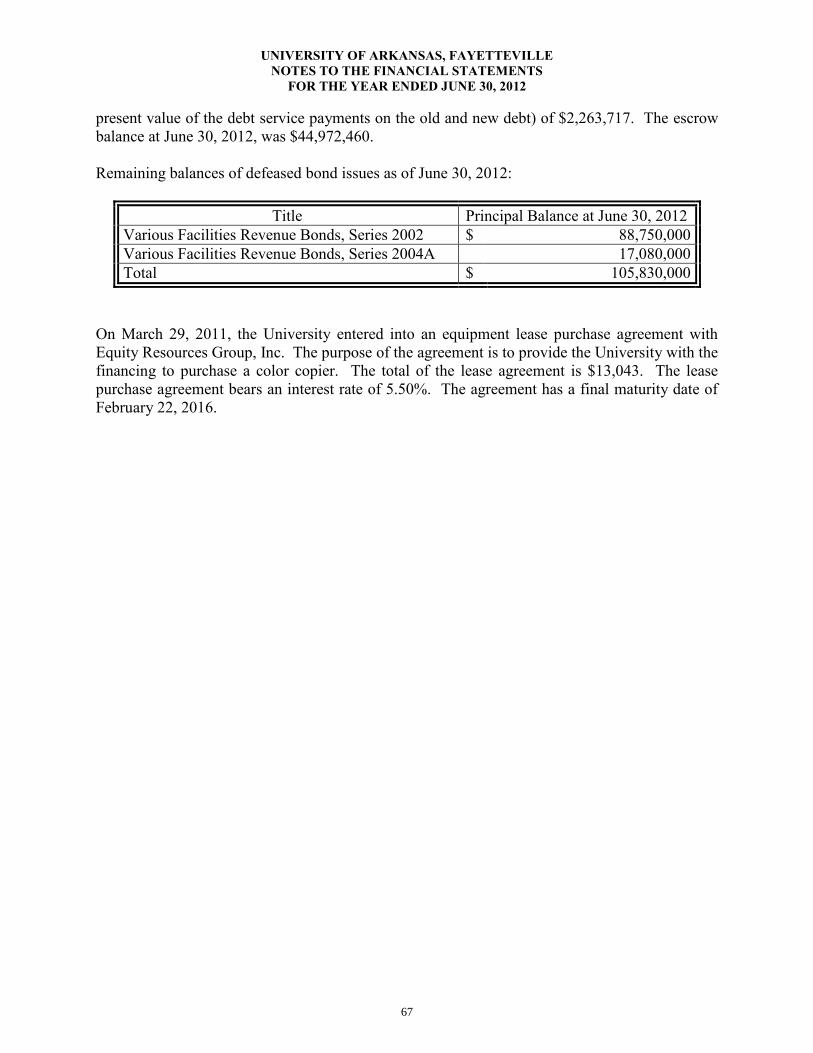
UNIVERSITY OF ARKANSAS, FAYETTEVILLE NOTES TO THE FINANCIAL STATEMENTS
FOR THE YEAR ENDED JUNE 30, 2012
present value of the debt service payments on the old and new debt) of $2,263,717. The escrow balance at June 30, 2012, was $44,972,460. Remaining balances of defeased bond issues as of June 30, 2012:
Title Principal Balance at June 30, 2012 Various Facilities Revenue Bonds, Series 2002 $ 88,750,000 Various Facilities Revenue Bonds, Series 2004A 17,080,000 Total $ 105,830,000
On March 29, 2011, the University entered into an equipment lease purchase agreement with Equity Resources Group, Inc. The purpose of the agreement is to provide the University with the financing to purchase a color copier. The total of the lease agreement is $13,043. The lease purchase agreement bears an interest rate of 5.50%. The agreement has a final maturity date of February 22, 2016.
67
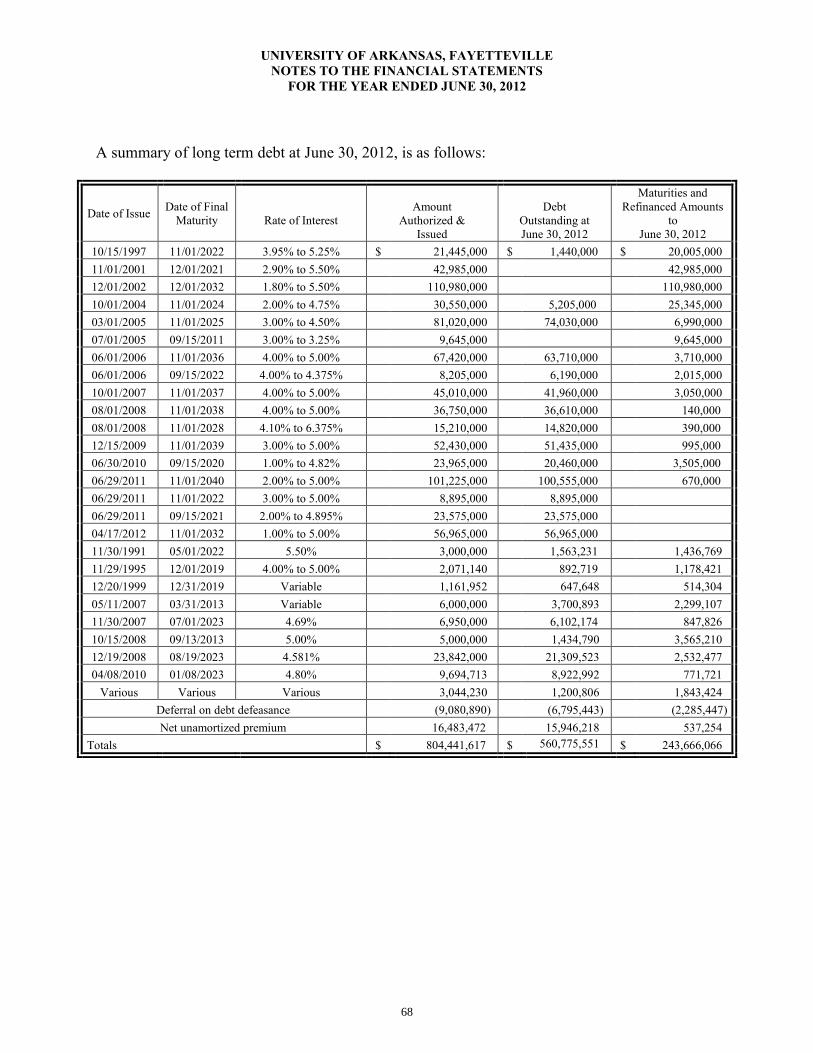
UNIVERSITY OF ARKANSAS, FAYETTEVILLE NOTES TO THE FINANCIAL STATEMENTS
FOR THE YEAR ENDED JUNE 30, 2012
A summary of long term debt at June 30, 2012, is as follows:
Date of Issue
Date of Final
Maturity
Rate of Interest
Amount
Authorized & Issued
Debt
Outstanding at June 30, 2012
Maturities and Refinanced Amounts
to June 30, 2012
10/15/1997 11/01/2022 3.95% to 5.25% $ 21,445,000 $ 1,440,000 $ 20,005,000 11/01/2001 12/01/2021 2.90% to 5.50% 42,985,000 42,985,000 12/01/2002 12/01/2032 1.80% to 5.50% 110,980,000 110,980,000 10/01/2004 11/01/2024 2.00% to 4.75% 30,550,000 5,205,000 25,345,000 03/01/2005 11/01/2025 3.00% to 4.50% 81,020,000 74,030,000 6,990,000 07/01/2005 09/15/2011 3.00% to 3.25% 9,645,000 9,645,000 06/01/2006 11/01/2036 4.00% to 5.00% 67,420,000 63,710,000 3,710,000 06/01/2006 09/15/2022 4.00% to 4.375% 8,205,000 6,190,000 2,015,000 10/01/2007 11/01/2037 4.00% to 5.00% 45,010,000 41,960,000 3,050,000 08/01/2008 11/01/2038 4.00% to 5.00% 36,750,000 36,610,000 140,000 08/01/2008 11/01/2028 4.10% to 6.375% 15,210,000 14,820,000 390,000 12/15/2009 11/01/2039 3.00% to 5.00% 52,430,000 51,435,000 995,000 06/30/2010 09/15/2020 1.00% to 4.82% 23,965,000 20,460,000 3,505,000 06/29/2011 11/01/2040 2.00% to 5.00% 101,225,000 100,555,000 670,000 06/29/2011 11/01/2022 3.00% to 5.00% 8,895,000 8,895,000 06/29/2011 09/15/2021 2.00% to 4.895% 23,575,000 23,575,000 04/17/2012 11/01/2032 1.00% to 5.00% 56,965,000 56,965,000 11/30/1991 05/01/2022 5.50% 3,000,000 1,563,231 1,436,769 11/29/1995 12/01/2019 4.00% to 5.00% 2,071,140 892,719 1,178,421 12/20/1999 12/31/2019 Variable 1,161,952 647,648 514,304 05/11/2007 03/31/2013 Variable 6,000,000 3,700,893 2,299,107 11/30/2007 07/01/2023 4.69% 6,950,000 6,102,174 847,826 10/15/2008 09/13/2013 5.00% 5,000,000 1,434,790 3,565,210 12/19/2008 08/19/2023 4.581% 23,842,000 21,309,523 2,532,477 04/08/2010 01/08/2023 4.80% 9,694,713 8,922,992 771,721
Various Various Various 3,044,230 1,200,806 1,843,424 Deferral on debt defeasance (9,080,890) (6,795,443) (2,285,447) Net unamortized premium 16,483,472 15,946,218 537,254
Totals $ 804,441,617 $ 560,775,551 $ 243,666,066
68
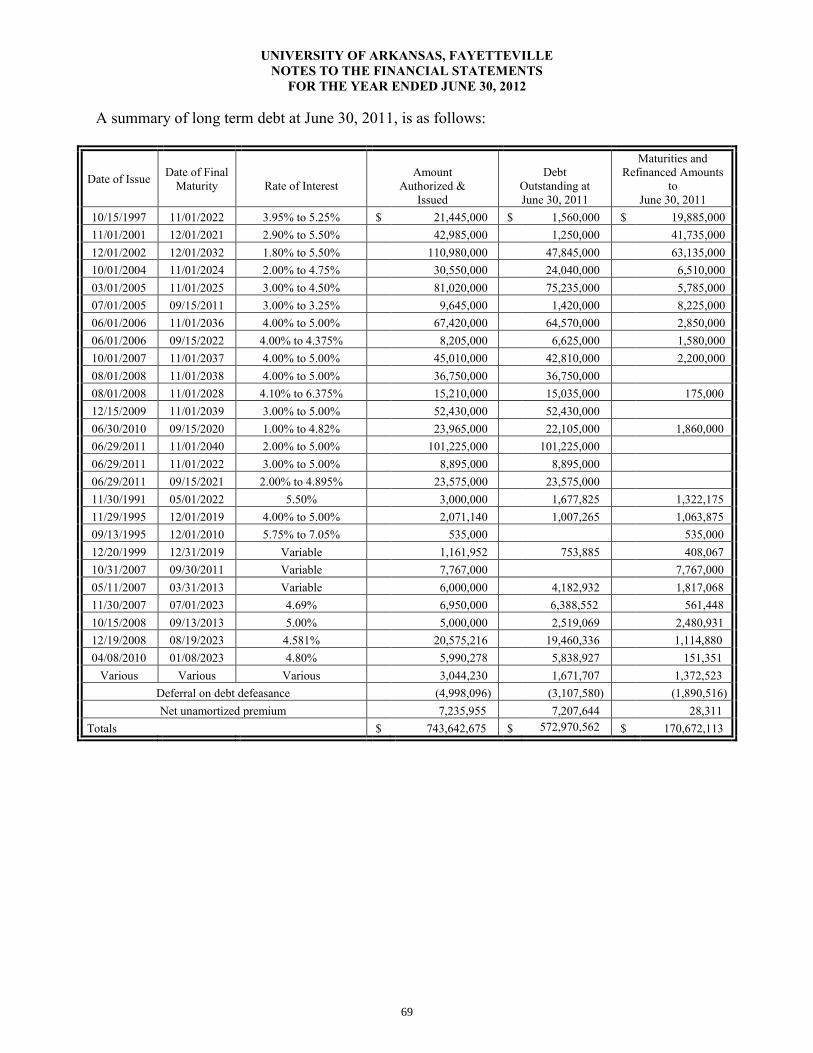
UNIVERSITY OF ARKANSAS, FAYETTEVILLE NOTES TO THE FINANCIAL STATEMENTS
FOR THE YEAR ENDED JUNE 30, 2012
A summary of long term debt at June 30, 2011, is as follows:
Date of Issue
Date of Final
Maturity
Rate of Interest
Amount
Authorized & Issued
Debt
Outstanding at June 30, 2011
Maturities and Refinanced Amounts
to June 30, 2011
10/15/1997 11/01/2022 3.95% to 5.25% $ 21,445,000 $ 1,560,000 $ 19,885,000 11/01/2001 12/01/2021 2.90% to 5.50% 42,985,000 1,250,000 41,735,000 12/01/2002 12/01/2032 1.80% to 5.50% 110,980,000 47,845,000 63,135,000 10/01/2004 11/01/2024 2.00% to 4.75% 30,550,000 24,040,000 6,510,000 03/01/2005 11/01/2025 3.00% to 4.50% 81,020,000 75,235,000 5,785,000 07/01/2005 09/15/2011 3.00% to 3.25% 9,645,000 1,420,000 8,225,000 06/01/2006 11/01/2036 4.00% to 5.00% 67,420,000 64,570,000 2,850,000 06/01/2006 09/15/2022 4.00% to 4.375% 8,205,000 6,625,000 1,580,000 10/01/2007 11/01/2037 4.00% to 5.00% 45,010,000 42,810,000 2,200,000 08/01/2008 11/01/2038 4.00% to 5.00% 36,750,000 36,750,000 08/01/2008 11/01/2028 4.10% to 6.375% 15,210,000 15,035,000 175,000 12/15/2009 11/01/2039 3.00% to 5.00% 52,430,000 52,430,000 06/30/2010 09/15/2020 1.00% to 4.82% 23,965,000 22,105,000 1,860,000 06/29/2011 11/01/2040 2.00% to 5.00% 101,225,000 101,225,000 06/29/2011 11/01/2022 3.00% to 5.00% 8,895,000 8,895,000 06/29/2011 09/15/2021 2.00% to 4.895% 23,575,000 23,575,000 11/30/1991 05/01/2022 5.50% 3,000,000 1,677,825 1,322,175 11/29/1995 12/01/2019 4.00% to 5.00% 2,071,140 1,007,265 1,063,875 09/13/1995 12/01/2010 5.75% to 7.05% 535,000 535,000 12/20/1999 12/31/2019 Variable 1,161,952 753,885 408,067 10/31/2007 09/30/2011 Variable 7,767,000 7,767,000 05/11/2007 03/31/2013 Variable 6,000,000 4,182,932 1,817,068 11/30/2007 07/01/2023 4.69% 6,950,000 6,388,552 561,448 10/15/2008 09/13/2013 5.00% 5,000,000 2,519,069 2,480,931 12/19/2008 08/19/2023 4.581% 20,575,216 19,460,336 1,114,880 04/08/2010 01/08/2023 4.80% 5,990,278 5,838,927 151,351
Various Various Various 3,044,230 1,671,707 1,372,523 Deferral on debt defeasance (4,998,096) (3,107,580) (1,890,516) Net unamortized premium 7,235,955 7,207,644 28,311
Totals $ 743,642,675 $ 572,970,562 $ 170,672,113
69

UNIVERSITY OF ARKANSAS, FAYETTEVILLE NOTES TO THE FINANCIAL STATEMENTS
FOR THE YEAR ENDED JUNE 30, 2012
Equipment Leases The University has acquired certain equipment under various lease-purchase contracts. The cost of equipment held under capital leases totaled $2,885,674 at June 30, 2012.
Asset Balance Type of Equipment June 30, 2012 Electronic Message Board $ 2,337,685 Mainframe 397,091 Color Digital Copier 14,419 Farm Equipment 136,479 Total $ 2,885,674 Total Minimum Lease Payments $ 1,326,895 Less: Amount Representing Interest 126,089 Total Present Value of Net Minimum Lease Payments $ 1,200,806
Changes in long-term liabilities for the year ended June 30, 2012, are as follows:
Fiscal Year Ended June 30, 2012
Beginning Balance
Additions Reductions Ending Balance
Current Portion
Bonds $ 525,370,000 $ 56,965,000 $ 76,485,000 $ 505,850,000 $ 17,895,000 Deferral on debt defeasance (3,107,580) (4,082,794) (394,931) (6,795,443) (595,130) Net unamortized premium 7,207,645 9,247,517 508,944 15,946,218 865,339 Notes 10,140,976 1,901,695 8,239,281 2,082,072 Leases 1,671,707 470,901 1,200,806 473,109 Installment contracts 31,687,814 6,971,219 2,324,344 36,334,689 2,434,157 Compensated absences 17,947,364 615,607 184,065 18,378,906 1,130,467 Liability for retiree insurance benefits 9,312,914 1,226,690 10,539,604 Totals $ 600,230,840 $ 70,943,239 $ 81,480,018 $ 589,694,061 $ 24,285,014
Note: Amounts shown in “Ending Balance” include both current and long-term portions.
70

UNIVERSITY OF ARKANSAS, FAYETTEVILLE NOTES TO THE FINANCIAL STATEMENTS
FOR THE YEAR ENDED JUNE 30, 2012
Changes in long-term liabilities for the year ended June 30, 2011, are as follows:
Fiscal Year Ended June 30, 2011
Beginning Balance
Additions Reductions Ending Balance
Current Portion
Bonds $ 414,460,000 $ 133,695,000 $ 22,785,000 $ 525,370,000 $ 14,850,000 Deferral on debt defeasance (3,566,447) (158,610) (617,477) (3,107,580) (341,143) Net unamortized premium (222,141) 7,447,208 17,422 7,207,645 415,155 Notes 13,692,130 3,551,154 10,140,976 1,920,186 Leases 2,107,040 13,043 448,376 1,671,707 470,900 Installment contracts 19,400,111 13,827,482 1,539,779 31,687,814 2,324,344 Compensated absences 17,397,623 620,798 71,057 17,947,364 1,049,944 Liability for retiree insurance benefits 8,225,317 1,087,597 9,312,914 Totals $ 471,493,633 $ 156,532,518 $ 27,795,311 $ 600,230,840 $ 20,689,386
Note: Amounts shown in “Ending Balance” include both current and long-term portions. Total long-term principal and interest payments are as follows:
Principal Interest* Total 2013 $ 22,884,338 $ 23,853,406 $ 46,737,744 2014 23,306,288 23,597,566 46,903,854 2015 24,037,155 22,761,149 46,798,304 2016 24,680,307 21,850,975 46,531,282 2017 26,379,602 20,846,742 47,226,344 2018-2022 137,583,606 87,204,308 224,787,914 2023-2027 87,313,480 59,588,798 146,902,278 2028-2032 81,955,000 39,933,433 121,888,433 2033-2037 83,930,000 19,916,150 103,846,150 2038-2042 39,555,000 3,314,141 42,869,141 Totals $ 551,624,776 $ 322,866,668 $ 874,491,444 Less Deferral on Debt Defeasance (6,795,443) Plus Net unamortized premiums 15,946,218 Totals $ 560,775,551 *Interest payments made on two notes payable are calculated using floating interest rates. The interest on the notes will be calculated using a floating rate equal to the amount earned on non-endowed investments known as the short-term intermediate pool each quarter from the fiscal years ended June 30, 2012, until maturity. The estimated future interest for these notes was calculated using the rate of 2.2%.
71

UNIVERSITY OF ARKANSAS, FAYETTEVILLE NOTES TO THE FINANCIAL STATEMENTS
FOR THE YEAR ENDED JUNE 30, 2012
Pledged Revenues For purposes of extinguishing the University’s long-term debt issues, certain revenues have been pledged as security. The following is a summary of the gross revenues collected during the fiscal year ended June 30, 2012, and June 30, 2011, that are pledged:
BOND SERIES REVENUE SOURCE 2012 20111
Series 1997 Various Facilities Student Tuition and Fees $ 188,696,913 $ 159,341,171 Series 2001 Various Facilities Sales and Services 13,074,148 12,101,079 Series 2002 Various Facilities Residential Life 33,047,957 31,097,352 Series 2004 Various Facilities Arkansas Union2 757,904 Series 2005 Various Facilities Bookstore3 18,487,696 16,705,062 Series 2006 Various Facilities Student Health Services 569,714 874,019 Series 2007 Various Facilities Transit and Parking 6,591,747 7,333,833 Series 2008 Various Facilities Other Auxiliaries 3,985,648 3,150,792 Series 2009 Various Facilities Series 2011 Various Facilities Series 2012 Various Facilities Total Various Fac. Pledge $ 264,453,823 $ 231,361,212 Series 2005 Athletic Refunding Men’s Athletic Revenue $ 61,439,528 $ 60,972,368 Series 2006 Athletic Facilities (less game guarantees) (3,368,027) (2,429,200) Series 2010 Athletic Refunding Series 2011 Athletic Facilities Total Athletics Pledge $ 58,071,501 $ 58,543,168 1Pledged revenue amounts for the year ended June 30, 2011 do not reflect the changes to revenue as a result of the prior year restatement discussed at Note 20. 2For the year ending June 30, 2012, the Arkansas Union was reclassified from Auxiliary Enterprises to Educational and General. Its applicable revenues are now included in Sales and Services. 3For the purposes of calculating pledged revenues, Bookstore revenues shown include internally generated revenues from sales to the University campus of $5,103,498 for the year ending June 30, 2012 and $5,242,584 for the year ending June 30, 2011.
72
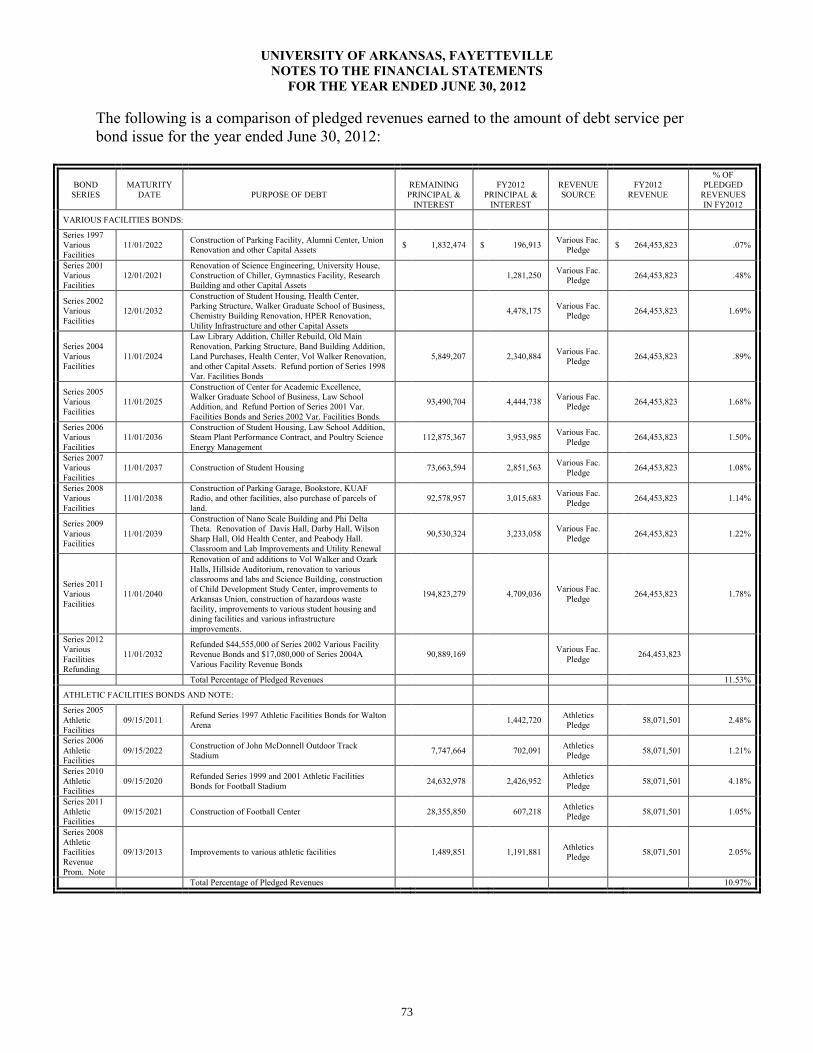
UNIVERSITY OF ARKANSAS, FAYETTEVILLE NOTES TO THE FINANCIAL STATEMENTS
FOR THE YEAR ENDED JUNE 30, 2012
The following is a comparison of pledged revenues earned to the amount of debt service per bond issue for the year ended June 30, 2012:
BOND
SERIES
MATURITY
DATE
PURPOSE OF DEBT
REMAINING PRINCIPAL &
INTEREST
FY2012
PRINCIPAL & INTEREST
REVENUE SOURCE
FY2012
REVENUE
% OF PLEDGED
REVENUES IN FY2012
VARIOUS FACILITIES BONDS:
Series 1997 Various Facilities
11/01/2022 Construction of Parking Facility, Alumni Center, Union Renovation and other Capital Assets $ 1,832,474 $ 196,913 Various Fac.
Pledge $ 264,453,823 .07%
Series 2001 Various Facilities
12/01/2021 Renovation of Science Engineering, University House, Construction of Chiller, Gymnastics Facility, Research Building and other Capital Assets
1,281,250 Various Fac. Pledge 264,453,823 .48%
Series 2002 Various Facilities
12/01/2032
Construction of Student Housing, Health Center, Parking Structure, Walker Graduate School of Business, Chemistry Building Renovation, HPER Renovation, Utility Infrastructure and other Capital Assets
4,478,175 Various Fac. Pledge 264,453,823 1.69%
Series 2004 Various Facilities
11/01/2024
Law Library Addition, Chiller Rebuild, Old Main Renovation, Parking Structure, Band Building Addition, Land Purchases, Health Center, Vol Walker Renovation, and other Capital Assets. Refund portion of Series 1998 Var. Facilities Bonds
5,849,207 2,340,884 Various Fac. Pledge 264,453,823 .89%
Series 2005 Various Facilities
11/01/2025
Construction of Center for Academic Excellence, Walker Graduate School of Business, Law School Addition, and Refund Portion of Series 2001 Var. Facilities Bonds and Series 2002 Var. Facilities Bonds.
93,490,704 4,444,738 Various Fac. Pledge 264,453,823 1.68%
Series 2006 Various Facilities
11/01/2036 Construction of Student Housing, Law School Addition, Steam Plant Performance Contract, and Poultry Science Energy Management
112,875,367 3,953,985 Various Fac. Pledge 264,453,823 1.50%
Series 2007 Various Facilities
11/01/2037 Construction of Student Housing 73,663,594 2,851,563 Various Fac. Pledge 264,453,823 1.08%
Series 2008 Various Facilities
11/01/2038 Construction of Parking Garage, Bookstore, KUAF Radio, and other facilities, also purchase of parcels of land.
92,578,957 3,015,683 Various Fac. Pledge 264,453,823 1.14%
Series 2009 Various Facilities
11/01/2039
Construction of Nano Scale Building and Phi Delta Theta. Renovation of Davis Hall, Darby Hall, Wilson Sharp Hall, Old Health Center, and Peabody Hall. Classroom and Lab Improvements and Utility Renewal
90,530,324 3,233,058 Various Fac. Pledge 264,453,823 1.22%
Series 2011 Various Facilities
11/01/2040
Renovation of and additions to Vol Walker and Ozark Halls, Hillside Auditorium, renovation to various classrooms and labs and Science Building, construction of Child Development Study Center, improvements to Arkansas Union, construction of hazardous waste facility, improvements to various student housing and dining facilities and various infrastructure improvements.
194,823,279 4,709,036 Various Fac. Pledge 264,453,823 1.78%
Series 2012 Various Facilities Refunding
11/01/2032 Refunded $44,555,000 of Series 2002 Various Facility Revenue Bonds and $17,080,000 of Series 2004A Various Facility Revenue Bonds
90,889,169 Various Fac. Pledge 264,453,823
Total Percentage of Pledged Revenues 11.53%
ATHLETIC FACILITIES BONDS AND NOTE:
Series 2005 Athletic Facilities
09/15/2011 Refund Series 1997 Athletic Facilities Bonds for Walton Arena 1,442,720 Athletics
Pledge 58,071,501 2.48%
Series 2006 Athletic Facilities
09/15/2022 Construction of John McDonnell Outdoor Track Stadium 7,747,664 702,091 Athletics
Pledge 58,071,501 1.21%
Series 2010 Athletic Facilities
09/15/2020 Refunded Series 1999 and 2001 Athletic Facilities Bonds for Football Stadium 24,632,978 2,426,952 Athletics
Pledge 58,071,501 4.18%
Series 2011 Athletic Facilities
09/15/2021 Construction of Football Center 28,355,850 607,218 Athletics Pledge 58,071,501 1.05%
Series 2008 Athletic Facilities Revenue Prom. Note
09/13/2013 Improvements to various athletic facilities 1,489,851 1,191,881 Athletics Pledge 58,071,501 2.05%
Total Percentage of Pledged Revenues 10.97%
73

UNIVERSITY OF ARKANSAS, FAYETTEVILLE NOTES TO THE FINANCIAL STATEMENTS
FOR THE YEAR ENDED JUNE 30, 2012
The following is a comparison of pledged revenues earned to the amount of debt service per bond issue for the year ended June 30, 2011:
BOND
SERIES
MATURITY
DATE
PURPOSE OF DEBT
REMAINING PRINCIPAL &
INTEREST
FY2011
PRINCIPAL & INTEREST
REVENUE SOURCE
FY2011
REVENUE
% OF PLEDGED
REVENUES IN FY2011
VARIOUS FACILITIES BONDS:
Series 1997 Various Facilities
11/01/2022 Construction of Parking Facility, Alumni Center, Union Renovation and other Capital Assets $ 2,029,386 $ 391,734 Various
Fac. Pledge $ 231,361,212 .17%
Series 2001 Various Facilities
12/01/2021 Renovation of Science Engineering, University House, Construction of Chiller, Gymnastics Facility, Research Building and other Capital Assets
1,281,250 1,543,088 Various Fac. Pledge 231,361,212 .67%
Series 2002 Various Facilities
12/01/2032
Construction of Student Housing, Health Center, Parking Structure, Walker Graduate School of Business, Chemistry Building Renovation, HPER Renovation, Utility Infrastructure and other Capital Assets
81,803,275 5,456,475 Various Fac. Pledge 231,361,212 2.36%
Series 2004 Various Facilities
11/01/2024
Law Library Addition, Chiller Rebuild, Old Main Renovation, Parking Structure, Band Building Addition, Land Purchases, Health Center, Vol Walker Renovation, and other Capital Assets. Refund portion of Series 1998 Var. Facilities Bonds
31,085,936 2,706,211 Various Fac. Pledge 231,361,212 1.17%
Series 2005 Various Facilities
11/01/2025
Construction of Center for Academic Excellence, Walker Graduate School of Business, Law School Addition, and Refund Portion of Series 2001 Var. Facilities Bonds and Series 2002 Var. Facilities Bonds.
97,935,441 4,454,428 Various Fac. Pledge 231,361,212 1.93%
Series 2006 Various Facilities
11/01/2036 Construction of Student Housing, Law School Addition, Steam Plant Performance Contract, and Poultry Science Energy Management
116,829,352 3,881,285 Various Fac. Pledge 231,361,212 1.68%
Series 2007 Various Facilities
11/01/2037 Construction of Student Housing 76,515,156 2,854,963 Various Fac. Pledge 231,361,212 1.23%
Series 2008 Various Facilities
11/01/2038 Construction of Parking Garage, Bookstore, KUAF Radio, and other facilities, also purchase of parcels of land.
95,594,639 2,846,800 Various Fac. Pledge 231,361,212 1.23%
Series 2009 Various Facilities
11/01/2039
Construction of Nano Scale Building and Phi Delta Theta. Renovation of Davis Hall, Darby Hall, Wilson Sharp Hall, Old Health Center, and Peabody Hall. Classroom and Lab Improvements and Utility Renewal
93,763,381 2,252,983 Various Fac. Pledge 231,361,212 .97%
Series 2011 Various Facilities
11/01/2040
Renovation of and additions to Vol Walker and Ozark Halls, Hillside Auditorium, renovation to various classrooms and labs and Science Building, construction of Child Development Study Center, improvements to Arkansas Union, construction of hazardous waste facility, improvements to various student housing and dining facilities and various infrastructure improvements.
199,532,315 Various Fac. Pledge 231,361,212
Total Percentage of Pledged Revenues 11.41%
ATHLETIC FACILITIES BONDS AND NOTE:
Series 2005 Athletic Facilities
09/15/2011 Refund Series 1997 Athletic Facilities Bonds for Walton Arena 1,442,720 1,817,488 Athletics
Pledge 58,543,168 3.10%
Series 2006 Athletic Facilities
09/15/2022 Construction of John McDonnell Outdoor Track Stadium 8,449,755 704,191 Athletics
Pledge 58,543,168 1.20%
Series 2010 Athletic Facilities
09/15/2020 Refunded Series 1999 and 2001 Athletic Facilities Bonds for Football Stadium 27,059,830 2,426,380 Athletics
Pledge 58,543,168 4.14%
Series 2011 Athletic Facilities
09/15/2021 Construction of Football Center 28,963,068 Athletics Pledge 58,543,168
Series 2008 Athletic Facilities Revenue Prom. Note
09/13/2013 Improvements to various athletic facilities 2,681,732 1,191,881 Athletics Pledge 58,543,168 2.04%
Total Percentage of Pledged Revenues 10.48%
74

UNIVERSITY OF ARKANSAS, FAYETTEVILLE NOTES TO THE FINANCIAL STATEMENTS
FOR THE YEAR ENDED JUNE 30, 2012
(10). Commitments The University was contractually obligated for the following at June 30, 2012: Construction and Architect Contracts
Project Name Completion Date
Beginning Contract Balance Plus Amendments
Amount Paid
Year-End Contract Balance
ARKU Interior Fit-Out and Renovations Substantially Complete $ 4,596,217 $ 4,388,499 $ 207,718 ARE-ON Fiber Optic July, 2013 13,781,750 9,167,990 4,613,760 ARTP Hazmat Building Substantially Complete 385,396 225,076 160,320 Child Development Research Center August, 2012 6,824,999 5,281,733 1,543,266 Chiller Replacement August, 2012 1,981,523 1,775,627 205,896 Football Center June, 2013 36,955,366 13,440,523 23,514,843 Founders Hall December, 2013 4,051,017 1,113,897 2,937,120 Hillside Auditorium October, 2012 12,949,785 5,969,465 6,980,320 Hotz Hall Renovation August, 2013 1,202,246 876,992 325,254 Housing Administration Building October, 2013 337,884 32,996 304,888 Nano Science & Technology Center Substantially Complete 1,066,571 839,395 227,176 Ozark Hall Renovation and Addition July, 2013 22,394,544 7,351,514 15,043,030 Peabody Hall Renovation Substantially Complete 3,925,500 3,853,071 72,429 Phi Gamma Delta Fraternity House Substantially Complete 2,452,497 2,434,538 17,959 Pi Beta Phi Gate & Campus Walk Ext. September, 2012 3,123,890 1,981,251 1,142,639 Pomfret Honors Quarters December, 2012 7,483,190 2,717,015 4,766,175 Science D Building Lab Upgrades December, 2014 2,059,109 1,517,252 541,857 Uptown Campus August, 2012 776,228 651,359 124,869 Vol Walker Hall Renovation August, 2013 31,228,716 12,401,456 18,827,260 Walton Hall South-Wilson Sharp Substantially Complete 2,847,745 2,829,130 18,615 WCOB Atrium Renovation August, 2012 989,511 184,213 805,298 Yocum Hall Renovation December, 2012 4,392,876 588,834 3,804,042 Other Various 7,259,343 5,136,681 2,122,662 Totals $ 173,065,903 $ 84,758,507 $ 88,307,396
The beginning year contract balance/amendments column represents the balance remaining on contracts at the beginning of the fiscal year plus new contracts for the current fiscal year and any amendments made to existing contracts in the current fiscal year. The year-end contract balances listed above do not reflect the effects of accrued expenses as of June 30, 2012. Operating Leases The University has entered into various operating leases for buildings and equipment. It is expected that in the normal course of business such leases will continue to be required. The total expenditures for all rental lease payments and non-lease rental payments for the fiscal year ended June 30, 2012, were $7,850,017. Minimum future annual rental payments for leases having an
75

UNIVERSITY OF ARKANSAS, FAYETTEVILLE NOTES TO THE FINANCIAL STATEMENTS
FOR THE YEAR ENDED JUNE 30, 2012
initial term in excess of one year totaled $3,914,821. Below are the scheduled payments for the five succeeding fiscal years and thereafter.
Year ended June 30 Amount 2013 $ 1,938,650 2014 1,153,741 2015 269,297 2016 214,400 2017 112,533 2018-2022 156,000 2023-2027 70,200 Total $ 3,914,821
(11). Employee Benefits Retirement Benefits The University offers employees the option of participating in either the Optional Retirement Program (ORP) which includes Teachers Insurance Annuity Association—College Retirement Equities Fund (TIAA-CREF) and Fidelity Investments or the Arkansas Public Employees Retirement System (APERS). Effective July 1, 2011, new employees of the University are no longer eligible to participate in the Arkansas Teacher Retirement System (ATRS). Existing ATRS participants are allowed to continue ATRS participation. APERS and ATRS are both defined benefit plans. The ORP is a defined contribution plan. The plan is a 403(b) program as defined by the Internal Revenue Service Code of 1986, as amended, and is administered by the President of the University or his delegate. Employees who reach their tax-deferred 403(b) maximums can then participate in a 457(b) plan. Contributions to Fidelity Investments shall be applied either to individual annuities issued under a Metropolitan Life Guaranteed Account and/or one or more mutual fund custodian accounts managed by Fidelity Investments. Contributions to TIAA-CREF can be allocated among their various annuity accounts. Arkansas law authorizes participation in the plan. Participants in the University’s plan can choose to be contributory or non-contributory. The University automatically contributes 5% of an employee’s regular salary to TIAA-CREF and/or Fidelity Investments retirement account, allocated between the two companies according to the employee’s choice. For any contributions an employee makes in excess of 5% regular salary, the University makes an equal contribution, up to a maximum University contribution of 10% of regular salary. Employee contributions in excess of 10% are allowed by the plans in accordance with Internal Revenue Service regulations but the University does not match these additional contributions. All benefits attributable to plan contributions made by both the University and the participant are immediately vested in the participant for all faculty members and non-classified employees and all classified employees whose initial employment occurred prior to January 1, 1985, and who made any plan contributions prior to that date. For all other classified employees, vesting of benefits attributable to plan contributions made by the University shall occur on the
76
UNIVERSITY OF ARKANSAS, FAYETTEVILLE NOTES TO THE FINANCIAL STATEMENTS
FOR THE YEAR ENDED JUNE 30, 2012
earlier of completion of three years of service, or attainment of age 65, or the participant’s having made plan contributions of at least five percent of regular salary for six consecutive months. The University’s and participants’ TIAA-CREF contributions for the year ending June 30, 2012, were $14,973,403 and $15,168,522, respectively. The University’s and participants’ Fidelity Investments contributions for the year ending June 30, 2012, were $5,721,349 and $5,900,388, respectively. The University’s and participants’ TIAA-CREF contributions for the year ending June 30, 2011, were $14,542,439 and $14,618,161, respectively. The University’s and participants’ Fidelity Investments contributions for the year ending June 30, 2011, were $5,365,415 and $5,371,783, respectively. APERS is a cost-sharing multiple employer defined benefit plan administered by the State of Arkansas. The University contributes 13.47% of applicable wages to the plan. Under certain conditions covered employees may voluntarily contribute 5% of his/her salary. The University’s and participants’ contributions for the year ending June 30, 2012, were $420,627 and $83,389, respectively. The University’s and participants’ contribution for the year ending June 30, 2011, were $306,730 and $49,017, respectively. The University’s and participants’ contribution for the year ending June 30, 2010, were $230,019 and $29,208, respectively. ATRS is a cost-sharing multiple employer defined benefit pension plan. The University contributes 14% of all covered employees’ salaries. Under certain conditions covered employees may voluntarily contribute 6% of his/her salary. The University’s and participants’ contributions for the year ending June 30, 2012, were $303,552 and $82,177, respectively. The University’s and participants’ contributions for the year ending June 30, 2011, were $283,388 and $85,694, respectively. The University’s and participants’ contributions for the year ending June 30, 2010, were $244,426 and $68,323, respectively. The University’s and participants’ contributions to all other pension plans for the year ended June 30, 2012, were $429,643 and $322,556, respectively. The University’s and participants’ contributions to all other pension plans for the year ended June 30, 2011, were $458,678 and $349,169, respectively. Self-Insurance Plans The University of Arkansas System sponsors self-funded health and dental benefit plans for University employees and their eligible dependents. The Fayetteville, Medical Sciences, Little Rock, Pine Bluff, Monticello, and Batesville campuses, state-wide operating units of the Arkansas Archeological Survey and Division of Agriculture, System Administration, Criminal Justice Institute, the Clinton School of Public Service, the Arkansas School for Mathematics, Sciences and the Arts, and the University of Arkansas Foundation, Inc., participate in the health insurance program which is administered by the System Administration. Operations of the plans are recorded in the separate University of Arkansas consolidated financial report. For the year ending June 30, 2012, a total of 4,903 active employees, former employees, and retirees were participants in the health plan. For the year ending June 30, 2011, the total of active employees, former employees, and retirees participating in the health plan was 4,827. The University pays 73.519% for the Point of Service Plan and 81.178% for the Classic Plan for Fayetteville, the Criminal Justice Institute and the Arkansas Archeological Survey. The
77
UNIVERSITY OF ARKANSAS, FAYETTEVILLE NOTES TO THE FINANCIAL STATEMENTS
FOR THE YEAR ENDED JUNE 30, 2012
University pays 74.295% for the Point of Service Plan and 79.905% for the Classic Plan for the Division of Agriculture. The University pays 70% of the health plan for federal employees. Life Insurance Plan The University of Arkansas System’s life insurance carrier is Unum Life Insurance Company of America. The University’s life insurance is a fully-insured arrangement with the premiums being sent directly to the life insurance carrier. Expenditures for all employee benefits are included as expenditures within the appropriate functional area.
12): Other Postemployment Benefits Other Postemployment Benefits (OPEB) The University offers postemployment health (including prescription drugs) and dental benefits along with life insurance ($10,000 available coverage) to eligible retirees. Health and dental benefits are provided in the University’s self-funded plan sponsored by the Board of Trustees of the University of Arkansas System for current and retired employees of the Fayetteville (UAF), Little Rock (UALR), Medical Sciences (UAMS), Monticello (UAM), Pine Bluff (UAPB), Phillips (PCCUA) and Batesville (UACCB) campuses, the Cooperative Extension Service of the Division of Agriculture (CES), the Arkansas School for Mathematics, Sciences and the Arts (ASMSA), and the University of Arkansas System Administration (SYSTEM). The plan is considered a single-employer, defined benefit plan. The System Administration manages and administers the plan. Although benefits are also provided under the University’s plan for the University of Arkansas Foundation, Inc. and the University of Arkansas Winthrop Rockefeller Institute, no postemployment benefit is accrued by the University for these private entities. Financial activities of the plan are reported in the University of Arkansas consolidated financial report.
In June 2004, GASB issued Statement No. 45, Accounting and Financial Reporting by Employers for Postemployment Benefits Other Than Pensions, which became effective for the fiscal year ending June 30, 2008. This statement requires governmental entities to recognize and match other postretirement benefit costs with related services received and also to provide information regarding the actuarially calculated liability and funding level of the benefits associated with past services. The calculation reflects expected future medical costs. It includes an accrual for all active employees valuing the benefits they are anticipated to receive in retirement based on the likelihood that they will stay employed until eligible for postretirement benefits. As a result of the implementation of this statement, the University accrued $10,539,604 in retiree healthcare liability as of June 30, 2012. For those campuses in the University’s self-funded plan, retirees qualify for postretirement benefits as follows: Participation: Employees who retire with a combination of age and years of service of at
least 70 with at least 10 years of coverage under the plan are eligible to participate. Retirees may cover spouses and eligible dependent children. Surviving spouses can continue
78

UNIVERSITY OF ARKANSAS, FAYETTEVILLE NOTES TO THE FINANCIAL STATEMENTS
FOR THE YEAR ENDED JUNE 30, 2012
coverage after retiree’s death. Retirees can continue coverage past Medicare eligibility age (age 65 or disabled) with the University plan paying secondary to Medicare.
Benefit Provided: Retirees participate in the plan at the same premium rate as an active employee.
Required Contribution Ratio: Retirees pay 100% of premium. Employer costs are funded on a pay-as-you-go basis.
Summary of Key Actuarial Methods and Assumptions
Actuarial Assumptions University Self-Funded Plan Valuation date July 1, 2011 Valuation year Census data was collected as of January 1, 2010
Liabilities were rolled forward to the July 1, 2011 valuation date.
Actuarial cost method Projected unit credit Amortization method 30 years open, level % of payroll Asset valuation method N/A Discount rate 4.50% Projected payroll growth rate 4.00% Medical inflation rate Immediate rate of 9.5%, with a 0.5% decrease each year
to an ultimate rate of 5% General Overview of the Valuation Methodology The process of determining the liability for retiree medical benefits is based on many assumptions about future events. Future increases in health care costs are affected by many factors, including: medical inflation; change in utilization patterns; technological advances; cost shifting; cost leveraging; and changes to government medical programs, such as Medicare. Actuarial valuations involve estimates of the value of reported amounts and assumptions about the probability of events far into the future, and actuarially determined amounts are subject to continual revision as actual results are compared to past expectations and new estimates are made about the future. Actuarial calculations reflect a long-term perspective. Actuarial methods and assumptions used include techniques that are designed to reduce short-term volatility in actuarial accrued liabilities and the actuarial value of assets. Calculations are based on the types of benefits provided under the terms of each plan at the time of each valuation and on the pattern of sharing of costs between the employer and plan members to that point. Changes in Actuarial Assumptions and Methods The mortality rates were changed from the RP-2000 Combined Healthy Mortality Table projected to 2011 by scale AA to the RP-2000 Fully Generational Combined Healthy Mortality Table projected by scale AA to better reflect anticipated future mortality improvements. The immediate medical inflation rate was changed from 9.0% to 9.5% to better anticipate future experience.
79
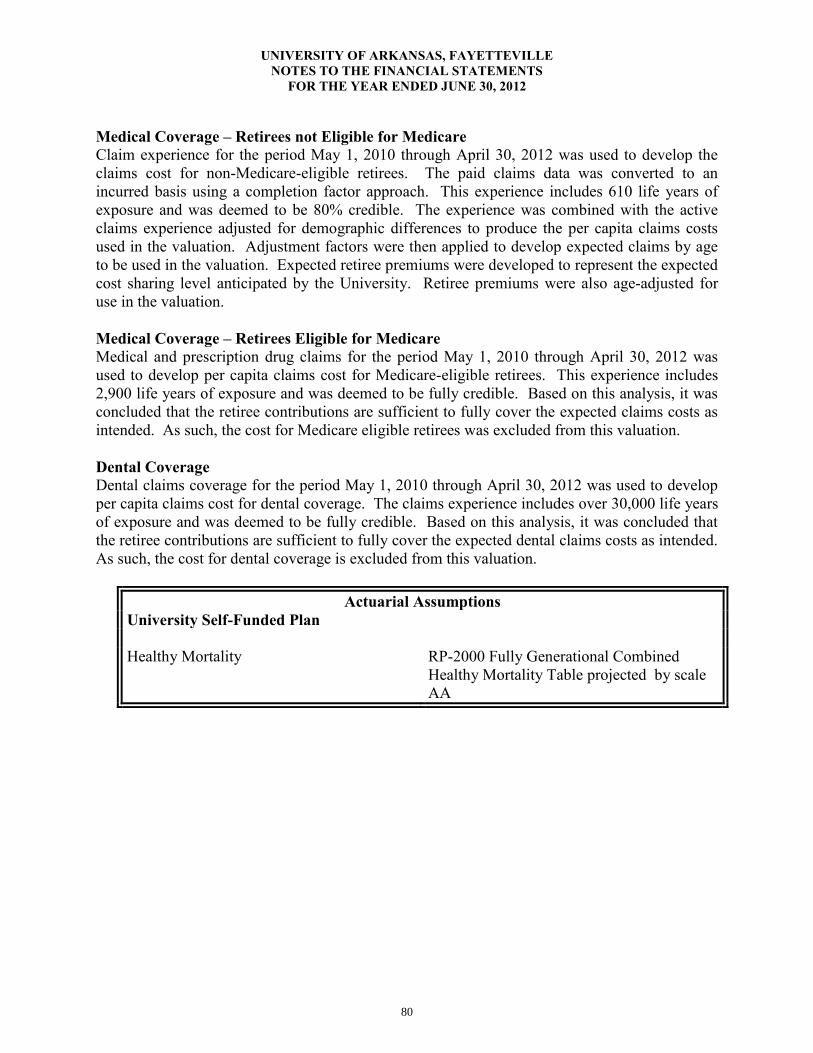
UNIVERSITY OF ARKANSAS, FAYETTEVILLE NOTES TO THE FINANCIAL STATEMENTS
FOR THE YEAR ENDED JUNE 30, 2012
Medical Coverage – Retirees not Eligible for Medicare Claim experience for the period May 1, 2010 through April 30, 2012 was used to develop the claims cost for non-Medicare-eligible retirees. The paid claims data was converted to an incurred basis using a completion factor approach. This experience includes 610 life years of exposure and was deemed to be 80% credible. The experience was combined with the active claims experience adjusted for demographic differences to produce the per capita claims costs used in the valuation. Adjustment factors were then applied to develop expected claims by age to be used in the valuation. Expected retiree premiums were developed to represent the expected cost sharing level anticipated by the University. Retiree premiums were also age-adjusted for use in the valuation. Medical Coverage – Retirees Eligible for Medicare Medical and prescription drug claims for the period May 1, 2010 through April 30, 2012 was used to develop per capita claims cost for Medicare-eligible retirees. This experience includes 2,900 life years of exposure and was deemed to be fully credible. Based on this analysis, it was concluded that the retiree contributions are sufficient to fully cover the expected claims costs as intended. As such, the cost for Medicare eligible retirees was excluded from this valuation. Dental Coverage Dental claims coverage for the period May 1, 2010 through April 30, 2012 was used to develop per capita claims cost for dental coverage. The claims experience includes over 30,000 life years of exposure and was deemed to be fully credible. Based on this analysis, it was concluded that the retiree contributions are sufficient to fully cover the expected dental claims costs as intended. As such, the cost for dental coverage is excluded from this valuation.
Actuarial Assumptions
University Self-Funded Plan Healthy Mortality RP-2000 Fully Generational Combined
Healthy Mortality Table projected by scale AA
80
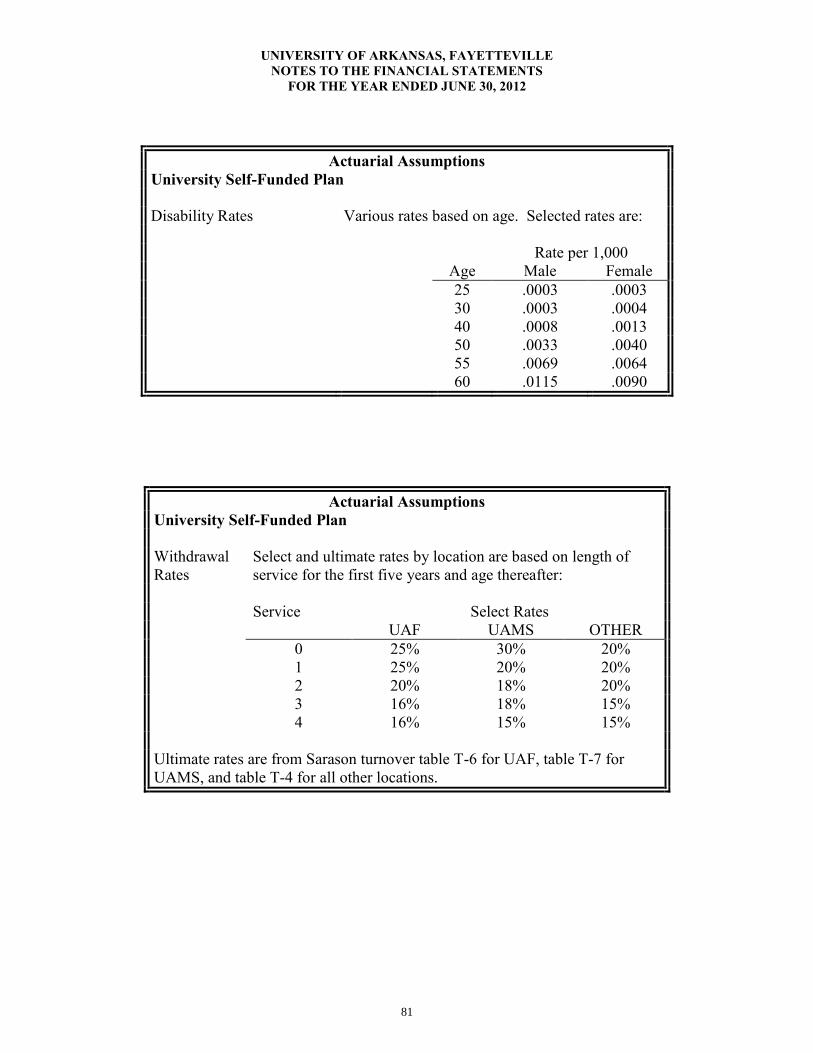
UNIVERSITY OF ARKANSAS, FAYETTEVILLE NOTES TO THE FINANCIAL STATEMENTS
FOR THE YEAR ENDED JUNE 30, 2012
Actuarial Assumptions University Self-Funded Plan Disability Rates Various rates based on age. Selected rates are: Rate per 1,000 Age Male Female 25 .0003 .0003 30 .0003 .0004 40 .0008 .0013 50 .0033 .0040 55 .0069 .0064 60 .0115 .0090
Actuarial Assumptions
University Self-Funded Plan Withdrawal Rates
Select and ultimate rates by location are based on length of service for the first five years and age thereafter:
Service Select Rates UAF UAMS OTHER 0 25% 30% 20% 1 25% 20% 20% 2 20% 18% 20% 3 16% 18% 15% 4 16% 15% 15% Ultimate rates are from Sarason turnover table T-6 for UAF, table T-7 for UAMS, and table T-4 for all other locations.
81

UNIVERSITY OF ARKANSAS, FAYETTEVILLE NOTES TO THE FINANCIAL STATEMENTS
FOR THE YEAR ENDED JUNE 30, 2012
Actuarial Assumptions
University Self-Funded Plan Retirement Rates Age Rate 50-59 5% 60-61 10% 62 15% 63-66 10% 67-69 50% 70+ 100%
Actuarial Assumptions University Self-Funded Plan Future Retiree Coverage For medical insurance, retiring employees are assumed to elect
medical and Rx coverage as follows: UAF UALR UAMS OTHER Pre-Medicare 55% 55% 55% 55% Medicare Eligible 60% 60% 50% 45% 75% of retiring employees are assumed to continue life
insurance at retirement.
Actuarial Assumptions University Self-Funded Plan Future Dependent Coverage 50% of employees electing medical and Rx coverage at
retirement are assumed to be married and elect spouse coverage. Males are assumed to be 4 years older than females.
82

UNIVERSITY OF ARKANSAS, FAYETTEVILLE NOTES TO THE FINANCIAL STATEMENTS
FOR THE YEAR ENDED JUNE 30, 2012
Determination of End of Year Accrual
Unfunded actuarial accrued liability at 7/1/11 $ 22,239,601 Annual Required Contribution (ARC) Normal cost $ 1,079,510 Amortization of the unfunded actuarial accrued liability over 30 years 794,025 Interest 84,308 Annual Required Contribution for FY12 1,957,843 Interest on Net OPEB Obligation 418,690 ARC Amortization Adjustment (347,139) Annual OPEB Cost for FY12 $ 2,029,394 Net OPEB Obligation, 7/1/11 $ 9,312,914 Annual OPEB Cost for FY12 2,029,394 Less: Expected Employer Contributions (802,704) Net OPEB Obligation, 6/30/12 $ 10,539,604
Schedule of Employer Contributions
Fiscal Year Ending
Annual OPEB Cost
Expected Contribution
Percentage Contributed
Net Obligation at Year End
6/30/10 $ 2,094,214 $ 926,635 44.25% $ 8,225,317 6/30/11 $ 1,913,022 $ 825,425 43.15% $ 9,312,914 6/30/12 $ 2,029,394 $ 802,704 39.55% $ 10,539,604
Since there is no funding, the expected contributions are any retiree premiums actually paid by the University plus expected implicit subsidy payments. The implicit rate subsidy is the difference between the true cost of medical benefits and the cost sharing premiums paid by the retiree.
Schedule of Funding Progress
Fiscal Year
Ending
Actuarial Value of Assets
Actuarial Accrued Liability (AAL)
Unfunded AAL (UAAL)
Funded Ratio
Covered Payroll
UAAL as Percentage Of Covered
Payroll 6/30/12 $ 0 $ 22,239,601 $ 22,239,601 0% $ 247,779,672 8.98%
83
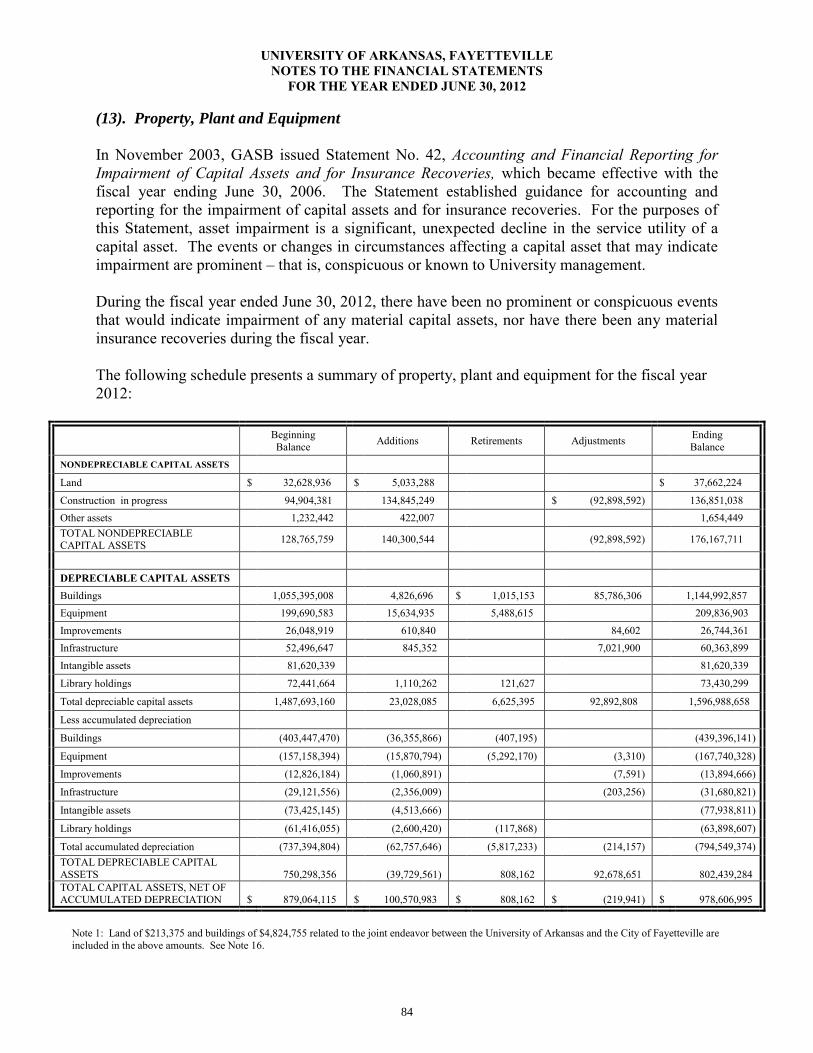
UNIVERSITY OF ARKANSAS, FAYETTEVILLE NOTES TO THE FINANCIAL STATEMENTS
FOR THE YEAR ENDED JUNE 30, 2012
(13). Property, Plant and Equipment
In November 2003, GASB issued Statement No. 42, Accounting and Financial Reporting for Impairment of Capital Assets and for Insurance Recoveries, which became effective with the fiscal year ending June 30, 2006. The Statement established guidance for accounting and reporting for the impairment of capital assets and for insurance recoveries. For the purposes of this Statement, asset impairment is a significant, unexpected decline in the service utility of a capital asset. The events or changes in circumstances affecting a capital asset that may indicate impairment are prominent – that is, conspicuous or known to University management. During the fiscal year ended June 30, 2012, there have been no prominent or conspicuous events that would indicate impairment of any material capital assets, nor have there been any material insurance recoveries during the fiscal year. The following schedule presents a summary of property, plant and equipment for the fiscal year 2012:
Beginning Balance Additions Retirements Adjustments Ending
Balance NONDEPRECIABLE CAPITAL ASSETS
Land $ 32,628,936 $ 5,033,288 $ 37,662,224
Construction in progress 94,904,381 134,845,249 $ (92,898,592) 136,851,038 Other assets 1,232,442 422,007 1,654,449 TOTAL NONDEPRECIABLE CAPITAL ASSETS 128,765,759 140,300,544 (92,898,592) 176,167,711
DEPRECIABLE CAPITAL ASSETS Buildings 1,055,395,008 4,826,696 $ 1,015,153 85,786,306 1,144,992,857 Equipment 199,690,583 15,634,935 5,488,615 209,836,903 Improvements 26,048,919 610,840 84,602 26,744,361 Infrastructure 52,496,647 845,352 7,021,900 60,363,899 Intangible assets 81,620,339 81,620,339
Library holdings 72,441,664 1,110,262 121,627 73,430,299
Total depreciable capital assets 1,487,693,160 23,028,085 6,625,395 92,892,808 1,596,988,658
Less accumulated depreciation
Buildings (403,447,470) (36,355,866) (407,195) (439,396,141)
Equipment (157,158,394) (15,870,794) (5,292,170) (3,310) (167,740,328)
Improvements (12,826,184) (1,060,891) (7,591) (13,894,666)
Infrastructure (29,121,556) (2,356,009) (203,256) (31,680,821)
Intangible assets (73,425,145) (4,513,666) (77,938,811)
Library holdings (61,416,055) (2,600,420) (117,868) (63,898,607)
Total accumulated depreciation (737,394,804) (62,757,646) (5,817,233) (214,157) (794,549,374) TOTAL DEPRECIABLE CAPITAL ASSETS 750,298,356 (39,729,561) 808,162 92,678,651 802,439,284 TOTAL CAPITAL ASSETS, NET OF ACCUMULATED DEPRECIATION $ 879,064,115 $ 100,570,983 $ 808,162 $ (219,941) $ 978,606,995
Note 1: Land of $213,375 and buildings of $4,824,755 related to the joint endeavor between the University of Arkansas and the City of Fayetteville are included in the above amounts. See Note 16.
84
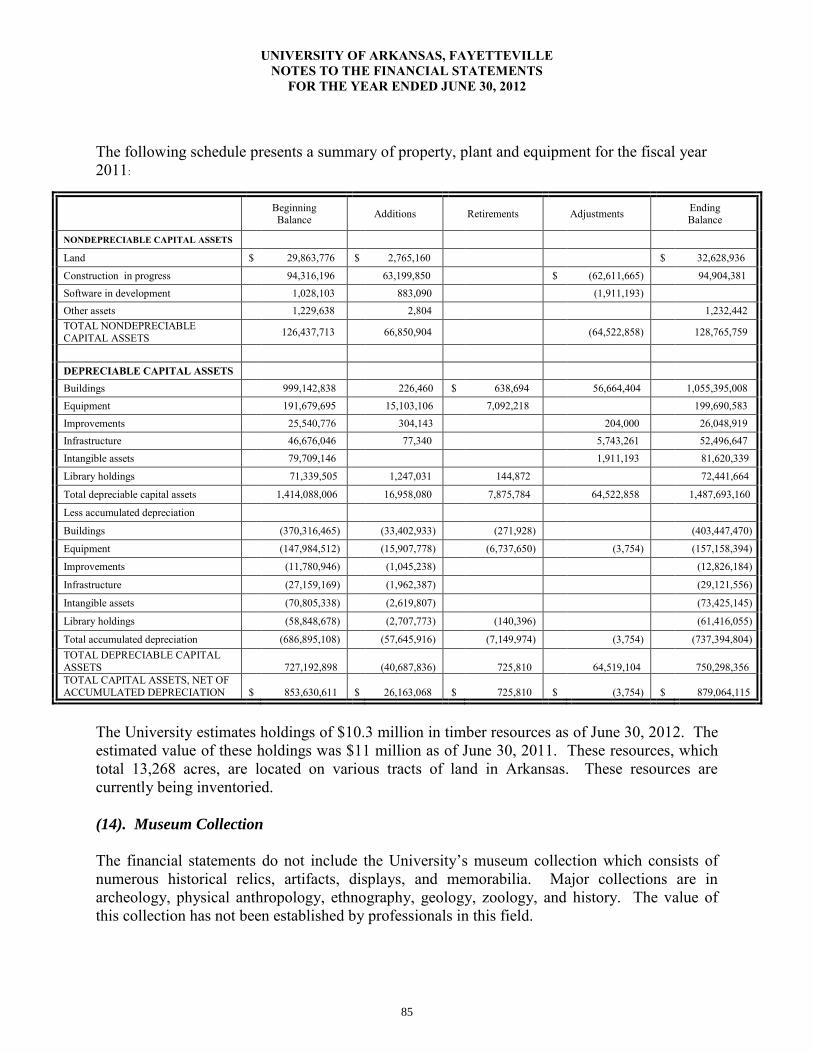
UNIVERSITY OF ARKANSAS, FAYETTEVILLE NOTES TO THE FINANCIAL STATEMENTS
FOR THE YEAR ENDED JUNE 30, 2012
The following schedule presents a summary of property, plant and equipment for the fiscal year 2011:
Beginning Balance Additions Retirements Adjustments Ending
Balance
NONDEPRECIABLE CAPITAL ASSETS
Land $ 29,863,776 $ 2,765,160 $ 32,628,936
Construction in progress 94,316,196 63,199,850 $ (62,611,665) 94,904,381 Software in development 1,028,103 883,090 (1,911,193) Other assets 1,229,638 2,804 1,232,442 TOTAL NONDEPRECIABLE CAPITAL ASSETS 126,437,713 66,850,904 (64,522,858) 128,765,759
DEPRECIABLE CAPITAL ASSETS Buildings 999,142,838 226,460 $ 638,694 56,664,404 1,055,395,008 Equipment 191,679,695 15,103,106 7,092,218 199,690,583 Improvements 25,540,776 304,143 204,000 26,048,919 Infrastructure 46,676,046 77,340 5,743,261 52,496,647 Intangible assets 79,709,146 1,911,193 81,620,339
Library holdings 71,339,505 1,247,031 144,872 72,441,664
Total depreciable capital assets 1,414,088,006 16,958,080 7,875,784 64,522,858 1,487,693,160
Less accumulated depreciation
Buildings (370,316,465) (33,402,933) (271,928) (403,447,470)
Equipment (147,984,512) (15,907,778) (6,737,650) (3,754) (157,158,394)
Improvements (11,780,946) (1,045,238) (12,826,184)
Infrastructure (27,159,169) (1,962,387) (29,121,556)
Intangible assets (70,805,338) (2,619,807) (73,425,145)
Library holdings (58,848,678) (2,707,773) (140,396) (61,416,055)
Total accumulated depreciation (686,895,108) (57,645,916) (7,149,974) (3,754) (737,394,804) TOTAL DEPRECIABLE CAPITAL ASSETS 727,192,898 (40,687,836) 725,810 64,519,104 750,298,356 TOTAL CAPITAL ASSETS, NET OF ACCUMULATED DEPRECIATION $ 853,630,611 $ 26,163,068 $ 725,810 $ (3,754) $ 879,064,115
The University estimates holdings of $10.3 million in timber resources as of June 30, 2012. The estimated value of these holdings was $11 million as of June 30, 2011. These resources, which total 13,268 acres, are located on various tracts of land in Arkansas. These resources are currently being inventoried.
(14). Museum Collection The financial statements do not include the University’s museum collection which consists of numerous historical relics, artifacts, displays, and memorabilia. Major collections are in archeology, physical anthropology, ethnography, geology, zoology, and history. The value of this collection has not been established by professionals in this field.
85
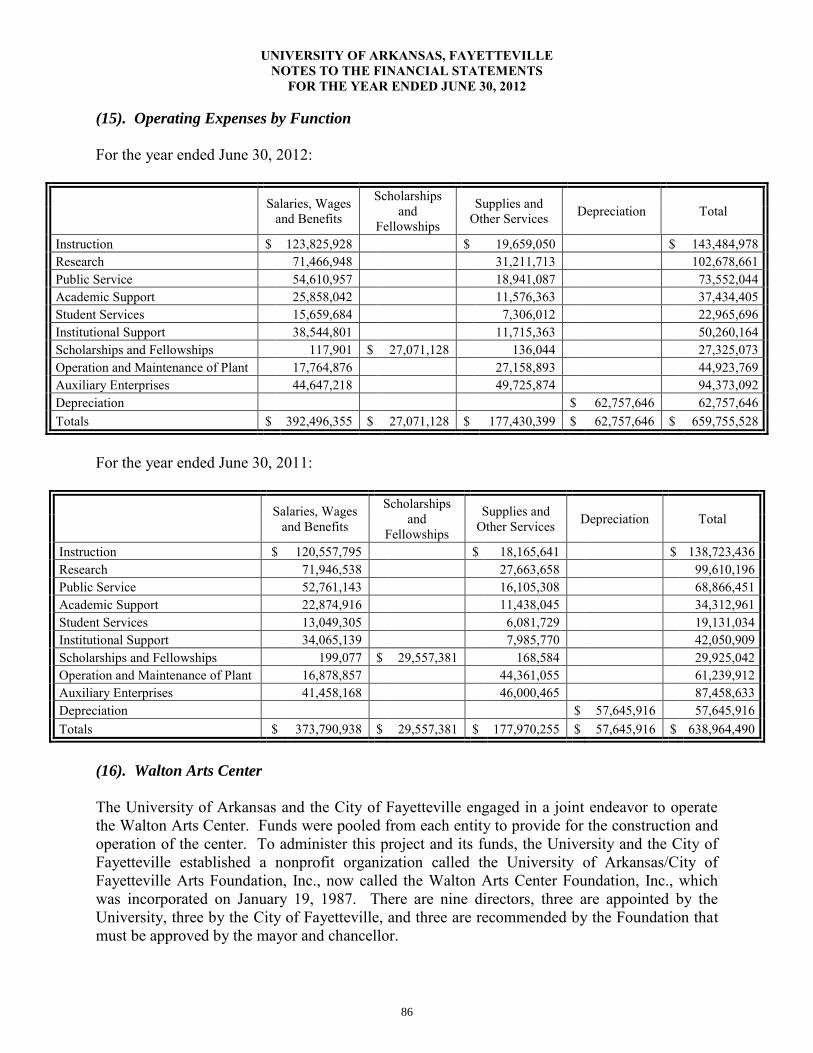
UNIVERSITY OF ARKANSAS, FAYETTEVILLE NOTES TO THE FINANCIAL STATEMENTS
FOR THE YEAR ENDED JUNE 30, 2012
(15). Operating Expenses by Function
For the year ended June 30, 2012:
Salaries, Wages and Benefits
Scholarships and
Fellowships
Supplies and Other Services Depreciation Total
Instruction $ 123,825,928 $ 19,659,050 $ 143,484,978 Research 71,466,948 31,211,713 102,678,661 Public Service 54,610,957 18,941,087 73,552,044 Academic Support 25,858,042 11,576,363 37,434,405 Student Services 15,659,684 7,306,012 22,965,696 Institutional Support 38,544,801 11,715,363 50,260,164 Scholarships and Fellowships 117,901 $ 27,071,128 136,044 27,325,073 Operation and Maintenance of Plant 17,764,876 27,158,893 44,923,769 Auxiliary Enterprises 44,647,218 49,725,874 94,373,092 Depreciation $ 62,757,646 62,757,646 Totals $ 392,496,355 $ 27,071,128 $ 177,430,399 $ 62,757,646 $ 659,755,528
For the year ended June 30, 2011:
Salaries, Wages and Benefits
Scholarships and
Fellowships
Supplies and Other Services Depreciation Total
Instruction $ 120,557,795 $ 18,165,641 $ 138,723,436 Research 71,946,538 27,663,658 99,610,196 Public Service 52,761,143 16,105,308 68,866,451 Academic Support 22,874,916 11,438,045 34,312,961 Student Services 13,049,305 6,081,729 19,131,034 Institutional Support 34,065,139 7,985,770 42,050,909 Scholarships and Fellowships 199,077 $ 29,557,381 168,584 29,925,042 Operation and Maintenance of Plant 16,878,857 44,361,055 61,239,912 Auxiliary Enterprises 41,458,168 46,000,465 87,458,633 Depreciation $ 57,645,916 57,645,916 Totals $ 373,790,938 $ 29,557,381 $ 177,970,255 $ 57,645,916 $ 638,964,490
(16). Walton Arts Center The University of Arkansas and the City of Fayetteville engaged in a joint endeavor to operate the Walton Arts Center. Funds were pooled from each entity to provide for the construction and operation of the center. To administer this project and its funds, the University and the City of Fayetteville established a nonprofit organization called the University of Arkansas/City of Fayetteville Arts Foundation, Inc., now called the Walton Arts Center Foundation, Inc., which was incorporated on January 19, 1987. There are nine directors, three are appointed by the University, three by the City of Fayetteville, and three are recommended by the Foundation that must be approved by the mayor and chancellor.
86
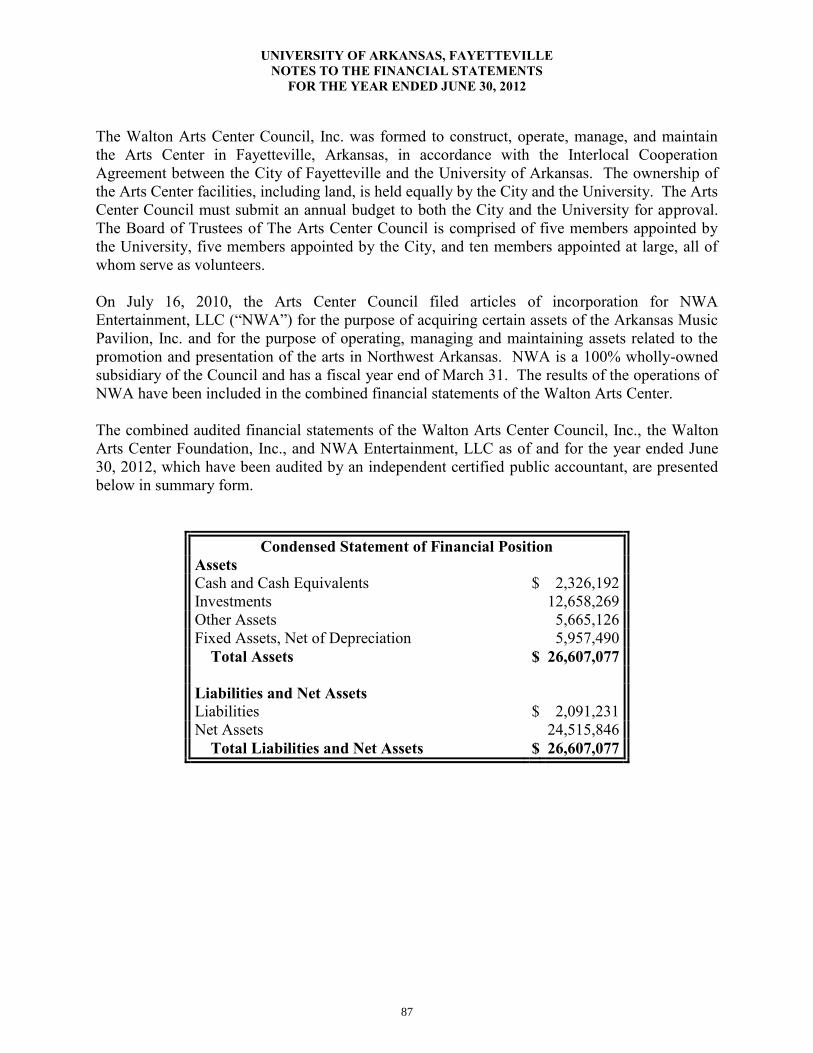
UNIVERSITY OF ARKANSAS, FAYETTEVILLE NOTES TO THE FINANCIAL STATEMENTS
FOR THE YEAR ENDED JUNE 30, 2012
The Walton Arts Center Council, Inc. was formed to construct, operate, manage, and maintain the Arts Center in Fayetteville, Arkansas, in accordance with the Interlocal Cooperation Agreement between the City of Fayetteville and the University of Arkansas. The ownership of the Arts Center facilities, including land, is held equally by the City and the University. The Arts Center Council must submit an annual budget to both the City and the University for approval. The Board of Trustees of The Arts Center Council is comprised of five members appointed by the University, five members appointed by the City, and ten members appointed at large, all of whom serve as volunteers. On July 16, 2010, the Arts Center Council filed articles of incorporation for NWA Entertainment, LLC (“NWA”) for the purpose of acquiring certain assets of the Arkansas Music Pavilion, Inc. and for the purpose of operating, managing and maintaining assets related to the promotion and presentation of the arts in Northwest Arkansas. NWA is a 100% wholly-owned subsidiary of the Council and has a fiscal year end of March 31. The results of the operations of NWA have been included in the combined financial statements of the Walton Arts Center. The combined audited financial statements of the Walton Arts Center Council, Inc., the Walton Arts Center Foundation, Inc., and NWA Entertainment, LLC as of and for the year ended June 30, 2012, which have been audited by an independent certified public accountant, are presented below in summary form.
Condensed Statement of Financial Position Assets Cash and Cash Equivalents $ 2,326,192 Investments 12,658,269 Other Assets 5,665,126 Fixed Assets, Net of Depreciation 5,957,490 Total Assets $ 26,607,077 Liabilities and Net Assets Liabilities $ 2,091,231 Net Assets 24,515,846 Total Liabilities and Net Assets $ 26,607,077
87

UNIVERSITY OF ARKANSAS, FAYETTEVILLE NOTES TO THE FINANCIAL STATEMENTS
FOR THE YEAR ENDED JUNE 30, 2012
Condensed Statement of Activities
Ticket Sales $ 4,973,143 Contributions and Sponsorships 2,241,422 Other Income 7,995,274 Total Income and Other Additions $ 15,209,839 Total Expenditures and Other Deductions $ 11,713,614 Increase/(Decrease) in Net Assets $ 3,496,225
(17). Other Entity University of Arkansas Foundation, Inc. - The Foundation operates as a nonprofit benevolent corporation for charitable educational purposes. The Board of Trustees of the Foundation includes one (1) member who is also a member of the University’s Board of Trustees. The audited financial statements of the Foundation, as of and for the year ended June 30, 2012, which have been audited by an independent certified public accountant, are presented below in summary form. The University of Arkansas, Fayetteville is the beneficiary of 50.7% of the net assets of the Foundation. The remaining 49.3% benefits other University of Arkansas campuses.
Condensed Statement of Financial Position Assets Investments $ 679,169,662 Contributions Receivable, less Allowance 51,874,709 Other Receivables 1,853,869 Fixed Assets, Net of Depreciation 1,106,752 Other Assets 869,703 Total Assets $ 734,874,695 Liabilities and Net Assets Liabilities $ 19,263,746 Net Assets Unrestricted 78,209,537 Restricted 637,401,412 Net Assets 715,610,949 Total Liabilities and Net Assets $ 734,874,695
88
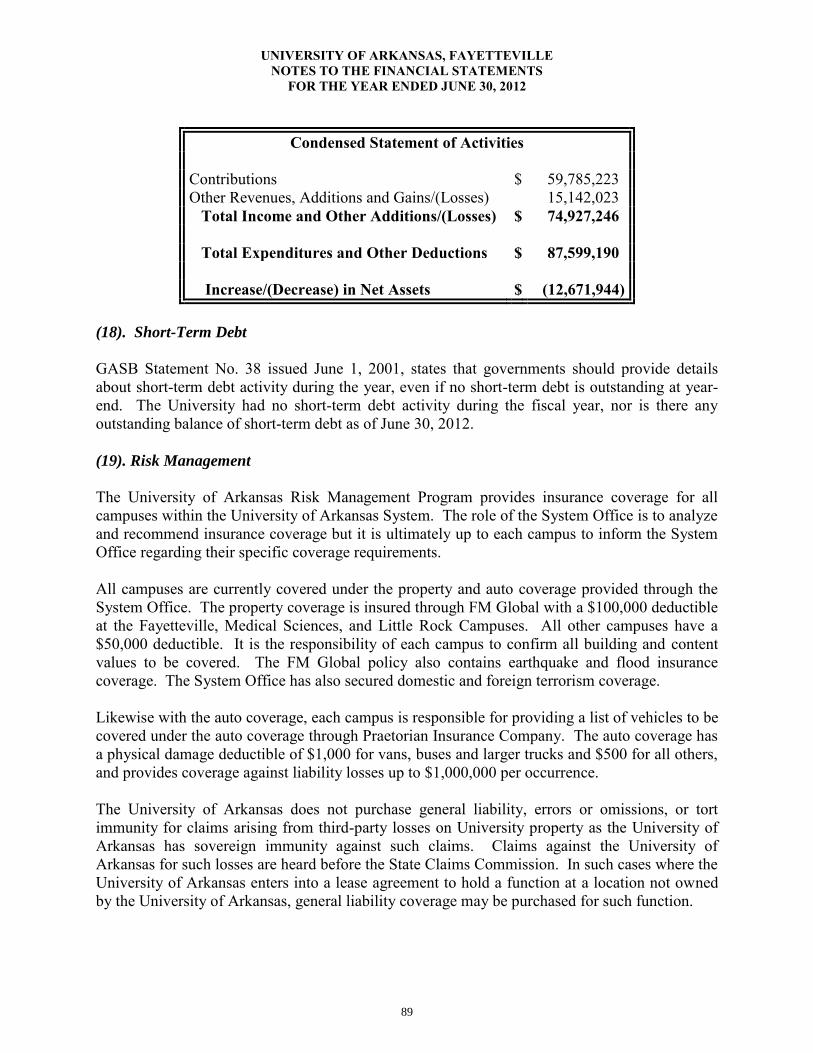
UNIVERSITY OF ARKANSAS, FAYETTEVILLE NOTES TO THE FINANCIAL STATEMENTS
FOR THE YEAR ENDED JUNE 30, 2012
Condensed Statement of Activities
Contributions $ 59,785,223 Other Revenues, Additions and Gains/(Losses) 15,142,023 Total Income and Other Additions/(Losses) $ 74,927,246 Total Expenditures and Other Deductions $ 87,599,190 Increase/(Decrease) in Net Assets $ (12,671,944)
(18). Short-Term Debt GASB Statement No. 38 issued June 1, 2001, states that governments should provide details about short-term debt activity during the year, even if no short-term debt is outstanding at year-end. The University had no short-term debt activity during the fiscal year, nor is there any outstanding balance of short-term debt as of June 30, 2012. (19). Risk Management The University of Arkansas Risk Management Program provides insurance coverage for all campuses within the University of Arkansas System. The role of the System Office is to analyze and recommend insurance coverage but it is ultimately up to each campus to inform the System Office regarding their specific coverage requirements. All campuses are currently covered under the property and auto coverage provided through the System Office. The property coverage is insured through FM Global with a $100,000 deductible at the Fayetteville, Medical Sciences, and Little Rock Campuses. All other campuses have a $50,000 deductible. It is the responsibility of each campus to confirm all building and content values to be covered. The FM Global policy also contains earthquake and flood insurance coverage. The System Office has also secured domestic and foreign terrorism coverage. Likewise with the auto coverage, each campus is responsible for providing a list of vehicles to be covered under the auto coverage through Praetorian Insurance Company. The auto coverage has a physical damage deductible of $1,000 for vans, buses and larger trucks and $500 for all others, and provides coverage against liability losses up to $1,000,000 per occurrence. The University of Arkansas does not purchase general liability, errors or omissions, or tort immunity for claims arising from third-party losses on University property as the University of Arkansas has sovereign immunity against such claims. Claims against the University of Arkansas for such losses are heard before the State Claims Commission. In such cases where the University of Arkansas enters into a lease agreement to hold a function at a location not owned by the University of Arkansas, general liability coverage may be purchased for such function.
89

UNIVERSITY OF ARKANSAS, FAYETTEVILLE NOTES TO THE FINANCIAL STATEMENTS
FOR THE YEAR ENDED JUNE 30, 2012
The University of Arkansas maintains workers' compensation coverage through the State of Arkansas program. Premiums are paid through payroll and are based on a formula calculated by the Department of Finance and Administration which is provided to the campuses around April 1 of each year to be used for the upcoming fiscal year. The types of benefits and expenditures that are paid include the following: medical expenses, hospital expenses, death benefits, disability, and claimant’s attorney fees. Additionally, the University of Arkansas participates in the State of Arkansas Fidelity Bond Program for claims of employee dishonesty. This program has a limit of $250,000 recovery per occurrence with a $2,500 deductible. Premiums are paid annually via a fund transfer from state appropriations to the Department of Finance and Administration. There have been no reductions in insurance coverage from the prior fiscal year. Settled claims resulting from these risks have not exceeded commercial insurance coverage in any of the past three fiscal years. (20). Restatement of Prior Year
The Statement of Revenues, Expenses and Changes in Net Assets has been restated for the year ended June 30, 2011. The University has determined that the revenue and expenses arising from certain internal transactions between Educational and General departments and Auxiliary Enterprises should have been eliminated. Revenues and expenses have each been reduced by a total of $14,648,099. The Statement of Cash Flows has also been restated to reflect this change. This change has no effect on Net Assets.
(21). Pollution Remediation
In November 2006, GASB issued Statement No. 49, Accounting and Financial Reporting for Pollution Remediation Obligations, which became effective with the fiscal year ending June 30, 2009. The Statement establishes standards for the accounting and financial reporting of pollution (including contamination) remediation obligations. On July 21, 2009, the University was awarded a grant in the amount of $1,900,000 from the United States Department of Energy to conduct a study to determine what obligation, if any, the University may have for potential remediation of the Southwest Experimental Fast Oxide Reactor site (SEFOR); including estimated remediation cost and development of a plan for necessary remediation. As of June 30, 2012, the study has been completed and the grant closed. The University remains under no obligation to begin pollution remediation of the site.
(22). Subsequent Events
On September 13, 2012, the University issued $60,540,000 in Various Facility Revenue Bonds, Series 2012B. The purpose of the bonds is to finance all or a portion of certain capital improvements on the Fayetteville campus.
90

UNIVERSITY OF ARKANSAS, FAYETTEVILLE NOTES TO THE FINANCIAL STATEMENTS
FOR THE YEAR ENDED JUNE 30, 2012
(23). Contingencies
The University has been named as defendant in several lawsuits. It is the opinion of management and its legal counsel that the ultimate outcome of litigation will not have a material effect on the future operations or financial position of the University.
91

UNIVERSITY OF ARKANSAS, FAYETTEVILLE
2012 ANNUAL FINANCIAL REPORT
REQUIRED SUPPLEMENTAL INFORMATION
92

UNIVERSITY OF ARKANSAS REQUIRED SUPPLEMENTAL INFORMATION
JUNE 30, 2012
Other Postemployment Benefits
Determination of End of Year Accrual Unfunded actuarial accrued liability at 7/1/11 $ 22,239,601 Annual Required Contribution (ARC) Normal cost $ 1,079,510 Amortization of the unfunded actuarial accrued liability over 30 years 794,025 Interest 84,308 Annual Required Contribution for FY12 1,957,843 Interest on Net OPEB Obligation 418,690 ARC Amortization Adjustment (347,139) Annual OPEB Cost for FY12 $ 2,029,394 Net OPEB Obligation, 7/1/11 $ 9,312,914 Annual OPEB Cost for FY12 2,029,394 Less: Expected Employer Contributions (802,704) Net OPEB Obligation, 6/30/12 $ 10,539,604
Schedule of Employer Contributions
Fiscal Year Ending
Annual OPEB Cost
Expected Contribution
Percentage Contributed
Net Obligation at Year End
6/30/10 $ 2,094,214 $ 926,635 44.25% $ 8,225,317 6/30/11 $ 1,913,022 $ 825,425 43.15% $ 9,312,914 6/30/12 $ 2,029,394 $ 802,704 39.55% $ 10,539,604
Since there is no funding, the expected contributions are any retiree premiums actually paid by the University plus expected implicit subsidy payments. The implicit rate subsidy is the difference between the true cost of medical benefits and the cost sharing premiums paid by the retiree.
93

UNIVERSITY OF ARKANSAS REQUIRED SUPPLEMENTAL INFORMATION
JUNE 30, 2012
An explanation of the differences in the annual required contribution is provided in the section, General Overview of the Valuation Methodology.
Schedule of Funding Progress
Fiscal Year
Ending
Actuarial Value of Assets
Actuarial Accrued Liability (AAL)
Unfunded AAL (UAAL)
Funded Ratio
Covered Payroll
UAAL as Percentage Of Covered
Payroll 6/30/10 $ 0 $ 23,547,619 $ 23,547,619 0% $ 227,163,777 10.37% 6/30/11 $ 0 $ 21,255,846 $ 21,255,846 0% $ 234,043,967 9.08% 6/30/12 $ 0 $ 22,239,601 $ 22,239,601 0% $ 247,779,672 8.98%
General Overview of the Valuation Methodology The process of determining the liability for retiree medical benefits is based on many assumptions about future events. Future increases in health care costs are affected by many factors, including: medical inflation; change in utilization patterns; technological advances; cost shifting; cost leveraging; and changes to government medical programs, such as Medicare.
Actuarial valuations involve estimates of the value of reported amounts and assumptions about the probability of events far into the future, and actuarially determined amounts are subject to continual revision as actual results are compared to past expectations and new estimates are made about the future. Actuarial calculations reflect a long-term perspective. Actuarial methods and assumptions used include techniques that are designed to reduce short-term volatility in actuarial accrued liabilities and the actuarial value of assets. Calculations are based on the types of benefits provided under the terms of each plan at the time of each valuation and on the pattern of sharing of costs between the employer and plan members to that point.
Changes in Actuarial Assumptions and Methods The mortality rates were changed from the RP-2000 Combined Healthy Mortality Table projected to 2011 by scale AA to the RP-2000 Fully Generational Healthy Mortality Table projected by scale AA to better reflect anticipated future mortality improvements. The immediate medical inflation rate was changed from 9.0% to 9.5% to better anticipate future experience.
94

UNIVERSITY OF ARKANSAS REQUIRED SUPPLEMENTAL INFORMATION
JUNE 30, 2012
Medical Coverage – Retirees not Eligible for Medicare Claim experience for the period May 1, 2010 through April 30, 2012 was used to develop the claims cost for non-Medicare-eligible retirees. The paid claims data was converted to an incurred basis using a completion factor approach. This experience includes 610 life years of exposure and was deemed to be 80% credible. The experience was combined with the active claims experience adjusted for demographic differences to produce the per capita claims costs used in the valuation. Adjustment factors were then applied to develop expected claims by age to be used in the valuation. Expected retiree premiums were developed to represent the expected cost sharing level anticipated by the University. Retiree premiums were also age-adjusted for use in the valuation. Medical Coverage – Retirees Eligible for Medicare Medical and prescription drug claims for the period May 1, 2010 through April 30, 2012 was used to develop per capita claims cost for Medicare-eligible retirees. This experience includes 2,900 life years of exposure and was deemed to be fully credible. Based on this analysis, it was concluded that the retiree contributions are sufficient to fully cover the expected claims costs as intended. As such, the cost for Medicare eligible retirees was excluded from this valuation. Dental Coverage Dental claims coverage for the period May 1, 2010 through April 30, 2012 was used to develop per capita claims cost for dental coverage. The claims experience includes over 30,000 life years of exposure and was deemed to be fully credible. Based on this analysis, it was concluded that the retiree contributions are sufficient to fully cover the expected dental claims costs as intended. As such, the cost for dental coverage is excluded from this valuation.
95

96
Printed by University of Arkansas P∙M∙C Solutions
BOARD OF TRUSTEES Mike Akin, Chairman Jane Rogers, Vice-Chairman Monticello, AR Little Rock, AR Term Ends 03/01/13 Term Ends 03/01/16 Jim von Gremp, Secretary Ben Hyneman, Assistant Secretary Rogers, AR Jonesboro, AR Term Ends 03/01/15 Term Ends 03/01/18 Sam Hilburn North Little Rock, AR Term Ends 03/01/14 David Pryor Fayetteville, AR Term Ends 03/01/19 John C. Goodson Texarkana, AR Term Ends 03/01/21
John Tyson
Springdale, AR Term Ends 03/01/17
Mark Waldrip
Moro, AR Term Ends 03/01/20
Stephen Broughton, M.D.
Pine Bluff, AR Term Ends 03/01/22
UNIVERSITY OF ARKANSAS FINANCIAL OFFICERS
Donald O. Pederson Jean E. Schook Vice Chancellor for Associate Vice Chancellor for Finance & Administration Finance & Administration Larrie Stolfi Controller Michael White Associate Controller Eric Robinson Budget Officer Susan Slinkard Investment Manager
Stephen Turner Director of Research Accounting
Jo Ann Pepper
Director of Student Accounts
Peter Campbell Information Technology Director
97