ANNUAL OPERATING PLAN FRYINGPAN-ARKANSAS PROJECT … · ANNUAL OPERATING PLAN FRYINGPAN-ARKANSAS...
77
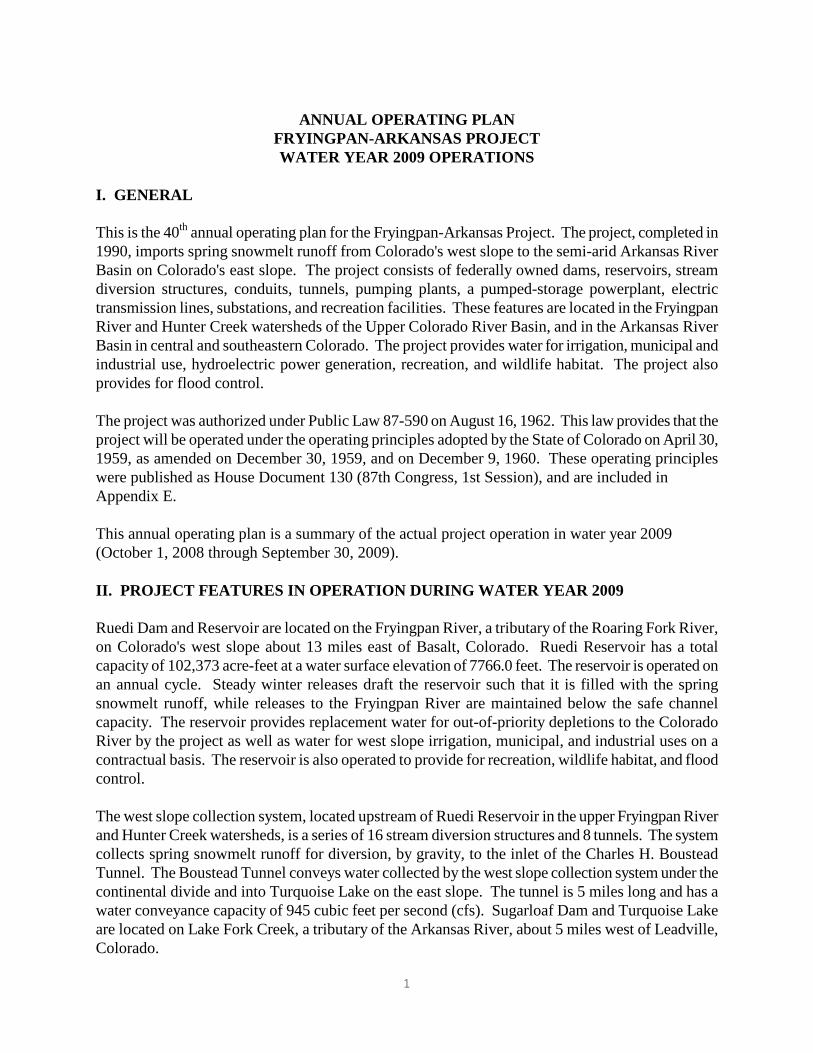
ANNUAL OPERATING PLAN FRYINGPAN-ARKANSAS PROJECT WATER YEAR 2009 OPERATIONS I. GENERAL This is the 40 th annual operating plan for the Fryingpan-Arkansas Project. The project, completed in 1990, imports spring snowmelt runoff from Colorado's west slope to the semi-arid Arkansas River Basin on Colorado's east slope. The project consists of federally owned dams, reservoirs, stream diversion structures, conduits, tunnels, pumping plants, a pumped-storage powerplant, electric transmission lines, substations, and recreation facilities. These features are located in the Fryingpan River and Hunter Creek watersheds of the Upper Colorado River Basin, and in the Arkansas River Basin in central and southeastern Colorado. The project provides water for irrigation, municipal and industrial use, hydroelectric power generation, recreation, and wildlife habitat. The project also provides for flood control. The project was authorized under Public Law 87-590 on August 16, 1962. This law provides that the project will be operated under the operating principles adopted by the State of Colorado on April 30, 1959, as amended on December 30, 1959, and on December 9, 1960. These operating principles were published as House Document 130 (87th Congress, 1st Session), and are included in Appendix E. This annual operating plan is a summary of the actual project operation in water year 2009 (October 1, 2008 through September 30, 2009). II. PROJECT FEATURES IN OPERATION DURING WATER YEAR 2009 Ruedi Dam and Reservoir are located on the Fryingpan River, a tributary of the Roaring Fork River, on Colorado's west slope about 13 miles east of Basalt, Colorado. Ruedi Reservoir has a total capacity of 102,373 acre-feet at a water surface elevation of 7766.0 feet. The reservoir is operated on an annual cycle. Steady winter releases draft the reservoir such that it is filled with the spring snowmelt runoff, while releases to the Fryingpan River are maintained below the safe channel capacity. The reservoir provides replacement water for out-of-priority depletions to the Colorado River by the project as well as water for west slope irrigation, municipal, and industrial uses on a contractual basis. The reservoir is also operated to provide for recreation, wildlife habitat, and flood control. The west slope collection system, located upstream of Ruedi Reservoir in the upper Fryingpan River and Hunter Creek watersheds, is a series of 16 stream diversion structures and 8 tunnels. The system collects spring snowmelt runoff for diversion, by gravity, to the inlet of the Charles H. Boustead Tunnel. The Boustead Tunnel conveys water collected by the west slope collection system under the continental divide and into Turquoise Lake on the east slope. The tunnel is 5 miles long and has a water conveyance capacity of 945 cubic feet per second (cfs). Sugarloaf Dam and Turquoise Lake are located on Lake Fork Creek, a tributary of the Arkansas River, about 5 miles west of Leadville, Colorado. 1
Transcript of ANNUAL OPERATING PLAN FRYINGPAN-ARKANSAS PROJECT … · ANNUAL OPERATING PLAN FRYINGPAN-ARKANSAS...
ANNUAL OPERATING PLANFRYINGPAN-ARKANSAS PROJECTWATER YEAR 2009 OPERATIONS
I. GENERAL
This is the 40th annual operating plan for the Fryingpan-Arkansas Project. The project, completed in1990, imports spring snowmelt runoff from Colorado's west slope to the semi-arid Arkansas RiverBasin on Colorado's east slope. The project consists of federally owned dams, reservoirs, streamdiversion structures, conduits, tunnels, pumping plants, a pumped-storage powerplant, electrictransmission lines, substations, and recreation facilities. These features are located in the FryingpanRiver and Hunter Creek watersheds of the Upper Colorado River Basin, and in the Arkansas RiverBasin in central and southeastern Colorado. The project provides water for irrigation, municipal andindustrial use, hydroelectric power generation, recreation, and wildlife habitat. The project alsoprovides for flood control.
The project was authorized under Public Law 87-590 on August 16, 1962. This law provides that theproject will be operated under the operating principles adopted by the State of Colorado on April 30,1959, as amended on December 30, 1959, and on December 9, 1960. These operating principleswere published as House Document 130 (87th Congress, 1st Session), and are included inAppendix E.
This annual operating plan is a summary of the actual project operation in water year 2009(October 1, 2008 through September 30, 2009).
II. PROJECT FEATURES IN OPERATION DURING WATER YEAR 2009
Ruedi Dam and Reservoir are located on the Fryingpan River, a tributary of the Roaring Fork River,on Colorado's west slope about 13 miles east of Basalt, Colorado. Ruedi Reservoir has a totalcapacity of 102,373 acre-feet at a water surface elevation of 7766.0 feet. The reservoir is operated onan annual cycle. Steady winter releases draft the reservoir such that it is filled with the springsnowmelt runoff, while releases to the Fryingpan River are maintained below the safe channelcapacity. The reservoir provides replacement water for out-of-priority depletions to the ColoradoRiver by the project as well as water for west slope irrigation, municipal, and industrial uses on acontractual basis. The reservoir is also operated to provide for recreation, wildlife habitat, and floodcontrol.
The west slope collection system, located upstream of Ruedi Reservoir in the upper Fryingpan Riverand Hunter Creek watersheds, is a series of 16 stream diversion structures and 8 tunnels. The systemcollects spring snowmelt runoff for diversion, by gravity, to the inlet of the Charles H. BousteadTunnel. The Boustead Tunnel conveys water collected by the west slope collection system under thecontinental divide and into Turquoise Lake on the east slope. The tunnel is 5 miles long and has awater conveyance capacity of 945 cubic feet per second (cfs). Sugarloaf Dam and Turquoise Lakeare located on Lake Fork Creek, a tributary of the Arkansas River, about 5 miles west of Leadville,Colorado.
1
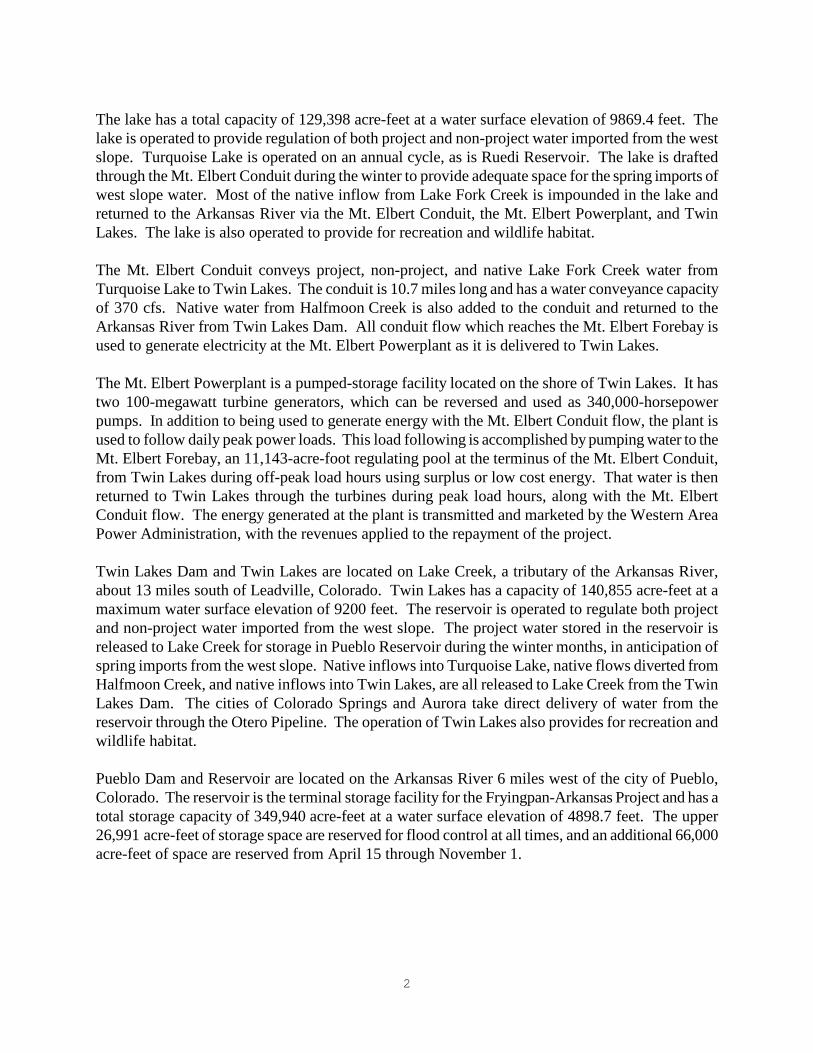
The lake has a total capacity of 129,398 acre-feet at a water surface elevation of 9869.4 feet. Thelake is operated to provide regulation of both project and non-project water imported from the westslope. Turquoise Lake is operated on an annual cycle, as is Ruedi Reservoir. The lake is draftedthrough the Mt. Elbert Conduit during the winter to provide adequate space for the spring imports ofwest slope water. Most of the native inflow from Lake Fork Creek is impounded in the lake andreturned to the Arkansas River via the Mt. Elbert Conduit, the Mt. Elbert Powerplant, and TwinLakes. The lake is also operated to provide for recreation and wildlife habitat.
The Mt. Elbert Conduit conveys project, non-project, and native Lake Fork Creek water fromTurquoise Lake to Twin Lakes. The conduit is 10.7 miles long and has a water conveyance capacityof 370 cfs. Native water from Halfmoon Creek is also added to the conduit and returned to theArkansas River from Twin Lakes Dam. All conduit flow which reaches the Mt. Elbert Forebay isused to generate electricity at the Mt. Elbert Powerplant as it is delivered to Twin Lakes.
The Mt. Elbert Powerplant is a pumped-storage facility located on the shore of Twin Lakes. It hastwo 100-megawatt turbine generators, which can be reversed and used as 340,000-horsepowerpumps. In addition to being used to generate energy with the Mt. Elbert Conduit flow, the plant isused to follow daily peak power loads. This load following is accomplished by pumping water to theMt. Elbert Forebay, an 11,143-acre-foot regulating pool at the terminus of the Mt. Elbert Conduit,from Twin Lakes during off-peak load hours using surplus or low cost energy. That water is thenreturned to Twin Lakes through the turbines during peak load hours, along with the Mt. ElbertConduit flow. The energy generated at the plant is transmitted and marketed by the Western AreaPower Administration, with the revenues applied to the repayment of the project.
Twin Lakes Dam and Twin Lakes are located on Lake Creek, a tributary of the Arkansas River,about 13 miles south of Leadville, Colorado. Twin Lakes has a capacity of 140,855 acre-feet at amaximum water surface elevation of 9200 feet. The reservoir is operated to regulate both projectand non-project water imported from the west slope. The project water stored in the reservoir isreleased to Lake Creek for storage in Pueblo Reservoir during the winter months, in anticipation ofspring imports from the west slope. Native inflows into Turquoise Lake, native flows diverted fromHalfmoon Creek, and native inflows into Twin Lakes, are all released to Lake Creek from the TwinLakes Dam. The cities of Colorado Springs and Aurora take direct delivery of water from thereservoir through the Otero Pipeline. The operation of Twin Lakes also provides for recreation andwildlife habitat.
Pueblo Dam and Reservoir are located on the Arkansas River 6 miles west of the city of Pueblo,Colorado. The reservoir is the terminal storage facility for the Fryingpan-Arkansas Project and has atotal storage capacity of 349,940 acre-feet at a water surface elevation of 4898.7 feet. The upper26,991 acre-feet of storage space are reserved for flood control at all times, and an additional 66,000acre-feet of space are reserved from April 15 through November 1.
2

Non-project water may be stored in the reservoir under temporary contract. Native inflow can bestored when the project storage right is in priority or under the winter water storage program(WWSP). Under the WWSP, irrigators are permitted to store native Arkansas River water in PuebloReservoir during the winter months for an additional supply of irrigation water, on the condition thatthe water is used before May 1 of the next water year. The majority of project water deliveries ismade from the reservoir. The Fountain Valley Authority, the Pueblo West Metropolitan District, andthe Pueblo Board of Water Works take direct delivery of municipal water through the south outletworks and joint-use manifold. A direct irrigation delivery is made to the Bessemer Ditch. Otherproject deliveries are made as releases to the Arkansas River for diversion downstream.Pueblo Reservoir is also operated to provide for recreation and wildlife habitat.
III. HYDROLOGIC CONDITIONS AND WEATHER EVENTS IN WATER YEAR 2009
The weather around the Fryingpan River drainage area was average in water year 2009. The wateryear began with above average precipitation, which lasted until December. The following twomonths became drier and cold. A wetter pattern returned to the area in February and March, bringingtotal precipitation closer to the 30-year average. The month of April turned out to be relatively dry,but cold temperatures kept the snowpack water intact.
Temperatures began to warm up very slowly during May but not warm enough to melt the snow onthe higher elevations. However, the snow in the lower reaches began to melt early in May. By themiddle of the month, the runoff season was producing high inflows for Ruedi Reservoir. TheBoustead Tunnel was also diverting at almost full capacity. The warmer weather also brought rain tothe area. By early June, rain was falling on a daily basis, melting all the remaining snow in the upperreaches. The Boustead Tunnel benefited from this weather pattern. Its diversions increased in lateJune, pushing the total volume diverted for the year to more than 82,000 acre-feet.
By the end of June, the rainfall was ending and warmer weather arrived; but the snowpack wasalmost completely gone. Inflow to Ruedi Reservoir dropped rapidly in June and July. Themonsoonal showers moved into the region by the middle of July; but with the snowpack completelygone, their intensity was not sufficient to push the Ruedi inflow up significantly.
The inflow to Ruedi for the year was sufficient to push the reservoir content to almost its fullcapacity, less than one-half foot from the top of the spillway. The inflow was also sufficient to keepRuedi’s level near the spillway crest from late June until early August. The high inflow in May alsoallowed the project to participate in the Coordinated Reservoir Operations (CROS) for 2009 insupport of the endangered species of fish along the Colorado River. Inflow total for October of 2008through September of 2009 was 101 percent of average, with an accumulated total volume of131,200 acre-feet. The April through July season produced a total of 98,000 acre-feet of inflow toRuedi.
3

IV. REPORT ON OPERATIONS DURING WATER YEAR 2009
A. Ruedi Reservoir
Ruedi Reservoir began the water year with a storage content of 81,804 acre-feet, which is 87 percentof average. Precipitation over the Fryingpan River Basin was slightly above average during thewinter and early spring. By April 1, the snow-water content in the Fryingpan River Basin wasestimated at 16.50 inches, 113 percent of average, which was higher than the previous year. All thereleases during the winter and spring months were made through the city of Aspen’s hydroelectricpowerplant.
The releases for November were set at 78 cfs and remained at that rate until March. The springforecast for runoff in the Fryingpan River Basin predicted high inflows for Ruedi Reservoir duringwater year 2009, given the relatively deep snowpack collected between November and March. TheApril through July runoff forecast called for 158,000 acre-feet of inflow. Despite the large volume ofpotential inflow predicted for Ruedi, releases were kept relatively low through April in preparation forCROS in May. The original plan for the CROS operation was to run 800 cfs for approximately eightdays. However, the strong runoff in May left Ruedi’s drainage area depleted of low level snow. Theplans for CROS were changed by the middle of May, and the releases only reached 800 cfs for oneday. As runoff continued through May and June, the reservoir level kept rising slowly. After CROS,the reservoir releases were reduced in 50-cfs increments, until reaching just below 300 cfs. ByJune 20, the reservoir level was approaching the spillway crest; therefore, releases were increased to525 cfs. Once the inflow dropped by early July, the releases were reduced.
The early summer runoff was sufficient to keep the water surface at Ruedi Reservoir near thespillway crest level through July and into early August. With most of the snow gone by late July,inflow to Ruedi finally began to drop. The hot and dry conditions in August dropped streamflows inthe Upper Colorado River Basin to minimum levels by the middle of the month. Supplemental waterwas required to meet established targets along the 15-Mile Reach of the Colorado River identified ascritical habitat for the Upper Colorado River Endangered Fish Recovery Program. The programtargets had been re-evaluated and set at a higher elevation along the 15-Mile Reach than in pastyears. The reservoir storage observed this summer was deemed adequate to make the 4-out-of-5-year, 5,000-acre-feet pool available to the endangered fish this year. The total volume of waterreleased from Ruedi to support the target flows at the 15-Mile Reach in Grand Junction betweenAugust and September, was 20,825 acre-feet, which included 5,000 acre-feet from the firm fish pool;the 10,825 acre-feet of mitigation water; and 5,000 acre-feet from the 4-out-of-5-year fish pool.Releases from Ruedi were increased to 500 cfs during the middle of August and slowly reduced asthe month advanced. By the end of August, the flow was approximately 370 cfs. The high releasescaused the reservoir water level to drop almost 18 feet during August. During September, thereleases were slowly reduced and the reservoir elevation stabilized. The 5,000 acre-feet of water inthe firm fish pool were exhausted by August 16, and the 10,825 acre-feet of mitigation water wereexhausted by September 2.
4
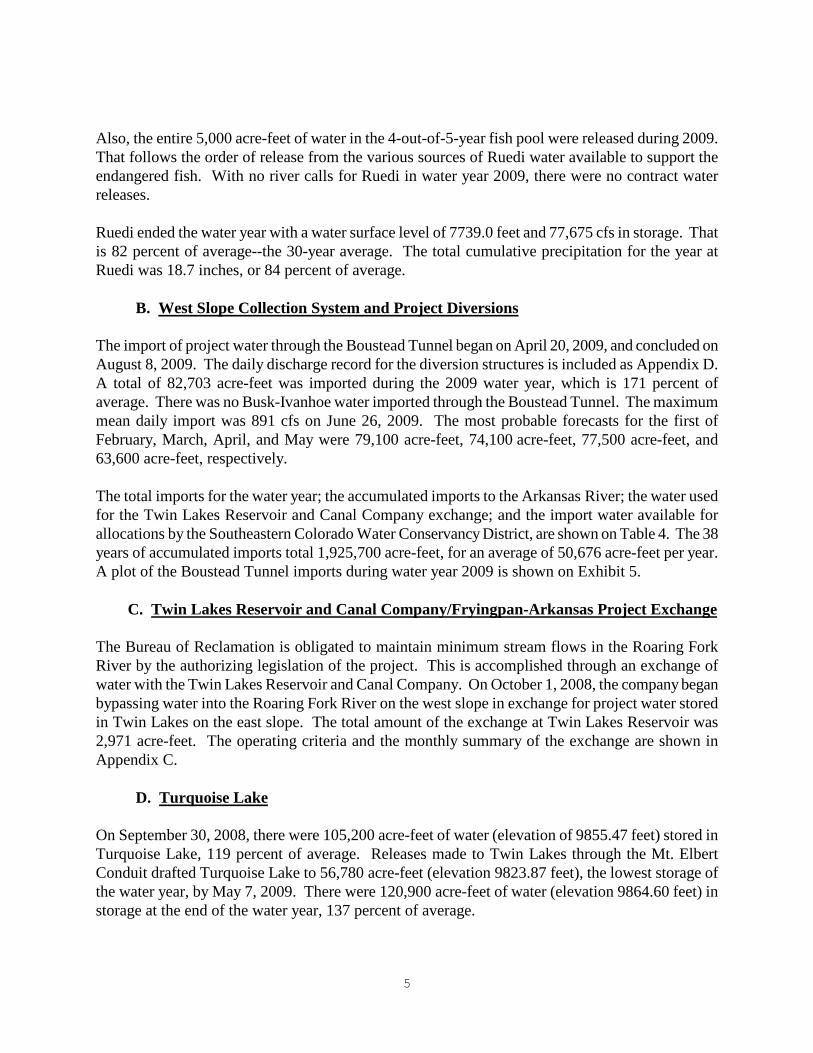
Also, the entire 5,000 acre-feet of water in the 4-out-of-5-year fish pool were released during 2009.That follows the order of release from the various sources of Ruedi water available to support theendangered fish. With no river calls for Ruedi in water year 2009, there were no contract waterreleases.
Ruedi ended the water year with a water surface level of 7739.0 feet and 77,675 cfs in storage. Thatis 82 percent of average--the 30-year average. The total cumulative precipitation for the year atRuedi was 18.7 inches, or 84 percent of average.
B. West Slope Collection System and Project Diversions
The import of project water through the Boustead Tunnel began on April 20, 2009, and concluded onAugust 8, 2009. The daily discharge record for the diversion structures is included as Appendix D.A total of 82,703 acre-feet was imported during the 2009 water year, which is 171 percent ofaverage. There was no Busk-Ivanhoe water imported through the Boustead Tunnel. The maximummean daily import was 891 cfs on June 26, 2009. The most probable forecasts for the first ofFebruary, March, April, and May were 79,100 acre-feet, 74,100 acre-feet, 77,500 acre-feet, and63,600 acre-feet, respectively.
The total imports for the water year; the accumulated imports to the Arkansas River; the water usedfor the Twin Lakes Reservoir and Canal Company exchange; and the import water available forallocations by the Southeastern Colorado Water Conservancy District, are shown on Table 4. The 38years of accumulated imports total 1,925,700 acre-feet, for an average of 50,676 acre-feet per year.A plot of the Boustead Tunnel imports during water year 2009 is shown on Exhibit 5.
C. Twin Lakes Reservoir and Canal Company/Fryingpan-Arkansas Project Exchange
The Bureau of Reclamation is obligated to maintain minimum stream flows in the Roaring ForkRiver by the authorizing legislation of the project. This is accomplished through an exchange ofwater with the Twin Lakes Reservoir and Canal Company. On October 1, 2008, the company beganbypassing water into the Roaring Fork River on the west slope in exchange for project water storedin Twin Lakes on the east slope. The total amount of the exchange at Twin Lakes Reservoir was2,971 acre-feet. The operating criteria and the monthly summary of the exchange are shown inAppendix C.
D. Turquoise Lake
On September 30, 2008, there were 105,200 acre-feet of water (elevation of 9855.47 feet) stored inTurquoise Lake, 119 percent of average. Releases made to Twin Lakes through the Mt. ElbertConduit drafted Turquoise Lake to 56,780 acre-feet (elevation 9823.87 feet), the lowest storage ofthe water year, by May 7, 2009. There were 120,900 acre-feet of water (elevation 9864.60 feet) instorage at the end of the water year, 137 percent of average.
5

Homestake Tunnel imports totaled 50,609 acre-feet during the water year, 198 percent of average.Busk-Ivanhoe imports totaled 1,400 acre-feet, 27 percent of average, and were divided between thePueblo Board of Water Works and the city of Aurora. Project water imports through the BousteadTunnel totaled 82,700 acre-feet, 163 percent of average.
Exhibits 8 and 9 show the precipitation and pan evaporation at Turquoise Lake. Exhibits 5, 6, and 7show the monthly imports through the Boustead, Homestake, and Busk-Ivanhoe Tunnels,respectively. Table 5 and Exhibit 10 depict the monthly operation of Turquoise Lake during the2009 water year.
E. Mt. Elbert Conduit/Halfmoon Creek Diversion
During water year 2009, 131,337 acre-feet of water released from Turquoise Lake, and 8,767 acre-feet of water diverted from Halfmoon Creek, were conveyed through the Mt. Elbert Conduit to theMt. Elbert Forebay, and subsequently to Twin Lakes through the Mt. Elbert Powerplant. Anadditional 3,909 acre-feet of water were released into the conduit from Turquoise Lake for use by theLeadville Federal Fish Hatchery. The water delivered to the hatchery was returned to the ArkansasRiver and stored in Pueblo Reservoir.
F. Twin Lakes/Mt. Elbert Forebay and Mt. Elbert Pumped-Storage Powerplant
The storage in Twin Lakes was 121,094 acre-feet of water (elevation 9192.40 feet) on September 30,2008. The combined storage of Twin Lakes and the Mt. Elbert Forebay was 128,600 acre-feet.Twin Lakes Reservoir releases to Lake Creek were made throughout the winter to pass the entireflow of the Mt. Elbert Conduit, and to transfer the project water stored in the reservoir to PuebloReservoir. The native inflow was stored in the Twin Lakes Reservoir and Canal Company storagespace from November 15 through March 15. A total of 30,819 acre-feet of project water wasreleased to Lake Creek during this time. This water was released such that the flow in the ArkansasRiver at the Wellsville gage was maintained as close to the average October 15 to November 15trout-spawning flow as possible. The combined reservoir and forebay water storage reached a lowpoint of 97,426 acre-feet on March 31, 2009, and was at its high point of 137,705 acre-feet onJuly 16, 2009. A total of 9,146 acre-feet of project water was released to augment rafting flows inthe Arkansas River during the period of July 1 to August 15.
At least one generating/pumping unit was available at the Mt. Elbert Powerplant throughout the 2009water year. The capacity of one unit is greater than the capacity of the Mt. Elbert Conduit. A total of233,681 megawatt-hours of energy was generated at the powerplant, with 727,526 acre-feet of water;140,624 acre-feet came through the Mt. Elbert Conduit; and 562,007 acre-feet were first pumped tothe Mt. Elbert Forebay from Twin Lakes during off-peak electric demand hours. Table 7 depicts themonthly powerplant operation for the 2009 water year.
6
G. Pueblo Reservoir
The water storage content of Pueblo Reservoir was 178,565 acre-feet (elevation 4861.16 feet) onSeptember 30, 2008, 133 percent of average. Project water released from Turquoise Lake, throughthe Leadville Federal Fish Hatchery, and from Twin Lakes, was stored in Pueblo Reservoir throughthe winter and spring. A total of 48,037 acre-feet of native inflow was stored in the reservoir underthe winter water storage program from November 15, 2008, through March 14, 2009. During thewater year, 31,072 acre-feet of winter water and 14,016 acre-feet of winter water carryover werereleased, and 2,528 acre-feet evaporated. The reservoir reached a high point in storage of 253,141acre-feet (elevation 4879.66 feet) on April 3, 2009. There were 193,160 acre-feet (elevation 4865.13feet) in storage on September 30, 2009. This is 146 percent of average and 63,789 acre-feet less thana full conservation pool.
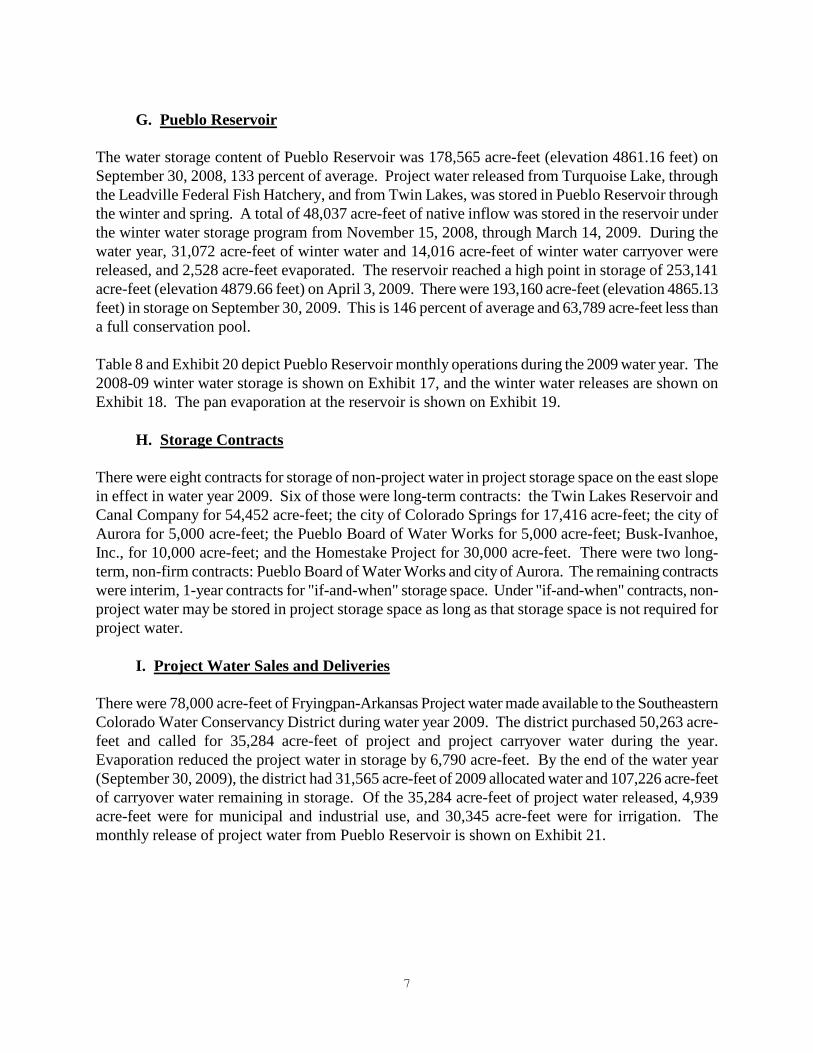
Table 8 and Exhibit 20 depict Pueblo Reservoir monthly operations during the 2009 water year. The2008-09 winter water storage is shown on Exhibit 17, and the winter water releases are shown onExhibit 18. The pan evaporation at the reservoir is shown on Exhibit 19.
H. Storage Contracts
There were eight contracts for storage of non-project water in project storage space on the east slopein effect in water year 2009. Six of those were long-term contracts: the Twin Lakes Reservoir andCanal Company for 54,452 acre-feet; the city of Colorado Springs for 17,416 acre-feet; the city ofAurora for 5,000 acre-feet; the Pueblo Board of Water Works for 5,000 acre-feet; Busk-Ivanhoe,Inc., for 10,000 acre-feet; and the Homestake Project for 30,000 acre-feet. There were two long-term, non-firm contracts: Pueblo Board of Water Works and city of Aurora. The remaining contractswere interim, 1-year contracts for "if-and-when" storage space. Under "if-and-when" contracts, non-project water may be stored in project storage space as long as that storage space is not required forproject water.
I. Project Water Sales and Deliveries
There were 78,000 acre-feet of Fryingpan-Arkansas Project water made available to the SoutheasternColorado Water Conservancy District during water year 2009. The district purchased 50,263 acre-feet and called for 35,284 acre-feet of project and project carryover water during the year.Evaporation reduced the project water in storage by 6,790 acre-feet. By the end of the water year(September 30, 2009), the district had 31,565 acre-feet of 2009 allocated water and 107,226 acre-feetof carryover water remaining in storage. Of the 35,284 acre-feet of project water released, 4,939acre-feet were for municipal and industrial use, and 30,345 acre-feet were for irrigation. Themonthly release of project water from Pueblo Reservoir is shown on Exhibit 21.
7

J. Reservoir Storage Allocation Data
Table 9 presents the reservoir storage allocations for the five project reservoirs.
K. Reservoir Evaporation and Precipitation
Tables 11 and 12 present the monthly average evaporation and precipitation at the four weatherstations near project facilities. When an evaporation pan is not in service and a reservoir is notcompletely ice-covered, the daily water surface evaporation is computed using seasonal evaporationfactors. Those factors are listed in Table 10. The assumption is that there is no evaporation from areservoir water surface when ice completely covers the reservoir.
L. Flood Control Benefits
Releases from Ruedi Reservoir did not create any flooding situation downstream during WY 2009due to a combination of adequate reservoir capacity, timely releases, and maximum diversionsthrough the Boustead Tunnel. However, the U. S. Army Corps of Engineers estimated that theoperations at Ruedi Reservoir during WY 2009 prevented a total of $740,100 in potential flooddamages. Since impoundment, Ruedi Reservoir has prevented a total of $12,321,400 in potentialflood damages.
The snowpack in the Arkansas River Basin was above average during WY 2009. However, thereservoir level for Pueblo Reservoir did not reach the flood pool, and the reservoir releases werealways below levels that could cause economic damage.
Therefore, the Corps of Engineers has determined that Pueblo Reservoir did not directly prevent anyflooding downstream during WY 2009.
Table 13 shows the historic flood control benefits provided by Pueblo and Ruedi Dams.
8

Table 1
Ruedi ReservoirWater Year 2009 Operations
Unit: 1,000 Acre-Feet
End of Month Water SurfaceYear Month Inflow Evaporation* Outflow Content Elevation
(FEET)
2008 Sep 81.8 7743.86Oct 3.7 0 8.5 77.0 7738.17Nov 3.4 0 4.4 76.0 7736.99Dec 3.2 0 4.5 74.7 7735.44
2009 Jan 2.6 0 4.4 73.0 7733.22Feb 2.4 0 4.4 70.9 7730.63Mar 4.0 0 6.8 68.1 7727.03Apr 9.7 0 9.0 68.8 7727.96May 38.4 0.2 18.1 88.9 7751.89Jun 34.7 0.6 21.8 101.1 7764.76Jul 15.5 0.6 14.3 101.7 7765.36Aug 8.2 0.4 24.5 85.0 7747.51Sep 5.3 0.2 12.5 77.7 7739.00
Total 131.1 2.0 133.2

Table 2-1FRYINGPAN-ARKANSAS PROJECT
RUEDI RESERVOIR
RELEASES FOR ENDANGERED FISH
WATER YEAR 2009
April-09
FRYINGPAN RUEDI REQUIRED
TOTAL ROCKY RIVER CALLED OUT? MIN FLOW ENDANGERED CUMULATIVE
RESERVOIR FORK GAGE (1= YES) BELOW RUEDI FISH FISH PALISADE
ELEV. STORAGE INFLOW EVAP. RELEASE CREEK BELOW DAM (0= NO) w /o FISH REL RELEASE RELEASE GAGE
DAY DATE (FT) (AC-FT) (CFS) (CFS) (CFS) (CFS) (CFS) (CFS) (CFS) (AC-FT) (CFS)
THU 4/1/2009 7,726.96 68037 83 0 110 4 113 no 39 0 0 1321
FRI 4/2/2009 7,726.84 67946 63 0 110 4 113 no 39 0 0 1137
SAT 4/3/2009 7,726.76 67885 79 0 110 4 113 no 39 0 0 1112
SUN 4/4/2009 7,726.66 67809 72 0 110 4 113 no 39 0 0 1492
MON 4/5/2009 7,726.52 67702 56 0 110 4 113 no 39 0 0 1278
TUE 4/6/2009 7,726.40 67611 64 0 110 4 113 no 39 0 0 1123
WED 4/7/2009 7,726.31 67542 76 0 110 5 113 no 39 0 0 989
THU 4/8/2009 7,726.28 67519 98 0 110 5 114 no 39 0 0 1056
FRI 4/9/2009 7,726.34 67565 133 0 110 5 114 no 39 0 0 1132
SAT 4/10/2009 7,726.34 67565 116 0 116 5 120 no 39 0 0 1328
SUN 4/11/2009 7,726.27 67512 128 0 154 6 159 no 39 0 0 1433
MON 4/12/2009 7,726.18 67443 120 0 154 6 159 no 39 0 0 1649
TUE 4/13/2009 7,726.07 67359 112 0 154 6 159 no 39 0 0 1613
WED 4/14/2009 7,726.00 67306 127 0 154 7 159 no 39 0 0 1644
THU 4/15/2009 7,725.95 67268 135 0 154 8 160 no 39 0 0 1722
FRI 4/16/2009 7,725.97 67284 163 0 155 8 162 no 39 0 0 2032
SAT 4/17/2009 7,725.92 67246 137 0 156 7 162 no 39 0 0 2129
SUN 4/18/2009 7,725.84 67185 125 0 156 7 162 no 39 0 0 1867
MON 4/19/2009 7,725.77 67132 129 0 156 8 171 no 39 0 0 1710
TUE 4/20/2009 7,725.74 67110 144 0 155 8 162 no 39 0 0 1630
WED 4/21/2009 7,725.82 67170 185 0 154 9 161 no 39 0 0 1912
THU 4/22/2009 7,726.09 67374 257 0 154 9 162 no 39 0 0 2623
FRI 4/23/2009 7,726.41 67619 277 0 154 10 162 no 39 0 0 3482
SAT 4/24/2009 7,726.75 67878 293 0 163 11 171 no 39 0 0 4315
SUN 4/25/2009 7,727.03 68091 315 0 207 12 218 no 39 0 0 5479
MON 4/26/2009 7,727.28 68283 303 0 207 14 218 no 39 0 0 6291
TUE 4/27/2009 7,727.41 68383 252 0 206 14 219 no 39 0 0 6146
WED 4/28/2009 7,727.50 68452 245 0 207 14 218 no 39 0 0 4773
THU 4/29/2009 7,727.62 68544 253 0 206 14 218 no 39 0 0 3982
FRI 4/30/2009 7,727.96 68804 337 0 205 13 217 no 39 0 0 4427
Averages 7,726.50 67687 163 0 151 8 157 0 2428
Totals (acft) 9675 0 8962 470 9356 0 144455
NOTES: Releases of w ater to support 15-Mile Reach target f low s ceased on 9/24. A total of 20,825 acre-feet w ere released to support Recovery Program target flow s in the 15-Mile Reach.
NOTES: The values presented in these tables w ere compliled from operational records.
NOTES: These are preliminary records and open to revision.

Table 2-2FRYINGPAN-ARKANSAS PROJECT
RUEDI RESERVOIR
RELEASES FOR ENDANGERED FISH
WATER YEAR 2009
May-09
FRYINGPAN RUEDI REQUIRED
TOTAL ROCKY RIVER CALLED OUT? MIN FLOW ENDANGERED CUMULATIVE
RESERVOIR FORK GAGE (1= YES) BELOW RUEDI FISH FISH PALISADE
ELEV. STORAGE INFLOW EVAP. RELEASE CREEK BELOW DAM (0= NO) w /o FISH REL RELEASE RELEASE GAGE
DAY DATE (FT) (AC-FT) (CFS) (CFS) (CFS) (CFS) (CFS) (CFS) (CFS) (AC-FT) (CFS)
THU 5/1/2009 7,728.39 69137 372 0 204 14 217 no 110 0 0 5704
FRI 5/2/2009 7,728.80 69454 366 0 206 16 220 no 110 0 0 6838
SAT 5/3/2009 7,729.21 69773 366 0 206 18 222 no 110 0 0 7099
SUN 5/4/2009 7,729.62 70092 366 0 205 17 222 no 110 0 0 7081
MON 5/5/2009 7,729.92 70326 316 0 198 17 215 no 110 0 0 6794
TUE 5/6/2009 7,730.39 70695 338 0 152 16 168 no 110 0 0 5942
WED 5/7/2009 7,731.14 71285 451 0 153 17 170 no 110 0 0 6937
THU 5/8/2009 7,732.05 72006 517 0 153 25 178 no 110 0 0 8945
FRI 5/9/2009 7,732.92 72700 504 0 154 28 182 no 110 0 0 10213
SAT 5/10/2009 7,733.80 73408 512 0 156 28 184 no 110 0 0 10077
SUN 5/11/2009 7,734.65 74095 503 4 156 31 187 no 110 0 0 10315
MON 5/12/2009 7,735.64 74901 568 4 159 35 193 no 110 0 0 10944
TUE 5/13/2009 7,736.69 75760 600 4 162 38 199 no 110 0 0 12863
WED 5/14/2009 7,737.64 76544 568 4 169 37 205 no 110 0 0 13134
THU 5/15/2009 7,738.39 77167 576 4 259 38 295 no 110 0 0 13507
FRI 5/16/2009 7,738.86 77558 588 4 367 39 406 no 110 0 0 13991
SAT 5/17/2009 7,739.31 77935 658 4 464 43 506 no 110 0 0 15116
SUN 5/18/2009 7,739.90 78429 814 4 560 48 607 no 110 0 0 16319
MON 5/19/2009 7,740.57 78995 937 4 649 53 700 no 110 0 0 17425
TUE 5/20/2009 7,740.97 79333 884 4 710 52 760 no 110 0 0 17759
WED 5/21/2009 7,741.58 79851 898 4 634 52 683 no 110 0 0 18516
THU 5/22/2009 7,742.27 80439 829 4 529 54 581 no 110 0 0 13518
FRI 5/23/2009 7,743.17 81210 844 4 451 55 504 no 110 0 0 12951
SAT 5/24/2009 7,744.41 82281 902 4 358 62 417 no 110 0 0 13488
SUN 5/25/2009 7,745.64 83352 824 4 280 63 341 no 110 0 0 11279
MON 5/26/2009 7,746.83 84397 797 4 266 59 325 no 110 0 0 11799
TUE 5/27/2009 7,747.94 85378 756 4 258 58 315 no 110 0 0 11720
WED 5/28/2009 7,748.92 86250 658 4 215 54 270 no 110 0 0 12352
THU 5/29/2009 7,749.83 87064 645 4 231 50 281 no 110 0 0 12554
FRI 5/30/2009 7,750.79 87928 672 4 233 48 281 no 110 0 0 12567
SAT 5/31/2009 7,751.89 88924 740 4 233 47 281 no 110 0 0 12743
Averages 7,738.78 77634 625 3 295 39 333 0 11629
Totals (acft) 38418 154 18112 2400 20455 0 715033
NOTES: Releases of w ater to support 15-Mile Reach target flow s ceased on 9/24. A total of 20,825 acre-feet w ere released to support Recovery Program target f low s in the 15-Mile Reach.
NOTES: The values presented in these tables w ere compliled from operational records.
NOTES: These are preliminary records and open to revision.
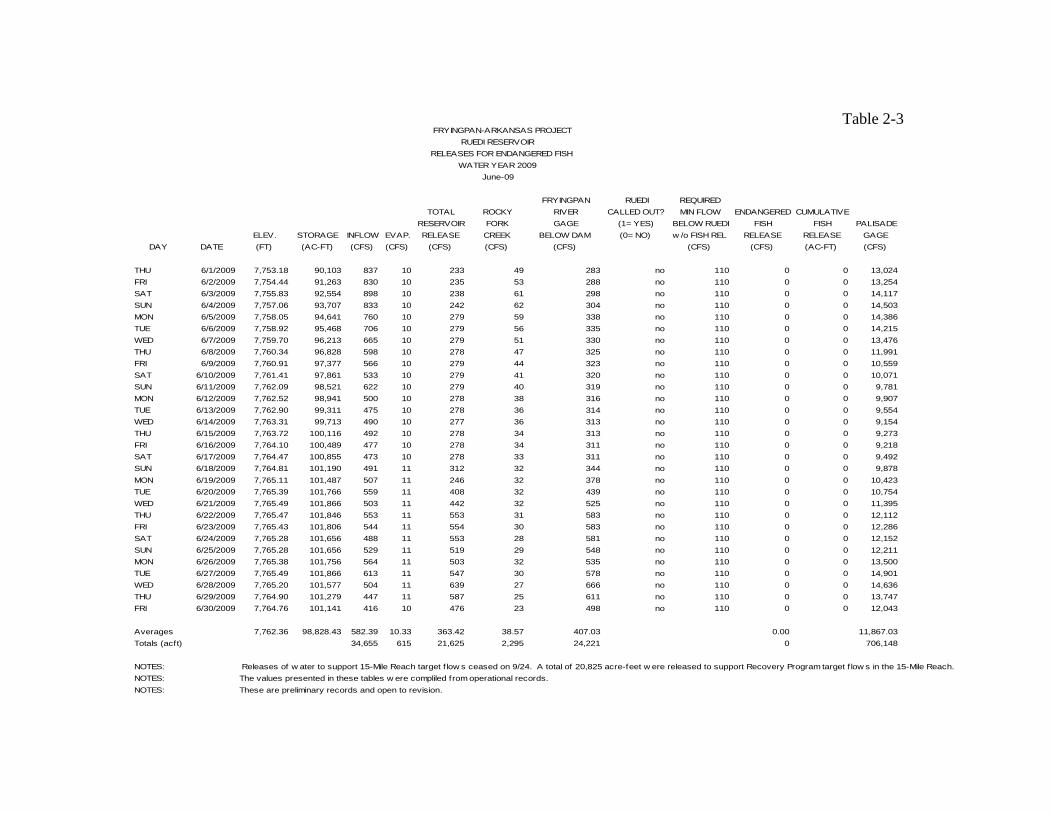
Table 2-3FRYINGPAN-ARKANSAS PROJECT
RUEDI RESERVOIR
RELEASES FOR ENDANGERED FISH
WATER YEAR 2009
June-09
FRYINGPAN RUEDI REQUIRED
TOTAL ROCKY RIVER CALLED OUT? MIN FLOW ENDANGERED CUMULATIVE
RESERVOIR FORK GAGE (1= YES) BELOW RUEDI FISH FISH PALISADE
ELEV. STORAGE INFLOW EVAP. RELEASE CREEK BELOW DAM (0= NO) w /o FISH REL RELEASE RELEASE GAGE
DAY DATE (FT) (AC-FT) (CFS) (CFS) (CFS) (CFS) (CFS) (CFS) (CFS) (AC-FT) (CFS)
THU 6/1/2009 7,753.18 90,103 837 10 233 49 283 no 110 0 0 13,024
FRI 6/2/2009 7,754.44 91,263 830 10 235 53 288 no 110 0 0 13,254
SAT 6/3/2009 7,755.83 92,554 898 10 238 61 298 no 110 0 0 14,117
SUN 6/4/2009 7,757.06 93,707 833 10 242 62 304 no 110 0 0 14,503
MON 6/5/2009 7,758.05 94,641 760 10 279 59 338 no 110 0 0 14,386
TUE 6/6/2009 7,758.92 95,468 706 10 279 56 335 no 110 0 0 14,215
WED 6/7/2009 7,759.70 96,213 665 10 279 51 330 no 110 0 0 13,476
THU 6/8/2009 7,760.34 96,828 598 10 278 47 325 no 110 0 0 11,991
FRI 6/9/2009 7,760.91 97,377 566 10 279 44 323 no 110 0 0 10,559
SAT 6/10/2009 7,761.41 97,861 533 10 279 41 320 no 110 0 0 10,071
SUN 6/11/2009 7,762.09 98,521 622 10 279 40 319 no 110 0 0 9,781
MON 6/12/2009 7,762.52 98,941 500 10 278 38 316 no 110 0 0 9,907
TUE 6/13/2009 7,762.90 99,311 475 10 278 36 314 no 110 0 0 9,554
WED 6/14/2009 7,763.31 99,713 490 10 277 36 313 no 110 0 0 9,154
THU 6/15/2009 7,763.72 100,116 492 10 278 34 313 no 110 0 0 9,273
FRI 6/16/2009 7,764.10 100,489 477 10 278 34 311 no 110 0 0 9,218
SAT 6/17/2009 7,764.47 100,855 473 10 278 33 311 no 110 0 0 9,492
SUN 6/18/2009 7,764.81 101,190 491 11 312 32 344 no 110 0 0 9,878
MON 6/19/2009 7,765.11 101,487 507 11 246 32 378 no 110 0 0 10,423
TUE 6/20/2009 7,765.39 101,766 559 11 408 32 439 no 110 0 0 10,754
WED 6/21/2009 7,765.49 101,866 503 11 442 32 525 no 110 0 0 11,395
THU 6/22/2009 7,765.47 101,846 553 11 553 31 583 no 110 0 0 12,112
FRI 6/23/2009 7,765.43 101,806 544 11 554 30 583 no 110 0 0 12,286
SAT 6/24/2009 7,765.28 101,656 488 11 553 28 581 no 110 0 0 12,152
SUN 6/25/2009 7,765.28 101,656 529 11 519 29 548 no 110 0 0 12,211
MON 6/26/2009 7,765.38 101,756 564 11 503 32 535 no 110 0 0 13,500
TUE 6/27/2009 7,765.49 101,866 613 11 547 30 578 no 110 0 0 14,901
WED 6/28/2009 7,765.20 101,577 504 11 639 27 666 no 110 0 0 14,636
THU 6/29/2009 7,764.90 101,279 447 11 587 25 611 no 110 0 0 13,747
FRI 6/30/2009 7,764.76 101,141 416 10 476 23 498 no 110 0 0 12,043
Averages 7,762.36 98,828.43 582.39 10.33 363.42 38.57 407.03 0.00 11,867.03
Totals (acft) 34,655 615 21,625 2,295 24,221 0 706,148
NOTES: Releases of w ater to support 15-Mile Reach target f low s ceased on 9/24. A total of 20,825 acre-feet w ere released to support Recovery Program target f low s in the 15-Mile Reach.
NOTES: The values presented in these tables w ere compliled from operational records.
NOTES: These are preliminary records and open to revision.

Table 2-4
FRYINGPAN-ARKANSAS PROJECT
RUEDI RESERVOIR
RELEASES FOR ENDANGERED FISH
WATER YEAR 2009
July-09
FRYINGPAN RUEDI REQUIRED
TOTAL ROCKY RIVER CALLED OUT? MIN FLOW ENDANGERED CUMULATIVE
RESERVOIR FORK GAGE (1= YES) BELOW RUEDI FISH FISH PALISADE
ELEV. STORAGE INFLOW EVAP. RELEASE CREEK BELOW DAM (0= NO) w /o FISH REL RELEASE RELEASE GAGE
DAY DATE (FT) (AC-FT) (CFS) (CFS) (CFS) (CFS) (CFS) (CFS) (CFS) (AC-FT) (CFS)
THU 7/1/2009 7764.72 101102 362 9 372 21 393 no 110 0 0 10747
FRI 7/2/2009 7764.82 101200 374 9 315 20 336 no 110 0 0 9706
SAT 7/3/2009 7764.90 101279 365 9 315 20 337 no 110 0 0 9024
SUN 7/4/2009 7764.92 101299 335 9 315 19 335 no 110 0 0 10136
MON 7/5/2009 7764.92 101299 324 9 334 18 334 no 110 0 0 9371
TUE 7/6/2009 7764.90 101279 304 9 305 17 323 no 110 0 0 8842
WED 7/7/2009 7764.89 101269 280 9 275 15 291 no 110 0 0 8136
THU 7/8/2009 7764.84 101220 259 9 275 14 290 no 110 0 0 7188
FRI 7/9/2009 7764.79 101171 260 9 275 13 289 no 110 0 0 6446
SAT 7/10/2009 7764.80 101180 148 9 234 13 247 no 110 0 0 5846
SUN 7/11/2009 7764.86 101240 258 9 219 12 232 no 110 0 0 5403
MON 7/12/2009 7764.90 101279 248 9 219 12 231 no 110 0 0 5059
TUE 7/13/2009 7764.92 101299 238 9 219 11 231 no 110 0 0 4816
WED 7/14/2009 7764.93 101309 233 9 219 11 231 no 110 0 0 4682
THU 7/15/2009 7765.01 101388 221 9 171 10 182 no 110 0 0 4414
FRI 7/16/2009 7765.11 101487 231 9 172 10 182 no 110 0 0 4063
SAT 7/17/2009 7765.17 101547 212 9 172 9 182 no 110 0 0 3709
SUN 7/18/2009 7765.22 101597 207 9 172 9 182 no 110 0 0 3487
MON 7/19/2009 7765.25 101627 197 9 173 9 182 no 110 0 0 3222
TUE 7/20/2009 7765.33 101706 222 9 173 8 182 no 110 0 0 2885
WED 7/21/2009 7765.36 101736 197 9 173 8 182 no 110 0 0 2711
THU 7/22/2009 7765.37 101746 188 9 173 8 182 no 110 0 0 2568
FRI 7/23/2009 7765.39 101766 193 9 174 8 182 no 110 0 0 2272
SAT 7/24/2009 7765.40 101776 188 9 174 8 182 no 110 0 0 2082
SUN 7/25/2009 7765.41 101786 188 9 174 8 182 no 110 0 0 1875
MON 7/26/2009 7765.62 101995 288 9 173 8 182 no 110 0 0 2110
TUE 7/27/2009 7765.75 102124 270 10 195 8 204 no 110 0 0 2204
WED 7/28/2009 7765.71 102084 234 10 244 7 252 no 110 0 0 2160
THU 7/29/2009 7765.59 101965 223 9 273 8 282 no 110 0 0 2066
FRI 7/30/2009 7765.50 101876 238 9 273 7 281 no 110 0 0 2098
SAT 7/31/2009 7765.36 101736 212 9 273 7 281 no 110 0 0 2118
Averages 7765.15 101528 248 9 233 12 245 0 4885
Totals (acft) 15268 582 14327 709 15044 0 300392
NOTES: Releases of w ater to support 15-Mile Reach target f low s ceased on 9/24. A total of 20,825 acre-feet w ere released to support Recovery Program target f low s in the 15-Mile Reach.
NOTES: The values presented in these tables w ere compliled from operational records.
NOTES: These are preliminary records and open to revision.

Table 2-5
FRYINGPAN-ARKANSAS PROJECT
RUEDI RESERVOIR
RELEASES FOR ENDANGERED FISH
WATER YEAR 2009
August-09
FRYINGPAN RUEDI REQUIRED
TOTAL ROCKY RIVER CALLED OUT? MIN FLOW ENDANGERED CUMULATIVE
RESERVOIR FORK GAGE (1= YES) BELOW RUEDI FISH FISH PALISADE
ELEV. STORAGE INFLOW EVAP. RELEASE CREEK BELOW DAM (0= NO) w /o FISH REL RELEASE RELEASE GAGE
DAY DATE (FT) (AC-FT) (CFS) (CFS) (CFS) (CFS) (CFS) (CFS) (CFS) (AC-FT) (CFS)
SUN 8/1/2004 7765.25 101627 223 7 272 7 279 no 110 0 0 2224
MON 8/2/2004 7765.06 101438 183 7 271 7 279 no 110 0 0 2415
TUE 8/3/2004 7764.87 101250 183 7 271 7 279 no 110 0 0 2323
WED 8/4/2004 7764.64 101022 164 7 272 7 279 no 110 0 0 1979
THU 8/5/2004 7764.37 100756 160 7 288 7 295 no 110 44 87 1753
FRI 8/6/2004 7764.08 100469 179 7 317 6 324 no 110 150 384 1619
SAT 8/7/2004 7763.77 100164 169 7 316 6 323 no 110 150 682 1507
SUN 8/8/2004 7763.44 99841 159 7 316 6 322 no 110 150 979 1442
MON 8/9/2004 7763.08 99488 145 7 316 6 322 no 110 150 1277 1392
TUE 8/10/2004 7762.66 99077 133 7 334 6 340 no 110 167 1608 1286
WED 8/11/2004 7762.13 98560 134 7 388 6 394 no 110 200 2005 1321
THU 8/12/2004 7761.48 97929 127 7 439 6 446 no 110 250 2501 1251
FRI 8/13/2004 7760.70 97175 133 7 507 6 513 no 110 330 3155 1119
SAT 8/14/2004 7759.98 96481 162 7 505 6 512 no 110 330 3810 1104
SUN 8/15/2004 7759.28 95811 172 7 503 6 510 no 110 330 4464 1204
MON 8/16/2004 7758.53 95097 147 7 501 7 509 no 110 330 5119 1431
TUE 8/17/2004 7757.76 94367 141 6 502 5 508 no 110 330 5773 1443
WED 8/18/2004 7756.98 93631 136 6 501 6 507 no 110 330 6428 1235
THU 8/19/2004 7756.18 92881 128 6 500 5 506 no 110 330 7083 1206
FRI 8/20/2004 7755.37 92126 124 6 498 5 504 no 110 330 7737 1184
SAT 8/21/2004 7754.60 91411 118 6 472 8 479 no 110 330 8392 1133
SUN 8/22/2004 7753.88 90746 115 6 444 7 451 no 110 330 9046 1178
MON 8/23/2004 7753.17 90093 120 6 443 6 450 no 110 330 9701 1248
TUE 8/24/2004 7752.45 89435 115 6 441 6 449 no 110 330 10355 1305
WED 8/25/2004 7751.74 88788 118 6 437 6 449 no 110 330 11010 1338
THU 8/26/2004 7751.00 88117 89 6 421 6 448 no 96 330 11664 1393
FRI 8/27/2004 7750.28 87468 79 6 400 6 432 no 85 322 12303 1450
SAT 8/28/2004 7749.60 86858 81 6 382 6 416 no 87 306 12910 1422
SUN 8/29/2004 7748.91 86241 72 6 377 6 416 no 78 306 13517 1427
MON 8/30/2004 7748.22 85627 67 6 371 6 415 no 73 305 14123 1416
TUE 8/31/2004 7747.51 84997 57 6 368 6 414 no 63 304 14726 1440
Averages 7757.77 94483 133 6 399 6 412 239 1458
Totals (acft) 8200 399 24541 379 25328 14726 89633
NOTES: Releases of w ater to support 15-Mile Reach target f low s ceased on 9/24. A total of 20,825 acre-feet w ere released to support Recovery Program target f low s in the 15-Mile Reach.
NOTES: The values presented in these tables w ere compliled from operational records.
NOTES: These are preliminary records and open to revision.
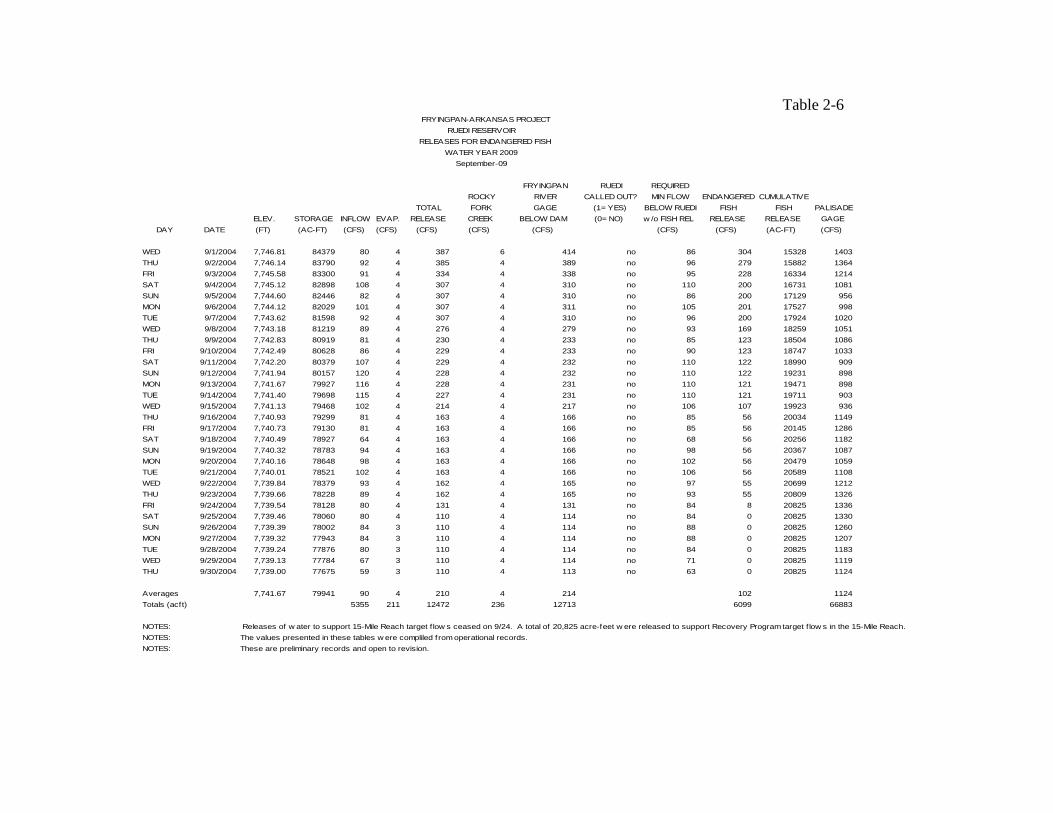
Table 2-6FRYINGPAN-ARKANSAS PROJECT
RUEDI RESERVOIR
RELEASES FOR ENDANGERED FISH
WATER YEAR 2009
September-09
FRYINGPAN RUEDI REQUIRED
ROCKY RIVER CALLED OUT? MIN FLOW ENDANGERED CUMULATIVE
TOTAL FORK GAGE (1= YES) BELOW RUEDI FISH FISH PALISADE
ELEV. STORAGE INFLOW EVAP. RELEASE CREEK BELOW DAM (0= NO) w /o FISH REL RELEASE RELEASE GAGE
DAY DATE (FT) (AC-FT) (CFS) (CFS) (CFS) (CFS) (CFS) (CFS) (CFS) (AC-FT) (CFS)
WED 9/1/2004 7,746.81 84379 80 4 387 6 414 no 86 304 15328 1403
THU 9/2/2004 7,746.14 83790 92 4 385 4 389 no 96 279 15882 1364
FRI 9/3/2004 7,745.58 83300 91 4 334 4 338 no 95 228 16334 1214
SAT 9/4/2004 7,745.12 82898 108 4 307 4 310 no 110 200 16731 1081
SUN 9/5/2004 7,744.60 82446 82 4 307 4 310 no 86 200 17129 956
MON 9/6/2004 7,744.12 82029 101 4 307 4 311 no 105 201 17527 998
TUE 9/7/2004 7,743.62 81598 92 4 307 4 310 no 96 200 17924 1020
WED 9/8/2004 7,743.18 81219 89 4 276 4 279 no 93 169 18259 1051
THU 9/9/2004 7,742.83 80919 81 4 230 4 233 no 85 123 18504 1086
FRI 9/10/2004 7,742.49 80628 86 4 229 4 233 no 90 123 18747 1033
SAT 9/11/2004 7,742.20 80379 107 4 229 4 232 no 110 122 18990 909
SUN 9/12/2004 7,741.94 80157 120 4 228 4 232 no 110 122 19231 898
MON 9/13/2004 7,741.67 79927 116 4 228 4 231 no 110 121 19471 898
TUE 9/14/2004 7,741.40 79698 115 4 227 4 231 no 110 121 19711 903
WED 9/15/2004 7,741.13 79468 102 4 214 4 217 no 106 107 19923 936
THU 9/16/2004 7,740.93 79299 81 4 163 4 166 no 85 56 20034 1149
FRI 9/17/2004 7,740.73 79130 81 4 163 4 166 no 85 56 20145 1286
SAT 9/18/2004 7,740.49 78927 64 4 163 4 166 no 68 56 20256 1182
SUN 9/19/2004 7,740.32 78783 94 4 163 4 166 no 98 56 20367 1087
MON 9/20/2004 7,740.16 78648 98 4 163 4 166 no 102 56 20479 1059
TUE 9/21/2004 7,740.01 78521 102 4 163 4 166 no 106 56 20589 1108
WED 9/22/2004 7,739.84 78379 93 4 162 4 165 no 97 55 20699 1212
THU 9/23/2004 7,739.66 78228 89 4 162 4 165 no 93 55 20809 1326
FRI 9/24/2004 7,739.54 78128 80 4 131 4 131 no 84 8 20825 1336
SAT 9/25/2004 7,739.46 78060 80 4 110 4 114 no 84 0 20825 1330
SUN 9/26/2004 7,739.39 78002 84 3 110 4 114 no 88 0 20825 1260
MON 9/27/2004 7,739.32 77943 84 3 110 4 114 no 88 0 20825 1207
TUE 9/28/2004 7,739.24 77876 80 3 110 4 114 no 84 0 20825 1183
WED 9/29/2004 7,739.13 77784 67 3 110 4 114 no 71 0 20825 1119
THU 9/30/2004 7,739.00 77675 59 3 110 4 113 no 63 0 20825 1124
Averages 7,741.67 79941 90 4 210 4 214 102 1124
Totals (acft) 5355 211 12472 236 12713 6099 66883
NOTES: Releases of w ater to support 15-Mile Reach target flow s ceased on 9/24. A total of 20,825 acre-feet w ere released to support Recovery Program target flow s in the 15-Mile Reach.
NOTES: The values presented in these tables w ere compliled from operational records.
NOTES: These are preliminary records and open to revision.

Table 2-7FRYINGPAN-ARKANSAS PROJECT
RUEDI RESERVOIR
RELEASES FOR ENDANGERED FISH
WATER YEAR 2009
October-09
FRYINGPAN RUEDI REQUIRED
TOTAL ROCKY RIVER CALLED OUT? MIN FLOW ENDANGERED CUMULATIVE
RESERVOIR FORK GAGE (1= YES) BELOW RUEDI FISH FISH PALISADE
ELEV. STORAGE INFLOW EVAP. RELEASE CREEK BELOW DAM (0= NO) w /o FISH REL RELEASE RELEASE GAGE
DAY DATE (FT) (AC-FT) (CFS) (CFS) (CFS) (CFS) (CFS) (CFS) (CFS) (AC-FT) (CFS)
FRI 10/1/2004 7,738.90 77,592 69 1 110 4 58 no 73 0 20,825 1,172
SAT 10/2/2004 7,738.79 77,500 65 1 110 4 54 no 69 0 20,825 1,213
SUN 10/3/2004 7,738.71 77,433 78 1 110 4 60 no 81 0 20,825 1,264
MON 10/4/2004 7,738.64 77,375 82 1 110 4 58 no 86 0 20,825 1,279
TUE 10/5/2004 7,738.55 77,300 74 1 110 4 61 no 77 0 20,825 1,320
WED 10/6/2004 7,738.46 77,225 73 1 110 4 61 no 77 0 20,825 1,370
THU 10/7/2004 7,738.37 77,150 73 1 110 4 62 no 77 0 20,825 1,383
FRI 10/8/2004 7,738.30 77,092 82 1 110 4 64 no 86 0 20,825 1,389
SAT 10/9/2004 7,738.22 77,025 78 1 110 4 63 no 81 0 20,825 1,400
SUN 10/10/2004 7,738.10 76,925 61 1 110 4 62 no 64 0 20,825 1,391
MON 10/11/2004 7,738.03 76,867 82 1 110 4 59 no 85 0 20,825 1,359
TUE 10/12/2004 7,737.92 76,776 65 1 110 4 57 no 69 0 20,825 1,333
WED 10/13/2004 7,737.83 76,701 73 1 109 4 58 no 77 0 20,825 1,286
THU 10/14/2004 7,737.83 76,701 110 1 109 4 68 no 110 0 20,825 1,291
FRI 10/15/2004 7,737.77 76,652 84 1 108 4 76 no 88 0 20,825 1,418
SAT 10/16/2004 7,737.73 76,619 89 1 104 4 71 no 93 0 20,825 1,482
SUN 10/17/2004 7,737.71 76,602 75 1 82 4 67 no 79 0 20,825 1,505
MON 10/18/2004 7,737.70 76,594 80 1 83 4 67 no 84 0 20,825 1,454
TUE 10/19/2004 7,737.68 76,578 77 1 84 4 69 no 81 0 20,825 1,424
WED 10/20/2004 7,737.68 76,578 86 1 85 5 69 no 92 0 20,825 1,440
THU 10/21/2004 7,737.66 76,561 61 1 68 23 67 no 83 0 20,825 1,461
FRI 10/22/2004 7,737.62 76,528 45 1 60 31 65 no 75 0 20,825 1,564
SAT 10/23/2004 7,737.59 76,503 61 1 72 18 63 no 79 0 20,825 1,573
SUN 10/24/2004 7,737.58 76,495 84 1 86 4 61 no 88 0 20,825 1,525
MON 10/25/2004 7,737.55 76,470 75 1 86 4 67 no 79 0 20,825 1,619
TUE 10/26/2004 7,737.48 76,412 58 1 86 4 53 no 62 0 20,825 1,428
WED 10/27/2004 7,737.28 76,246 4 1 86 4 63 no 8 0 20,825 1,441
THU 10/28/2004 7,737.25 76,222 75 1 86 4 60 no 78 0 20,825 1,483
FRI 10/29/2004 7,737.14 76,131 41 1 85 4 50 no 45 0 20,825 1,486
SAT 10/30/2004 7,737.08 76,081 59 1 83 4 55 no 63 0 20,825 1,473
SUN 10/31/2004 7,737.07 76,073 71 1 74 3 58 no 75 0 20,825 1,393
Averages 7,737.88 76742 71 1 95 6 62 0 1407
Totals (acft) 4340 80 5863 355 3820 0 86517
NOTES: Releases of w ater to support 15-Mile Reach target f low s ceased on 9/24. A total of 20,825 acre-feet w ere released to support Recovery Program target f low s in the 15-Mile Reach.
NOTES: The values presented in these tables w ere compliled from operational records.
NOTES: These are preliminary records and open to revision.

Table 3
Fryingpan-Arkansas ProjectTransmountain Diversions
Water Year 2009Unit: Acre-Feet
Diversion Apr May Jun Jul Aug SepTotal
No Name 1,827 1,496 3,323Hunter 2,916 3,112 36 6,064Sawyer 1,751 2,513 768 5,032Midway 2,632 3,324 222 6,178
1Chapman 175 1,454 2,059 628 4,316South Fork 81 4,034 5,004 1,162 10,281
Subtotal 256 14,614 17,508 2,816 35,194Carter 103 1,619 2,043 1,041 4,806North Fork 345 484 97 926Mormon 8 1,694 2,277 512 4,491N. Cunningham 20 1,085 1,325 208 2,638
2M. Cunningham 2 1,014 1,724 355 3,095Ivanhoe 83 3,463 4,025 565 8,136Lily Pad 906 930 299 2,135Granite 912 1,482 379 2,773Fryingpan 371 7,414 7,085 2,630 17,500
Subtotal 932 18,591 20,988 5,989 46,500Total 1,188 33,205 38,496 8,805 81,694Boustead Tunnel3 759 4 32,817 40,452 8,634 38 3 82,703
1 Does not include No Name, Hunter, Sawyer and Midway
2 Includes South Cunningham
3 The difference between total diversion and Charles H. Boustead Tunnel results from the accuracy
limitations of the measurement.
4 Includes minimal flow from October through March 2009
Table 4Fryingpan-Arkansas Project Imports
Charles H. Boustead Tunnel OutletUnit: 1,000 Acre-feet
Accumulated Twin Lakes Available forYear Imports Imports Exchange Allocations
1972 32.0 32.0 0 0.01973 36.8 68.8 0 16.01974 34.1 102.9 0 18.61975 37.2 140.1 0 25.01976 26.9 167.0 0 24.01977 11.4 178.4 0 25.01978 49.2 227.6 0 25.01979 53.7 281.3 0 25.61980 55.7 337.0 0 70.01981 34.6 371.6 0 25.01982 75.2 446.8 2.7 68.01983 90.85 537.6 0.3 125.01984 110.16 647.7 1.9 210.01985 70.2 717.9 1.7 289.91986 30.3 748.2 1.5 300.31987 2.2 750.4 1.1 288.01988 13.4 763.8 2.0 247.81989 36.2 800.0 1.7 197.61990 46.6 846.6 1.7 142.11991 59.1 905.7 1.5 58.71992 54.8 960.5 1.2 32.91993 86.6 1,047.1 2.3 70.11994 52.2 1,099.3 1.3 51.71995 90.5 1,189.8 2.3 55.01996 36.9 1,226.7 1.8 110.01997 78.6 1,305.3 1.8 116.01998 51.3 1,356.6 2.6 102.01999 40.8 1,397.4 2.1 127.52000 44.8 1,442.2 1.7 171.62001 45.3 1,487.5 2.1 67.52002 13.2 1,500.7 1.5 8.52003 54.9 1,555.6 2.4 37.52004 27.4 1,583.0 1.3 15.32005 54.6 1,637.6 3.0 40.82006 61.2 1,698.8 3.0 49.22007 54.2 1,753.0 3.0 40.42008 90.0 1,843.0 3.0 83.02009 82.7 1,925.7 3.0 78.0
Restriction: Not to exceed 120,000 acre-feet in 1 year but not to exceed 2,352,800 acre-feet in 34consecutive years.
5 Includes 3,120 acre-feet imported through Twin Lakes Tunnel.
6 Includes 2,080 acre-feet imports through Boustead Tunnel in October and 420 acre-feet in November.All other years are water year totals.

Table 5Turquoise Lake
Water Year 2009 OperationsUnit: 1,000 Acre-Feet
_________________________________ Inflow______________________________
Busk-Ivanhoe Homestake Project Native Total Total End of Month WaterSurface
Imports Imports Imports Inflow Inflow Evap Outflow ContentElevation
(FEET)Through Through
Year Month Carlton Boustead
2008 Sep 105.2 9855.47Oct 0.1 0 0 0.1 0 0.2 0.3 1.0 104.0 9854.75Nov 0 0 0 0.1 0.2 0.3 0.2 1.0 103.1 9854.22Dec 0 0 0 0.1 0.8 0.9 0 7.0 96.9 9850.50
2009 Jan 0 0 0 0 1.9 1.9 0 21.5 77.4 9838.21Feb 0 0 0 0 1.2 1.2 0 15.9 62.7 9828.22Mar 0.1 0 18.0 0.1 1.5 19.7 0 22.2 60.3 9826.45Apr 0.1 0 16.4 0.5 2.5 19.5 0 21.6 58.2 9824.90May 0.6 0 3.0 32.8 12.3 48.7 0.3 16.3 90.2 9846.40Jun 0.4 0 9.2 40.4 12.3 62.3 0.5 25.3 126.7 9867.91Jul 0 0 3.9 8.6 5.2 17.7 0.7 21.2 122.6 9865.55Aug 0 0 0.1 0 1.5 1.6 0.7 1.5 122.0 9865.20Sep 0.1 0 0 0 0.2 0.3 0.3 1.0 120.9 9864.60
Subtotal 1.4 0
Total 1.4 0 50.6 82.7 39.6 174.3 3.0 155.5_______________________________________________________________________________________________________________________________________

Year Month
Twin Lakes/Mt. Elbert ForebayWater Year 2009 Operations
Unit: 1,000 Acre-Feet
________________________Inflow_______________________________Twin Lakes Native Total
Canal Company Mt. Elbert Conduit Inflow Inflow
ProjectImports Other Halfmoon Water
EvapTotalOutflow
End of MonthContent7
Table 6
Water Surface8Elevation
(FEET)
2008
2009
Subtotal
SepOctNovDec
JanFebMarAprMayJunJulAugSep
0.91.31.6
1.40.90.70.7
24.022.5
8.81.60.8
65.2
00.71.2
1.10.60.3
0000
0.40
4.3
000
0000
4.22.91.10.6
0
8.8
0.50.56.5
21.015.621.620.814.716.212.8
0.60
131.3
1.80.60.3
00.10.42.3
24.026.814.0
3.62.0
3.23.19.6
23.517.223.023.866.968.436.7
6.83.3
0.50.3
0
000
0.21.01.01.31.20.6
12.011.813.1
16.619.529.414.343.153.536.919.6
1.9
128.6119.6110.0105.1
109.4105.4
97.4105.5125.9136.4133.5119.9120.9
9192.409187.999183.449180.46
9182.499181.249177.289181.559190.599195.059193.799188.109188.55
Total 69.5 140.1 75.9 285.5 6.1 271.7
7
8
Contents of both Twin Lakes and Mt. Elbert Forebay
Elevation of Twin Lakes
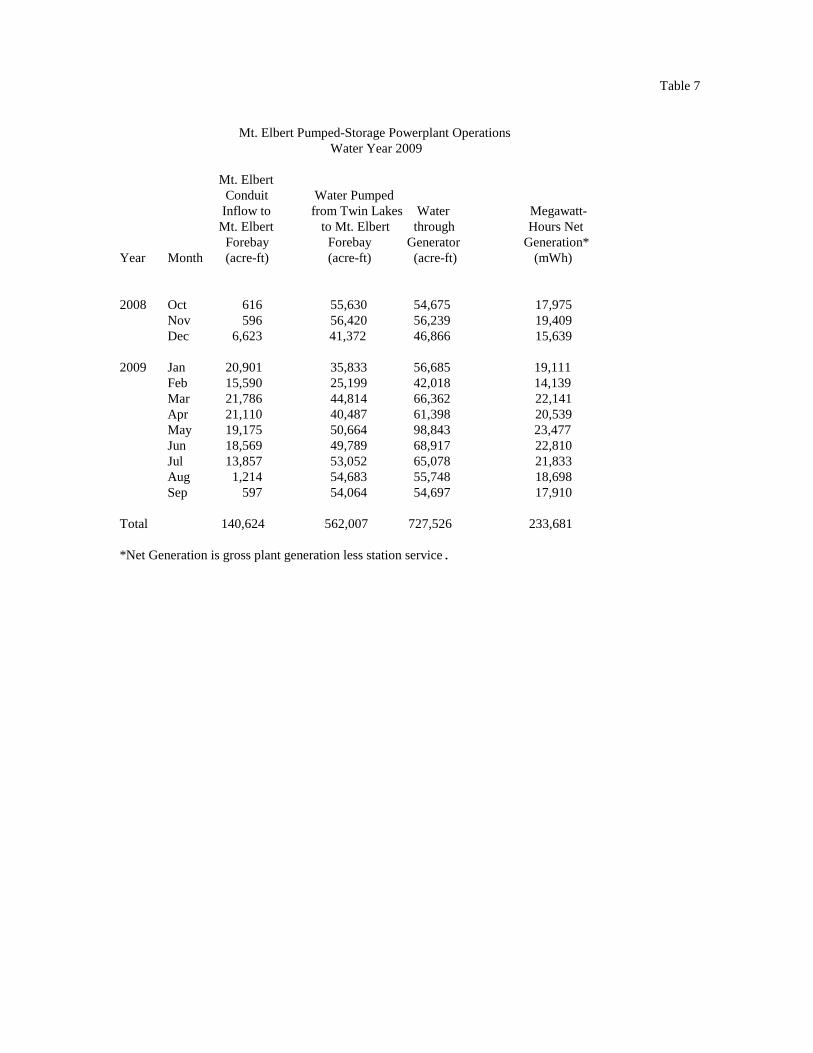
Table 7
Mt. Elbert Pumped-Storage Powerplant OperationsWater Year 2009
Mt. ElbertConduit Water Pumped
Inflow to from Twin Lakes Water Megawatt-Mt. Elbert to Mt. Elbert through Hours Net
Forebay Forebay Generator Generation*Year Month (acre-ft) (acre-ft) (acre-ft) (mWh)
2008 Oct 616 55,630 54,675 17,975Nov 596 56,420 56,239 19,409Dec 6,623 41,372 46,866 15,639
2009 Jan 20,901 35,833 56,685 19,111Feb 15,590 25,199 42,018 14,139Mar 21,786 44,814 66,362 22,141Apr 21,110 40,487 61,398 20,539May 19,175 50,664 98,843 23,477Jun 18,569 49,789 68,917 22,810Jul 13,857 53,052 65,078 21,833Aug 1,214 54,683 55,748 18,698Sep 597 54,064 54,697 17,910
Total 140,624 562,007 727,526 233,681
*Net Generation is gross plant generation less station service.

Year Month
_______________Inflow_________________Project TotalWater Other Native Inflow
Pueblo ReservoirWater Year 2009 Operations
Unit: 1,000 Acre-Feet
Evapo-ration Outflow
End of monthcontent
Water surfaceelevation(FEET)
Table 8
2008
2009
Subtotal
SepOctNovDec
JanFebMarAprMayJunJulAugSep
0.31.02.4
7.310.117.5
1.00.36.5
10.88.00.3
65.5
2.72.32.5
2.62.63.64.67.5
13.315.4
5.72.7
65.5
17.920.419.1
17.715.815.419.5
106.5131.8
66.920.613.6
465.2
20.923.724.0
27.628.536.525.1
114.3151.6
93.134.316.6
1.20.60.5
0.50.71.41.72.32.52.62.61.7
22.017.1
8.3
7.97.3
20.344.2
130.4139.3
92.151.622.8
178.6176.2182.4197.6
216.8237.3252.1231.3212.9222.6221.0201.1193.2
4861.164860.514862.214866.31
4871.184876.104879.434874.684870.214872.614872.204867.204865.13
Total 596.2 18.3 563.3

Table 9
Fryingpan-Arkansas ProjectReservoir Storage Allocation Data
Unit: Acre-Feet
TotalActive Joint Flood capacity
Reservoir Dead Inactive conservation use control storage
Ruedi 63 1,095 101,278 0 0 102,3731
Turquoise 2,810 8,920 120,478 0 0 129,3981
Pueblo 2,329 28,121 228,828 66,000 26,991 349,9402
Twin Lakes 63,324 72,938 67,917 0 0 140,855
Mt. ElbertForebay 561 3,825 7,318 0 0 11,1431
1 New area-capacity tables (1984)
2 New area-capacity table (1994)
Note: Inactive includes dead storage
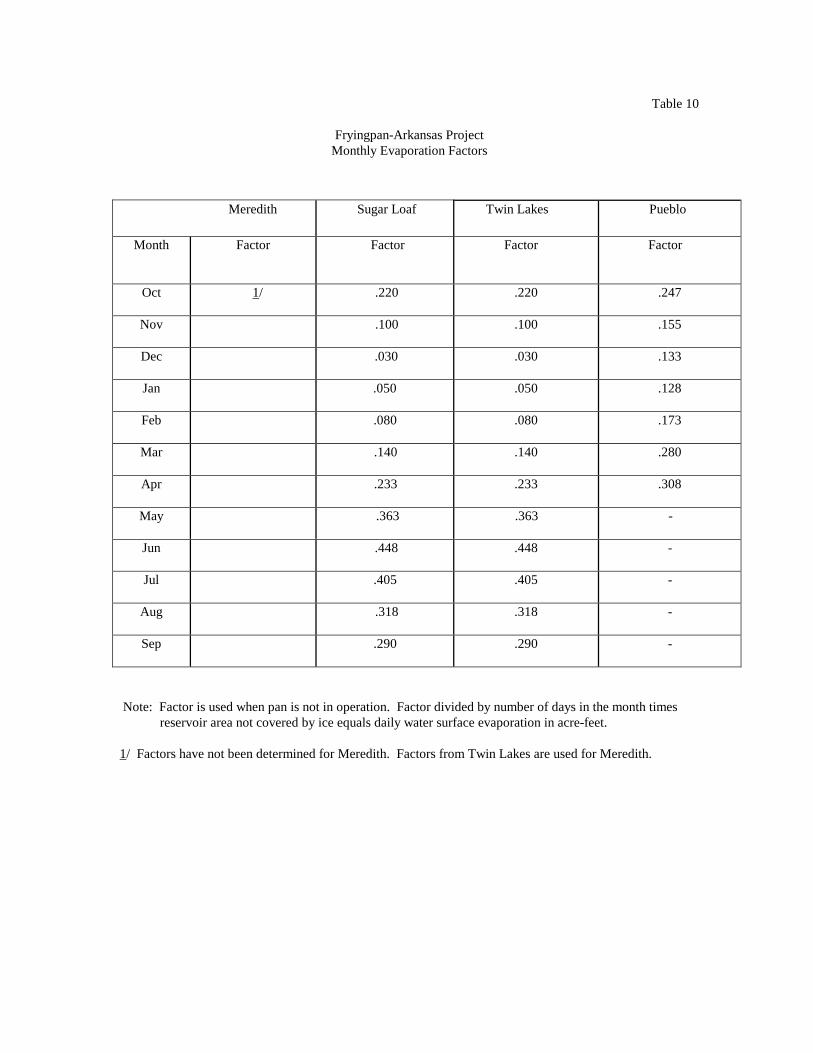
Table 10
Fryingpan-Arkansas ProjectMonthly Evaporation Factors
Meredith Sugar Loaf Twin Lakes Pueblo
Month Factor Factor Factor Factor
Oct 1/ .220 .220 .247
Nov .100 .100 .155
Dec .030 .030 .133
Jan .050 .050 .128
Feb .080 .080 .173
Mar .140 .140 .280
Apr .233 .233 .308
May .363 .363 -
Jun .448 .448 -
Jul .405 .405 -
Aug .318 .318 -
Sep .290 .290 -
Note: Factor is used when pan is not in operation. Factor divided by number of days in the month timesreservoir area not covered by ice equals daily water surface evaporation in acre-feet.
1/ Factors have not been determined for Meredith. Factors from Twin Lakes are used for Meredith.

Table 11
Fryingpan-Arkansas ProjectMonthly Average vs. Current Water Year Evaporation
(Unit = Inches)
Meredith Sugar Loaf Twin Lakes Pueblo
Ave Ave Ave AveMonth
Pan WY 09 WY 09 Pan WY 09 Pan WY 09(In.) Pan (In.) (In.)
(In.)
Oct 0.89 2.34 3.44 2.73 3.67 5.36 5.82
Nov 0 1.57 1.70 1.70 1.89 2.63 2.66
Dec 0 0.30 0.53 0.37 0.53 2.28 2.28
Jan 0.21 0 0.85 0 0.85 2.19 2.19
Feb 0 0 1.39 0 1.39 2.98 2.97
Mar 0 0.30 2.39 0.54 2.39 4.86 5.58
Apr 0.21 0.62 4.01 1.85 4.01 6.36 6.60
May 2.33 3.09 1.66 3.45 4.57 5.97 8.79 9.79
Jun 7.49 10.82 5.47 4.64 7.36 5.31 10.17 10.86
Jul 7.60 10.06 5.25 5.48 6.79 7.45 10.94 11.26
Aug 6.06 7.23 4.21 6.29 5.58 7.51 9.00 11.58
Sep 4.02 4.26 3.45 2.16 4.87 3.42 7.34 7.73

Table 12
Fryingpan-Arkansas ProjectMonthly Average Vs. Current Water Year Precipitation
(Unit = Inches)
Month
Meredith Sugar Loaf Twin Lakes Pueblo Rocky Ford
Avg. WY 09 Avg. WY 09 Avg. WY 09 Avg. WY 09 Avg. WY 09
Oct 1.46 0.37 0.97 0.80 0.64 0.43 0.65 0.47 0.78 1.70
Nov 1.11 0.04 1.28 1.58 0.51 0.18 0.54 0.30 0.46 0.22
Dec 1.22 0.05 1.23 2.26 0.47 1.06 0.37 0.64 0.32 0.17
Jan 1.20 1.13 1.43 3.41 0.40 0.25 0.28 0.04 0.26 0.01
Feb 1.01 1.30 1.21 0.98 0.49 0.40 0.25 0.03 0.29 0.00
Mar 1.13 1.53 1.46 1.38 0.73 0.28 0.85 0.29 0.68 0.83
Apr 1.26 2.60 1.42 1.00 0.76 0.39 1.36 1.47 1.32 0.68
May 1.38 2.10 1.27 3.06 0.92 1.95 1.58 0.63 1.83 1.27
Jun 1.38 1.13 1.15 1.29 0.87 1.39 1.34 0.85 1.40 1.63
Jul 1.63 1.40 1.97 2.45 1.59 1.11 1.94 1.63 1.97 2.73
Aug 1.73 0.81 2.01 0.58 1.51 0.37 1.93 1.60 1.54 0.87
Sep 1.64 0.91 1.35 2.12 0.96 1.95 0.93 0.79 0.90 0.63
Total 16.15 13.37 16.75 20.91 9.85 9.76 12.02 8.74 11.75 10.74
Max.Annual
26.70 (1984) 25.95 (1957) 17.27 (1952) 20.32 (2007) 22.75 (1999)
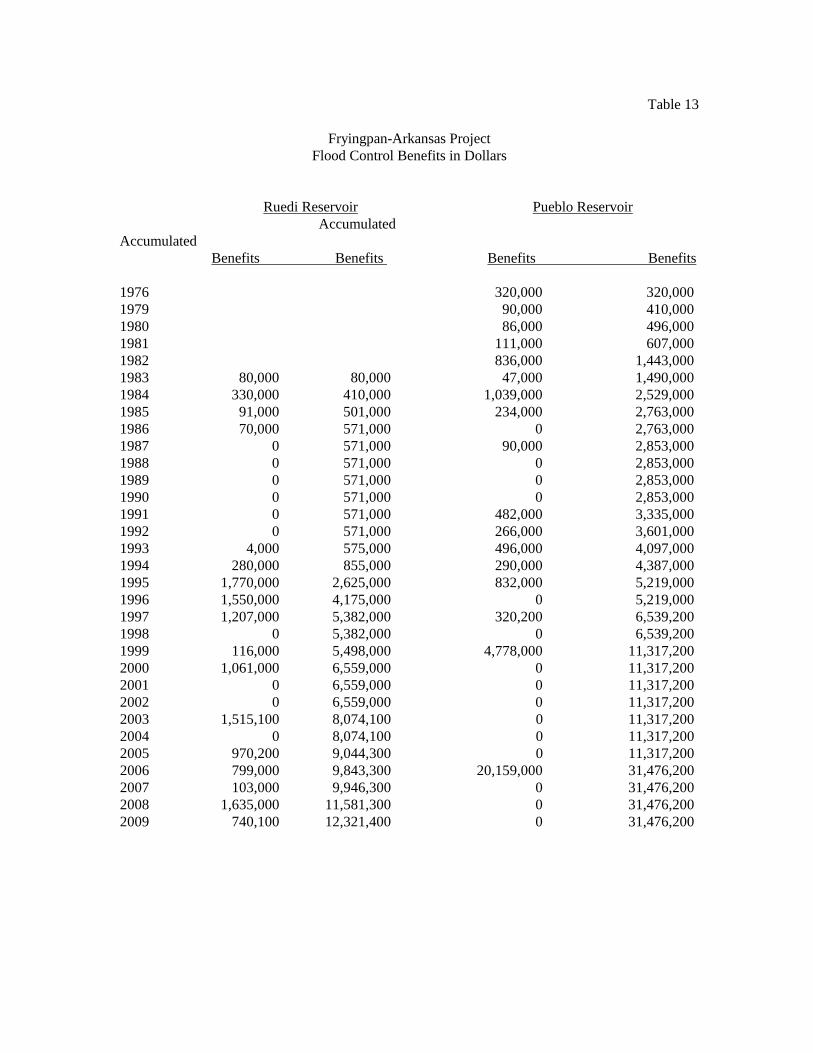
Table 13
Fryingpan-Arkansas ProjectFlood Control Benefits in Dollars
Ruedi Reservoir Pueblo ReservoirAccumulated
AccumulatedBenefits Benefits Benefits Benefits
1976 320,000 320,0001979 90,000 410,0001980 86,000 496,0001981 111,000 607,0001982 836,000 1,443,0001983 80,000 80,000 47,000 1,490,0001984 330,000 410,000 1,039,000 2,529,0001985 91,000 501,000 234,000 2,763,0001986 70,000 571,000 0 2,763,0001987 0 571,000 90,000 2,853,0001988 0 571,000 0 2,853,0001989 0 571,000 0 2,853,0001990 0 571,000 0 2,853,0001991 0 571,000 482,000 3,335,0001992 0 571,000 266,000 3,601,0001993 4,000 575,000 496,000 4,097,0001994 280,000 855,000 290,000 4,387,0001995 1,770,000 2,625,000 832,000 5,219,0001996 1,550,000 4,175,000 0 5,219,0001997 1,207,000 5,382,000 320,200 6,539,2001998 0 5,382,000 0 6,539,2001999 116,000 5,498,000 4,778,000 11,317,2002000 1,061,000 6,559,000 0 11,317,2002001 0 6,559,000 0 11,317,2002002 0 6,559,000 0 11,317,2002003 1,515,100 8,074,100 0 11,317,2002004 0 8,074,100 0 11,317,2002005 970,200 9,044,300 0 11,317,2002006 799,000 9,843,300 20,159,000 31,476,2002007 103,000 9,946,300 0 31,476,2002008 1,635,000 11,581,300 0 31,476,2002009 740,100 12,321,400 0 31,476,200
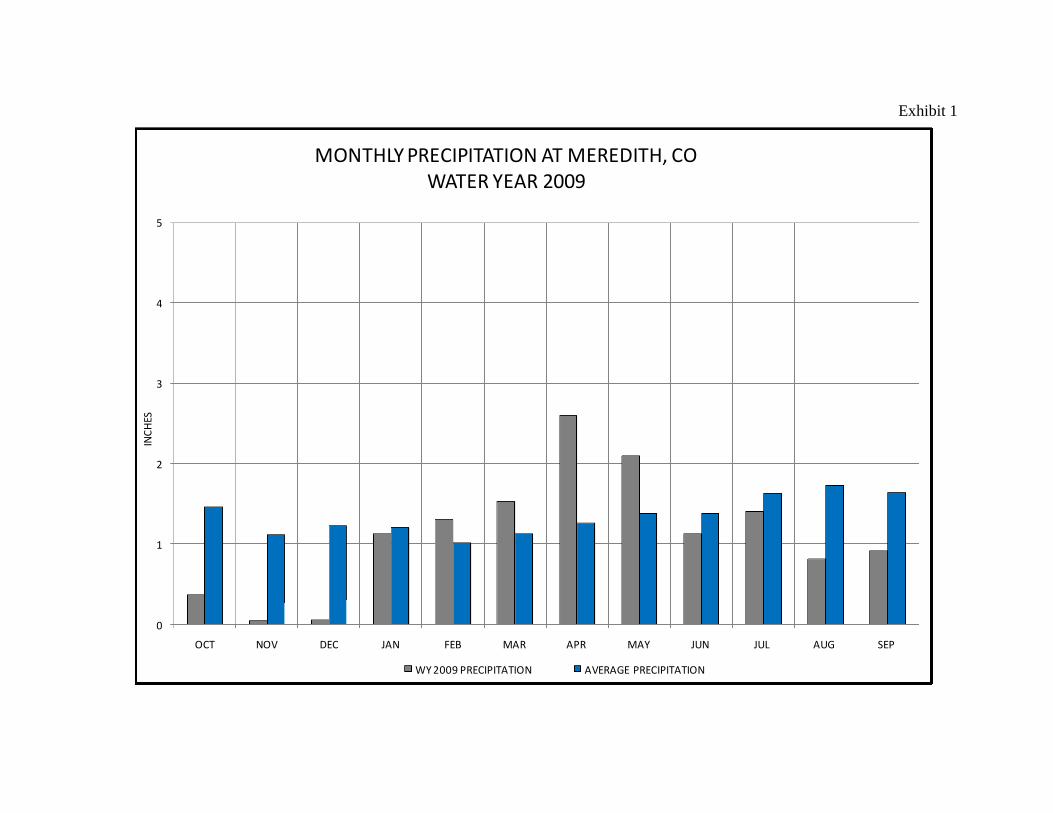
Exhibit 1
0
1
2
3
4
5
OCT NOV DEC JAN FEB MAR APR MAY JUN JUL AUG SEP
INC
HES
MONTHLY PRECIPITATION AT MEREDITH, COWATER YEAR 2009
WY 2009 PRECIPITATION AVERAGE PRECIPITATION
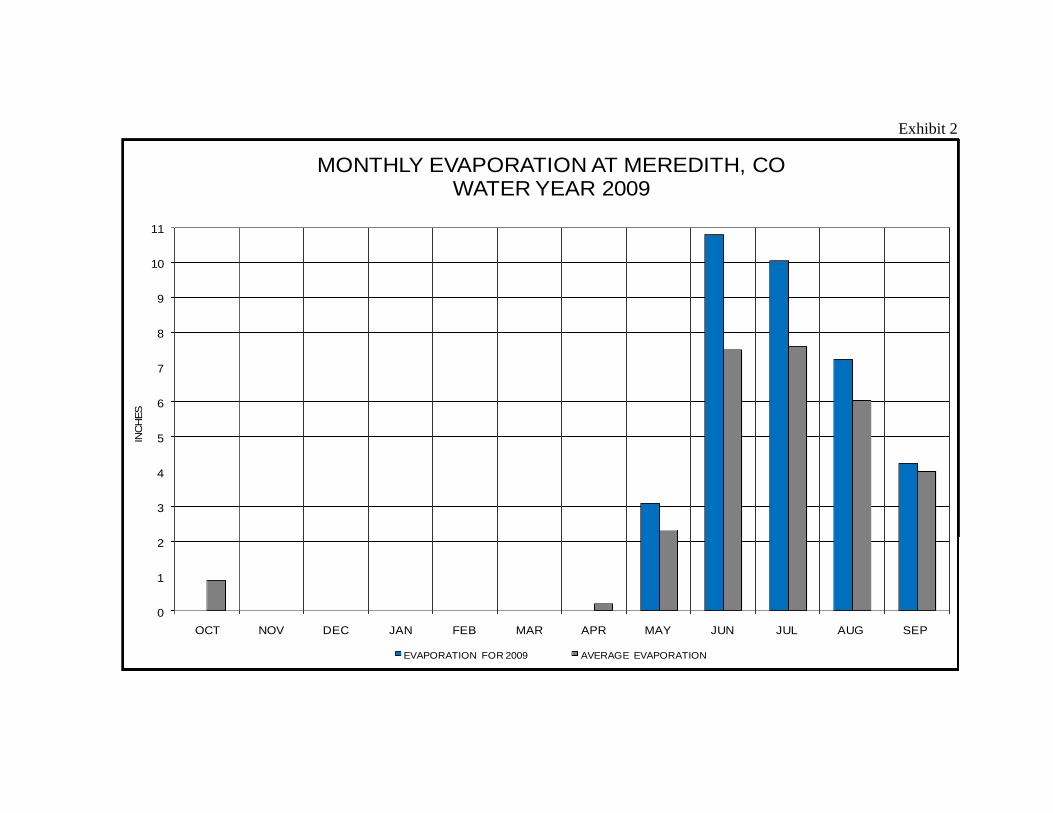
Exhibit 2
0
1
2
3
4
5
6
7
8
9
10
11
OCT NOV DEC JAN FEB MAR APR MAY JUN JUL AUG SEP
INC
HES
MONTHLY EVAPORATION AT MEREDITH, COWATER YEAR 2009
EVAPORATION FOR 2009 AVERAGE EVAPORATION

Exhibit 3
0
20000
40000
60000
80000
100000
120000
0
5000
10000
15000
20000
25000
30000
35000
40000
45000
OCT NOV DEC JAN FEB MAR APR MAY JUN JUL AUG SEP
ST
OR
AG
EIN
AC
RE
-FE
ET
AC
RE
-FE
ETRUEDI RESERVOIR
WATER YEAR 2009 ACTUAL OPERATIONS
INFLOW OUTFLOW STORAGE

Exhibit 4
0
50
100
150
200
250
300
350
400
OCT NOV DEC JAN FEB MAR APR MAY JUN JUL AUG SEP
CFS
FRYINGPAN RIVER NEAR THOMASVILLEWATER YEAR 2009

Exhibit 5
0
5000
10000
15000
20000
25000
30000
35000
40000
45000
OCT NOV DEC JAN FEB MAR APR MAY JUN JUL AUG SEP
AC
RE
-FE
ET
BOUSTEAD TUNNEL IMPORTSWATER YEAR 2009

Exhibit 6
0
2000
4000
6000
8000
10000
12000
14000
16000
18000
20000
OCT NOV DEC JAN FEB MAR APR MAY JUN JUL AUG SEP
AC
RE-F
EET
HOMESTAKE TUNNEL IMPORTSWATER YEAR 2009

Exhibit 7
0
100
200
300
400
500
600
700
OCT NOV DEC JAN FEB MAR APR MAY JUN JUL AUG SEP
AC
RE
-FE
ET
BUSK-IVANHOE TUNNEL IMPORTSWATER YEAR 2009

Exhibit 8
0
1
2
3
4
5
OCT NOV DEC JAN FEB MAR APR MAY JUN JUL AUG SEP
INC
HE
S
MONTHLY PRECIPITATION AT SUGAR LOAF DAMWATER YEAR 2009
WY 2009 PRECIPITATION AVERAGE PRECIPITATION

Exhibit 9
0
1
2
3
4
5
6
7
8
9
10
OCT NOV DEC JAN FEB MAR APR MAY JUN JUL AUG SEP
INC
HE
SMONTHLY EVAPORATION AT SUGARLOAF DAM
WATER YEAR 2009
WY 2009 EVAPORATION AVERAGE EVAPORATION
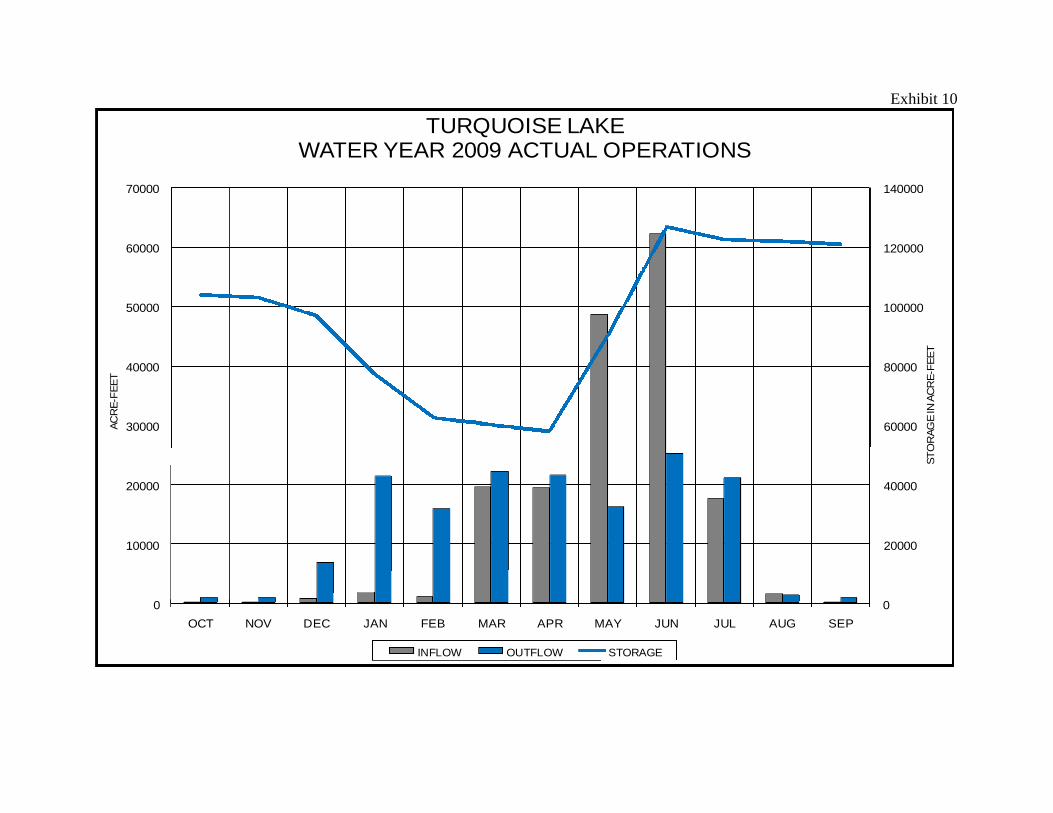
Exhibit 10
0
20000
40000
60000
80000
100000
120000
140000
0
10000
20000
30000
40000
50000
60000
70000
OCT NOV DEC JAN FEB MAR APR MAY JUN JUL AUG SEP
ST
OR
AG
EIN
AC
RE
-FE
ET
AC
RE
-FE
ET
TURQUOISE LAKEWATER YEAR 2009 ACTUAL OPERATIONS
INFLOW OUTFLOW STORAGE
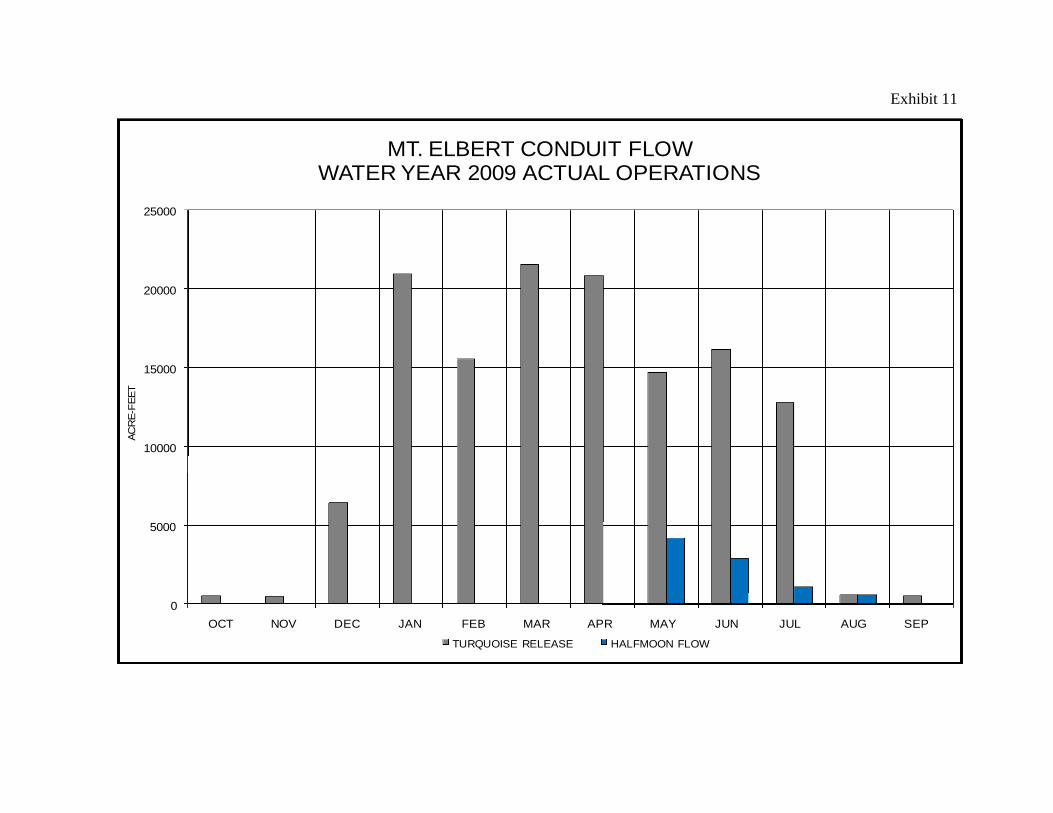
Exhibit 11
0
5000
10000
15000
20000
25000
OCT NOV DEC JAN FEB MAR APR MAY JUN JUL AUG SEP
AC
RE
-FE
ET
MT. ELBERT CONDUIT FLOWWATER YEAR 2009 ACTUAL OPERATIONS
TURQUOISE RELEASE HALFMOON FLOW

Exhibit 12
0
1
2
3
OCT NOV DEC JAN FEB MAR APR MAY JUN JUL AUG SEP
INC
HE
SMONTHLY PRECIPITATION AT TWIN LAKES DAM
WATER YEAR 2009
WY 2009 PRECIPITATION AVERAGE PRECIPITATION

Exhibit 13
0
1
2
3
4
5
6
7
8
9
10
11
OCT NOV DEC JAN FEB MAR APR MAY JUN JUL AUG SEP
INC
HE
SMONTHLY EVAPORATION AT TWIN LAKES DAM
WATER YEAR 2009
WY 2009 EVAPORATION AVERAGE EVAPORATION

Exhibit 14
0
20000
40000
60000
80000
100000
120000
140000
160000
0
10000
20000
30000
40000
50000
60000
70000
OCT NOV DEC JAN FEB MAR APR MAY JUN JUL AUG SEP
ST
OR
AG
EIN
AC
RE
-FE
ET
AC
RE
-FE
ET
TWIN LAKESWATER YEAR 2009 ACTUAL OPERATIONS
INFLOW OUTFLOW STORAGE

Exhibit 15
0
1
2
3
OCT NOV DEC JAN FEB MAR APR MAY JUN JUL AUG SEP
INC
HE
SMONTHLY PRECIPITATION AT PUEBLO RESERVOIR
WATER YEAR 2009
WY 2009 PRECIPITATION AVERAGE PRECIPITATION
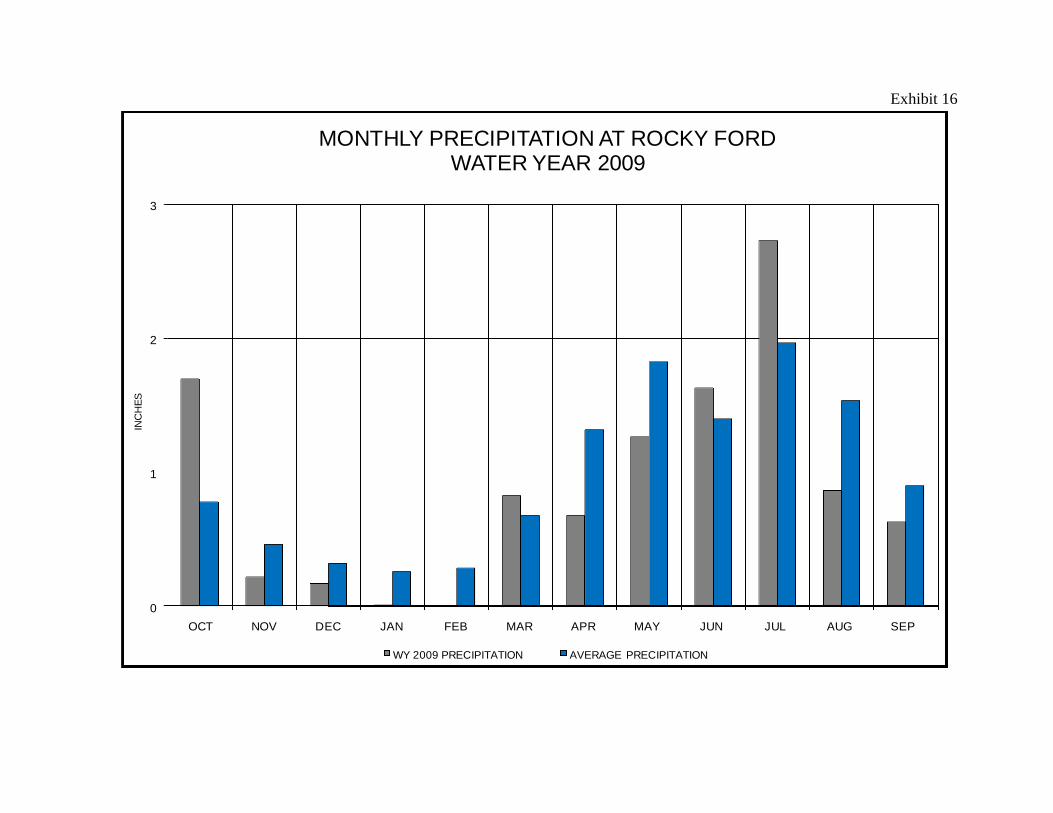
Exhibit 16
0
1
2
3
OCT NOV DEC JAN FEB MAR APR MAY JUN JUL AUG SEP
INC
HE
SMONTHLY PRECIPITATION AT ROCKY FORD
WATER YEAR 2009
WY 2009 PRECIPITATION AVERAGE PRECIPITATION

Exhibit 17
0
2000
4000
6000
8000
10000
12000
14000
16000
OCT NOV DEC JAN FEB MAR APR MAY JUN JUL AUG SEP
AC
RE
-FE
ET
PUEBLO RESERVOIR WINTER WATER STORAGEWATER YEAR 2009

Exhibit 18
0
2000
4000
6000
8000
10000
12000
14000
16000
OCT NOV DEC JAN FEB MAR APR MAY JUN JUL AUG SEP
AC
RE
-FE
ET
PUEBLO RESERVOIR WINTER WATER RELEASESWATER YEAR 2009

Exhibit 19
0
1
2
3
4
5
6
7
8
9
10
11
12
13
14
15
OCT NOV DEC JAN FEB MAR APR MAY JUN JUL AUG SEP
INC
HE
SMONTHLY EVAPORATION AT PUEBLO DAM
WATER YEAR 2009
WY 2009 EVAPORATION AVERAGE EVAPORATION
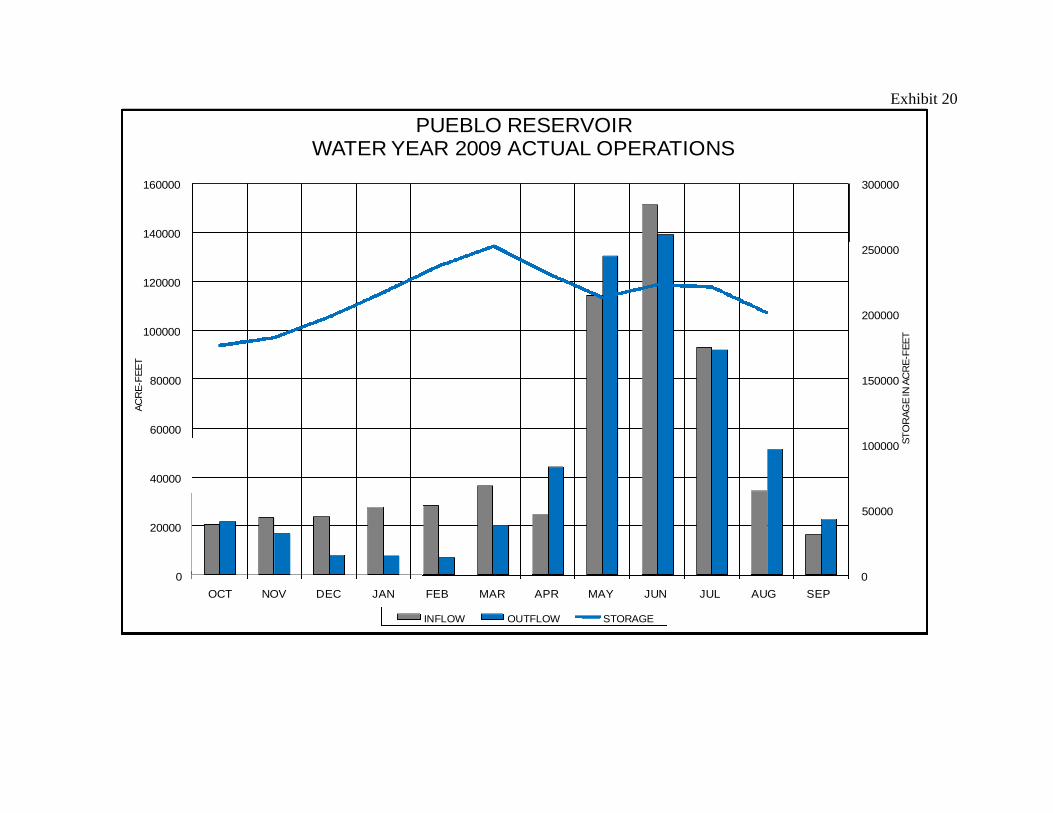
Exhibit 20
0
50000
100000
150000
200000
250000
300000
0
20000
40000
60000
80000
100000
120000
140000
160000
OCT NOV DEC JAN FEB MAR APR MAY JUN JUL AUG SEP
ST
OR
AG
EIN
AC
RE
-FE
ET
AC
RE
-FE
ET
PUEBLO RESERVOIRWATER YEAR 2009 ACTUAL OPERATIONS
INFLOW OUTFLOW STORAGE

Exhibit 21
0
2000
4000
6000
8000
10000
12000
14000
16000
OCT NOV DEC JAN FEB MAR APR MAY JUN JUL AUG SEP
AC
RE
-FE
ET
PUEBLO RESERVOIR PROJECT WATER RELEASESWATER YEAR 2009
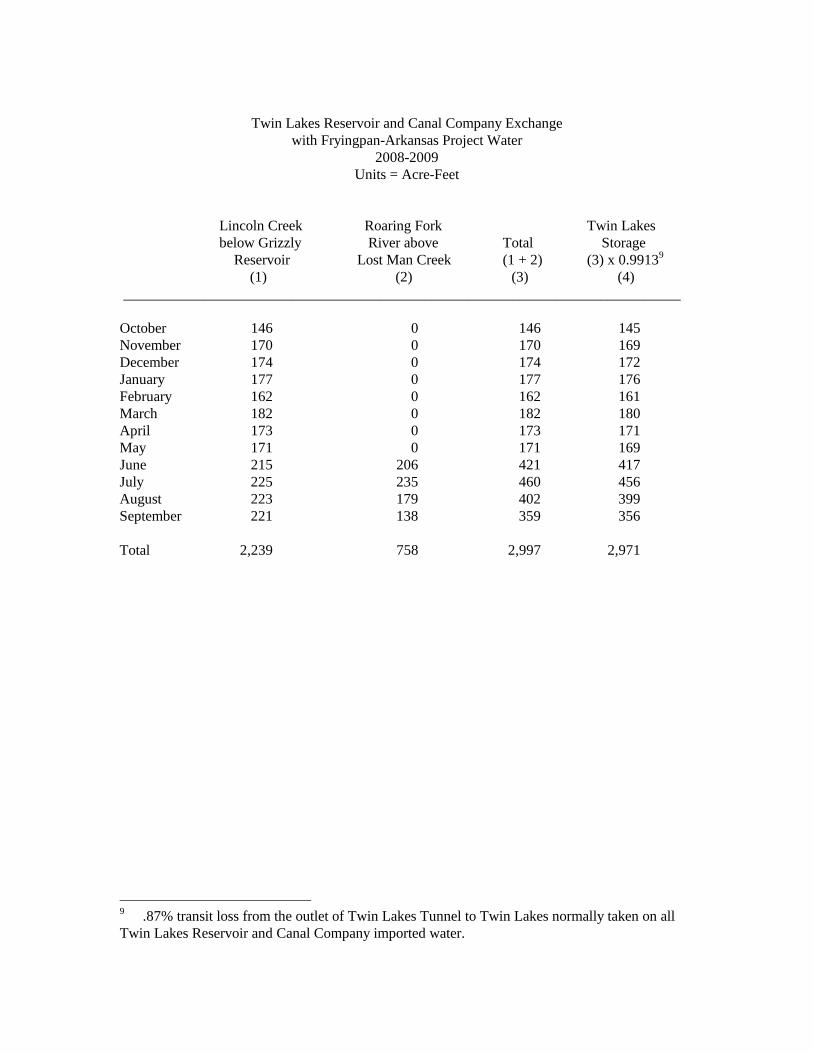
Twin Lakes Reservoir and Canal Company Exchangewith Fryingpan-Arkansas Project Water
2008-2009Units = Acre-Feet
Lincoln Creek Roaring Fork Twin Lakesbelow Grizzly River above Total
Reservoir Lost Man Creek (1 + 2)Storage
(3) x 0.99139
(1) (2) (3) (4)____________________________________________________________________________
October 146 0 146 145November 170 0 170 169December 174 0 174 172January 177 0 177 176February 162 0 162 161March 182 0 182 180April 173 0 173 171May 171 0 171 169June 215 206 421 417July 225 235 460 456August 223 179 402 399September 221 138 359 356
Total
9 .87% tranTwin Lakes R
2,239 758 2,997
sit loss from the outlet of Twin Lakes Tunnel to Twin Lakes normally taken on alleservoir and Canal Company imported water.
2,971
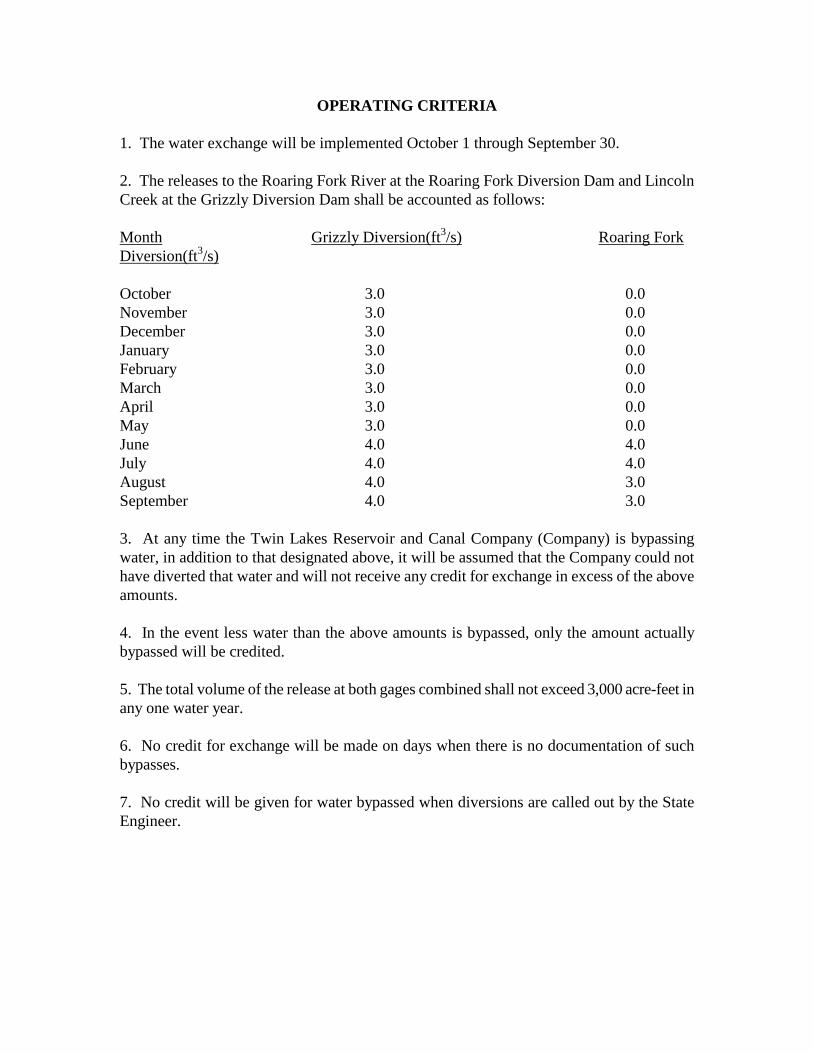
OPERATING CRITERIA
1. The water exchange will be implemented October 1 through September 30.
2. The releases to the Roaring Fork River at the Roaring Fork Diversion Dam and LincolnCreek at the Grizzly Diversion Dam shall be accounted as follows:
Month Grizzly Diversion(ft3/s) Roaring ForkDiversion(ft3/s)
October 3.0 0.0November 3.0 0.0December 3.0 0.0January 3.0 0.0February 3.0 0.0March 3.0 0.0April 3.0 0.0May 3.0 0.0June 4.0 4.0July 4.0 4.0August 4.0 3.0September 4.0 3.0
3. At any time the Twin Lakes Reservoir and Canal Company (Company) is bypassingwater, in addition to that designated above, it will be assumed that the Company could nothave diverted that water and will not receive any credit for exchange in excess of the aboveamounts.
4. In the event less water than the above amounts is bypassed, only the amount actuallybypassed will be credited.
5. The total volume of the release at both gages combined shall not exceed 3,000 acre-feet inany one water year.
6. No credit for exchange will be made on days when there is no documentation of suchbypasses.
7. No credit will be given for water bypassed when diversions are called out by the StateEngineer.

0
0.5
1
1.5
2
2.5
3
3.5
4
4.5
OCT NOV DEC JAN FEB MAR APR MAY JUN JUL AUG SEP
CF
SLINCOLN CREEK BELOW GRIZZLY RESERVOIR
WATER YEAR 2009

0
0.5
1
1.5
2
2.5
3
3.5
4
4.5
OCT NOV DEC JAN FEB MAR APR MAY JUN JUL AUG SEP
CF
SROARING FORK ABOVE LOST MAN
WATER YEAR 2009

0
5000
10000
15000
20000
25000
30000
35000
OCT NOV DEC JAN FEB MAR APR MAY JUN JUL AUG SEP
AC
RE
-FE
ET
TWIN LAKES TUNNEL IMPORTSWATER YEAR 2009

0
10000
20000
30000
40000
50000
60000
OCT NOV DEC JAN FEB MAR APR MAY JUN JUL AUG SEP
MAXIMUM CONTENT
AC
RE
-FE
ET
TWIN LAKES CANAL COMPANY STORAGEWATER YEAR 2009
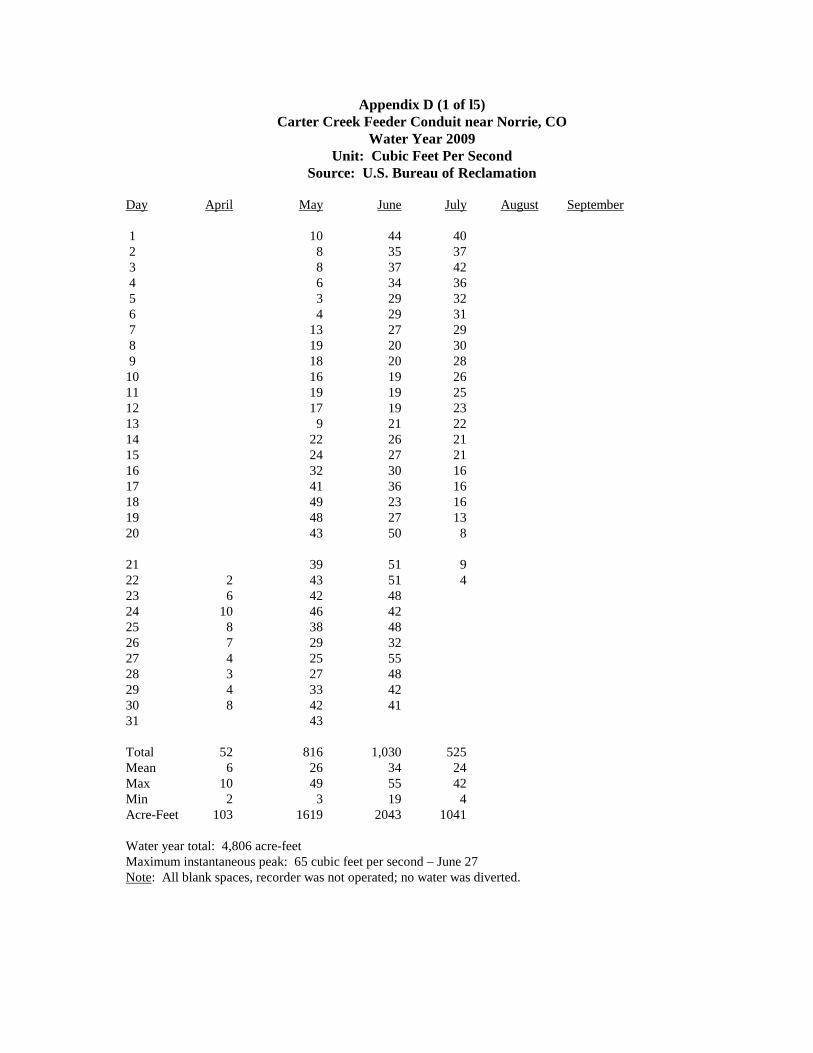
Appendix D (1 of l5)Carter Creek Feeder Conduit near Norrie, CO
Water Year 2009Unit: Cubic Feet Per Second
Source: U.S. Bureau of Reclamation
Day April May June July August September
1 10 44 402 8 35 373 8 37 424 6 34 365 3 29 326 4 29 317 13 27 298 19 20 309 18 20 28
10 16 19 2611 19 19 2512 17 19 2313 9 21 2214 22 26 2115 24 27 2116 32 30 1617 41 36 1618 49 23 1619 48 27 1320 43 50 8
21 39 51 922 2 43 51 423 6 42 4824 10 46 4225 8 38 4826 7 29 3227 4 25 5528 3 27 4829 4 33 4230 8 42 4131 43
Total 52 816 1,030 525Mean 6 26 34 24Max 10 49 55 42Min 2 3 19 4Acre-Feet 103 1619 2043 1041
Water year total: 4,806 acre-feetMaximum instantaneous peak: 65 cubic feet per second – June 27Note: All blank spaces, recorder was not operated; no water was diverted.

Appendix D (2 of l5)North Fork Fryingpan River Feeder Conduit near Norrie, CO
Water Year 2009Unit: Cubic Feet Per Second
Source: U.S. Bureau of Reclamation
Day April May June July August September
1 10 62 9 63 9 54 9 65 8 56 8 57 8 48 6 39 6 2
10 6 111 6 112 4 6 113 6 9 114 6 9 115 6 7 116 8 6 117 9 618 10 719 11 1020 11 1021 11 922 10 923 11 924 11 925 10 926 8 927 7 1028 7 1029 8 930 10 631 10
Total 174 244 49Mean 9 8 3Max 11 10 6Min 4 6 1Acre-Feet 345 484 97
Water year total: 926 acre-feetMaximum instantaneous peak: 12 cubic feet per second – May 19Note: All blank spaces, recorder was not operated; no water was diverted.

Appendix D (3 of l5)Mormon Creek Feeder Conduit near Norrie, CO
Water Year 2009Unit: Cubic Feet Per Second
Source: U.S. Bureau of Reclamation
Day April May June July August September
1 5 43 292 6 36 283 6 36 294 5 38 245 2 37 206 3 38 187 10 32 168 16 26 139 16 27 12
10 14 26 1011 17 26 1012 23 26 913 26 35 814 25 36 715 28 34 616 35 37 517 42 40 418 47 37 319 43 45 320 49 51 321 44 50 122 43 4823 47 4524 51 4625 39 4926 31 4327 28 5628 28 4029 35 3430 4 42 3131 48
Total 4 854 1148 258Mean 4 28 38 12Max 4 51 56 29Min 4 5 26 1Acre-Feet 8 1694 2277 512
Water year total: 4,491 acre-feetMaximum instantaneous peak: 81 cubic feet per second – June 27Note: All blank spaces, recorder was not operated; no water was diverted.

Appendix D (4 of l5)North Cunningham Feeder Conduit near Norrie, CO
Water Year 2009Unit: Cubic Feet Per Second
Source: U.S. Bureau of Reclamation
Day April May June July August September
1 6 25 152 6 21 143 5 23 144 5 25 115 3 23 96 3 23 77 8 20 68 13 17 59 13 18 4
10 11 17 411 12 17 312 17 16 313 18 22 314 18 22 315 20 21 216 22 22 117 25 25 118 26 2119 28 1820 28 2221 25 3222 25 2723 31 2624 30 2625 22 2626 1 19 2627 1 17 2828 1 18 2329 2 21 2030 5 25 1631 27
Total 10 547 668 105Mean 2 18 22 6Max 5 31 32 15Min 1 3 16 1Acre-Feet 20 1085 1325 208
Water year total: 2,638 acre-feetMaximum instantaneous peak: 46 cubic feet per second – May 24Note: All blank spaces, recorder was not operated; no water was diverted.

Appendix D (5 of l5)Middle Cunningham Feeder Conduit near Norrie, CO
Water Year 2009Unit: Cubic Feet Per Second
Source: U.S. Bureau of Reclamation
Day April May June July August September
1 2 32 222 2 30 213 2 32 204 2 32 175 1 29 146 2 29 127 3 25 118 5 21 99 4 21 8
10 4 20 711 3 20 712 7 19 613 11 21 514 11 23 515 14 25 316 18 27 317 23 30 218 29 28 219 31 33 220 31 37 221 29 37 122 28 3623 33 3524 34 3625 27 3726 22 3827 20 3628 22 3029 27 2630 1 31 2431 33
Total 1 511 869 179Mean 1 16 29 9Max 1 34 38 22Min 1 1 19 1Acre-Feet 2 1014 1724 355
Water year total: 3,095 acre-feetMaximum instantaneous peak: 48 cubic feet per second – June 26Note: All blank spaces, recorder was not operated; no water was diverted.

Appendix D (6 of l5)Ivanhoe Creek Feeder Conduit near Norrie, CO
Water Year 2009Unit: Cubic Feet Per Second
Source: U.S. Bureau of Reclamation
Day April May June July August September
1 16 87 432 17 82 393 17 87 394 14 82 375 8 73 356 11 70 287 22 62 238 33 55 169 36 51 9
10 37 48 211 44 45 212 58 41 213 56 57 114 54 67 115 57 55 116 67 39 117 79 36 118 93 50 119 88 54 120 87 65 121 74 91 122 2 67 84 123 2 72 8324 3 78 8325 4 60 8526 5 49 9027 4 64 9028 4 101 8329 6 103 7430 12 95 6031 89
Total 42 1746 2029 285Mean 5 56 68 13Max 12 103 91 43Min 2 8 36 1Acre-Feet 83 3463 4025 565
Water year total: 8,136 acre-feetMaximum instantaneous peak: 131 cubic feet per second – May 29Note: All blank spaces, recorder was not operated; no water was diverted.

Appendix D (7 of l5)Lily Pad Creek Feeder Conduit near Norrie, CO
Water Year 2008Unit: Cubic Feet Per Second
Source: U.S. Bureau of Reclamation
Day April May June July August September
1 22 112 21 113 21 124 21 105 20 96 20 9
7 16 88 6 15 79 9 14 6
10 11 14 611 12 14 612 13 14 613 14 15 614 15 15 515 16 14 516 18 14 517 22 14 518 26 15 519 30 15 520 29 15 421 24 15 422 23 14 323 22 14 324 24 1425 22 1426 19 1527 17 1628 18 1429 21 1330 23 1131 23
Total 457 469 151Mean 19 16 7Max 30 22 12Min 6 11 3Acre-Feet 906 930 299
Water year total: 2,135 acre-feetMaximum instantaneous peak: 37 cubic feet per second – May 19Note: All blank spaces, recorder was not operated; no water was diverted.
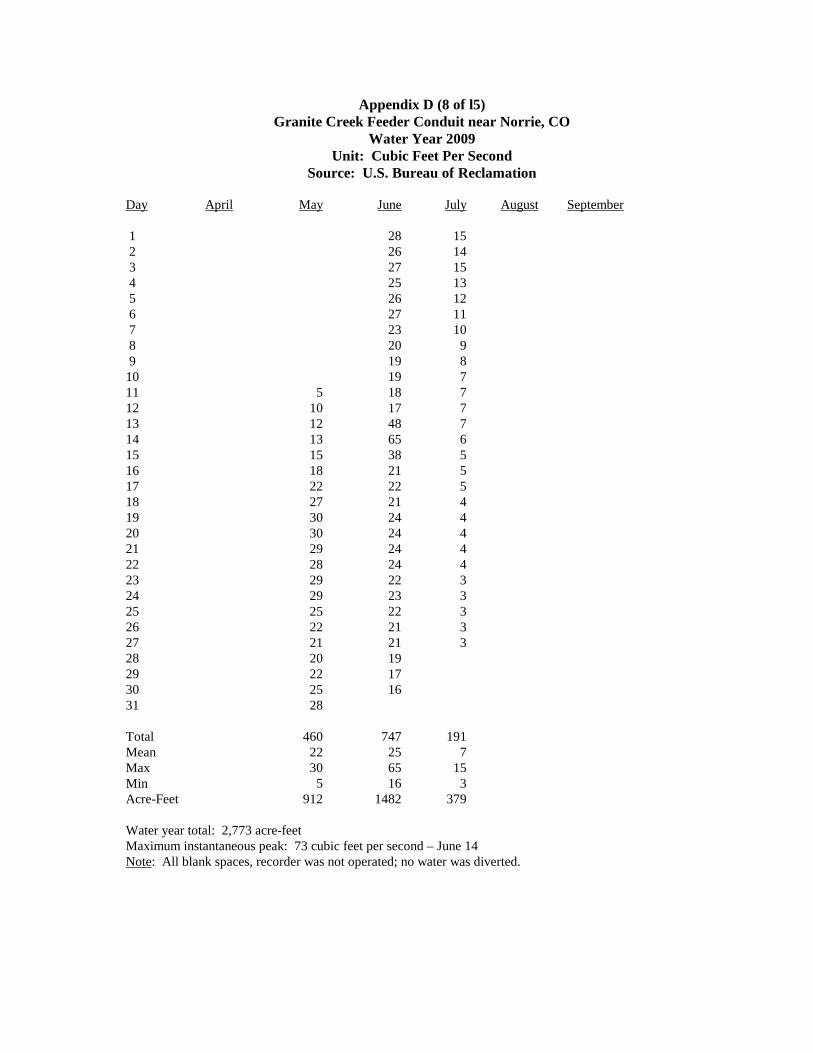
Appendix D (8 of l5)Granite Creek Feeder Conduit near Norrie, CO
Water Year 2009Unit: Cubic Feet Per Second
Source: U.S. Bureau of Reclamation
Day April May June July August September
1 28 152 26 143 27 154 25 135 26 126 27 117 23 108 20 99 19 8
10 19 711 5 18 712 10 17 713 12 48 714 13 65 615 15 38 516 18 21 517 22 22 518 27 21 419 30 24 420 30 24 421 29 24 422 28 24 423 29 22 324 29 23 325 25 22 326 22 21 327 21 21 328 20 1929 22 1730 25 1631 28
Total 460 747 191Mean 22 25 7Max 30 65 15Min 5 16 3Acre-Feet 912 1482 379
Water year total: 2,773 acre-feetMaximum instantaneous peak: 73 cubic feet per second – June 14Note: All blank spaces, recorder was not operated; no water was diverted.

Appendix D (9 of l5)No Name Creek Feeder Conduit near Norrie, CO
Water Year 2009Unit: Cubic Feet Per Second
Source: U.S. Bureau of Reclamation
Day April May June July August September
1 282 2 273 274 255 316 297 278 16 249 20 24
10 22 2311 30 2312 41 2413 46 2814 48 2715 49 2516 41 2517 45 2518 28 2719 28 3020 49 3121 53 3322 59 3023 60 2824 57 2925 41 3326 33 3527 31 2728 31 929 3130 3031 30
Total 921 754Mean 37 27Max 60 35Min 2 9Acre-Feet 1827 1496
Water year total: 3,323 acre-feetMaximum instantaneous peak: 82 cubic feet per second – May 20Note: All blank spaces, recorder was not operated; no water was diverted.

Appendix D (10 of l5)Midway Creek Feeder Conduit near Norrie, CO
Water Year 2009Unit: Cubic Feet Per Second
Source: U.S. Bureau of Reclamation
Day April May June July August September
1 742 4 653 2 674 605 666 647 50 148 19 50 219 18 52 18
10 22 49 1411 31 47 1212 42 48 1113 45 66 1014 47 59 815 53 58 416 63 6017 71 6518 53 6719 46 7120 47 7121 61 7522 83 7323 83 7224 85 7325 73 7526 56 6527 50 3428 5529 6430 7431 80
Total 1327 1676 112Mean 51 62 12Max 85 75 21Min 2 34 4Acre-Feet 2632 3324 222
Water year total: 6,178 acre-feetMaximum instantaneous peak: 111 cubic feet per second – May 23Note: All blank spaces, recorder was not operated; no water was diverted.
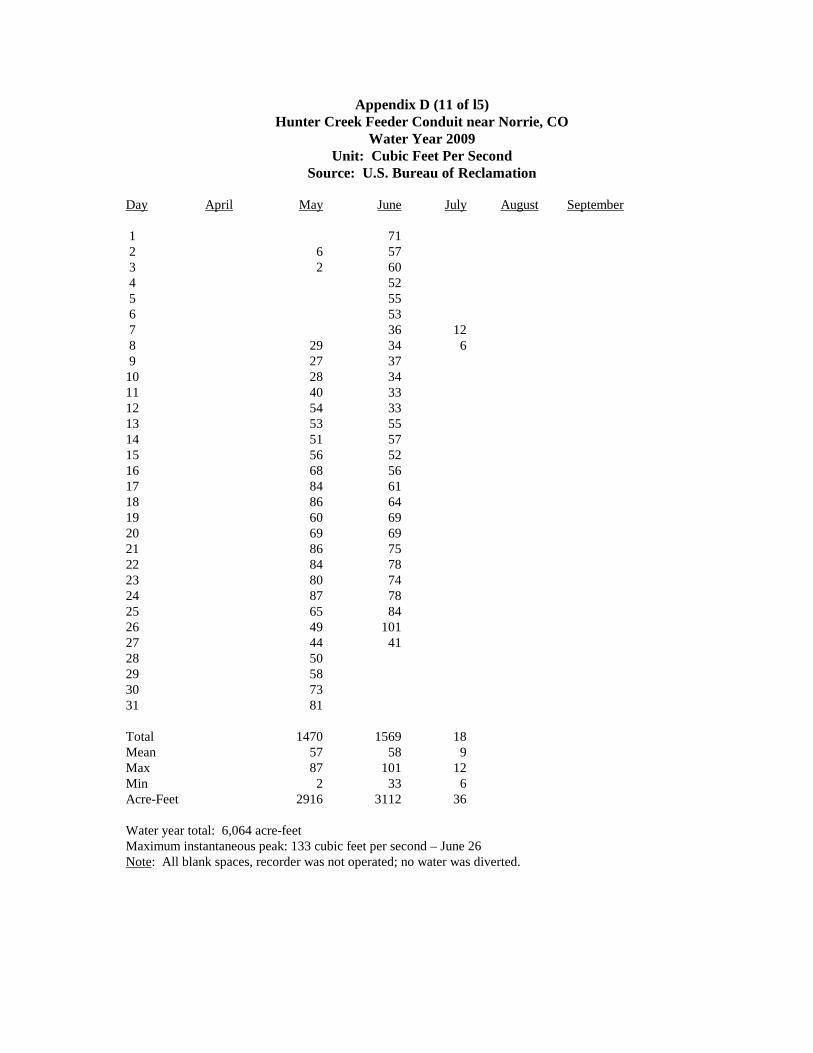
Appendix D (11 of l5)Hunter Creek Feeder Conduit near Norrie, CO
Water Year 2009Unit: Cubic Feet Per Second
Source: U.S. Bureau of Reclamation
Day April May June July August September
1 712 6 573 2 604 525 556 537 36 128 29 34 69 27 37
10 28 3411 40 3312 54 3313 53 5514 51 5715 56 5216 68 5617 84 6118 86 6419 60 6920 69 6921 86 7522 84 7823 80 7424 87 7825 65 8426 49 10127 44 4128 5029 5830 7331 81
Total 1470 1569 18Mean 57 58 9Max 87 101 12Min 2 33 6Acre-Feet 2916 3112 36
Water year total: 6,064 acre-feetMaximum instantaneous peak: 133 cubic feet per second – June 26Note: All blank spaces, recorder was not operated; no water was diverted.

Appendix D (12 of l5)Sawyer Creek Feeder Conduit near Norrie, CO
Water Year 2009Unit: Cubic Feet Per Second
Source: U.S. Bureau of Reclamation
Day April May June July August September
1 43 362 11 43 353 11 42 344 42 325 46 306 49 287 43 268 16 40 249 16 40 23
10 18 39 2211 22 38 2112 25 37 2013 27 43 1914 28 47 1915 31 45 1816 36 4517 41 4818 48 5019 49 5220 48 5321 46 5222 45 5223 45 5224 47 5025 44 5326 40 5727 37 3928 35 629 35 630 39 1531 43
Total 883 1267 387Mean 34 42 26Max 49 57 36Min 11 6 18Acre-Feet 1751 2513 768
Water year total: 5,032 acre-feetMaximum instantaneous peak: 59 cubic feet per second – June 26Note: All blank spaces, recorder was not operated; no water was diverted.
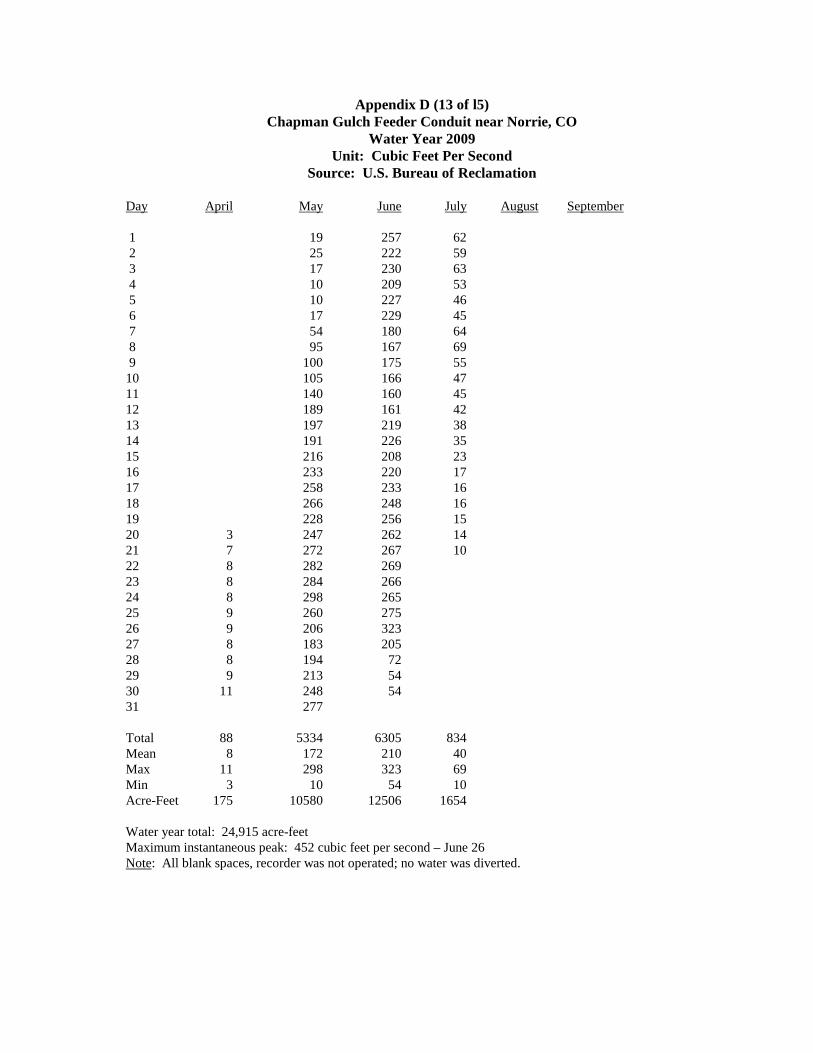
Appendix D (13 of l5)Chapman Gulch Feeder Conduit near Norrie, CO
Water Year 2009Unit: Cubic Feet Per Second
Source: U.S. Bureau of Reclamation
Day April May June July August September
1 19 257 622 25 222 593 17 230 634 10 209 535 10 227 466 17 229 457 54 180 648 95 167 699 100 175 55
10 105 166 4711 140 160 4512 189 161 4213 197 219 3814 191 226 3515 216 208 2316 233 220 1717 258 233 1618 266 248 1619 228 256 1520 3 247 262 1421 7 272 267 1022 8 282 26923 8 284 26624 8 298 26525 9 260 27526 9 206 32327 8 183 20528 8 194 7229 9 213 5430 11 248 5431 277
Total 88 5334 6305 834Mean 8 172 210 40Max 11 298 323 69Min 3 10 54 10Acre-Feet 175 10580 12506 1654
Water year total: 24,915 acre-feetMaximum instantaneous peak: 452 cubic feet per second – June 26Note: All blank spaces, recorder was not operated; no water was diverted.
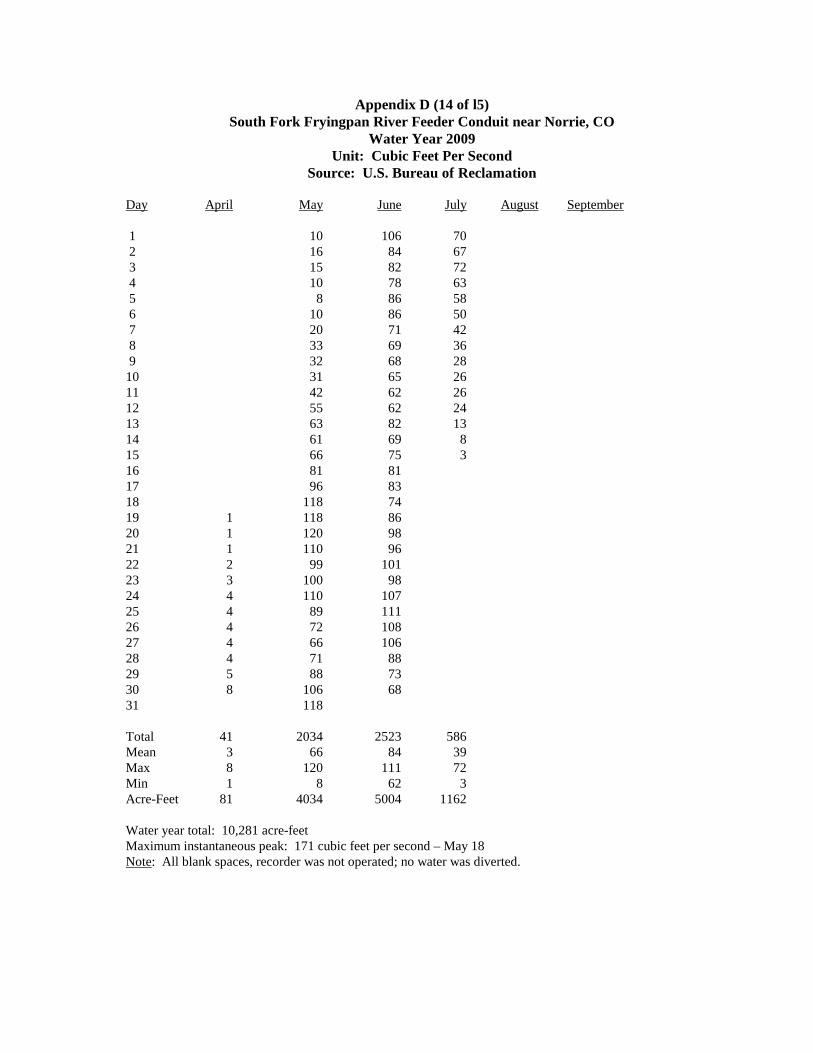
Appendix D (14 of l5)South Fork Fryingpan River Feeder Conduit near Norrie, CO
Water Year 2009Unit: Cubic Feet Per Second
Source: U.S. Bureau of Reclamation
Day April May June July August September
1 10 106 702 16 84 673 15 82 724 10 78 635 8 86 586 10 86 507 20 71 428 33 69 369 32 68 28
10 31 65 2611 42 62 2612 55 62 2413 63 82 1314 61 69 815 66 75 316 81 8117 96 8318 118 7419 1 118 8620 1 120 9821 1 110 9622 2 99 10123 3 100 9824 4 110 10725 4 89 11126 4 72 10827 4 66 10628 4 71 8829 5 88 7330 8 106 6831 118
Total 41 2034 2523 586Mean 3 66 84 39Max 8 120 111 72Min 1 8 62 3Acre-Feet 81 4034 5004 1162
Water year total: 10,281 acre-feetMaximum instantaneous peak: 171 cubic feet per second – May 18Note: All blank spaces, recorder was not operated; no water was diverted.
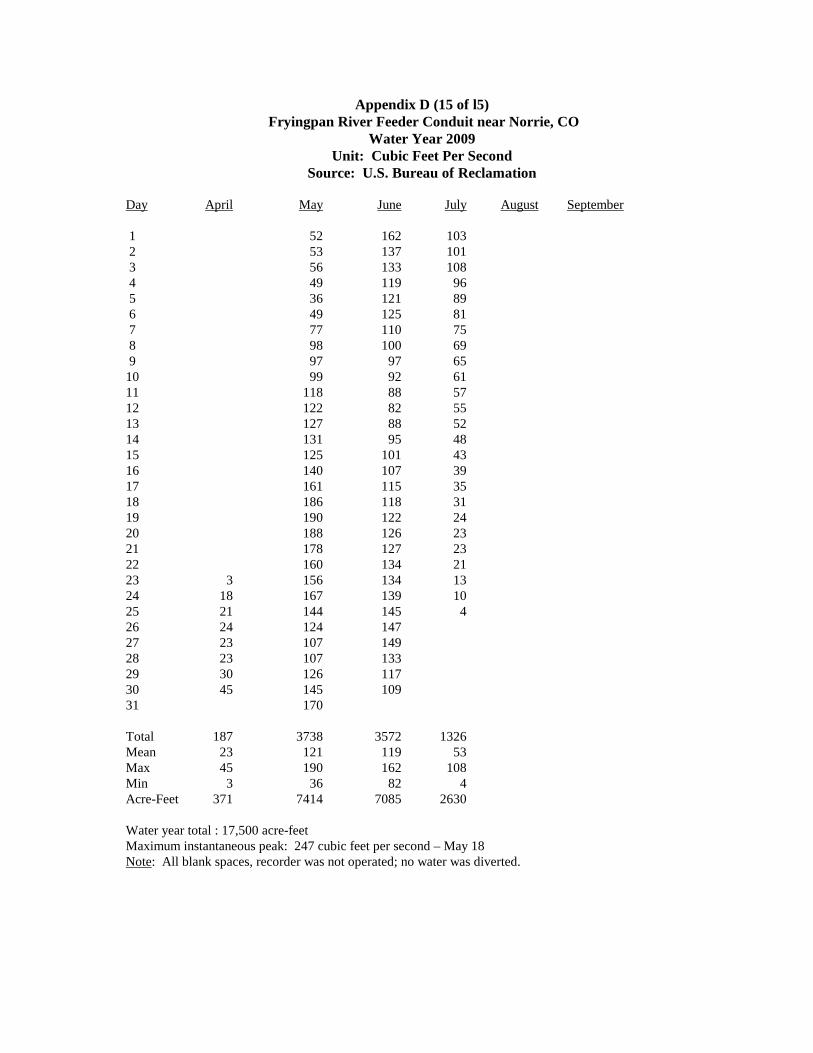
Appendix D (15 of l5)Fryingpan River Feeder Conduit near Norrie, CO
Water Year 2009Unit: Cubic Feet Per Second
Source: U.S. Bureau of Reclamation
Day April May June July August September
1 52 162 1032 53 137 1013 56 133 1084 49 119 965 36 121 896 49 125 817 77 110 758 98 100 699 97 97 65
10 99 92 6111 118 88 5712 122 82 5513 127 88 5214 131 95 4815 125 101 4316 140 107 3917 161 115 3518 186 118 3119 190 122 2420 188 126 2321 178 127 2322 160 134 2123 3 156 134 1324 18 167 139 1025 21 144 145 426 24 124 14727 23 107 14928 23 107 13329 30 126 11730 45 145 10931 170
Total 187 3738 3572 1326Mean 23 121 119 53Max 45 190 162 108Min 3 36 82 4Acre-Feet 371 7414 7085 2630
Water year total : 17,500 acre-feetMaximum instantaneous peak: 247 cubic feet per second – May 18Note: All blank spaces, recorder was not operated; no water was diverted.

87th Congress, 1st Session---------------------------------------------House Document No. 130
OPERATING PRINCIPLES
FRYINGPAN-ARKANSAS PROJECT
ADOPTED BY THE STATE OF COLORADO
APRIL 30, 1959
(As amended December 30, 1959,and December 9, 1960)
MARCH 15, 1961----Ordered to be printed
U. S. GOVERNMENT PRINTING OFFICEWASHINGTON: 1961
H. RES. 91In the House of Representatives, U. S.,
March 15, 1961.
Resolved, That there be printed as a House document the publication entitled“Operating Principles, Fryingpan-Arkansas Project, Adopted by the State of Colorado, April30, 1959 (as amended December 30, 1959, and December 9, 1960)”, and that there be printedfor the use of the Committee on Interior and Insular Affairs one thousand additional copies.
Attest:Ralph R. Roberts, Clerk.
OPERATING PRINCIPLES, FRYINGPAN-ARKANSAS PROJECT
ADOPTED BY THE STATE OF COLORADO, APRIL 30, 1959
(As Amended December 30, 1959, and December 9, 1960)
The construction and operation of the project involve the diversion of water from theheadwaters of the Fryingpan River and other tributaries of the Roaring Fork River to theArkansas River Basin. The project contemplates—
(a) The maximum conservation and use of water;(b) The protection of western Colorado water uses, both existing and potential, in
accordance with the declared policy of the State of Colorado; and(c) The preservation of recreational values.In order to accomplish such purposes, the project shall be operated by the United
States in compliance with the Federal reclamation laws, the laws of the State of Coloradorelating to the appropriation, use, or distribution of water, and the following operatingprinciples:1. As used herein:
(a) “Project” means that certain enterprise planned and designed by the Bureauof Reclamation, Department of the Interior, for the transmountain diversionof water from the headwaters of the Fryingpan River and other tributaries ofthe Roaring Fork River to the basin of the Arkansas River, together with allof its appurtenant works and facilities in both eastern and western Colorado.
(b) “Eastern Colorado” means that portion of the State of Colorado lying withinthe natural drainage basin of the Arkansas River.
(c) “Western Colorado” means that portion of the State of Colorado lying withinthe natural drainage basin of the Colorado River and served by diversionsmade from the Colorado River, or its tributaries, above its confluence with theGunnison River.
(d) “Southeastern Colorado Water Conservancy District” means that entity createdto contract for payment to the United States of an appropriate portion ofproject cost allocated to certain water uses in eastern Colorado.
(e) “Colorado River Water Conservation District” means that entity created byColorado Revised Statutes 1953, 149-8, as amended.
(f) “Southwestern Water Conservation District” means that entity created byColorado Revised Statutes 1953, 149-9, as amended.
(g) “Ruedi Reservoir” means the reservoir presently planned for construction onthe Fryingpan River above the town of Basalt as part of the project.
(h) “Ashcroft Reservoir” means not only the reservoir contemplated forconstruction on Castle Creek, a tributary of the Roaring Fork River, but also,unless the context requires otherwise, any other reservoir that may beconstructed in the Roaring Fork basin above the town of Aspen in lieu of thatreservoir.
(i) “cfs” means cubic feet of water per second of time.
2. The Ruedi Reservoir shall be constructed and maintained on the Fryingpan Riverabove the town of Basalt with an active capacity of not less than 100,000 acre-feet. Inaddition thereto and in order to offset adverse streamflow conditions on the RoaringFork River above the town of Aspen which might occur as a result of the projectenlargement of the Twin Lakes Reservoir, the Ashcroft Reservoir on Castle Creek, orsome reservoir in lieu thereof, shall be constructed on the Roaring Fork drainageabove Aspen to a capacity of approximately 5,000 acre-feet: Providing, However,That the Ashcroft Reservoir shall be constructed only if the Secretary of the Interiorafter appropriate study shall determine that its benefits exceed the costs: Andproviding further, That no part of the construction, operation, or maintenance of saidAshcroft Reservoir shall be chargeable to the Fryingpan-Arkansas project.All of such stored water shall be released under the conditions and limitationshereinafter set forth.
3. The receipts from the sale of water from Ruedi Reservoir, as permitted in paragraph6 (b) hereof, shall be applied solely to the operation and maintenance costs and tothose reimbursable construction costs of said reservoir which exceed $7,600,000. Thecost of perpetual operation and maintenance of the Ruedi Reservoir shall be borne byusers of project water and users of water stored in Ruedi Reservoir in such proportionas may be determined by the Secretary of the Interior.
4. The inclusion of the Ruedi Reservoir in the project shall not preclude theconstruction of any other replacement or regulatory reservoirs on the Colorado Riveror its tributaries above Cameo gaging station.
5. The Ruedi Reservoir shall be completed and in operation before any water is divertedto eastern Colorado by means of the project.
6. (a) The replacement capacity of Ruedi Reservoir, and any reservoir constructed inaddition thereto, is that portion of the total reservoir capacity required topermit project diversions at times when such diversions could not otherwise bemade because of simultaneous demands of senior diversions in westernColorado existing at the time of the adoption of these operating principles, andshall be so operated to accomplish this purpose. Water stored in such capacityshall be released by the United States, upon the request of the Colorado Stateengineer, to the extent that water would have been available to said decreedrights except for stream depletion resulting from diversions by this project tothe Arkansas Valley.
(b) The regulatory capacity of Ruedi Reservoir, and any reservoir constructed inaddition thereto, is that portion of the total reservoir capacity not needed forreplacement purposes. Water stored in such category may be sold or leased bythe United States to water users in Colorado for any purpose recognized by thelaws of the United States: Provided, That the sale of water for use outside thenatural basin of the Colorado River can only be made with the consent of theColorado River Water Conservation District. Charges for the use of suchwater shall be established by the Secretary of the Interior by appropriatecontract in accordance with the payment ability of such water users.
7. The primary purpose of Ruedi Reservoir, and any reservoir constructed in additionthereto, is to furnish, to the extent of its capacity, in like manner as if the project wereconstructed by a water conservancy district organized pursuant to the laws of the Stateof Colorado, the water required for the protection of western Colorado water users bythe provisions of Colorado Revised Statutes 1953, 149-6-13, reading as follows:However, any works or facilities planned and designed for the exportation of water
from the natural basin of the Colorado River and its tributaries in Colorado, by any districtcreated under this article, shall be subject to the provisions of the Colorado River Compactand the Boulder Canyon Project Act. Any such works or facilities shall be designed,constructed and operated in such a manner that the present appropriations of water, and inaddition thereto prospective uses of water for irrigation and other beneficial consumptive usepurposes, including consumptive uses for domestic, mining, and industrial purposes, withinthe natural basin of the Colorado River in the State of Colorado, from which water isexported, will not be impaired nor increased in cost at the expense of the water users withinthe natural basin. The facilities and other means for the accomplishment of said purpose shallbe incorporated in, and made a part of any project plans for the exportation of water from saidnatural basin in Colorado.8. Project diversions from Lime Creek shall be made only in the months of May and
June of each year, unless the Colorado River Water Conservation District shall, bywritten communication, advise the Colorado State engineer that additional diversionscan be made.
9. The respective decrees which may be or have been awarded to the parties hereto as apart of the Fryingpan-Arkansas project and Basalt project shall be administered by theproper officials of the State of Colorado, in accordance with the applicable laws of theState of Colorado, and with the following principles and procedures, to wit:(1) That the demand on the waters available under such decrees shall be allocated
in the following sequence:(a) For diversion to the Arkansas Valley through the collection system and
the facilities of the Fryingpan-Arkansas project in an amount notexceeding an aggregate of 120,000 acre-feet of water in any year, butnot to exceed a total aggregate of 2,352,800 acre-feet in any period of34 consecutive years reckoned in continuing progressive series startingwith the first full year of diversions, both limitations herein beingexclusive of Roaring Fork exchanges as provided in (c) below, andexclusive of diversions for the Busk-Ivanhoe decree; and with thefurther and absolute limitation that in order to protect existing andfuture beneficial uses of water in Western Colorado, includingrecreational and fishing values, the State engineer shall so regulate thetransmountain diversions above referred to, to the end that nodiversions shall be made which will reduce the remaining aggregatestreamflows to less than either of the following minimum standards:
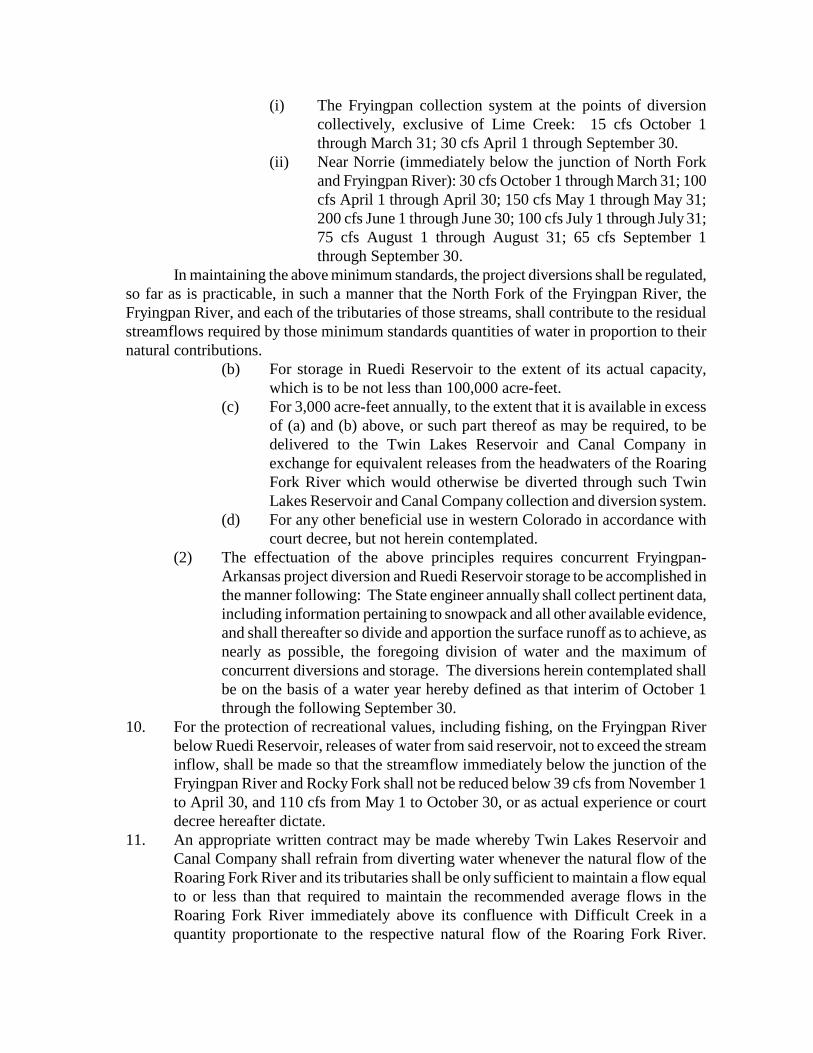
(i) The Fryingpan collection system at the points of diversioncollectively, exclusive of Lime Creek: 15 cfs October 1through March 31; 30 cfs April 1 through September 30.
(ii) Near Norrie (immediately below the junction of North Forkand Fryingpan River): 30 cfs October 1 through March 31; 100cfs April 1 through April 30; 150 cfs May 1 through May 31;200 cfs June 1 through June 30; 100 cfs July 1 through July 31;75 cfs August 1 through August 31; 65 cfs September 1through September 30.
In maintaining the above minimum standards, the project diversions shall be regulated,so far as is practicable, in such a manner that the North Fork of the Fryingpan River, theFryingpan River, and each of the tributaries of those streams, shall contribute to the residualstreamflows required by those minimum standards quantities of water in proportion to theirnatural contributions.
(b) For storage in Ruedi Reservoir to the extent of its actual capacity,which is to be not less than 100,000 acre-feet.
(c) For 3,000 acre-feet annually, to the extent that it is available in excessof (a) and (b) above, or such part thereof as may be required, to bedelivered to the Twin Lakes Reservoir and Canal Company inexchange for equivalent releases from the headwaters of the RoaringFork River which would otherwise be diverted through such TwinLakes Reservoir and Canal Company collection and diversion system.
(d) For any other beneficial use in western Colorado in accordance withcourt decree, but not herein contemplated.
(2) The effectuation of the above principles requires concurrent Fryingpan-Arkansas project diversion and Ruedi Reservoir storage to be accomplished inthe manner following: The State engineer annually shall collect pertinent data,including information pertaining to snowpack and all other available evidence,and shall thereafter so divide and apportion the surface runoff as to achieve, asnearly as possible, the foregoing division of water and the maximum ofconcurrent diversions and storage. The diversions herein contemplated shallbe on the basis of a water year hereby defined as that interim of October 1through the following September 30.
10. For the protection of recreational values, including fishing, on the Fryingpan Riverbelow Ruedi Reservoir, releases of water from said reservoir, not to exceed the streaminflow, shall be made so that the streamflow immediately below the junction of theFryingpan River and Rocky Fork shall not be reduced below 39 cfs from November 1to April 30, and 110 cfs from May 1 to October 30, or as actual experience or courtdecree hereafter dictate.
11. An appropriate written contract may be made whereby Twin Lakes Reservoir andCanal Company shall refrain from diverting water whenever the natural flow of theRoaring Fork River and its tributaries shall be only sufficient to maintain a flow equalto or less than that required to maintain the recommended average flows in theRoaring Fork River immediately above its confluence with Difficult Creek in aquantity proportionate to the respective natural flow of the Roaring Fork River.

The recommended average flows above mentioned are flows in quantities equal tothose recommended as a minimum immediately above its confluence with DifficultCreek according to the following schedule submitted by the United States Fish andWildlife Service and the Colorado Game and Fish Commission:
Month Average Acre-feet Month Average Acre-feetSecond-feet (thousands) Second-feet (thousands)
October 44 2.7 May 100 6.2November 35 2.1 June 120 7.1December 29 1.8 July 100 6.2January 26 1.6 August 63 3.9February 25 1.4 September 44 2.6March 24 1.5April 64 3.8 Total ---- 40.9
In maintaining the above averages, at no time shall the flow be reduced below 15 cfsduring the months of August to April, inclusive, or below 60 cfs during the months of May toJuly, inclusive, providing the natural flow during said period is not less than these amounts.The obligation to supply the minimum streamflow as set forth in the above table on theRoaring Fork River shall, to the extent of 3,000 acre-feet annually, be a project obligation tobe supplied from any waters diverted from the south tributaries of Hunter Creek, Lime Creek,Last Chance Creek, or any of them.
The Twin Lakes Reservoir and Canal Company shall not be required to refrain fromdiverting water under its existing decrees from the Roaring Fork River except to the extentthat a like quantity of replacement water is furnished to said company without chargetherefore through and by means of project diversions and storage.
If by reason of storage capacity in the Ruedi Reservoir, or any reservoir constructed inaddition thereto, the Twin Lakes Reservoir and Canal Company derives additional water orother benefits or advantages it would not have realized had this project not been constructed,then nothing herein contained shall prevent the project from making appropriate charges forsuch water or other benefits or advantages. All revenues derived from the use of water storedin Ashcroft Reservoir shall be used to assist in the repayment of the construction, operation,and maintenance costs of that reservoir, or any reservoir constructed in lieu thereof, as may bedetermined by the Secretary of the Interior.12. All lands acquired and held for project construction and operation and water surfaces
of project reservoirs will be open to the public for recreational purposes, exceptingthose areas reserved by the operating agency.
13. The project will be operated in such a manner that those in eastern Colorado usingproject water imported from the Colorado River Basin for domestic purposes shallhave preference over those claiming or using water for any other purpose.
14. The project is to be operated in such a manner as to secure the greatest benefit fromthe use and reuse of imported project waters within project boundaries in the Stateof Colorado

15. Any and all benefits and rights of western Colorado water users in and to waterstored in Green Mountain Reservoir, as described and defined in Senate Document80, 75th Congress, 1st session, shall not be impaired or diminished by this project.
16. The project, its operation, maintenance, and use shall be subject to the provisions ofthe Upper Colorado River Basin Compact of October 11, 1948 (Public Law 37, 81st
Congress, 1st session), and the Colorado River Compact of November 24, 1922(House Document 605, 67th Congress, 4th session).
17. The Colorado River Water Conservation District of the State of Colorado shallacquire title to storage of water in Ruedi Reservoir and any reservoir constructed inaddition thereto, by appropriate proceedings in the courts of the State of Colorado.The Southeastern Colorado Water Conservancy District of the State of Coloradoshall likewise acquire title to the water required by the project for diversion to theArkansas Valley. The Secretary of the Interior shall at any time after theauthorization of the project have the option to obtain or require the transfer to theUnited States of any and all rights initiated or acquired by appropriation as hereinset forth: Provided, however, That the rights so taken shall be subject to abeneficial use of such water as may be provided in the repayment contract orcontracts, and subject to all the operating principles herein set forth.
18. No transmountain diversion of water shall ever be made through the collection anddiversion system of the Fryingpan-Arkansas Project in excess of the quantitativelimitations and conditions established by this document: Provided, however, Thatwhen under the laws of the State of Colorado, there may be additional wateravailable for such collection and diversion which is not at the time of diversionrequired for beneficial use in western Colorado or for filling interstate watercompact agreements, then such water may be collected and diverted for beneficialuse in the Arkansas Valley: Provided further, That such additional diversion shallonly be made with the mutual consent of each of the following agencies of the Stateof Colorado, to wit: the Colorado Water Conservation Board, the SouthwesternWater Conservation District, the Colorado River Water Conservation District, andthe Southeastern Colorado Water Conservancy District.
19. To assure project operation in conformity with the operating principle heretoforestated, to provide a means for the collection and interchange of information, and toprovide a method for the continued study of project operations to the end that, if thestated operating principles may be improved upon, recommendations for changesmay be made to the contracting parties, a commission shall be created in anappropriate manner to be composed of one representative of the SoutheasternColorado Water Conservancy District, one representative of the Colorado RiverWater Conservation District, two representatives of the United States, and onerepresentative of the State of Colorado appointed by the Colorado WaterConservation Board after consultation with the Colorado Game and FishCommission. The powers of such commission shall be limited to the collection ofdata, the making of findings of fact, and the suggestion of changes in operatingprinciples.

These operating principles shall be deemed to have amended and take the place ofthose operating principles signed and executed on April 30, 1959. These operating principlesshall be and do constitute a contract between the signatory parties, and shall inure to thebenefit of and shall be and remain binding upon said parties, their respective successors andassigns.
Executed as amended at Denver, Colorado, this 9th day of December 1960.
COLORADO WATER CONSERVATION BOARDSteve McNichols, Chairman;Governor, State of Colorado
Attest:Felix L. Sparks,
Director and SecretarySOUTHEASTERN COLORADO WATER CONSERVANCY
DISTRICTBy J. Selby Young, President
Attest:J. G. Shoun,
SecretaryCOLORADO RIVER WATER CONSERVATION DISTRICT
By A. Allen Brown, PresidentAttest:
Philip P. Smith,Secretary
SOUTHWESTERN WATER CONSERVATION DISTRICTBy Ira E. Kelly, President
Attest:Archie B. Toner,
Secretary