University internationalisation: The e ect ... - warwick.ac.uk
26
University internationalisation: The e↵ect of domestic tuition fee increases on campus diversity EC331: Research in Applied Economics Abstract This research analyses the e↵ect of increasing UK domestic tuition fees for the 2012/13 academic year on the proportion of international students at univer- sities across England and Wales. Previous e↵orts have found some e↵ect on applications from higher domestic tuition fees and international students have been shown to be sensitive to a range of influences. Combining these areas of research, university level attendance panel data is used to analyse the changes in university cohorts resulting from the tuition fee rise. It finds that there is a significant increase in international representation relative to domestic students with varying e↵ects by university rank. Higher ranked institutions experienced a more profound increase in the international share of students compared to their lower ranked counterparts, due to a stronger substitution e↵ect between domestic and international demand. Student number: u1503557 Word count: 4,995 (311 in tables and figures) Tutor: Aditi Dimri Date: 24th April 2018
Transcript of University internationalisation: The e ect ... - warwick.ac.uk

University internationalisation: Thee↵ect of domestic tuition fee increases
on campus diversity
EC331: Research in Applied Economics
Abstract
This research analyses the e↵ect of increasing UK domestic tuition fees for the2012/13 academic year on the proportion of international students at univer-sities across England and Wales. Previous e↵orts have found some e↵ect onapplications from higher domestic tuition fees and international students havebeen shown to be sensitive to a range of influences. Combining these areas ofresearch, university level attendance panel data is used to analyse the changesin university cohorts resulting from the tuition fee rise. It finds that there is asignificant increase in international representation relative to domestic studentswith varying e↵ects by university rank. Higher ranked institutions experienceda more profound increase in the international share of students compared totheir lower ranked counterparts, due to a stronger substitution e↵ect betweendomestic and international demand.
Student number: u1503557Word count: 4,995 (311 in tables and figures)
Tutor: Aditi DimriDate: 24th April 2018

Acknowledgements
This paper would not have been possible without the continuous support of AditiDimri, who’s advice and expertise have helped guide the research question andeconometric techniques that underpin the models of this paper. I would also liketo thank Claire Crawford for the initial support on pinning down the researchtopic. Finally, I have to extend my thanks to the UK government and TheresaMay for commissioning a review of tuition fees in 2018, which makes this papersomewhat more topical and relevant than it may otherwise have been.
2

Contents
1 Introduction 4
2 Literature review 5
2.1 Theoretical framework . . . . . . . . . . . . . . . . . . . . . . . . 52.2 Empirical framework . . . . . . . . . . . . . . . . . . . . . . . . . 6
3 Data 7
4 Methodology 9
5 Results 10
5.1 Initial results . . . . . . . . . . . . . . . . . . . . . . . . . . . . . 105.2 High ranking universities . . . . . . . . . . . . . . . . . . . . . . . 115.3 Low ranking universities . . . . . . . . . . . . . . . . . . . . . . . 135.4 Robustness . . . . . . . . . . . . . . . . . . . . . . . . . . . . . . 155.5 Limitations . . . . . . . . . . . . . . . . . . . . . . . . . . . . . . 15
6 Conclusion 16
A Appendix 20
A.1 Summary statistics . . . . . . . . . . . . . . . . . . . . . . . . . . 20A.2 Pooled OLS . . . . . . . . . . . . . . . . . . . . . . . . . . . . . . 22A.3 Fixed e↵ects and subgroup determination . . . . . . . . . . . . . 23A.4 Low rank model testing . . . . . . . . . . . . . . . . . . . . . . . 25A.5 Robustness . . . . . . . . . . . . . . . . . . . . . . . . . . . . . . 26
3

1 Introduction
Higher education funding has long been at the centre of the UK political debate.The Browne Review (2010) provided the largest reform to education funding inUK history, as the domestic fee cap rose from a maximum of £3,375 to £9,000per annum. More recently, the UK government announced another review toassess if students are over paying for undergraduate tuition. Concurrently, theworld has continued to globalise, and education is firmly part of this process.Universities around the world have faced growing demand from an increasingnumber of nations and UK universities have been at the forefront of this raceto attract global talent.
Economists have analysed these two forces, albeit separately. Spence (1973)formally introduced the trade o↵ between education costs and future expectedearnings as a motivating factor behind education choices. Subsequent empiricalliterature has supported this argument and evidence from the UK suggests thatstudents place a higher emphasis on financial decisions more than other factors(Wilkins et al. (2013)), and estimated price elasticity of demand for universitylies between -0.14 and -0.26 (Sa et al. (2014)). International tuition fees inexcess of £20,000 per annum at top UK universities create a similarly di�cultdecision for international students. Although, factors such as location, campusand university ranking play a more important role in demand from interna-tional students (Soo & Elliott (2010)). However, there has been no attempt toacknowledge the interrelated nature of demand for university places by thesetwo student groups, and how domestic tuition fee changes open the door tomore international university cohorts and campuses.
Combining these two areas of research in an attempt to assess such interre-lated demands, I analyse the UK domestic undergraduate tuition fee rise at thestart of the 2012/13 academic year in a fixed e↵ects framework to determine itse↵ect on the internationalisation of UK universities. That is, the change in theshare of undergraduate cohorts attributed to international student attendance.This is aided by the assumption of relatively stable international tuition feesover the period, given the absence of any large discontinuous change in fees.This extends further and seeks to determine if there is an accentuated e↵ect forhigher ranking universities, which I hypothesise is a result of a stronger substi-tution e↵ect between UK and international students. This substitution e↵ect isno doubt derived from a higher prestige and reputation from success in leaguetables driving international interest and demand. Thus, this research shouldshed some light onto the true e↵ect and longevity of the impact of tuition feeson UK campuses diversity.
The results suggest that there is a significant change in the share of interna-tional students after the policy reform in 2012, the strength of which varies bythe rank of university. Higher ranked universities have seen the largest change ininternational student share relative to lower ranked universities. This confirmsprevious research regarding domestic students, and furthers the hypothesis that,at the expense of domestic students, UK campuses have more international stu-dents, implying higher diversity, as a result of increased tuition fees. Although,
4

the longevity of this impact remains ambiguous, given the timing of previousand subsequent university legislation.
2 Literature review
2.1 Theoretical framework
Spence (1973), and latterly Weiss (1995), modelled education as a signal forhigher productivity in order to obtain a higher wage, making costs pivotal ineducation decisions.
Figure 1: Expected wage against university costs
The model Spence developed can be adapted to model UK undergraduatedecisions in a simple framework. Figure 1 graphically demonstrates the financialdecisions of net present value of expected earnings against net present value ofcosts, which is composed of ability, fees and initial wealth, which aids abilityto fund their university expenditure. An example of di↵ering cost curves couldbe a necessity to take out more loans to finance living costs. Cost curves I, IIand III denote three potential di↵erent students and denote the wage requiredto o↵set the costs they incur from attending university. Pre fee rise, studentsI and II have a higher expected wage minus costs from attending both typesof university, compared to not attending university. Whereas student III onlybenefits from the earnings boost of a high ranking university. Increasing fees to£9,000 rotates their cost curves to reflect the extra financial burden. Post rise,the graduate wage premium is no longer su�cient to entice student III to attendeither type of university, student II requires the wage benefits of a high rankuniversity and student I still strictly prefers to attend university. This simplemechanical example demonstrates how expected domestic demand for both highand low ranking universities falls due to fee changes.
5

International students are much more price inelastic. Furthermore, interna-tional fees didn’t experience the same discontinuous change compared to domes-tic fees. Therefore, it is reasonable to assume that international fees didn’t causeany significant changes in demand. Soo & Elliott (2010) note that prestige is akey determinant of international demand; hence, international students demandmore places at higher ranking universities, causing excess demand, compared tolower ranking institutions. Thus, the increase in university places available afterthe fall in domestic demand should cause a larger increase of international stu-dents at higher ranking universities. Whilst this is a very crude approximation,it stakes what is a reasonable expectation that more prestigious universities aresubject to a stronger substitution e↵ect to international students when domesticdemand falls.
This theoretical framework gives rise to the hypothesis that increased domes-tic fees will increase the international share more at higher ranking universitiesdue to both university groups losing domestic demand, but higher ranking uni-versities can o↵set this loss with foreign demand.
2.2 Empirical framework
In line with theoretical predications, UK students are sensitive to financial con-siderations of higher education (Heller (1997); Foskett et al. (2006)). Wilkinset al. (2013) notes that finances are the most important consideration for UKsixth formers outweighing university quality and reputation.
Extending to more robust econometric analysis has facilitated estimates ofdemand elasticity. Dearden et al. (2011) combined UK labour force survey datacreating a pseudo panel data set, to analyse the introduction of fees in 1998 andthe subsequent rise to £3,000 in 2006. Across the two policy changes, there wasa robust negative relationship between the level of participation and fees, withevery £1,000 increase in fees decreasing participation by 3.9%. Dearden et al.(2014) latterly re-estimated the e↵ect of grants on participation, finding that a£1,000 increase in the grants increased participation by 3.95%.
More recently, Sa et al. (2014) assessed the e↵ect of the 2012 fee change onapplication rates to UK universities, extending the theoretical frameworks toincorporate a net present value for higher education, based on a graduate pre-mium in expected wages. From which two hypothesises were drawn out: firstly,increased tuition fees decreased applications and, secondly, caused students toshift to courses with higher expected earnings. Using UCAS application data,Sa et al. (2014) generated two di↵erence in di↵erences models to evaluate thehypothesis, using the lag between policy implementations across the UK, andScotland as a control. The nature of using the logarithm of applications datapermitted the interpretation of an elasticity of demand for university of between-0.14 and -0.26. This result remains robust when accounting for the reducednumbers of individuals taking a gap year in the year before the policy reform,highlighted by Crawford & Dearden (2010).
It is Sa’s empirical analysis that this paper builds upon. However, a keydi↵erence is a renewed focus on attendance, rather than applications, which
6
I argue is a better measure of demand. Students are not obliged to attenduniversity, if they subsequently decide that they no longer value their universityo↵ers su�ciently to pay £9,000. Thus, application data can over estimate thepost-reform demand and mask the true e↵ect on attendance.
Internationally, Cordaro (1984) noted quantitative literature surroundingdecision making is limited in volume. Jena & Reilly (2013) provided one of ahandful of approaches in an attempt to further the understanding of interna-tional students’ motivations to study in the UK. Estimating a fixed e↵ects modelusing student visa data from 89 developing nations across 2001 to 2008, tuitionfees had a significant e↵ect through the exchange rate and national income chan-nels. These both significantly a↵ected visa applications, supporting the workof Agarwal and Winkler (1985). This follows the argument that internationalstudents are not so much concerned about tuition fees in GBP, but are moreheavily influenced by how it converts to their own local currency. Furthermore,this, to a certain extent, demonstrated the trend to higher level of internationaleducation can be attributed to the growth of developing economies facilitatingthe financial support needed to send students abroad.
Whilst they only use aggregated tuition fee data, Soo & Elliott (2010) pro-vided empirical evidence to partially mitigate this flaw, finding that proximityto London, the university’s rank and domestic students’ applications to theuniversity provide more significant explanations to variation in participation.Critically these findings influence the use of controls throughout this analysis,and support the argument that a lack of international fee data isn’t too detri-mental to this study.
3 Data
This analysis is conducted on 87 universities across England and Wales. Scot-land is excluded due to their unique structure of fees whereby Scottish studentsface free higher education upon studying in Scotland. The data is collected fromseveral sources across the period 2008 to 2014. This period is chosen given twouniversity reforms in 2007 and 2015. In 2007 a tuition fee cap was introducedat £3,000 per annum and in 2015 universities no longer faced a maximum onthe number of student admissions per course.
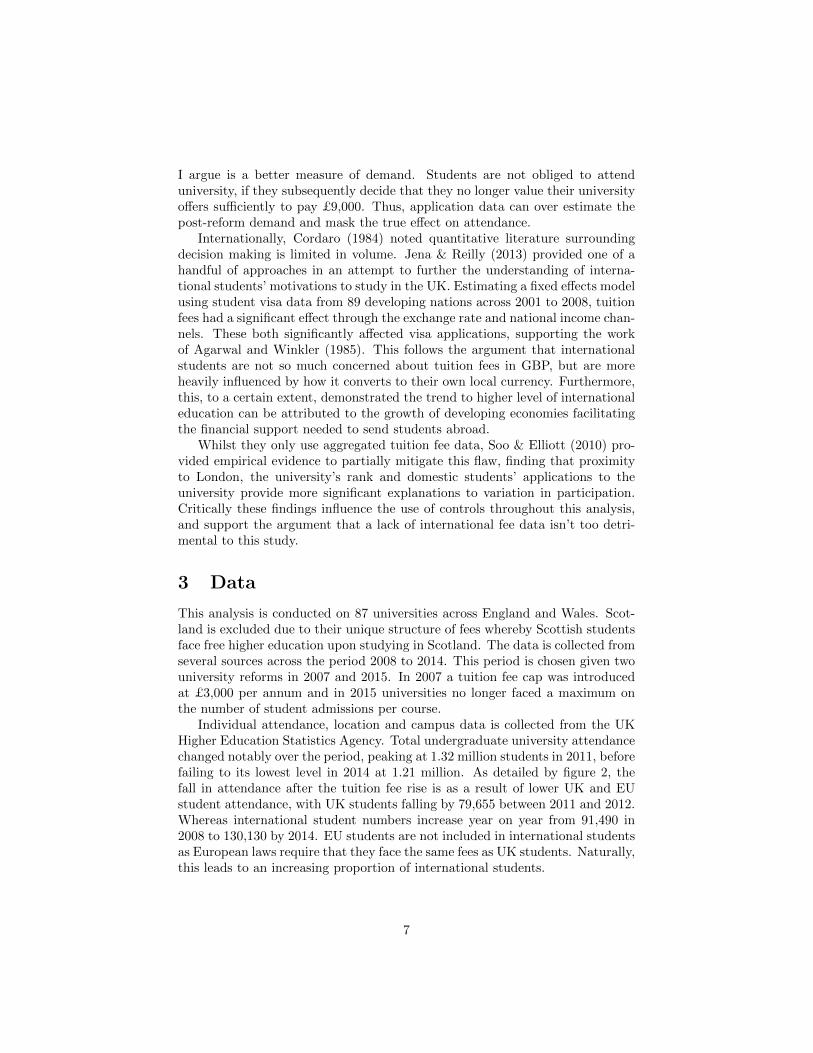
Individual attendance, location and campus data is collected from the UKHigher Education Statistics Agency. Total undergraduate university attendancechanged notably over the period, peaking at 1.32 million students in 2011, beforefailing to its lowest level in 2014 at 1.21 million. As detailed by figure 2, thefall in attendance after the tuition fee rise is as a result of lower UK and EUstudent attendance, with UK students falling by 79,655 between 2011 and 2012.Whereas international student numbers increase year on year from 91,490 in2008 to 130,130 by 2014. EU students are not included in international studentsas European laws require that they face the same fees as UK students. Naturally,this leads to an increasing proportion of international students.
7

050
0000
1000
000
1500
000
2008 2010 2012 2014Year
total_UK total_EUtotal_international
Fig 2. Total attendance over time by student origin
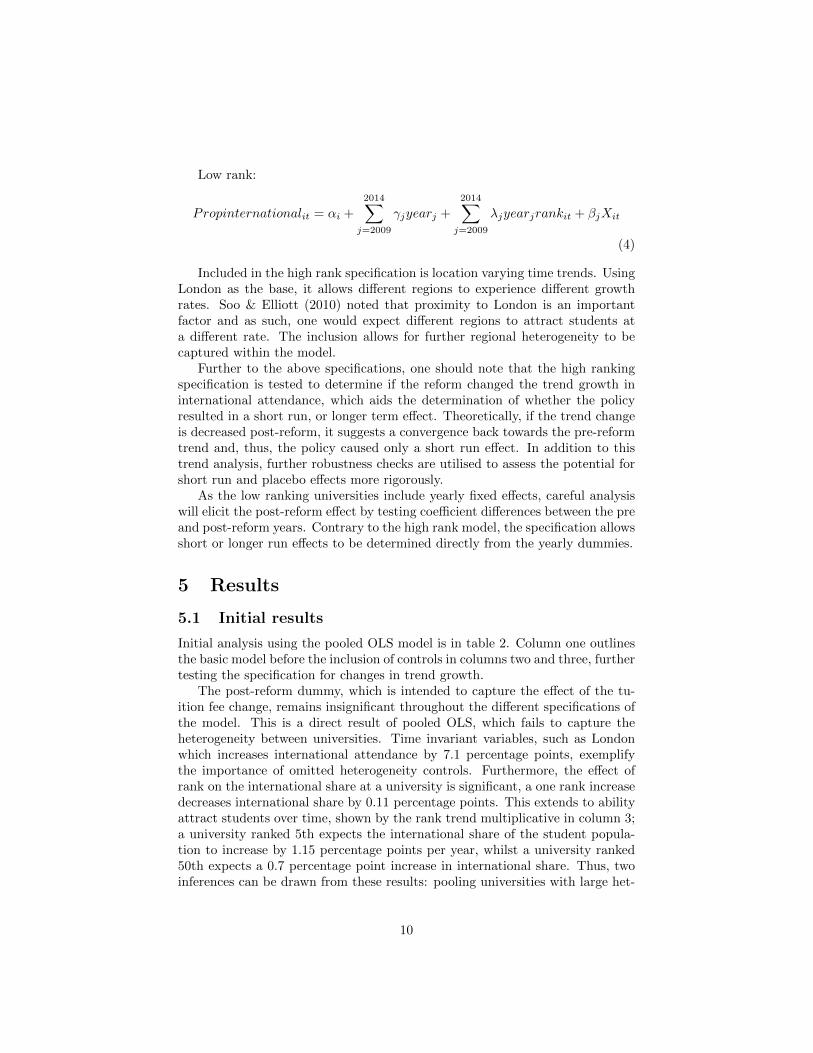
Summary statistics for the control variables are given in table 1, includingboth international and domestic student specific controls. More pertinently, thecorrelation between proportion international and rank is -0.5632, which denoteshigher ranked universities have more international student cohorts. Buildingupon the hypothesis posed, the correlation between proportion internationaland year is 0.2866 and 0.1383 for the top 50 and lower ranked universitiesrespectively, which suggests di↵ering international demand across the groups.Figure 3 demonstrates such a split, with the trend growth, defined as trendbetween 2008 and 2011 extrapolated out to 2014, and actual changes over time.The comparison demonstrates a potentially larger policy reaction above trendat high ranked universities, with other universities experiencing more randomchanges. This further motivates the hypothesis that higher ranking universitiesexperienced a more alarming change.
.05
.1.1
5
2008 2010 2012 20142008 2010 2012 2014
Outside top 50 Top 50 ranked
LowRank LowRank_trendTop50 Top50_trend
Year
Graphs by top50
Fig 3. Trend against actual change in percentage of international students
8

4 Methodology
The empirical approach to determine the e↵ect of the tuition fee rise, is builtup in increasing complexity, in order to account for as many control variables,and other biases as possible. Initially, a pooled OLS is estimated, accountingfor key university level controls:
Propinternationalit = ↵0 + �1trendt + �2postreformt + �jXit (1)
The dependent variable is the percentage of international students in a uni-versity undergraduate cohort. The post-reform dummy variable coe�cient, �2,is the variable of interest records 1 for 2012 onwards and 0 for before the fee rise,and is used to determine the e↵ect of the tuition fee rise. The vector �jXit de-notes the control variables, including drivers of international demand followingthe empirical analysis of Jena & Reilly (2013) and domestic students demand.
In order to increase the validity, and demonstrate the innate issues of pooledOLS, the empirical approach of Sa et al. (2014) is built upon, giving rise to thefollowing fixed e↵ects model:
Propinternationalit = ↵i + �1trendt + �2postreformt + �jXit (2)
This di↵ers, given data limitations, from Sa et al. (2014) by not making useof a di↵erence in di↵erences model. This is primarily due to the aforementioneddi↵erences in fee structure of Scottish universities, which would otherwise haveconstituted a suitable control group. This is estimated using the entire set ofuniversities, and is tested to determine di↵ering e↵ects across ranks.
Figure 3 graphically demonstrates such a di↵erence between high and lowranking universities. High ranking universities are defined as universities in thetop 50 throughout the defined time period. Given the distinct paths of growth,the model is tested, using both rank and a dummy variable highrank, whichregisters 1 for top 50 universities and 0 otherwise, to verify that structuraldi↵erences exist between the groups.
Subsequently, high and low ranking universities are estimated separately,with di↵erent specifications. High ranking universities have a distinct and reg-ular trend increasing year on year before and after the policy change for in-ternational share. The inclusion of a trend and yearly e↵ects causes issues ofcollinearity, hence, the inclusion of a trend causes the omission of yearly fixede↵ects. However, the smooth trend supports the view that this omission will notsignificantly bias the results. In contrast, lower ranked universities demonstrateno clear trend. To account for the variation, year fixed e↵ects are estimated inplace of trend and treatment e↵ect, which makes the interpretation somewhatmore intricate.
High rank:
Propinternationalit = ↵i + �1trendt + �2postreformt + �jXit (3)
9
Low rank:
Propinternationalit = ↵i +2014X
j=2009
�jyearj +2014X
j=2009
�jyearjrankit + �jXit
(4)
Included in the high rank specification is location varying time trends. UsingLondon as the base, it allows di↵erent regions to experience di↵erent growthrates. Soo & Elliott (2010) noted that proximity to London is an importantfactor and as such, one would expect di↵erent regions to attract students ata di↵erent rate. The inclusion allows for further regional heterogeneity to becaptured within the model.
Further to the above specifications, one should note that the high rankingspecification is tested to determine if the reform changed the trend growth ininternational attendance, which aids the determination of whether the policyresulted in a short run, or longer term e↵ect. Theoretically, if the trend changeis decreased post-reform, it suggests a convergence back towards the pre-reformtrend and, thus, the policy caused only a short run e↵ect. In addition to thistrend analysis, further robustness checks are utilised to assess the potential forshort run and placebo e↵ects more rigorously.
As the low ranking universities include yearly fixed e↵ects, careful analysiswill elicit the post-reform e↵ect by testing coe�cient di↵erences between the preand post-reform years. Contrary to the high rank model, the specification allowsshort or longer run e↵ects to be determined directly from the yearly dummies.
5 Results
5.1 Initial results
Initial analysis using the pooled OLS model is in table 2. Column one outlinesthe basic model before the inclusion of controls in columns two and three, furthertesting the specification for changes in trend growth.
The post-reform dummy, which is intended to capture the e↵ect of the tu-ition fee change, remains insignificant throughout the di↵erent specifications ofthe model. This is a direct result of pooled OLS, which fails to capture theheterogeneity between universities. Time invariant variables, such as Londonwhich increases international attendance by 7.1 percentage points, exemplifythe importance of omitted heterogeneity controls. Furthermore, the e↵ect ofrank on the international share at a university is significant, a one rank increasedecreases international share by 0.11 percentage points. This extends to abilityattract students over time, shown by the rank trend multiplicative in column 3;a university ranked 5th expects the international share of the student popula-tion to increase by 1.15 percentage points per year, whilst a university ranked50th expects a 0.7 percentage point increase in international share. Thus, twoinferences can be drawn from these results: pooling universities with large het-
10

erogeneity biases the results, and there is evidence of varying ability to attractinternational students by rank.
Table 3 details an advancement onto a fixed e↵ects model to capture univer-sity heterogeneity. There is a significant policy e↵ect, with international shareof student populations rising by 0.87 percentage points after the reform. Trendgrowth remains significant and the addition of regional trends, where Londonis the base, captures further heterogeneity and inter-region ability to attractincreasing international demand.
Column three is the first major step to aligning the results with the hy-pothesis. Allowing the trend and post-reform dummy to vary by rank revealsa major insight into the di↵erences across universities. Most significantly, thepost-reform coe�cient increases to a 1.34 percentage point increase, and themultiplicative implies a one place reduction in rank causes this to diminish by0.01 percentage points. Testing this e↵ect at di↵erent ranks causes the policye↵ect to become insignificant below 63rd in national rankings. The implicationis that lower ranked universities felt less of a substitution e↵ect following thepolicy, which can be reconciled with the hypothesis and motivates the followinganalysis to test the need for di↵erent models by high and low rank.
Pooling all universities into one group poses the assumption that there is nostructural di↵erence in the post-reform and trend e↵ects between high and lowranked institutions. That is, it assumes a linear relationship between rank andthe reform e↵ects and trend, which is unlikely to be a realistic assumption. Testsby rank and the dummy variable highrank find a highly significant di↵erencebetween coe�cients (A.3). This confirms the belief that two di↵erent modelsneed to be estimated to facilitate structural di↵erences between high and lowerranked universities.
5.2 High ranking universities
Table 4 contains the results of the High ranking universities model, where col-umn two outlines the final model for the subgroup. The major di↵erence thatcan be taken from the separation of the model is the more homogenous e↵ect ofthe policy change across the high ranking universities. The rise in fees increasesthe international share of student populations by 0.83 percentage points, whichrepresents a 5.5% increase on the mean international share of high ranking uni-versities in 2012. Furthermore, and importantly in the context of policy, thelack of a significant coe�cient on a trend and post-reform multiplicative demon-strates that there is no significant change in the trend rate of growth. This im-plication is important; it denotes that the e↵ect of tuition fees has increased thelevel of international students in high ranking universities permanently abovethe initial trend. Thus, the process of internationalisation of higher educationinstitutions has been increased indefinitely as a result of £9,000 tuition fees.
A test for a homogenous e↵ect across the top 50 universities demonstratesthat there is no variation in e↵ect by ranks, indicating universities experiencedan equal percentage point change in international share. Rank does continueto have an e↵ect on the trend change, however, the sign is reversed, suggesting
11

that the highest ranking universities, whom already have a large internationalstudent population, have less change to undergo.
.1.1
5.2
.25
2008 2010 2012 2014Year
London_trend London_postreformNorthWest_trend NorthWest_postreform
Fig 4. London against North West trend and policy effects
Figure 4 graphically demonstrates these results at mean values, using theLondon base case trend against North West universities, which experienced the
12

fastest rate of change. Comparing against the expected trend, the di↵erencedemonstrates the 0.83 percentage point increase in international share as a resultof the fee change and supports the hypothesis initially posed; high rankinguniversities experienced a large substitution to international demand.
5.3 Low ranking universities
Table 5 contains the results of a revised model for low ranked universities. Yearlye↵ects are included given substantial yearly variation and multiplicative termspermit yearly dummies to di↵er by rank. This allows the post-reform e↵ects tobe larger for universities close to the top 50, and to determine when the policye↵ect tends to zero.
Column three shows the e↵ects, at mean values of rank, of the yearly dum-mies. Initially, there is evidence to suggest that the proportion of internationalstudents is increasing year on year, with 2.6 percentage points higher share ofinternational students in 2014 compared to 2008. It further implies a 0.7 per-centage point increase in share immediately after the fee rise, which increasesfurther in 2013 and 2014. These coe�cients are tested to elicit the true di↵er-ences between the pre and post-reform years, including by di↵erent ranks, inorder to determine the policy e↵ect.
The outcomes have two very important results (A.4). Primarily, at mean, 1stand 3rd quartile ranks there is no significant increase between pre-reform yearscompared to 2008. Thus, there is no rise in the share of cohorts attributed tooverseas students before 2012. However, it is not true of the post-reform years,whilst the 3rd quartile post-reform years are insignificantly di↵erent comparedto 2008, the post-reform years are significantly larger than all pre-reform yearsfor the mean and 1st quartile of universities. Secondly, 2012 has a significantlysmaller e↵ect compared to 2013 and 2014 for the mean and 1st quartile ofuniversity ranks.
From this it can be inferred: There is no trend of increasing internationalstudent share before the policy and only the higher ranked universities have vari-ation between yearly e↵ects post-reform, implying these universities increasinglyturned to international admissions post-reform with a weak substitution e↵ect.In addition, only the higher ranking universities within the group experienced asignificant post-reform e↵ect. This evidence is demonstrated in figure 5, whichshows the model predictions at mean, 1st and 3rd quartile of ranks. The thirdquartile has very little variation over the period, resulting from no substitutione↵ect. In contrast, there remains a weak substitution e↵ect for universities atthe higher end of the spectrum, with a sharper increase in international sharefor the 1st quartile of rank.
Consequently, there is evidence to support the hypothesis that there was anincrease in the proportion of international students, however, the e↵ect dimin-ishes the lower a university is in league tables. The policy e↵ect reaches zero,and is statistically insignificant for ranks above 90.
13

14

.05
.06
.07
.08
.09
2008 2010 2012 2014Year
first_quartile_year_effects mean_year_effectsthird_quartile_year_effects
Fig 5. First, Mean and Third quartile yearly variation
5.4 Robustness
The results indicate a significant e↵ect, diminishing over rank at the lower end.Whilst the low ranking model allows a full examination of the results withregards to potential short run or placebo e↵ects from focusing on yearly fixede↵ects, the model for high ranking universities is open to be misinterpretedas a sustained rise in the level of international share above trend, instead ofpotentially a short run or placebo e↵ect.
Table 6 shows that the model is robust to changes in the base year; dummyvariables detailing a pre-emption or late reaction to tuition fee changes are notsignificant. This can be attributed to the structure of the reform; students whowere already at university before the reform continued to pay fees at the pre-reform level. Students entering university in 2010 or 2011 would not be a↵ected,hence, it is sensible to assume that university choices were not a↵ected by thegovernment decision to raise fees for the academic year 2012/13.
Analysis of a one-year shock is insignificant, validating the argument thatthe increased fees had a longer term e↵ect. This extends to only a short runshock, defined as lasting only two years. The inclusion of a dummy variable findsno significance over and above the post-reform coe�cient. Thus, the model isrobust over the time period specified.
5.5 Limitations
Omitted variables, the shortened time frame of the model and the lack of acontrol group for the analysis provide avenues for improvement. However, thereis su�cient grounding to argue that improvements to the model are unlikely toachieve dissimilar results, especially as the removal of several flaws would beexpected to strengthen the results.
The lack of a control group is di�cult to address; a control group of Scotlandor Ireland would create the ideal experiment to use di↵erence in di↵erences.
15

Although, Scottish students face a di↵erent decision, they have the option tostudy in Scotland for free, or face the same charges as other students by studyingin other parts of the UK. This causes a self selection bias, and one could expectstudents to stay in Scotland causing a lack of independence between the twocountries and creating an endogeneity problem.
The restriction to seven years causes interpretation issues. Robustness toa short run response dummy doesn’t equate to a concrete conclusion that theresults can be interpreted as an indefinite e↵ect. The concern persists as thecoe�cient on the short run dummy is considerably larger than that of the post-reform dummy, suggesting a short run e↵ect is more likely. Additionally, thedata in figure 3 suggests a return to trend by 2014; hence, it would have beenpreferable to test over a longer time frame. If the cap on maximum courseattendance wasn’t removed in 2015, a more robust test of a short run e↵ectcould have been undertaken. Thus, it is certain that the policy had an e↵ect,but its duration remains ambiguous.
It is possible to mitigate, at least partly, the biases of omitted variables. Soo& Elliott (2010) argue that international student fees aren’t the most importantdecision in variation of international students; London and campus environmentplay a more integral role, which are both controlled for. Furthermore, followingJena & Reilly (2013), US GDP acts as a proxy for global economic health, whichpartially controls for increasing wealth driving international student demand.In addition, it is important to understand the main aim of this analysis is tolook at how a discontinuous jump in domestic fees a↵ected the student body.International students experienced fee changes in line with inflation, and assuch the shock to domestic fees will have far more of an important impact thaninternational fees.
Also, the additions of the national scholarship fund of £50 million per an-num and government expenditure on education are omitted due to collinearity.However, their inclusion would only have strengthened the e↵ect of the reform,as a scholarship fund should have a positive e↵ect on domestic attendance. Inaddition, competitors’ admissions policies over the period, such as Canada andUSA, were stable with no fee changes that would indirectly increase interna-tional attendance in the UK.
Finally, the low ranking interpretations should be taken with caution as thisanalysis implies all yearly variation is driven by the change in tuition fees, whichis a very unrealistic, but unavoidable assumption without further controls.
6 Conclusion
The aim of this research is to analyse the UK domestic undergraduate tuitionfee rise at the start of the 2012/13 academic year and determine its e↵ect on theinternationalisation of UK universities. Overall, there is significant evidence ofincreased international share of undergraduate cohorts as a result of tuition feeincreases; the e↵ect diminishing the lower the university lies in rankings due to aweakening substitution e↵ect. High ranking universities experienced an increase
16

of 0.8 percentage points in share of international students, in comparison to a 0.7percentage point increase in lower ranked universities at mean characteristics.Although, this should be taken with caution; the endurance of the e↵ect remainsambiguous and other e↵ects may have influenced the low ranking interpretation.
The significant internationalising e↵ect on the student body from raising tu-ition fees opens up interesting avenues for further research. Potential benefits ofa more rounded education from more international cohorts with a wider rangeof global views and the e↵ect of an integrated campus on student performancewould be an eloquent extension to explore the implications for attainment. Suchresearch would be timely given the impending review into tuition fees. The di-versity of universities should not be overlooked when considering the financialopportunities available to UK students, especially as this research suggests every£1,000 reduction in fees could induce a 0.15 percentage points fall in interna-tional share with potential unintended e↵ects on attainment.
17

References
Agarwal, V. B. & Winkler, D. R. (1985), ‘Foreign demand for united stateshigher education: a study of developing countries in the eastern hemisphere’,Economic Development and Cultural Change 33(3), 623–644.
Altbach, P. (2015), ‘Knowledge and education as international commodities’,International higher education (28).
Barr, N. & Crawford, I. (1998), ‘The dearing report and the government’s re-sponse: a critique’, The Political Quarterly 69(1), 72–84.
Browne, J. (2010), ‘Securing a sustainable future for higher education: an inde-pendent review of higher education funding and student finance’.
Chevalier, A. (2011), ‘Subject choice and earnings of uk graduates’, Economicsof Education Review 30(6), 1187–1201.
Chowdry, H., Crawford, C., Dearden, L., Goodman, A. & Vignoles, A. (2013),‘Widening participation in higher education: analysis using linked adminis-trative data’, Journal of the Royal Statistical Society: Series A (Statistics inSociety) 176(2), 431–457.
Cordaro, J. (1984), ‘International students and study-abroad programs: A selectbibliography’, Comparative Education Review 28(2), 300–339.
Crawford, C. & Dearden, L. (2010), ‘The impact of the 2006-07 he financereforms on he participation (bis research paper no. 13)’.
Dearden, L., Fitzsimons, E. & Wyness, G. (2011), The impact of tuition fees andsupport on university participation in the uk, Technical report, IFS WorkingPapers.
Dearden, L., Fitzsimons, E. & Wyness, G. (2014), ‘Money for nothing: Estimat-ing the impact of student aid on participation in higher education’, Economicsof Education Review 43, 66–78.
Foskett, N., Roberts, D. & Maringe, F. (2006), Changing fee regimes and theirimpact on student attitudes to higher education, University of SouthamptonSouthampton, England.
Goodman, A. & Kaplan, G. (2003), ’Study now, pay later’or’HE for free’? Anassessment of alternative proposals for higher education finance.
Healey, N. M. (2008), ‘Is higher education in really ‘internationalising’?’, Highereducation 55(3), 333–355.
Heller, D. E. (1997), ‘Student price response in higher education: An update toleslie and brinkman’, The Journal of Higher Education 68(6), 624–659.
18

Jena, F. & Reilly, B. (2013), ‘The determinants of united kingdom student visademand from developing countries’, IZA Journal of Labor & Development2(1), 6.
Leslie, L. L. & Brinkman, P. T. (1987), ‘Student price response in higher ed-ucation: The student demand studies’, The Journal of Higher Education58(2), 181–204.
Maringe, F. (2006), ‘University and course choice: Implications for positioning,recruitment and marketing’, International Journal of Educational Manage-ment 20(6), 466–479.
Mazzarol, T. & Soutar, G. N. (2002), ‘“push-pull” factors influencing interna-tional student destination choice’, International Journal of Educational Man-agement 16(2), 82–90.
Sa, F. et al. (2014), The e↵ect of tuition fees on university applications andattendance: Evidence from the uk, Technical report, Institute for the Studyof Labor (IZA).
Soo, K. T. & Elliott, C. (2010), ‘Does price matter? overseas students in ukhigher education’, Economics of Education Review 29(4), 553–565.
Spence, M. (1973), ‘Job market signaling’, The quarterly journal of Economics87(3), 355–374.
Weiss, A. (1995), ‘Human capital vs. signalling explanations of wages’, TheJournal of Economic Perspectives 9(4), 133–154.
Wilkins, S., Shams, F. & Huisman, J. (2013), ‘The decision-making and chang-ing behavioural dynamics of potential higher education students: the impactsof increasing tuition fees in england’, Educational Studies 39(2), 125–141.
19

A Appendix
A.1 Summary statistics
Variables regarding rankings data is collected from the Good UniversityGuide. Each university has seven observations of each variable over time. Vari-ables including median graduate salary, national scholarship fund and govern-ment expenditure don’t vary by institution. US GDP is taken from the IMFstatisitics database.
20

21

A.2 Pooled OLS
Pooled OLS results demonstrate the innate issues of heterogeneity omission.Including a rank and trend multiplicative in column 3 begins to highlight suchissues, with higher ranked universities having a much sharper increase year onyear compared to lower ranking universities. This motivates a movement tomore complex models where heterogeneity and further controls can be capturedby the university fixed e↵ects model.
22

A.3 Fixed e↵ects and subgroup determination
Table 3a represents an advancement to university fixed e↵ects analysis, whereindividual university heterogeneity over time is captured. Variables such asdistance to London, which heavily influences international demand, is accountedfor in the individual university dummies. There is a clear change from thepooled OLS analysis, as the post-reform dummy is significant and positive. Thisdenotes an increase in the international share of the student population and isdecreasing in rank. Trend remains significant throughout the analysis despitethe London trend being insignificantly di↵erent from 0. The final column movestowards the final models and gives evidence for why the split hypothesis mayrequire di↵erent models due to varying structures of universities by rank. Lowerranked universities rely less on international attendance due to a lower prestigedrawing in students, this is represented with a much lower post-reform and trende↵ects as the rank decreases, which is a proxy for prestige.
As mentioned in the results section, the e↵ect falls to insignificant and zerofor the lowest ranked universities in the model outlined in column three. Testingat the third quartile of ranks (rank = 86th), a test on the overall e↵ect of thepost-reform e↵ect is insignificant with a p-value of 0.6289. Further testing findsthat there is no significant e↵ect of the policy for universities ranked 63 or below.This falls within the hypothesis provided that higher ranked universities havea larger substitution e↵ect and, therefore, a significant change in their cohortcomposition.
23

Table 3b is pivotal in determining the sub groups which will be used to buildthe final models. It is clear that rank is significant and variables individuale↵ects are heavily influenced by where a university sits in the rankings. This istrue of both the post-reform and trend e↵ects. In determining the sub groupseach variable in the model, including the controls, are allowed to vary by rankand, although not included in table 3b, Highrank. This variable registers 0for universities outside the top 50 and 1 otherwise. Testing for systematicdi↵erences in coe�cients by rank and by Highrank gives p-values of 0.0000.This concludes that there is a systematic structural di↵erence and, hence, aneed for separate models. Obviously this cannot be done by rank, and dividingbetween top 50 and other universities becomes the natural point to split at.This is due to the significant test and allows su�cient observations for a modelto be satisfactorily estimated.
24

A.4 Low rank model testing
The tests here look to determine if there are di↵erence in the yearly dummiesat a range of di↵erent ranks. It doesn’t give the full picture of outcomes, how-ever, it shows how past a certain rank the e↵ect falls to zero and insignificant.This fits with the hypothesis of a diminishing substitution e↵ect.
25

A.5 Robustness
The results in table 6 outline three key robustness tests. Firstly, there isno pre-emption of the policy. The negative sign is in line with the literature,which found that there was a drop in the number of individuals taking gapyears in 2011 to avoid paying higher levels of fees, however, it is not significant.Secondly, the policy is robust to the policy e↵ect dissipating after a year; theShock regression outlines that there is no statistically significant evidence of aone-year shock. Finally, the short run regression finds that the regression isrobust to a short run e↵ect.
However, the large coe�cient compared to the post-reform dummy coe�-cient is a cause for concern and highlights a major limitation of the analysis.The removal of the cap on the number of places universities could o↵er in 2015means that there is a limit of three years over which this shock can be analysed.Given the magnitude of the short run and post-reform coe�cients in columnthree, it is entirely plausible that this limit changes how the policy is inter-preted. As mentioned in the conclusion, the longevity of the e↵ect is called intoquestion by this result.
26