Universitätsklinikum Ulm Zentrum für Innere Medizin Klinik ...
98
Universitätsklinikum Ulm Zentrum für Innere Medizin Klinik für Innere Medizin III Hämatologie, Onkologie, Rheumatologie und Infektionskrankheiten Ärztlicher Direktor: Prof. Dr. med. Hartmut Döhner RAS, KIT, FLT3 and JAK2 Gene Mutations in Acute Myeloid Leukemia (AML) with inv(16) and t(8;21): Incidence and Relevance on Clinical Outcome Dissertation for the attainment of the Doctoral Degree of Medicine (Dr. med.) at the Faculty of Medicine, University of Ulm, Ulm, Germany Presented by Juan Du born in Mudanjiang, Heilongjiang Province, P. R. China 2007
Transcript of Universitätsklinikum Ulm Zentrum für Innere Medizin Klinik ...
Universitätsklinikum Ulm
Zentrum für Innere Medizin
Klinik für Innere Medizin III
Hämatologie, Onkologie, Rheumatologie und
Infektionskrankheiten
Ärztlicher Direktor: Prof. Dr. med. Hartmut Döhner
RAS, KIT, FLT3 and JAK2 Gene Mutations in
Acute Myeloid Leukemia (AML) with inv(16)
and t(8;21): Incidence and Relevance on
Clinical Outcome
Dissertation
for the attainment of the
Doctoral Degree of Medicine (Dr. med.)
at the Faculty of Medicine, University of Ulm, Ulm, Germany
Presented by Juan Du
born in Mudanjiang, Heilongjiang Province, P. R. China
2007

Amtierender Dekan:
1. Berichterstatter:
2. Berichterstatter:
Tag der Promotion:

Content
I
Content
Abbreviations……………………………………………………………… III
1. Introduction........................................................................................... 1
1.1. Acute myeloid leukemia.......................................................................... 1
1.2. Prognostic subgroups based on cytogenetic findings ............................. 3
1.2.1. Core binding factor (CBF) acute myeloid leukemia................................. 5
1.3. Mutation classes in AML......................................................................... 9
1.3.1. Class I mutations .................................................................................. 10
1.3.2. Class II mutations ................................................................................. 15
1.4. The aim of the study ............................................................................. 16
2. Material and Methods ......................................................................... 18
2.1. Material................................................................................................. 18
2.1.1. DNA extraction...................................................................................... 18
2.1.2. Polymerase chain reaction (PCR)......................................................... 18
2.1.3. Agarose gel electrophoresis ................................................................. 20
2.1.4. Denaturing high performance liquid chromatography (DHPLC)............ 20
2.1.5. Purification of PCR products................................................................. 21
2.1.6. Cycle sequencing reaction (CSR)......................................................... 21
2.1.7. Dye removal.......................................................................................... 21
2.1.8. Direct DNA sequencing ........................................................................ 21
2.2. Patients................................................................................................. 21
2.3. Treatment ............................................................................................. 23
2.4. Cytogenetic and molecular genetic analysis......................................... 25
2.5. Analysis of RAS, KIT, FLT3 and JAK2 gene mutations ........................ 25
2.5.1. DNA extraction...................................................................................... 25
2.5.2. Polymerase chain reaction (PCR)......................................................... 26
2.5.3. PCR with restriction fragment length polymorphism (PCR-RFLP)........ 26
2.5.4. Detection of JAK2 mutations using allele-specific PCR........................ 27
2.5.5. Agarose gel electrophoresis ................................................................. 28
2.5.6. Isolation of the DNA fragments from agarose gels ............................... 28
2.5.7. Denaturing high performance liquid chromatography (DHPLC)............ 28
2.5.8. Purification of PCR products................................................................. 30
2.5.9. Cycle sequencing reaction (CSR)......................................................... 31

Content
II
2.5.10. Dye removal using DyeEx spin kit ........................................................ 31
2.5.11. Direct DNA sequencing ........................................................................ 31
2.5.12. Sensitivity of DHPLC and sequencing assay........................................ 31
2.6. Statistical analyses ............................................................................... 32
3. Results................................................................................................. 33
3.1. Incidence of RAS, KIT, FLT3 and JAK2 gene mutations ...................... 33
3.1.1. RAS mutations...................................................................................... 34
3.1.2. KIT mutations........................................................................................ 35
3.1.3. FLT3 mutations ..................................................................................... 36
3.1.4. JAK2 mutations..................................................................................... 36
3.2. Associated gene mutations................................................................... 36
3.2.1. Associated gene mutations in inv(16)-positive patients ........................ 36
3.2.2. Associated gene mutations in t(8;21)-positive patients......................... 37
3.3. Patients characteristics......................................................................... 38
3.3.1. Pretreatment characteristics for inv(16)-positive patients ..................... 38
3.3.2. Pretreatment characteristics for t(8;21)-positive patients...................... 43
3.4. Response to induction therapy ............................................................. 48
3.4.1. Response to induction therapy for inv(16)-positive patients ................. 48
3.4.2. Response to induction therapy for t(8;21)-positive patients .................. 48
3.5. Survival analysis ................................................................................... 51
3.5.1. Survival analysis for inv(16)-positive patients ....................................... 51
3.5.2. Survival analysis for t(8;21)-positive patients........................................ 56
4. Discussion .......................................................................................... 60
4.1. RAS analysis ........................................................................................ 60
4.2. KIT analysis .......................................................................................... 62
4.3. FLT3 analysis ....................................................................................... 64
4.4. JAK2 analysis ....................................................................................... 66
4.5. Conclusion............................................................................................ 67
5. Summary ............................................................................................. 69
6. References .......................................................................................... 71
7. Curriculum vitae ................................................................................. 87
8. Acknowledgements ............................................................................ 90

Abbreviations
III
Abbreviations
ACN Acetonitrile
Allo-SCT Allogeneic stem-cell transplantation
AML Acute myeloid leukemia
AMLSG AML Study Group
APL Acute promyelocytic leukemia
ATRA all-transretinoic acid
Auto-SCT Autologous stem-cell transplantation
BM Bone marrow
bp Base pair
CBF Core-binding factor
CBFB Core-binding factor β
CBFs Core-binding factors
CEP Anti-cancer compound
CI Confidence interval
CIR Cumulative incidence of relapse
CALGB Cancer and Leukemia associated Group B
CMPD Chronic myeloproliferative diseases
CNS Central nervous system
CR Complete remission
CRi Complete remission with incomplete hematological recovery
CSR Cycle sequencing reaction
DFS Disease-free survival
DHPLC Denaturing high performance liquid chromatography
DNA Deoxyribonucleic acid
dNTP Deoxynucleotide triphosphate
ED Early death
EDTA Ethylene diaminetetraacetic acid
EFS Event-free survival
EML Extramedullary involvement
ETO Eight twenty-one
EUN N-ethyl-N-nitorsourea
FAB French-American-British

Abbreviations
IV
FISH Fluorescence in situ hybridization
FTIs Farnesyl transferase inhibitors
GISTs Gastrointestinal stromal tumors
HAM High-dose cytarabine and mitoxantrone
HiDAC High-dose cytarabine
HOVON Hemato-Oncologie voor Volwassenen Nederland
HPV Human papilloma virus
HR Hazard ratio
HSC Hematopoietic stem cell
HSCs Hematopoietic stem cells
HSPCs Hematopoietic stem/progenitor cells
HUGO Human Genome Organization
IC Idarubicin, cytarabine
ICE Idarubicin, cytarabine, etoposide
IDAC Intermediate-dose cytatabine
IE Idarubicin, etoposide
ins/del Insertion/deletion mutations
inv(16) Inversion inv(16)
ITD Internal tandem duplication
JAK Janus kinase
JM Juxtamembrane
KI Kinase insert
LDH Lactate dehydrogense
LSCs Leukemia stem cells
MCD Mast cell disease
MDS Myelodysplastic syndrome
MgCl2 Magnesium chloride
MgSO4 Magnesium sulfate
MPD Myeloproliferative disorders
MRC AML 10 Medical Research Council's 10th AML trial
MYH11 Myosin heavy chain 11
NCAM Neural cell adhesion molecule
OR Odds ratio
OS Overall survival

Abbreviations
V
PB Peripheral Blood
PCR Polymerase chain reaction
PCR-RFLP PCR with restriction fragment length polymorphism
PDGFRa Platelet-derived growth factor- receptor-α
PDGFRB Platelet-derived growth factor- receptor-β
PKC Protein Kinase C
PML Promyelocytic leukaemia
RARA Retinoid-acid receptor-α
RD Resistant disease
RFS Relapse-free survival
rpm Rotation per Minute
RT-PCR Reverse transcription-polymerase chain reaction
RTKs Receptor tyrosine kinases
RUNX1 Runt-related transcription factor 1
S-AML Secondary AML
SCF Stem cell factor
SCT Stem cell transplantation
SMMHC Smooth-muscle myosin heavy chain
SNL Sinonasal lymphomas
STAT Signal transducer and activator of transcription
STI571 Signal transduction inhibitor number 571
t(8;21) Translocation t(8;21)
t-AML Therapy-related AML
TE Tris-EDTA
TEAA Triethylammonium acetate
TK Tyrosine kinase
TKD Tyrosine kinase domain
TKIs Tyrosine kinase inhibitors
TM Transmembrane domain
Tris Tris (hydroxymethyl) aminomethane
UV light Ultraviolet light
WBC White blood cell
WHO World Health Organization

Introduction
1
1. Introduction
1.1. Acute myeloid leukemia
Acute myeloid leukemia (AML) is a heterogeneous malignant hematopoietic
disorder characterized by clonal expansion of immature myeloid cells in the bone
marrow, blood or other organs. The affected cells underly an uncontrolled
proliferation and impaired differentiation program. Typically, the cells are blocked at
various maturation steps and are resistant to cell death (Martelli et al. 2006). AML
accounts for approximately 80% of all adult leukemias. Complete remission (CR)
can be achieved in approximately 60% to 70% of adult AML following appropriate
induction therapy and more than 15% of the AML patients (about 25% of those who
attain CR) can be expected to survive 3 or more years and may be cured (Tallman
et al. 2005). Increased morbidity and mortality during induction therapy appear to
be directly related to age, as well as other adverse prognostic factors including
central nervous system (CNS) involvement, severe infection at diagnosis, elevated
white blood cell (WBC) count, treatment-induced AML, or history of
myelodysplastic syndrome (MDS) (Campos et al. 1992; Lowenberg et al. 1999).
Standard in the diagnosis of AML is the cytologic examination of
Wright-Giemsa or May-Grünwald Giemsa stained blood and bone marrow smears
by light microscopy allowing reproducible classification by experienced
morphologists in most of the cases. Until 1999, the most widely used AML
classification was the French-American-British (FAB) classification that described
the degree of differentiation and the lineage of leukemia based on predominantly
morphological criteria (Table 1) (Bennett et al. 1985). The FAB classification also
included cytochemical stains. With the intention to link previous, predominantly
morphologic classification systems with newly emerging scientific data, the current
World Health Organization (WHO) classification of hematopoietic neoplasms was
recently implemented. This new classification comprises four major categories of
AML (Table 2) (Harris et al. 1999).

Introduction
2
Table 1. FAB classification of AML (Bennett et al. 1985)
FAB: French-American-British; AML: Acute myeloid leukemia.
Table 2. WHO classification of AML (Harris et al. 1999)
Category Morphology Incidence (%)
AML with recurrent
cytogenetic
translocations
AML with t(8;21)(q22;q22), AML1/ETO
AML with (15;17)(q22;q11-12), (PML/RAR α)
and variants,
AML inv(16)(p13q22) or t(16;16)(p13;q11),
(CBFb/MYH11)
AML with 11q23 (MLL) abnormalities
5-12
10-15
5
3-5
AML with multilineage
dysplasia
With prior myelodysplastic syndrome
Without prior myelodysplastic syndrome
10-15
AML and
mylodysplastic
syndromes (MDS),
therapy-related
Alkylating agent–related
Epipodophyllotoxin-related (some maybe
lymphoid)
Other types
5-10
AML not otherwise
categorized
AML minimally differentiated
AML without maturation
AML with maturation
Acute myelomonocytic leukemia
Acute monocytic leukemia
Acute erythroid leukemia
Acute megakaryocytic leukemia
Acute basophilic leukemia
Acute panmyelosis with myelofibrosis
40-50
WHO: World Health Organization; AML: Acute myeloid leukemia; ETO: Eight twenty-one;
CBFb : Core-binding factor β; MYH11: Myosin heavy chain 11.
Category Morphology Incidence (%)
M0 AML with differentiation 3
M1 AML without maturation 15-20
M2 AML with maturation 25-30
M3 Acute promyelocytic leukemia (APL) 5-10
M4 Acute myelomonocytic leukemia 25-30
M5 Acute monocytic/monoblastic leukemia 2-10
M6 Acute erythroleukemia 3-5
M7 Acute megakaryoblastic leukemia 3-12
Introduction
3
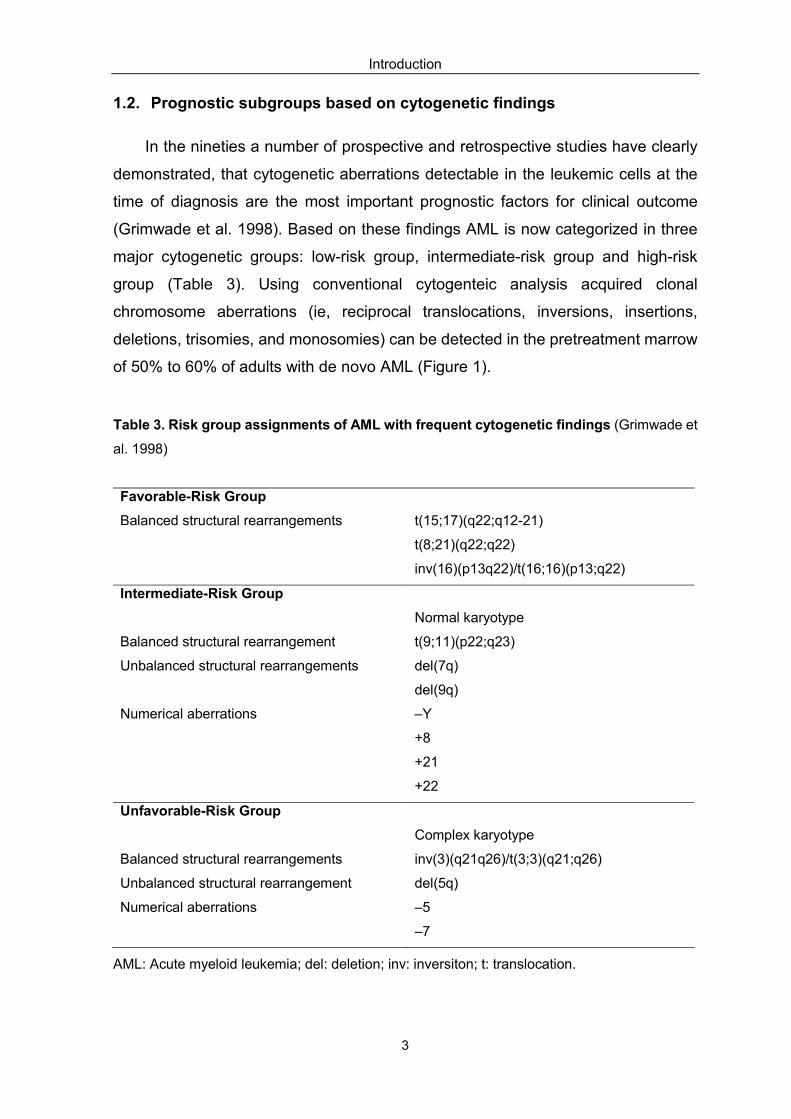
1.2. Prognostic subgroups based on cytogenetic findings
In the nineties a number of prospective and retrospective studies have clearly
demonstrated, that cytogenetic aberrations detectable in the leukemic cells at the
time of diagnosis are the most important prognostic factors for clinical outcome
(Grimwade et al. 1998). Based on these findings AML is now categorized in three
major cytogenetic groups: low-risk group, intermediate-risk group and high-risk
group (Table 3). Using conventional cytogenteic analysis acquired clonal
chromosome aberrations (ie, reciprocal translocations, inversions, insertions,
deletions, trisomies, and monosomies) can be detected in the pretreatment marrow
of 50% to 60% of adults with de novo AML (Figure 1).
Table 3. Risk group assignments of AML with frequent cytogenetic findings (Grimwade et
al. 1998)
AML: Acute myeloid leukemia; del: deletion; inv: inversiton; t: translocation.
Favorable-Risk Group
Balanced structural rearrangements t(15;17)(q22;q12-21)
t(8;21)(q22;q22)
inv(16)(p13q22)/t(16;16)(p13;q22)
Intermediate-Risk Group
Normal karyotype
Balanced structural rearrangement t(9;11)(p22;q23)
Unbalanced structural rearrangements del(7q)
del(9q)
Numerical aberrations –Y
+8
+21
+22
Unfavorable-Risk Group
Complex karyotype
Balanced structural rearrangements inv(3)(q21q26)/t(3;3)(q21;q26)
Unbalanced structural rearrangement del(5q)
Numerical aberrations –5
–7

Introduction
4
Figure 1. Genotypic diversity of AML based on the different cytogenetic subgroups.
AML: acute myeloid leukemia.
Based on the proposed WHO classification, the first group is defined by
leukemias exhibiting specific gene fusions resulting from balanced translocations or
inversions like the translocation t(15;17) associated with acute promyelocytic
leukemia (APL), the inversion/translocation inv(16) and the translocation t(8;21).
AML associated with either t(8;21) or inv/t(16) represents the so called core binding
factor (CBF) leukemias, affecting the same transcription factor complex. In addition,
chromosomal translocations of band 11q23 involving the MLL gene belongs to this
cytogenetic subgroup of AML. These four groups are now recognized as specific
genetically defined subsets within the WHO classification.
The second group is defined by the large subset of AMLs with normal
karyotype which comprises approximately 45% to 50% of AMLs. In these cases
submicroscopic lesions can not be detected by conventional chromosome banding
analysis.
The remaining 30% of AMLs exhibit other abnormalities, mainly aneuploidies,
such as trisomies, monosomies or deletions, including the cases with complex
karyotype. Interestingly, to date almost no gene has been identified that is targeted
by these abnormalities.
In recent years a large number of gene aberrations have been identified in
normal karyotype AML, some of them providing novel insights into the pathology
mechanisms of leukemia. In addition, some of these gene alterations are of
42% normal karyotype
29% other
abnormalities11% t(15;17)
7% inv(16)
6% t(8;21)
5% t(11q23)
genes involved?

Introduction
5
prognostic relevance and are now being used for risk-stratification of the patients.
1.2.1. Core binding factor (CBF) acute myeloid leukemia
Inversion or translocation of chromosome 16 [inv(16)(p13q22) or
t(16;16)(p13;q22)], hereafter abbreviated inv(16) and translocation t(8;21)(q22;q22)
abbreviated t(8;21) belong to the most common cytogenetic abnormalities in AML
(Erichkson et al. 1992; Liu et al. 1993). At the molecular level, these genomic
aberrations are characterized by the disruption of genes encoding different subunits
of the core binding factor family. Patients with CBF AML are considered to have a
favorable outcome, in particular when treated with cytarabine-based consolidation
regimens. However, a significant proportion of these patients relapse and survival
after 5 years is about 50%. These findings suggest that additional genetic lesions
are underlying the clinical heterogeneity.
1.2.1.1. Molecular biology of CBF AML
The core-binding factors (CBFs) are heterodimeric transcription factors that
serve, in part, as overseers and regulators of hematopoietic ontogeny (Speck et al.
2002). The CBF family consists of three distinct DNA binding CBFα subunits
(RUNX1, RUNX2 and RUNX3), and a common non-DNA-binding CBFβ subunit that
is encoded by CBFB. RUNX1 — the first mammalian CBF gene to be isolated —
has been known by a number of names, originally AML1 — which remains the most
commonly used name in the literature — but also PEBPA2B and CBFA2, in 1999,
which was renamed by the Human Genome Organization (HUGO), and is now
formally known as runt-related transcription factor 1 — RUNX1. The CBFα subunit
binds directly to the enhancer core DNA sequence on target genes, whereas the
beta subunit does not bind the DNA directly but increases the affinity and stabilizes
the binding of the alpha subunit to the DNA. The RUNX1 and CBFB genes are
required for hematopoietic stem cell (HSC) emergence during development, and
are key regulators of hematopoiesis at several steps (Speck et al. 2002). The CBFβ
subunit is encoded by CBFB on chromosome 16q22 and is disrupted by
inv(16)(p13q22) or t(16;16)(p13;q22) (Liu et al. 1993). RUNX1, located on
chromosome band 21q22, is disrupted by t(8;21)(q22;q22) (van der Reijden et al.
1997).

Introduction
6
1.2.1.1.1. inv(16)(p13q22) and t(16;16)(p13;q22)
At the molecular level, inv(16)(p13q22) and t(16;16)(p13;q22) both result in the
fusion of the CBFβ gene from chromosome 16q22 with the MYH11 (myosin heavy
chain 11) gene from chromosome 16p13 (Liu et al. 1993; Lowenberg et al. 1999).
The MYH11 gene encodes a smooth-muscle myosin heavy chain (SMMHC) (van
der Reijden et al. 1993). Two novel fusion genes, CBFβ/MYH11 and MYH11/ CBFβ,
are created as a result of the inversion of chromosome 16 but only the first appears
to be critical in leukemogenesis. Several studies have demonstrated that the
genomic breakpoints within CBFβ and MYH11 are extremely variable, and at least
eight types of CBFβ/MYH11 fusion transcripts have been identified by reverse
transcription-polymerase chain reaction (RT-PCR), which the most common is
referred to as type A detected in approximately 85% of patients with AML and inv(16)
(Claxton et al. 1994; Liu et al. 1995).
The mechanism whereby the CBFβ/MYH11 fusion gene leads to malignant
transformation remains to be fully elucidated (Liu et al. 1995). Data from murine
models appear to support the hypothesis that CBFβ/MYH11 interferes with normal
hematopoiesis in a dominant-negative manner. Mice lacking the CBFβ gene or
which are heterozygous for a CBFβ/MYH11 allele produce an identical phenotype in
which the animals lack fetal liver hematopoiesis, resulting in early embryonic death
(Castilla et al. 1996; Wang et al.1996).
1.2.1.1.2. t(8;21)(q22;q22)
The translocation t(8;21)(q22;q22) is a balanced translocation between
chromosomes 8 and 21, resulting in the fusion of the acute myeloid leukemia 1
(AML1) gene from chromosome 21q22 with the eight twenty-one (ETO) gene on
chromosome 8q22 (Erickson et al. 1992; Nucifora et al. 1993). In this translocation,
the first five exons of AML1 are fused to almost the entire ETO gene (Erickson et al.
1992; Miyoshi et al.1991). The AML1 N-terminus contains the DNA binding motif;
the C-terminus of the ETO gene contains a domain that appears necessary for
transcriptional activation (Ito Y. 1996). The ETO gene encodes a protein with two
putative zinc-fingers and several proline-rich regions. It is presumed to function as
a transcription factor (Miyoshi et al. 1993).

Introduction
7
In t(8;21)(q22;q22) AML, the AML1/ETO fusion gene is created on the
derivative chromosome 8. This gene encodes the AML1/ETO fusion transcript that
is believed to play a primary role in leukemogenesis (Erickson et al. 1992; Nucifora
et al. 1993). Loss of either AML1 or ETO results in embryonic lethality with
complete lack of definitive hematopoietic stem cells (HSCs) (Wang et al. 1996). In
addition, it was recently reported that AML1+/– adult mice suffer from a 50%
reduction of long-term repopulating stem cells (Sun et al. 2004). Although it is yet
not fully understood how the AML1-ETO fusion gene contributes to
leukemogenesis, it is thought that one key mechanism is the suppression of AML1-
and C/EBPα- dependent activation of genes responsible for myeloid development
(Licht et al. 2001; Pabst et al. 2001). In vivo and ex vivo analyses demonstrated
that alterations in the differentiation pattern and proliferative capacity of murine
hematopoietic cells expressing the fusion gene (Rhoades et al. 2000; Fenske et al.
2004). However, numerous murine in vivo models documented that AML1-ETO on
its own is not able to induce leukemia (Castilla et al. 1996; Rhoades et al. 2000),
suggesting that introduction of additional genetic changes might contribute to
t(8;21)-positive AML pathogenesis through their constitutive activation.
Since the results of these studies appear very similar to those obtained from
studies of mice lacking the CBFβ gene or which are heterozygous for a
CBFβ/MYH11 allele, it is reasonable to postulate the existence of a common
pathway that leads to the leukemic phenotype in CBF AML. The leukemogenic role
of the AML1-ETO protein is further supported by preliminary evidence showing that
AML1-ETO chimeric mice created with the "knocking-in" methodology may develop
myelomonocytic leukemia when a second "hit" event is induced with a chemical
mutagen at a sublethal dose (Schwieger et al. 2002).
1.2.1.2. Clinical features and prognostic factors in CBF AML
1.2.1.2.1. inv(16)/t(16;16)-positive AML
AML with inv(16) is found in approximately 10% to 12% of all AML cases,
predominantly in FAB subtype M4eo that is characterized by an abnormal
eosinophilic differentiation (Le Beau et al. 1983). Inv(16) has been found to be
associated with higher WBC count, percentages of peripheral blood (PB) or bone
marrow (BM) blasts, more often EML, in particular lymphadenopathy, splenomegaly,
Introduction
8
gingival hypertrophy and skin/mucosa involvement (Marcucci et al. 2005;
Appelbaum et al. 2006). Based on the individual patient data-based meta-analysis
performed by Schlenk et al. (2004) trisomy 22 was a significant prognostic variable
for longer RFS. These findings have been confirmed by the CALGB showing a lower
cumulative incidence of relapse (CIR) for patients with additional trisomy 22
compared to patients with inv(16) as a sole abnormality (Marcucci et al. 2005).
1.2.1.2.2. t(8;21)-positive AML
AML with the t(8;21) is associated with the M2 subtype and accounts for 5% to
12% of cases of AML. t(8;21) AML is frequently associated with specific
characteristics, such as myeloid precursors containing Auer rods (Bloomfield et al.
1987), immunophenotypic aberrant expression of the CD19 (Kita et al. 1992) and
the CD56 antigen (Reuss-Borst et al. 1994) and, in some patients, by
extramedullary disease (EML) (granulocytic sarcomas) (Bloomfield et al. 1987;
Tallman et al. 1993).
Additional cytogenetic, immunophenotypic and clinical features have been
found in t(8;21) and some of them appear to have a prognostic impact on patients'
outcome. In a recent individual patient data-based meta-analysis (Schlenk et al.
2004) performed on 392 adults with CBF AML significant prognostic variables for
longer relapse free survival (RFS) and overall survival (OS) were lower WBC and
higher platelet counts in the t(8;21) group. In addition, loss of the Y chromosome in
male patients was prognostic for shorter OS. For patients who experienced relapse,
second CR rate was significantly lower in patients with t(8;21), resulting in a
significantly inferior survival after relapse compared to patients with inv(16). In
analogy to inv(16)-assocaited leukemias these data have been confirmed in a study
by the Cancer and Leukemia associated Group B (CALGB) (Marcucci et al. 2005).
In this study a possible interaction between secondary chromosome abnormalities
and race in patients with t(8;21) was observed. Finally, immunophenotypic
expression of the neural cell adhesion molecule (NCAM) CD56 appears to be
associated with an inferior outcome in CBF leukemia (Baer et al. 1997; Raspadori et
al. 2001).

Introduction
9
1.2.1.3. Treatment of primary CBF AML
In almost all studies of adult AML, CBF leukemia has been associated with a
very high CR rate (approximately 90%) and the longest disease-free survival (DFS)
at 5 years (approximately 50%), especially after dose-intensified cytarabine-based
postremission therapy (Mrózek et al. 1997). Most important data came from the
CALGB trial demonstrating that the cure rate can be improved with 3 or 4 cycles of
intermediate-dose (IDAC) or high-dose cytarabine (HiDAC) as opposed to 1 cycle
(Bloomfield et al. 1998; Byrd et al. 2002). In the study by Schlenk et al. (2004) for
postremission therapy, intention-to-treat analysis revealed no difference between
intensive HiDAC-based chemotherapy and autologous transplantation in the t(8;21)
group as well as no difference between chemotherapy, autologous, and allogeneic
transplantation in the inv(16) group, which is consistent with the data from Medical
Research Council's 10th AML trial (MRC AML 10) (Grimwade et al. 1998), and
French AML Intergroup (Delaunay et al. 2003).
Despite the fact that CBF leukemias are considered as "favorable/low-risk" with
5-year survival probabilities of 60% to 70%, RFS is worse with 40% to 50% of
patients relapsing and eventually die from their disease (Schlenk et al. 2004;
Marcucci et al. 2005). At this point the identification of these "high-risk patients" by
genetic profiling becomes important. In addition, the identification of novel molecular
markers might improve clinical outcome by using molecular targeted therapies as it
has been recently demonstrated for FLT3 mutated patients with normal karyotype
AML.
1.3. Mutation classes in AML
The genetic events underlying AML pathogenesis appear to fall into two
broadly defined complementation groups (Kelly et al. 2001): class I mutations that
activate signal transduction pathways, resulting in enhanced proliferation and/or
survival of hematopoietic progenitors and class II mutations affecting transcription
factors or components of the transcriptional co-activation complex, resulting in
impaired hematopoietic differentiation and/or aberrant acquisition of self-renewal
properties by hematopoietic progenitors (Figure 2) (Speck et al. 2002).

Introduction
10
In the model of Kelly and Gilliland both class I and class II mutations are
required for the development of the leukemic phenotype that is characterized by
proliferation and impaired differentiation of hematopoietic progenitors.
Figure 2. The model of cooperating mutations in acute leukemia (Speck et al. 2002). ATRA:
all-transretinoic acid; CBFB: core-binding factor β; CEP: anti-cancer compound; PDGFRB:
platelet-derived growth factor receptor β; PML: promyelocytic leukaemia; RARA: retinoid-acid
receptor; STI571: signal transduction inhibitor number 571, Gleevec; PKC: Protein kinase C.
1.3.1. Class I mutations
Prominent examples for class I mutations are mutations in the genes
belonging to the Class III receptor tyrosine kinase (RTKs) family, like the FMS
(Coussens et al. 1986), KIT (Yarden et al. 1987), FLT3 (Rosnet et al. 1993a),
PDGFRa (Claesson-Welsh et al. 1989) and PDGFRb genes (Yarden et al. 1986).
Class III RTK genes share structural characteristics with 5 immunoglobulin-like
domains (Matthews et al. 1991), a single transmembrane domain (TM), a
juxtamembrane (JM) domain, 2 intracellular tyrosine kinase domains (TK1 and TK2)
separated by a kinase insert (KI) domain, and a C-terminal domain in intracellular
regions (Figure 3) (Yarden et al. 1987). In addition, they share common
downstream affectors [RAS, JAK/STAT (Janus kinase/signal transducer and
activator of transcription)] that have emerged as significant components in the
BCR-ABL
RAS
FLT3
KIT
TEL-PDGFRB
NF1
PTPN11
? Others
RUNX1–ETO
CBFβ-MYH11TEL-AML1
PML- RARαNUP98-HOXA9
PU.1
C/EBPαAML1
AML1-AMP19
Acute Leukeamia
Class I mutationsProliferation and survival
Class II mutationsImpaired differentiation
STI571PKC412CEP-701Farnesyltransferaseinhibition
ATRAHistonedeacetylaeinhibitors

Introduction
11
pathogenesis of AML (Weiner et al. 2000; Stephenson et al. 2001).
Figure 3. Cartoon of class III RTK (Yarden et al. 1987). A schematic of a canonical class III
RTK monomer spanning the plasma membrane demonstrating five immunoglobulin-like
domains (Ig1–5) in the extracellular ligand binding region, a single TM, a JM, two intracellular
TK1 and TK2 divided by a KI. The position of reported mutations and their disease associations
for FLT3 and KIT are highlighted. AML: acute myeloid leukemia; CMPD: chronic
myeloproliferative diseases; GISTs: gastrointestinal stromal tumors; SNL: sinonasal
lymphomas; MCD: mast cell disease; MDS: Myelodysplastic syndrome; ins/del:
insertion–deletion mutations.
1.3.1.1. Candidates for class I gene mutations in CBF AML
1.3.1.1.1. RAS
RAS oncogenes encode a family of membrane-associated proteins that
regulate signal transduction on binding to a variety of membrane receptors. They
play important roles in the regulation of cellular proliferation, the cell cycle and
apoptosis (Byrne et al. 1998). In general, RAS mutations lead to a resistance of the
RAS proteins to signaling provided by GTPase activating proteins thus remaining in
the active GTP-bound state (Ahmadian et al. 1999; Seeburg et al. 1984). This
constitutive activity is further translated via a cascade of key signaling events that
contribute to the regulation of proliferation, apoptosis, and differentiation. There are
3 functional RAS genes — NRAS, KRAS, and HRAS — and all homologs carry

Introduction
12
mutations nearly exclusively in codons 12, 13, and 61, conferring constitutive
activation of the RAS protein, which subsequently is held in GTP-bound status.
Different RAS oncogenes are preferentially associated with different types of
human cancer (Kiyoi et al.1999; Beaupre et al. 1999). For example, KRAS
mutations are predominantly associated with pancreatic, lung, and colon cancers.
In myeloid malignancies, NRAS mutations occur in varying frequencies (11 - 40%)
more frequently than KRAS mutations (Bowen et al. 2005; Boissel et al. 2006;
Bacher et al. 2006), whereas HRAS mutations are rare (Bos JL.1989). In CBF AML,
NRAS mutations have been reported in approximately 13 - 38% of cases
(Panagopoulos et al. 1996; Kiyoi et al. 1999; Bacher et al. 2006); whereas KRAS
mutations vary from 2 - 23% (Kiyoi et al. 1999; Bacher et al. 2006; Boissel et al.
2006). To date, the prognostic impact of RAS mutation is still under discussion and
seems to depend on the type of the disease (Kiyoi et al.1999; Stirewalt et al. 2001;
Ritter et al. 2004)
1.3.1.1.2. KIT
Human c-KIT (CD117), the cellular counterpart of v-KIT, derived from the
Hardy–Zuckerman 4-feline sarcoma virus (Besmer et al. 1986), encodes a
glycoprotein receptor that binds stem cell factor (SCF, kit ligand, mast cell growth
factor). KIT is located in tandem on the chromosomal region 4q11-q13 (Gronwald et
al. 1990; Giebel et al. 1992). At the genomic level KIT spans more than 70 kb and
includes 21 exons (Vandenbark et al. 1992). KIT receptor is a member of the type
III receptor tyrosine kinase family, which also includes FLT3 and PDGFRs (Heinrich
et al. 2002). Activating mutations in KIT were first described in the mast cell
leukemia cell line HMC-1 and activating mutations in KIT have subsequently been
identified in AML, mastocytosis (Nagata et al. 1995; Longley et al. 1999), GIST and
seminoma/dysgerminoma (Hirota et al. 1998; Kemmer et al. 2004). Functional
studies demonstrated that these KIT mutations conferred cytokine-independent
survival and a growth advantage to cells (Kitayama et al. 1996).
Ligand-independent activation of KIT can be caused by gain-of-function mutations
that have been reported in between 12.8% and 48.1% of adult CBF AML (Wang et
al. 2005; Schnittger et al. 2006; Paschka et al. 2006). The prognostic significance
of KIT mutations in patients with CBF has been analyzed by several groups

Introduction
13
revealing inconsistent results (Care et al. 2003; Cairoli et al. 2006; Paschka et al.
2006). However, more recent data published by the CALGB in a large patient
cohort (Paschka et al. 2006) demonstrated that KIT mutations are associated with
a significantly adverse OS probability.
1.3.1.1.3. FLT3
The human FLT3 gene maps to chromosomal band 13q12 and is closely linked,
in a head-to-tail fashion, to FLT1, a class V RTK (characterized by seven
immunoglobulin-like domains) (Imbert et al. 1994). Recently, FLT3 gene has been
shown to comprise 24, rather than the expected 21 exons typical of other class III
RTKs, with seven instead of four exons encoding the first three immunoglobulin-like
repeats (Abu-Duhier et al. 2001). FLT3 is normally expressed by hematopoietic
stem/progenitor cells (HSPCs) and expression is lost as hematopoietic cells
differentiate. A large body of work has shown that FLT3 plays a role in survival,
proliferation and differentiation of hematopoeitic cells (Gilliland et al. 2002; Stirewalt
et al. 2003).
Activation of FLT3 by mutation results in autophosphorylation as well as
phosphorylation of a number of other proteins, either directly or indirectly.
Examination of these proteins clearly demonstrated that the major signal
transduction pathways leading from FLT3 include PI3-kinase/AKT, RAS/MAPK,
and STAT5 (Small D. 2006). FLT3 mutations are one of the most frequent somatic
alterations in AML, occurring in approximately 25% to 30% of patients. FLT3
mutations consist of two major types: internal tandem duplication (ITD) mutations of
3 - 400 base pair (bp) (always in frame) that map to the juxtamembrane region
(23% of AML patients) and point mutations that most frequently involve aspartic
acid 835 of the tyrosine kinase domain (TKD) but have also been found less
frequently in several other sites (8 - 12% of AML patients) (Yamamoto et al. 2001).
Recently, Schessl et al. (2005) showed that RUNX1-CBFA2T1 and the FLT3-ITD
mutation collaborate in inducing acute leukemia in a murine BM transplantation
model. Moreover, they identified additional FLT3-ITD, KIT and NRAS mutations in
28% of 135 t(8;21)-positive leukemias supporting the concept of oncogenic
cooperation between RUNX1-CBFA2T1 and activating gene mutations. Recently,
several study groups reported a substantial proportion of CBF AML patients

Introduction
14
carrying FLT3-ITD up to 9%, as well as TKD mutations in 2 - 7% (Yamamoto et al.
2001; Care et al. 2003; Boissel et al. 2006). Some studies have shown that patients
with FLT3-ITD have a distinctly different gene expression profile than those with
FLT3-TKD (Neben et al. 2005). Other studies have defined signal transduction
differences in in vitro and in vivo model systems (Choudhary et al. 2005; Grundler
et al. 2005), substantiating that biologic differences underlie the differences in
clinical outcome in patients with the 2 distinct FLT3 mutations. FLT3-ITD mutations
have been shown to be associated with a poor prognosis for both pediatric and
adult patients, whereas in a very recent study on a large patient population the
patients with FLT3-TKD point mutations had an improved outcome (Mead et al.
2007).
1.3.1.1.4. JAK2
JAK2 is a tyrosine kinase involved in the transduction of cellular growth stimuli
(Witthuhn et al. 1993; Parganas et al. 1998). In vitro experiments revealed that
hematopoetic cells transduced with the JAK2 V617F mutation, that has recently
been identified, showed cytokine independent growth and activation of the STAT
and extracellular receptor kinase signal transduction pathways. Based on that
findings showing that the JAK2 V617F mutation mediates increased activity of the
JAK/STAT pathway resulting in increased cell proliferation and survival (Kralovics
et al. 2005), JAK2 mutations is considered as a class I mutation within the model of
two complemenation groups of mutations in AML.
The JAK2 V617F mutation has recently been discovered as a single-site,
clonal, gain-of-function mutation in myeloid cells from the majority of patients with
chronic myeloproliferative disorders (MPD) (James et al. 2005), whereas in AML
the JAK2 V617F mutation is rare (Levine et al. 2005; Fröhling et al. 2006). Lee et al.
(2006) reported JAK2 mutations were found in only 3/113 AML patients, however,
two of three cases exhibiting JAK2 V617F were diagnosed as t(8;21)-positive AML.
In addition, in the study from Döhner et al. (2006) JAK2 V617F mutations were
identified in 6% of t(8;21)-positive AML whereas none of the
inv(16)/t(16;16)-positive cases had this type of mutation. These findings together
with the observation from Schessl et al. (2005) sustain the model of cooperating
gene mutations.

Introduction
15
1.3.2. Class II mutations
The second broad complementation group comprises mutations in
transcription factors or transcriptional co-activators that are important for
differentiation of hematopoietic cells (Gilliland et al. 2004). These include the CBF
transcription complex and CEBPα, as well as RARA (Sirulnik et al. 2003), MLL
(Armstrong et al. 2003), and components of the transcriptional co-activation
complex such as CBP, MOZ, and TIF2 (Borrow et al. 1996; Liang et al. 1998).
Gene rearrangements involving these proteins also play an important role in
activation of pathways responsible for self-renewal, such as the canonical
WNTCTNNB1, NOTCH, and BMI1 pathways (Jordan et al. 2004; Huntly et al.
2005). These pathways are likely to be critical for generation of leukemic stem cells
that are ultimately responsible for the maintenance of the leukemic phenotype. Of
these, the most extensively investigated are AML1-ETO and CBFβ-MYH11 fusions.
Homozygous loss of function of either AML1 or CBFβ in genetically engineered
mice results in a complete lack of definitive hematopoiesis, indicating that both
components of CBF are essential for hematopoietic development (Gilliland et al.
2004). The molecular biology characteristic of AML1-ETO and CBFβ-MYH11 were
already discussed in Section 1.2.1. In recent years many groups investigated the
mechanisms by which the CBFs and their partner fusion genes contribute to the
pathogenesis of AML. However, studies from murine models clearly demonstrated
that the neither the fusion gene AML1-ETO nor CBFβ-MYH11 are sufficient to
cause an AML phenotype (Castilla et al. 1999; Schessl et al. 2005).
The observation that AML1-ETO as a single factor is nonleukemogenic is
further supported by findings that nonleukemic AML1-ETO–expressing progenitor
cells can be isolated from healthy individuals as well as AML patients in remission,
which suggests that additional mutations in these AML1-ETO–positive progenitors
are necessary for the transformation into leukemia-initiating cells (Miyamoto et al.
2000; Reya et al. 2001). The importance of collaborating genetic events in the
pathogenesis of AML1-ETO–positive leukemias has indeed been shown in different
murine models. As already discussed, in the study by Schessl et al (2005), in a
murine BM transplantation model, AML1-ETO collaborates with FLT3-ITD in
inducing acute leukemia. The need for additional genetic events for full
transformation has also been demonstrated for CBFβ-MYH11, for example, a
Introduction
16
mouse "knock-in" model created by inserting the CBFβ-MYH11 fusion gene into the
mouse CBFβ locus in embryonic stem cells, failed to develop leukemia at high
frequency within the first year of life (Castilla et al. 1996). However, after exposure
to N-ethyl-N-nitorsourea (EUN), a DNA-alkylating agent, 4-16 week-old chimaeras
developed leukemia, with some features of inv(16)-positive AML after several
months. Furthermore, co-expression of CBFβ-MYH11 with the human papilloma
virus (HPV) E7 oncogene, or expression of the fusion protein in the absence of the
tumor suppressor genes p16INK4a and p19 ARF leads to acute leukemia (Yang et
al. 2002)
In addition, several groups have reported some AML patients in long-term
remission retain the AML1-ETO fusion gene in a small, but stable, fraction of their
bone marrow cells (Nucifora et al. 1993), while some patients persisted of
chimaeric CBFβ-MYH11 transcripts even after allgeneic bone marrow
transplantation (Tobal et al. 1995; Costello et al. 1997b). In addition, Wiemels et al.
(2002) detected AML1-ETO in Guthrie blood spots of children who developed a
corresponding AML many years later, while the prenatal origin of childhood
leukaemia harboring CBFβ-MYH11 has been reported with postnatal latencies of
approximately 10 years (McHale et al. 2003). The long latency periods have been
interpreted to reflect postnatal persistence of translocation-positive, quiescent
multi-potent cells, which, upon later recruitment into the myeloid differentiation
pathway, acquire additional secondary changes necessary for leukaemia (Reilly JT.
2004). Taken together, these experimental and clinical studies strongly support the
model of two complementation groups of mutations in CBF leukemia harboring the
specific fusion genes in potential leukemic precursor cells that might be
transformed by additional secondary genetic events.
1.4. The aim of the study
Based on the findings of recent studies implicating a model of two
complementation groups of mutations for the development of AML, the aims of this
study are:
1) to evaluate the incidence of RAS (NRAS/KRAS exon 1, exon 2), KIT
(exons 8, 10, 11, and 17), FLT3 (ITD and TKD) and JAK2 (V617F) mutations in a
large cohort of inv(16)/t(16;16)-positive and t(8;21)-positive AML patients enrolled

Introduction
17
in 5 treatment trials of the AML Study Group (AMLSG) and the Hemato-Oncologie
voor Volwassenen Nederland (HOVON) study.
2) to evaluate the prognostic impact of each single gene mutation on clinical
outcome and to examine potential interaction of different gene mutations.
3) to provide a rationale for the treatment with molecular-targeted therapies
such as tyrosine kinase inhibitors in patients exhibiting one of these gene
mutations.

Material and Methods
18
2. Material and Methods
2.1. Material
2.1.1. DNA extraction
Chemicals
DNAzol reagent GibcoBRL, Eggenstein, Germany
Ethanol Riedel-de Haën, Seelze, Germany 100%
EB buffer Qiagen, Hilden, Germany
EDTA Merck, Darmstadt, Germany
Tris-HCl Roth, Karlsruhe, Germany
Buffer and solutions
Ethanol 100% ethanol 750mL
add double distilled H2O (ddH2O) to final
volume of 1 L
75% (v/v)
TE buffer
10 mM Tris-HCl (pH 8)
2 mM EDTA (pH 8)
add ddH2O to final volume of 1 L
pH 8 (v/v)
Tris-HCl 121.1 g Tris base
add ddH2O to volume of 850 mL, pH
adjusted with HCl to 7.5
1M (w/v)
Instruments
Photometer Eppendorf AG, Hamburg, Germany
Eppendorf centrifuge 5415D Eppendorf AG, Hamburg, Germany
2.1.2. Polymerase chain reaction (PCR)
Enzymes and chemicals
AmpliTaq Gold polymerase Applied Biosystems, Weiterstadt,
Germany
10 x buffer 3 New England Biolabs, Beverly, MA
dNTPs Roche, Mannheim, Germany
EcoR V Roche, Mannheim, Germany
Hot Star DNA Polymerase Qiagen, Hilden, Germany
Taq DNA polymerase Applied Biosystems, Weiterstadt,

Material and Methods
19
Germany
Primers and dNTPs preparation
dNTPs for standard PCR 12.5 µL of 100 mM stock solution of
each dNTP, add ddH2O to final
volume of 1 mL
100 mM (v/v)
Primer for standard PCR 100 µL of 100 mM stock solution of
primer, add ddH2O to final volume of
1 mL
10 mM (v/v)
Instrument
Thermocycler (GeneAmp PCR
system 2700)
Applied Biosystems, Singapore
2.1.2.1. Synthetic oligonucleotide primers
All oligonucleotide primers were purchased from Roche, Mannheim, Germany.
The following nucleotides were used.
Table 4. Oligonucleotide primers used for mutation screening
Gene Exon Sequence (5’- 3’) Fragment size (bp)
1 Forward: CAC TAG GGT TTT CAT TTC CAT TG Reverse: TCC TTT AAT ACA GAA TAT GGG TAA AGA
300 NRAS
2 Forward: AA GTG GTT ATA GAT GGT GAA ACC Reverse: AG ATC ATC CTT TCA GAG AAA ATA AT
201
1 Forward: GCC TGC TGA AAA TGA CTG AA Reverse: GT CCT GCA CCA GTA ATA TGC
162 KRAS
2 Forward: TT TTG AAG TAA AAG GTG CAC TG Reverse:TGG CAA ATA CAC AAA GAA AGC C
195
8 Forward: GCT GAG GTT TTC CAG CAC TC Reverse: AAT TGC AGT CCT TCC CCT CT
219
10 Forward: CCA AGG TGAA GCT CTG AGA C Reverse: CAC TGT ACT TCA TAC ATG GG
366
11 Forward: CCA GAG TGC TCT AAT GAC TG Reverse: GGA AGC CAC TGG AGT TCC TT
274 KIT
17 Forward: TGT ATT CAC AGA GAC TTG GC Reverse: GGA TTT ACA TTA TGA AAG TCA CAG G
218
14/15 Forward: GCA ATT TAG GTA TGA AAG CCA GC Reverse: CTT TCA GCA TTT TGA CGG CAA CC
328 FLT3
20 Forward: CCA GGA ACG TGC TTG TCA Reverse: TCA AAA ATG CAC CAC AGT GAG
196
JAK2 12
Forward 1: AGC ATT TGG TTT TAA ATT ATG GAG TAT ATT (sepecific) Reverse: CTG AAT AGT CCT ACA GTG TTT TCA GTT TCA
203

Material and Methods
20
12
Forward 2: ATC TAT AGT CAT GCT GAA AGT AGG AGA AAG (internal control) Reverse: CTG AAT AGT CCT ACA GTG TTT TCA GTT TCA
364
2.1.3. Agarose gel electrophoresis
Chemicals
Agarose Sigma, St. Louis, USA
DNA-ladder Invitrogen, Carlsbad, CA, USA 100 bp
Loading buffer Invitrogen, Carlsbad, CA, USA
Ethidium bromide
Carl Roth GmbH, Mannheim, Germany 10 mg/mL
Buffer and solutions
Agarose gel 12 g agarose
300 mL 1 X TAE buffer
4% (w/v)
50 X TAE (Stock solution) 242 g Tris base
57.1 mL acetic acid
0.5 M 100 mL EDTA
w/v
1 X TAE (Electrophoresis buffer) 50 mL 50 X TAE stock solution
add ddH2O to final volume of 5 L
v/v
Instruments
Electrophoresis apparatus Owl Separation System Incorporation,
Portsmouth, NH, USA
Electrophoreses power supply Amersham Pharmacia Biotech, Upsala
UV light Schweden Transilluminator, UVP,
Upland, USA
Video camera MWG Biotech, Ebersberg, Germany
2.1.4. Denaturing high performance liquid chromatography (DHPLC)
Buffers and solutions
DNAsep® Wash Solution Transgenomic, Omaha, NE, USA
WAVE High-Range Mutation Standard Transgenomic, Omaha, NE, USA
WAVE Low-Range Mutation Standard Transgenomic, Omaha, NE, USA
WAVE Optimized® TEAA Buffer A Transgenomic, Omaha, NE, USA
WAVE Optimized® TEAA Buffer B Transgenomic, Omaha, NE, USA
WAVE Optimized® Solution D Transgenomic, Omaha, NE, USA

Material and Methods
21
WAVE Optimized® Syringe Wash Solution Transgenomic, Omaha, NE, USA
Instruments and software
DNAsep® Cartridge Transgenomic, Omaha, NE, USA
FCW-200 in-line fragment Transgenomic, Omaha, NE, USA
Navigator software 4.1.42 Transgenomic, Omaha, NE, USA
3500HT WAVE DNA Fragment
Analysis System
Transgenomic, Omaha, NE, USA
2.1.5. Purification of PCR products
Name
Isopropanol (70%) Merck, Darmstadt, Germany
QIAquick Gel Extraction Kit Qiagen, Hilden, Germany
QIAquick PCR Purification Kit Qiagen, Hilden, Germany
2.1.6. Cycle sequencing reaction (CSR)
ABI PRISM Big Dye Terminator Cycle Sequencing Kit was purchased from
Applied Biosystems, Darmstadt, Germany.
2.1.7. Dye removal
DyeEx 2.0 Spin Kit was purchased from Qiagen, Hilden, Germany.
2.1.8. Direct DNA sequencing
Name
ABI-PRISM310 genetic analyzer Applied Biosystems, Foster City, CA
Data Collection Software v1.1 Applied Biosystems, Foster City, CA
Heat block Grant Instruments Ltd, Cambridge,
England
2.2. Patients
A total of 167 inv(16) (n = 101) and t(8;21) (n = 66) positive AML-patients were
included in the present study. One hundred sixty four patients were treated within
one of the AMLSG treatment trials [AML HD93 (age 16 - 60 years), August 1993 to

Material and Methods
22
January 1998; AML HD98-A (age 18 - 60 years) and AML HD98-B (age ≥ 60 years),
February 1998 to April 2004; or AMLSG 07-04 (age 18-60 years), and AMLSG
06-04 (age ≥ 60 years, both ongoing]. Three patients were included in the HOVON
treatment trial (age ≥ 60 years, October 2000 to November 2004). Among all
analyzed patients, 94 younger inv(16)-positive patients (median age 40 years,
range from 18-58 years) were enrolled in three multicenter treatment trials [AML
HD93 (n = 21), AML HD98-A (n = 59), AMLSG 07-04 (n = 14)], and 52 younger
t(8;21)-positive patients (median age 42 years, range from 18-59 years) entered
into the same treatment protocols [AML HD93 (n = 7), AML HD98-A (n = 37), and
AMLSG 07-04 (n = 7)]. A detailed distribution of patient numbers enrolled in above
treatment trials is given in Table 5. All patients included were diagnosed according
to FAB Cooperative Group criteria (Bennett et al. 1985) and gave informed consent.
Institutional review board approval was provided from all participating centers.
Table 5. Distribution of patient numbers enrolled in various AMLSG trials at diagnosis
and number of patients per postremission therapy in first CR.
inv(16) t(8;21)
Treatment trial Total Chemo Auto Allo Total Chemo Auto Allo
AML HD93 21 12 0 2 7 5 0 2
< 60years AML HD98-A 59 20 23 10 39 31 1 1
AMLSG 07-04 14 13 0 0 7 3 1 1
AML HD98-B 6 4 0 0 9 5 0 0
≥ 60years AMLSG 06-04 1 1 0 0 1 1 0 0
HOVON 0 0 0 0 3 3 0 0
AML: acute myeloid leukemia; AMLSG: AML Study Group; Chemo, chemotherapy; Auto,
autologous transplantation; Allo, allogeneic transplantation.
De novo AML was diagnosed in 93 patients with inv(16) and 47 patients with
t(8;21), respectively; among them 6 and 11 patients had therapy-related
AML/secondary AML (t-AML/s-AML), and in 2 and 8 patients the information was
missing. For the present study, the inclusion criteria used were as follows: (1)
presence of t(8;21)(q22;q22) or inv(16)(p13q22)/t(16;16)(p13;q22) on standard
karyotypic analysis or presence of the RUNX1-CBFA2T1 or the CBFß-MYH11
fusion gene by molecular screening, (2) availability of BM or PB samples at
diagnosis. All patients gave informed consent for both treatment and

Material and Methods
23
cryopreservation of BM and PB according to the Declaration of Helsinki.
2.3. Treatment
All younger patients (16 to 60 years) received intensive, response-adapted
double-induction and consolidation therapy (Figure 4). In AML HD93 and AML
HD98-A, double-induction therapy consisted of a course of idarubicin 12 mg/m2 on
days 1, 3, and 5; cytarabine 100 mg/m2 continuously on days 1 through 7; and
etoposide 100 mg/m2 on days 1 through 3 (ICE), followed by a second course of
ICE started between days 21 and 28 in patients with a response to the first course,
or by a course of a high-dose cytarabine (HAM)-base (3 g/m2 of cytarabine every
12 hours on days 1 through 3; 12 mg/m2 of mitoxantrone on days 2 and 3) regimen
in patients with ICE-refractory disease. Response assessment was scheduled on
day 21 of first induction therapy and after hematologic reconstitution after second
induction therapy. First consolidation therapy with one course of HAM (cytarabine 3
g/m2 every 12 hours on days 1 through 3; mitoxantrone 12 mg/m2 on days 2 and 3).
For further postremission therapy differed between trials (Figure 4). In the AML
HD93 trial, all patients with CBF-AML were assigned to a second course of HAM. In
the AML HD98-A trial, patients exhibiting the t(8;21) were assigned to a second
course of HAM, whereas patients exhibiting inv(16) were assigned to autologous or
allogeneic stem cell transplantation (SCT), if an HLA-compatible family donor was
available. In AMLSG 07-04 trial, the same double-induction ICE regime with
aforementioned two studies trials with or without the integration of all-transretinoic
acid and/or Valproic acid [ATRA: 45 mg/m2 on days 3 through 5 and 15 mg/m2 on
days 6 through 28; 400 mg Valproic acid on days 1, 2, subsequently p.o.
plasma-level adapted, aspired plasma-level 100 mg/L (60 -150 mg/L)] as adjunct to
the induction therapy. Response assessment was scheduled on day 15, 21, and 28
of first induction therapy and after hematologic reconstitution after second induction
therapy. Three cycles consolidation therapy with HiDAC (3 g/m2 of cytarabine every
12 hours on days 1 through 3) were administered with or without the integration of
ATRA and/or valproic acid (ATRA; 15 mg/m2 on days 6 through 21; 400 mg
Valproic acid, aspired plasma-level 100 mg/L). Response evaluation was
performed to every patient, before start of the following 2nd and 3rd consolidation
cycles. Only patients in continuous CR or CRi (CR with incomplete hematological
recovery) qualify for the following cycles.

Material and Methods
24
CBF patients ≥ 60 years were enrolled in the AML HD98-B and AMLSG 06-04,
respectively. In the AML HD98-B trial, randomized induction therapy consisted of 2
courses of 12 mg/m2 idarubicin on days 1 and 3, 100 mg/m2 cytarabine
continuously on days 1 through 5, and 100 mg/m2 etoposide on days 1 and 3 (ICE)
with or without ATRA (45 mg/m2 on days 3 through 5 and 15 mg/m2 on days 6
through 28), followed by first consolidation therapy with a course of 0.5 g/m2
cytarabine every 12 hours on days 1 through 3 and 10 mg/m2 mitoxantrone on days
2 and 3 (HAM) with or without ATRA (15 mg/m2 on days 3 through 28). For further
postremission therapy, patients were randomized to intensive second consolidation
therapy (12 mg/m2 idarubicin on days 1 and 3, 100 mg/m2 etoposide on days 1
through 5) or 12 monthly courses of outpatient maintenance therapy (5 mg
idarubicin orally on days 1, 4, 7, 10, and 13 and 100 mg etoposide orally on days 1
and 13) (Figure 4). Patients not responding to the first course of induction therapy
were assigned to receive a course of 0.5 g/m2 cytarabine every 12 hours on days 1
through 3, 250 mg/m2 etoposide continuously on days 4 and 5, 45 mg/m2 ATRA on
days 3 through 5, and 15 mg/m2 ATRA on days 6 through 28 (A-HAE), followed by
a course of A-HAM and 6 monthly courses of outpatient maintenance therapy (5
mg idarubicin on days 1, 4, 7, 10, and 13 and 15 mg/m2 ATRA on days 1 through
28). In AMLSG 06-04 trial, the same dosage and schedule double induction
therapy as AML HD98-B treatment consisted of idarubicin and cytarabine (IC) with
ATRA (45 mg/m2 on days 4 through 6 and 15 mg/m2 on days 7 through 28),
followed by first consolidation therapy with a course of HAM with ATRA (15 mg/m2
on days 4 through 28). For further postremission therapy, patients were assigned to
intensive second consolidation therapy idarubicin and etoposide (IE) with ATRA
(15 mg/m2 on days 4 through 28). During the whole double induction and
consolidation therapy, patients with or without Valproic acid were assigned
[Valproic acid, plasma-level adapted, aspired plasma-level 100 mg/L (60 - 150
mg/L)]. Patients enrolled in the HOVON study protocol received HiDAC.
Material and Methods
25
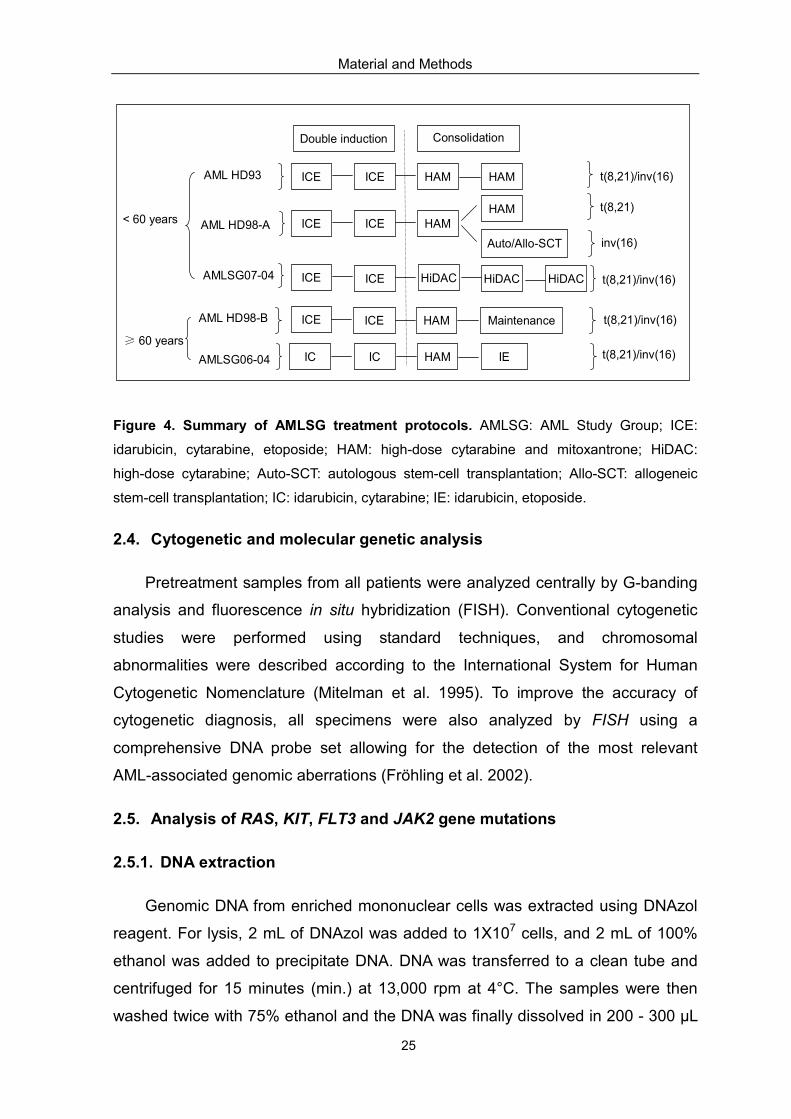
Figure 4. Summary of AMLSG treatment protocols. AMLSG: AML Study Group; ICE:
idarubicin, cytarabine, etoposide; HAM: high-dose cytarabine and mitoxantrone; HiDAC:
high-dose cytarabine; Auto-SCT: autologous stem-cell transplantation; Allo-SCT: allogeneic
stem-cell transplantation; IC: idarubicin, cytarabine; IE: idarubicin, etoposide.
2.4. Cytogenetic and molecular genetic analysis
Pretreatment samples from all patients were analyzed centrally by G-banding
analysis and fluorescence in situ hybridization (FISH). Conventional cytogenetic
studies were performed using standard techniques, and chromosomal
abnormalities were described according to the International System for Human
Cytogenetic Nomenclature (Mitelman et al. 1995). To improve the accuracy of
cytogenetic diagnosis, all specimens were also analyzed by FISH using a
comprehensive DNA probe set allowing for the detection of the most relevant
AML-associated genomic aberrations (Fröhling et al. 2002).
2.5. Analysis of RAS, KIT, FLT3 and JAK2 gene mutations
2.5.1. DNA extraction
Genomic DNA from enriched mononuclear cells was extracted using DNAzol
reagent. For lysis, 2 mL of DNAzol was added to 1X10⁷ cells, and 2 mL of 100%
ethanol was added to precipitate DNA. DNA was transferred to a clean tube and
centrifuged for 15 minutes (min.) at 13,000 rpm at 4°C. The samples were then
washed twice with 75% ethanol and the DNA was finally dissolved in 200 - 300 µL
AML HD98-A
AMLSG07-04
AML HD98-B
AMLSG06-04
ICE ICE HAM HAMAML HD93
ICE ICE HAMHAM
ICE ICE HAM Maintenance
Auto/Allo-SCT
t(8,21)/inv(16)
t(8,21)
inv(16)
< 60 years
≥ 60 years
t(8,21)/inv(16)
Double induction Consolidation
ICE ICE HiDAC HiDACHiDAC t(8,21)/inv(16)
IC IC HAM IE t(8,21)/inv(16)

Material and Methods
26
water or TE buffer. Determination of the DNA concentration was performed with a
1:50 dilution of DNA in ddH2O and absorbency was measured 260 and 280 nm
using a photometer. Since a solution with an OD260 of 1 contains approximately 50
µg DNA per milliliter, the DNA concentration in a sample was as follows:
DNA concentration = OD260 X dilution factor X 50 µg/mL
2.5.2. Polymerase chain reaction (PCR)
2.5.2.1. Amplification of NRAS, KRAS and KIT
The amplification of NRAS and KRAS (exons 1, 2), respectively, as well as KIT
exons 8, 10, 11 and 17 were performed using conventional genomic DNA PCR.
Primer pairs of all target genes are listed in Table 4. Briefly, the total reaction
volume of 50 µL contained 50 ng template DNA, 10 pmol of each primer,
deoxynucleotide triphosphate (dNTPs, 10 mmol/L each), 5 µL of 10 X High fidelity
buffer, and 2 µL of 25 mM MgSO4, 2.5 U proofreading DNA Optimase polymerase.
Samples were amplified using the following cycling conditions: denaturation step at
95°C for 5 min.; followed by 35 cycles at 94°C for 30 sec., 57°C for 1 min., 72°C for
1 min.; and a final extension step at 72°C for 10 min..
2.5.2.2. Amplification of FLT3-ITD
FLT3-ITDs were identified by amplification using conventional genomic DNA
PCR. All primers used are shown in Table 4. The total reaction volume of 50 µL
contained approximately 100 ng genomic DNA and 10 pmol each primer, 10 mM
dNTP, 5 µL of 10 X PCR buffer with 15 mM MgCl2, 10 µL Q-solution, 2.5 U Hot Star
DNA Polymerase. Samples were amplified using standard PCR conditions (95°C
for 10 min.; 35 cycles at 95°C for 1 min., 56°C for 1 min., 72°C for 2 min.; 72°C for
10 min.).
2.5.3. PCR with restriction fragment length polymorphism (PCR-RFLP)
2.5.3.1. Detection of FLT3-TKD
A PCR-RFLP assay described by Yamamoto et al. (2001) was performed to
Material and Methods
27
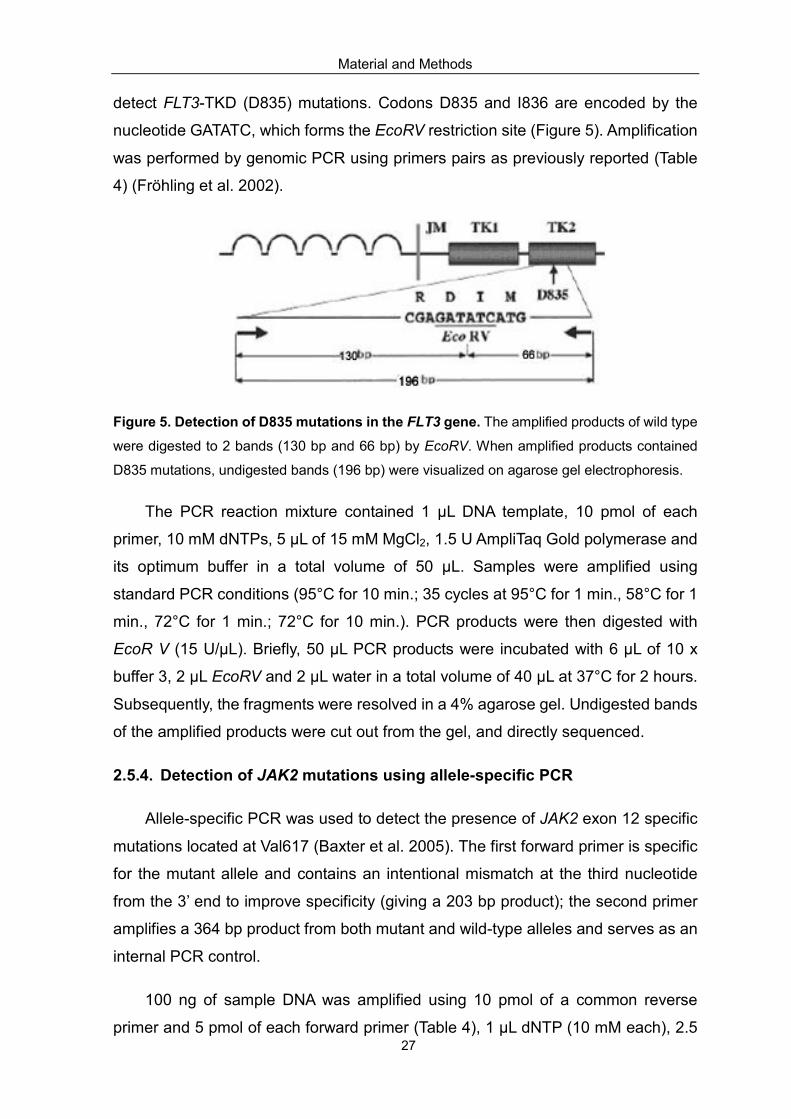
detect FLT3-TKD (D835) mutations. Codons D835 and I836 are encoded by the
nucleotide GATATC, which forms the EcoRV restriction site (Figure 5). Amplification
was performed by genomic PCR using primers pairs as previously reported (Table
4) (Fröhling et al. 2002).
Figure 5. Detection of D835 mutations in the FLT3 gene. The amplified products of wild type
were digested to 2 bands (130 bp and 66 bp) by EcoRV. When amplified products contained
D835 mutations, undigested bands (196 bp) were visualized on agarose gel electrophoresis.
The PCR reaction mixture contained 1 µL DNA template, 10 pmol of each
primer, 10 mM dNTPs, 5 µL of 15 mM MgCl2, 1.5 U AmpliTaq Gold polymerase and
its optimum buffer in a total volume of 50 µL. Samples were amplified using
standard PCR conditions (95°C for 10 min.; 35 cycles at 95°C for 1 min., 58°C for 1
min., 72°C for 1 min.; 72°C for 10 min.). PCR products were then digested with
EcoR V (15 U/µL). Briefly, 50 µL PCR products were incubated with 6 µL of 10 x
buffer 3, 2 µL EcoRV and 2 µL water in a total volume of 40 µL at 37°C for 2 hours.
Subsequently, the fragments were resolved in a 4% agarose gel. Undigested bands
of the amplified products were cut out from the gel, and directly sequenced.
2.5.4. Detection of JAK2 mutations using allele-specific PCR
Allele-specific PCR was used to detect the presence of JAK2 exon 12 specific
mutations located at Val617 (Baxter et al. 2005). The first forward primer is specific
for the mutant allele and contains an intentional mismatch at the third nucleotide
from the 3’ end to improve specificity (giving a 203 bp product); the second primer
amplifies a 364 bp product from both mutant and wild-type alleles and serves as an
internal PCR control.
100 ng of sample DNA was amplified using 10 pmol of a common reverse
primer and 5 pmol of each forward primer (Table 4), 1 µL dNTP (10 mM each), 2.5

Material and Methods
28
µL MgCl2 (50 mM), 2.5 U Platinum Taq DNA polymerase and its optimum buffer.
Reaction conditions for amplification was as follows: 95 °C for 5 min.; 36 cycles at
95 °C for 15 sec., 58 °C for 1 min. and 72 °C for 1 min.; followed by a final step at
72 °C for 10 min.
2.5.5. Agarose gel electrophoresis
To visualize amplified PCR products, agarose gel electrophoresis was
performed. Briefly, 2 µL loading buffer was added to 8 µL PCR product and
subsequently loaded to a 2% agarose gel in 1 x TAE buffer. A 100 bp DNA-ladder
was used to as size marker. Electrophoresis was run by 120V/80mA for 1 hour.
Subsequently, the gel was stained in 1 x TAE buffer containing 0.5 µg/mL ethidium
bromide for 15 - 30 min. For documentation, DNA bands were visualized by UV
light at 302 nm and photographed using a digital camera.
2.5.6. Isolation of the DNA fragments from agarose gels
After PCR amplification, DNA fragments were size-fractionated in agarose gels
and the specific bands were cut out of the gel with a scalpel under UV light. DNA
extraction was performed using the QIAquick Gel Extraction Kit according to the
instructions of the manufacturer.
2.5.7. Denaturing high performance liquid chromatography (DHPLC)
DHPLC analysis on the Transgenomic WAVE® System by temperature
modulated heteroduplex analysis offers a rapid, highly sensitive, automated and
cost-effective method for mutation screening, and has been demonstrated to be
more sensitive than both single-strand conformational polymorphism analysis and
direct sequencing in the detection of germ-line and somatic mosaicism (Xiao et al.
2001).
DHPLC is based on the detection of heteroduplexes in short segments of DNA
by ion-reverse phase high performance liquid chromatography (Xiao et al. 2001).
Partial heat denaturation within an acetonitrile gradient leads to the separation of
the DNA strands, resulting in the formation of hybrid wild-type/mutant
heteroduplexes. These heteroduplexes have a reduced column retention time and
hence an altered mobility compared to their homoduplex counterpart (Figure 6).

Material and Methods
29
Figure 6. Principle of mutation detection by DHPLC. A: In the presence of mismatch, not
only are the original homoduplices formed, but also the sense and antisense strands of either
homoduplex form heteroduplices; B: Heteroduplices denature more extensively at the analysis
temperature (ranges from 50°C to 70°C) and are eluted earlier than the homoduplices in the
DNA Sep column. DHPLC: denaturing high performance liquid chromatography.
For detection of DNA sequence changes, DHPLC was performed using the
3500HT WAVE DNA Fragment Analysis System. Heteroduplex formation was
created by denaturating the PCR products for 5 min. at 95°C and then allowing the
samples to reanneal by decreasing the temperature 1°C per min. from 95°C to
45°C. Five to ten µL of the PCR products (NRAS, KRAS, and KIT) were run on the
DHPLC via rapid mode with a gradient time of 2.5 min and a total run time of 3 min.,
in comparison to control samples run in parallel. The start ratio of buffers A [0.1M
triethylammonium acetate (TEAA), 0.025% acetonitrile (ACN) (v/v), pH 7.0], and B
[0.1M TEAA, 25% ACN (v/v), pH 7.0] was calculated using Navigator software
(Transgenomics). The stop ratio was set as the buffer B start value + 12%. The
elution temperatures for each amplicon were recommended by the Navigator
software and then optimized by studying alterations in the elution profiles of the
samples within a temperature varied according to the analyze products: KIT exon 8:
50°C; KIT exon 10: 57°C; KIT exon 11: 57°C; KIT exon 17: 56.7°C; NRAS exon 1:
59.8°C; NRAS exon 2: 58.2°C; KRAS exon 1: 58.2°C; KRAS exon 2 58.2°C. To
identify homozygous mutations, equal aliquots of a known wild-type sample were
mixed with the DNA prior to the re-annealing step to enable heteroduplex
A
B

Material and Methods
30
formation.
Samples exhibiting an abnormal DHPLC profile (Figure 7) were subsequently
sequenced to confirm the mutation. In case, sequencing was insufficiently sensitive
to confirm mutation, fragment collection was carried out using a Transgenomic
FCW-200 in-line fragment collector (Emmerson et al. 2003). Collected positive
fractions served as a template for re-amplification, which were subsequently
directly sequenced to reveal the mutation.
Figure 7. DHPLC profiles from representative KIT exon 8. A: DHPLC profiles from DNA
containing KIT exon 8 wild-type; B: DNA containing KIT exon 8 mutant indicated by an
additional peak. In the profiles indicating mutations, wild-type homoduplexes are retained on
the DHPLC column for longer than wild-type/mutant heteroduplexes (KIT exon 8: 2.182 min,
1.997 min). DHPLC: Denaturing high performance liquid chromatography.
2.5.8. Purification of PCR products
For purification of DNA fragments, the QIAquick PCR Purification kit was used.
Briefly, 25 µL of PCR product and 125 µL Buffer PBI were added to a QIAquick spin
column for DNA binding and then centrifuged at 13,000 rpm for 1 min.. Discarded
the flow-through, and then 750 µL washing Buffer PE was added to the QIAquick
spin column for centrifuging at 13,000 rpm for 1 min.. After discarding flow-through,
the column was centrifuged at 13,000 rpm for 1 min. again, and then the column
was placed in a clean 1.5 mL microcentrifuge tube. Finally, 30 µL Buffer EB was
A
B

Material and Methods
31
added to the center of QIAquick membrane for eluting. After incubation at room
temperature for 1 min., the column was centrifuged again at 13,000 rpm for 1 min.
to elute DNA. The purified PCR products were stored at -20°C until further used.
2.5.9. Cycle sequencing reaction (CSR)
Cycle sequencing reaction was performed using an ABI PRISM Big Dye
Terminator Cycle Sequencing Kit, which contains thermally stable AmpliTaq DNA
polymerase, modified dNTPs and a set of dye terminators labeled with high-senility
dyes. The reaction was carried out in a total volume of 20 µL, containing 2 µL of
purified PCR product, 1 µL (10 pmol/µL) of sequencing primer and 4 µL of Big Dye
sequencing mix, using the following PCR profile: 25 cycles for 15 sec. at 96°C, 10
sec. at 54°C, and 4 min. at 60°C.
2.5.10. Dye removal using DyeEx spin kit
DyeEx 2.0 Spin Kit was used to remove unincorporated dye terminators
directly from sequencing reactions. Firstly, the column was placed in a 2 mL
collection tube and centrifuged 3 min. at 3.000 rpm to resuspend the resin.
Secondly, the CSR product was loaded to gel bed and centrifuged for 3 min. at
3.000 rpm in a new collection tube. Finally, the purified DNA was transferred into
sequencing tube. The purified PCR product was stored at -20°C until using for
nucleotide sequencing.
2.5.11. Direct DNA sequencing
After denaturation at 95°C for 2 min., the samples were loaded on the
ABI-PRISM310 genetic analyzer.
2.5.12. Sensitivity of DHPLC and sequencing assay
DNA isolated from a patient, who had 90% blast cells had one of targets
mutation, was serially diluted by mixing with wide-type cells to create 10 different
mixtures containing 90%, 75%, 50%, 25%, 15%, 10%, 5%, 4%, 2.5%, 1% positive
DNAs, and then analyzed by DHPLC and sequencing as described above. When
samples escaped sequencing, DHPLC in-line fragment collector was utilized as
descried above.
Material and Methods
32
2.6. Statistical analyses
The median duration of follow-up was calculated according to the method of
Korn et al. (1986). The definition of CR followed the recommended criteria (Cheson
et al. 2003). OS end points, measured from entry into one of the prospective
studies, were death (failure) and alive at last follow-up (censored) (Cheson et al.
2003). RFS end points, measured from the date of documented CR, were relapse
(failure), death in CR (failure), and alive in CR at last follow-up (censored) (Cheson
et al. 2003). Event-free survival (EFS) was defined as the time from diagnosis to an
event (either failure to achieve remission, death in first CR, or relapse). Pairwise
comparisons between patient characteristics were performed by Mann-Whitney
test for continuous variables and by Fisher exact test for categorical variables. A
multivariable logistic model was used to analyze associations between presenting
features and response to induction therapy. The Kaplan-Meier method was used to
estimate the distribution of RFS, EFS and OS. Confidence interval (CI) estimation
for the survival curves was based on the cumulative hazard function using
Greenwood’s formula for the standard error estimation (Therneau et al. 2000).
Survival distributions were compared using the log-rank test. Missing data were
estimated using a multiple-imputation technique using predictive mean matching
with n = 100 for multiple imputations (Harrell et al. 2001). A limited backward
selection procedure was used to exclude redundant or unnecessary variables
(Harrell et al. 2001). To provide quantitative information on the relevance of results,
95% confidence intervals (95% CIs) of odds ratios (ORs) and hazard ratios (HRs)
were computed. To correct for overestimation, a shrinkage procedure and a
bootstrap correction of the CIs were applied according to Hollander et al. (2004).
CIs for binomial probabilities were estimated using the method proposed by Agresti
and Coull (1998). All statistical analyses were performed with R software, version
2.1.1, using R packages Design, version 2.0, and cmprsk, version 2.1 (all available
at http://www.r-project.org) (R Development Core Team 2005).
Results
33
3. Results
3.1. Incidence of RAS, KIT, FLT3 and JAK2 gene mutations
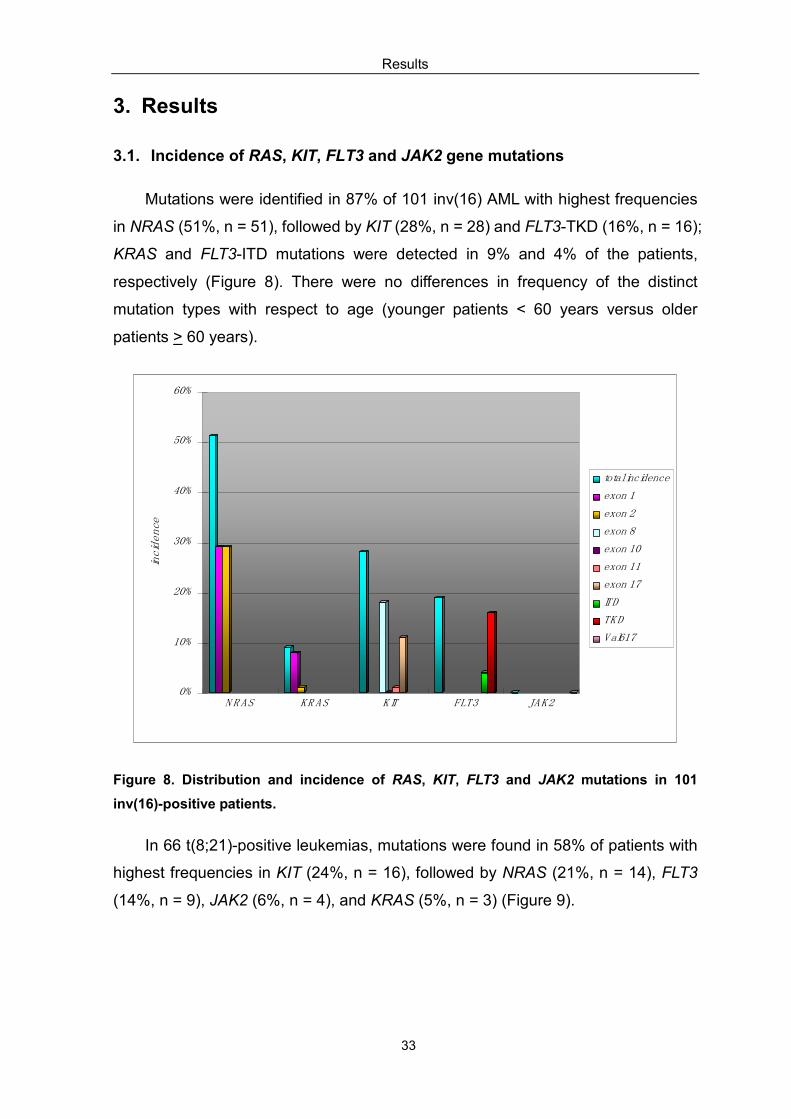
Mutations were identified in 87% of 101 inv(16) AML with highest frequencies
in NRAS (51%, n = 51), followed by KIT (28%, n = 28) and FLT3-TKD (16%, n = 16);
KRAS and FLT3-ITD mutations were detected in 9% and 4% of the patients,
respectively (Figure 8). There were no differences in frequency of the distinct
mutation types with respect to age (younger patients < 60 years versus older
patients > 60 years).
0%
10%
20%
30%
40%
50%
60%
incidence
N R AS KR AS KIT FLT3 JAK2
total incidence
exon 1
exon 2
exon 8
exon 10
exon 11
exon 17
ITD
TKD
Val617
Figure 8. Distribution and incidence of RAS, KIT, FLT3 and JAK2 mutations in 101
inv(16)-positive patients.
In 66 t(8;21)-positive leukemias, mutations were found in 58% of patients with
highest frequencies in KIT (24%, n = 16), followed by NRAS (21%, n = 14), FLT3
(14%, n = 9), JAK2 (6%, n = 4), and KRAS (5%, n = 3) (Figure 9).

Results
34
0%
5%
10%
15%
20%
25%
incidence
N R AS KR AS KIT FLT3 JAK2
total incidence
exon 1
exon 2
exon 8
exon 10
exon 11
exon 17
ITD
TKD
Val617
Figure 9. Distribution and incidence of RAS, KIT, FLT3 and JAK2 mutations in 66
t(8;21)-positive patients.
3.1.1. RAS mutations
3.1.1.1. RAS mutations in inv(16) AML
Heterozygous RAS mutations were identified in 57% of the whole inv(16)
group. The most frequent mutation type affected codon 61 (29%) of the NRAS
gene, followed by mutations of codon 12 in 20%, and codon 13 in 9% of the
patients. KRAS mutations were observed in 8% of all inv(16)-positive AML. In all of
the cases mutations affected codon 12 and codon 13 located in exon 1 of KRAS.
Sequence analysis identified two different exon 1 mutation types: A11_G12insA
and G10dup. KRAS exon 2 mutation was only detected in one patient. A detailed
distribution of mutations detected in NRAS and KRAS is shown in Figure 8.
3.1.1.2. RAS mutations in t(8;21) AML
Of the 66 t(8;21)-positive patients, RAS mutations were identified in 23% (n =
15) mostly affecting the NRAS gene (14 of 15 patients). Six of the 14 NRAS
mutations (43%) occurred in codon 13, 5 (36%) in codon 61 and 3 (21%) in codon
12. Only 3 patients (2 patients coexisted NRAS mutation) exhibited KRAS exon 1
mutation and none of the patients had KRAS exon 2 mutations (Figure 9).
Results
35
3.1.2. KIT mutations
3.1.2.1. KIT mutations in inv(16) AML
The incidence of KIT mutations in inv(16)-positive AML was 28% (n = 28)
(Figure 8). In 28 mutated patients, 18 cases affected exon 8 mutation (18%),
followed by exon 17 (11%, n = 10) and exon 11 mutations (1%, n = 1); among them,
two patients harbored exon 8 as well as exon 17 mutations. None of samples had a
KIT exon 10 mutation.
3.1.2.2. KIT mutations in t(8;21) AML
KIT mutation was identified in 24% (16/66) of the t(8;21)-positive patients. KIT
exon 17 was detected in 15 (22%) patients, followed by 4 (6%) patients having KIT
exon 8 mutations, among them, there were 3 patients who had both exon 8 and
exon 17 mutations. In none of the patients KIT exons 10 or 11 mutations were
identified (Figure 9).
3.1.2.3. Type of KIT mutations in inv(16) and t(8;21) AML
KIT exon 8 mutations were characterized as in-frame deletions or insertions
involving codon 419. All KIT exon 17 mutations involved residues in the KIT
activation loop which have recently been shown to result in constitutive kinase
activity. The most commonly affected residue was codon 816, whereas less
commonly mutations resulted in replacement of amino acids N822 and Y823.
In addition, three types of polymorphisms were identified in KIT exon 10 and
exon 17: 1642 A>C, 1659 A>G, and 2415 C>T. KIT exon 10 1642 A>C was
detected in 29 of 100 (29%) inv(16)-positive patients and in 12 of 66 (18%)
t(8;21)-positive patients, respectively. Although 1642 A>C resulted in the
substitution of a leucine for a methionine residue at codon 541, this type of
mutation was also identified in remission samples of 10 of the affected patients
suggesting that it is rather a polymorphism than an active mutation. These findings
were supported by Nagata et al. (1996) who identified that sequence variation in a
two-generation family as well as in a study by Fritsche-Polanz et al. (2001) where
the 1642 A>C mutation was not more prevalent among patients than among
healthy controls. The remaining two other polymorphisms were silent nucleotide
Results
36
exchanges (KIT 1659 A>G in exon 10; KIT 2415 C>T in exon 17) not affecting the
predicted amino acid sequence. KIT 1659 A>G mutation and KIT 2415 C>T
mutations were identified in 7 (7%) and 4 (4%) of the inv(16) -positive patients, and
in 3 (5%) and 5 (8%) of the t(8;21)-positive patients, respectively.
3.1.3. FLT3 mutations
3.1.3.1. FLT3-ITD mutations in inv(16) and t(8;21) AML
FLT3-ITD mutations were identified in 4 (4%) of 101 inv(16)-, and 6 (9%)
t(8;21)-positive AML patients, respectively (Figure 8, 9). In 6 of the 10 FLT3-ITD
positive patients sequencing analysis could be performed showing a great variety
of FLT3-ITDs in length ranging from 20 to 61 bp (median, 46). Five patients had
simple FLT3-ITDs within exon 14, and in one patient FLT3-ITD involved exon 14
and intron 14. All FLT3-ITDs mutations were in-frame.
3.1.3.2. FLT3-TKD mutations in inv(16) and t(8;21) AML
Activating mutations affecting the second tyrosine kinase domain of the FLT3
gene, the so called FLT3-TKD mutations, were detected in 16 (16%) of 101 inv(16)
patients, and in 3 (5%) patients within t(8;21) cohort (Figure 8, 9). Most were point
mutations resulting in a substitution of aspartic residue 835 with a tyrosine (D835Y,
the most frequent mutation).
3.1.4. JAK2 mutations
Heterozygous JAK2 V617F mutations were identified in 4 (6%) t(8;21)-positive
AML patients, whereas none of the inv(16)-positive cases showed sequence
variations at codon 617 of the JAK2 gene (Figure 8, 9).
3.2. Associated gene mutations
3.2.1. Associated gene mutations in inv(16)-positive patients
In this study patients were analyzed for mutations in the NRAS, KRAS, KIT,
FLT3, and JAK2 genes. 66 had only one single gene mutation whereas 21 patients
exhibited more than one mutation either affecting the same gene or affecting one of
the other genes mentioned above. Mostly the NRAS/FLT3-TKD genotype was

Results
37
observed (n = 6), but also other genotypes such as NRAS/KIT (n = 5),
KIT/FLT3-TKD (n = 3), NRAS/KRAS (n = 3), KRAS/KIT (n = 2), FLT3-ITD/
FLT3-TKD (n= 1) or NRAS/FLT3-ITD (n = 1) have been observed. A detailed
distribution of the associated gene mutations is shown in Figure 10. Thus, 87 (86%)
of 101 patients harbored at least one activating mutation.
Figure 10. Associated gene mutation status based on 101 inv(16) patients for NRAS,
KRAS, KIT, FLT3-ITD, and FLT3-TKD. A: KRAS/KIT n = 2; B: KIT/FLT3-TKD n = 3; C:
FLT3-ITD/FLT3-TKD n = 1; D: NRAS/FLT3-TKD n = 6; E: NRAS/KIT n = 5; F: NRAS/FLT3-ITD
n = 1; G: NRAS/KRAS n = 3.
3.2.2. Associated gene mutations in t(8;21)-positive patients
In the whole t(8;21)-positive group, 8 patients harbored two different gene
mutations: 2 patients had the NRAS/KRAS genotype, 2 patients the NRAS/KIT
genotype, two patient showed a combined KIT/FLT3-TKD mutation, and two
patients with JAK2 mutations revealed additional gain of function mutations in the
genes encoding for FLT3 and NRAS, respectively. A detailed distribution of the
associated gene mutations is shown in Figure 11. Therefore, 58% patients
presented at least one activating mutation.
NRAS
KRAS
FLT3-ITD
FLT3-TKD
KIT
A CB D E F G
16%
51%
9%
28%
4%
Incidence

Results
38
Figure 11. Associated gene mutation status based on 66 t(8;21) patients for NRAS, KRAS,
KIT, FLT3-ITD, and FLT3-TKD. A: KIT/FLT3-TKD n = 2; B: FLT3-ITD/JAK2 n = 1; C:
NRAS/JAK2 n = 1; D: NRAS/KIT n = 2; E: NRAS/KRAS n = 2.
3.3. Patients characteristics
3.3.1. Pretreatment characteristics for inv(16)-positive patients
Pretreatment characteristics of all inv(16) patients for NRAS and KRAS
mutated patients are summarized in Table 6, and patients characteristics according
to the KIT mutation status are shown in Table 7. Due to previous reports showing
that FLT3-ITD and FLT3-TKD mutations show great differences in phenotype and
clinical outcome, we additionally analyzed patients characteristics for
inv(16)-positive AML according to the FLT3-ITD or FLT3-TKD mutation status
(Table 8).
For the whole inv(16) group, the median age was 41 years (range 18 - 71
years), with 94 patients younger than 60 years of age (range 18 - 58 years). The
majority (92%) had de novo AML, with FAB-M4 (67%) predominating. Correlation of
the mutation status of each of the genes with clinical characteristics revealed only a
few significant differences: patients with KIT mutation had a higher median
percentage of PB blasts (62.5%) compared to unmutated patients (37%, P = 0.004).
In addition to the aforementioned characteristics, subset analyses considering KIT
exon 17 mutations revealed that mutated patients were more frequently male (P =
A CB D E
NRAS
KRAS
KIT
JAK2
FLT3-ITD
FLT3-TKD
6%
21%
5%
24%
9%
Incidence
5%

Results
39
0.02). For FLT3-TKD mutated patients the analysis demonstrated that lactate
dehydrogenase (LDH) serum levels in mutated patients were significantly higher (P
= 0.04) compared to FLT3-TKD wild-type patients. Patients harboring KIT exon 17
mutations had in trend more frequently EML due to splenomegaly (P = 0.09), and
this was also the case for FLT3-TKD positive patients (P = 0.09). There was no
difference in WBC count between RAS mutated and unmutated patients. It is
noteworthy that a lower percentage of PB blasts (36%) was found in NRAS
mutated patients compared to unmutated patients (47%, P = 0.08); for KRAS a
lower percentage of BM blasts was identified in mutated KRAS (51%) than in
unmutated (80%) KRAS patients (P = 0.06). In addition, there was no significant
difference for other presenting clinical features such as age, hemoglobin level,
platelet count, or secondary chromosomal aberrations (e.g. trisomy 22) between
patients with and without mutation in the genes NRAS, KRAS, KIT and FLT3 (Table
6, 7, 8).
Within the younger inv(16) cohort, similar to the whole inv(16) groups, patients
with KIT exon 17 mutations had significantly higher percentages of PB blasts
(71.5%) compared to patients with KIT exon 17 wild-type (43.5%, P = 0.03), and
showed to be in trend more frequently of male gender (P = 0.08). Since there was
no statistical difference for the other clinical characteristic between patients with
and without NRAS, KRAS, FLT3 and KIT gene mutations in the whole inv(16)
patients, subgroup analysis was not performed for the younger inv(16) group.
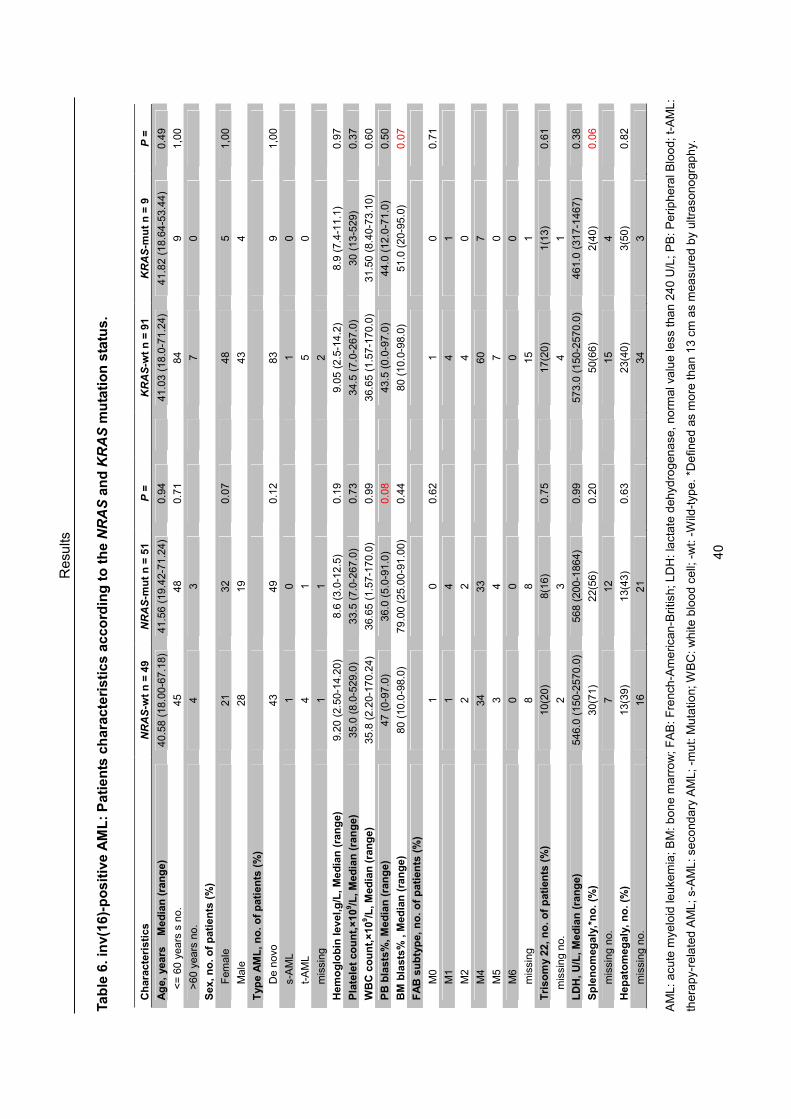
Resu
lts
40
Ta
ble
6. in
v(1
6)-
po
sit
ive
AM
L:
Pa
tie
nts
ch
ara
cte
ris
tic
s a
cc
ord
ing
to
th
e N
RA
S a
nd
KR
AS
mu
tati
on
sta
tus
.
Ch
ara
cte
risti
cs
NR
AS
-wt
n =
49
NR
AS
-mu
t n
= 5
1
P =
KR
AS
-wt
n =
91
KR
AS
-mu
t n
= 9
P
=
Ag
e,
years
M
ed
ian
(ra
ng
e)
40.58 (18.00-67.18)
41.56 (19.42-71.24)
0.94
41.03 (18.0-71.24)
41.82 (18.64-53.44)
0.49
<= 60 years s no.
45
48
0.71
84
9
1,00
>60 years no.
4
3
7
0
Sex, n
o. o
f p
ati
en
ts (
%)
F
emale
21
32
0.07
48
5
1,00
M
ale
28
19
43
4
Typ
e A
ML
, n
o. o
f p
ati
en
ts (
%)
D
e novo
43
49
0.12
83
9
1,00
s-AML
1
0
1
0
t-AML
4
1
5
0
m
issing
1
1
2
Hem
og
lob
in level,g
/L, M
ed
ian
(ra
ng
e)
9.20 (2.50-14.20)
8.6 (3.0-12.5)
0.19
9.05 (2.5-14.2)
8.9 (7.4-11.1)
0.97
Pla
tele
t co
un
t,×
10
9/L
, M
ed
ian
(ra
ng
e)
35.0 (8.0-529.0)
33.5 (7.0-267.0)
0.73
34.5 (7.0-267.0)
30 (13-529)
0.37
WB
C c
ou
nt,
×10
9/L
, M
ed
ian
(ra
ng
e)
35.8 (2.20-170.24)
36.65 (1.57-170.0)
0.99
36.65 (1.57-170.0)
31.50 (8.40-73.10)
0.60
PB
bla
sts
%, M
ed
ian
(ra
ng
e)
47 (0-97.0)
36.0 (5.0-91.0)
0.08
43.5 (0.0-97.0)
44.0 (12.0-71.0)
0.50
BM
bla
sts
% ,
Med
ian
(ra
ng
e)
80 (10.0-98.0)
79.00 (25.00-91.00)
0.44
80 (10.0-98.0)
51.0 (20-95.0)
0.07
FA
B s
ub
typ
e,
no
. o
f p
ati
en
ts (
%)
M
0
1
0
0.62
1
0
0.71
M
1
1
4
4
1
M
2
2
2
4
0
M
4
34
33
60
7
M
5
3
4
7
0
M
6
0
0
0
0
m
issing
8
8
15
1
Tri
so
my 2
2,
no
. o
f p
ati
en
ts (
%)
10(20)
8(16)
0.75
17(20)
1(13)
0.61
missing no.
2
3
4
1
LD
H,
U/L
, M
ed
ian
(ra
ng
e)
546.0 (150-2570.0)
568 (200-1864)
0.99
573.0 (150-2570.0)
461.0 (317-1467)
0.38
Sp
len
om
eg
aly
,*n
o.
(%)
30(71)
22(56)
0.20
50(66)
2(40)
0.06
m
issing no.
7
12
15
4
Hep
ato
meg
aly
, n
o. (%
) 13(39)
13(43)
0.63
23(40)
3(50)
0.82
m
issing no.
16
21
34
3
AML: acu
te m
yeloid le
uke
mia; BM: bone m
arrow; FAB: French
-America
n-British; LDH: lactate dehyd
rogenase
, norm
al value le
ss than 240 U/L; PB: Peripheral B
lood; t-AML:
therapy-related AML; s-AML: se
condary AML; -m
ut: M
utatio
n; W
BC: white
blood cell; -wt: -Wild-typ
e. *D
efin
ed as more than 13 cm as measu
red by ultraso
nography.

Resu
lts
41
Ta
ble
7. in
v(1
6)-
po
sit
ive
AM
L:
Pa
tie
nts
ch
ara
cte
ris
tic
s a
cc
ord
ing
to
th
e K
IT m
uta
tio
n s
tatu
s.
Ch
ara
cte
risti
cs
KIT
-wt
n =
72
KIT
-mu
t n
= 2
8
P =
KIT
17-w
t n
= 8
9
KIT
17-m
ut
n =
11
P =
Ag
e,
years
M
ed
ian
(ra
ng
e)
42.25 (18.96-71.24)
37.33 (18.00-68.05)
0.20
41.03 (18.00-71.24)
43.74 (22.93-67.18)
0.94
<= 60 years s no.
67
26
1,00
83
10
0.57
>60 years no.
5
2
6
1
Sex, n
o. o
f p
ati
en
ts (
%)
F
emale
42
11
0.12
51
2
0.02
M
ale
30
17
38
9
Typ
e A
ML
, n
o. o
f p
ati
en
ts (
%)
D
e novo
66
26
0.39
82
10
0.12
s-AML
0
1
0
1
t-AML
4
1
5
0
m
issing
2
2
Hem
og
lob
in level,g
/L, M
ed
ian
(ra
ng
e)
8.80 (5.2-12.7)
9.20 (2.50-14.20)
0.51
9.05 (3.00-14.2)
8.60 (2.50-11.90)
0.94
Pla
tele
t co
un
t,×
10
9/L
, M
ed
ian
(ra
ng
e)
34.0 (7.0-267.0)
34.0 (15.0-529.0)
1,00
34.0 (7.0-529.0)
34.0 (17.0-110.0)
0.86
WB
C c
ou
nt,
×10
9/L
, M
ed
ian
(ra
ng
e)
34.80 (1.57-170.24)
49.00 (2.40-165.60)
0.14
35.90 (1.57-170.24)
42.90 92.40-121.70)
0.98
PB
bla
sts
%, M
ed
ian
(ra
ng
e)
37.00(0.0-91.00)
62.50 (13.00-97.00)
0.004
38.5 (0.0-91.0)
67.0 (36.0-97.0)
0.007
BM
bla
sts
% ,
Med
ian
(ra
ng
e)
80.0 (20.0-97.0)
75.00 910.0-98.0)
0.74
79.5 (20.0-98.0)
77.5 (10.0-90.0)
0.98
FA
B s
ub
typ
e,
no
. o
f p
ati
en
ts (
%)
M
0
0
1
0.20
1
0
0.63
M
1
4
1
5
0
M
2
3
1
3
1
M
4
47
20
57
10
M
5
7
0
7
0
M
6
0
0
0
0
m
issing
11
5
16
Tri
so
my 2
2,
no
. o
f p
ati
en
ts (
%)
13(19)
5(19)
0.76
16(19)
2(20)
0.57
missing no.
3
2
4
1
LD
H,
U/L
, M
ed
ian
(ra
ng
e)
568.0 (150.0-2570.0)
563.0 (200.0-1164.0)
0.56
566 (150-2570)
511.0 (298-1164)
0.72
Sp
len
om
eg
aly
,*n
o.
(%)
34(61)
18(72)
0.29
43(61)
9(82)
0.09
m
issing no.
16
3
19
Hep
ato
meg
aly
, n
o. (%
) 17(40)
9(45)
0.53
20(64)
6(75)
0.12
m
issing no.
29
8
34
3
AML: acu
te m
yeloid le
uke
mia; BM: bone m
arrow; FAB: French
-America
n-British; LDH: lactate dehyd
rogenase
, norm
al value le
ss than 240 U/L; PB: Peripheral B
lood; t-AML:
therapy-related AML; s-AML: se
condary AML; -m
ut: M
utatio
n; W
BC: white
blood cell; -wt: -Wild-typ
e. *D
efin
ed as more than 13 cm as measu
red by ultraso
nography.

Resu
lts
42
Ta
ble
8. in
v(1
6)-
po
sit
ive
AM
L:
Pa
tie
nts
ch
ara
cte
ris
tic
s a
cc
ord
ing
to
th
e F
LT
3 m
uta
tio
n s
tatu
s.
Ch
ara
cte
risti
cs
FL
T3-I
TD
-wt
n =
97
FL
T3-I
TD
-mu
t n
= 4
P
=
F
LT
3-T
KD
-wt
n =
85
FL
T3-T
KD
-mu
t n
= 1
6
P =
Ag
e,
years
M
ed
ian
(ra
ng
e)
41.03 (18.00-71.24)
46.78 (37.16-66.52)
0.25
43.17 (18.00-71.24)
37.71 (22.93-51.52)
0.14
<= 60 years s no.
91
3
0.25
78
16
0.59
>60 years no.
6
1
7
0
Sex, n
o. o
f p
ati
en
ts (
%)
F
emale
53
1
0.34
46
8
0.79
M
ale
44
3
39
8
Typ
e A
ML
, n
o. o
f p
ati
en
ts (
%)
D
e novo
90
3
1,00
79
14
0.12
s-AML
1
0
0
1
t-AML
5
0
4
1
m
issing
1
1
2
Hem
og
lob
in level,g
/L, M
ed
ian
(ra
ng
e)
8.90 (2.50-14.20)
10.60 (6.90-12.50)
0.42
9.15 (3.0-14.20)
8.50 (2.50-12.70)
0.18
Pla
tele
t co
un
t,×
10
9/L
, M
ed
ian
(ra
ng
e)
34.0 (7.0-529.0)
52.0 (46.0-82.0)
0.18
37.5 (8.0-529.0)
30.5 (7.0-96.0)
0.19
WB
C c
ou
nt,
×10
9/L
, M
ed
ian
(ra
ng
e)
37.30 (1.57-170.24)
35.80 (7.6-43.4)
0.49
33.65 (1.57-165.60)
67.00 (2.68-170.24)
0.98
PB
bla
sts
%, M
ed
ian
(ra
ng
e)
45.0 (0.0-97.0)
37.0 (11.0-42.0)
0.33
41.0 (0.0-97.0)
50.0 (7.0-90.0)
0.59
BM
bla
sts
%, M
ed
ian
(ra
ng
e)
80.0 (10.0-98.0)
77.0 (30.0-80.0)
0.39
79.0 (10.0-98.0)
81.5 (20.0-91.0)
0.89
FA
B s
ub
typ
e,
no
. o
f p
ati
en
ts (
%)
M
0
1
0
0.49
1
0
0.60
M
1
5
0
5
0
M
2
4
0
3
1
M
4
66
2
57
11
M
5
6
1
5
2
M
6
0
0
0
0
m
issing
16
1
14
3
Tri
so
my 2
2,
no
. o
f p
ati
en
ts (
%)
18(20)
0
1,00
13(16)
5(31)
0.31
missing no.
5
5
LD
H,
U/L
, M
ed
ian
(ra
ng
e)
564.5 (150.0-2570.0)
492.0 (459.0-581.0)
0.66
522 (150.0-1864)
641.0 (296.0-2570.0)
0.04
Sp
len
om
eg
aly
,*n
o.
(%)
49(63)
3(100)
0.52
41(59)
11(92)
0.09
m
issing no.
19
1
16
4
Hep
ato
meg
aly
, n
o. (%
) 26(42)
1(50)
1,00
23(42)
4(44)
0.84
m
issing no.
35
2
30
7
AML: acu
te m
yeloid le
uke
mia; BM: bone m
arrow; FAB: French
-America
n-British; LDH: lactate dehyd
rogenase
, norm
al value le
ss than 240 U/L; PB: Peripheral B
lood; t-AML:
therapy-related AML; s-AML: se
condary AML; -m
ut: M
utatio
n; W
BC: white
blood cell; -wt: -Wild-typ
e. *D
efin
ed as more than 13 cm as measu
red by ultraso
nography.

Results
43
3.3.2. Pretreatment characteristics for t(8;21)-positive patients
The pretreatment characteristics of the 66 t(8;21)-positive AML patients
according to the NRAS and KRAS, KIT (including exon 17) and FLT3 (ITD and TKD)
mutation status are given in Table 9, 10 and 11, respectively. Owing to the
incidence of JAK2 mutations was less (n = 4), statistical correlation did not reveal
any significant features when comparing mutated and unmutated t(8;21)-patients.
The median age was 49 years in the whole group (range 18 - 73 years), with 52
patients younger than 60 years of age (range 18 - 59). In 71% patients had de novo
AML and the most common FAB subtype was M2 (60%) in all t(8;21) patients.
Subgroup analysis for the other genotypes showed a significant higher LDH
serum levels for KIT-mutated patients (P = 0.004). The same was true when
subgroup analysis for KIT exon 17 mutation was performed (P = 0.004). The higher
frequency of EML involvement in the KIT exon 17 mutated group was due to higher
rate of hepatomegaly (P = 0.04). In NRAS mutated patients a significantly lower
median percentage BM blast (50%) was found compared to unmutated patients
(70%, P = 0.04); in analogy, KRAS mutations had significantly lower BM blast (32%)
than patients with KRAS wild-type (60%, P = 0.05). Secondary chromosome
aberrations, such as loss of Y chromosome in male patients which was observed in
51% of the patients (21/41) or loss of X chromosome in female patients that was
found in (36%) of the patients (9/25) no statistically significant differences between
mutated and unmutated patients was observed with regard to RAS, KIT, FLT3, or
JAK2 genes. In addition, correlation of other clinical characteristics such as age,
hemoglobin level, platelet count, BM blast, or other EML did not reveal significant
differences between the mutated and unmutated patient subgroups (Table 9, 10,
11).
We further correlated the patient characteristics for the younger
t(8;21)-positive patients group. In analogy to the whole group, the main difference
was observed in patients with KIT-mutations showing a significantly higher LDH
than KIT-unmutated patients (P = 0.007), this difference was also significant when
focusing on KIT exon 17 mutations (P = 0.007). The KIT exon 17 mutated group
also had a higher rate of hepatomegaly (P = 0.05). In contrast to the whole t(8;21)
group, there was no difference in the percentages of PB and BM blasts for the

Results
44
younger group with regard to NRAS and KRAS mutation status. Secondary
chromosome abnormality such as loss of Y chromosome was observed in 48% of
the younger patients (15/31), loss of X chromosome in female patients occurred in
38% (8/21) of the younger patients. There was no difference between mutated and
unmutated patients with regard to the RAS, KIT or FLT3 mutation status. In addition,
correlation of other clinical characteristics such as age, hemoglobin level, platelet
count, BM blast, or other EML did not reveal significant differences between the
mutated and unmutated groups in younger patients.

Resu
lts
45
Ta
ble
9. t(
8;2
1)-
po
sit
ive
AM
L:
Pa
tie
nts
ch
ara
cte
ris
tic
s a
cc
ord
ing
to
th
e N
RA
S a
nd
KR
AS
mu
tati
on
sta
tus
.
Ch
ara
cte
risti
cs
NR
AS
-wt
n =
52
NR
AS
-mu
t n
= 1
4
P =
KR
AS
-wt
n =
63
KR
AS
-mu
t n
= 3
P
=
Ag
e,
years
M
ed
ian
(ra
ng
e)
49.19 (18.440-73.09)
50.21 (19.16-63.52)
0.83
49.11 (18.44-73.09)
50.59 (45.01-63.52)
0.64
<= 60 years no.
40
12
50
2
>60 years no.
12
2
13
1
Sex, n
o. o
f p
ati
en
ts (
%)
F
emale
19
6
0.76
25
0
0.28
M
ale
33
8
38
3
Typ
e A
ML
, n
o. o
f p
ati
en
ts (
%)
D
e novo
38
9
0.41
46
1
0.09
s-AML
3
0
6
2
t-AML
5
3
3
0
m
issing
6
2
9
Hem
og
lob
in level, g
/L, M
ed
ian
(ra
ng
e)
9.10 (4.20-14.80)
8.0 (4.7-11.2)
0.32
9.0 (4.2-14.8)
8.00 (5.40-9.70)
0.33
Pla
tele
t co
un
t,×
10
9/L
, M
ed
ian
(ra
ng
e)
36.2 (5.0-226.0)
45.0 (7.0-470.0)
0.12
39.0 (5.0-470.0)
42.0 (30.0-58.0)
0.83
WB
C c
ou
nt,
×10
9/L
, M
ed
ian
(ra
ng
e)
9.2 (1.1-133.2)
17.00 (3.50-152.0)
0.07
22.16 (1.10-152.0)
17.00 (9.40-22.10)
0.41
PB
bla
sts
%, M
ed
ian
(ra
ng
e)
46.5 (1.0-90.0)
34.0 (0.0-87.0)
0.12
46.0 (0.0-90.0)
25.0 (10.0-31.0)
0.09
BM
bla
sts
%, M
ed
ian
(ra
ng
e)
70.0 (6.0-85.0)
50.0 (20.0-80.0)
0.04
60.0 (6.0-98.0)
32.0 (25.0-38.0)
0.05
FA
B s
ub
typ
e,
no
. o
f p
ati
en
ts (
%)
M
0
2
1
0.85
3
0
0.17
M
1
5
1
5
1
M
2
32
7
38
1
M
3
2
1
2
1
M
4
4
1
5
0
M
5
0
0
0
0
M
6
0
0
0
0
m
issing
7
3
10
Ad
dit
ion
al C
hro
mo
so
mal
Ab
err
ati
on
s, n
o.
of
pati
en
ts (
%)
L
oss Y
16(31)
5(42)
0.25
19(32)
2(67)
0.76
L
oss X
8(16)
1(8)
9(15)
0
m
issing no.
1
2
3
LD
H,
U/L
, M
ed
ian
(ra
ng
e)
470.0 (161.0-3890.0)
740.0 (366.0-1299.0)
0.10
497.0 (161.0-3890.0)
740.0 (375.0-1096.0)
0.48
Sp
len
om
eg
aly
,*n
o.
(%)
13(41)
4(40)
0.80
16(42)
1(33)
0.47
m
issing no.
20
4
24
Hep
ato
meg
aly
, n
o. (%
) 6(27)
0
0.16
6(21)
0
1.00
m
issing no.
30
6
34
2
AML: acu
te m
yeloid le
uke
mia; BM: bone m
arrow; FAB: French
-America
n-British; LDH: lactate dehyd
rogenase
, norm
al value le
ss than 240 U/L; PB: Peripheral B
lood; t-AML:
therapy-related AML; s-AML: se
condary AML; -m
ut: M
utatio
n; W
BC: white
blood cell; -wt: -Wild-typ
e. *D
efin
ed as more than 13 cm as measu
red by ultraso
nography.

Resu
lts
46
Ta
ble
10
. t(
8;2
1)-
po
sit
ive
AM
L:
Pa
tie
nts
ch
ara
cte
ris
tic
s a
cc
ord
ing
to
th
e K
IT m
uta
tio
n s
tatu
s.
Ch
ara
cte
risti
cs
KIT
-wt
n =
50
KIT
-mu
t n
= 1
6
P =
KIT
17-w
t n
= 5
1
KIT
17-m
ut
n =
15
P =
Ag
e,
years
M
ed
ian
(ra
ng
e)
49.76 (18.44-73.09)
46.63(19.16-72.37)
0.96
49.27 (18.440-73.09)
47.85 (33.87-72.37)
0.68
<= 60 years no.
41
11
42
10
>60 years no.
9
5
9
5
Sex, n
o. o
f p
ati
en
ts (
%)
F
emale
19
6
1.00
19
6
1.00
M
ale
31
10
32
9
Typ
e A
ML
, n
o. o
f p
ati
en
ts (
%)
D
e novo
34
13
0.85
35
12
1.00
s-AML
6
2
6
2
t-AML
3
0
3
0
m
issing
7
1
7
1
Hem
og
lob
in level,g
/L, M
ed
ian
(ra
ng
e)
8.8 (4.2-12.6)
9.40 (6.60-14.80)
0.36
8.9 (4.2-12.6)
9.55 (6.60-14.80)
0.40
Pla
tele
t co
un
t,×
10
9/L
, M
ed
ian
(ra
ng
e)
39.0 (7.0-470.0)
35.0 (5.0-114.0)
0.53
40.5 (7.0-470.0)
34.0 (5.0-114.0)
0.33
WB
C c
ou
nt,
×10
9/L
, M
ed
ian
(ra
ng
e)
9.40 (1.10-152.00)
10.35 (2.30-60.45)
0.73
10.10 (1.10-152.00)
9.90 (2.3-36.30)
0.43
PB
bla
sts
%, M
ed
ian
(ra
ng
e)
46.0 (0.0-90.0)
50.0 (1.0-87.0)
0.43
46 (0-90)
47.5 (1.0-78.0)
0.76
BM
bla
sts
%, M
ed
ian
(ra
ng
e)
50.5 (6.0-98.0)
65.0 (24.0-93.0)
0.27
51.0 (6.0-98.0)
70.0 (24.0-93.0)
0.24
FA
B s
ub
typ
e,
no
. o
f p
ati
en
ts (
%)
M
0
2
1
0.28
2
1
0.18
M
1
5
1
5
1
M
2
31
8
32
7
M
3
2
1
2
1
M
4
2
3
2
3
M
5
0
0
0
0
M
6
0
0
0
0
m
issing
8
2
8
2
Ad
dit
ion
al C
hro
mo
so
mal
Ab
err
ati
on
s, n
o.
of
pati
en
ts (
%)
L
oss Y
17 (36)
4(25)
0.67
17(33)
4(27)
0.75
L
oss X
6(13)
3(19)
6(13)
3(20)
m
issing no.
3
3
LD
H,
U/L
, M
ed
ian
(ra
ng
e)
439.5 (161.0-3890.0)
895.0 (213.0-2579.0)
0.004
439.5 (161.0-3890.0)
895.5 (213.0-2579.0)
0.004
Sp
len
om
eg
aly
,*n
o.
(%)
13(36)
4(50)
0.37
14(39)
3(43)
0.35
m
issing no.
16
8
16
8
Hep
ato
meg
aly
, n
o. (%
) 2(9)
4(50)
0.06
2(9)
4(50)
0.04
m
issing no.
28
8
29
7
AML: acu
te m
yeloid le
uke
mia; BM: bone m
arrow; FAB: French
-America
n-British; LDH: lactate dehyd
rogenase
, norm
al value le
ss than 240 U/L; PB: Peripheral B
lood; t-AML:
therapy-related AML; s-AML: se
condary AML; -m
ut: M
utatio
n; W
BC: white
blood cell; -wt: -Wild-typ
e. *D
efin
ed as more than 13 cm as measu
red by ultraso
nography.

Resu
lts
47
Ta
ble
11
. t(
8;2
1)-
po
sit
ive
AM
L:
Pa
tie
nts
ch
ara
cte
ris
tic
s a
cc
ord
ing
to
th
e F
LT
3 m
uta
tio
n s
tatu
s.
Ch
ara
cte
risti
cs
FL
T3-
ITD
-wt
n =
60
FL
T3-
ITD
-mu
t n
= 6
P
=
F
LT
3-T
KD
-wt
n =
63
FL
T3-T
KD
-mu
t n
= 3
P
=
Ag
e,
years
M
ed
ian
(ra
ng
e)
49.75 (18.44-73.09)
44.99 (33.56-58.96)
0.27
49.11 (19.16-73.09)
68.810 (18.44-70.41)
0.56
<= 60 years no.
46
6
51
1
>60 years no.
14
0
12
2
Sex, n
o. o
f p
ati
en
ts (
%)
F
emale
22
3
0.67
23
2
0.55
M
ale
28
3
40
1
Typ
e A
ML
, n
o. o
f p
ati
en
ts (
%)
D
e novo
42
5
0.31
46
1
1.00
s-AML
8
0
8
0
t-AML
2
1
3
0
m
issing
8
6
2
Hem
og
lob
in level,g
/L, M
ed
ian
(ra
ng
e)
9.05 (4.70-14.80)
8.75 (4.20-9.80)
0.48
9.00 (4.20-14.80)
10.6 (10.6-10.6)
0.23
Pla
tele
t co
un
t,×
10
9/L
, M
ed
ian
(ra
ng
e)
37.1 (5.0-470.0)
52.0 (20.0-191.0)
0.20
39.0 (5.0-470.0)
9.0 (9.0-9.0)
0.13
WB
C c
ou
nt,
×10
9/L
, M
ed
ian
(ra
ng
e)
9.9 (1.8-152.0)
11.15 (1.10-133.20)
0.54
9.9 (1.1-152.0)
9.8 (2.6-17.0)
0.62
PB
bla
sts
%, M
ed
ian
(ra
ng
e)
46.0 (0.0-90.0)
68.0 (24.0-79.0)
0.37
46.0 (0.0-90.0)
50.0 (50.0-50.0)
0.81
BM
bla
sts
%, M
ed
ian
(ra
ng
e)
60.0 (6.0-98.0)
50.5 (30.0-85.0)
0.66
60.0 (6.0-98.0)
93.0 (93.0-93.0)
0.17
FA
B s
ub
typ
e,
no
. o
f p
ati
en
ts (
%)
M
0
3
0
1.00
3
0
1.00
M
1
6
0
6
0
M
2
34
5
37
2
M
3
3
0
3
0
M
4
5
0
5
0
M
5
0
0
0
0
M
6
0
0
0
0
m
issing
9
1
9
1
Ad
dit
ion
al C
hro
mo
so
mal
Ab
err
ati
on
s, n
o.
of
pati
en
ts (
%)
L
oss Y
20(34)
1(20)
0.34
21(35)
0
0.36
L
oss X
8(14)
1(20)
8(13)
1(33)
m
issing no.
2
1
3
LD
H,
U/L
, M
ed
ian
, ra
ng
e
489.0 (161.0-2579.0)
804.5 (249.0-3890)
0.38
497.0 (161.0-3890.0)
1759.0 (1759.0-1759.0)
0.12
Sp
len
om
eg
aly
,*n
o.
(%)
15(42)
2(33)
0.12
17(40)
0
0.06
m
issing no.
24
21
3
Hep
ato
meg
aly
, n
o. (%
) 6(22)
0
0.82
6(20)
0
0.45
m
issing no.
33
3
33
3
AML: acu
te m
yeloid le
uke
mia; BM: bone m
arrow; FAB: French
-America
n-British; LDH: lactate dehyd
rogenase
, norm
al value le
ss than 240 U/L; PB: Peripheral B
lood; t-AML:
therapy-related AML; s-AML: se
condary AML; -m
ut: M
utatio
n; W
BC: white
blood cell; -wt: -Wild-typ
e. *D
efin
ed as more than 13 cm as measu
red by ultraso
nography.
Results
48
3.4. Response to induction therapy
3.4.1. Response to induction therapy for inv(16)-positive patients
The CR rate in younger (< 60 years) and older (≥ 60 years) patients was 89%
and 85%, respectively. Correlations between the presence of NRAS, KRAS, KIT,
and FLT3 mutations and response to induction therapy, as determined by
univariate analysis, are given in Table 12, 13, and 14. Univariate analysis showed
that the presence of FLT3-ITD mutations was associated with low CR (50%), 25%
resistant disease (RD), and 25% early death (ED) (P = 0.06). However, the number
of FLT3-ITD mutated patients was quite small (n = 4), 1 patient had RD, 1 had ED,
and 2 patients attained CR. There was no difference in response to induction
therapy with regard to the NRAS, KRAS, KIT and FLT3-TKD mutational status
when tested as single variables (Table 12, 13, 14). Due to very low RD and ED,
multivariable analysis could not be performed in response rates after induction
therapy for the different gene mutations.
3.4.2. Response to induction therapy for t(8;21)-positive patients
For all 66 patients with t(8;21) the CR rate was 86%; whereas 90% of the
younger patients achieved CR after induction therapy. Univariate analyses
revealed that there was no difference in CR rates for RAS, KIT, FLT3 (Table15, 16,
17), and JAK2 (data not show) mutated t(8;21)-positive patients compared to the
unmutated group. Due to very low RD and ED, multivariable analysis could not be
performed.

Resu
lts
49
Ta
ble
12
. A
ch
ieve
me
nt
of
CR
ac
co
rdin
g t
o t
he
NR
AS
an
d K
RA
S m
uta
tio
n s
tatu
s in
in
v(1
6)-
po
sit
ive
pa
tie
nts
.
N
RA
S-w
t n
= 4
9
NR
AS
-mu
t n
= 5
1
K
RA
S-w
t n
= 9
1
KR
AS
-mu
t n
= 9
Rem
issio
n
All
Pati
en
ts n
= 1
01
ag
e <
60 y
ears
n =
94
no
. o
f p
ati
en
ts (
%)
no
. o
f p
ati
en
ts (
%)
P =
n
o. o
f p
ati
en
ts (
%)
no
. o
f p
ati
en
ts (
%)
P =
CR
90 (89)
85(90)
42(86)
47(92)
0.06
82(90)
7(78)
0.26
RD
5 (5)
3(3)
5(10)
0
4(4)
1(11)
ED
6 (6)
6(7)
2(4)
4(8)
5(5)
1(11)
-wt: -Wild-typ
e; -m
ut: M
utatio
n; CR in
dicated complete remission; RD: resistant disease
; ED: early death.
Ta
ble
13
. A
ch
ieve
me
nt
of
CR
ac
co
rdin
g t
o t
he
KIT
mu
tati
on
sta
tus
in
in
v(1
6)-
po
sit
ive
pa
tie
nts
.
K
IT-w
t n
= 7
2
KIT
-mu
t n
= 2
8
K
IT17-w
t n
= 8
9
KIT
17-m
ut
n =
11
Rem
issio
n
All
Pati
en
ts n
= 1
01
ag
e <
60 y
ears
n=
94
no
. o
f p
ati
en
ts (
%)
no
. o
f p
ati
en
ts (
%)
P =
n
o. o
f p
ati
en
ts (
%)
no
. o
f p
ati
en
ts (
%)
P =
CR
90 (89)
85(90)
62(86)
27(96)
0.37
78(87)
11(100)
1,00
RD
5 (5)
3(3)
4(6)
1(4)
5(6)
0
ED
6 (6)
6(7)
6(8)
0
6(7)
0
-wt: -Wild-typ
e; -m
ut: M
utatio
n; CR in
dicated complete remission; RD: resistant disease
; ED: early death.
Ta
ble
14
. A
ch
ieve
me
nt
of
CR
ac
co
rdin
g t
o t
he F
LT
3 m
uta
tio
n s
tatu
s in
in
v(1
6)-
po
sit
ive
pa
tie
nts
.
F
LT
3-T
KD
-wt
n =
85
FL
T3-T
KD
-mu
t n
= 1
6
F
LT
3-I
TD
-wt
n =
97
FL
T3-I
TD
-mu
t n
= 4
Rem
issio
n
All
Pati
en
ts n
=101
ag
e <
60 y
ears
n=
94
no
. o
f p
ati
en
ts (
%)
no
. o
f p
ati
en
ts (
%)
P =
n
o. o
f p
ati
en
ts (
%)
no
. o
f p
ati
en
ts (
%)
P =
CR
90 (89)
85(90)
75(88)
15(94)
1,00
88(91)
2(50)
0.06
RD
5 (5)
3(3)
5(6)
0
4(4)
1(25)
ED
6 (6)
6(7)
5(6)
1(6)
5(5)
1(25)
-wt: -Wild-typ
e; -m
ut: M
utatio
n; CR in
dicated complete remission; RD: resistant disease
; ED: early death.

Resu
lts
50
Ta
ble
15
. A
ch
ieve
me
nt
of
CR
ac
co
rdin
g t
o t
he
NR
AS
an
d K
RA
S m
uta
tio
n s
tatu
s in
t(8
;21
)-p
os
itiv
e p
ati
en
ts.
NR
AS
-wt
n =
52
NR
AS
-mu
t n
= 1
4
K
RA
S-w
t n
= 6
3
KR
AS
-mu
t n
= 3
Rem
issio
n
All
Pati
en
ts n
= 6
6
ag
e <
60 y
ears
n =
52
no
. o
f p
ati
en
ts (
%)
no
. o
f p
ati
en
ts (
%)
P =
n
o. o
f p
ati
en
ts (
%)
no
. o
f p
ati
en
ts (
%)
P =
CR
55 (86)
46(90)
44(86)
11(84)
0.45
53(87)
2(67)
0.43
RD
3 (5)
0
2(4)
1(8)
3(5)
0
ED
6 (9)
5(10)
5(10)
1(8)
5(8)
1(33)
missing
1
1
2
-wt: -Wild-typ
e; -m
ut: M
utatio
n; CR in
dicated complete remission; RD, resistant disease
; and ED, early death.
Ta
ble
16
. A
ch
ieve
me
nt
of
CR
ac
co
rdin
g t
o t
he K
IT m
uta
tio
n s
tatu
s in
t(8
;21
)-p
os
itiv
e p
ati
en
ts.
KIT
-wt
n =
50
KIT
-mu
t n
= 1
6
K
IT17-w
t n
= 5
1
KIT
17-m
ut
n =
15
Rem
issio
n
All
Pati
en
ts n
= 6
6
ag
e <
60 y
ears
n =
52
no
. o
f p
ati
en
ts (
%)
no
. o
f p
ati
en
ts (
%)
P =
n
o. o
f p
ati
en
ts (
%)
no
. o
f p
ati
en
ts (
%)
P =
CR
55 (86)
46(90)
43(88)
12(80)
0.18
44(88)
11(79)
0.14
RD
3 (5)
0
1(2)
2(13)
1(2)
2(14)
ED
6 (9)
5(10)
5(10)
1(7)
5(10)
1(7)
missing
1
1
1
1
-wt: -Wild-typ
e; -m
ut: M
utatio
n; CR in
dicateds co
mplete remission; RD, resistant disease
; and ED, early death.
Ta
ble
17
. A
ch
ieve
me
nt
of
CR
ac
co
rdin
g t
o t
he
FLT
3 m
uta
tio
n s
tatu
s in
t(8
;21
)-p
os
itiv
e p
ati
en
ts.
FL
T3 IT
D-w
t n
= 6
0
FL
T3 IT
D-m
ut
n =
6
FL
T3-T
KD
-wt
n =
63
FL
T3-T
KD
-mu
t n
= 3
Rem
issio
n
All
Pati
en
ts n
= 6
6
ag
e <
60 y
ears
n =
52
no
. o
f p
ati
en
ts (
%)
no
. o
f p
ati
en
ts (
%)
P =
n
o. o
f p
ati
en
ts (
%)
no
. o
f p
ati
en
ts (
%)
P =
CR
55 (86)
46(90)
50(86)
5(83)
0.68
53(85)
2(100)
0.14
RD
3 (5)
0
3(5)
0
3(5)
0
ED
6 (9)
5(10)
5(9)
1(17)
6(10)
0
missing
2
1
1
-wt: -Wild-typ
e; -m
ut: M
utatio
n; CR in
dicateds co
mplete remission; RD, resistant disease
; and ED, early death.

Results
51
3.5. Survival analysis
3.5.1. Survival analysis for inv(16)-positive patients
In the whole inv(16) group, 94 patients received the assigned postremission
therapy. The median follow-up time for survival was 52 months (95%-CI, 36 - 62
months). In univariate analyses, FLT3-TKD mutations were associated with a
significant inferior RFS (P = 0.03), and in trend adverse EFS (P = 0.07) (Figure 12),
but not in OS (P = 0.55). Of the 4 FLT3-ITD-mutated patients, 2 died from disease
progression during chemotherapy, and 2 are alive after autologous SCT, therefore,
no significant difference in OS (P = 0.15) and RFS (P = 0.86) was observed. For
the patients harboring NRAS mutations, there was no significant difference in OS
(P = 0.52), EFS (P = 0.59), and RFS (P = 0.80). The same was true when
comparing patients with and without KRAS mutations; again there was no
significant difference in OS (P = 0.85), EFS (P = 0.99), and RFS (P = 0.62).
However, the NRAS mutated group showed a trend to reach a plateau after 1 year
of follow-up for RFS (P = 0.80) as well as EFS (P = 0.59) for (Figure 13). This
feature was not observed in the KRAS mutated groups, which is probably due to
the low number (n = 9) of mutated patients. Between KIT-mutated and
KIT-unmutated patients there was no significant difference in OS (P = 0.70), EFS
(P = 0.86), and RFS (P = 0.38); when focusing at KIT exon 17 mutation only, again
there was no significant difference in OS (P = 0.66), EFS (P = 0.59), and RFS (P =
0.23) between the mutated and unmutated patients. However, when performing the
analyses according to the different postremission therapies [high-dose cytarabine
(HiDAC), autologous SCT (autoSCT), allogeneic SCT (alloSCT)], the distinct
consolidation regimens seem to impact the prognosis for FLT3-TKD and KIT exon
17 mutated patients.

Results
52
Figure 12. RFS (A) and EFS (B) according to the FLT3-TKD mutation status in 101 inv(16)
patients. EFS: event-free survival; RFS: relapse-free survival.
Figure 13. RFS (A) and EFS (B) according to the NRAS mutation status in 101 inv(16)
patients. EFS: event-free survival; RFS: relapse-free survival.
Based on the different postremission therapies that patients with FLT3-TKD
mutations received, we defined 5 subgroups for further analysis:
alloSCT-FLT3-TKD-unmutated (n = 13), autoSCT-FLT3-TKD-unmutated (n = 18),
autoSCT- FLT3-TKD mutated (n = 5), HiDAC- FLT3-TKD-unmutated (n = 47),
HiDAC-FLT3-TKD mutated (n = 10); there was no FLT3-TKD-mutated patient who
was assigned to alloSCT. The estimated 3-year RFS and EFS among these 5
groups was significantly different (P = 0.003 and P = 0.007, respectively) (Figure
14). FLT3-TKD mutated patients undergoing autoSCT had a better RFS than
FLT3-TKD mutated patients receiving HiDAC, and unmutated patients treated with
Time (months)
Relapse
-Free-S
urvival (%)
0 12 24 36 48 60 72 84 96 108 120 132
0
25
50
75
100
FLT3-TKD mutated n=15
FLT3-TKD unmutated n=79
P=0.03
Time (months)
Eve
nt-Free-Survival (%)
0 12 24 36 48 60 72 84 96 108 120 132
0
25
50
75
100
FLT3-TKD unmutated n=85
FLT3-TKD mutated n=16
P=0.07A B
Time (months)
Eve
nt-Free-S
urvival (%)
0 12 24 36 48 60 72 84 96 108 120 132
0
25
50
75
100
Time (months)
Relapse
-Free-Survival (%)
0 12 24 36 48 60 72 84 96 108 120 132
0
25
50
75
100 P=0.59P=0.80
NRAS unmutated n=49
NRAS mutated n=48NRAS mutated n=51
NRAS mutated n=45
A B

Results
53
more intensive regimens such as alloSCT or autoSCT, had a better RFS compared
to patients treated with HiDAC alone. There was no significant difference in OS
among these groups (P = 0.24).
Figure 14. RFS (A) and EFS (B) according to the FLT3-TKD mutation status and different
postremission therapies in 101 inv(16)-positive patients. alloSCT: allogeneic stem cell
transplantation; autoSCT: autologous stem cell transplantation; EFS: event-free survival;
HiDAC: high-dose cytarabine; RFS: relapse-free survival.
When looking for different treatment effects in the KIT exon 17 mutated
patients, 6 subgroups were identified: alloSCT-KIT17-mutated (n = 2),
alloSCT-KIT17-unmutated (n = 11), autoSCT-KIT17-mutated (n = 5),
autoSCT-KIT17-unmutated (n = 18), HiDAC-KIT17-mutated (n = 4),
HiDAC-KIT17-unmutated (n = 52). RFS and EFS was significantly different among
the 6 groups (P < 0.0001 and P = 0.0007, respectively) (Figure 15). KIT exon 17
mutated patients undergoing alloSCT, or autoSCT had a better RFS and EFS than
mutated patients treated with HiDAC. Similarly, unmutated patients treated by
alloSCT or autoSCT had a better RFS and EFS compared to patients who received
HiDAC. However, one should keep in mind, that the number of patients treated
within the different regimens was quite small. There was no significant difference in
OS among these groups (P = 0.26).
P= 0.007
Time (months)
Eve
nt-Free-Survival (%)
0 12 24 36 48 60 72 84 96 108 120 132
0
25
50
75
100
Time (months)
Relapse
-Free-S
urvival (%)
0 12 24 36 48 60 72 84 96 108 120 132
0
25
50
75
100
autoSCT-unmutated n=18
HiDAC-mutated n=10
HiDAC-unmutated n=47
alloSCT-unmutated n=13
autoSCT-mutated n=5
P= 0.003
autoSCT-unmutated n=18
HiDAC-mutated n=10
HiDAC-unmutated n=47
alloSCT-unmutated n=13
autoSCT-mutated n=5
BA

Results
54
Figure 15. RFS (A) and EFS (B) of KIT exon 17 mutated patients according to different
postremission therapies in 101 inv(16) patients. alloSCT: allogeneic stem cell
transplantation; autoSCT: autologous stem cell transplantation; EFS: event-free survival;
HiDAC: high-dose cytarabine; RFS: relapse-free survival.
Since FLT3 and KIT mutations represent excellent targets for a therapy with
tyrosine kinase inhibitors, we performed an explorative analysis for the combined
FLT3-TKD and/or KIT exon 17 mutation status. Patients having either FLT3-TKD or
KIT exon 17 or both mutations (P = 0.02) had a significantly inferior RFS compared
to unmutated patients. However, there was no difference in OS which is mainly due
to the high rate of second complete remission in this patient subgroup (P = 0.32)
(Figure 16).
Figure 16. RFS (A) and OS (B) according to the combined FLT3-TKD and/or KIT exon 17
mutation status in 101 inv(16) patients. RFS: relapse-free survival; OS: overall survival.
Time (months)
Eve
nt-Free-S
urvival (%)
0 12 24 36 48 60 72 84 96 108 120 132
0
25
50
75
100
Time (months)
Relapse
-Free-Survival (%)
0 12 24 36 48 60 72 84 96 108 120 132
0
25
50
75
100 P=0.0007P<0.0001
autoSCT-unmutated n=18
HiDAC-mutated n=4
HiDAC-unmutated n=53
alloSCT-unmutated n=11
autoSCT-mutated n=5
alloSCT-mutated n=2
autoSCT-unmutated n=18
HiDAC-mutated n=4
HiDAC-unmutated n=52
alloSCT-unmutated n=11
autoSCT-mutated n=5
alloSCT-mutated n=2
BA
A B
time (years)
Su
rviv
al
(%)
0 1 2 3 4 5 6 7 8 9 10 11
0
25
50
75
100
time (years)
Rela
ps
e-f
ree
Su
rviv
al
(%)
0 1 2 3 4 5 6 7 8 9 10 11
0
25
50
75
100
time (years)
Rela
ps
e-f
ree
Su
rviv
al
(%)
0 1 2 3 4 5 6 7 8 9 10 11
0
25
50
75
100
FLT3-TKD and KIT exon 17 unmutated n=71
P=0.02
FLT3-TKD and/or KIT exon17 mutated n=21
FLT3-TKD and KIT exon17 unmutated n=71
P=0.32
FLT3-TKD and/or KIT
exon 17 mutated n=21

Results
55
3.5.1.1. Survival analyses for 94 younger inv(16)-positive patients
To address the different biological and clinical features of younger AML
patients, the same survival analysis was performed in the 94 younger (< 60 years)
inv(16)-positive patients. In analogy to the analysis of the whole cohort, univariate
analysis showed a trend to reach a plateau after 1 year in RFS analysis (P = 0.64)
for NRAS mutated patients. However, there was no significant difference in EFS,
OS, and RFS in the younger inv(16)-patient group with regard to the KRAS and KIT
mutation status.
Explorative subgroup analysis based on the FLT3-TKD and KIT exon 17
mutation status was performed for the different postremission therapies. None of
the FLT3-TKD mutation patients underwent alloSCT. Comparing FLT3-TKD
positive patients who received HiDAC or autoSCT with FLT3-TKD unmutated
patients treated with the same approaches, FLT3-TKD mutated patients had an
adverse RFS (P = 0.02) (Figure 17). KIT exon 17 mutated patients treated with
HiDAC, had a significant inferior RFS (P = 0.00004) and OS (P = 0.05), in contrast
to patients receiving alloSCT or autoSCT (RFS P = 0.70; OS P = 0.44) (Figure 18,
19). Therefore, the negative prognostic impact of KIT exon 17 mutations seems to
be abrogated by SCT strategies, although the number of patients is quite small.
In analogy to the whole inv(16) group explorative subgroup analysis based on
the combined FLT3-TKD and/or KIT exon 17 mutation status was performed.
FLT3-TKD mutated and/or KIT exon 17 mutated patients had a significantly
adverse RFS than unmutated patients (P = 0.01) whereas for the whole inv(6)
cohort, there was no difference in OS (P = 0.33).
FLT3-TKD unmutated n=59
FLT3-TKD mutated n=15
P=0.02

Results
56
Figure 17. RFS according to the FLT3-TKD mutation status in 94 younger inv(16) patients
treated with HiDAC or autoSCT regimen. autoSCT: autologous stem cell transplantation;
HiDAC: high-dose cytarabine; RFS: relapse-free survival.
Figure 18. RFS according to the KIT exon 17 mutation status in 94 younger inv(16)
patients treated with (A) HiDAC or (B) SCT regimens. SCT: stem cell transplantation; HiDAC:
high-dose cytarabine; RFS: relapse-free survival.
Figure 19. OS according to the KIT exon 17 mutation status in 94 younger
inv(16)-positive patients treated with HiDAC (A) or SCT regimens (B). SCT: stem cell
transplantation; HiDAC: high-dose cytarabine; OS: overall survival.
3.5.2. Survival analysis for t(8;21)-positive patients
Among 66 t(8;21)-positive patients, 52 younger patients received
postremission therapy with HiDAC, and 14 older patients (≥ 60 years) were
randomized for intensive postremission therapy with idarubicin and etoposide or
time (years)
Relapse
-free Survival (%)
0 1 2 3 4 5 6 7 8 9
0
25
50
75
100 P = 0.00004
time (years)
Relapse
-free Survival (%)
0 1 2 3 4 5 6 7 8 9 10 11
0
25
50
75
100 P = 0.70
KIT exon 17 unmutated n=47
KIT exon 17 mutated n=3
KIT exon 17 unmutated n=28
KIT exon 17 mutated n=7
A B
time (years)
Survival (%)
0 1 2 3 4 5 6 7 8 9
0
25
50
75
100
time (years)
Survival (%)
0 1 2 3 4 5 6 7 8 9 10 11
0
25
50
75
100P = 0.05
KIT unmutated n=47
KIT mutated n=3
P = 0.44
KIT unmutated n=28
KIT mutated n=7
A B

Results
57
outpatient maintenance therapy. The median follow-up time for survival was 44
months (95%-CI, 36 - 57 months). In univariate analysis, FLT3-ITD mutations were
significantly associated with an inferior RFS (P = 0.02), and in trend OS (P = 0.06),
and EFS (P = 0.08) in all 66 patients (Figure 20). KIT mutated patients showed no
significant difference in OS (P = 0.12) and RFS (P = 0.76) compared to the
unmutated group. However, when looking at KIT exon 17 mutated patients in a
subset analysis, these patients showed in trend a shorter OS (P = 0.06), whereas
there was no difference in RFS (P = 0.49) and EFS (P = 0.18) for the whole t(8;21)
group (Figure 21). With regard to the NRAS mutation status, there was no
significant difference between mutated and unmutated patients in OS (P = 0.16),
RFS (P = 0.43), and EFS (P = 0.32); the same was true for the KRAS mutations
(OS P = 0.97, RFS P = 0.78, and EFS P = 0.32). However, the NRAS mutated
group showed a trend to reach a plateau after 1 year of follow-up for OS, RFS and
EFS (Figure 22). There was no significant difference in FLT3-TKD mutated and
unmutated patients in OS (P = 0.82) and RFS (P = 0.38), and no difference in
prognosis between JAK2 mutated and unmutated patients. Since FLT3-ITD and
KIT exon 17 mutations both represent potential targets for tyrosine kinase inhibitors,
an explorative analysis combining both gene mutations versus unmutated patients
was performed revealing a significant inferior OS (P = 0.006), EFS (P = 0.03), and
in trend RFS (P = 0.06) (Figure 23).
Figure 20. RFS (A) and OS (B) according to the FLT3-ITD mutation status in 66 t(8;21)
patients. RFS: relapse-free survival; OS: overall survival.
Time (months)
Survival (%)
0 6 18 30 42 54 66 78 90 102
0
25
50
75
100
Time (months)
Relapse
-Free-S
urvival (%)
0 6 12 24 36 48 60 72 84 96
0
25
50
75
100
FLT3-ITD unmutated n=52
FLT3-ITD mutated n=5
P=0.02
FLT3-ITD unmutated n=60
FLT3-ITD mutated n=6
P=0.06A B
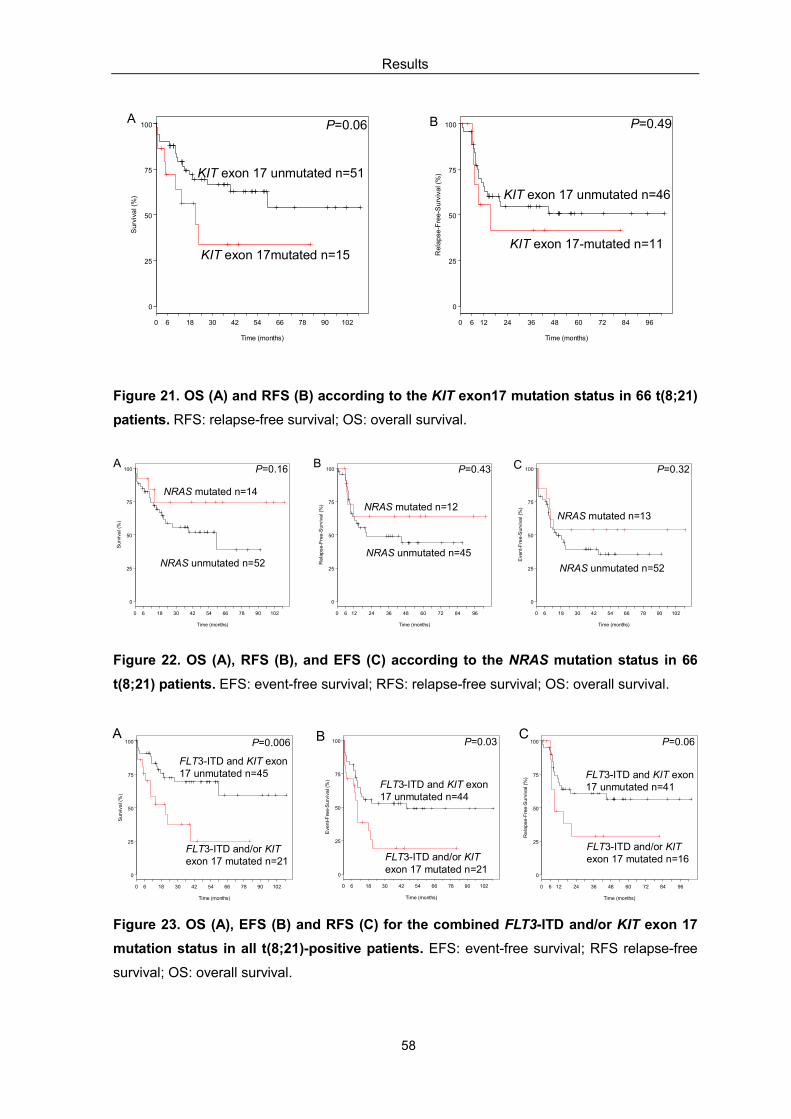
Results
58
Figure 21. OS (A) and RFS (B) according to the KIT exon17 mutation status in 66 t(8;21)
patients. RFS: relapse-free survival; OS: overall survival.
Figure 22. OS (A), RFS (B), and EFS (C) according to the NRAS mutation status in 66
t(8;21) patients. EFS: event-free survival; RFS: relapse-free survival; OS: overall survival.
Figure 23. OS (A), EFS (B) and RFS (C) for the combined FLT3-ITD and/or KIT exon 17
mutation status in all t(8;21)-positive patients. EFS: event-free survival; RFS relapse-free
survival; OS: overall survival.
Time (months)
Survival (%)
0 6 18 30 42 54 66 78 90 102
0
25
50
75
100
Time (months)
Eve
nt-Free-Survival (%)
0 6 18 30 42 54 66 78 90 102
0
25
50
75
100
Time (months)
Relapse
-Free-S
urvival (%)
0 6 12 24 36 48 60 72 84 96
0
25
50
75
100
FLT3-ITD and KIT exon17 unmutated n=45
FLT3-ITD and/or KIT exon 17 mutated n=21
FLT3-ITD and KIT exon17 unmutated n=44
FLT3-ITD and/or KIT exon 17 mutated n=21
FLT3-ITD and KIT exon17 unmutated n=41
FLT3-ITD and/or KITexon 17 mutated n=16
P=0.006 P=0.03 P=0.06A B C
Time (months)
Survival (%)
0 6 18 30 42 54 66 78 90 102
0
25
50
75
100
Time (months)
Relapse
-Free-S
urvival (%)
0 6 12 24 36 48 60 72 84 96
0
25
50
75
100P=0.06
KIT exon 17mutated n=15
KIT exon 17 unmutated n=51
P=0.49
KIT exon 17-mutated n=11
KIT exon 17 unmutated n=46
A B
Time (months)
Survival (%)
0 6 18 30 42 54 66 78 90 102
0
25
50
75
100
Time (months)
Relapse
-Free-S
urvival (%)
0 6 12 24 36 48 60 72 84 96
0
25
50
75
100P=0.16 P=0.43
NRAS unmutated n=52NRAS unmutated n=45
NRAS mutated n=14
NRAS mutated n=12
Time (months)
Eve
nt-Free-S
urvival (%)
0 6 18 30 42 54 66 78 90 102
0
25
50
75
100 P=0.32
NRAS mutated n=13
NRAS unmutated n=52
A B C

Results
59
3.5.2.1. Survival analyses for 52 younger t(8;21)-positive patients
In accordance with the inv(16)-positive group, we next analyzed the prognostic
impact of NRAS, KRAS, KIT, FLT3 and JAK2 mutations in the 52 younger t(8;21)
patients who were uniformly assigned to post-remission therapy with HiDAC. In
univariate analysis, the adverse effect of FLT3 mutations on prognosis (RFS P =
0.009, EFS P = 0.02, and OS P = 0.02) was mainly due to the presence of
FLT3-ITD mutations. In contrast to the analysis of the whole t(8;21) patient cohort,
in younger t(8;21)-positive patients KIT exon 17 mutations did not show significant
differences in OS (P = 0.37), EFS (P = 0.31), and RFS (P = 0.27). In addition, there
was no significant difference in OS, EFS and RFS for KIT mutated NRAS mutated
KRAS mutated or JAK2 mutated patients compared to the unmutated group.
However, when combining FLT3-ITD and/or KIT exon 17 mutation status, patients
with either one or both gene mutations showed a significantly adverse OS (P =
0.02), EFS (P = 0.02), and RFS (P = 0.01) compared to the unmutated patients.

Discussion
60
4. Discussion
In this study, we evaluated the incidence and prognostic impact of RAS, KIT,
FLT3 and JAK2 mutations in a large cohort of CBF leukemia consisting of 101
inv(16)-positive and 66 t(8;21)-positive AML patients. We demonstrated that these
gene mutations were present in 86% of the 101 inv(16)-positive and in 58% of the
66 t(8;21)-positive patients, respectively. By using a comprehensive gene mutation
screening approach, this is the first study revealing gene mutations with a
frequency up to 90% in CBF AML (Care et al. 2003; Valk et al. 2004; Nanri et al.
2005; Beghini et al. 2004; Boissel et al. 2006; Cairoli et al. 2006). Moreover,
correlation of these molecular findings with clinical outcome showed that some
gene mutations are of prognostic relevance. In the inv(16)-positive group patients
with FLT3-TKD and KIT mutations had a significantly worse outcome compared to
unmutated patients. Likewise, in t(8;21)-positive group FLT3-ITD and KIT mutations
were associated with a poor prognosis. The detection of gene mutations with such
a high frequency can be attributed to the high sensitivity of DHPLC analysis that
has been used in our study (Xiao et al. 2001).
Since there was no significant difference in mutation frequency and clinical
outcome between the younger and the older inv(16)-positive or t(8;21)-positive
patient groups for all gene mutation types (RAS, KIT, FLT3, and JAK2) that have
been analyzed, the results of younger inv(16)- and t(8;21)-positive groups will not
be discussed separately.
4.1. RAS analysis
Our analysis on a large cohort of inv(16)-positive AML identified NRAS
mutations in 57%, which was considerably higher than the prevalence of 13% to
38% in CBF AML that have been described by other studies (Panagopoulos et al.
1996; Kiyoi et al. 1999; Bacher et al. 2006; Boissel et al. 2006). In accordance to
other groups we also identified NRAS mutation to be the most detected gene
mutation in inv(16) AML (Goemans et al, 2005; Boissel et al. 2006). Consistent with
Bacher et al (2006) NRAS mutations mainly involved codon 61. In contrast, KRAS
mutations were detected in 9% of our cohort which is less frequent than in the study
from Bowen et al. (2005) who identified KRAS mutations in 23% of the
inv(16)-positive patients. These findings may reflect a greater transforming capacity
Discussion
61
for NRAS mutation in hematopoietic cells (Maher et al. 1994), and/or the
predominance of NRAS P21 protein in myeloid cells (Furth et al. 1987) leading to a
selective pressure for NRAS in comparison to KRAS gene mutation.
Among t(8;21)-positive patients, NRAS mutations were detected in 21% of the
patients showing a higher incidence compared to previous reports (Boissel et al.
2006; Bowen et al. 2005). KRAS mutation were detected in 5% of all
t(8;21)-positive patients, an incidence that is similar to the average frequency of
KRAS mutations identified by other groups (Boissel et al. 2006; Goemans et al.
2006). Studies from Kiyoi et al. (1999) and Bacher et al. (2006) showed that NRAS
mutations were significantly associated with lower peripheral leukocyte counts,
whereas in our study no significant correlation of WBC could be identified for both
the inv(16)- and t(8;21)-positive group, respectively. However, when considering
the median percentage of BM and PB blast cells, there were significantly less BM
blast cells in the NRAS mutated t(8;21)-positive cohort compared to the unmutated
group.
Although RAS gene is frequently affected by mutation in CBF AML, the
prognostic significance of this mutation in CBF AML is still under discussion.
Boissel et al. (2006) did not observe RAS mutation affecting prognosis by
screening 103 CBF AML (73 adults and 30 children CBF AML). In the study of
Goemans et al. (2005), no significant influence on the clinical outcome was found in
patients presenting RAS mutation including a small subset of 27 pediatric CBF AML.
In the study from Bacher et al. (2006), on a large cohort of CBF leukemia, 113
inv(16)-positive and 116 t(8;21)-positive AML patients, no statistically significant
impact of NRAS mutations was detected with regard to CR rate, OS and EFS. In
addition, in the MRC AML 10 and AML 12 trial studies (Bowen et al. 2005), the
presence of NRAS or KRAS mutations did not significantly influence prognosis
when considering the specific risk groups inv(16)-positive and t(8;21)-positive AML.
However, these historical data sets are hampered by the heterogeneity of patient
treatment, and by limited patient numbers that do not allow to distinguish
prognostic differences in CBF AML patients. In our study on a large series of
inv(16)- and t(8;21)-positive patients, no significant differences in clinical outcome
was observed between NRAS mutated and unmutated patients, which was in
agreement with previous observations. However, in accordance to the study from

Discussion
62
Bacher et al. (2006) Kaplan-Meier plot in our study showed a trend for NRAS
mutated patients to reach a plateau after 1 year in both the inv(16) and the
t(8;21)-positive group, respectively. For KRAS mutations there was no significant
difference in clinical outcome between the mutated and the unmutated group in the
inv(16)-positive as well as in the t(8;21)-positive patients, which might be possibly
due to the low frequency of this mutation type.
4.2. KIT analysis
The incidence of KIT mutations in CBF leukemia has been reported to vary
between 12.8% and 46.1% (Care et al. 2003; Kohl et al. 2005; Boissel et al. 2006;
Schnittger et al. 2006). In our current study, KIT mutations were detected in 28% of
the inv(16)-positive patient group; 18% of the 101 inv(16) patients exhibited a KIT
exon 8 mutation, whereas 11% had exon 17 mutations. In the t(8;21)-positive group,
KIT mutations were detected in 24%; exon 8 mutations (6%) were less common
than in inv(16) patients, whereas exon 17 mutations (23%) were observed with a
relatively high frequency compared to the inv(16) group. In accordance to previous
findings (Gari et al. 1999; Care et al. 2003; Goemans et al. 2006; Boissel et al.
2006), we observed all different KIT exon 8 mutation types that have been
described so far, like small deletions or deletions and insertions affecting the same
codon D419. The majority of exon 17 mutations occurred at D816 and very rarely in
N822, which is somewhat in contrast to the findings of Wang et al. (2005) who
described the most frequent KIT exon 17 mutation in codon N822 in t(8;21) AML.
These disparities may be possibly due to ethnic and geographic variations. Given
the aforementioned genetic heterogeneity of KIT mutation types, it is crucial to
determine the exact type of KIT mutation in each patient because activity of specific
TK inhibitors have been reported to be dependant on the KIT mutation type
(Paschka et al. 2006).
In agreement with the report from Paschka et al. (2006), in our study
inv(16)-positive patients with KIT mutations had significantly higher PB blast cells
compared to the KIT unmutated cases. The same was true when comparing exon
17 mutated patients with those having KIT wild-type. In addition, in our study, KIT
mutated t(8;21)-positive patients had significantly higher LDH level than unmutated
patients, and the same results showed up when performing subgroup analysis for

Discussion
63
KIT exon 17 mutations.
To date, several studies have analyzed the prognostic significance of KIT
mutations in inv(16)-positive AML. However, the prognostic significance of this
gene mutation is discussed controversially. Care et al. (2003) showed that KIT exon
8 mutations are associated with an increased relapse rate but have no impact on
OS in 63 inv(16)-positive AML; while data from a CALGB (Paschka et al. 2006) on
61 adult inv(16)-positive AML patients demonstrated that the presence of KIT exon
17 mutations conferred a higher relapse risk, and both exons 8 and 17 mutations
appeared to adversely affect OS. In contrast to these findings both Cairoli et al.
(2006) and Boissel et al. (2006) were unable to show a prognostic impact of KIT
mutations in 25 adult inv(16)-positive patients and in 47 adult and childhood
inv(16)-positive cases, respectively. However, these studies were heterogeneous
with respect to number of patient that have been analyzed, treatment, various
techniques that have been used for mutation screening, and parts of the KIT gene,
which have been screened. In a recent report from Schnittger et al. (2006), KIT
gene D816 mutations have been analyzed in a relative large number of inv(16)
patients (n = 97) by using a melting curve-based Light Cycler assay. In their study,
only two patients harboring the KIT D816 mutation have been identified not
allowing to perform a meaningful clinical correlation.
In our study, to our knowledge the largest inv(16) AML cohort that has been
analyzed so far, univariate analysis for RFS and OS did not reveal a significant
difference between patients with and without KIT mutations and this was also the
case when comparing KIT exon 17 mutated and KIT exon 17 wild-type patients.
However, when correlating the KIT exon17 mutation status according to the
different types of postremission therapy, our data suggest that patients with KIT
exon 17 mutations might benefit from more intensive postremission strategies such
as allogeneic or autologous SCT as indicated by an improved RFS and reduced
relapse risk compared to patients who received consolidation therapy with HiDAC.
Thus, the adverse prognosis of KIT exon 17 might be overcome by the more
intensive SCT strategies. However, the current study was performed
retrospectively with only 4 KIT exon 17 mutated patients have been treated with
HiDAC chemotherapy. Therefore, the role of pretreatment KIT exon 17 mutation
status in the context of different postremission regimens is intriguing but has to be

Discussion
64
evaluated in larger prospective trials.
Recently, several studies evaluated the prognostic impact of KIT mutations in
t(8;21)-positive AML. Schnittger et al. (2006), who analyzed 76 adult t(8;21) AML
patients with KIT exon 17 for D816 mutations, found an independent negative
impact on EFS and OS. Data from an Italian retrospective study on 42
t(8;21)-positive patients (Cairoli et al. 2006) showed that patients with KIT D816
mutations had a significantly higher incidence of relapse and a lower OS. In
accordance to these findings the France research group (Boissel et al. 2006)
reported on 50 adult and childhood t(8;21)-positive leukemia and showed that
patients with KIT exon 17 mutations have an adverse OS and EFS. Paschka et al.
(2006) demonstrated that KIT mutations are associated with a higher CIR, but do
not impact on survival. In analogy to the studies on inv(16)-positive leukemia,
studies on the prognostic impact of KIT mutations in t(8;21)-positive AML are
limited due to the size of patient population, the heterogeneity of the patients and
the treatment and the parts the KIT gene was screened for; in particular, some
studied just focused on KIT D816 mutations.
In contrast to previous findings, in our study univariate analysis showed no
significant difference between KIT mutated and unmutated patients for RFS, EFS
and OS. The same was true when focusing on KIT exon 17 mutated cases. This
might be related to differences in patient numbers, distinct treatment regimens, in
particular the type of salvage therapy, as well as differences in ethnic background.
Finally, one have to take into account that other molecular aberrations that have not
been identified yet might contribute to the differences in the clinical phenotype.
4.3. FLT3 analysis
The prevalence of FLT3-ITD mutations in CBF leukemia varies from one study
to another. Care et al. (2003) reported 3% FLT3-ITD mutations in 63
inv(16)-positive patients, and 4% in 47 t(8;21)-positive patients, respectively. In the
study of Boissel et al. (2006), only one t(8;21)-positive patient had a FLT3-ITD
mutation out of 103 adult and childhood CBF leukemia patients. Schessl et al.
(2006) detected 11 (8%) FLT3-ITD mutated patients in a cohort of 135
t(8;21)-positive patients. In comparison to previous reports, in our study, we have
screened a large cohort of CBF patients and found the incidence of FLT3-ITD was
Discussion
65
to be 4% in the inv(16)-positive group, and 9% in the t(8;21)-positive group.
In contrast FLT3-ITD, FLT3-TKD mutations has been detected with a higher
frequency in inv(16)-positive AML; whereas the incidence is low in t(8;21)-positive
leukemia. Care et al. (2003) identified FLT3-TKD mutation 5% of 63 inv(16)-positive
and in and 2% of 47 t(8;21)-positive patients, respectively. Boissel et al. (2006)
identified FLT3-TKD mutation in 6% of 47 inv(16)-positive patients and in 7% of 56
t(8;21)-positive patients, respectively. However, this study also included 30 cases of
childhood leukemia. Schessl et al. (2006) detected FLT3-TKD mutations in 2% of
135 t(8;21)-positive patients. In a recent study published by Mead and colleagues
(2007) a high frequency of 24% FLT3-TKD mutations (13/55) was reported in cases
with inv(16); whereas the incidence in the t(8;21)-positive group was 7% (5/69). In
our study, FLT3-TKD mutations were detected in 16% of the inv(16)-positive
leukemia and in 5% of the t(8;21)-positive group, respectively.
Obviously, the frequency of FLT3-ITD and FLT3-TKD mutations in CBF AML is
markedly different in comparison to normal karyotype AML where FLT3-ITD
mutations are relatively common (25 - 30%) and FLT3-TKD occur with an incidence
of 8% to 12% (Small D. 2006). In comparison to most others studies in CBF AML, in
our study, we identified a relatively high incidence of 19% of FLT3 (ITD and TKD)
mutations in inv(16)-positive patients and 14% in t(8;21)-positive patients. It is very
unlikely that these differences are caused by technical reasons but are rather due
to the relatively large size of patients number tested.
In normal karyotype AML FLT3-ITD mutations have clearly emerged as a
negative prognostic marker (Yamamoto et al. 2001; Thiede et al. 2002; Fröhling et
al. 2002), whereas more recent data provide evidence that FLT3-TKD mutations
are associated with an improved clinical outcome (Mead et al. 2007). However, the
prognostic impact of either FLT3-ITD or FLT3-TKD mutations in CBF leukemia is
still under discussion. In the study by Care et al. (2003) FLT3-ITD or FLT3-TKD
mutations did not impact the prognosis of inv(16)-positive and t(8;21)-positive
leukemia. Boissel et al. (2006) found FLT3-ITD and FLT3-TKD to be associated
with a significantly worse EFS and OS in inv(16)- and t(8;21)-positive patients.
However, in their study of 103 CBF AML, a significant number of childhood
leukemia was analyzed.

Discussion
66
In contrast to previous results, in our study, FLT3-TKD mutations were
significantly associated with an inferior RFS and in trend with an adverse EFS in
the inv(16)-positive group, whereas for FLT3-ITD mutations we could not identify a
prognostic impact. However, the number of FLT3-ITD mutations was quite low with
only 4 mutated patients in the whole inv(16) group. For the t(8;21)-positive group
the presence of FLT3-ITD mutations was associated with a significantly inferior
RFS and in trend with a shorter OS and EFS. In contrast, FLT3-TKD mutations did
not show a prognostic significance.
Since FLT3 gene (ITD and TKD) mutations and KIT exon 17 mutations both
represent potential targets for tyrosine kinase inhibitors, an explorative combined
analysis for either FLT3-TKD and/or KIT exon 17 mutated patients versus
unmutated patients was performed revealing a significant inferior RFS in inv(16)
patients, and a significant inferior OS, EFS, and in trend RFS in t(8;21)-positive
patients. There was no effect on OS in inv(16)-positive cases, which is mainly due
to the fact that almost all inv(16)-positive patients achieved a second CR.
4.4. JAK2 analysis
Recently, several studies have described JAK2 mutations as cooperating
mutations in t(8;21)-positive AML (Lee et al. 2006; Döhner et al. 2006; Schnittger et
al. 2007). In the study of Lee et al. (2006), JAK2 mutations were found in two of 12
t(8;21)-positive patients. Schnittger et al. (2007) identified JAK2 mutations in two
(8%) of the 24 t(8;21)-positive cases. JAK2 V617F mutations were also detected by
Illmer and colleagues (2007) who screened 138 CBF leukemia patients with an
incidence of 3.5% (n = 5); in the t(8;21)-positive group 2 patients harbored the
mutation and in the inv(16) group 3 cases were JAK2 V617F positive. In our series,
JAK2 mutations were exclusively detected in t(8;21)-positive AML with an
incidence of 6% (4/66). In contrast to the report from Illmer et al. (2007) who
demonstrated JAK2 V617F mutations were associated with an aggressive clinical
outcome in CBF leukemia, the four mutated t(8;21) patients in our study had no
distinct biological or clinical features compared to the unmutated t(8;21) patients.
However, in both studies the number of JAK2 mutated patients was quite small not
allowing any conclusions on the prognostic impact of JAK2 mutations in this AML
subgroup. Future studies on larger cohorts might facilitate the evaluation of the

Discussion
67
prognostic impact of JAK2 V617F mutations in CBF leukemias.
4.5. Conclusion
In the current study, mutation screening of the genes encoding for RAS, KIT,
FLT3, and JAK2 revealed a mutation rate of almost 90% in inv(16)-positive patients
and almost 60% in the t(8;21)-positive cohort, respectively. This data suggest that
activating mutations in the RTK and in the RAS pathways might play an important
role in the pathogenesis of CBF AML.
Recent data from murine models showed that the expression of one single
gene mutation is not sufficient to cause AML and that cooperation of several genes
is necessary. Based on this observation a model of two complementation groups of
mutations has been suggested. The class I mutations leading to activation of
signaling pathways resulting in enhanced proliferation and/or survival of leukemic
cells and the class II mutations affecting transcription factors or components of the
transcriptional-coactivation complex leading to an impaired differentiation of
hematopoeitc cells. The fusion transcripts CBFβ-MYH11 or AML1-ETO resulting
from inv(16) or t(8;21), respectively, have been shown to belong to the class II
mutation group, whereas mutations in the RTK genes such as FLT3, KIT, or JAK2
or mutations in the RAS gene fall into the group of class I mutations. Therefore, it is
very likely that cooperation of these gene mutations might be one of the major
pathogenic events in CBF leukemia. Our data provide further evidence that some of
these secondary gene mutations are of prognostic relevance. In our study
FLT3-TKD and KIT mutations were associated with an inferior outcome in
inv(16)-positive AML. Likely, FLT3-ITD and KIT mutations were associated with an
unfavorable prognosis in t(8;21)-positive patients. In addition, in the inv(16) group
our data suggest that different consolidation regimens may impact on the prognosis
dependent on the FLT3-TKD and KIT mutation status. However, the number of
mutated patients who received HiDAC or an intensive SCT-based regimen in our
study was quite small. This study provides an important basis to fully evaluate the
role of SCT in KIT and/or FLT3 mutated patients in a larger number of
homogenously treated CBF patients.
Identification of secondary gene mutations in CBF leukemia is of major clinical
relevance since some of these molecular rearrangements can be targeted by

Discussion
68
molecular therapies as it has been impressively shown for CML. Activated RTK
pathways can be inhibited by a number of tyrosine kinase inhibitors (Weisberg et al.
2002) that have recently been developed. Likewise, the RAS pathway can be
successfully targeted by Farnesyltransferase-inhibitors (Lancet et al. 2003).
Based on our data that were generated within one of the largest cohorts of
CBF leukemias, together with data reported by several other groups, FLT3 and KIT
gene mutations seem to be of prognostic significance. In the near future, mutation
screening of CBF leukemias might reach clinical importance, in particular for the
identification of patients who might benefit from molecular targeted therapies.

Summary
69
5. Summary
Patients with core binding factor (CBF) acute myeloid leukemia (AML), defined
by the inversion/translocation inv(16) and the translocation t(8;21)
[inv(16)(p13q22)/t(16;16)(p13;q22) and t(8;21)(q22;q22)] are considered to have a
favorable outcome, in particular when treated with cytarabine-based consolidation
regimens. However, a significant proportion of these patients relapse and survival
after 5 years is approximately 50%. These findings together with studies from
murine models suggest that additional genetic lesions are underlying the clinical
heterogeneity of CBF leukemias. The recently described mutations in the signaling
molecules RAS, KIT, FLT3, and JAK2 represent potential secondary genetic
lesions that might contribute to leukemic transformation through their constitutive
activation.
In this study we determined the incidence of RAS (NRAS and KRAS exon 1
and exon 2), KIT (exons 8, 10, 11, and 17), FLT3 [Internal tandem duplication (ITD)
and Tyrosine kinase domain (TKD) at codon D835], and JAK2 V617 mutations in
101 adults patients with inv(16) (median age 41 years) and 66 adult patients
(median age 49 years) with t(8;21)-positive AML, respectively, and evaluated their
prognostic impact on clinical outcome.
KIT and RAS mutation screening was performed using a sensitive Denaturing
high performance liquid chromatography (DHPLC)-based assay; FLT3-ITDs were
identified by Polymerase chain reaction (PCR), and detection of FLT3-TKD
mutation was performed by PCR and restriction fragment length polymorphism
(PCR-RFLP). The presence of the JAK2 V617 mutation was revealed by
allele-specific PCR. All samples with abnormal DHPLC profile and specific bands in
gel were confirmed by direct sequencing. Patients were enrolled in 5 AML Study
Group (AMLSG) treatment trials [AML HD93, AML HD98-A, AML HD98-B, AMLSG
07-04, and AMLSG 06-04] and the Hemato-Oncologie voor Volwassenen
Nederland (HOVON) protocol. Postremission therapy in t(8;21)-positive AML was
consistently high-dose cytarabine (HiDAC) in all trials, whereas in inv(16) AML
cohort of patients were treated with HiDAC, autologous or allogeneic stem cell
transplantation (SCT) in first complete remission (CR). The comprehensive
mutation analyses of the RAS, KIT, FLT3, or JAK2 genes revealed a high mutation
rate of 86% with highest frequencies in NRAS (51%), followed by KIT (28%) and

Summary
70
FLT3-TKD (16%) mutations; in particular, 10/28 KIT mutations affected exon 17.
KRAS and FLT3-ITD mutations were detected in 9% and 4%, respectively. In
analogy, for the t(8;21)-positive patients 58% exhibited gene mutations in at least
one of the genes. Highest frequencies were detected for KIT mutations (24%)
followed by NRAS (21%) and FLT3-ITD mutations (9%); 10/16 KIT mutations
affected exon 17. KRAS, FLT3-TKD and JAK2 mutation were detected in 5%, 5%,
and 6%, respectively. In the inv(16) cohort, univariate analyses showed a
significant inferior relapse-free survival RFS (P = 0.004) for patients with FLT3-TKD,
whereas for the other gene mutations there was no significant difference between
mutated and unmutated patients. Interestingly, when performing survival analysis
for the type of postremission therapy according to the FLT3-TKD and KIT exon 17
mutation status, we saw a benefit for mutated patients who received a more
intensive treatment regimen like autologous or allogeneic SCT in comparison to
patients undergoing HiDAC. However, one has to keep in mind that the patient
number in the different treatment arms is still quite small. Likely, FLT3-ITD and KIT
mutations were associated with an unfavorable prognosis in a large series of
t(8;21)-positive patients. The negative prognostic impact of FLT3 and KIT
mutations in CBF leukemia was clearly demonstrated by an explorative analysis
using the combined mutation status [FLT3-TKD and/or KIT exon 17 for the
inv(16)-positive group; FLT3-ITD and/or KIT exon 17 for the t(8;21)-positive group]
versus the unmutated patients. In the inv(16)-positive group, patients with either
one of the two mutation types had a significantly inferior RFS (P = 0.02) than the
wild-type patients. In the t(8;21)-positive group, RFS and overall survival (OS) were
significantly worse for patients exhibiting a FLT3-ITD and/or KIT exon 17 mutation
(P = 0.06 and P = 0.006).
In summary, the high frequency of RAS, KIT, FLT3 or JAK2 gene mutations in
CBF leukemia further sustain the model of different cooperating groups of gene
mutations. In our study FLT3 and KIT exon 17 mutations seems to be of prognostic
relevance. Although we screened one of the largest series of CBF leukemias, the
patient number for subgroup analysis is still small. Therefore, our preliminary
findings on the clinical benefit for inv(16)-positive patients receiving SCT-based
treatment have to be evaluated on a larger patient population. In addition,
information on the KIT and FLT3 mutation status might soon reach clinical
importance for identifying patients who are eligible for molecular targeted therapies.
References
71
6. References
Abu-Duhier FM, Goodeve AC, Wilson GA, Care RS, Peake IR, Reilly JT: Genomic
structure of human FLT3: implications for mutational analysis. Br J Haematol 113:
1076-1077 (2001)
Agresti A, Coull BA: Approximate is better than ‘exact’ for interval estimation of
binomial proportions. The American Statistician 52: 119-126 (1998)
Ahmadian MR, Zor T, Vogt D, Kabsch W, Selinger Z, Wittinghofer A, Scheffzek K:
Guanosine triphosphatase stimulation of oncogenic Ras mutants. Proc Natl Acad
Sci USA 96: 7065-7070 (1999)
Appelbaum FR, Kopecky KJ, Tallman MS, Slovak ML, Gundacker HM, Kim HT,
Dewald GW, Kantarjian HM, Pierce SR, Estey EH: The clinical spectrum of adult
acute myeloid leukaemia associated with core binding factor translocations. Br J
Haematol 135: 165-173 (2006)
Armstrong SA, Golub TR, Korsmeyer SJ: MLL-rearranged leukemias: Insights from
gene expression profiling. Semin Hematol 40: 268-273 (2003)
Bacher U, Haferlach T, Schoch C, Kern W, Schnittger S: Implications of NRAS
mutations in AML: a study of 2502 patients. Blood 107: 3847-3853 (2006)
Baer MR, Stewart CC, Lawrence D, Arthur DC, Byrd JC, Davey FR, Schiffer CA,
Bloomfield CD: Expression of the neural cell adhesion molecule CD56 is associated
with short remission duration and survival in acute myeloid leukemia with
t(8;21)(q22;q22). Blood 90: 1643-1648 (1997)
Baxter EJ, Scott LM, Campbell PJ, East C, Fourouclas N, Swanton S, Vassiliou GS,
Bench AJ, Boyd EM, Curtin N, Scott MA, Erber WN, Green AR: Cancer Genome
Project. Acquired mutation of the tyrosine kinase JAK2 in human myeloproliferative
disorders. Lancet 365: 1054-1061 (2005)
Beaupre DM, Kurzrock R: RAS and leukemia: from basic mechanisms to
gene-directed therapy. J Clin Oncol 17: 1071-1079 (1999)
Beghini A, Ripamonti CB, Cairoli R, Cazzaniga G, Colapietro P, Elice F, Nadali G,

References
72
Grillo G, Haas OA, Biondi A, Morra E, Larizza L: KIT activating mutations:
Incidence in adult and pediatric acute myeloid leukemia, and identification of an
internal tandem duplication. Haematologica 89: 920-925 (2004)
Bennett JM, Catovsky D, Daniel MT, Flandrin G, Galton DA, Gralnick HR, Sultan C:
Proposed revised criteria for the classification of acute myeloid leukemia: A report
of the French-American-British Cooperative Group. Ann Intern Med 103: 620-625
(1985)
Besmer P, Murphy JE, George PC, Qiu FH, Bergold PJ, Lederman L, Snyder HW
Jr, Brodeur D, Zuckerman EE, Hardy WD: A new acute transforming feline
retrovirus and relationship of its oncogene v-kit with the protein kinase gene family.
Nature 320: 415-422 (1986)
Bloomfield CD, de la Chapelle A: Chromosome abnormalities in acute
nonlymphocytic leukemia: clinical and biologic significance. Semin Oncol 14:
372-383 (1987)
Bloomfield CD, Lawrence D, Byrd JC, Carroll A, Pettenati MJ, Tantravahi R, Patil
SR, Davey FR, Berg DT, Schiffer CA, Arthur DC, Mayer RJ: Frequency of
prolonged remission duration after high-dose cytarabine intensification in acute
myeloid leukemia varies by cytogenetic subtype. Cancer Res 58: 4173-4179 (1998)
Bos JL. ras oncogenes in human cancer: a review. Cancer Res 49: 4682-4689
(1989)
Boissel N, Leroy H, Brethon B, Philippe N, S de Botton S, Auvrignon A, Raffoux E:
Incidence and prognostic impact of c-Kit, FLT3, and Ras gene mutations in core
binding factor acute myeloid leukemia (CBF-AML). Leukemia 20: 965-970 (2006)
Borrow J, Stanton VP Jr, Andresen JM, Becher R, Behm FG, Chaganti RS, Civin CI,
Disteche C, Dube I, Frischauf AM, Horsman D, Mitelman F, Volinia S, Watmore AE,
Housman DE: The translocation t(8;16)(p11;p13) of acute myeloid leukaemia fuses
a putative acetyltransferase to the CREB-binding protein. Nat Genet 14: 33-41
(1996)
Bowen DT, Frew ME, Hills R, Gale RE, Wheatley K, Groves MJ, Langabeer SE,
Kottaridis PD, Moorman AV, Burnett AK, Linch DC: RAS mutation in acute myeloid
References
73
leukemia is associated with distinct cytogenetic subgroups but does not influence
outcome in patients younger than 60 years. Blood 106: 2113-2119 (2005)
Byrd JC, Mrózek K, Dodge RK, Carroll AJ, Edwards CG, Arthur DC, Pettenati MJ,
Patil SR, Rao KW, Watson MS, Koduru PR, Moore JO, Stone RM, Mayer RJ,
Feldman EJ, Davey FR, Schiffer CA, Larson RA, Bloomfield CD: Cancer and
Leukemia Group B (CALGB 8461). Pretreatment cytogenetic abnormalities are
predictive of induction success, cumulative incidence of relapse, and overall
survival in adult patients with de novo acute myeloid leukemia: results from Cancer
and Leukemia Group B (CALGB 8461). Blood 100: 4325-4336 (2002)
Byrne JL, Marshall CJ: The molecular pathophysiology of myeloid leukaemias: Ras
revisited. Br J Haematol 100: 256-264 (1998)
Cairoli R, Beghini A, Grillo G, Nadali G, Elice F, Ripamonti CB, Colapietro P,
Nichelatti M, Pezzetti L, Lunghi M, Cuneo A, Viola A, Ferrara F, Lazzarino M,
Rodeghiero F, Pizzolo G, Larizza L, Morra E: Prognostic impact of c-KIT mutations
in core binding factor leukemias: An Italian retrospective study. Blood 107:
3463-3468 (2006)
Campos L, Guyotat D, Archimbaud E, Calmard-Oriol P, Tsuruo T, Troncy J, Treille
D, Fiere D: Clinical significance of multidrug resistance P-glycoprotein expression
on acute nonlymphoblastic leukemia cells at diagnosis. Blood 79: 473-476 (1992)
Care RS, Valk PJ, Goodeve AC, Abu-Duhier FM, Geertsma-Kleinekoort WM,
Wilson GA, Gari MA, Peake IR, Lowenberg B, Reilly JT: Incidence and prognosis of
c-KIT and FLT3 mutations in core binding factor (CBF) acute myeloid leukaemias.
Br J Haematol 121: 775-777 (2003)
Castilla LH, Wijmenga C, Wang Q, Stacy T, Speck NA, Eckhaus M, Marin-Padilla
M, Collins FS, Wynshaw-Boris A, Liu PP: Failure of embryonic hematopoiesis and
lethal hemorrhages in mouse embryos heterozygous for a knocked-in leukemia
gene CBFB-MYH11. Cell 87: 687-696 (1996)
Castilla LH, Garrett L, Adya N, Orlic D, Dutra A, Anderson S, Owens J, Eckhaus M,
Bodine D, Liu PP: The fusion gene Cbfb-MYH11 blocks myeloid differentiation and
predisposes mice to acute myelomonocytic leukaemia. Nat Genet 23: 144-146

References
74
(1999)
Cheson BD, Bennett JM, Kopecky KJ, Buchner T, Willman CL, Estey EH, Schiffer
CA, Döhner H, Tallman MS, Lister TA, Lo-Coco F, Willemze R, Biondi A,
Hiddemann W, Larson RA, Lowenberg B, Sanz MA, Head DR, Ohno R, Bloomfield
CD: Revised recommendations of the International Working Group for Diagnosis,
Standardization of Response Criteria, Treatment Outcomes, and Reporting
Standards for Therapeutic Trials in Acute Myeloid Leukemia. J Clin Oncol
21:4642-4649 (2003). Erratum in: J Clin Oncol 22: 576 (2004)
Choudhary C, Schwable J, Brandts C, Tickenbrock L, Sargin B, Kindler T, Fischer
T, Berdel WE, Muller-Tidow C, Serve H: AML associated Flt3 kinase domain
mutations show signal transduction differences compared with Flt3 ITD mutations.
Blood 106: 265-273 (2005)
Claesson-Welsh L, Eriksson A, Westermark B, Heldin CH: cDNA cloning and
expression of the human A-type platelet-derived growth factor (PDGF) receptor
establishes structural similarity to the B-type PDGF receptor. Proc Natl Acad Sci
USA 86: 4917-4921 (1989)
Claxton DF, Liu P, Hsu HB, Marlton P, Hester J, Collins F, Deisseroth AB, Rowley
JD, Siciliano MJ: Detection of fusion transcripts generated by the inversion 16
chromosome in acute myelogenous leukemia. Blood 83: 1750-1756 (1994)
Costello R, Sainty D, Blaise D, Gastaut JA, Gabert J, Poirel H, Buzyn-Veil A,
Macintyre E: Prognosis value of residual disease monitoring by polymerase chain
reaction in patients with CBF beta/MYH11-positive acute myeloblastic leukemia.
Blood 89: 2222-2223 (1997)
Coussens L, Van Beveren C, Smith D, Chen E, Mitchell RL, Isacke CM, Verma IM,
Ullrich A: Structural alteration of viral homologue of receptor proto-oncogene fms at
C terminus. Nature 320: 277-280 (1986)
Delaunay J, Vey N, Leblanc T, Fenaux P, Rigal-Huguet F, Witz F, Lamy T,
Auvrignon A, Blaise D, Pigneux A, Mugneret F, Bastard C, Dastugue N, Van den
Akker J, Fiere D, Reiffers J, Castaigne S, Leverger G, Harousseau JL, Dombret H:
French Acute Myeloid Leukemia Intergroup: Groupe Ouest-Est des Leucemies

References
75
Aigues Myeoblastiques; Leucemies Aigues Myeoblastiques de l'Enfant; Acute
Leukemia French Association; Bordeaux-Grenoble-Marseille-Toulouse cooperative
groups. Prognosis of inv(16)/t(16;16) acute myeloid leukemia (AML): a survey of
110 cases from the French AML Intergroup. Blood 102: 462-469 (2003)
Döhner K, Du J, Corbacioglu A, Scholl C, Schlenk RF, Döhner H: JAK2V617F
mutations as cooperative genetic lesions in t(8;21)-positive acute myeloid leukemia.
Haematologica 91: 1569-1570 (2006)
Emmerson P, Maynard J, Jones S, Butler R, Sampson JR, Cheadle JP:
Characterizing mutations in samples with low-level mosaicism by collection and
analysis of DHPLC fractionated heteroduplexes. Hum Mutat 21: 112-115 (2003)
Erickson P, Gao J, Chang KS, Look T, Whisenant E, Raimondi S, Lasher R, Trujillo
J, Rowley J, Drabkin H: Identification of breakpoints in t(8;21) acute myelogenous
leukemia and isolation of a fusion transcript, AML1/ETO, with similarity to
Drosophila segmentation gene, runt. Blood 80: 1825-1831(1992)
Fenske TS, Pengue G, Mathews V, Hanson PT, Hamm SE, Riaz N, Graubert TA.
Stem cell expression of the AML1/ETO fusion protein induces a myeloproliferative
disorder in mice. Proc Natl Acad Sci USA 101: 15184-15189 (2004)
Fritsche-Polanz R, Jordan JH, Feix A, Sperr WR, Sunder-Plassmann G, Valent P,
Fodinger M: Mutation analysis of C-KIT in patients with myelodysplastic syndromes
without mastocytosis and cases of systemic mastocytosis. Br J Haematol 113:
357-364 (2001)
Fröhling S, Schlenk RF, Breitruck J, Benner A, Kreitmeier S, Tobis K, Döhner H,
Döhner K: Prognostic significance of activating FLT3 mutations in younger adults
(16 to 60 years) with acute myeloid leukemia and normal cytogenetics: a study of
the AML Study Group Ulm. Blood 100: 4372-4380 (2002)
Fröhling S, Skelin S, Liebisch C, Scholl C, Schlenk RF, Döhner H, Döhner K:
Comparison of cytogenetic and molecular cytogenetic detection of chromosome
abnormalities in 240 consecutive consecutive adult patients with acute myeloid
leukemia. J Clin Oncol 20: 2480-2485 (2002)

References
76
Fröhling S, Lipka DB, Kayser S, Scholl C, Schlenk RF, Döhner H, Gilliland DG,
Levine RL, Döhner K: Rare occurrence of the JAK2 V617F mutation in AML
subtypes M5, M6, and M7. Blood 107: 1242-1243 (2006)
Furth ME, Aldrich TH, Cordon-Cardo C: Expression of ras proto-oncogene proteins
in normal human tissues. Oncogene 1: 47-58 (1987)
Gari M, Goodeve A, Wilson G, Winship P, Langabeer S, Linch D, Vandenberghe E,
Peake I, Reilly J: C-kit proto-oncogene exon 8 in-frame deletion plus insertion
mutations in acute myeloid leukaemia. Br J Haematol 105: 894-900 (1999)
Goemans BF, Zwaan CM, Miller M, Zimmermann M, Harlow A, Meshinchi S,
Loonen AH, Hahlen K, Reinhardt D, Creutzig U, Kaspers GJ, Heinrich MC:
Mutations in KIT and RAS are frequent events in pediatric core-binding factor acute
myeloid leukemia. Leukemia 19: 1536-1542 (2005)
Giebel LB, Strunk KM, Holmes SA, Spritz RA: Organization and nucleotide
sequence of the human KIT (mast/stem cell growth factor receptor)
proto-oncogene. Oncogene 7: 2207-2217 (1992)
Gilliland DG, Jordan CT, Felix CA: The molecular basis of leukemia. Hematology
Am Soc Hematol Educ Program: 80-97 (2004)
Grimwade D, Walker H, Oliver F, Wheatley K, Harrison C, Harrison G, Rees J,
Hann I, Stevens R, Burnett A, Goldstone A: The importance of diagnostic
cytogenetics on outcome in AML: analysis of 1,612 patients entered into the MRC
AML 10 trial. Blood 92: 2322-2333 (1998)
Gronwald RG, Adler DA, Kelly JD, Disteche CM, Bowen-Pope DF: The human
PDGF receptor alpha-sub-unit gene maps to chromosome 4 in close proximity to
c-kit. Human Genetics 85: 383-385 (1990)
Grundler R, Miething C, Thiede C, Peschel C, Duyster J: FLT3-ITD and tyrosine
kinase domain mutants induce 2 distinct phenotypes in a murine bone marrow
transplantation model. Blood 105: 4792-4799 (2005)
Harrell FE: Regression modeling strategies: with applications to linear models,
logistic regression, and survival analsysis. Springer-Verlag, New York (2001)

References
77
Harris NL, Jaffe ES, Diebold J, Flandrin G, Muller-Hermelink HK, Vardiman J, Lister
TA, Bloomfield CD: World Health Organization classification of neoplastic diseases
of the hematopoietic and lymphoid tissues: report of the Clinical Advisory
Committee meeting-Airlie House, Virginia, November 1997. J Clin Oncol 17:
3835-3849 (1999)
Heinrich MC, Blanke CD, Druker BJ, Corless CL: Inhibition of KIT tyrosine kinase
activity: a novel molecular approach to the treatment of KIT-positive malignancies.
J Clin Oncol 20: 1692-1703 (2002)
Hirota S, Isozaki K, Moriyama Y, Hashimoto K, Nishida T, Ishiguro S, Kawano K,
Hanada M, Kurata A, Takeda M, Muhammad Tunio G, Matsuzawa Y, Kanakura Y,
Shinomura Y, Kitamura Y: Gain-offunction mutations of c-kit in human
gastrointestinal stromal tumors. Science 279: 577-580 (1998)
Hollander N, Sauerbrei W, Schumacher M: Confidence intervals for the effects of a
prognostic factor factor after selection of an ‘optimal’ cutpoint. Statist Med 23:
1701-1713 (2004)
Huntly BJ, Gilliland DG: Leukaemia stem cells and the evolution of
cancer-stem-cell research. Nat Rev Cancer 5: 311-321 (2005)
Illmer T, Schaich M, Ehninger G, Thiede C: Tyrosine kinase mutations of JAK2 are
rare events in AML but influence prognosis of patients with CBF-leukemias.
Haematologica 92: 137-138 (2007)
Imbert A, Rosnet O, Marchetto S, Ollendorff V, Birnbaum D, Pebusque MJ:
Characterization of a yeast artificial chromosome from human chromosome band
13q12 containing the FLT1 and FLT3 receptor-type tyrosine kinase genes.
Cytogenet Cell Genet 67: 175-177(1994)
Ito Y: Structural alterations in the transcription factor PEBP2/CBF linked to four
different types of leukemia. J Cancer Res Clin Oncol 122: 266-274 (1996)
James C, Ugo V, Le Couedic JP, Staerk J, Delhommeau F, Lacout C, Garcon L,
Raslova H, Berger R, Bennaceur-Griscelli A, Villeval JL, Constantinescu SN,
Casadevall N, Vainchenker W: A unique clonal JAK2 mutation leading to
constitutive signaling causes polycythaemia vera. Nature 434: 1144-1148 (2005)

References
78
Jordan CT, Guzman ML: Mechanisms controlling pathogenesis and survival of
leukemic stem cells. Oncogene 23: 7178-7187 (2004)
Kelly LM, Gilliland DG: Genetics of myeloid leukemias. Annu Rev Genomics Hum
Genet 3: 179-198 (2002)
Kohl TM, Schnittger S, Ellwart JW, Hiddemann W, Spiekermann K: KIT exon 8
mutations associated with core-binding factor (CBF)-acute myeloid leukemia (AML)
cause hyperactivation of the receptor in response to stem cell factor. Blood 105:
3319-3321 (2005)
Korn EL: Censoring distributions as a measure of follow-up in survival analysis.
Stat Med 5: 255-260 (1986)
Kita K, Nakase K, Miwa H, Masuya M, Nishii K, Morita N, Takakura N, Otsuji A,
Shirakawa S, Ueda T, Nasu K, Kyo T, Dohy H, Kamada N: Phenotypical
characteristics of acute myelocytic leukemia associated with the t(8;21)(q22;q22)
chromosomal abnormality: frequent expression of immature B-cell antigen CD19
together with stem cell antigen CD34. Blood 80: 470-477 (1992)
Kralovics R, Passamonti F, Buser AS, Teo SS, Tiedt R, Passweg JR, Tichelli A,
Cazzola M, Skoda RC: A gain-of-function mutation of JAK2 in myeloproliferative
disorders. N Engl J Med 352: 1779-1790 (2005)
Kiyoi H, Naoe T, Nakano Y, Yokota S, Minami S, Miyawaki S, Asou N, Kuriyama K,
Jinnai I, Shimazaki C, Akiyama H, Saito K, Oh H, Motoji T, Omoto E, Saito H, Ohno
R, Ueda R: Prognostic implication of FLT3 and N-RAS gene mutations in acute
myeloid leukemia. Blood 93: 3074-3080 (1999)
Lancet JE, Karp JE: Farnesyltransferase inhibitors in hematologic malignancies:
new horizons in therapy. Blood 102: 3880-3889 (2003)
Le Beau MM, Larson RA, Bitter MA, Vardiman JW, Golomb HM, Rowley JD:
Association of an inversion of chromosome 16 with abnormal marrow eosinophils in
acute myelomonocytic leukemia. A unique cytogenetic-clinic pathological
association. N Engl J Med 309: 630-666 (1983)
Lee JW, Kim YG, Soung YH, Han KJ, Kim SY, Rhim HS, Min WS, Nam SW, Park

References
79
WS, Lee JY, Yoo NJ, Lee SH: The JAK2 V617F mutation in de novo acute
myelogenous leukemias. Oncogene 25: 1434-1436 (2006)
Levine RL, Loriaux M, Huntly BJ, Loh ML, Beran M, Stoffregen E, Berger R, Clark
JJ, Willis SG, Nguyen KT, Flores NJ, Estey E, Gattermann N, Armstrong S, Look
AT, Griffin JD, Bernard OA, Heinrich MC, Gilliland DG, Druker B, Deininger MW:
The JAK2V617F activating mutation occurs in chronic myelomonocytic leukemia
and acute myeloid leukemia, but not in acute lymphoblastic leukemia or chronic
lymphocytic leukemia. Blood 106: 3377-3379 (2005)
Liang J, Prouty L, Williams BJ, Dayton MA, Blanchard KL: Acute mixed lineage
leukemia with an inv(8)(p11q13) resulting in fusion of the genes for MOZ and TIF2.
Blood 92: 2118-2122 (1998)
Licht JD: AML1 and the AML1-ETO fusion protein in the pathogenesis of t(8;21)
AML. Oncogene 20: 5660-5679 (2001)
Liu P, Tarle SA, Hajra A, Claxton DF, Marlton P, Freedman M, Siciliano MJ, Collins
FS: Fusion between transcription factor CBF beta/PEBP2 beta and a myosin heavy
chain in acute myeloid leukemia. Science 261: 1041-1044 (1993)
Liu PP, Hajra A, Wijmenga C, Collins FS: Molecular pathogenesis of the
chromosome 16 inversion in the M4Eo subtype of acute myeloid leukemia. Blood 85:
2289-2302 (1995)
Longley BJ Jr, Metcalfe DD, Tharp M, Wang X, Tyrrell L, Lu SZ, Heitjan D, Ma Y:
Activating and dominant inactivating c-KIT catalytic domain mutations in distinct
clinical forms of human mastocytosis. Proc Natl Acad Sci USA 96: 1609-1614
(1999)
Lowenberg B, Downing JR, Burnett A: Acute myeloid leukemia. N Engl J Med 341:
1051-1062 (1999)
Maher J, Colonna F, Baker D, Luzzatto L, Roberts I: Retroviral-mediated gene
transfer of a mutant H-ras gene into normal human bone marrow alters myeloid cell
proliferation and differentiation. Exp Hematol 22: 8-12 (1994)
Marcucci G, Mrózek K, Ruppert AS, Maharry K, Kolitz JE, Moore JO, Mayer RJ,

References
80
Pettenati MJ, Powell BL, Edwards CG, Sterling LJ, Vardiman JW, Schiffer CA,
Carroll AJ, Larson RA, Bloomfield CD: Prognostic factors and outcome of core
binding factor acute myeloid leukemia patients with t(8;21) differ from those of
patients with inv(16): A Cancer and Leukemia Group B study. J Clin Oncol 23:
5705-5717 (2005)
Martelli AM, Nyakern M, Tabellini G, Bortul R, Tazzari PL, Evangelisti C, Cocco L:
Phosphoinositide 3-kinase/Akt signaling pathway and its therapeutical implications
for human acute myeloid leukemia. Leukemia 20: 911-928 (2006)
Matthews W, Jordan CT, Wiegand GW, Pardoll D, Lemischka IR: A receptor
tyrosine kinase specific to hematopoietic stem and progenitor cell-enriched
populations. Cell 65: 1143-1152 (1991)
McHale CM, Wiemels JL, Zhang L, Ma X, Buffler PA, Feusner J, Matthay K, Dahl G,
Smith MT: Prenatal origin of childhood acute myeloid leukemias harboring
chromosomal rearrangements t(15;17) and inv(16). Blood 101: 4640-4641 (2003)
Mead AJ, Linch DC, Hills RK, Wheatley K, Burnett AK, Gale RE: FLT3 tyrosine
kinase domain mutations are biologically distinct from and have a significantly more
favorable prognosis than FLT3 internal tandem duplications in patients with acute
myeloid leukemia. Blood 24: Epub ahead of print (2007) (www.ncbi.nlm.nih.gov)
Mitelman F. ISCN: an International System for Human Cytogenetic Nomenclature.
Basel, Switzerland: Karger S, (1995)
Miyamoto T, Weissman IL, Akashi K: AML1/ETO-expressing nonleukemic stem
cells in acute myelogenous leukemia with 8;21 chromosomal translocation. Proc
Natl Acad Sci USA 97: 7521-7526 (2000)
Miyoshi H, Shimizu K, Kozu T, Maseki N, Kaneko Y, Ohki M: t(8;21) breakpoints on
chromosome 21 in acute myeloid leukemia are clustered within a limited region of a
single gene, AML1. Proc Natl Acad Sci USA 88: 10431-10434 (1991)
Miyoshi H, Kozu T, Shimizu K, Enomoto K, Maseki N, Kaneko Y, Kamada N, Ohki
M: The t(8;21) translocation in acute myeloid leukemia results in production of an
AML1-MTG8 fusion transcript. EMBO J 12: 2715-2721 (1993)

References
81
Mrózek K, Heinonen K, de la Chapelle A, Bloomfield CD: Clinical significance of
cytogenetics in acute myeloid leukemia. Semin Oncol 24: 17-31(1997)
Nagata H, Worobec AS, Oh CK, Chowdhury BA, Tannenbaum S, Suzuki Y,
Metcalfe DD: Identification of a point mutation in the catalytic domain of the
protooncogene c-kit in peripheral blood mononuclear cells of patients who have
mastocytosis with an associated hematologic disorder. Proc Natl Acad Sci USA 92:
10560-10564 (1995)
Nanri T, Matsuno N, Kawakita T, Suzushima H, Kawano F, Mitsuya H, Asou N:
Mutations in the receptor tyrosine kinase pathway are associated with clinical
outcome in patients with acute myeloblastic leukemia harboring t(8;21)(q22;q22).
Leukemia 19: 1361-1366 (2005)
Neben K, Schnittger S, Brors B, Tews B, Kokocinski F, Haferlach T, Müller J, Hahn
M, Hiddemann W, Eils R, Lichter P, Schoch C: Distinct gene expression patterns
associated with FLT3- and NRAS-activating mutations in acute myeloid leukemia
with normal karyotype. Oncogene 24: 1580-1588 (2005)
Nucifora G, Birn DJ, Erickson P, Gao J, LeBeau MM, Drabkin HA, Rowley JD:
Detection of DNA rearrangements in the AML1 and ETO loci and of an AML1/ETO
fusion mRNA in patients with t(8;21) acute myeloid leukemia. Blood 81: 883-888
(1993)
Pabst T, Mueller BU, Harakawa N, Schoch C, Haferlach T, Behre G, Hiddemann W,
Zhang DE, Tenen DG: AML1-ETO downregulates the granulocytic differentiation
factor C/EBP alpha in t(8;21) myeloid leukemia. Nat Med 7: 444-451 (2001)
Panagopoulos I, Aman P, Johansson B, Malm C, Lenhoff S, Billstrom R, Mitelman
F: NRAS mutations are rare in acute myeloid leukaemias with t(8;21) or inv(16).
Eur J Haematol 56: 68-71(1996)
Parganas E, Wang D, Stravopodis D, Topham DJ, Marine JC, Teglund S, Vanin EF,
Bodner S, Colamonici OR, van Deursen JM, Grosveld G, Ihle JN: Jak2 is essential
for signaling through a variety of cytokine receptors. Cell 93: 385-395 (1998)
Paschka P, Marcucci G, Ruppert AS, Mrózek K, Chen H, Kittles RA, Vukosavljevic
T, Perrotti D, Vardiman JW, Carroll AJ, Kolitz JE, Larson RA, Bloomfield CD:

References
82
Cancer and Leukemia Group B Adverse prognostic significance of KIT mutations in
adult acute myeloid leukemia with inv(16) and t(8;21): a Cancer and Leukemia
Group B Study. J Clin Oncol 24: 3904-3911 (2006)
R Development Core Team R: A Language and Environment for Statistical
Computing. Vienna, Austria: R Foundation for Statistical Computing (2005)
(www.r-project.org)
Raspadori D, Damiani D, Lenoci M, Rondelli D, Testoni N, Nardi G, Sestigiani C,
Mariotti C, Birtolo S, Tozzi M, Lauria F: CD56 antigenic expression in acute myeloid
leukemia identifies patients with poor clinical prognosis. Leukemia 15: 1161-1164
(2001)
Reilly JT: Pathogenesis of acute myeloid leukaemia and inv(16)(p13;q22): a
paradigm for understanding leukaemogenesis? Br J Haematol 128: 18-34 (2005)
Reuss-Borst MA, Buhring HJ, Schmidt H, Muller CA: Immunophenotypic
heterogeneity and prognostic significance of c-kit expression. Leukemia 8: 258-263
(1994)
Reya T, Morrison SJ, Clarke MF, Weissman IL: Stem cells, cancer, and cancer
stem cells. Nature 414: 105-111 (2001)
Rhoades KL, Hetherington CJ, Harakawa N, Yergeau DA, Zhou L, Liu LQ, Little MT,
Tenen DG, Zhang DE: Analysis of the role of AML1-ETO in leukemogenesis, using
an inducible transgenic mouse model. Blood 96: 2108-2115 (2000)
Ritter M, Kim TD, Lisske P, Thiede C, Schaich M, Neubauer A: Prognostic
significance of N-RAS and K-RAS mutations in 232 patients with acute myeloid
leukemia. Haematologica 89: 1397-1399 (2004)
Rosnet O, Schiff C, Pebusque MJ, Marchetto S, Tonnelle C, Toiron Y, Birg F,
Birnbaum D: Human FLT3/FLK2 gene: cDNA cloning and expression in
hematopoietic cells. Blood 82: 1110-1119 (1993)
Schessl C, Rawat VP, Cusan M, Deshpande A, Kohl TM, Rosten PM, Spiekermann
K, Humphries RK, Schnittger S, Kern W, Hiddemann W, Quintanilla-Martinez L,
Bohlander SK, Feuring-Buske M, Buske C: The AML1-ETO fusion gene and the

References
83
FLT3 length mutation collaborate in inducing acute leukemia in mice. J Clin Invest
15: 2159-2168 (2005)
Schlenk RF, Benner A, Krauter J, Buchner T, Sauerland C, Ehninger G, Schaich M,
Mohr B, Niederwieser D, Krahl R, Pasold R, Döhner K, Ganser A, Döhner H, Heil G:
Individual patient data-based meta-analysis of patients aged 16 to 60 years with
core binding factor acute myeloid leukemia: a survey of the German Acute Myeloid
Leukemia Intergroup. J Clin Oncol 22: 3741-3750 (2004)
Schnittger S, Kohl TM, Haferlach T, Kern W, Hiddemann W, Spiekermann K,
Schoch C: KIT-D816 mutations in AML1-ETO-positive AML are associated with
impaired event-free and overall survival. Blood 107: 1791-1799 (2006)
Schnittger S, Bacher U, Kern W, Haferlach C, Haferlach T: JAK2 seems to be a
typical cooperating mutation in therapy-related t(8;21)/AML1-ETO-positive AML.
Leukemia 21: 183-184 (2007)
Schwieger M, Lohler J, Friel J, Scheller M, Horak I, Stocking C: AML1-ETO inhibits
maturation of multiple lymphohematopoietic lineages and induces myeloblast
transformation in synergy with ICSBP deficiency. J Exp Med. 196: 1227-1240
(2002)
Seeburg PH, ColbyWW, Capon DJ, Goeddel DV, Levinson AD: Biological
properties of human c-Haras1 genes mutated at codon 12. Nature 312: 71-75
(1984)
Sirulnik A, Melnick A, Zelent A, Licht JD: Molecular pathogenesis of acute
promyelocyti leukaemia and APL variants. Best Pract Res Clin Haematol 16:
387-408 (2003)
Small D: FLT3 Mutations: Biology and Treatment. Hematology Am Soc Hematol
Educ Program 178-184 (2006)
Speck NA, Gilliland DG: Core-binding factors in haematopoiesis and leukaemia.
Nat Rev Cancer 2: 502-513 (2002)
Stephenson SA, Slomka S, Douglas EL, Hewett PJ, Hardingham JE: Receptor
protein tyrosine kinase EphB4 is up-regulated in colon cancer. BMC Mol Biol 2: 15

References
84
(2001)
Stirewalt DL, Kopecky KJ, Meshinchi S, Appelbaum FR, Slovak ML, Willman CL,
Radich JP: FLT3, RAS, and TP53 mutations in elderly patients with acute myeloid
leukemia. Blood 97: 3589-3595 (2001)
Sun W, DowningJR: Haploinsufficiency of AML1 results in a decrease in the
number of LTR-HSCs, while simultaneously inducing an increase in more mature
progenitors. Blood 104: 3565-3572 (2004)
Tallman MS, Hakimian D, Shaw JM, Lissner GS, Russell EJ, Variakojis D:
Granulocytic sarcoma is associated with the 8;21 translocation in acute myeloid
leukemia. J Clin Oncol 11: 690-697 (1993)
Tallman MS, lliland DG, Rowe JM: Drug therapy for acute myeloid leukemia. Blood
106: 1154-1163 (2005)
Therneau TM, Grambusch PM: Modeling survival data: extending the Cox model.
Springer, New York, S. 57-58 (2000)
Thiede C, Steudel C, Mohr B, Schaich M, Schakel U, Platzbecker U, Wermke M,
Bornhauser M, Ritter M, Neubauer A, Ehninger G, Illmer T: Analysis of
FLT3-activating mutations in 979 patients with acute myelogenous leukemia:
association with FAB subtypes and identification of subgroup with poor prognosis.
Blood 99: 4326-4335 (2002)
Tobal K, Johnson PR, Saunders MJ, Harrison CJ, Liu Yin JA: Detection of
CBFB/MYH11 transcripts in patients with inversion and other abnormalities of
chromosome 16 at presentation and remission. Br J Haematol 9:104-108 (1995)
Valk PJ, Bowen DT, Frew ME, Goodeve AC, Lowenberg B, Reilly JT: Second hit
mutations in the RTK/RAS signaling pathway in acute myeloid leukemia with
inv(16). Haematologica 89: 106 (2004)
Vandenbark GR, deCastro CM, Taylor H, Dew-Knight S, Kaufman RE: Cloning and
structural analysis of the human c-kit gene. Oncogene 7: 1259-1266 (1992)

References
85
van der Reijden BA, Dauwerse JG, Wessels JW, Beverstock GC, Hagemeijer A,
van Ommen GJ, Breuning MH: A gene for a myosin peptide is disrupted by the
inv(16)(p13q22) in acute nonlymphocytic leukemia M4Eo. Blood 82: 2948-2952
(1993)
van der Reijden BA, Bloomfield CD, Touw IP, Jansen JH: Acute leukemias with
structurally altered core binding factor subunits (t(8;21), inv(16), t(12;21)), 27-28
June 1997, Rotterdam, The Netherlands. Leukemia 11: 2217-2219 (1997)
Wang Q, Stacy T, Miller JD, Lewis AF, Gu TL, Huang X, Bushweller JH, Bories JC,
Alt FW, Ryan G, Liu PP, Wynshaw-Boris A, Binder M, Marin-Padilla M, Sharpe AH,
Speck NA: The CBFbeta subunit is essential for CBFalpha2 (AML1) function in vivo.
Cell 87: 697-708 (1996)
Wang YY, Zhou GB, Yin T, Chen B, Shi JY, Liang WX, Jin XL, You JH, Yang G,
Shen ZX, Chen J, Xiong SM, Chen GQ, Xu F, Liu YW, Chen Z, Chen SJ:
AML1-ETO and C-KIT mutation/overexpression in t(8;21) leukemia:Implication in
stepwise leukemogenesis and response to Gleevec. Proc Natl Acad Sci USA 102:
1104-1109 (2005)
Weisberg E, Boulton C, Kelly LM, Manley P, Fabbro D, Meyer T, Gilliland DG, Griffin
JD: Inhibition of mutant FLT3 receptors in leukemia cells by the small molecule
tyrosine kinase inhibitor PKC412. Cancer Cell 1: 433-443 (2002)
Wiemels JL, Xiao Z, Buffler PA, Maia AT, Ma X, Dicks BM, Smith MT, Zhang L,
Feusner J, Wiencke J, Pritchard-Jones K, Kempski H, Greaves M: In utero origin of
t(8;21) AML1-ETO translocations in childhood acute myeloid leukemia. Blood 99:
3801-3805 (2002)
Weiner HL, Zagzag D: Growth factor receptor tyrosine kinases: cell adhesion
kinase family suggests a novel signaling mechanism in cancer. Cancer Invest 18:
544-554 (2000)
Witthuhn BA, Quelle FW, Silvennoinen O, Yi T, Tang B, Miura O, Ihle JN: JAK2
associates with the erythropoietin receptor and is tyrosine phosphorylated and
activated following stimulation with erythropoietin. Cell 74: 227-236 (1993)
Xiao WZ, Oefner PJ: Denaturing High-Performance Liquid Chromatography. Hum

References
86
Mutat 17: 439-474 (2001)
Yamamoto Y, Kiyoi H, Nakano Y, Suzuki R, Kodera Y, Miyawaki S, Asou N,
Kuriyama K, Yagasaki F, Shimazaki C, Akiyama H, Saito K, Nishimura M, Motoji T,
Shinagawa K, Takeshita A, Saito H, Ueda R, Ohno R, Naoe T: Activating mutation
of D835 within the activation loop of FLT3 in human hematologic malignancies.
Blood 97: 2434-2439 (2001)
Yang Y, Wang W, Cleaves R, Zahurak M, Cheng L, Civin CI, Friedman AD:
Acceleration of G(1) cooperates with core binding factor beta-smooth muscle
myosin heavy chain to induce acute leukemia in mice. Cancer Reaearch 62:
2232-2235 (2002)
Yarden Y, Escobedo JA, Kuang WJ, Yang-Feng TL, Daniel TO, Tremble PM, Chen
EY, Ando ME, Harkins RN, Francke U, Fried VA, Ullrich A, Williams LT: Structure of
the receptor for platelet-derived growth factor helps define a family of closely
related growth factor receptors. Nature 323: 226-232 (1986)
Yarden Y, Kuang WJ, Yang-Feng T, Coussens L, Munemitsu S, Dull TJ, Chen E,
Schlessinger J, Francke U, Ullrich A: Human proto-oncogene c-kit: a new cell
surface receptor tyrosine kinase for an unidentified ligand. EMBO J 6:
3341-3351(1987)

Curriculum vitae
87
7. Curriculum vitae
Personal data
Surname Du Name Juan Sex Female Date of birth October 2nd, 1976 Place of birth Mudanjiang, Heilongjiang Province, China Nationality Chinese Address Department of Internal Medicine III,
University of Ulm Robert-Koch-Str. 8, D-89081 Ulm, Germany E-mail: [email protected]
Professional Education
04/2005 – 9/2007(scheduled) Doctoral Candidate. Department of Internal Medicine III, University of Ulm, Ulm, Germany. M.D. thesis: RAS, KIT, FLT3 and JAK2 Gene Mutations in Acute Myeloid Leukemia (AML) with inv(16) and t(8;21): Incidence and Relevance on Clinical Outcome.
09/2001 – 07/2004 Master’s Degree. Department of
Hematology and Oncology, Internal medicine, Southeast University of Medical College, Nanjing, China. Master thesis: Protein arrays for multidrug-resistance in human leukemia cell determination.
09/1995 – 07/2000 Bachelor’s Degree. Southeast University
of Medical College, Nanjing, China. Studies in the field of clinical medicine.
Professional Appointments
07/2000 – 09/2001 Resident physician, Department of Internal Medicine, Railroad Hospital of Mudanjing, China.

Curriculum vitae
88
Awards
2003 The first prize academic scholarship of Southeast University of Medical College, Nanjing, China.
2002 The first prize academic scholarship of
Southeast University of Medical College, Nanjing, China.
Spoken Languages
Chinese, English
Publications and Presentations Publications
Bullinger L, Rucker FG, Kurz S, Du J, Scholl C, Sander S, Corbacioglu A, Lottaz C, Krauter J, Fröhling S, Ganser A, Schlenk RF, Döhner K, Pollack JR, Döhner H: Gene expression profiling identifies distinct subclasses of core binding factor acute myeloid leukemia. Blood May 7: [Epub ahead of print] (2007)
Döhner K, Du J, Corbacioglu A, Scholl C, Schlenk RF, Döhner H: JAK2V617F mutations as cooperative genetic lesions in t(8;21)-positive acute myeloid leukemia (AML). Haematologica 91(11):1569-1570 (2006) Du J, Chen BA, Zhang CX, Xu XX, Cheng J, Gao F and Lu ZH. Protein Arrays for Multidrug resistance in Human Leukemia Cell Determination. Sensors 5:250-257 (2005) Chen BA, Zhang F, Wang Y, Zheng WL, Du J, Gao C, Ding JH, Sun YY, Cheng J, Wang J, Zhao G, Chen NN, Lu ZH: Quantitative microarray-based DNA methylation analysis of E-cadherin gene promoter in acute leukemia. Zhonghua Zhong Liu Za Zhi 29(1):41-44 (2007) Chinese Chen BA, Du J, Zhang CX, Cheng J, Gao F, Lu ZH. Detection of multidrug resistance proteins with protein array chips. Zhonghua Zhong Liu Za Zhi 27(9): 528-530 (2005) Chinese. Chen BA, Du J, Zhang CX, Cheng J, Gao F, Lu ZH. Using protein chips to study mechanism underlying reversion of drug resistance in leukemia cells in tetrandrime alone or in combination with droloxifen. Zhongguo Shi Yan Xue Ye Xue Za Zhi 13(6):999-1003 (2005) Chinese. Du J, Chen BA. Allogeneic peripheral blood stem cells transplantation of HLA-
Curriculum vitae
89
mismatch. Journal of Medical Postgraduates 17(5):461-464 (2004) Chinese Du J, Chen BA. MDS is research progress in genetic. Foreign Medical Sciences 26(6):488-490 (2003) Chinese.
Presentations
Du J, Schlenk RF, Corbacioglu A, Habdank M, Scholl C, Fröhling S, Bullinger L, Ganser A, Döhner H, and Döhner K: RAS, KIT and FLT3 Gene Mutations in inv(16)/t(16;16)-Positive Acute Myeloid Leukemia (AML): Incidence and Relevance on Clinical Outcome. 48th Annual Meeting of the American Society of Hematology (ASH), December 09-12, 2006, Orlando, FL, USA (Abstract in Blood 108(11):652a 2006) Du J, Schlenk RF, Corbacioglu A, Habdank M, Scholl C, Fröhling S, Bullinger L, Ganser A, Döhner H, and Döhner K: Detection of RAS, KIT and FLT3 Gene Mutations in t(8;21)-Positive Acute Myeloid Leukemia (AML): Evaluation of the Clinical Relevance. 48th Annual Meeting of the American Society of Hematology (ASH), December 09-12, 2006, Orlando, FL, USA (Abstract in Blood 108(11):653a, 2006) Du J, Schlenk RF, Corbacioglu A, Habdank M, Scholl C, Krauter S, Fröhling S, Ganser A, Döhner H, and Döhner K: KIT mutation screening in core binding factor (CBF) acute myeloid leukemia: incidence and clinical relevance: A study of the AML Study Group (AMLSG). Gemeinsame Jahrestagung der Deutschen, Österreichischen und Schweizerischen Gesellschaften für Hämatologie und Onkologie (DGHO), November 04-08, 2006, Leipzig, Germany (Abstract in: Onkologie 29,Suppl. 3: 90, 2006) Schlenk RF, Corbacioglu A, Fröhling S, Du J, Späth D, Schäfer I, Krauter J, Ganser A, Döhner H, and Döhner K for the German-Austrian, AML Study Group (AMLSG). Impact of Different Postremission Strategies in Younger Adults with Acute Myeloid Leukemia and Normal Karyotype Exhibiting a CEBPA Mutation. 47th Annual Meeting of the American Society of Hematology (ASH), December 10-13, 2006, Atlanta, GA, USA (Abstract in Blood 106 (11):2353, 2005)

Acknowledgements
90
8. Acknowledgements
I would like to take this opportunity to offer my honest thanks to a number of
people who contributed to the completion of this work.
First and foremost, I would like to give my overwhelming gratitude to Prof.
Hartmut Döhner for providing me with the opportunity to work with a talented team
of researchers and for his unique perspectives to my research, only such a
professor can give. I extend this gratitude to my supervisor Prof. Konstanze Döhner.
This thesis would not have been possible without her valuable and timely advice,
fair and professional guidance, the kind support, the trenchant critiques, the
probing questions, and the remarkable patience during my graduate career. I can
not thank her enough. I can not overstate the importance of these two people being
involved in my graduate career.
I owe my special thanks to Dr. Andreas Breitbart and Prof. Martin
Griesshammer for their enthusiasm, tremendously help, and lots of support during
my study period in Germany.
I would like to express my heart-felt thanks to Dr. Andrea Corbacioglu, who
was kind enough to give me a great number of practical instructions and lots of
valuable suggestions and support for finalization of my thesis. I am deeply grateful
to Dr. Richard F. Schlenk who not only kindly performed all statistical work of my
thesis results part but also provided valuable discussions about the project. I am
also very thankful to Dr. Lars Bullinger, who provided the positive control
information for my project and helped me with a smile.
I would like to thank the team of the laboratory of the Department of Innere
Medizin III, in particular the team working in molecular genetics of myeloid
leukemia, for providing me valuable scientific assistance and an excellent and very
stimulating working atmosphere. So many thanks go to Dr. Sabine Kayser, Dr.
Verena Gaidzik, Dr. Christian Schön, Dr. Frank Stegelmann, Dr. Frank Rücker,
Doreen Riedel, Kerstin Wittke, and Simone Miller. I would like to specially thank
Marianne Habdank, Stefan Hein, Karina Eiwen, for their expert technical assistance
and great help.

Acknowledgements
91
I would like to thank my former Chinese advisor Prof. Baoan Chen and many
Chinese friends in Germany for their friendship and plenty of help during my stay in
Germany. Thank you very much Dr. Shaoxia Zhou, Dr. Shan Wang, Yan Zhang, Lei
Wang, Jinfei Chen. I, likewise, would like to thank all people whose names have not
been listed here, but who also gave me lots of support and encouragement during
my study period in Germany.
Last, but not least, I wish to express my love and extend my deepest gratitude
to my husband, my parents, family members in China for their unwavering love,
constant support and ongoing encouragement, who have done all they could and
more to get me to this point. They are a great source of strength and without their
support this thesis would never have started much less finished.