Universities of Leeds, Sheffield and York …eprints.whiterose.ac.uk/75954/7/Combine.pdf ·...
35
promoting access to White Rose research papers White Rose Research Online [email protected] Universities of Leeds, Sheffield and York http://eprints.whiterose.ac.uk/ This is the author’s version of an article published in the International Journal of Hydrogen Energy White Rose Research Online URL for this paper: http://eprints.whiterose.ac.uk/id/eprint/75954 Published article: Zin, RM, Lea-Langton, A, Dupont, V and Twigg, MV (2012) High hydrogen yield and purity from palm empty fruit bunch and pine pyrolysis oils. International Journal of Hydrogen Energy, 37 (14). 10627 - 10638. ISSN 0360-3199 http://dx.doi.org/10.1016/j.ijhydene.2012.04.064
Transcript of Universities of Leeds, Sheffield and York …eprints.whiterose.ac.uk/75954/7/Combine.pdf ·...

promoting access to White Rose research papers
White Rose Research [email protected]
Universities of Leeds, Sheffield and Yorkhttp://eprints.whiterose.ac.uk/
This is the author’s version of an article published in the International Journalof Hydrogen Energy
White Rose Research Online URL for this paper:
http://eprints.whiterose.ac.uk/id/eprint/75954
Published article:
Zin, RM, Lea-Langton, A, Dupont, V and Twigg, MV (2012) High hydrogen yieldand purity from palm empty fruit bunch and pine pyrolysis oils. InternationalJournal of Hydrogen Energy, 37 (14). 10627 - 10638. ISSN 0360-3199
http://dx.doi.org/10.1016/j.ijhydene.2012.04.064

1
High hydrogen yield and purity from palm empty fruit bunch and pine
pyrolysis oils
Authors
Rohaya Md Zin1, Amanda Lea-Langton
1, Valerie Dupont
1, Martyn V. Twigg
2
1Energy Research Institute, The University of Leeds, Leeds LS2 9JT, UK
2Johnson Matthey Orchard Laboratory, Orchard Road, Royston, SG8 5HE, UK
Corresponding author:
Valerie Dupont
Energy Research Institute,
Energy Building,
The University of Leeds,
LS2 9JT
United Kingdom
Email [email protected]
Tel: (00 44) 113 3432503 outside UK
0113 3432503 inside UK
Fax: (00 44) 113 246 7310
Paper accepted in International Journal of Hydrogen Energy
Published article reference:
Md Zin, R., Lea-Langton, A., Dupont, V., Twigg, M.V., 2012. High hydrogen
yield and purity from palm empty fruit bunch and pine pyrolysis oils.
International Journal of hydrogen energy 37 (2012) 10627-10638
2
High hydrogen yield and purity from palm empty fruit bunch and pine
pyrolysis oils
Rohaya Md Zin1, Amanda Lea-Langton
1, Valerie Dupont
1*, Martyn V. Twigg
2
1Energy Research Institute, The University of Leeds, Leeds LS2 9JT, UK
2Johnson Matthey Orchard Laboratory, Orchard Road, Royston, SG8 5HE, UK
Abstract
The benefits of CO2 sorption enhanced steam reforming using calcined dolomite were
demonstrated for the production of hydrogen from highly oxygenated pyrolysis oils of the
agricultural waste palm empty fruit bunches (PEFB) and pine wood. At 1 atm in a down-flow
packed bed reactor at 600 °C, the best molar steam to carbon ratios were between 2 and 3
using a Ni catalyst. After incorporating steam-activated calcined dolomite as the CO2 sorbent
in the reactor bed, the H2 yield from the moisture free PEFB oil increased from 9.5 to 10.4
wt% while that of the pine oil increased from 9.9 to 13.9 wt%. The hydrogen purity also rose
from 68 to 96% and from 54 to 87 % for the PEFB and pine oils respectively, demonstrating
very substantial sorption enhancement effects.
Keywords: steam reforming, CO2-sorption enhancement, pyrolysis oil, nickel catalyst,
hydrogen production, dolomite
3
1. Introduction
Fossil fuels contribute to more than 90% of the world hydrogen production. Depletion of
resources and environmental issues related to high CO2 emissions and climate change, as well
as air pollution will make fossil fuels’ availability and consumption less dominant in the
future. The situation has led to significant research on the production of hydrogen from
renewable energy including waste biomass.
Steam reforming of pyrolysis oils has received considerable attention from various
research groups [1, 2], [3-5] and [6-8] for the past years. Results from the studies have
confirmed that pyrolysis oils comprise complex mixtures of oxygenates that can be steam
reformed to produce hydrogen.
Studies on steam reforming of pyrolysis oils and their aqueous fraction have been carried
out using representative compounds such as acetic acid, acetone, ethylene glycol and ethanol.
Acetic acid, one of major constituents of pyrolysis oil that can reach up to 12 wt% of biomass
oils [9], has become the focus of research in steam reforming [10],[11] [12] [13] [1] [14, 15]
[16]. Vagia and Lemonidou [7] reported that the yield of H2 approached 80% of the
maximum when steam reforming acetic acid at 750 °C, producing mainly H2, CO2 and CO,
and small amount of CH4 . Steam reforming of acetic acid at lower temperatures than 750 °C
has been found to lead to carbonaceous deposits on the catalysts bed. Temperatures above
600 °C and molar steam to carbon ratios (S/C) above 3 were reported to be ideal conditions
for complete reforming of model compound mixtures (acetic acid, acetone, ethylene glycol)
[17]. Boudouard and thermal decomposition reactions may contribute to the formation of
carbon deposits. Results from studies on steam reforming using the aqueous phase of
pyrolysis oils (obtained by phase separation after addition of water to the pyrolysis oil)
revealed that the coke deposits on catalysts have a polyaromatic structure, in contrast to those

4
produced by model compounds, which had a graphitic nature [17] . Catalyst deactivation due
to carbon deposition is one of major challenges in the steam reforming of pyrolysis oil, which
has major effects on the process performance by decreasing the desirable products CO2 and
H2 and increasing the undesirable products CO and CH4. Many studies related to steam
reforming of pyrolysis oils and model compounds employ Ni-based catalyst as the reforming
catalyst [2, 3, 18-21].
Results from the catalytic steam reforming and from early cycles of the chemical looping
reforming of pyrolysis oil derived from palm empty fruit bunches (PEFB) and pinewood have
been published by the authors [22]. PEFB is a by-product generated during the fruit stripping
stage at the oil mill processing plant. Malaysia is the world second largest producer of palm
oil [23, 24] and can be considered as the major producer of PEFB based on the assumption
that a kg of palm oil generates a kg of wet PEFB [25]. In the present study, PEFB and pine
wood pyrolysis oils were steam-reformed to produce high purity hydrogen using the process
of sorption-enhancement. A mixture of calcined dolomite and of nickel catalyst was used in
this study.
This study aims to investigate the feasibility of firstly, sorption enhanced steam reforming
PEFB and pine oils, and secondly, quantifying the effects of sorption-enhancement via the
increases in both H2 yield and H2 purity achieved in the presence of a Ca-based sorbent.
Comparisons are drawn with the thermodynamic equilibrium calculations for the sorption
enhancement of the major components measured in the bio-oils.
2. Materials and Methods
2.1. Materials
2.1.1. Characterisation of the oils

5
The pyrolysis oils were purchased from BTG, Netherlands where they were produced using a
non-catalytic fast pyrolysis process. They were filtered to remove fibrous material to prevent
clogging of the fuel delivery lines. Characteristics of these oils are reported elsewhere (Lea-
Langton et al., 2011), including density, pH, gross calorific value (bomb calorimetry), water
content (Karl Fischer titration), C/H/N/O elemental analysis, and inorganics content (K, S,
Ca, Si, Fe, Al, Mg, P, Na, Br) by ICP-MS, volatiles, carbonaceous residue, ash content and
thermal decomposition kinetics were obtained from TGA measurements. To summarise,
both oils were acidic (pH ≤ 3.2), had low gross calorific value (≤15 MJ kg-1
), high
carbonaceous residue (~11wt%) and high ash content (~3 wt%), with significant S, Ca and Si
impurities (~500 ppm). In particular PEFB oil had a high K content (1418 ppm), and pine oil
a significant Fe content (620 ppm). This resulted in the molar formulae of C0.1845
H0.4873O0.3233N0.0049 for the ‘wet’ PEFB oil, and C0.2462H0.5024O0.2502N0.0012 for ‘wet’ pine oil.
Using the measured water contents of 32 and 22 wt% for PEFB and pine oils respectively, a
moisture-free (m.f.) molar formula was then be derived for each oil via elemental balances,
resulting in C0.3178H0.3605O0.3132 N0.0085 for the m.f. PEFB oil, and C0.3372H0.4440O0.2171N0.0017 for
the m.f. pine oil.
The organic compounds in the filtered pyrolysis oils were identified using an Agilent 5975B
inert XLMSD gas chromatography-mass spectrometry (GS-MS) unit equipped with slightly
polar capillary column Restek Rtx 1701 and MS detector. The initial temperature of the oven
was 60 °C and held for 2 minutes before increasing to final temperature of 280 °C at 5
°C/min heating rate. The final temperature was held for 20 minutes. Helium was used as the
carrier gas and solvent delay time was set at 6 minutes. All samples of pyrolysis oils were
prepared by dissolving it in methanol.
It is not possible to ‘dry’ the oils without losing a significant portion of their volatiles content,
therefore the oils can only be used in their ‘wet’ state. However, knowledge of the moisture
6
free molar elemental composition of the oils allows the calculation of maximum H2 yields,
the stoichiometric S/C ratio, maximum water conversions and water flow rate to achieve a
specific S/C ratio in the experiments. E.g, the stoichiometric S/C ratios were, based on
moisture free compositions, 1.01 and 1.36 for the PEFB and pine oils, respectively. Similarly,
the maximum H2 yields were 10.9 wt % and 17.1 wt% of the m.f. PEFB and pine oils
respectively. For the PEFB oil, 36% of this maximum hydrogen yield would originate from
the oil and 64% from the water co-reactant. For pine oil, the maximum hydrogen yield had a
32.5% oil and 67.5% water contributions. In comparison, the maximum H2 yield from SR-
WGS of acetic acid is 13.3 wt%, with a 50/50 % split between fuel and water contributions.
Comparisons of experimental outputs with model compounds in similar steam
reforming conditions can then be performed.
2.1.2. Solids characterisation
The catalyst was originally supplied in pellet form (Johnson Matthey Plc) and consisted
of 18 wt% NiO on a crystalline alpha-alumina support when fully oxidized, as per its MSDS.
Nickel is widely considered as the most suitable metal for steam reforming of hydrocarbons
[26]. The surface area of the catalyst was measured by the BET method with a Quantachrome
Instrument Nova® 2200. The catalyst had relatively low surface area (2.3 m
2 g
-1). Imaging
and analysis of the catalyst’s surface before and after steam reforming were performed by
TEM coupled with EDX. The equipment used was a FEI CM200 field emission gun (FEG)
TEM running at 197 kV equipped with an Oxford Instruments energy dispersive X-ray
(EDX) spectrometer and a Gatan Imaging Filter. The images of the as-received catalyst
revealed a very crystalline Al2O3 support with NiO particle deposits of around 50 nm size.
The catalyst’s composition of 17.9 wt% NiO on -Al2O3 was confirmed using Rietveld

7
refinement [27] of the powder XRD spectra obtained from the as-received catalyst ground to
a fine powder. The XRD apparatus was a X’pert MPD by PANalytical, fitted with a Cu-K
anode, and used in the range of angles from 2θ= 5º to 2θ= 90º at increments of 0.017º, with a
scan step time of 40.7 s. The Highscore Plus software was used for peak fitting and analysis
of the diffractograms in the Rietveld refinement and for the calculation of crystallite sizes
following the Scherrer equation corrected for peak broadening caused by instrumentation and
strain. The crystallites of NiO were measured at 44.7 nm for the as-received catalysts. Crystal
size and phase composition of the catalyst after the steam reforming experiments was also
performed.
The dolomite CO2 sorbent was supplied as granules (3- 4 mm) by WBB minerals
(Warmsworth Quarry, South Yorkshire, England) and contained 21.3 wt.% MgO, 30.7 wt.%
CaO, 0.3 wt.% SiO2, 0.27 wt.% Fe2O3, and 0.1 wt.% Al2O3 and 47.33 wt% CO2.
Dolomite is a natural mineral containing near equimolar amounts of magnesium and calcium
carbonate. After calcination, only the calcium oxide component is able to re-carbonate while
MgO remains chemically inert [28, 29]. Other compounds are finely dispersed in small
crystallites on dolomite [30]. Earlier studies [31] showed that using a mixture of reforming
catalyst and CaO (derived from calcinations of high-purity CaCO3) in a single reactor, high
H2 concentration of >95% could be achieved. CaO-based sorbents combine well with bio-oil
steam reforming because of their high capacity and fast kinetics at the temperatures of
maximum hydrogen yield (500-700°C), when temperatures in excess of 600°C have been
shown necessary to ensure significant bio-oils conversion in practice [17]. The inexpensive
dolomite was chosen over limestone in many studies on the basis that it gives better
multicycle performance [32-35]. The methane SESR experiment by Lopez-Ortiz and
Harrison [36] exhibited only moderate activity loss after twenty cycles of carbonation-
calcination of a pre-treated dolomite with a commercial Ni-based catalyst. These studies have

8
focused on methane fuel for this process, but other feedstock that have successfully been
tested for the sorption-enhanced steam reforming process are crude glycerol and
vegetable waste cooking oil. Hydrogen purities above 90% with low concentration of CO2
have been obtained during sorbent pre-saturation conditions when steam reforming crude
glycerol and waste cooking oil in the presence of calcined dolomite [37-39]. The authors
have studied the cyclic carbonations and thermal decompositions of dolomite at the micro-
reactor and bench reactor scales [40]. The effects of partial pressure of CO2 and of H2O on
the kinetics of the global reactions were investigated, revealing significant increases in
carbonation capacity in the presence of relatively small partial pressures of H2O.
2.2. Reactor setup
The schematic diagram of the steam reforming equipment setup is presented in Fig. 1. The
reactor incorporated a down-flow quartz reactor of 12 mm ID and 70 cm long. The reactor
was held inside a tube furnace. MKS mass flow controllers were used to control the gas flow
rates (N2, H2 and air). Two programmable syringe pumps by New Era Pump Systems
provided separate PEFB oil and water liquid flows. The reactor’s off-gas was cooled via two
condenser units and the moisture was removed by a silica gel trap prior to entering the gas
analyzers. ABB analysers were used to record online hydrogen, methane and carbon oxide
products respectively at 5 s intervals. H2 was measured by a thermal conductivity detector
(Caldos 15) and CO, CO2 and CH4 via non-dispersive infra-red absorption-based instruments
(Uras 14).
2.3. Experimental procedures for steam reforming

9
The catalyst and dolomite were crushed separately and sieved to 0.85 – 2 mm size particles.
The size of the dolomite particles was the same as the catalysts particles so as to avoid
altering the flow patterns in the reactor bed when comparing conditions with and without
sorbent. The size for the catalyst was optimally chosen to prevent large pressure drop (too
small particles) and diffusion limitations caused by too large particles. Nevertheless mass
transfer effects are expected in the current system as they would be in a scaled up version.
The same amount (6.0 g) of catalyst was used for all experimental runs, mixed with steam-
activated calcined dolomite (6.0 g) for the sorption enhanced experiments. For the steam
activation procedure, ground dolomite was loaded on its own into the reactor. Water was fed
into the reactor with a heating rate and set temperature of 850 °C (1.583 cm3 min
-1) together
with N2 (200 cm3 min
-1, STP). Initially the release of CO2 increased with temperature until it
reached a maximum, at a furnace temperature of 800 °C, then it slowly decreased to zero,
indicating the end of the decarbonation (calcination) reaction. The furnace was then switched
off and allowed to cool overnight. After discharging the activated dolomite, the reactor was
re-loaded with a mixture of catalyst and steam activated calcined dolomite.
The steam reforming experiments were carried out at atmospheric pressure and 600 °C with
varying molar S/C ratios without sorbent, and after identification of the optimal S/C ratio, the
experiments were repeated with sorbent. The experiments began with reduction of the
catalyst to convert all the NiO to the active phase of Ni. This step used nitrogen and hydrogen
flow rates of 200 and 10 cm3 min
-1 (STP), respectively. The H2 flow was stopped keeping just
the N2 and injection of the ‘wet’ pyrolysis oil and water began using the two programmable
syringe pumps. Experiments were ended by switching off first the fuel and then water flows,
leaving the N2 gas flow on, still at 600 °C, and when the reformate gases concentrations had
subsided, N2 flow was also turned off. Finally the catalyst was reoxidised, also burning-off

10
any carbon that may have been formed on the catalyst, in a flow of air (500 cm3 min
-1, STP)
at a set temperature of 600 °C for the experiments without sorbent, and 970 cm3 min
-1 (STP)
at 850 °C for those with sorbent (the higher temperature was used to calcine the sorbent). The
release of CO and CO2 was monitored by the on-line analyser to complete the carbon and
oxygen balances. Typically during air feeds with and without sorbent, the recorded
temperature increased by 10-15 °C caused by the oxidation reactions of the carbon residue
and the reoxidation of the nickel catalyst. The flow of 200 N2 cm3 min
-1 (STP) was
maintained throughout the steam reforming stage to enable calculation through material
balances of the fuel and steam conversions, H2 yield and selectivity to H-containing and C-
containing products as outlined below using Eqs 1-4. The analysers measured the exit dry gas
concentrations and mol (vol) fractions ‘yi’ of CH4, CO, CO2, O2 and H2 were calculated. The
mol fraction of nitrogen, 2Ny was calculated by balance to 1. The total dry molar flow rate
leaving the reactor dryoutn , was determined via a nitrogen balance.
The ideal process outputs from sorption enhanced steam reforming provide a basis for
comparison of the real process. The steam reforming reactions of an organic fuel followed by
water gas shift (‘SR’ and ‘WGS’) and the principle behind sorption enhancement with a Ca-
based CO2 sorbent via its carbonation (‘CB’) are given in the following equations:
CnHmOk + (n-k)H2O nCO + (n+0.5m-k)H2 SR
CO + H2O CO2 + H2 WGS
CaO(S) + CO2 CaCO3(S) CB
The carbonation reaction removes CO2 from the reformate gases and thus promotes a
favourable shift in the WGS equilibrium, which has the triple effect of increasing the H2
concentration (effectively resulting in higher H2 purity), increasing the H2 production yield,
and decreasing the temperature of maximum H2 yield. According to the stoichiometry of the

11
complete SR and WGS reactions, this maximum is (2n+0.5m-k) mol of H2 per mol of
CnHmOk fuel, or, when reported in wt% of the fuel, 100×2.02×(2n+0.5m-
k)/(12.01n+1.01m+16k). This is superior to the maximum that would be reached under the
thermodynamic equilibrium limited reactions without sorption enhancement, as the reverse
WGS reaction prevents complete CO conversion to CO2. However, regeneration of the Ca-
based CO2 sorbent by temperature swing represents an energy penalty of the sorption
enhanced steam reforming process, but costs can be minimised by process intensification
measures such as chemical looping reforming, as explored in detail with waste cooking oil as
feedstock [38].
A carbon balance yields the oil conversion fraction Xoil to the main C-containing products
(CH4, CO, CO2) according to (1).
inoil
COCOCHdryout
oilnn
yyynX
,
, 24
(1)
Where n was the moles of atomic C in the moisture free (m.f.) oil elemental molar formula. A
hydrogen balance yielded an estimate of the fractional steam conversion, equation (2), in
which
oilinoilHCHdryout
inOH
OH Xnmyynn
X ,,
,
5.021
24
2
2
(2)
m was the moles of atomic H in the m.f. oil. The H2 purity ‘H2 pur’ and the hydrogen yield
‘H2 yield’ were defined as in equation (3) and (4) respectively:
422
21002
CHCOCOH
H
yyyy
ypurH
(3)
(m.f.) oil of wt%100 yield ,
,
222
inoiloil
dryoutHH
nW
nyWH
(4)
Where W is the relevant molar mass concerned.

12
The H2 yield efficiency or ‘H2 eff’ is the ratio (in %) of H2 yield during the experiments to
the theoretical stoichiometric maximum H2 yield (Eq. 5).
The selectivity to the C-containing products (‘Sel’) was defined according to Eqs. 6-8:
)8(100
);7(100
);6(100
42
4
42
42
2
4
2
CHCOCO
CH
CHCOCO
CO
CHCOCO
CO
yyy
ySelCH
yyy
ySelCO
yyy
ySelCO
To provide a measure of the combined steam reforming and water gas shift efficiency, the
output parameters for a given experiment are compared with their ideal theoretical
counterparts notwithstanding equilibrium limitations (see end section 2.1.1).
Moreover, when comparing the process outputs with and without CaO sorbent in the reactant
mixture, the enhancement ‘Enh’ (in %) is calculated, defined by equation (9).
(S)
(S)(S)
CaOhout Output wit
CaOhout Output witCaOh Output wit100
Enh (9)
Equation (9) was used for comparisons of H2 yield and purity in the results section.
2.4. Thermodynamic equilibrium calculations
Although the exact composition of the PEFB oil is unknown, the process of choosing the
conditions for the steam reforming experiments was assisted by knowledge of the
thermodynamic equilibrium for the reaction of its main components. Thermodynamic
calculations for the steam reforming of acetic acid, levoglucosan, phenol, guaiacol, 2(5H)
furanone, syringol, methyl guaiacol, eugenol, palmitic acid and methyl palmitate, which
were identified as significant components of the bio-oils, were performed with and without
the CO2 sorbent CaO(S) in the reactant mixture. Thermodynamic properties have only recently

13
made available for such calculations, and those employed in here were compiled by
Guenadou et al [41]. For calculations in the presence of CaO, two cases were considered, one
where both the products of CaO hydration (Ca(OH)2(S)), and of CaO carbonation (CaCO3(S))
were included, and the other where CaCO3(S) was the only Ca-product allowed. This was to
help discuss the profiles of the H2 yield with temperature and molar steam to carbon ratio.
The FORTRAN programme EQUIL [42] was used. It relies on a minimization of Gibbs free
energy solution method. So as not to restrict the potential carbon products, 32 species in total
were considered in the calculations such as stable C2- and C3- hydrocarbons and free
radicals, but not solid carbon, whose thermodynamic properties when produced on catalysts
are variable. The temperature range of 20-1000 °C was chosen to show the gradual effects of
temperature on the different mechanisms contributing to hydrogen production. The
calculations showed that the H-containing products reaching significant quantities (mol
fractions exceeding 10-6
) were H2, CH4, and Ca(OH)2(S), and the main C-containing products
were CH4, CO2, CO, CaCO3(S).
3. Results and discussion
3.1 Measured main compounds in the bio-oils
Tables 1 and 2 list the most significant organic compounds in the two bio-oils, identified by
GC-MS using the NIST search library, alongside the percent surface area of their respective
peaks. The compounds in Table 1 (PEFB) account for 75% of the total area of peaks
recorded, and those in Table 2 (pine), 65%. Significant peaks of acetic acid were found both
in the PEFB and pine oils at 32.06% and 15.17% respectively. Levoglucosan, the highest
compound measured in pine oil at 28.11% was also detected in PEFB oil but at very low area
percentage of 2.20%. Phenol, the second major compound detected for PEFB at 21.23% was
not significant in pine oil (0.33%). Among other compounds measured in both oils were

14
syringol, guaiacol, 2(5H)-furanone, eugenol and methyl guaiacol, which are aromatic
compounds. Small amounts of palmitic acid and methyl palmitate were also present.
3.2. Thermodynamic equilibrium of steam reforming of individual bio-oil compounds with
and without CO2 capture by CaO
3.2.1 Effects of temperature and S/C on acetic acid with and without CaO
The effects of steam to carbon ratio and temperature were investigated on the equilibrium H2
yield from the steam reforming and the sorption enhanced steam reforming of the compound
present in largest amounts and common to both the PEFB and pine bio oils, namely acetic
acid. When ignoring thermodynamic equilibrium limitations, the reaction of steam reforming
of acetic acid (below) can yield a maximum of or 13.3 wt% according to reaction ‘SR-
WGSac’
CH3COOH + 2H2O → 2CO2 + 4H2 (SR-WGSac)
The H2 yield versus temperature profiles are shown in Fig. 2 for increasing S/C ratios from 0
to 4. These profiles were calculated with the three Ca-species (CaO(S) reactant, Ca(OH)2(S)
and CaCO3(S) products), simulating sorption enhanced steam reforming, and without any of
the Ca-species, simulating conventional steam reforming. Additional profiles of H2 yield
obtained with CaO reactant and only CaCO3 as the product are shown for just the S/C of 0.5
and 4 for the purpose of discussing the effects of hydration of CaO(S) during the sorption
enhanced process. For conventional steam reforming, a similar pattern of curves was
observed at S/C ratios above 0.5, in which the H2 yield increased steeply between 200 and
580 °C (portion ‘A’), peaked following a gradient that increased with increasing S/C (portion
‘B’), and finally decayed with a shallow gradient rather independent on the S/C (portion ‘C’).
In the lowest temperature range (lower ‘A’), the equilibrium product distribution (not shown)
indicated a 50/50% split between CH4 and CO2 in the C- products, with CH4 as the only H-

15
containing product, thus no net H2 production was expected, independently of S/C. This can
be seen as, in sequence, steam reforming of acetic acid into CO and 2H2, water gas shift, and
methanation of CO (reverse steam methane reforming). With increasing temperature (mid
‘A’), the equilibrium H2 yield increased by the shift of methanation to steam methane
reforming, but this was mitigated by the reverse water gas shift which also increased resulting
in CH4 still present as co-product. With further increases in temperature from ca. 600 to 700
°C (upper ‘A’), steam methane reforming took over significantly over methanation,
dominating the H2 production against the reverse water gas shift reaction, and as a result the
H2 yield underwent a sharp increase. Above 700 °C, the reverse water gas shift was
responsible for the slow, steady decay in H2 yield (‘B’ and ‘C’). The asymmetry between
steep positive at low temperature and shallow negative gradients of H2 yield at high
temperature was caused by the stronger endothermicity of the steam reforming reactions (of
acetic acid and methane) compared to the weak exothermicity of the water gas shift, and is
common to steam reforming of hydrocarbons. According to Le Chatelier’s principle,
increasing the steam to carbon ratio results in a higher H2 yield. The shift of the peak H2 yield
towards lower temperatures with S/C is a result of the stronger effect of S/C on the steam
reforming reactions than on the water gas shift for temperatures below 600 °C, reflecting
their different reaction enthalpies. At the stoichiometric S/C of 1, the equilibrium H2 yield for
steam reforming of acetic acid peaked at 707 °C with 68% H2 eff (Eq.5), corresponding to
58% H2 pur (Eq.3), whereas at the higher S/C of 4 the peak H2 yield occurred at a lower 607
°C, with 89% H2 eff and 64% H2 pur. This illustrated the benefits of operating at higher S/C
which result in higher H2 yield and purity as well as lower temperature requirement. In
practice, higher S/C represent higher costs of raising steam, with larger volumes of recycled
water through the SR plant.
16
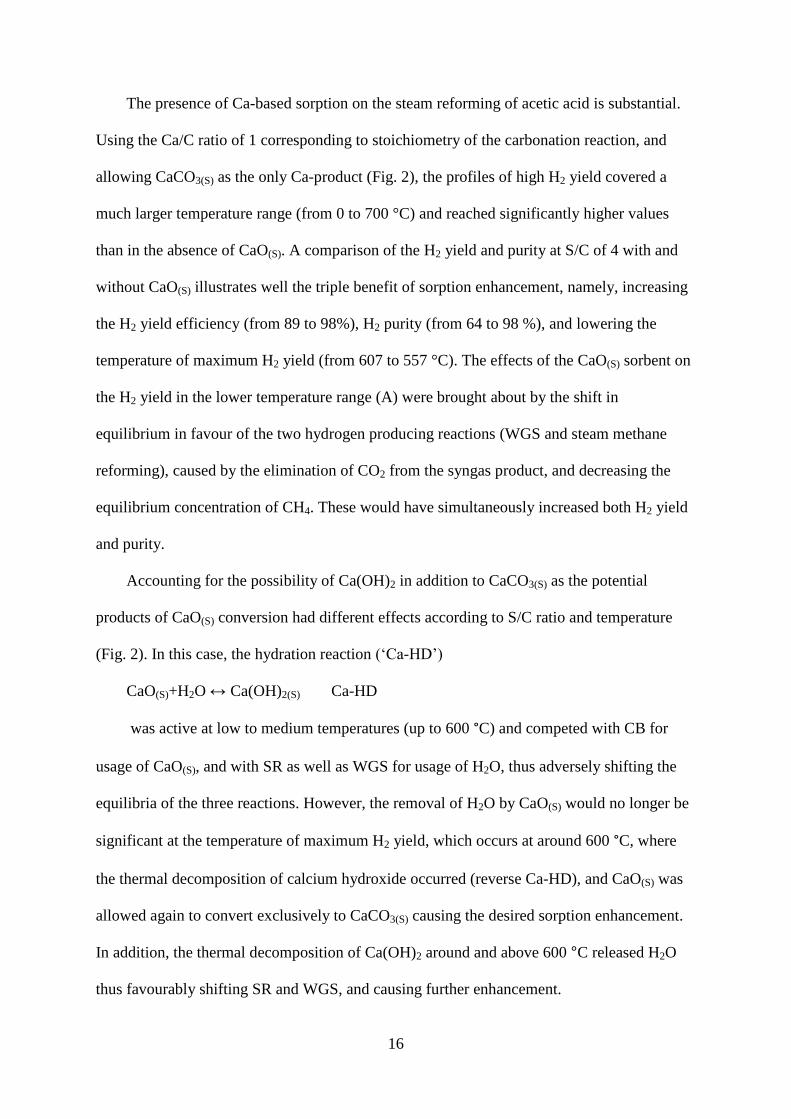
The presence of Ca-based sorption on the steam reforming of acetic acid is substantial.
Using the Ca/C ratio of 1 corresponding to stoichiometry of the carbonation reaction, and
allowing CaCO3(S) as the only Ca-product (Fig. 2), the profiles of high H2 yield covered a
much larger temperature range (from 0 to 700 °C) and reached significantly higher values
than in the absence of CaO(S). A comparison of the H2 yield and purity at S/C of 4 with and
without CaO(S) illustrates well the triple benefit of sorption enhancement, namely, increasing
the H2 yield efficiency (from 89 to 98%), H2 purity (from 64 to 98 %), and lowering the
temperature of maximum H2 yield (from 607 to 557 °C). The effects of the CaO(S) sorbent on
the H2 yield in the lower temperature range (A) were brought about by the shift in
equilibrium in favour of the two hydrogen producing reactions (WGS and steam methane
reforming), caused by the elimination of CO2 from the syngas product, and decreasing the
equilibrium concentration of CH4. These would have simultaneously increased both H2 yield
and purity.
Accounting for the possibility of Ca(OH)2 in addition to CaCO3(S) as the potential
products of CaO(S) conversion had different effects according to S/C ratio and temperature
(Fig. 2). In this case, the hydration reaction (‘Ca-HD’)
CaO(S)+H2O ↔ Ca(OH)2(S) Ca-HD
was active at low to medium temperatures (up to 600 °C) and competed with CB for
usage of CaO(S), and with SR as well as WGS for usage of H2O, thus adversely shifting the
equilibria of the three reactions. However, the removal of H2O by CaO(S) would no longer be
significant at the temperature of maximum H2 yield, which occurs at around 600 °C, where
the thermal decomposition of calcium hydroxide occurred (reverse Ca-HD), and CaO(S) was
allowed again to convert exclusively to CaCO3(S) causing the desired sorption enhancement.
In addition, the thermal decomposition of Ca(OH)2 around and above 600 °C released H2O
thus favourably shifting SR and WGS, and causing further enhancement.
17
3.2.1. Effect of temperature for the other bio-oil compounds at S/C of 3.
Equilibrium H2 yields were calculated at S/C of 3 with and without CaO(S) in the reactant
mixture for most of the bio-oil compounds identified by GC-MS and listed in Tables 1 and 2
for the two oils (Fig. 3). A Ca/C ratio of 1 was used for the CaO(S) in the reactant mixtures,
and both products Ca(OH)2(S) and CaCO3(S) were allowed in the equilibrium products. Similar
profiles were obtained for these compounds than for acetic acid, reflecting the same chemical
mechanism at work. All compounds exhibited significant sorption enhancement predicted by
extending the region of high H2 yield by ca. 200 °C towards lower temperatures, compared to
conventional steam reforming. In all the cases, the temperature of maximum yield was shifted
by more than 100 °C, and by yield enhancements (Enh, Eq.9) of between 14.7%
(levoglucosan) and 16.5 % (2(5H) furanone) for the compounds of carbon atom of 10 and
below. The lowest yield enhancement (12.7%) was calculated for palmitic acid and methyl
palmitate.
3.3. Experiments of steam reforming without CO2 sorbent: effect of steam to carbon ratio on
reactants conversions, H2 yield and selectivity to carbon products
The main process outputs for the steam reforming of both oils are presented in Table 3
for increasing S/C ratio at 600 °C. There are two S/C entries per row, one on the basis of the
filtered oil with its natural water content (‘wet S/C’), and the other on the basis of the
moisture free (m.f.) oil. No addition of water during the experiments resulted in S/C of 0.76
for m.f. PEFB oil, and 0.37 for m.f. pine oil.
Under these conditions of no steam addition, the PEFB oil and the pine oil conversion to
CO, CO2 and CH4 were only 67% and 69 % respectively, and the calculated water
conversions were ‘107%’ and ‘157%’. Equation 2 shows how underestimating the fuel

18
conversion would have resulted in erroneously high steam conversion. It is expected that for
the experiments without steam addition some volatiles would have escaped analysis,
however, the H2 yield calculation, which is based on non- volatiles measurements, would
have been reliable. Without steam addition, the H2 yield was 8.06 wt% of the m.f. PEFB oil
(74% H2 eff), and 7.6 wt% of the m.f. pine oil (45 % H2 eff). The lower yield obtained for
pine oil was caused by a high selectivity to CO (61%) and to CH4 (10%) in addition to
incomplete oil conversion. Generally, high selectivity to CO reflects poor efficiency of the
water gas shift reaction (either from lack of steam, insufficient catalyst activity, or
insufficient reaction time), or equilibrium conditions favouring the reverse water gas shift
(high temperature). High selectivity to CH4 reflects poor catalyst activity for steam methane
reforming, or equilibrium conditions favouring its reverse (methanation of CO). In the pine
oil experiment without steam, fuel conversion was significantly less than 100% at 600 °C,
neither reverse water gas shift nor methanation would be expected to be dominant, thus the
low H2 yield was due to poor efficiency in both water gas shift and steam methane reforming.
For pine oil, the stoichiometric m.f. S/C was 1.36, therefore the first two conditions
(S/C=0.37 and 1.01) lacked sufficient water, hence poor efficiency of SR and WGS,
explaining the high selectivity to CO.
As expected, the H2 yield increased with S/C. The condition ‘wet’ S/C of 1.89 (2.65 m.f.
PEFB, 2.26 m.f. pine) corresponded to the highest oil fractional conversions to the carbon
products CO, CO2 and CH4 (0.89 and 0.97, respectively). The H2 purity and H2 yield with
time on stream are plotted for these optimum conditions in Figs. 4a-b and 5a-b for the PEFB
oil and the pine oil respectively. In the case of PEFB oil, selectivity to CH4 was low for the
whole S/C range tested, with values below 5%, which in addition to good oil and water
conversions, contributed to H2 eff between 81 and 90% (Table 3). It is worth noting due to
thermodynamic equilibrium limitations of the experiments without sorbent, as illustrated by

19
the calculations for acetic acid, 100% yield would be impossible. With increasing S/C, pine
oil continued exhibiting high selectivity to CH4 whereas selectivity to CO remained constant
once the stoichiometric S/C of 1.36 had been exceeded (Table 3). Consequently, the ‘wet’
S/C of 2 was chosen to test the sorption enhancement effect by in-situ CO2 capture using a
CaO-based CO2 sorbent in the steam reforming of both oils.
3.4. Carbon balance and catalyst characterization following steam reforming without
sorption enhancement
Carbon balances for each experiment of steam reforming of PEFB and pine oils are listed in
Table 4. This includes the amounts of carbon input as fuel to the reactor during fuel feeds, the
carbon converted during fuel feed. The difference between these two amounts yielded carbon
assumed deposited on the catalyst. This was followed by the carbon subsequently burnt off
during the nitrogen and air feeds. The carbon balance (assumed deposited minus burnt-off) is
indicated in the last column as a percent of the total carbon feed. As an average over the
experiments with the two oils -to the exception of those without added steam, the carbon
balances averaged 4.4% with a standard deviation of 5%. This may have been caused by
either error propagations in the carbon balance calculations, or by a real effect of carbon
residue on the catalyst.
The catalyst samples used in the PEFB and pine oil experiments were characterized by BET,
XRD, SEM and TEM-EDX after the steam reforming experiments without sorbent. The
TEM-EDX of catalysts after reforming both oils exhibited negligible amounts of carbon but
significant amounts of Ni and O. For the PEFB oil, the EDX of the used catalyst also
revealed very small amounts of calcium and silicon which would have originated from the
oil’s small impurities (0.05 wt% and 0.052 wt% respectively), as measured by ICP-MS. The

20
particles observed on the TEM images were approximately 50 nm in size. The XRD of the
catalysts identified Al2O3, and NiO as the only phases present, with the Rietveld refinement
yielding the composition 83.7% Al2O3, 16.3% NiO and 0% Ni for the catalyst used with
PEFB oil, and 83.4 %,15.5% NiO and 1.1% Ni for the catalyst used with pine oil. For the
used catalyst with PEFB oil, this represented just a slight deviation from the expected
nominal 18 wt% NiO/Al2O3 composition of the as-received catalyst, and probably results
from experimental uncertainties. For the used catalyst with pine oil, the measured 1.1% Ni
indicates the oxidation at the end of the air feed was nearly complete. The XRD spectrum and
its calculated profile with Rietveld refinement are shown in Fig. 6 for the pine oil experiment.
In this figure, the residual curve defined by the difference between observed and calculated
spectra can be seen to be close to zero. Both phase composition and crystallite sizes can be
derived from these data. The Scherrer equation algorithm (corrected for peak broadening
caused by instrumentation and strain), yielded a NiO crystallite size of 50.7 nm for the
catalyst used with PEFB oil, and 45.5 nm for the catalyst used with pine oil, which are both
close to that measured from XRD of the as-received catalyst (44.7 nm, Table 5). Two BET
surface area analyses were carried out on the catalyst after steam reforming without sorbent,
and surface areas of 2.2 and 2.8 m2 g
-1 were obtained for the catalyst used with PEFB oil, and
of 3.2 and 2.6 m2 g
-1 for the catalyst used with pine oil. This was not significantly different
from the as-received catalyst (3.2 and 2.6 m2 g
-1). Based on the relatively unchanged
crystallite sizes and surface areas between the as-received and used catalyst, it could be
concluded the catalyst had not undergone significant sintering, while the EDX and carbon
balance indicated no obvious signs of deactivation by carbon deposition following air feed as
a regeneration step. The solids characterization values are summarised in Table 5.
3.5. Steam reforming with Ca-based CO2 sorbent at 600 °C and ‘wet’ S/C of 2

21
The average mol fractions from steam reforming experiments with steam activated calcined
dolomite are presented in Table 6 on a dry mol basis for the wet S/C of 2 for both oils. The
hydrogen purity and yield with time on stream are shown in Figs 4a-b and Fig. 5a-b alongside
those obtained without sorbent. The experiments with the sorbent resulted in a higher H2
yield (pre-sorbent saturation) than the experiments without sorbent. Pre-saturation conditions
were measured for nearly 1 h operation. In pre-saturation conditions for both oils, the
concentration of CO2 in the gas products was small (below 1%), indicating the calcined
dolomite was efficiently capturing CO2 via the carbonation reaction. The concentrations of
undesirable products such as CH4 and CO were negligible during sorption: below 0.55 mol %
for CH4 and CO respectively. The lack of CO2 and also lower CO and CH4 in the products
resulted in high purity of H2, and demonstrated that the reaction equilibrium of WGS had
shifted forward producing more hydrogen. Even though neither fuel nor steam conversions
could be derived during sorption from elemental balances using the dry gas composition due
to the unknown exact rate of CO2 captured as carbonate, the closeness of the H2 yield to its
theoretical value strongly suggested that both had been very near their maxima.
Quantification of the sorption enhancement effects on the H2 yield and purity, shown in Table
6, indicated 9% and 41% enhancements in H2 yield, and 67 % and 60% enhancements in H2
purity for the PEFB and pine oils, respectively, compared to the values obtained without
sorbent. Figures 4 and 5 show the enhancement effects were constant and sustained for at
least 3500 s. For the calcined dolomite to be fully saturated, approximately 206 min with
complete conversion of the oil to CO2 and complete CO2 capture would have been required.
But the H2 yields were seen to decrease beyond one hour operation, corresponding to ca. 30%
sorbent use, despite maintaining a product of nearly pure hydrogen. This would have been
caused by a gradual erosion of the steam reforming efficiency by carbon deposition while
carbonation remained effective. A burn-off step under air feed achieved complete removal of
22
the carbon and regeneration of the sorbent by calcination, as shown by the absence of C, and
the presence of the Ni, Al and O of the catalyst, with the Mg, Ca and O of the calcined
dolomite in the relevant EDX spectrum (bottom right of Fig. 7). Whereas process efficiency
under many cycles of sorbent carbonation and calcination remains to be investigated, the
present study has demonstrated the beneficial effects of sorption enhancement on the steam
reforming of PEFB and pine oils.
4. Conclusion
The effects of sorption enhancement, namely, substantial increases in both hydrogen yield
and hydrogen purity of syngas, as well as a significant drop in the temperature of maximum
H2 yield, were demonstrated for the bio-oil model compound acetic acid and the CaO(S)
sorbent using equilibrium calculations. The role played by the intermediate product calcium
hydroxide (Ca(OH)2(S)) was analysed in the equilibrium system. It showed the importance of
operating at around 600 °C to prevent Ca(OH)2 formation from decreasing the availability of
CaO(S) for carbonation and of H2O for steam reforming and water gas shift. Near full
sorption-enhancement effects during steam reforming experiments were observed at 600 °C
with PEFB oil, and significant enhancement was found for pine oil. This was achieved in the
presence of steam-activated calcined natural dolomite and a Ni-based catalyst at the ‘wet’
molar steam to carbon ratio of 2 at atmospheric pressure. For PEFB oil, H2 of purity above 96
vol% and H2 yield approaching 10.4 wt% of the fuel, i.e. 95% of the maximum, were
maintained for 42 min with the dolomite sorbent, compared to a H2 purity of 67 vol% and
yield of 9.51 wt% without sorbent. This represented enhancement effects of 67% and 9% in
purity and yield, respectively. For pine oil, the H2 purity and H2 yield reached 87% and 13.9
wt% for 58 min respectively, representing 60% and 41% enhancement effects.

23
Acknowledgments
Our thanks to RCUK for grants EP/D078199/1 and EP/G01244X/1, Johnson Matthey for
donation of catalyst materials, WBB Minerals for the dolomite from Warmsworth quarry and
SIRIM Berhad/MOSTI, Malaysia for the scholarship for PhD student Mrs Rohaya Md Zin.
We would like to also thank Dr Nicole Hondow for help with the electron microscopy work,
and Professor Jenny M. Jones with Dr Andy B. Ross for use of their GC-MS and Karl Fischer
titrator.
Nomenclature
Ca-HD Calcium oxide hydration reaction
CB Carbonation of CaO reaction
Enh Enhancement, % (Eq.9)
H2 Yield Hydrogen yield (mol H2/mol H2 from fuel) or wt% of fuel (Eq.4)
H2 eff Hydrogen yield efficiency (ratio experimental yield to theoretical maximum,
Eq. 5)
H2 pur Hydrogen purity according to Eq. 3
m.f. moisture free
PEFB Palm empty fruit bunches
S/C Molar steam to carbon ratio
Sel Selectivity to relevant product.
SR Steam reforming
WGS Water gas shift
24
Xoil Conversion fraction of pyrolysis oil (Eq. 1)
XH2O Conversion fraction of water for experiments (Eq. 2)
References
1. Wang D, Montane D, and Chornet E. Catalytic steam reforming of biomass-derived
oxygenates: Acetic acid and hydroxyacetaldehyde. Applied Catalysis A-General
1996; 143(2): 245-70.
2. Wang DN, Czernik S, and Chornet E. Production of hydrogen from biomass by
catalytic steam reforming of fast pyrolysis oils. Energy & Fuels 1998; 12(1): 19-24.
3. Garcia L, French R, Czernik S, and Chornet E. Catalytic steam reforming of bio-oils
for the production of hydrogen: effects of catalyst composition. Applied Catalysis A-
General 2000; 201(2): 225-39.
4. Medrano JA, Oliva M, Ruiz J, Garcia L, and Arauzo J. Hydrogen from aqueous
fraction of biomass pyrolysis liquids by catalytic steam reforming in fluidized bed.
Energy 2011; 36(4): 2215-24.
5. Medrano JA, Oliva M, Ruiz J, Garcia L, and Afauzo J. Catalytic steam reforming of
model compounds of biomass pyrolysis liquids in fluidized bed reactor with modified
Ni/Al catalysts. Journal of Analytical and Applied Pyrolysis 2009; 85(1-2): 214-25.
6. Kechagiopouos PN, Voutetakis SS, Lemonidou AA, and Vasalos IA. Hydrogen
Production via Reforming of the Aqueous Phase of Bio-Oil over Ni/Olivine Catalysts
in a Spouted Bed Reactor. Industrial & Engineering Chemistry Research 2009; 48(3):
1400-8.
7. Vagia EC and Lemonidou AA. Hydrogen production via steam reforming of bio-oil
components over calcium aluminate supported nickel and noble metal catalysts.
Applied Catalysis a-General 2008; 351(1): 111-21.
8. Kechagiopoulos PN, Voutetakis SS, Lemonidou AA, and Vasalos IA. Sustainable
hydrogen production via reforming of ethylene glycol using a novel spouted bed
reactor. Catalysis Today 2007; 127(1-4): 246-55.
9. Dielbold JP, A Review of the Chemical and Physical Mechanisms of the Storage
Stability of Fast Pyrolysis Bio-Oils. 2000, Thermalchemie, Inc, National Renewable
Energy Laboratory (NREL): Colorado.
10. Basagiannis AC and Verykios XE. Influence of the carrier on steam reforming of
acetic acid over Ru-based catalysts. Applied Catalysis B-Environmental 2008; 82(1-
2): 77-88.
11. Basagiannis AC and Verykios XE. Catalytic steam reforming of acetic acid for
hydrogen production. International Journal of Hydrogen Energy 2007; 32(15): 3343-
55.
12. Basagiannis AC and Verykios XE. Reforming reactions of acetic acid on nickel
catalysts over a wide temperature range. Applied Catalysis A-General 2006; 308: 182-
93.
13. Bimbela F, Oliva M, Ruiz J, Garcia L, and Arauzo J. Hydrogen production by
catalytic steam reforming of acetic acid, a model compound of biomass pyrolysis
liquids. Journal of Analytical and Applied Pyrolysis 2007; 79(1-2): 112-20.
14. Takanabe K, Aika K, Seshan K, and Lefferts L. Sustainable hydrogen from bio-oil -
Steam reforming of acetic acid as a model oxygenate. Journal of Catalysis 2004;
227(1): 101-8.

25
15. Takanabe K, Aika K, Seshan K, and Lefferts L. Catalyst deactivation during steam
reforming of acetic acid over Pt/ZrO2. Chemical Engineering Journal 2006; 120(1-2):
133-7.
16. Wu C, Sui M, and Yan YJ. A Comparison of Steam Reforming of Two Model Bio-
Oil Fractions. Chemical Engineering & Technology 2008; 31(12): 1748-53.
17. Kechagiopoulos PN, Voutetakis SS, Lemonidou AA, and Vasalos IA. Hydrogen
production via steam reforming of the aqueous phase of bio-oil in a fixed bed reactor.
Energy & Fuels 2006; 20(5): 2155-63.
18. Xu Q, Lan P, Zhang B, Ren Z, and Yan Y. Hydrogen Production via Catalytic Steam
Reforming of Fast Pyrolysis Bio-oil in a Fluidized-Bed Reactor. Energy & Fuels
2010; 24(12): 6456-62.
19. Marquevich M, Czernik S, Chornet E, and Montane D. Hydrogen from biomass:
Steam reforming of model compounds of fast-pyrolysis oil. Energy & Fuels 1999;
13(6): 1160-6.
20. Czernik S, French R, Feik C, and Chornet E. Hydrogen by catalytic steam reforming
of liquid byproducts from biomass thermoconversion processes. Industrial &
Engineering Chemistry Research 2002; 41(17): 4209-15.
21. Wang ZX, Pan Y, Dong T, Zhu XF, Kan T, Yuan LX, Torimoto Y, Sadakata M, and
Li QX. Production of hydrogen from catalytic steam reforming of bio-oil using
C12A7-O--based catalysts. Applied Catalysis A-General 2007; 320: 24-34.
22. Lea-Langton A, Md Zin R, Dupont V, and Twigg MV. Biomass pyrolysis oils for
hydrogen production using chemical looping reforming. International Journal of
Hydrogen Energy 2012; 37: 2037-43.
23. Shuit SH, Tan KT, Lee KT, and Kamaruddin AH. Oil palm biomass as a sustainable
energy source: A Malaysian case study. Energy 2009; 34(9): 1225-35.
24. Sumathi S, Chai SP, and Mohamed AR. Utilization of oil palm as a source of
renewable energy in Malaysia. Renewable & Sustainable Energy Reviews 2008;
12(9): 2404-21.
25. Sulaiman F, Abdullah N, Gerhauser H, and Shariff A. An outlook of Malaysian
energy, oil palm industry and its utilization of wastes as useful resources. Biomass
and Bioenergy 2011; 35(9): 3775-86.
26. Ridler DE and Twigg MV, Steam reforming, in Catalyst Handbook, M.V. Twigg,
Editor. 1989, Wolfe Publishing Ltd: Frome, England. p. 225-80.
27. McCusker LB, Dreele RBV, Cox DE, Louer D, and Scardi P. Rietveld refinement
guidelines. International Union of Crystallography 1999; 32(1): 36-50.
28. Dupont V, Ross AB, Knight E, Hanley I, and Twigg MV. Production of hydrogen by
unmixed steam reforming of methane. Chemical Engineering Science 2008; 63: 2966-
79.
29. Chrissafis K, Dagounaki C, and Paraskevopoulos KM. The effects of procedural
variables on the maximum capture efficiency of CO2 using a carbonation/calcination
cycle of carbonate rocks Thermochimica Acta 2005; 428: 193-8.
30. Dobner S, Sterns L, Graff RA, and Squires AM. Cyclic Calcination and
Recarbonation of Calcined Dolomite. Industrial & Engineering Chemistry Process
Design and Development 1977; 16(4): 479-86.
31. Balasubramanian B, Lopez Ortiz A, Kaytakoglu S, and Harrison DP. Hydrogen from
methane in a single-step process. Chemical Engineering Science 1999; 54(15-16):
3543-52.
32. Silaban A, Narcida M, and Harrison DP. Characteristics of the reversible reaction
between CO2(g) and calcined dolomite. Chemical Engineering Communications
1996; 146: 149-62.
26
33. Johnsen K, Ryu HJ, Grace JR, and Lim CJ. Sorption-enhanced steam reforming of
methane in a fluidized bed reactor with dolomite as -acceptor. Chemical Engineering
Science 2006; 61(4): 1195-202.
34. Hildenbrand N, Readman J, Dahl IM, and Blom R. Sorbent enhanced steam reforming
(SESR) of methane using dolomite as internal carbon dioxide absorbent: Limitations
due to Ca(OH)2 formation. Applied Catalysis A: General 2006; 303(1): 131-7.
35. Han C and Harrison DP. Multicycle Performance of a Single-Step Process for H2
Production. Separation Science and Technology 1997; 32(1-4): 681-97.
36. Lopez Ortiz A and Harrison DP. Hydrogen Production Using Sorption-Enhanced
Reaction. Industrial & Engineering Chemistry Research 2001; 40(23): 5102-9.
37. Dou BL, Dupont V, Rickett G, Blakeman N, Williams PT, Chen HS, Ding YL, and
Ghadiri M. Hydrogen production by sorption-enhanced steam reforming of glycerol.
Bioresource Technology 2009; 100(14): 3540-7.
38. Pimenidou P, Rickett GL, Dupont V, and Twigg MV. High purity H2 by sorption-
enhanced chemical looping reforming of waste cooking oil in packed bed reactor
Bioresource Technology 2010; 10(23): 9279-86.
39. Dou BL, Rickett GL, Dupont V, Williams PT, Chen HS, Ding YL, and Ghadiri M.
Steam reforming of crude glycerol with in situ CO2 sorption. Bioresource Technology
2010; 101(7): 2436-42.
40. Pimenidou P, Rickett GL, and Dupont V, In-situ CO2 capture for unmixed steam
reforming, in 8th World Congress of Chemical Engineering. 2009: Montreal, Quebec,
Canada.
41. Guenadou D, Lorcet H, Peybernes J, Catoire L, Osmont A, and Gokalp I. Plasma
thermal conversion of bio-oil for hydrogen production. International Journal of
Energy Research 2011; Published online.
42. Kee RJ, Rupley FM, Miller JA, Coltrin ME, Grcar JF, Meeks E, Moffat HK, Lutz AE,
Dixon-Lewis G, Smooke MD, Warnatz J, Evans GH, Larson RS, Mitchell RE,
Petzold LR, Reynolds WC, Caracotsios M, Stewart WE, and Glarborg P, CHEMKIN
Collection, Release 3.5, Reaction Design, Inc.,San Diego, CA, 1999

27
Table 1 Main compounds detected by GC-MS for PEFB oil
Compounds Area percentage
Acetic acid 32.06
Propanoic acid 0.89
1-Hydroxy-2-butanone 2.98
2(5H)-Furanone 0.28
2-Cyclopenten-1-one, 2-hydroxy-3-methyl- 8.34
Phenol 21.23
Phenol, 2-methoxy- (guaiacol) 1.99
Phenol, 2-methoxy-4-methyl (methyl guaiacol) 0.38
Phenol, 2,6-dimethoxy- (syringol) 4.60
Levoglucosan 2.20
Total 74.95%
Table 2 Main compounds detected by GC-MS for pine oil
Compounds Area percentage
Acetic acid 15.17
2(5H)-furanone 2.15
1,2-cyclopentanedione,3-methyl 3.94
Phenol 0.33
Phenol, 2-methoxy (guaiacol) 4.89
Phenol, 2-methoxy -4-methyl (methyl guaiacol) 5.44
Eugenol 1.70
Phenol, 2,6-dimethoxy- (syringol) 1.09
Vanillin 1.79
Levoglucosan 28.11
Total 64.61%

28
Table 3 Process outputs for steam reforming of PEFB and pine oils with molar steam to
carbon ratio at 600 °C in the absence of CO2 sorbent. (max theor. H2 yields are 10.9 and 17.1
wt% of moisture free PEFB and pine oils, respectively).
wet m.f. Conversions
exp. exp. max.
theor.
% selectivity to C-
products
Wt%mf H2
yield
S/C S/C XEFB XH2O XH2O SelCO2 SelCO SelCH4 H2
yield
eff.
PEFB
0 0.76 0.67 1.07 1.00 47 51 2 8.06 0.74
0.64 1.43 0.77 0.63 0.72 51 45 4 8.72 0.81
1.22 1.98 0.83 0.45 0.51 42 53 5 8.88 0.82
1.89 2.65 0.89 0.36 0.38 43 55 2 9.50 0.87
2.00 2.75 0.87 0.34 0.37 39 59 2 9.51 0.87
2.52 3.28 0.83 0.31 0.31 53 42 5 9.73 0.90
Pine
0 0.37 0.69 1.57 1.00 29 61 10 7.6 0.45
0.64 1.01 0.74 0.55 1.00 29 63 8 7.8 0.46
1.22 1.59 0.95 0.49 0.85 40 53 7 10.6 0.63
1.89 2.26 0.97 0.34 0.60 42 47 11 9.9 0.58
2.52 2.89 0.80 0.35 0.47 52 42 6 12.2 0.72

29
Table 4 Carbon balance PEFB and pine oils without sorbent, based on total mol of C input
minus mol of C converted (to CO, CO2 and CH4) during the fuel feed, minus the mol of C
subsequently oxidised during both air and N2 feeds.
wet S/C mol C in mol C
conv
mol C
oxid
mol C
oxid
mol C oxid C bal C
bal
feed→ Fuel/H2
O
Fuel/H2O Air N2 Air & N2 (mol) (%)
PEFB
0.00 2.26×10-
2
1.52×10⁻²
3.22×10⁻³
2.42×10⁻⁴
3.46×10⁻³
3.89×10-
3
17.2
0.66 3.18×10-
2
2.44×10⁻²
5.58×10⁻³
2.86×10⁻⁴
5.87×10⁻³
1.51×10-
3
4.8
1.23 2.98×10-
2
2.47×10⁻²
3.29×10⁻³
6.07×10⁻⁶
3.29×10⁻³
1.84×10-
3
6.2
1.89 3.26×10-
2
2.70×10⁻²
4.17×10⁻³
2.83×10⁻⁷
4.17×10⁻³
1.43×10-
3
4.4
2.51 3.26×10-
2
2.70×10⁻²
3.07×10⁻³
7.80×10⁻⁵
3.15×10⁻³
2.48×10-
3
7.6
Pine
0
2.25×10-
2 1.59×10
-2 N.A. N.A. N.A. N.A. N.A.
0.66
3.29×10-
2 2.43×10
-2 8.25×10
-3 2.33×10
-4 8.48×10
-3
1.19×10-
4 0.4
1.23
5.16×10-
2 4.90×10
-2 3.23×10
-3 1.32×10
-3 4.55×10
-3
2.02×10-
3 3.9
1.89
1.96×10-
2 1.90×10
-2 N.A N.A. N.A. N.A. N.A.
2.51
2.20×10-
2 1.75×10
-2 1.92×10
-3 2.13×10
-5 1.94×10
-3
2.54×10-
3 11.5

30
Table 5 Characterisation of the catalyst by N2 adsorption (BET surface area) and powder
XRD (composition and crystallite size)
Sample Conditions BET
(m2g
-1)
Al2O3
(wt%)
NiO
(wt%)
Ni
(wt%)
NiO crystallite
size (Å)
As-
received
oxide 3.262
1.884
n.a n.a n.a 447
Reduced H2 reduced 3.720
2.798
n.a n.a n.a n.a
Used PEFB, after
air feed
2.819
2.203
83.7 16.3 0 506.6
Used Pine, after
air feed
3.258
2.557
83.4 15.5 1.1 455.5
Table 6 Process outputs of sorption enhanced steam reforming of PEFB and pine oils at wet
S/C of 2 (PEFB) and 1.9 (pine) and 600 °C. The enhancement effect given in % change,
compared to the values without sorption are also shown in brackets.
Oil duration H2 yield H2 purity Concentrations (Mol %)
(s) (wt% of
fuel)
(%) CO2 CO CH
4
H2
PEFB 2500 10.4
(Enh+9%)
97
(Enh+67%)
0.007 0.11 0.0
3
5.12
Pine 3500 13.9
(Enh+41%)
87
(Enh+60%)
0.66 0.55 0.2
1
9.92

31
Fig. 1 Experimental set-up for the steam reforming of the pyrolysis oils.
Fig. 2 H2 yield from acetic acid at thermodynamic equilibrium vs. temperature at different
S/C ratios (0-4). ‘w/o Ca’, dotted lines represent reactant mixtures without CaO(S); solid black
lines: reactant mixtures with CaO(S) at molar Ca/C ratio of 1, allowing both CaCO3(S) and
Ca(OH)2 products; ‘w/o Ca(OH)2’, solid grey lines: as black lines but allowing CaCO3(S) as
the only Ca-product.
P P P
FMass Flow
Controller
Condenser 1
Chiller
Air H2N2
Temp
Controller
Syringe Pump
for Pyrolysis oil
Syringe pump for water
Condenser 2
Silica gel
Gas Analyzer
PCT
T
Re
acto
r
Fu
rna
ce
0.0
1.0
2.0
3.0
4.0
5.0
6.0
7.0
8.0
9.0
10.0
11.0
12.0
13.0
14.0
15.0
0 200 400 600 800 1000
H2yie
ld (
wt%
fu
el)
temperature (0C)
S/C=0
S/C=0.5
S/C=0.5 w/o Ca(OH)2
S/C=1.0
S/C=4.0
S/C=4.0, w/o Ca(OH)2
S/C=0.0, w/o Ca
S/C=0.5, w/o Ca
S/C=1.0, w/o Ca
S/C=4.0, w/o Ca
A B C

32
Fig. 3 H2 yield for S/C of 3.0 for the bio-oil compounds measured in significant
concentrations by GC-MS (Tables 1&2). Dotted lines represent reactant mixtures without
CaO (conventional steam reforming), and solid lines represent reactant mixtures with CaO/C
ratio of 1 (sorption enhanced steam reforming). The following substances produced nearly
superimposed profiles: palmitic acid with methyl palmitate (PAME), phenol with eugenol.
Fig. 4: (a) H2 purity and (b) Yield of the hydrogen produced during steam reforming and
sorption-enhanced steam reforming of PEFB pyrolysis oil 600 °C and S/C of 2.52.
0.0
5.0
10.0
15.0
20.0
25.0
30.0
35.0
0 200 400 600 800 1000
H2
yie
ld (
wt%
fu
el)
temperature ( C)
palmitic acid/PAME
phenol/eugenol
guaiacol
2(5H) furanone
levoglucosan
methyl guaiacol
syringol
0
20
40
60
80
100
0 1000 2000 3000
H2
pu
rity
(%
)
time (s)
(a)
0
2
4
6
8
10
12
0 1000 2000 3000
H2
yie
ld (
wt%
of
fuel
)
time (s)
(b)

33
Fig. 5 as Fig. 4 for pine oil at S/C of 2.
Fig. 6 XRD observed spectrum for pine oil after wet S/C=2 experiments without sorbent,
following final air feed (solid line), also shown the calculated spectrum with Rietveld
refinement (scatter points) and the residue line between the two spectra (dashed line).
0
20
40
60
80
100
0 1000 2000 3000
H2
pu
rity
(%
)
time (s)
(a)
0
5
10
15
0 1000 2000 3000
H2
yie
ld (
wt%
of
fuel
)
time (s)
(b)

34
Fig. 7 SEM images for pine EPFB oil for wet S/C=2. Top left: experiment without sorbent
after fuel and steam feed and N2 purge, top right: same after the air feed, bottom left: with
sorbent after air feed. Bottom right: EDX of SEM image in bottom left.