UNIVERSITI PUTRA MALAYSIA MAPPING THE CENTRAL …psasir.upm.edu.my/5064/1/FH_2006_7a.pdf · areal...
25
UNIVERSITI PUTRA MALAYSIA MAPPING THE CENTRAL MATANG MANGROVE FOREST RESERVE, PERAK, USING REMOTE SENSING AND GEOGRAPHIC INFORMATION SYSTEM AZIAN BINTI MOHTI FH 2006 7
Transcript of UNIVERSITI PUTRA MALAYSIA MAPPING THE CENTRAL …psasir.upm.edu.my/5064/1/FH_2006_7a.pdf · areal...

UNIVERSITI PUTRA MALAYSIA
MAPPING THE CENTRAL MATANG MANGROVE FOREST
RESERVE, PERAK, USING REMOTE SENSING AND GEOGRAPHIC
INFORMATION SYSTEM
AZIAN BINTI MOHTI
FH 2006 7

MAPPING THE CENTRAL MATANG MANGROVE FOREST RESERVE, PERAK, USING REMOTE SENSING AND GEOGRAPHIC
INFORMATION SYSTEM
By
AZIAN BINTI MOHTI
Thesis Submitted to the School of Graduate Studies, Universiti Putra Malaysia in Fulfilment of the Requirement for the Degree of Master of
Science
April 2006
ii
DEDICATION
Wish to thank ALLAH the Almighty
for his wisdom, guidance and strength in completing this Master
Dedicated to my daughter FIEFA
my family members; MAK, ABAH, LAN, YAYA, AAH, IZAM, K.CHIK, UDIN,
IETA, ENGKUK, arwah ADIK DULLAH and also IEMA
last but not least ABANG…
for their love, continuous moral support and encouragement.
“I’m the winner after going through the bad and good time within 7 years...”

iii
Abstract of thesis presented to the Senate of Universiti Putra Malaysia in fulfilment of the requirement of the degree of Master of Science.
MAPPING THE CENTRAL MATANG MANGROVE FOREST RESERVE, PERAK, USING REMOTE SENSING AND GEOGRAPHIC
INFORMATION SYSTEM
By
AZIAN BINTI MOHTI
April 2006
Chairman : Ismail Adnan Abdul Malek, M.F.
Faculty : Forestry
Mangroves are characterized by littoral forest formation occurring in all
estuaries of the Peninsular Malaysia. It plays an important role to protect the
shoreline along the coast. In Malaysia, although mangroves are well
managed especially in Perak, Johor and Selangor but the integration of
remote sensing with geographic information system (GIS) for mapping and
managing mangrove forest is not widely practiced. The purpose of this
study is to use remote sensing technique using SPOT and IKONOS data
integrated with GIS for mapping the extent of mangrove forest in central
part of MMFR and for quantifying temporal changes in stand density and
areal extent within the MMFR from year 1989 – 2000.

iv
A study in mapping the mangrove forest using remote sensing integration
with GIS was carried out in central part of Matang Mangrove Forest Reserve
(MMFR) in the Range Kuala Trong, Perak. The study area faces the Straits of
Malacca lying between latitudes 438N to 449N and longitudes 10020E to
10036E, where the classification of mangrove forest areas was carried out
and recorded.
Multispectral SPOT (Systeme Pour‟l Observation de la Terre) images of 1989,
1993, 1997 and 2000 and IKONOS image of 2000 for Kuala Trong areas
(based on AOI) were enhanced, classified and vectorized using image
processing software for the purpose of mapping the mangrove forest. Spatial
data for the mangrove forests such as information of compartments, blocks,
names of area digitized by the Forestry Department (Mapping and GIS
Section) using ARC/INFO Version 3.4.2 Geographic Information System
(GIS) software were used as secondary data in the study.
Based on the image analysis of the SPOT images, the mangrove forest
reserves were classified as Excellent Forest Reserve, Good Forest Reserve,
Poor Forest Reserve, Dryland Forest Reserve and Damaged Forest Reserve.
These five classes of mangrove forests, can be further categorised as
Productive and Non-productive area. The analysis showed that the average
volumes of timber available within the productive areas of the study site
were Excellent Forest (362.50m3/ha - 50.82%); Good Forest (256.31m3/ha -
v
5.93%) and Poor Forest (94.54m3/ha - 13.25%) with an overall classification
accuracy of more than 70% while the statistics value obtained from Kappa‟s
was shown more than 0.6 which is relatively quite good results for image
processing.
It can be concluded that the satellite remote sensing with the integration of
GIS can be successfully used and implemented for mangrove classification
and mapping for the advance purposes of providing fast, efficient and
accurate information on the mangrove resource.

vi
Abstrak tesis yang dikemukakan kepada Senat Universiti Putra Malaysia sebagai memenuhi keperluan untuk ijazah Master Sains
PEMETAAN BAHAGIAN TENGAH HUTAN SIMPAN PAYA BAKAU MATANG, PERAK, MENGGUNAKAN PENDERIAAN JAUH (RS) DAN
SISTEM MAKLUMAT GEOGRAFI (GIS)
Oleh
AZIAN BINTI MOHTI
April 2006
Pengerusi : Ismail Adnan Abdul Malek, M.F.
Fakulti : Perhutanan
Di Semenanjung Malaysia bakau mempunyai karektor untuk hidup subur di
sepanjang muara sungai. Bakau penting untuk melindungi kawasan tebing
laut. Walaupun hutan bakau diuruskan dengan baik di Malaysia terutama
di negeri Perak, Johor dan Selangor tetapi, integrasi teknololgi penderiaan
jauh dengan sistem maklumat geografi untuk pemetaan dan pengurusan
hutan paya bakau merupakan satu fenomena baru. Kajian berkenaan
pemetaan dan pengurusan hutan paya bakau menggunakan penderiaan
jauh dengan GIS dilakukan di bahagian tengah Hutan Simpan Paya Bakau
(HSPB) iaitu kawasan Kuala Trong, Perak. Kawasan kajian ini mengadap
Selat Melaka dengan latitud di antara 438U hingga 449U dan longitud di
antara 10020T hingga 10036T.

vii
Imej satelit SPOT tahun 1989, 1993, 1997 dan tahun 2000 serta imej satelit
IKONOS tahun 2000 bagi kawasan Kuala Trong (hanya mengambil kira
kawasan kajian) telah dipertingkatkan, dikelaskan dan divektorkan
menggunakan perisian yang dikhaskanuntuk pemprosesan imej bagi
pemetaan hutan paya bakau ini. Data spasial untuk kawasan hutan paya
bakau seperti maklumat kompartmen, blok, nama, kawasan dan sebagainya
lagi telah juga digunakan. Maklumat ini telah ditukarkan dalam format
digital oleh Jabatan Perhutanan (Bahagian Pemetaan dan GIS)
menggunakan perisian Sistem Maklumat Geografi (GIS) ARC/INFO versi
3.4.2 dan digunakan sebagai data sekunder dalam kajian ini.
Berdasarkan analisis yang telah dijalankan pada data SPOT, lima kelas
hutan paya bakau dapat dikelaskan iaitu Hutan Paling Bagus, Hutan Bagus,
Hutan Miskin, Hutan Darat dan Hutan Rosak. Seterusnya daripada lima
kelas hutan paya bakau ini, dua daripadanya dapat dinyatakan iaitu
kawasan yang Produktif dan kawasan yang Tidak Produktif. Analisis purata
isipadu kayu balak telah dapat mengenal pasti bagi kawasan produktif di
dalam kawasan kajian yang mana Hutan Paling Bagus ialah 362.50m3/ha
meliputi 50.82%, Hutan Bagus 256.31m3/ha meliputi 35.93% dan Hutan
Miskin 94.54m3/ha meliputi 13.25%. Ketepatan pengkelasan keseluruhan
kawasan menggunakan kaedah penderiaan jauh melebihi 70%. Manakala
nilai statistic yang diperolehi daripada Kappa pula melebihi 0.6. Ini jelas
menunjukkan keputusan ini adalah baik bagi pengelasan imej.

viii
Kesimpulannya, satelit penderiaan jarak jauh (RS) dengan integrasi Sistem
Maklumat Geografi (GIS) boleh digunakan atau dilaksanakan dengan
jayanya untuk pengkelasan hutan paya bakau dan pemetaan bagi tujuan
selanjutnya supaya maklumat dapat disampaikan dengan cepat, efisen dan
infomasi yang lebih tepat.

ix
ACKNOWLEDGEMENTS
Alhamdulillah, Praise be to Allah Almighty for His blessing that I could
complete this thesis. I would like to express my deepest appreciation to my
Supervisor, En. Ismail Adnan Abd Malek for his guidance, expertise and
meticulous editing towards successful completion of this study. I would also
like extend my gratitude to my co-supervisor, Prof. Dr. Hj. Mazlan Hashim
of Universiti Teknologi Malaysia, Dr. Ahmad Ainuddin Nuruddin and Prof.
Dato‟ Dr. Hj. Nik Muhammad Majid for their advice on gaining leadership,
communication and dynamic research skills to complete this work. I would
like to thank my ex-Supervisor Capt. Prof. Dr. Kamaruzaman Jusoff in
providing me the invaluable suggestions and comments towards the
completion of this study.
Special appreciation to the Forestry Department of Peninsular Malaysia
Headquarters especially The Mapping and GIS Section, Malaysian Centre
for Remote Sensing (MACRES) for kindly allowing the use of digital and
spatial data for this study, to the Department of Forestry, Perak Darul
Ridzuan especially En. Azni Rahman (ADFO) and Tn. Hj. Mohamad Ismail
(DFO) of the Taiping District Forestry Department for their kindness in
giving useful information and data for this study. My thanks also go to all
staff of Range Kuala Trong, Sungai Kerang and Kuala Sepetang especially
Pakcik Raja Shahar, Pakcik Abu Bakar, Pakcik Hadri, Pakcik Ahmad

x
Mashhor, En. Zaidi, En. Isa, En. Fauzi, En. Kamaruddin, Miss A‟ah and
others for their kindness and technical assistance during field survey and
data collection. Thank you very much to all.
Finally, my loving thanks to my beloved „cute‟ baby girl, family and my very
good friend (A.R.A) who have been patient and faithfully praying for my
success. Not to be forgotten are my friends; Iwan, Madi, Pak Tamal, Fandi,
Elia, Harzany, Sheriza, Khor, Fairuz, Kamarul, Teacher Khazila, members of
Forest Research Institute of Malaysia (FRIM) and last but not least Zul as
well others for their moral support and help in this study.
xi
I certify that an Examination Committee has met on 5th April 2006 to conduct the final examination of Azian Binti Mohti on his Master of Science thesis entitled “Mapping The Central Matang Mangrove Forest Reserve, Perak, using Remote Sensing and Geographic Information System” in accordance with Universiti Pertanian Malaysia (Higher Degree) Act 1980 and Universiti Pertanian Malaysia (Higher Degree) Regulations 1981. The Committee recommended that the candidate be awarded the relevant degree. Members of the Examination Committee are as follows: Shattri Bin Mansor, PhD Professor Faculty of Engineering Universiti Putra Malaysia (Chairman) Helmi Zulhaidi Bin Mohd Shafri, PhD Lecturer Faculty of Engineering Universiti Putra Malaysia (Internal Examiner) Anuar Bin Abdul Rahim, PhD Lecturer Faculty of Agriculture Universiti Putra Malaysia (Internal Examiner) Sulong Bin Ibrahim, M.Sc. Lecturer Institute of Oceanography Kolej Universiti Sains & Teknologi Malaysia (KUSTEM) (External Examiner)
__________________________________ HASANAH MOHD GHAZALI, PhD Professor/Deputy Dean School of Graduate Studies Universiti Putra Malaysia Date :

xii
This thesis submitted to the Senate of Universiti Putra Malaysia and has accepted as fulfilment of the requirement for the degree of Master of Science. The members of the Supervisory Committee are as follows: Ismail Adnan Bin Abdul Malek, M.F. Lecturer Faculty of Forestry Universiti Putra Malaysia (Chairman) Mazlan Bin Hashim, PhD Professor Faculty of Geoinformation Science and Engineering Universiti Teknologi Malaysia (Member) Ahmad Ainuddin Bin Nuruddin, PhD Lecturer Faculty of Forestry Universiti Putra Malaysia (Member) Dato’ Nik Muhammad Bin Nik Abd. Majid, PhD Professor Faculty of Forestry Universiti Putra Malaysia (Member)
_________________________ AINI IDERIS, PhD Professor/Dean School of Graduate Studies Universiti Putra Malaysia
Date :

xiii
DECLARATION
I hereby declare that the thesis is based on my original work except for quotations and citations, which have been duly acknowledged. I also declare that it has not been previously or concurrently submitted for any other degree at UPM or other institutions.
__________________________ AZIAN BINTI MOHTI
Date :

xiv
TABLE OF CONTENTS
Page DEDICATION ii ABSTRACT iii ABSTRAK vi ACKNOWLEDGEMENTS ix APPROVAL xi DECLARATION xiii LIST OF TABLES xvi LIST OF FIGURES xvii GLOSSARY OF TERMS xix CHAPTER
I INTRODUCTION General Background 1 Justification 5 Objectives of Study 8
II LITERATURE REVIEW Scenario of Mangrove Forest in Malaysia 9 Definition of Satellite Remote Sensing 14 SPOT Satellite System 16 IKONOS Satellite System 21 Geographic Information System (GIS) 24 Mapping and Managing Mangrove 29
Application / Integration of Remote Sensing with GIS to Assist Mangrove Mapping
37
III MATERIALS AND METHODS
Description of Study Area 44 Topography, Soil and Climate 46 Forest Description and Vegetation 47 Materials and Equipment 49 Data Acquisition 49 Image Processing System 51 Components and Techniques of GIS 52 Methodology 54 Digital Image Processing and Visual Interpretation 58 Pre-Processing 59 Masking 61 Image Enhancement 64

xv
Image Classification 66 Ground Verification 71 Survey Design for Ground Truthing 72 Accuracy Assessment 74 Raster to Vector Conversion 75 Data Analysis for Mangrove Volume Estimation 76
Development of MMFR Geographic Information Systems
78
MMFR Database Design 78
Data Integration of Remote Sensing and Geographic Information System
80
IV RESULTS AND DISCUSSION
Mangrove Classification 84 Ground Truthing 94 Accuracy Assessment 104 Raster to Vector Conversion 107 Mangrove Mapping 112
Temporal Changes in Stand Density and Areal Extent from 1989 - 2000
112
V CONCLUSIONS AND RECOMMENDATIONS Conclusions 120 Recommendations 122
REFERENCES 124 APPENDICES 135 BIODATA OF THE AUTHOR 160

xvi
LIST OF TABLES
Table Page
1 Extent of mangrove forest reserves and state land mangroves in Malaysia (2003)
11
2 Area of mangrove forest reserves in Malaysia 1980 and 1990 11
3 Differences between SPOT and IKONOS satellite and sensor characteristics
23
4 Summaries of IKONOS products 24
5 List of major trees, palms, rattan and ferns in Range Kuala Trong
48
6 12 clusters of Unsupervised Classification for 1989 SPOT image
85
7 Seven clusters of Unsupervised Classification for 1993 SPOT image
86
8 11 clusters of Unsupervised Classification for 1997 SPOT image
87
9 12 clusters of Unsupervised Classification for 2000 SPOT image
88
10 12 clusters of Unsupervised Classification for 2000 IKONOS image
89
11 Statistical results of six classes by MLC of SPOT images for year 1989
92
12 Statistical results of six classes by MLC of SPOT images for year 1993
93
13 Statistical results of six classes by MLC of SPOT images for year 1997
94
14 Statistical results of six classes by MLC of SPOT images for year 2000
95
xvii
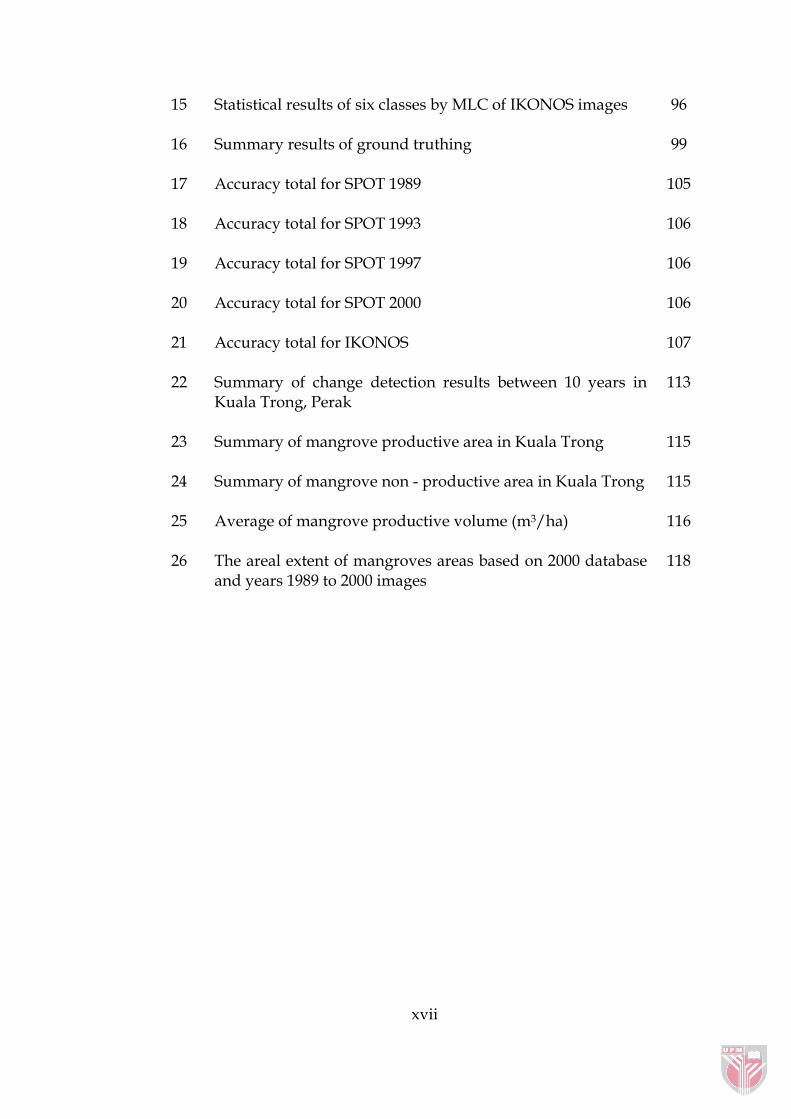
15 Statistical results of six classes by MLC of IKONOS images
96
16 Summary results of ground truthing
99
17 Accuracy total for SPOT 1989
105
18 Accuracy total for SPOT 1993
106
19 Accuracy total for SPOT 1997
106
20 Accuracy total for SPOT 2000
106
21 Accuracy total for IKONOS
107
22 Summary of change detection results between 10 years in Kuala Trong, Perak
113
23 Summary of mangrove productive area in Kuala Trong
115
24 Summary of mangrove non - productive area in Kuala Trong
115
25 Average of mangrove productive volume (m3/ha)
116
26 The areal extent of mangroves areas based on 2000 database and years 1989 to 2000 images
118
xviii
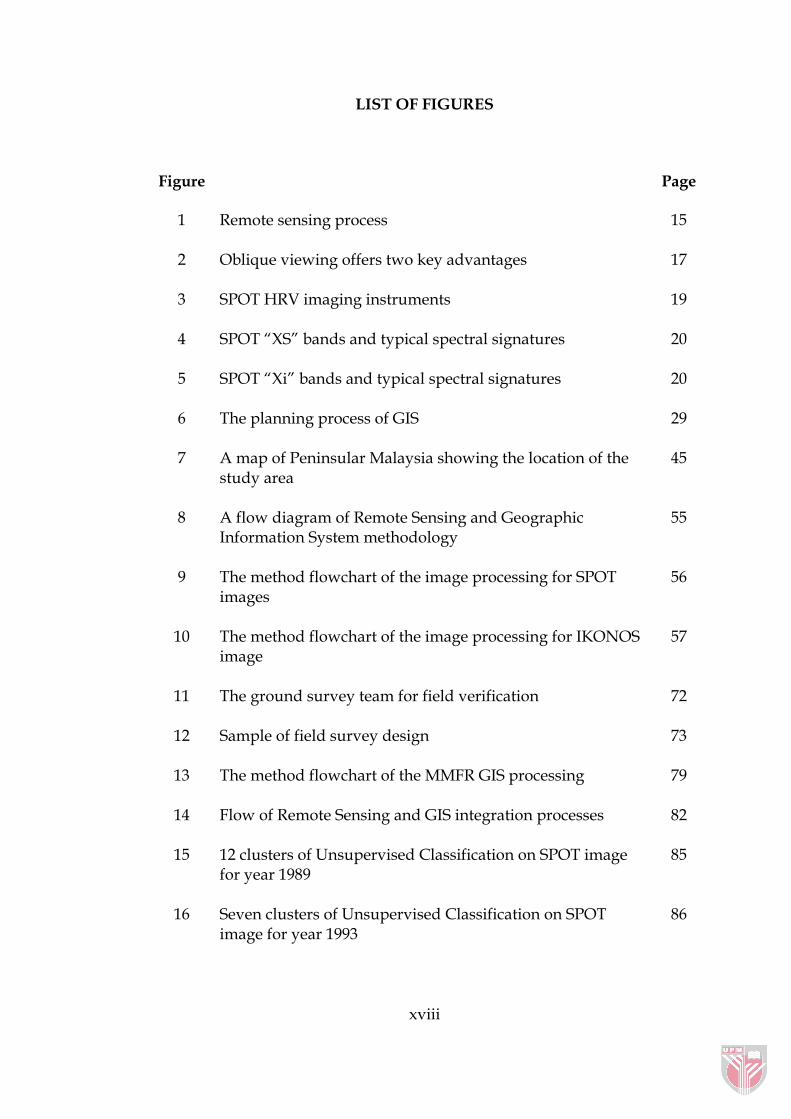
LIST OF FIGURES
Figure Page
1 Remote sensing process 15
2 Oblique viewing offers two key advantages 17
3 SPOT HRV imaging instruments 19
4 SPOT “XS” bands and typical spectral signatures 20
5 SPOT “Xi” bands and typical spectral signatures 20
6 The planning process of GIS 29
7 A map of Peninsular Malaysia showing the location of the study area
45
8 A flow diagram of Remote Sensing and Geographic Information System methodology
55
9 The method flowchart of the image processing for SPOT images
56
10 The method flowchart of the image processing for IKONOS image
57
11 The ground survey team for field verification 72
12 Sample of field survey design 73
13 The method flowchart of the MMFR GIS processing 79
14 Flow of Remote Sensing and GIS integration processes 82
15 12 clusters of Unsupervised Classification on SPOT image for year 1989
85
16 Seven clusters of Unsupervised Classification on SPOT image for year 1993
86

xix
17 11 clusters of Unsupervised Classification on SPOT image for year 1987
87
18 12 clusters of Unsupervised Classification on SPOT image for year 2000
88
19 12 clusters of Unsupervised Classification on IKONOS image for year 2000
89
20 Seven clusters of Supervised Classification on SPOT image for year 1989
92
21 Six clusters of Supervised Classification on SPOT image for year 1993
93
22 Six clusters of Supervised Classification on SPOT image for year 1997
94
23 Seven clusters of Supervised Classification on SPOT image for year 2000
95
24 Seven clusters of Supervised Classification on IKONOS image for year 2000
96
25 Location of training sites 97
26 A segment of Excellent Forest Reserve 101
27 A segment of Good Forest Reserve 101
28 A segment of Poor Forest Reserve 102
29 A segment of Damaged Forest Reserve 102
30 A segment of Dryland Forest Reserve 103
31 Vectorization of 1989 Supervised Classified image 108
32 Vectorization of 1993 Supervised Classified image 109
33 Vectorization of 1997 Supervised Classified image 110
34 Vectorization of 2000 Supervised Classified image 111

xx
35 The average productive volume (m3/ha) of mangrove 117
36 The changes of mangrove areas from year 1989 to 2000 118
37 The extent of mangrove areas based on database and images in the study
119

xxi
GLOSSARY OF TERMS
AOI Area of Interest
CASI Compact Airborne Spectrographic Imager
CCRS Canada Centre for Remote Sensing
CD Compact Disk
CD-ROM Compact Disk – Read Only Memory
CNES Centre National d‟Etudes Spatiales
DEMs Digital Elevation Models
DN Digital Number
ENVI Environmental for Visualizing Images
ESRI Environmental Systems Research Institute
etc et cetera
FAO Food and Agricultural Organization
FCC False colour composite
F.D.(MGS) Forestry Department (Mapping and GIS Section)
GCPs Ground Control Points
GIS Geographic Information Systems
GPS Global Positioning Systems
HRV High Resolution Visible
IFOV Instantaneous Field of View
xxii
IRS Indian Remote Sensing
ITTO International Tropical Timber Organization
LiDAR Light Detection and Ranging
LISS Linear Imaging Self-scanning Sensor
LUT Look Up Table
MACRES Malaysian Centre for Remote Sensing
MLC Maximum Likelihood Classifier
MMFR Matang Mangrove Forest Reserve
NDVI Normalized Difference Vegetation Index
NIR Near Infrared
PFE Permanent Forest Estate
pixel picture elements
R-G-B Red - Green - Blue
r.m.s root mean square
RSO Rectified Skew Orthomorphic Projection
ROI Region of Interest
SPOT Systeme Pour‟l Observation de la Terre
TM Thematic Mapper
USGS United State Geological Survey
UPM Universiti Putra Malaysia
UTM Universal Transverse Mercator

xxiii
www world wide web
XP/P Panchromatic mode
XS/Xi Multispectral mode

CHAPTER I
INTRODUCTION
General Background
Mangrove forests form an integral component of the dynamic homeostatic
coastal ecosystem. They are also termed as "Coastal Woodlands" or "Tidal
Forest" mangroves (Kumari et al., 1999), which are composed of salt tolerant,
inter tidal halophytic vegetation forming a locale specific unique community
with specific ecological amplitude. Mangroves are an integral part of the
coastal environment extending throughout the tropics and sub-tropics of the
world. It covers an area of one third of the world's total in South East Asia
(Rao, 1992), and is considered rich in species diversity and luxuriant in
growth (FAO, 1984).
Mangrove forests occur in the intertidal zone along the seacoast in most of
the tropical and sub-tropical region (Arksornkoae, 1995). Although
mangrove forests have multiple functions (such as human settlement,
transportation and resource utilization) their occurrences are frequently
regarded as wasteland having low economic value. Even if they are
productive, there is a general early perception that mangroves are of lower
value and their contribution to the adjacent ecosystem is not clear (Ong,
1984). Consequently, as human population increases and urbanization
accelerates, mangrove land and resources are often converted to other uses.


![Whirlpool Fl 5064 [ET]](https://static.fdocuments.in/doc/165x107/577d33e71a28ab3a6b8c0c60/whirlpool-fl-5064-et.jpg)