UNIVERSITI PUTRA MALAYSIA CONSUMER DEMAND FOR...
25
UNIVERSITI PUTRA MALAYSIA CONSUMER DEMAND FOR FRESH MARINE FISH IN PENINSULAR MALAYSIA Kamaruzzaman Abu Samah FEP 1987 3
Transcript of UNIVERSITI PUTRA MALAYSIA CONSUMER DEMAND FOR...

UNIVERSITI PUTRA MALAYSIA
CONSUMER DEMAND FOR FRESH MARINE FISH IN PENINSULAR MALAYSIA
Kamaruzzaman Abu Samah
FEP 1987 3

It is hereby certifiErl that we have read this thesis entitlErl 'Consumer Demand for Fresh Marine Fish in Peninsular Malaysia'" by Karnaruzzaman Abu Samah, am in our opinion it is satisfactory in terms of the scope, quality, am presentation as partial fulfilment of the requirements faL' the degree of Master of Science
�""'n::J P. ZAINUDDIN, Ph. D. Assoc. Profe /Dean of Graduate Sttrlies
Universiti Pertanian Malaysia (Chairnan Board of Examiners)
f;o,l ot1K"\nn, Ph. D.
Associate ofessor D=partment of Agricultural and Resource
Econanics The National University of Malaysia
(External Examiner)
.... ~ SAHAK r-w1AT, Ph. D.
�partrnent of Natural Resource Eo::>nanics Universiti Pertanian Malaysia
(Internal Examiner)
..... .... ..... ± EDDIE FCOK CHCNG
Department of Agricultural Eoonanics Universiti Pertanian Malaysia
(Supervisor)
This thesis was submitted to the Senate of Universiti Pertanian Malaysia and was accepted as partial fulfilment of th e requirements for the degree of Master of Science.
15 JUl 1987
... � . . � ........ . (Dean of Graduate Studies )
Date : •••••••••••••
<nSJMER DE%t1AND R:R FRESH MARINE FISH IN PENINSULAR MALAYSIA
by
Kamaruzzaman Ahl Sa.mah
A thesis submitted in partial fulfilment of the requirements for the degree of Master of Science in the Faculty of Eoonomics am Management,- Uni versiti Pertanian Malaysia.
May 1 987
I wish to express my gratitude to Mr.Eddie Chiew F. Chong,
my advisor, for his guidance am oomments throughout this study.
My gratitude is a lso extended to Dr. Roslan A Ghaffar for his
guidance, oomments am suggestions, especially on the theoretical
parts of this study.
Tb Dr . Br ian Lock wood, the Coordinator of AFSSRN (As ian
Fisheries Social Science Research Network) which is under ICLARM
(International Center of Living Aquatic Resource Management), I
express gratitude for the financial support throughout the study.
I am deeply indebted to my parents (Haj i Abu Samah Haj i
Lembang and Hajjah Saniah Jali) and brothers for theirunfailling
support. I like to thank my fr iends and colleagues (Piti, Bahar,
Poo, Rath, Muz and Thapa) for the ir gener ous ass istance in
facilitating th is study.
My appreciation is due to M iss Damitah Han im (UPM), M iss
Khatijah Abu Bakar (UPM) am Miss Sharifah Mastura Alsagoff (US M)
for proof-reading am editing this work. Finally, I would like
to express my sincere thanks to those who in one way or an other
have helpe1 me in oompletion of this thesis.
ii
TABLE OF <XNI'ENl'S
......................................
TABLE OF a:Nl'Em'S .•.........•••......•........••.......
LIST OF TABLES ......................................
LIST OF FIGURE'S ....••........•.......................
... . ............ . .....................
......................................
OIAPI'ER 1
Contributions of Fisheries to the National Economy ••••••••••••••••••••••••••••••
General Informations on Fisheries Sub-Sector ................................
The Marine Fisheries Resources ••••••••••••••••••
Proo.uction Trerrl. of Fresh Marine Fish
Page
ii
iii
vii
x
xi
xiii
1
1 0
10
14
Fishing Boats and Gears ••••••••••••••••••••••••• 24
Government Policy in Fisheries ............... . . 29
Statement of Problems •••••••••••••••••••••••••••••••• 31
The Imp::>rtance of this Stooy ...................... . .. 34
Objectives of Stooy •••••••••••••••••••••••••••••••••• 38
Scope and Limitation of the Stooy ••••••••••••••••••••• 39
�sation of Thesis ••••••••••••••••••••••••••••••• 41
iii
Page
CHAPl'ER 2 REVIEW OF LITERATURE
Factors Affecting Demard for Fresh Marine Fish ••••••• 42
Non-Empirical Studies on Fish Consumption •••••••••••• 45
Empirical Stu:lies on Fish Consumption •••••••••••••••• 52
'Illeory of Consumer Demarrl Concepts and Restrictions .. . ...... . . . ................ 68
Empirical Models for Demand Analysis ••••••••••••••••• 73
Derivation of Demarrl Function With and Without Restriction •••••••••••••••••••••••• 75
Single Equation Model .. . ..... . . . . . ... . . . . . . ... . 80
Linear Demand r.tJdel ... . . .................. 81
Non Linear Demand Model ••••••••••••••••••• 81
Simultaneous Equations Model 83
Empirical Estimation Technique ....... . . ... . . . . ... . . . 89
Sources of Data ......... . ... . . . . .. . .. . .. . . ... . . . . . 93
Description of Variables ••••••••••••••••••••••••••••• 94
iv
Page
CHAP.IER 4 n.tPIRICAL RESULTS AND DISaJSSlOO
Consumer Demarrl by Species of Marine Fish • • • • • • • • • •• 97
Consurrm- Demarrl by Grades of Marine Fish ........... 110
Consumer Demarrl for Total Fresh Marine Fish 124
Discussion on Elasticities for Total Fish Consumed With am Without Restriction •••••••• • •••• 142
Demarrl Proj ections for Total Fish Consumed
CHAPTER 5 SUMMARY, POLICY IMPLlCATIOOS AND �ATIONS
147
Review of Fishery Policy in Malaysia •••••••••••••••• 158
Policy Implications for Total Fish Consume:i •••••••• 165
Suggestions for Further Research . . . . . .. . ....... . .. 173
Summary and Conclusion ••••••••• . •••• . ••• . ••••• . •• . • • 174
BIBLIOGRAPHY •••••••••••••••••••••••••••••••••••••••••••• 178
APPENDICES ••••••••••••••••••••••••••••••••••••••••••••••• 187
v
LIsr OF APPENDICES
Page
A strategy in Fisheries Development • • • • • • • •• •• • • 187
B Proj ection Technique and Testing of The Existence of Eoonanetric Problems 190
C Restriction Analysis •• • • •• • • • • • • •• • •• • •• • •• • • • 195
D List of Species by Grades Used in the Analysis and Data on Popular Species • • • •• 200
E Data Used in the Analysis • • •• • • • • • • • •• • • • •• • •• 205
F Results of Quantity-Depeooent �el for Fish by Species, Grades and Total Fish •• •• • • •• • • 232
G Standard Statistical Classification of Malaysian Commercial Marine Fishes ••••••••• ••• 247
H Map of Peninsular Malaysia and Fisheries districts • • • •• • • •• • • •• • • •• • •• • •• •• • 250
I Derivation of Price-Depeooent M:rlel • •• • • • • • • • • • 253
J Identifications of Equations • • • •• • •• •• • • • •• • •• • 255
vi
Tables
1 .1
1 . 2
1 . 3
1 .4
1 . 5
1 . 6
LIST OF TABLES
Total am Per capita Consumption of Meat and Fish in Peninsular Malaysia ••••••••••••••••
Per Capita Consumption Per Day of Fish am Animal Protein in Peninsular Malaysia ••••••••••
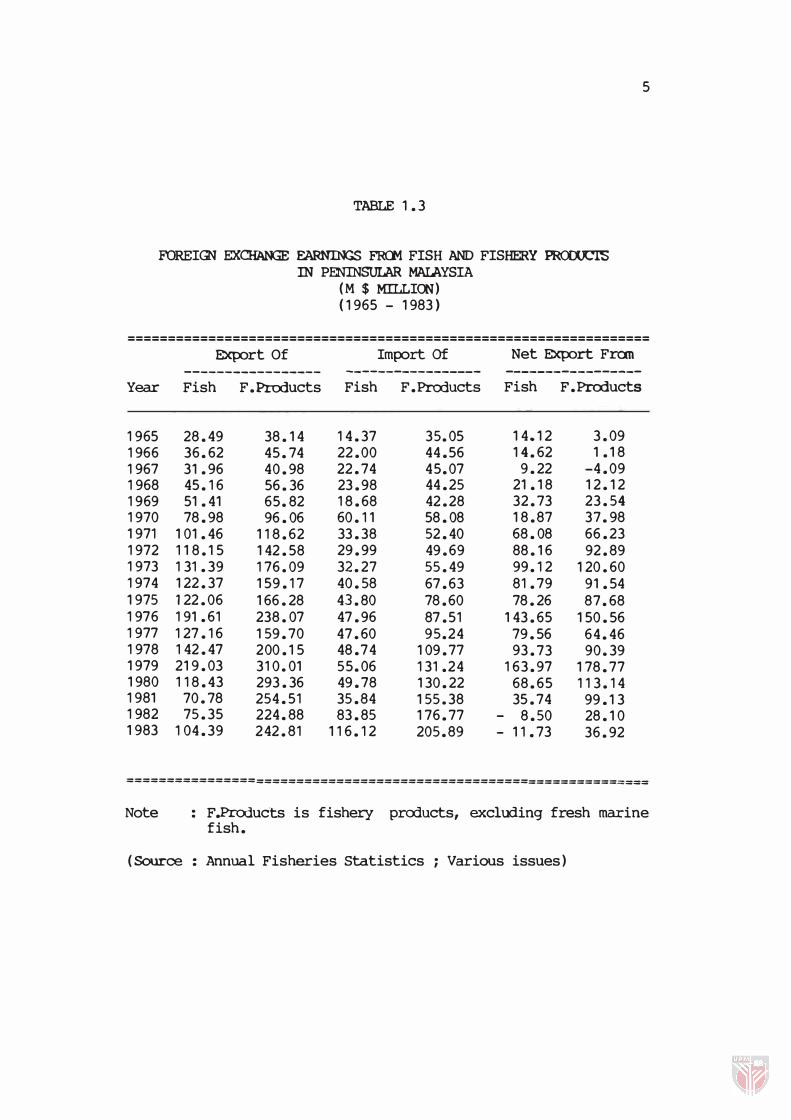
Foreign Exchange Earnings fran Fish and Fishery Products ••••••••••••••••••••••••••
Fish Trade in Peninsular Malaysia ••••••••••••••
Contribution of Fish and Fishery Products towards Gross Domestic Products •••••••••••••••
Contribution of Fishing Carmuni ty tcMards Agricultural Sector and Total labour Force
1 .7 The Status of Fisheries Resources in
Page
3
4
5
6
8
9
Peninsular Malaysia •••••••••••••••••••••••••••• 12
1 . 8 Fish Landed in Peninsular Malaysia ••••••••••••• 15
1 . 9 Landing of Fish by Gear Groups ••••••••••••••••• 16
1 .10 Fish Landed by States •••••••••••••••••••••••••• 22
1 .11 Numberof FishingBoats Licenced andin Operation in Peninsular Malaysia ••••••••••••••• 2 5
1 .12 Number of Fishing Boats Licenced and in Operation in West and East Coast ••••••••••••••• 26
1 • 13 Number of Fishing Gears Licenced and in Operation in Peninsular Malaysia ••••••••••••••• 28
2 .1 Expenditures on Fish and Meats a week ••••••••• 50
2 . 2 Demand Elasticity of Fresh Fish by Young ••••••• 66
4 . 1 Price Deperrlent fwtrlel for Spanish Mackerel Species (OLS �ch) •••••••••••••••••••••••• 98
vii
4.2 Price Deperrlent r.txlel for Spanish Mackerel
Page
Species (Cochrane-Orcutt Approach)............. 1 01
4.3 Price DeperXient r.txlel for Hardtail Scad Species (OLS Approach) •••••••••••••••••••••••• 103
4.4 Price Deperrlent r.txlel for Hardtail Scad Species (Cochrane-Orcutt Approach) ••••••••••••• 1 05
4.5 Price Deperrlent r.txlel for Chub Mackerel Species (OLS Approach) •••••••••••••••••••••••• 107
4 .6 Price Depeooent r-trlel for Chub Mackerel Species (Cochrane-Orcutt Approach) • • ••••••••••• 1 09
4.7 Price Deperrlent r.txlel for Grade One Fish using OLS approach ••••••••••••••••••••••••••• 111
4.8 Price Depeooent r-trlel for Grade One Fish using Cochrane-Orcutt Approach ••••••••••••••• 11 4
4.9 Price Depeooent �el for Grade 'IWo Fish using OLS approach ••••••• ••••••••••••••••••••• 118
4 • 1 0 Price Depeooent r.txlel for Grade 'IWo Fish using Cochrane-Orcutt Approach •••••••••••••••• 119
4. 11 Price Deperrlent r-trlel for Grade Three Fish using OLS approach ••••••••••••••••••••••••••• 121
4.12 Price Depeooent �el for Grade Three Fish using Cochrane-Orcutt Approach ••••••••••••••••• 1 23
4. 13 Price Depeooent r-trlel for Total Fish using OLS approach ••••••••••••••••••••••••••• 125.
4.1 4 Price Depeooent �el for Total Fish using Cochrane-Orcutt Approach •••••••••••••••• 127
4.15 Surmary of Statistical Results for Total Fish in Peninsular Malaysia using 2SLS ••••••••••••• 129
4.16 Summary of Statistical Results for Total Fish in Peninsular Malaysia using 2SLS • • • • • • • • • • • • • 130
4.17 Summary of Statistical Results for Total Fish in West Coast region using 2SLS • • • • • • • • • • • • • • • 133
viii
4.18 SUrrmary of Statistical Results for Total Fish
Page
in the East Ooast region using 2SLS ••••••••••• 1 35
4 .19 SUrrmary of statistical Results for Total Fish in Perak using 2SLS appvoach •••••••••••••••••• 138
4.20 SUrrmary of Statistical Results for Total Fish in Selangor using 2SLS appvoach • • • • • • • • • • • • • • • 1 39
4.21 Surmary of Statistical Results for Total Fish in Kelantan using 2SLS approach • • • • • • • • • • • • • • • 1 40
4.22 Summary of Statistical Results for Total Fish in Terengganu using 2SI.S approach •••••••••••••• 1 41
4.23 Value of Elasticities for Total Fish With and Without Restriction •••••••••••••••••• 144
4.24 Relationship Between Own Price Elasticity and Total Expenditure •••••••••••••••••••••••••• 146
4.25 Demand Proj ection for Total Fish using 2SI.S approach ••••••••••••••••••••••••••• 154
4.26 Demand Projection for Tbtal Fish using 2SI.S approach ••••••••••••••••••••••••••• 157
5.1 Fishenren's Subsidy Scheme in Peninsular Malaysia ••••••••••••••••••••••••••• 161
ix
LIST OF FIGURES
Figure Page
1.1 Landing of Marine Fish by Classification in the west Coast •••••••••••••••••••••••••••• 18
1.2 Landing of Marine Fish by Classification in the East Coast •••••••••••••••••••••••••••• 20
1.3 Average Price of Fresh Marine Fish • ••••••••••• 33
x

An abstract of the thesis presented to the Senate of Universiti Pertanian Malaysia in partial fulfilment of the requirements for the degree of Master of Science.
<naJMER DEltWID Fm FRESH MARINE FISH IN PENINSULAR MAIAYSIA
Supervisor Co-SUpervisor Faculty
By
Kamaruzzaman Am sarnah May 1987
Eddie Chiew F. Chong Roslan A Ghaffar, Ph. D Econcxnics and Mana gement
The general obje ctiv e o f the study was to examin e the
consumer demarrl for fresh marine fish in Peninsular Malaysia. In
particular, the study aimed at evaluating the important factors
in determining the demand for fish, estimating elasticity values,
as well as projecting the demarrl up to the year 2000.
Two models were used, a single equation and a simultaneous
equation. A sin gl e equ ation model was us ed in the demand
analysis o f fish by speci es and grades, whereas, the demand for
total fish was evaluated by the simultaneous equation demand
xi
mc:del. To estimate the empirical models , annual data from the
perioo of 1 950 to 1 984 was used.
A sir¥Jle equation which was in the form of price deperrlent
rocxlel was estimated by using Ordinary Least Squares (OLS) and
Cochrane-Orcutt iterative techniques, whereas, the simultaneous
rocxlel was estimated by Two Stage Least Squares (2SLS).
It was found that the important variables in the single
equation model were income per capita, average price index of
fish arrl meat, trem am quantity of fish consumed per capita.
The results suggest that fresh marine fish can be either
normal, i nferi or, subst itutes or complementary commodity
depending on the specific areas of the study. A simi lar
situation was observed with the own price elasticity of fresh
marine fish.
xii
Abstrak untuk tesis yang diserahkan kepada Senet Unversiti Pertanian Malaysia sebagai memenuhi sebahagian daripada keperluan bagi dianugerahkan Ijazah Sarjana Sains.
Penyelia Penyelia Bersama Fakulti
Oleh
Kamaruzzaman Abu Samah �i 1 987
Eddie Chiew F.Chong Roslan A Ghaffar, Ph. D Ekoncxni dan Pengurusan
Matlamat penyelidikan ialah untuk menganggar permintaan
pengguna terhadap ikan laut yang masi h segar di Semenanjung
Malaysia dengan mengambi l kira Pantai Barat, Timur dan negeri-
negeri Selangor, Perak, Kelantan dan Terengganu. Penyelidikan ini
juga akan menganalisa faktor-faktor yang menentukan permintaan
pengguna, menganggar keanjalan-keanjalan yang berkaitan ser ta
j umlah permintaan hingga ke tahun 2000.
Bagi mencapai matlamat-matlamat tersebut, data sekunder
( 1 950 - 1 984) digunakan agar dapat memberi keputusan-keputusan
empirikal bagi j angka masa panjang.
xiii

Angkubah-angkubah yang digunakan meliputi indek harga ikan
segar dan daging , pendapatan serta kuantiti per kapita dan cita
rasa pengguna. Irrleks harga 1980 digunakan dan ini menghapuskan
peranan inf lasi yang boleh menggugat keputusan empirika l yang
bakal didapati. Dua jenis merlel digunakan dan merlel-merlel ini
didalam bentuk persamaan satu fungsi dan persamaan serentak.
Persamaan satu fungsi digunakan bagi menganalisa permintaan ikan
berdasarkan gred dan jenis ikan , sementara persamaan serentak
untuk mengkaji permintaan pengguna terhadap keseluruhan ikan
segar di Semenanj ung Malaysia.
Bagi merlel persamaan satu fungsi ialah didalam bentuk harga
sebagai angkubah tidak bebas. Teknik OLS dan Cochrane-Orcutt
digunakan untuk menguji bagi mendapatkan keputusan-keputusan
empirikal, sementara mode l dida lam bentuk persamaan serentak
menggunakan teknik 2SIS bagi penyelesaian empirikal.
Keputusan empirika l menunjuk kan bahawa ikan segar boleh
dianggap sebagai barangan bawahan, biasa atau mewah, juga
barangan pengganti dan penggenap mengikut kawasan kajian. Begitu
juga halnya dengan keanjalan harga ikan-ikan segar tersebut.
xiv

IN'I'ROIXJCITON
Contributioos of Fisheries in the Rational &u-..,_
Fisheries play a significant role in Malaysia's economy as a
source of protein, foreign exchange earnings and employment. More
than 60 percent ( 1970-1984) of the edible fish landed are
marketed fresh and serves as a complement to rice, the main
staple food of the population (Nik Mustapha & Ghaffar, 1985).
It is also the cheapest animal protein. The diversity in types,
grades and availability in relative abundance in the markets at a
broad price range make fish available to all groups of
consumers irrespective of their income levels. In the year 1983,
the amount of fresh marine fish consumed was 353,471 metric
tonnes (Annual Fisheries Statistics, 1983) and 278,643 metric
tonnes in the case of meats (FAMA Commodity Bulletin, 1983). In
terms of average retail price, grade one fish fetched $6.85 per
kilogram,1 while the average price of meat, its substitute , was
$7.80 per kilogram.2
1. Computed from the average price of Silver and Chinese Pomfret (Pampus argentus arrl Pam� chinensis) and · Threadfin Species (Eleutheronema species arrl Polynemus species)
2. Computed from the average price of beef, mutton, chicken and pork (FAMA Commooity Bulletin, 1985).
1
2
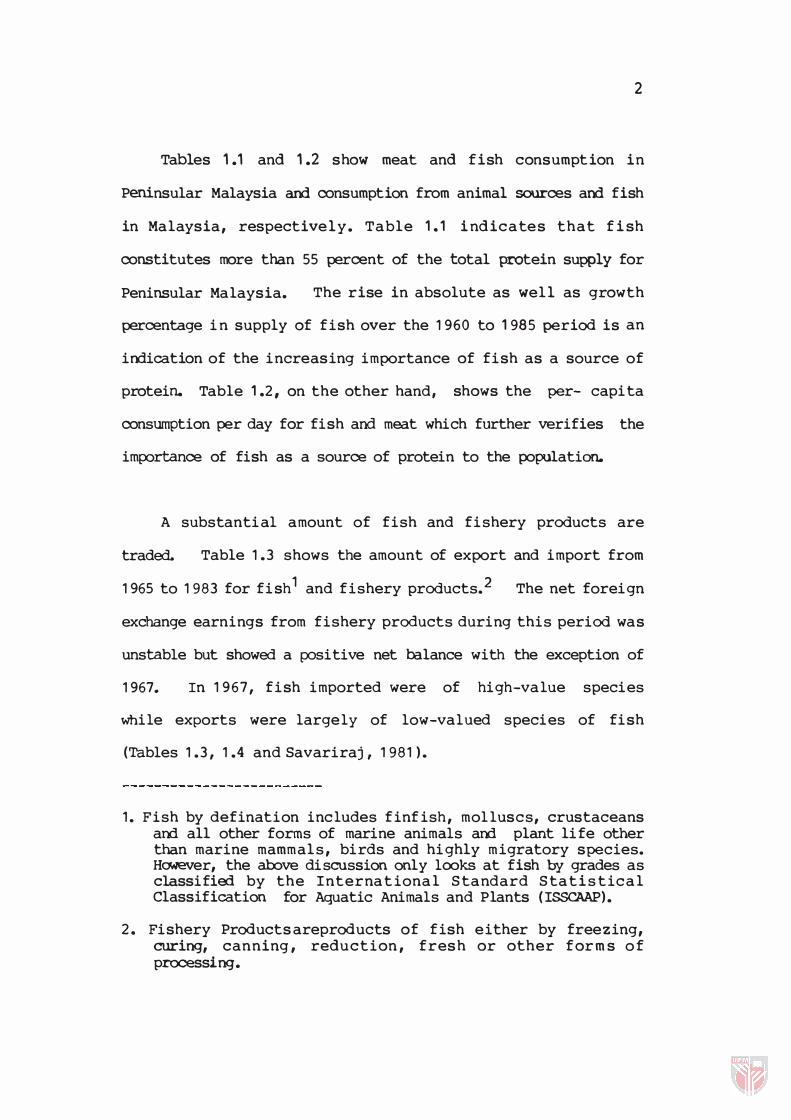
Tab les 1 .1 and 1 .2 show meat and fish c onsumption in
Peninsular Malaysia am consumption from animal sources and fish
in Malaysia, respectively. Table 1.1 i ndicate s that f i sh
constitutes more than 55 percent of the total �tein supp ly for
Peninsular Malaysia. The rise in absolute as wel l as growth
percentage in supply of fish over the 1 960 to 1985 period is an
indication of the increasing importance of fish as a source of
protein. Table 1.2, on the other hand, sh ows the per- capita
consumption per day for fish and meat which further verifies the
importance of fish as a source of protein to the population.
A substantial amount of fish and fishery products are
traded. Table 1 .3 shows the amount of export and import from
1 965 to 1 983 for fish1 and fishery products.2 The net foreign
exchange earnings from fishery products during this period was
unstable but showed a positive net balance with the exception of
1 967. In 1 967, fish imported were of high-value species
while exports were largely of low-valued species of fish
(Tables 1 .3, 1 .4 and Savariraj, 1 981 ) .
1 . Fish by defination includes finf ish, mol luscs, crustaceans am all other forms of marine animals am plant life other than marine mammals, birds and highly migratory species. HCMever, the above discussion only looks at fish by grades as classified by the Internationa l S tandard S tatistica l Classification for Aquatic Animals and Plants ( I SSCAAP) .
2 . Fishery Productsareproducts o f fish either by freezing, curing, canning , reduction , fresh or other f or m s o f processing.
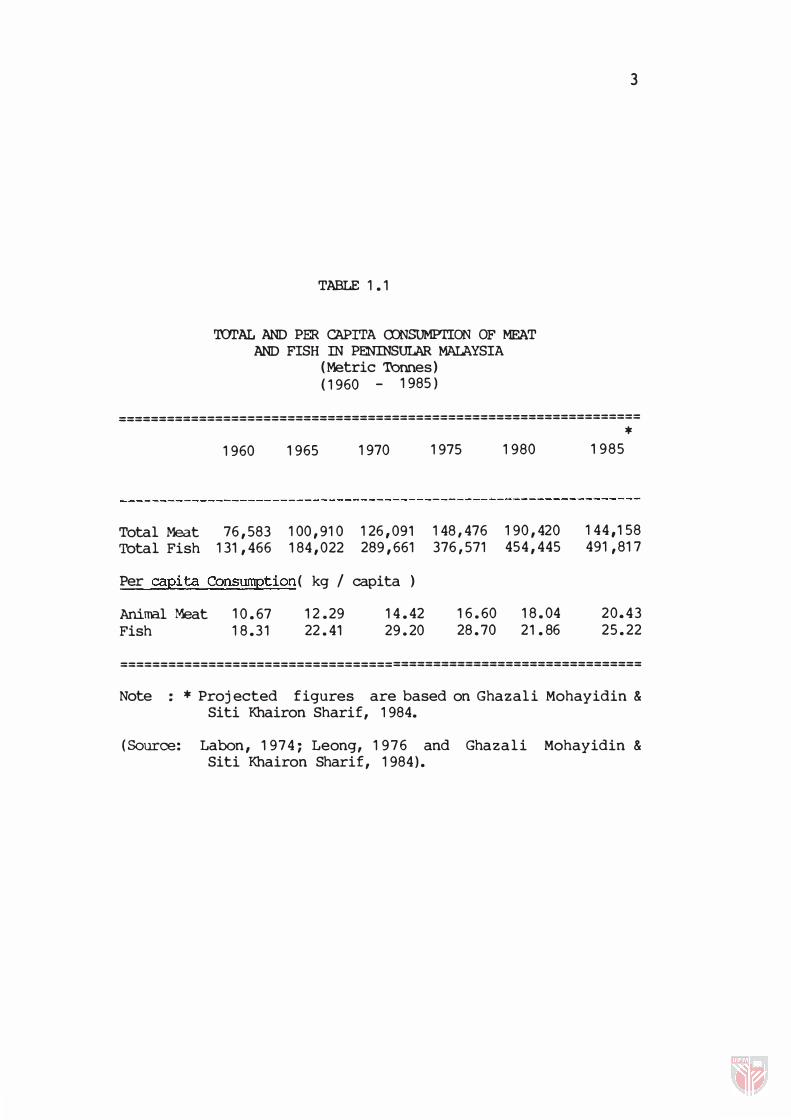
TABLE 1 .1
'IDI'AL AND PER CAPITA CX>NSUMPl'ION OF MEAT AND FISH IN PENINSULAR MALAYSIA
( Metric Tonnes) ( 1960 - 1 985 )
3
================================================================= *
1960 1965 1970 1975 1980 1985
Total Meat 76,583 100,910 126,091 148,476 190,420 144,158 Total Fish 131,466 184,022 289,661 376,571 454,445 491,817
Per capita Consumetion ( kg / capita )
Animal Meat 10 .67 12.29 14 .42 16.60 18 .04 20.43 Fish 18 .31 22.41 29.20 28.70 21 . 86 25 . 22
=================================================================
Note : * Proj ected figures are based on Ghazali Mohayidin & Siti Khairon Sharif, 1984.
(Source: Labon, 1974; Leong, 1976 and Ghazali Mohayidin & Siti Khairon Sharif, 1984).
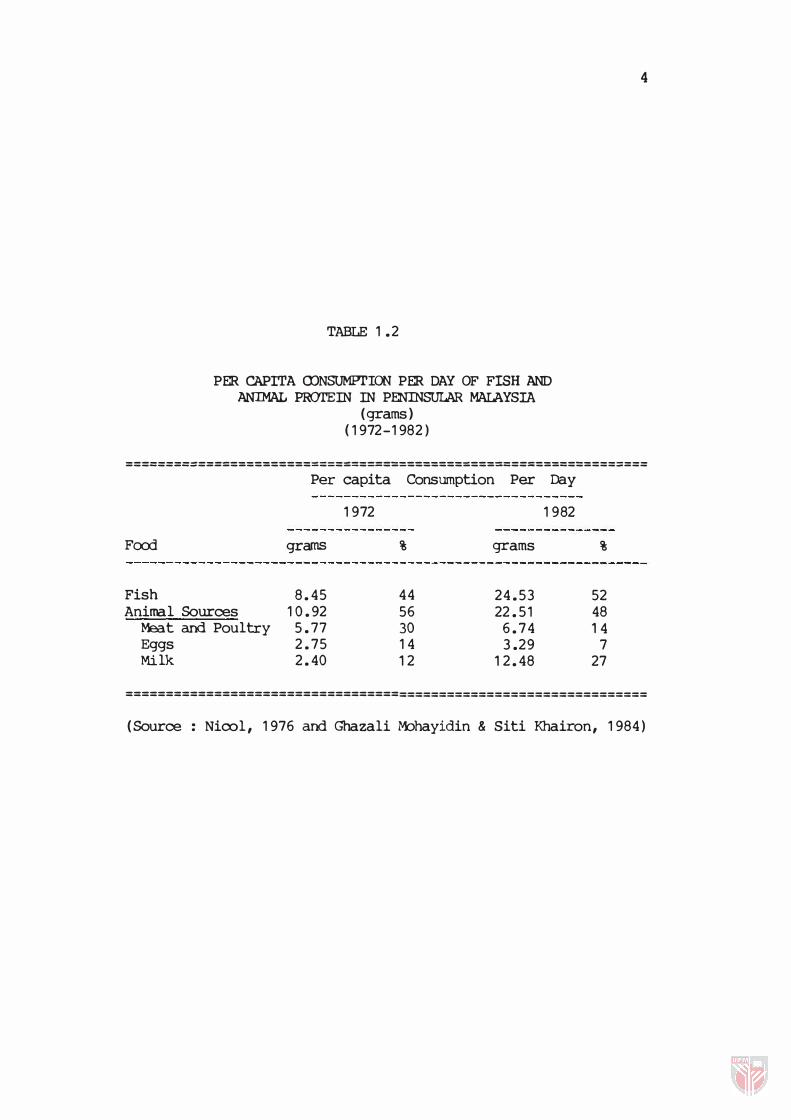
TABLE 1.2
PER CAPITA (J)NSUMPI'ION PER DAY OF FISH AND ANIMAL PROTEIN IN PENINSULAR MAIAYSIA
( grams) ( 1972-1982 )
4
----------------------------------------------------------------------------------------------------------------------------------
Fcx:rl
Fish Animal Sources
�t and Poultry Eggs Milk
Per capita Consumption Per Day
grams
8.45 10.92
5.77 2.75 2.40
1972
%
44 56 30 14 12
grams
24.53 22.51
6.74 3.29
12.48
1982
%
52 48 14
7 27
=================================================================
( Source : Nicol, 1976 and Ghazali Mohayidin & Siti Khairon, 1984)
5
TABLE 1 . 3
FOREIGN EX� � FRCM FISH AND FISHERY PRaX.CI'S m PENINSUIAR MAIAYSIA
( M $ MILLIOO ) ( 1 965 - 1 983 )
=================================================================
Exp:>rt Of Import Of Net Exp:>rt Fran ----------------- ----------------- -----------------
Year Fish F.Products Fish F.Prcx:1ucts Fish F.Products
1 965 28 . 49 38 . 1 4 1 4 . 37 35.05 1 4. 1 2 3 .09 1 966 36 . 62 45 . 74 22 .00 44 .56 1 4 . 62 1 . 1 8 1 967 31 . 96 40 . 98 22 . 74 45.07 9 . 22 -4 .0 9 1 968 45 . 1 6 56 . 36 23 . 98 44 .25 21 . 1 8 1 2 . 1 2 1 969 51 . 41 65. 82 1 8 . 68 42 .28 32 . 73 23 . 54 1 970 78 . 98 96 .06 60 . 1 1 58 .08 1 8 .87 37 . 98 1 971 1 0 1 . 46 1 1 8 . 62 33 . 38 52 . 40 68 .08 66 . 23 1 972 1 1 8 . 1 5 1 42 . 58 29 . 99 49 . 69 88 . 1 6 92 . 89 1 973 1 31 . 39 1 76 .09 32 . 27 55 . 49 99 . 1 2 1 20 . 60 1 974 1 22 . 37 1 59 . 1 7 40 . 58 67 . 63 81 . 79 91 . 54 1 975 1 22 .0 6 1 66 . 28 43 . 80 78 . 60 78 . 26 87 . 68 1 976 1 91 . 61 238 .07 47 . 96 87 .51 1 43 . 65 1 50 . 56 1 977 1 27 . 1 6 1 59 . 70 47 . 60 95.24 79 . 56 64 . 46 1 978 1 42 . 47 200 . 1 5 48 .74 109 .77 93 . 73 90 . 39 1 979 21 9 .03 310 .01 55.06 1 31 .24 1 63 . 97 1 78 . 77 1 980 1 1 8 . 43 293 . 36 49 . 78 1 30 . 22 68 . 65 1 1 3 . 1 4 1 981 70 . 78 254 . 51 35 .84 1 55 . 38 35 . 74 99 . 1 3 1 982 75 . 35 224 . 88 83 . 85 1 76 . 77 - 8 . 50 28 . 10 1 983 1 0 4 . 39 242 . 81 1 1 6 . 1 2 20 5 . 89 - 1 1 . 73 36 . 92
=============================================================�===
Note : F.Products is fishery prooucts, excluding fresh marine fish.
(Source : Annual Fisheries Statistics ; Various issues )
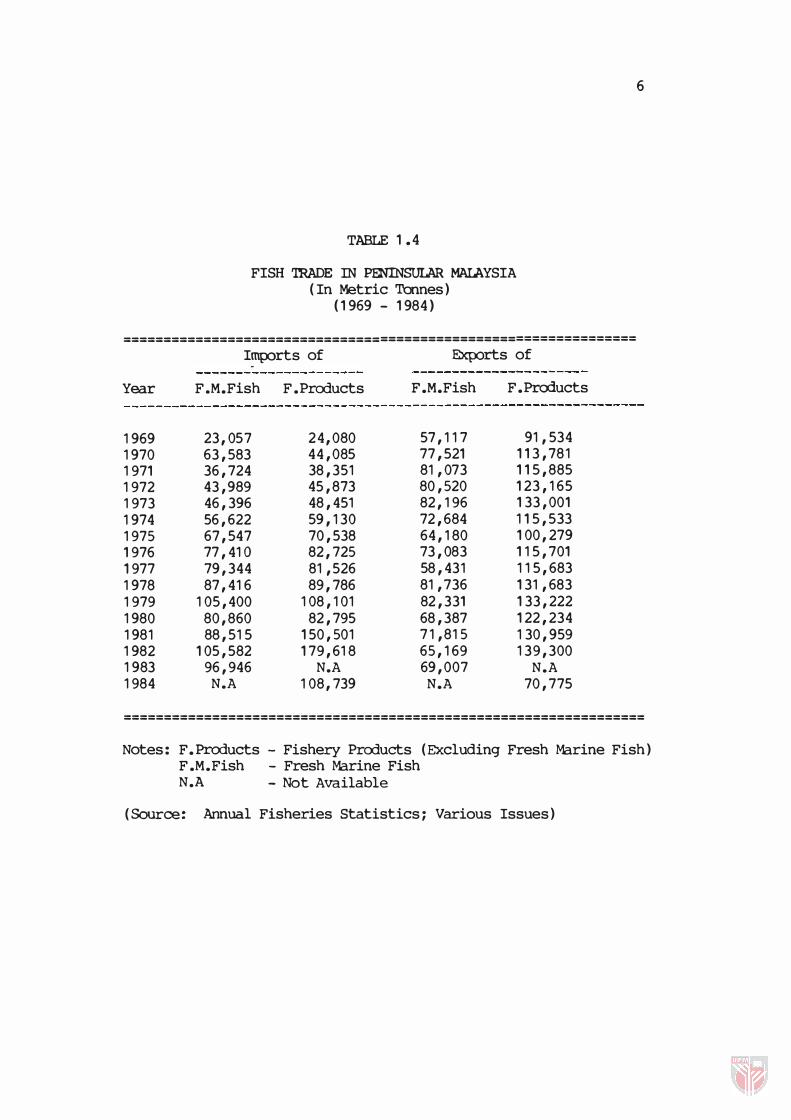
TABLE 1 . 4
FISH 'mADE IN PENINSULAR MAIAYSIA ( In Metric Tonnes )
( 1 969 - 1 984 )
================================================================
Imports of Elqxlrts of
Year F.M.Fish F .Products F.M.Fish F.Products
1 969 23 ,057 24 ,080 57 , 1 1 7 91 , 534 1 970 63 , 583 44 ,085 77 , 521 1 1 3 , 781 1 971 36 , 724 38 , 351 81 ,073 1 1 5 , 885 1 972 43 , 989 45 , 873 80 , 520 1 23 , 1 65 1 973 46 , 396 48 , 451 82 , 1 96 1 33 ,00 1 1 974 56 , 622 59 , 1 30 72 , 684 1 1 5 , 533 1 975 67 , 547 70 , 538 64 , 1 80 100 , 279 1 976 77 , 41 ° 82 , 725 73 ,083 1 1 5 , 701 1 977 79 , 344 81 , 526 58 , 431 1 1 5 , 683 1 978 87 , 41 6 89 , 786 81 , 736 1 31 , 683 1 979 10 5 , 400 108 , 10 1 82 , 331 1 33 , 222 1 980 80 , 860 82 , 795 68 , 387 1 22 , 234 1 981 88 , 51 5 1 50 , 50 1 7 1 ,81 5 1 30 , 959 1 982 105 , 582 1 79 , 61 8 65 , 1 69 1 39 , 300 1 983 96 , 946 N.A 69 ,00 7 N.A 1 984 N.A 108 , 739 N.A 70 , 775
6
=================================================================
Notes : F. Products - Fishery Products (Excluding Fresh Marine Fish ) F .M.Fish - Fresh Marine Fish N.A - Not Available
(Source: Annual Fisheries statistics ; Various Issues )
7
In the case of fresh marine fish, the net export earnings are
posi ti ve except in the year 1 982 onwards when earnings started to
decline and became negative in value. The reasons for the
decline in the net export earnings were due to the increase in
demand, a decline in total per capita prcrluction and an increase
in the cost of prcrluction (Nik Mustapha & Ghaffar, 1 985).
The contribution of fisheries towards the National Gross
Danestic Product i s shown i n Table 1 . 5 . In 1 9 8 3 , the
Agricultural Sector contributed 22.0 2 percent ($ 6 , 92 2 million)
of Gross Domestic Products ($ 31 , 4 4 2 ) and from this 22.0 2
percent, fisheries contributed 4.1 4 percent ( $ 1 , 30 3 million ) .
External trade earnings contributed 0 .1 2 percent ( $ 36.92
million) in terms of fishery products and a negative balance in
terms of fresh marine fis�
The Fisheries sector is an imPJrtant source of employment.
In 1 98 3 , approximately 76 ,000 people were employed and this
represented 3.92 percent and 1 .4 5 percent contribution to the
agricultural labour force and total labour force in the country,
respectively ( Annual Fi shery Stati stics , 1 9 8 3 ) . The
contribution of the fishing community (fishermen) towards total
labour force and labour force in the agricultural sector is
shcMn in Table 1 . 6.
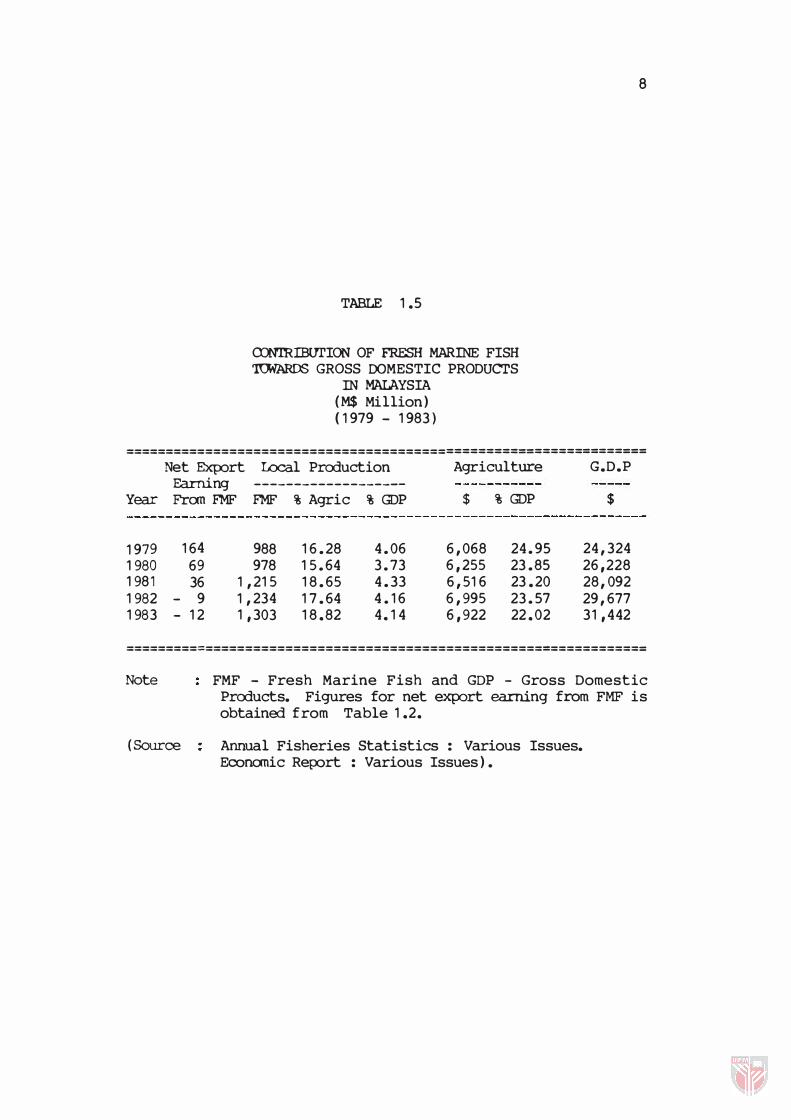
TABLE 1.5
<XNIRIBUl'ION OF FRESH MARINE FISH 'ItMARDS GROSS OOMESTIC PRODUCTS
IN MALAYSIA (M$ Million) ( 1 979 - 1 983)
8
=================================================================
Net Export Local Production Agricul ture G.D.P Earning -------------------
Year Fran FMF FMF % Agric % GDP $ % GDP $
1 979 1 64 1980 69 1981 36 1982 - 9 1983 - 1 2
988 978
1 , 21 5 1 , 234 1,30 3
1 6 . 28 1 5 . 64 1 8 . 65 1 7 . 64 1 8. 82
4 .0 6 3 . 73 4 . 33 4 . 1 6 4. 1 4
6 ,0 68 6,255 6 , 51 6 6 ,995 6,9 22
24 . 95 23 .85 23. 20 23 . 57 22.0 2
24 , 324 26,228 28 ,092 29 , 677 31,442
=================================================================
Note
(Source
FMF - Fresh Marine Fish and GDP - Gross Domestic Products. Figures for net export earning from FMF is obtained from Table 1.2.
Annual Fisheries Statistics : Various Issues. Economic Report : Various Issues ) .