
UNIVERSITI PUTRA MALAYSIA COMPARATIVE …psasir.upm.edu.my/10543/1/FP_2001_3_A.pdf · comparative...
25
UNIVERSITI PUTRA MALAYSIA COMPARATIVE ANALYSIS OF FORECASTING PERFORMANCE : CRUDE PALM OIL FUTURES (CPO) PRICES VS EXPERT OPINIONS ABDULLAHI FARAH AHMED FP 2001 3
Transcript of UNIVERSITI PUTRA MALAYSIA COMPARATIVE …psasir.upm.edu.my/10543/1/FP_2001_3_A.pdf · comparative...
UNIVERSITI PUTRA MALAYSIA
COMPARATIVE ANALYSIS OF FORECASTING PERFORMANCE : CRUDE PALM OIL FUTURES (CPO) PRICES
VS EXPERT OPINIONS
ABDULLAHI FARAH AHMED
FP 2001 3

COMPARATIVE ANALYSIS OF FORECASTING PERFORMANCE: CRUDE PALM OIL FUTURES (CPO) PRICES
VS EXPERT OPINIONS
By
ABDULLAHI FARAH AHMED
Thesis Submitted in Fulfilment of the Requirement for the Degree of Master of Science in the Faculty of Agriculture
U niveniti Putra Malaysia
July 2001
DEDICATED TO
MY BELOVED PARENTS, FARAH AND A WRALA
ii
Abstract of thesis submitted to the Senate ofUniversiti Putra Malaysia in fulfilment of the requirement for the degree of Master Science
COMPARATIVE ANALYSIS OF FORECASTING PERFORMANCE: CRUDE PALM OIL FUTURES (CPO) PRICES VS EXPERT OPINIONS
By
ABDULLAHI F ARAB AHMED
July 2001
Chairperson: Ismail Abd Latif
Faculty: Agriculture
The main economic functions of the futures market are to provide price discovery and
risk management facilities. It is well known that the futures market can function well
only when the futures prices provide accurate price forecast to subsequent cash prices.
The greater the degree of price forecast accuracy, the greater the effectiveness of the
futures market in terms of performing its economic functions. If the market is not
efficient, effective transmission of information from one market to another will be
impaired, thus the value of the futures market in price discovery and hedging.
The creation of the crude palm oil (CPO) futures market in Malaysia was to fulfil the
need for an efficient pricing and hedging mechanism for Malaysia's palm oil.
Therefore, the extent to which CPO futures market has served as an efficient center of
price discovery and risk management, has been the focus of considerable research. In
general, debate has centered around the extent of which futures market provide price
leadership to cash market and the ability of futures market to predict subsequent spot
iii

debate has centered around the extent of which futures market provide price leadership
to cash market and the ability of futures market to predict subsequent spot price in
accurate way. Empirical evidence has shown that CPO futures prices performed
relatively better compared to other forecasting models. However, no comparison is made
in forecast accuracy of CPO futures with expert opinion. This approach is unique in the
sense that it examines the relative efficiency of ex ante forecasts rather then ex post.
The objectives of this study are: firstly, to evaluate the forecast accuracy of the CPO
futures market relative to expert prediction. Secondly, to test the relationship between
the futures, forward and cash prices, to examine whether these price series have the
same properties and relationship in the long-run.
AGS and the Johansen's cointegrations techniques were used to analyze the forecast
accuracy and log-run relationship over, 1st, tld, 3rd and 4th month spreads offutures and
forward prices. The analyzed sample data consists of the daily end-of-month trading
prices of the futures, cash, and forward prices for the period from January 1989 to
December 1999.
The findings of this study suggested that the forward forecast accuracy price was
superior to the futures. It implies that the forward prices which represent expert
prediction of cash price, contain more information for price discovery than CPO futures
prices in the one month and two months horizons. This finding indicated that the CPO of
futures market is relatively less efficient. Hence, the use of futures prices for short-term
price forecasting may be more biased than relying on expert forecasts.
IV

Furthennore, it was found that the futures and cash prices were-emntegtated lOr up to
two months spread. Similarly forward and cash prices were also cointegrated for up to
two months into the future. This suggests that futures and forward prices can be used
to predict subsequent spot price up to two month in advance. It was also detected that
an error correction mechanism exists which brought cash and futures price into
equilibrium whenever they diverged. The evidence also points to the dependence of
cash market on futures markets for price leadership.
v
Abstrak tesis yang dikemukakan kepada Senat Universiti Putra Malaysia sebagai memenuhi keperluan untuk ijazah Master Sains
KETEPATAN RAMALAN HARGA: HARGA NIGA HADPAN MINYAK SA WIT MENTAH (MSM) VS RAMALAN PAKAR
Oleb
ABDULLAHI FARAH AHMED
Julai 2001
Pengerusi: Ismail Abd. Latif
Fakulti: Pertanian
Fungsi ekonomi utama pasaran niaga hadapan adalah untuk menyediakan kemudahan
penemuan harga dan pengurusan risko. Pasaran niaga hadapan akan dapat berfungsi
dengan baik apabila harga niaga hadapan memberi ramalan yang tepat keatas harga tunai
yang berikutnya. Lebih tinggi ketepatan harga niaga hadapan meramal, maka lebih
tinggi keberkesanan pasaran ini melaksanakan fungsinya. Pasaran yang tidak cekap akan
menjejaskan aliran licin maklumat dari satu pasaran kepada pasaran yang lian; lantas
melemahkan fungsi pasaran niaga hadapan dalam melaksanakan fungsi lindung nilai dan
pengurusan risko.
Pewujudan pasaran niaga hadapan Minyak Sawit Mentah (MSM) bertujuan untuk
memenuhi keperluan mekanisme letak harga dan lindung nilai yang cekap untuk industri
kelapa sawit Malaysia. Maka isu ini iaitu sejauh mana pasaran ini berfungsi sebagai
pusat penemuan harga dan pengurusan telah menjadi fokus kepada beberapa
penyelidikan. Secara umum, debat tentang isu ini menjurus kepada sejauhmana pasaran
VI
niaga hadapan berlaku sebagai ketua harga kepada pasaran tunai dan keupayaannya
meramal harga tunai yang berikutnya dengan tepat. Bukti empirik menunjukkan bahawa
harga niaga hadapan MSM boleh meramal dengan baik berbanding dengan model
unjuran. Namun, masih belum ada perbandingan dibuat tetang ketepatan unjuran niaga
hadapan dengan ramalan pakar. Perbandingan antara dua kaedah ini adalah unik kerana
keduanya membandingkan kecekapan relatif unjuran ex ante dan tidak ex post.
Objektif kajian ini adalah: pertama� untuk menilai ketepatan ramalan pasaran niga
hadapan MSM berbanding dengan ramalan pakar. Kedua� untuk menguji perkaitan
antara harga niaga hadapan, hadapan dan tunai. Ketiga� untuk meneliti sarna ada siri-siri
ini menampilkan tabii dan perkaitan yang sarna dalarn jangka rnasa panjang.
Kajian ini menggunakan ujian AGS yang dipelopori oleh Ashley, Granger dan
Schmalensee (AGS) untuk menguji perhubungan jangka masa panjang bagi jeda antara
harga niaga hadapan dan hadapan bagi bulan pertama, kedua, tiga dan keempat. Data
yang dianalisis adalah data harian bagi harga niaga dihujung bulan bagi niaga hadapan,
hadapan dan tunai untuk jangka waktu Januari 1989 hingga Disember 1999.
Kajian mendapati bukti yang bererti yang menyokong kepada hujah bahawa ramalan
hadapan adalah lebih baik daripada niaga hadapan. Ini menyarankan bahawa harga
hadapan yang juga mewakili ramalan pakar keatas harga tunai mengandungi lebih
maklumat untuk membantu penemuan harga dibandingkan dengan harga niaga hadapan
terutama bagi bulan pertama dan kedua. Penemuan ini mencadangkan bahawa pasaran
niaga hadapan MSM adalah tidak secekap dibandingkan dengan harga hadapan. Maka,
VII
penggunaan harga naiga hadapan dalam jangka masa pendek mungkin bias berbanding
dengan ramalan pakar. Lagipun, didapati bahawa harga niaga hadapan dan tunai
berkointegrasi sehingga jeda dua bulan. Harga hadapan dan tunai juga berkointegrasi
sehingga dua bulan kehadapan. Ini mencadangkan bahawa harga niaga hadapan dan
hadapan boleh digunakan untuk meramal harga spot yang berikutnya dua bulan lebih
awal. Kajian mendapati bahawa mekanisme pembetulan ralat wujud yang membawa
harga niaga hadapan dan tunai kedalam keseimbangan apabila keduanya tidak selari.
Penemuan kajian juga menunjukkan kepada pergantungan pasaran tunai kepada niaga
hadapan untuk ketua harga.
Vlll
ACKNOWLEDGEMENTS
Thanks to the God "Allah S.W.T' without whose blessing, this study would not have
been possible. Also, this study would not have been conceivable without the advice,
contribution and moral support of several individuals and institutions.
I wish to express my gratitude to my supervisory committee; Chairperson Mr. Ismail
Abdi Latif, who initiated my interest in the present topic and for his guidance,
suggestions and support throughout the preparation of this thesis. Prof. Dr Mad Nasir
Shamsudin his precious advice, guidance helped improving this thesis. Prof. Dr. Fatimah
Mohd. Arshad who was ever helpful and whose constructive criticisms and suggestions
helped me in the completion of the thesis. For her, I learnt to be independent and to
think analytically.
I also wish to express my gratitude to Islamic Development Bank in Jeddah, for without
their financial support I can never afford in pursuing this noble exercise. I am aware of
the Muslim's money being spent on me and I hope to repay by helping other Muslims
the services needed, to the best of my capability. The services provide by the Office of
Scholarship in administering all the financial transactions necessary is commended. I am
also indebted to members of the Faculty of Economics and Management, UPM Library
and Faculty of Agriculture at Universiti Putra Malaysia who rendered assistance at
various stages of this study. My appreciation is also extended to all my friends especially
ix

Samira V. Hassan who helped me in English editing, and my fellow graduate students
who rendered their help in one way or another toward the completion of my research.
Last, but not least, to my father and mother, I pray Allah to give them blessings and
protection. I can never thank them enough for the sacrifices they make in laying the
foundation during the early stages of my life and I know of their constant pray for my
continues safety that brought me to where I am today. My deepest gratitude to my other
family members, relatives and friends who has been very supportive and understanding
throughout my years in Malaysia. I would like to record my appreciation for their
sacrifices and love.
x
I certify that an Examination Committee met on 20th July 2001 to conduct the final examination of Abdullahi Farah Ahmed on his Master of Science thesis entitled "Comparative Analysis of Forecasting Performance: Crude Palm Oil Futures Price vs Expert Opinion" in accordance with Universiti Pertanian Malaysia (High Degree) Act 1980 and Universiti Pertanian Malaysia (High Degree) Regulations 198 1 . The Committee recommends that the candidate be awarded the relevant degree. Members of the Examination Committee are as follows:
MOHD MANSOR ISMAIL, Ph.D. Lecturer Faculty of Agriculture, Universiti Putra Malaysia (Chairman)
ISMAIL ABD LATIF, M.S. Lecturer Faculty of Agriculture, Universiti Putra Malaysia (Member)
MAD NASIR SBAMSUDIN, Ph.D. Professor Faculty of Agriculture Universiti Putra Malaysia (Member)
FATIMAH MOHD ARSHAD, Ph.D. Professor Faculty of Economics and Management Universiti Putra Malaysia (Member)
MOH�OHAYIDIN. Ph.D. Professor/ Deputy Dean of Graduate School Universiti Putra Malaysia
Date: _.. Z 2 AUG 2001
Xl

This thesis submitted to the Senate of University Putra Malaysia has been accepted as fulfilment of the requirement for the degree of Master of Science.
AINI IDERIS, Ph.D. Professor Dean of Graduate School Universiti Putra Malaysia
Date: 0 8 NOV 2001
xu
DECLARATION
I hereby declare that the thesis is based on my original work except for quotations and citations, which have been duly acknowledge. I also declare that it has not been previously or concurrently submitted for any other degree at UPM or other institutions.
Date: 2 1 /08/ 2001
xiii

TABLE OF CONTENTS
Page DEDICATION 11 ABSTRACT III ABSTRAK VI ACKNOWLEDGEMENTS IX APPROVAL Xl DECLARATION Xlll LIST OF TABLES xv LIST OF FIGURES XVll LIST OF ABBREVIATIONS XVlll
CHAPTER
1 INTRODUCTION l. 1 Malaysian Palm Oil Sector l. 1
l.l. 1 Introduction l. 1 1 . 1 .2 Production l. 1 l.l.3 Processing l.9 l.l.4 Trade of Palm oil l. 12 l. 1 . 5 Price of Palm Oil l. 1 5
l.2 Role and Performance of COMMEX 1 .23 1 .2. 1 Historical Background 1 .23 1 .2.2 Functions and Importance of COMMEX Malaysia l.28
l.3 Problem Statements 1 .3 1 l.4 Objectives of Study 1 .34 1 .5 Significance of Study l.35 l.6 Structure of the Study 1 .35
2 LITERATURE REVIEW 2. 1 2. 1 Fundamental and Technical Forecast Approaches 2. 1
2. 1 . 1 The Fundamental Forecast Approach 2. 1 2.l.2 The Technical Forecast Approach 2.3
2.2 Forecast Efficiency of CPO Futures Price 2.4 2.3 Palm Oil Price Forecasting by Econometric and Time-series
Models 2.5 2.4 Forecast Accuracy and Efficiency of Commodity Futures
Markets 2.6 2.4. 1 Forecast Accuracy between Commodity Futures and
Expect predictions 2.7 2.4.2 Commodity Futures Price and Cointegration Analysis 2. 1 1
3 METHODOLOGY 3. 1 3 . 1 Evaluation of Forecast Accuracy: Conceptual Framework 3 . 1
3.1.1 Descriptive Analysis for Forecast Accuracy 3.3 3.1.2 Statistical Measure of Forecast Accuracy 3.8
3.2 Time -Series Properties of the Data 3.1 1
xiv

3.2. 1 Cointegration 3 . 12 3.2.2 The Granger Causality Test 3.23 3.2.3 Error Correction Model Test 3.25
3.3 Data 3.27
4 RESULTS AND DISCUSSION 4. 1 4. 1 Time-Series Properties of the Data 4. 1
4.l. 1 Test of Stationarity 4.1 4. 1 .2 Cointegration Test 4.8 4.l.3 Granger Causality Test 4 . 12 4. 1.4 Test of Error Correction Model 4. 14
4.2 Evaluation of Forecast Accuracy 4. 17 4.2. 1 Descriptive Analysis 4. 17 4.2.2 Result of AGS test 4.22
5 SUMMARY AND CONCLUSIONS 5 . 1 5. 1 Background of the Study 5. 1 5.2 Methodology 5.3 5.3 Findings 5.5 5 .4 Policy Implications 5.7 5 .5 Limitations of the Study 5.8 5.6 Conclusions 5.9
REFERENCES R.l BIODATA OF THE AUTHOR B. 1
xv
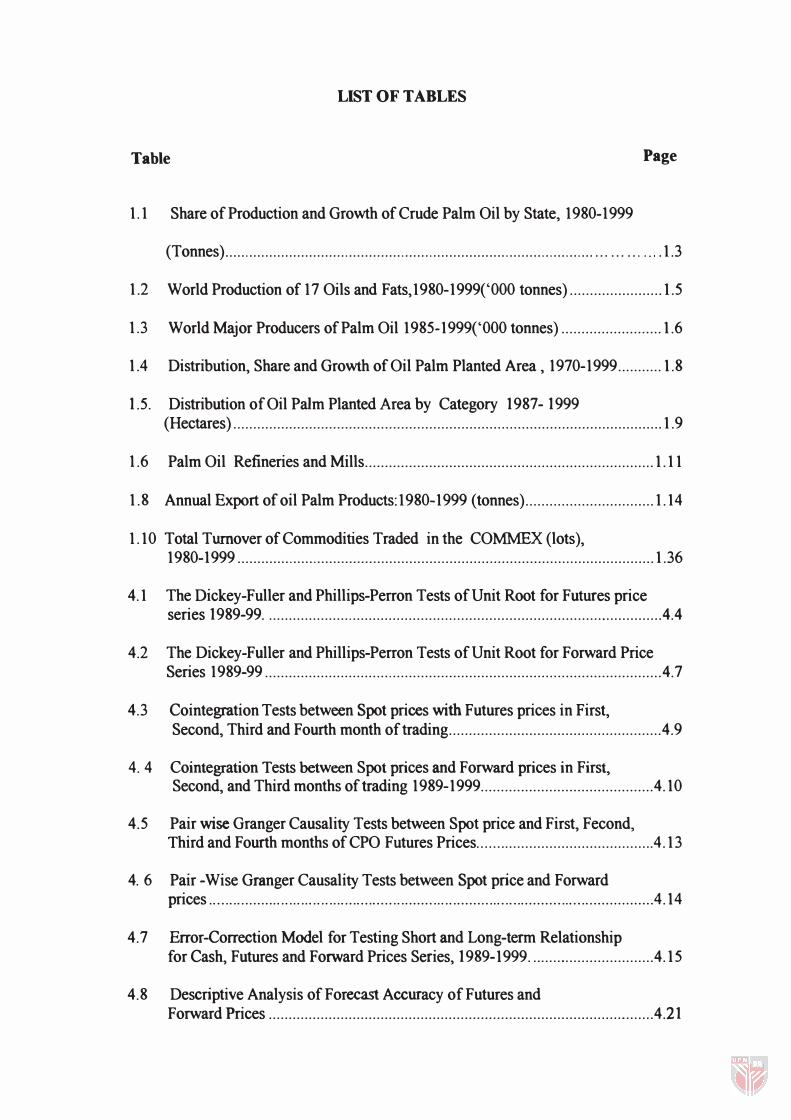
LIST OF TABLES
Table Page
1. 1 Share of Production and Growth of Crude Palm Oil by State, 1980-1999
(Tonnes) ............................................................................................ ... ... ... '" .1.3
1.2 World Production of 17 Oils and Fats,1980-1999('000 tonnes) ....................... 1.5
1.3 World Major Producers of Palm Oil 1985-1999('000 tonnes) ......................... 1.6
1.4 Distribution, Share and Growth of Oil Palm Planted Area , 1970-1999 ........... 1.8
1.5. Distribution of Oil Palm Planted Area by Category 1987- 1999 (Hectares) ........................................................................................................... 1.9
1.6 Palm Oil Refineries and Mills ........................................................................ 1.11
1. 8 Annual Export of oil Palm Products: 1980-1999 (tonnes) ................................ 1.14
1.10 Total Turnover of Commodities Traded in the COMMEX (lots), 1980-1999 ........................................................................................................ 1.36
4.1 The Dickey-Fuller and Phillips-Perron Tests of Unit Root for Futures price series 1989-99 . .................................................................................................. 4.4
4.2 The Dickey-Fuller and Phillips-Perron Tests of Unit Root for Forward Price Series 1989-99 ................................................................................................... 4.7
4.3 Cointegration Tests between Spot prices with Futures prices in First, Second, Third and Fourth month of trading .................................................... .4.9
4. 4 Cointegration Tests between Spot prices and Forward prices in First, Second, and Third months of trading 1989-1999 .......................................... .4.1 0
4.5 Pair wise Granger Causality Tests between Spot price and First, Fecond, Third and Fourth months of CPO Futures Prices ........................................... .4.13
4. 6 Pair -Wise Granger Causality Tests between Spot price and Forward prices ......... .. ...... . . . . . . . . . . . . . . . ... .......... ........................ ........................... ............... 4.14
4.7 Error-Correction Model for Testing Short and Long-term Relationship for Cash, Futures and Forward Prices Series, 1989-1999 . ............................. .4.15
4.8 Descriptive Analysis of Forecast Accuracy of Futures and Forward Prices ................................................................................................ 4.21

4.9 AGS test result for CPO Futures and Forward Prices, 1989-1999 . ................ .4.23
LIST OF FIGURES
Figure Page
1.1 Annual Average Price of Selected Vegetable Oils, 1975-1999 1.16
1.2 Annual Average Price of Palm oil and Soybean Oils, 1975-1999 1.18
1.3 Average Monthly Price of Crude Palm Oil, 1993-1999 1.20
4.1 Forecast Errors of One-month ahead for Futures and Forward Prices 4.17
4.2 Forecast Errors of Two-month spread for Futures and Forward Prices 4.18
xviii
AGS
ARIMA
COMMEX
LIFFE
MARMA
ML
MPOB
PORIM
PORLA
U
VAR
FELDA
FELCRA
CPO
RISDA
LIST OF ABBREVIATIONS
=Ashley, Granger and Schmalensee
= Autoregressive Integrated Moving Average
=Commodity and Monetary Exchange
= London International Financial Future Exchange
= Multivariated-autoregressive Moving Average
= Maximum-likelihood
=Malaysian Palm Oil Board
=Palm Oil Research Institute of Malaysia
=Palm Oil Registration and Licensing Authority
=Theil's Inequality Coefficient
=Vector Autoregressive
=Fedaral Land Development Authority
=Federalland Consolidation and Rehabilitation Authority
=Crude Palm Oil
=Rubber Industry Smallholders Development Authority
xix
CHAPTER 1
INTRODUCTION
1.1 Malaysian Palm Oil Sector
1.1.1 Introduction
The progressive pursuit of oil palm cultivation had evolved Malaysia from a mere
producer of crude palm oil (CPO) into a more diversified producer of new and higher
value-added downstream food and non-food products.
In 1998, Malaysia's palm oil accounted for 49.9 per cent of the world production and
67.6 per cent of the world trade in palm oil. Palm oil had emerged as a major player
in the international oils and fats market. Export earnings from palm oil and related
products increased from RM 2.60 and 6.3 billion in 1980 and 1990, respectively,
which increased to 22.64 billion in 1998, making the oil palm industry the second
largest export earner in the country after electrical and electronic products. The
industry provides employment to about 350,000 workers in the plantations,
government land schemes and supporting industries and services (PORLA, 2000).
1.1.2 Production
Production of palm oil from Malaysia has been increasing over the years from
92,000 tonnes in 1960 to 2.6 million tonnes in 1980 and to 10.55 million tonnes in
1999. This was due to the increase in matured area, particularly in Sabah. However,
as Table 1.1 shows the production decreased by 8.3 per cent from 9.06 million
tonnes in 1997 to 8.3 million tonnes in 1998. The decline in production was the
lower yield of fresh fruit bunches due to stress cycle experienced by the oil palm
trees which occurs every three or four years, as happened in 1994. In 1994 there was
still a fall in yield production from the previous year but having rested, the palms
increased their yields from 1995-1997. This decline in production was also
associated with the haze and prolonged dry spell which affected Malaysia in the
second half of 1997 due to the El-Nino phenomenon (PORLA, 1999).
Production is still mainly from Peninsular Malaysia with 7.427 million tonnes (70.4
per cent) in 1999 as shown in Table 1.1. The share of total production is declining in
Peninsular Malaysia as the share of East Malaysia expanded. Thus,the Peninsula
produced only 70.4 per cent of the total production in 1999 compared with 76.4 per
cent in 1980. Production of crude palm oil in 1999 increased to 10.55 million tones,
reflecting an growth of 26.9 per cent or 2.23million tones compared to 8.32 million
tones in 1998 (pORLA, 2000).
This was mainly attributed to the favorable weather conditions and rainfall
distribution as well as constant sunshine throughout the year. These ensured more
effective pollination and formation of palm fruits. Consequently, the oil palm fruit
yield per hectare increased to 19.26 tonnes compared to 15.98 tonnes recorded in
1998. The increase in matured oil palm areas also contributed to the expansion in
crude palm oil production.
1.2
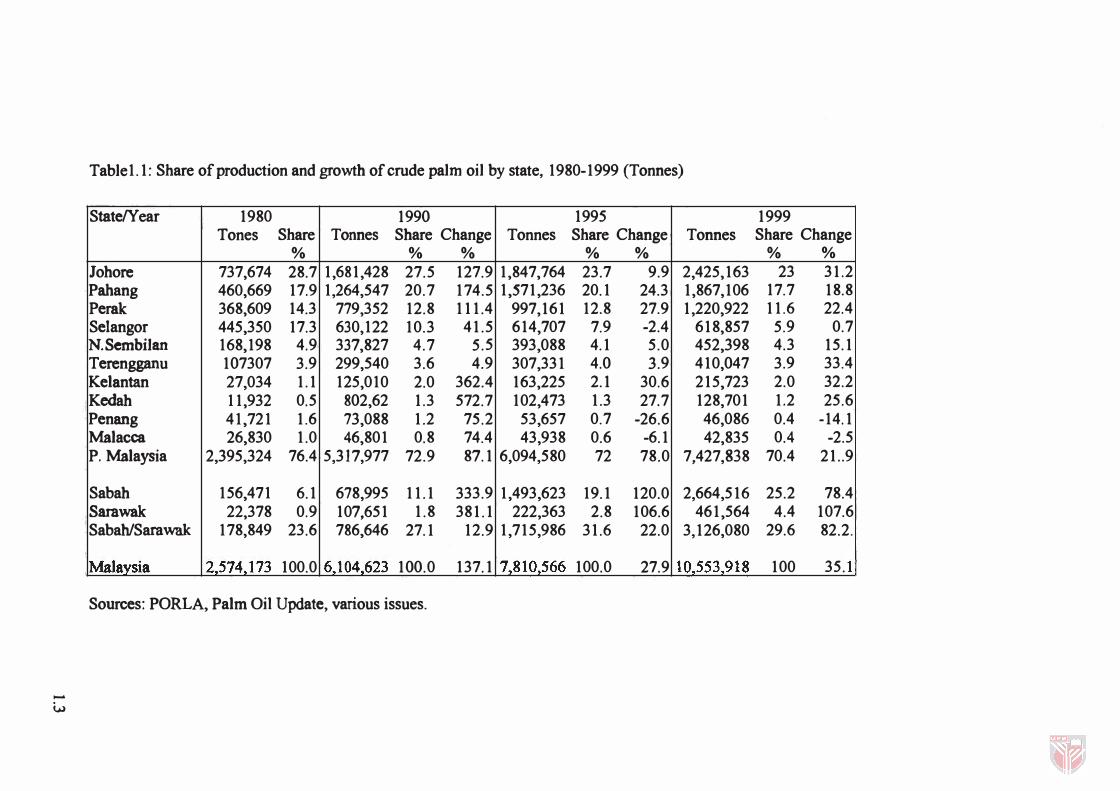
Table 1. 1: Share of production and growth of crude palm oil by state, 1980-1999 (Tonnes)
State!Year 1980 1990 1995 1999 Tones Share Tonnes Share Change Tonnes Share Change Tonnes Share Change
% % % % % % % lohore 737,674 28.7 1,681,428 27.5 127.9 1,847,764 23.7 9.9 2,425,163 23 31.2 Pahang 460,669 17.9 1,264,547 20.7 174.5 1,571,236 20.1 24.3 1,867,106 17.7 18.8 Perak 368,609 14.3 779,352 12.8 111.4 997,161 12.8 27.9 1,220,922 11.6 22.4 SeJangor 445,350 17.3 630,122 10.3 41.5 614,707 7.9 -2.4 618,857 5.9 0.7 N.Sernbilan 168,198 4.9 337,827 4.7 5.5 393,088 4.1 5.0 452,398 4.3 15.1 Terengganu 107307 3.9 299,540 3.6 4.9 307,331 4.0 3.9 410,047 3.9 33.4 Kelantan 27,034 1.1 125,010 2.0 362.4 163,225 2.1 30.6 215,723 2.0 32.2 Kedah 11,932 0.5 802,62 1.3 572.7 102,473 1.3 27.7 128,701 1.2 25.6 Penang 41,721 1.6 73,088 1.2 75.2 53,657 0.7 -26.6 46,086 0.4 -14.1 Malacca 26,830 1.0 46,801 0.8 74.4 43,938 0.6 -6.1 42,835 0.4 -2.5 P. Malaysia 2,395,324 76.4 5,317,977 72.9 87.1 6,094,580 72 78.0 7,427,838 70.4 21..9
Sabah 156,471 6.1 678,995 11.1 333.9 1,493,623 19.1 120.0 2,664,516 25.2 78.4 Sarawak 22,378 0.9 107,651 1.8 381.1 222,363 2.8 106.6 461,564 4.4 107.6 Sabah/Sarawak 178,849 23.6 786,646 27.1 12.9 1,715,986 31.6 22.0 3,126,080 29.6 82.2.
Malaysia 2,574,173 100.0 6JI04,623 100.0 137.1 7J810,566 100.0 27.9 10,553,918 100 35. }, Sources: PORLA, Palm Oil Update, various issues .
..... w
The ending stock in 1999 at 1,175,693 tonnes was higher than that of 1998, which
was at 824,815 tonnes. With production of palm oil being forecast at
10.8 million tones for 2000, it is anticipated that the scenario for palm oil in 2000
would be another favorable one. Thus, approximately 12 million tonnes of palm oil
would be available for trade from Malaysia in 2000 against 11.4 million tonnes in the
previous year (pORLA, 2000).
The world production of palm oil had witnessed a rapid growth compared to other
oils and fats during the 1980-1998. Thus the palm oil's share of the world oils and
fats production increased to 18.6 per cent in 1999 from 13.3 per cent in 1990, while
that of soyabean oil rose to 22.8 per cent from 19.4 per cent during the same period
as shown in table 1.2. In 1998, Malaysia contributed 52.9 per cent of the world palm
oil production, while Indonesia 30 per cent (Table 1.3).
The world oils and fats production reached 108.8 million tonnes in 1999, an increase
of 14.9 per cent or 14.12 million tonnes from 1995. A significant share of the
increase comprised of vegetable oils, which grew at 14.0 per cent per annwn as
against 6.9 per cent per annwn for animal oils and fats. Soybean oil remained the
largest oils and fats produced at 24.7 million tonnes, followed by palm oil at 20.3
million tonnes, rapeseed oil at 12.9 million tonnes, sunflower oil at 9.2 million
tonnes and tallow at 7.5 million tonnes ( Table 1..2).
1.4

Tablet. 2: World production of 17 oils and fat, 1980-1999 ('000 tones)
Oils & Fats 1980 1990 1995 1999 Tonnes Share Tonnes Share Change Tonnes Share Change Tonnes Share Change
% % % % % % % Soyabean Oil 13,382 22.4 16,097 19.4 20.3 20,307 21.5 26.2 24,755 22.8 21.9 Palm Oil 4,543 7.6 11,027 13.3 142.7 15,1 IS 16.0 37.1 20,277 18.6 34.1 Rapeseed Oil 3,474 5.8 8,160 9.8 134.9 10,976 11.6 34.5 12,936 11.9 17.9 Sunflowcrseed Oil 5,024 8.4 7,869 9.5 56.6 8,686 9.2 10.4 9,237 8.5 6.3 GToundnut Oil 2,864 4.8 3,897 4.7 36.1 4,354 4.6 11.7 4,705 4.3 8.1 Cottonneseed Oil 2,992 5.0 3,782 4.6 26.4 3,870 4.1 2.3 3,811 3.5 -1.5 Coconut Oil 2,716 4.6 3,387 4.1 24.7 3,446 3.6 1.7 2,499 2.3 -27.5 Olive Oil 1,701 2.9 1,855 2.2 9.1 1,852 2.0 -0.2 2,425 2.2 30.9 Com Oil 866 1.5 1,477 1.8 70.6 1,854 2.0 25.5 1,989 1.8 7.3 Palm Kernel Oil 571 1.0 1,450 1.7 153.9 1,920 2.0 32.4 2,518 2.3 31.1 Linseed Oil 764 1.3 653 0.8 -14.5 690 0.7 5.7 721 0.7 4.5 Sesame Oil 502 0.8 612 0.7 21.9 728 0.8 19.0 689 0.6 -5.4 Castor Oil 346 0.6 438 0.5 26.6 486 0.5 11.0 433 0.4 -10.9 Vegetable Oils 41,725 69.9 62,694 75.6 50.3 76,282 78.5 21.7 86,995 80.0 14.0
Tallow 6,283 10.5 6,813 8.2 8.4 7460 7.9 9.5 8,133 7.5 9.0 Butter 5,746 9.6 6,500 7.8 13.1 5722 6.0 -12.0 5,819 5.4 1.7 Lard 4,691 7.9 5,509 6.6 17.4 5853 6.2 6.2 6,609 6.1 12.9 Fish Oil 1,214 2.0 1,378 1.7 13.5 1314 1.4 -4.6 1,201 1.1 -8.6 Animal OilsIFats 17,934 30.1 20,200 24.4 12.6 20,349 21.5 0.7 21,762 20.0 6.9 GRAND TOTAL 59,659 100.0 82,894 100.0 38.9 94,636 100.0 14.2 108 757 100.0 14.9
Sources: Oil World, various issues.
-VI