UNIVERSITA' DEGLI STUDI DI PADOVA - [email protected]/1964/1/Luni.pdf ·...
222
UNIVERSITA' DEGLI STUDI DI PADOVA Sede Amministrativa: Università degli Studi di Padova Dipartimento di Principi e Impianti di Ingegneria Chimica "I. Sorgato" SCUOLA DI DOTTORATO DI RICERCA IN : Ingegneria Industriale INDIRIZZO: Ingegneria Chimica XXI CICLO DEVELOPMENT OF CELL CULTURE TECHNOLOGY FOR THE EXPANSION OF HOMOGENEOUS POPULATIONS OF HUMAN STEM CELLS Direttore della Scuola : Ch.mo Prof. Paolo Bariani Supervisore : Ch.mo Prof. Nicola Elvassore Dottorando : Camilla Luni
Transcript of UNIVERSITA' DEGLI STUDI DI PADOVA - [email protected]/1964/1/Luni.pdf ·...

UNIVERSITA' DEGLI STUDI DI PADOVA
Sede Amministrativa: Università degli Studi di Padova
Dipartimento di Principi e Impianti di Ingegneria Chimica "I. Sorgato"
SCUOLA DI DOTTORATO DI RICERCA IN : Ingegneria Industriale
INDIRIZZO: Ingegneria Chimica
XXI CICLO
DEVELOPMENT OF CELL CULTURE TECHNOLOGY FOR THE EXPANSION
OF HOMOGENEOUS POPULATIONS OF HUMAN STEM CELLS
Direttore della Scuola : Ch.mo Prof. Paolo Bariani
Supervisore : Ch.mo Prof. Nicola Elvassore
Dottorando : Camilla Luni


To my parents


"The human understanding is of its own nature prone to suppose
the existence of more order and regularity in the world than it finds."
Sir Francis Bacon

Table of contents
Sommario VIII
Summary XII
Foreword XIV
Chapter 1
Clinical use of hematopoietic stem cells
1.1 Clinical motivation 1
1.1.1 HSCs from bone marrow: clinical relevance and limitations 2
1.1.2 UCB as a promising source of HSCs for transplantation 4
1.2 HSC expansion and cell quality assessment 6
1.3 From discovery to clinical use7
1.4 Thesis outline 9
1.5 References 10
Chapter 2
Rational design principles
2.1 Stem cell behavior 13
2.2 Stem cell characterization at population level 16
2.2.1 Flow cytometry 16
2.2.2 Cell morphology 17
2.3 Stem cell culture methods 18
2.3.1 Static culture 18
2.3.2 Stirred suspension bioreactor 19

2.3.3 Analysis of characteristic times 21
2.3.3.1 Static culture characteristic times 21
2.3.3.2 Dynamic culture characteristic times 23
2.4 Intrinsic cell population heterogeneity 26
2.5 Concluding remarks 26
2.6 References 27
Chapter 3
Microliter-bioreactor array stirred by thermoconvection
3.1 Introduction 29
3.2 Materials and methods 32
3.2.1 Bioreactor device 32
3.2.1.1 Complete bioreactor system 32
3.2.1.2 Miniaturized electrical circuit fabrication 34
3.2.1.3 Heater characterization 35
3.2.1.4 Numerical model 36
3.2.1.5 Micro-particle image velocimetry (μPIV) 37
3.2.2 Cell culture 38
3.2.2.1 Cell isolation and culture conditions 38
3.2.2.2 Cell viability, cell count and flow cytometry analyses 39
3.3 Results and discussion 39
3.3.1 Numerical simulations and μPIV data 39
3.3.2 Theoretical considerations 42
3.3.3 Experiments of HSC culture 45
3.3.3.1 Temperature effect on HSCs 45
3.3.3.2 Biological experiments 45
3.4 Conclusions 48

3.5 References 49
Chapter 4
Six-well stirred suspension bioreactor
4.1 Introduction 51
4.2 Materials and methods 53
4.2.1 Bioreactor device 53
4.2.2 Study of oxygen solubility 55
4.2.2.1 Experimental setup 55
4.2.2.2 Calibration 56
4.2.2.3 Oxygen solubility measurements 57
4.2.3 Cell culture 57
4.2.3.1 Cell isolation and culture conditions 57
4.2.3.2 Cell analyses 58
4.3 Results and discussion 59
4.3.1 Bioreactor design 59
4.3.2 Oxygen solubility 60
4.3.3 Cell culture 62
4.3.3.1 Experiments at 20% oxygen partial pressure 63
4.3.3.2 Experiments at 5% oxygen partial pressure 68
4.4 Conclusions 71
4.5 References 72
Chapter 5
Cell population modeling describes intrinsic heterogeneity
5.1 Introduction 75
5.2 Theoretical framework 76
5.3 Mathematical model 79

5.3.1 General population balance model 79
5.3.2 Single-cell process kinetics 81
5.3.3 PBE model by generations 82
5.4 Simulation and analysis 83
5.4.1 Numerical solution and parameter estimation 83
5.4.2 Model output 84
5.5 Results 85
5.5.1 Simulations at constant ligand concentration 85
5.5.2 Different ligand administration profiles 88
5.5.3 Dimensionless analysis of cell population heterogeneity 92
5.6 Conclusions 94
5.7 References 97
5.8 Appendices 98
5.8.1 Model solution method 98
5.8.2 Parameter derivations 100
Chapter 6
Conclusions 101
Appendix A
Flow cytometric cell cycle analysis of muscle precursor cells cultured within 3D
scaffolds in a perfusion bioreactor 105
Appendix B
Population balance model of a muscle stem cell culture 135
Appendix C
Dispositivo di miscelazione meccanica per piastre di coltura 171


Sommario
E' stato prospettato l'impiego di cellule staminali per terapie volte al mantenimento,
alla rigenerazione o alla sostituzione di tessuti malfunzionanti. Tuttavia non sono
ancora state risolte alcune limitazioni legate principalmente alla scarsa disponibilità
di cellule staminali e ai problemi di sicurezza clinica connessi alla qualità cellulare.
L'ottimizzazione del processo di espansione cellulare è un sfida ingegneristica,
oltre che biologica.
Scopo di questa tesi è lo sviluppo di una tecnologia sperimentale e di un quadro
razionale che consenta di comprendere e controllare l'espansione di cellule
staminali in vitro, sia considerando le proprietà medie che la loro distribuzione
nella popolazione cellulare prodotta.
E' stata realizzata un'analisi razionale dei principali fenomeni coinvolti nella coltura
cellulare, ponendo in evidenza le fonti di eterogeneità sia nei sistemi di coltura
convenzionali che nei bioreattori mescolati.
Da un punto di vista sperimentale, sono stati progettati e sviluppati due tipi di
bioreattori fino a realizzarne dei prototipi. Il primo, un sistema di bioreattori di
volume dell'ordine dei microlitri, è stato progettato basato su un meccanismo di
termoconvezione; questo apparato sperimentale è particolarmente adatto per
un'ottimizzazione multiparametrica delle condizioni di coltura. Il secondo, un
bioreattore in sospensione multipozzetto con un volume operativo di 10
ml/pozzetto, è stato pensato e costruito per un'ottimizzazione di processo meno
dettagliata o, alternativamente, per una produzione su piccola scala di cellule
staminali; una versione più avanzata è stata sviluppata per effettuare colture di
cellule staminali in condizioni di ipossia. Entrambi i dispositivi sono stati

vantaggiosamente utilizzati per coltivare cellule staminali ematopoietiche, ricavate
da cordone ombelicale umano, che sono poi state caratterizzate secondo i metodi di
analisi biologica convenzionali.
Per ottimizzare razionalmente il processo di espansione delle cellule staminali, è
stato sviluppato un modello computazionale, basato su un bilancio di popolazione,
che tiene conto della distribuzione di recettori e di complessi recettore-ligando nel
campione cellulare. Il modello descrive ragionevolmente l'eterogeneità intrinseca,
intra- e intergenerazionale, derivante dal processo di divisione cellulare.
Questi risultati possono dare un riscontro positivo in fase di progettazione degli
esperimenti e di definizione delle condizioni operative a cui effettuare colture in
bioreattore, al fine di minimizzare l'eterogeneità estrinseca e intrinseca della
popolazione cellulare e di effettuare un ulteriore avanzamento verso un processo di
espansione di cellule staminali umane clinicamente sicuro ed affidabile.


Summary
Stem cell-based therapies have been proposed as promising for the maintenance,
regeneration, or replacement of malfunctioning tissues, but suffer from limitations
mainly due to scarce cell availability and clinical safety concern related to cell
quality. Optimization of stem cell expansion process is an engineering challenge,
besides a biological issue.
Aim of the work presented is to develop the experimental technology and the
rational insight to understand and control stem cell expansion in vitro, in terms of
both average and distributed properties of the cell population produced.
A rational analysis of the main phenomena involved in a cell culture was achieved,
underlining the sources of stem cell heterogeneity in both conventional culture
systems and stirred bioreactors.
From an experimental point of view, two types of bioreactors were designed,
developed, and prototyped. The first, a microliter bioreactor array, was designed
based on thermoconvective mixing; this experimental setup is particularly
convenient for multiparametric optimization of cell culture conditions. The second,
a six-well suspension bioreactor with a working volume of 10 ml/well, was
designed and fabricated for coarse process optimization or, alternatively, for small-
scale stem cell production; an improved setup was developed to perform stem cell
cultures under hypoxia conditions. Both devices were advantageously used to
culture human cord blood-derived hematopoietic stem cells, which were then
characterized according to the currently available biological assays.
In order to rationally optimize the stem cell expansion process, a computational
model, based on a population balance approach, was developed, that takes into

account receptor and receptor-ligand complex distribution in the cell sample. The
model fairly describes intrinsic intra- and inter-generational heterogeneity arising
from the process of cell division.
These findings could give interesting feedback to experimental design and to define
the operative conditions for bioreactor cultures, in order to minimize extrinsic and
intrinsic heterogeneity, and to make a step towards a clinically safe and reliable
human hematopoietic stem cell expansion process.


Foreword
The work of this PhD program was performed at "Dipartimento di Principi e
Impianti di Ingegneria Chimica" of Università di Padova. Part of the computational
section was carried out at University of California at Santa Barbara (UCSB), under
the supervision of Prof. F. J. Doyle III.
I would like to thank here my supervisor Prof. N. Elvassore, for his constant
challenging collaboration, and my co-supervisor, Prof. F. J. Doyle III, for the
opportunity of profitably working at UCSB.
Due to the high interdisciplinarity of this topic, the work in this thesis has benefited
from external collaborations, and I would like to thank the following research
groups:
Prof. Paolo De Coppi (Department of Paediatric Surgery, Institute of Child
Health, London, UK)
Prof. Carl Meinhart (Department of Mechanical Engineering, University of
California at Santa Barbara, USA)
I am grateful to Ministero Italiano dell’Università e della Ricerca (MIUR),
Università di Padova, and Città della Speranza, for the financial support to the
research activity.

During the period of the PhD program, a patent application was deposited at
Camera di Commercio Industria, Artigianato e Agricoltura of Padova
(PD2008A000371).
During of the period of the PhD program, the following publications have been
produced:
Flaibani M, Luni C, Sbalchiero E, Elvassore N. Flow cytometric cell cycle
analysis of muscle precursor cells cultured within 3D scaffolds in a perfusion
bioreactor. Biotechnol Progr. In press.
Luni C, Strumendo M, Boldrin L, Piccoli M, De Coppi P, Elvassore N.
Modeling of human skeletal muscle stem cell ex vivo culture by a population
balance equation. To be submitted.
Luni C, Feldman H, Meinhart C, Pozzobon M, De Coppi P, Elvassore N.
Multiwell bioreactor for hematopoietic stem cell expansion under
thermoconvective flow. In preparation.
Luni C, Albania L, Pozzobon M, Piccoli M, De Coppi P, Elvassore N. Six-
well stirred bioreactor for hematopoietic stem cell expansion. To be submitted.
Luni C, Doyle III FJ, Elvassore N. Optimizing ligand administration for
hematopoietic stem cell expansion in bioreactor through a population balance
model approach. To be submitted.
Luni C, Cimetta E, Elvassore N. Understanding the dominant regimes to
tailor the stem cell niche. In preparation.
Part of the work in this thesis was presented at international conferences, including:
the American Institute of Chemical Engineering (AIChE), Biomedical Engineering
Society (BMES), International Conference on Systems Biology (ICSB).

Chapter 1
Clinical use of hematopoietic
stem cells
In this chapter clinical relevance, problems, limitations, and current perspectives of
hematopoietic stem cell use are presented. The rational analysis of these topics in
view of a process design will be analyzed in Chapter 2. At the end of this chapter,
the outline of the thesis is reported.
1.1 Clinical motivation
The use of living cells as therapeutic agents for the maintenance, regeneration, or
replacement of malfunctioning tissues has been proposed in last decades (Kirouac
et al, 2008). Stem cells are the basis for cell therapy. They are functionally
undifferentiated cells that retain the ability to differentiate in one or more mature
cell types under appropriate conditions, and to self-renew, representing a
potentially inexhaustible cell source (Alberts et al, 2002).
There are two main sources of stem cells. Adult stem cells are present as a small
fraction in most tissues of the human body, and are mostly committed to

2
differentiate only in the mature cells of the tissue where they reside. Embryonic
stem cells are used in the form of immortal cell lines that were derived from the
inner mass of the blastocyst during embryogenesis, they are multipotent as they are
able to differentiate in mature cells derived from all three germ layers (Alberts et
al, 2002).
Cell-based therapies use either autologous or allogeneic stem cells, depending if the
recipient is the same as the donor or not, respectively. While autologous cell
therapy has the advantage of complete immunological compatibility, there are
many situations where allogeneic cell transplantation is necessary for therapeutic
efficacy (Cortesini, 2005). Therapeutic strategies that make use of stem cells have
been proposed for many clinical applications for example, Parkinson's and
Alzheimer's diseases, spinal cord injury, stroke, burns, heart disease, diabetes,
osteoarthritis, and rheumatoid arthritis (stemcells.nih.gov).
Despite the efforts in stem cell research, cell therapy is still not widely applied
clinically, because severe limitations reduce their potential benefits. There some
general issues that need to be solved in most of the clinical applications, such as the
need to have a sufficient number of cells that maintain the appropriate phenotype
and perform the required biological functions; the choice of the stem cell source
considering availability, invasiveness of cell harvesting, and histocompatibility;
safety challenges as the product is the living cells themselves, and the extensive
proliferative potential that makes stem cells attractive also confers the risk
associated with their tumorgenicity (Polak et al, 2006).
1.1.1 HSCs from bone marrow: clinical relevance and limitations
A particularly promising cell-based therapy is hematopoietic stem cell (HSC)
transplantation, because it has a wide range of applicability, for example in the

Clinical use of hematopoietic stem cells 3
treatment of blood cancers, hereditary blood disorders, or, in some cases, to replace
cells destroyed by chemotherapy (Weissman, 2000).
Adult hematopoiesis in vivo is performed by HSCs present in bone marrow, as
shown in Fig. 1.
Figure 1. Location of HSCs in the bone marrow, and differentiation tree that
produces the different classes of mature blood cells (stemcells.nih.gov).
According to molecular signals from the local microenvironment, HSCs proliferate
and differentiate, producing the different classes of blood cells. In this process
different steps are generally identified that correspond to distinct intermediate cell
phenotypes, as reported in Fig. 1. Each phenotype is characterized by a specific
morphology and cell surface markers. During differentiation cells progressively
become committed to only one type of mature cell and loose their proliferative
potential (Alberts et al, 2002). While progenitors seem to play a role in the
immediate period after transplantation, only HSCs are able to give rise to long-term
bone marrow reconstitution (Weissman, 2000).
HSC

4
Despite its therapeutic potential, bone marrow transplantation have several
limitations. First, the large HSC dose required, which is a crucial parameter for a
successful therapy, but makes bone marrow harvesting a more invasive procedure
for the donor. Then donor availability, considering the importance of
histocompatibility issues. Except in the case of homozygous twins, there is always
a certain severity of immunological response, called graft-versus-host disease, after
transplantation. The donor cells have different surface proteins, called human
lymphocyte antigen (HLA), that produce an immunological response from the host.
Furthermore bone marrow from the donor includes T cell lymphocytes that do not
recognize host cells, giving rise to a double immunological response. Thus, a
requirement for bone marrow transplantation is the HLA matching between donor
and patient. Consequently patients with uncommon HLA-types can face difficulties
in finding a matching donor. However the high degree of HLA polymorphism
makes a random match between unrelated humans a rare event in any case, and
even between siblings the probability of a HLA match is 25%. All these medical
implications result in very long times before a suitable donor can be found and
transplantation performed. For completeness, it is worth to highlight that, although
autograft bone marrow transplantations overcome the histocompatibility issue, they
are not feasible in many cases from a clinical perspective. A minor issue is the risk
of donor morbidity, that requires careful control of donor cells and further delays
the transplantation (Weissman, 2000).
An alternative source of HSCs is umbilical cord blood (UCB).
1.1.2 UCB as a promising source of HSCs for transplantation
The presence of HSCs in UCB was discovered in the 80s (Broxmeyer et al, 1989).
Since then, various works have studied UCB as a possible alternative to bone

Clinical use of hematopoietic stem cells 5
marrow in HSC transplantations. There are several advantages connected with
UCB use, even if a definitive assessment of its comparable therapeutic efficacy
with respect to bone marrow has not been given in clinical trials yet, because of the
difficulty to compare data that inevitably present a high variability (Shoemans et al,
2006).
The main advantage of UCB as a HSC source is its availability. Cord blood banks
select, purify, classify, and store UCBs from donors (Shoemans et al, 2006). The
bank network is growing all over the world, making an UCB unit ready to use in a
day because it is HLA-typed before storage. Bone marrow usually requires 3-4
months, as it is donor-dependent. HSCs from UCB give rise to less
histocompatibility problems and require a less HLA-match, because they have
more immature surface antigens and T cell lymphocytes are absent. The risk of
donor morbidity is also reduced (Eapen et al, 2007).
The main limitation for UCB success in transplantations is the fixed HSC content
of a unit of UCB, considering that the minimum number of cells required for
transplantation is 2.5∙107 cryopreserved nucleated cells/kg of patient. As
transplantation outcome is correlated with the cell dose infused, this restricts UCB
use mainly to pediatric patients (Eapen et al, 2007). Different strategies try to
overcome this limitation, like the injection of multiple cords, that resulted in a
higher engraftment but also in an increased graft-versus-host disease. Expansion ex
vivo of HSC from a unit of UCB is a promising strategy. Up to now the increased
number of cells obtained is mainly due to hematopoietic progenitors which are
helpful in the immediate recovery after transplantation, but a higher number of
HSCs is also required, and efficient strategies for effective stem cell expansion in
vitro have not been developed yet (Eapen et al, 2007).

6
1.2 HSC expansion and cell quality assessment
In vivo HSC expansion is regulated by a network of chemical, mechanical, and
electrical signals from the local surrounding environment, called stem cell niche. In
vitro HSCs are conventionally cultured in single-well Petri dishes, multiwell, or
flasks, where they grow settled at the bottom without surface attachment. Their
proliferation rate is regulated by exogenous and endogenous growth factors that are
present as soluble molecules in the culture medium. Besides proliferation, growth
factors affect the phenotypic characteristics of the cell population, for example in
terms of morphology, degree of differentiation, and tumorigenicity properties
(Kirouac et al, 2008).
The optimization of protocols for HSC expansion needs to span a wide range of
experimental conditions, in terms of type, timing and dose of soluble growth
factors to reproduce in vitro stem cell niche signals (Verfaillie, 1992).
The first requirement of a cell-based therapy is its efficacy in the human patient. A
robust correlation between measurable HSC properties and clinical success is not
available yet. Most of the assays, developed to characterize the cells, associate cell
characteristics to short-term engraftment more than to long-term bone marrow
reconstitution (Purton et al, 2007).
Despite this limitation, the characterization of cells from a cell culture is important
to understand different aspects of the expansion process, such as repeatability and
heterogeneity inside the HSC population, to increase our understanding of cell
behavior, and to detect the retain of multipotency after the expansion process.
The most common assays used for cell quality assessment are flow cytometry,
colony-forming cell assays, in vivo assays in model animals, and then clinical trials.
Currently, results from clinical trials are the only ultimate response of the effective
expansion of HSCs, whereas it is uncertain if experiments in animals are

Clinical use of hematopoietic stem cells 7
representative of the human response. Colony-forming cell assays are informative
about the progenitor cell content of a population of interest, but do not measure the
HSC fraction of a cell population, they are used to detect the retention of
multipotency in the expanded cells (Purton et al, 2007). Flow cytometry is a
powerful technique used to analyze the pattern of protein markers present on the
surface of cells at different stages of differentiation, it will be described in further
detail in Chapter 2.
1.3 From discovery to clinical use
The road map that brings HSCs from umbilical cord blood to the clinic is a long
process (Fig. 2), that involves people with different skills, like biologists,
engineers, and physicians.
Figure 2. Schematic representation of the road map from hematopoietic stem cell
discovery to their clinical use.
Discovery is the first step, which gives the basis for a feasible clinical
application. It involves the identification of HSCs, and of the basic
signaling they receive from the stem cell niche, like endogenous and
exogenous growth factors.
Process optimization involves the understanding of the relative importance
of the different processes in order to find the proper conditions for an

8
effective stem cell expansion. Wide screening of experimental conditions
occurs at this stage, that includes for example the choice of materials used
for cell culture and definition of local conditions for cell expansion, along
with the development of reliable cell quality detection assays. The cell
quality after in vitro culture is the main goal of this step. Process
development occurs on a small scale to provide increased insight and
understanding.
Once the key design parameters for HSC expansion are known, the process
needs to be implemented for a production at the clinical scale. At this stage
other variables come into play, such as the development of a cost-effective
process, robustness and reproducibility in the methodology of cell
expansion, detection of key measurements for cell quality control and
process monitoring.
The last step is clinical use of HSCs.
This road map that brings HSCs to the clinic is not just a sequence of steps,
because different development phases feed back on one another. For example, as
clinical trials are today the only evidence of therapeutic efficacy, motivated by the
lack of other reliable tests, they give a feedback to the whole process development
pipeline.
Food and Drug Administration (FDA), the American agency responsible for
protecting and promoting public health, indicated the guidelines and regulations to
develop stem cell clinical applications, underlining the importance of quality
control not only of the final cell product, but also of the manufacturing methods
that need to be robust and repeatable (FDA, 2004). This task is further complicated

Clinical use of hematopoietic stem cells 9
by the fact that besides average properties, also their distribution in the cell
population affects the clinical success of the cell-based therapy (Bryder et al,
2006).
Thus, process optimization and production are not only biological problems, but
also engineering challenges.
1.4 Thesis outline
The aim of this thesis is to develop the technology to expand HSC populations
under definite conditions, and to define and describe the average properties of the
system and eventual sources of intrinsic and extrinsic variability or heterogeneity in
the cellular quality outcome.
In Chapter 2 a rational analysis of the biological and physical phenomena relevant
for the development of cell culture technology is discussed. In particular, the key
variables to take into account in bioreactor design are discussed, and the strategy to
collect experimental data are presented.
In Chapter 3 the design and application of a microliter bioreactor array is presented,
in view of a wide screening of experimental conditions for stem cell culture under
stirred-suspension conditions.
In Chapter 4 a clinical-scale bioreactor prototype is described, along with the
results from biological experiments, where human umbilical cord blood
hematopoietic stem cells were cultured.
In Chapter 5 a theoretical analysis of the intrinsic heterogeneity in a stem cell
population is presented. This study is performed by a mathematical model based on
a population balance approach.

10
In Chapter 6 conclusions are presented, along with future perspectives.
1.5 References
Alberts B, Johnson A, Lewis J, Raff M, Roberts K, Walter P. 2002.
Molecular Biology of the Cell, 4th ed. New York:Garland.
Broxmeyer HE, Douglas GW, Hangoc G, Cooper S, Bard J, English D,
Arny M, Thomas L, Boyse EA. 1989. Human umbilical cord blood as a potential
source of transplantable hematopoietic stem/progenitor cells. PNAS 86:3828-3832.
Bryder D, Rossi DJ, Weissman IL. 2006. Hematopoietic stem cells - The
paradigmatic tissue-specific stem cell. Am J Pathol 169(2):338-346.
Cortesini R. 2005. Stem cells, tissue engineering and organogenesis in
transplantation. Transplant Immunology 15:81-89.
Eapen M, Rubinstein P, Zhang M-J, Stevens C, Kurtzberg J, Scaradavou A,
Loberiza FR, Champlin RE, Klein JP, Horowitz MM, Wagner JE. 2007. Outcomes
of transplantation of unrelated donor umbilical cord blood and bone marrow in
children with acute leukaemia: a comparison study. Lancet 369: 1947-1954.
FDA. 2004. Guidance for industry: PAT—A framework for innovative
pharmaceutical development, manufacturing, and quality assurance
(http://www.fda.gov/cder/guidance/6419fnl.htm).
Kirouac DC, Zandstra PW. 2008. The systematic production of cells for cell
therapies. Cell Stem Cell 3:369-381.
Polak JM, Bishop AE. 2006. Stem cells and tissue engineering: Past,
present, and future. Ann N Y Acad Sci 1068:352-66.
Purton LE, Scadden DT. 2007. Limiting factors in murine hematopoietic
stem cell assays. Cell Stem Cell 1(3):263-70.

Clinical use of hematopoietic stem cells 11
Schoemans H, Theunissen K, Maertens J, Boogaerts M, Verfaillie C,
Wagner C. 2006. Adult umbilical cord blood transplantation: a comprehensive
review. Bone Marrow Transplantation 38:83–93.
Verfaillie CM. 1992. Direct contact between human primitive
hematopoietic progenitors and bone marrow stroma is not required for long-term in
vitro hematopoiesis. Blood 79(11):2821-2826.
Weissman IL. 2000. Translating Stem and Progenitor Cell Biology to the
Clinic: Barriers and Opportunities. Science 287:1442-1446.

Chapter 2
Rational design principles
In this chapter the biological processes involving stem cell behavior, connected to
the topic of this work, are reviewed. The methods to experimentally detect cell
quality at population level are described. The theoretical analysis of the processes
generating heterogeneity is then performed, anticipating the content of next
chapters.
2.1 Stem cell behavior
Stem cell behavior strongly depends on interactions with signal molecules in the
extracellular environment. In vivo these molecules are produced by neighboring
cells or by cells further away inside the organism. Cells are able to detect and
respond to the presence of these molecules in the local environment by a variety of
cell-surface receptor proteins. A type of receptor is specific for detecting only the
complementary ligand signal molecule. When a receptor-ligand complex is formed,
an intracellular signaling cascade is generated inside the cell, affecting its behavior
(Alberts et al, 2002).

14
Stem cell niche is the local tissue microenvironment that maintain and regulate
stem cells in vivo (Scadden, 2006). Besides by soluble factors, stem cell behavior is
also influenced by surface contact, and mechanical and electrical stimuli. But they
are out of the scope of this thesis.
Cell surface receptors are important markers that characterize a cell, because they
are an index of cell ability to respond to specific external stimuli. Nonetheless a
straight relationship between certain kind of receptors and cell "stemness" has not
been found yet. Even if some markers are associated with primitive cell behavior,
they are not fully specific for stem cells (Morrison et al, 2008).
HSC-environment interactions in vitro can be schematically described as in Fig. 1,
where a main distinction is made among:
exogenous soluble factors, that are provided by the culture medium;
endogenous factors, that are produced by cells to influence neighbor cells;
autologous factors that cells both release and uptake.
Figure 1. Schematic of the soluble factors involved in cell-environment
interaction. Exogenous factors present in culture medium, endogenous factors
released by the cell, and autologous factors that are both released and up taken by
the cell itself.

Rational design principles 15
The commitment of a stem cell to different differentiation lineages (Fig.1, Chapter
1) is dependent from these signaling molecules. Thus, they play a key role in stem
cell culture strategies. Growth factors represent the operative variables that need to
be controlled during in vitro expansion (Verfaillie et al, 1992).
In vivo, hematopoietic stem cells (HSCs) reside primarily in the bone marrow, that
contains both hematopoietic and non-hematopoietic cells. In response to signals
from the local microenvironment, cells proliferate. Proliferation occurs also in vitro
if culture conditions are suitable.
Cell cycle is the sequence of steps that cells undergo to divide. It is mainly
composed by four phases, as indicated in Fig. 2. During S-phase cells double their
DNA, whereas during M-phase they effectively divide their biological material
between the two daughters. G1 and G2 phases are gap phases of variable duration
that are inserted between S- and M- phases. A further cell state exists called G0-
phase, typical of cells that perform normal cellular functions, but are in a status of
proliferative quiescence. Stem cells are recognized to be in G0 in many adult tissues
in vivo, where they reside before external signals make them enter the cell cycle
(Alberts et al, 2002).
Figure 2. Schematic of the main phases of the cell cycle. G0 is a phase of
proliferative quiescence, in S cells duplicate their DNA, in M biological material is
split between the two daughter cells. G1 and G2 are gap phases that separate S and
M.

16
2.2 Stem cell characterization at population level
Various experimental methods are available to assess cell quality at population
level. They detect both average and distributed properties. Flow cytometry and
Coulter counter are detailed below.
2.2.1 Flow cytometry
Flow cytometry is a powerful means to analyze samples of about 104 cells in few
minutes. Cells are stained with different types of fluorescent probes that bind
specifically defined cell components. Then their fluorescence is analyzed, while
one cell at a time passes in front of a laser beam (Ormerod, 2000).
As reported in §2.1, cells proliferate undergoing a cell cycle. By flow cytometry it
is possible to study the asynchrony of a cell population detecting the fraction of
cells in each phase of the cell cycle. In Appendix A, a study is reported of a flow
cytometric cell cycle analysis of muscle precursor cells cultured in a perfusion
bioreactor (Flaibani et al, in press).
In this thesis more emphasis is given to flow cytometry as an analysis tool to detect
various types of cell surface markers. Different markers can be contemporarily
detected if cells are stained with fluorescent probes of different wavelengths. In
Fig. 3 an example of the distribution of marker c-kit, also called CD117, is
reported. As shown, it is possible to detect the distribution of fluorescence
intensity, and thus marker content, in the cell population.
In Chapter 3 and 4 a detailed analysis is presented on characterization of human
cord blood-derived HSCs after culture in the two different bioreactor systems
developed.

Rational design principles 17
Figure 3. Example of measurement of c-kit (CD117) distribution in a population
of cord blood-derived cells.
2.2.2 Cell morphology
Cell morphology can be analyzed by a Coulter counter. An instrument that detects
cell number and volume distribution in the cell population. The counter
measurement is based on the change in electrical conductance of a small aperture
when fluid containing cells pass through.
Cell volume heterogeneity in a population of satellite cells – a type of stem cells
present in adult skeletal muscle – was analyzed in a previous work that is reported
in Appendix B. An example is shown in Fig. 4.

18
Figure 4. Example of a measurement of muscle satellite stem cell volume
distribution by Coulter counter.
2.3 Stem cell culture methods
2.3.1 Static culture
Static culture systems, such as polystyrene Petri dishes, multiwells, or flasks, have
been the most widely used culture devices. HSCs are conventionally cultured in
these containers, and put inside a biological incubator, where two physical
parameters are regulated: temperature and pH. Temperature is usually set at 37°C,
whereas pH control is performed by maintaining an atmosphere at 5% CO2
concentration, which corresponds to the physiological pH of 7.2. The main sources
of variability among different culture protocols reside in medium composition, cell
seeding density, and time intervals between cell dilutions, called cell passages, and
medium changes. Conventional cultivation methods are in need of both optimized
protocols and ad hoc technology (Cabrita et al, 2003).

Rational design principles 19
2.3.2 Stirred suspension bioreactor
The road map from stem cell discovery to clinical use involves a sequence of
phases (see Fig. 2, Chapter 1), bioreactors of different scales can be useful in the
two steps of process optimization and production, where cost reduction and product
quality control are needed (Kirouac et al, 2008).
A cell suspension bioreactor is a closed stirred vessel where it is possible to inline
monitor and control some culture parameters, and to take samples from the vessel
without disrupting culture conditions. It can be run in different configurations, such
as batch, fed-batch, and in perfusion mode, with a system to prevent cell wash-out
(Cabrita et al, 2003). The main advantage of a suspension bioreactor is related to
the reduction of spatial gradients. The homogeneity in the vessel ensures more
defined and repeatable culture conditions, making easier the scale-up of the process
with a consequent cost reduction. Other pros are the possibility to control the
process inline, and to attain higher cellular densities, because, as cells are
suspended, the culture becomes three-dimensional (Blanch et al, 1997).
While biopharmaceutical microbiologic production processes are currently
performed in stirred bioreactors, the adaptation of the setup of these systems to
stem cell culture requires a more careful choice of biocompatible materials, and a
minimization of the shear stress caused by the stirring (Nielsen, 1999).
Presently, research is performed in bioreactors with volume in the range of about
100-1000 ml to culture embryonic, mesenchymal, neural (for references, see King
et al, 2007; Kirouac et al, 2008), and HSCs (Sardonini et al, 1993; Zandstra et al,
1994; Collins et al, 1998). HSCs are particularly suitable to be cultured in
suspension bioreactors as they do not require surface attachment to grow.
Many protocols available have been developed for static culture conditions. Using
these protocols in suspended bioreactors requires their adaptation to a completely

20
different system. For example, bioreactors are made of different materials, such as
glass, that requires a coating to have a suitable cell-contact surface (Zandstra et al,
1994), but exogenous and endogenous factors have different adsorption constants
on these materials respect to, for example, polystyrene. Furthermore, pH control is
performed by feeding a gas mixture on medium surface, thus the efficiency of this
control is dependent on medium surface-volume ratio and mixing rate, and is
completely different to that under static conditions. Besides tubing used for gas
inlet can also play a role.
In Fig. 5 a bioreactor with a minimum working volume of 300 ml is shown. This
system was initially used in the experiments at the beginning of this PhD program,
but all the limitations just described, and, in particular, the costs for handling in
such a large volume very valuable materials, induced to the development of more
sustainable culture systems, described in Chapter 3 and 4.
Figure 5. Large scale stirred suspension
bioreactor. Provided with water jacket for
temperature control, gas inlet and outlet for
pH control by CO2, stirring system, pumps
or on line sampling and feeding. Minimum
working volume is 300 ml.

Rational design principles 21
2.3.3 Analysis of characteristic times
A useful means to understand stem cell behavior is the study of the interplay
between the relative rates of different biological, chemical, and physical
phenomena involved. A qualitative analysis of these crucial aspects, restricted to
endogenous and exogenous soluble factors, is now reported for the two culture
conditions presented: culture under static conditions and in a stirred bioreactor.
2.3.3.1 Static culture characteristic times
When cells are cultured under static conditions, medium in the well is stagnant.
The small convective flow due to random local temperature gradients will be
neglected in this analysis. Soluble factors are present in the medium, and are up
taken and released by the cells, depending if they are exogenous or endogenous
(Fig. 1). The competitive processes in these culture conditions are transport by
diffusion and cell uptake/release of soluble factors. Only uptake will be considered
in this theoretical analysis.
The characteristic time of diffusion, 1 , is given by:
2
1 ,D
(2.1)
where is a the characteristic diffusion length, and D the diffusion coefficient.
While for endogenous factors is equal to the average cell-cell distance at well
bottom, 1cc (Fig. 6 A), which is cell density dependent, is reasonably given by
medium height, H, for exogenous factors (Fig. 6 A).
A simple kinetics of uptake is assumed for the reaction between receptor, R, and
ligand, L:
onkR L RL

22
where RL is the complex formed. The uptake characteristic time, 2 , can be
defined as:
2
1 .
[ ]onk L (2.2)
Figure 6. Schematic representation of the characteristic lengths in a static (A) and
in a stirred (B) culture systems.
The concentration at cell surface is dependent on the ratio between these two
characteristic times, and can have values in the range between null and bulk
concentration. Thus, as cells feel only the concentration of signaling molecules at
their surface, assuming they are subjected to the same conditions of the bulk
volume is not always a good approximation.
It is important to notice from (2.1) that in some conditions soluble factors with the
same diffusion coefficient can be either diffusion- or uptake-limited, depending if
they are exogenous or endogenous. Besides, endogenous factors with different
diffusion coefficients can be either diffusion- or uptake-limited, even in the same
culture conditions. The same is true for exogenous factors with different diffusion
coefficients. Thus, some soluble factors can be homogeneously distributed, while

Rational design principles 23
others can be diffusion-limited at the same culture conditions, and these equilibria
are further complicated by cell density changing with time.
2.3.3.2 Dynamic culture characteristic times
When cells are cultured in a stirred bioreactor the same considerations on the
importance of characteristic times ratio hold, but the situation is further
complicated by convection coming into play.
The case when medium is mixed and cells homogeneously suspended in the whole
volume is now analyzed.
Diffusion characteristic time is still given by (2.1), but the characteristic
length is now the average cell-cell distance for cells distributed in the whole
working volume 2cc (Fig. 6 B), both for endogenous and exogenous
factors. Thus, under stirred suspension culture conditions, it is removed the
difference in diffusive mass transport of endogenous and exogenous factors,
as they have the same characteristic length.
Under the assumption of a ratio between well height and diameter closed to
unity, medium convection has a characteristic time, 3 , given by (Nienow,
1997):
3
3.9 ,
sN (2.3)
where sN is the impeller stirring rate.
The characteristic time of cell convection, 4 , is given by:
4
0,cellv (2.4)

24
where 0,cellv is cell terminal falling velocity with respect to the medium,
given by Stokes' law, and analyzed in Chapter 3. The characteristic length,
, is given by the average cell-cell distance, 2cc (Fig. 6 B), and is then
cell density dependent.
Eq. (2.2) still holds for the characteristic time of uptake.
Some general considerations can be drawn. Uptake and mass transport are
processes that act in series, thus the slower is the limiting one. Whereas diffusion
and convection processes are parallel phenomena, and the faster is the dominant
one.
An intermediate condition between static and stirred suspension culture is given by
a situation when medium is mixed, but cells lie at the well bottom without being
suspended. Similar considerations on characteristic times hold in this case, where
different characteristic lengths should be considered.
The lack of quantitative knowledge on stem cell kinetics of uptake/release and the
huge number of different molecules acting, limit the feasibility of a thorough
definition of the local microenvironment surrounding the cells. However an insight
of the key processes that should be considered is still important at this stage.
An overview of the characteristic times and lengths just described is reported in
Fig. 7 to give a taste of the complexity of the system under study. There are three
different characteristic lengths involved: cellular, niche, and culture system lengths.
However characteristic times of different processes are not distinct, and can be
overlapped for competitive processes, depending on culture conditions (e.g. static
vs. dynamic culture, high vs. low cell density), molecule of interest (different
diffusive coefficient, and uptake kinetics), and type of cells considered (different

Rational design principles 25
cell dimension, and tendency to form clusters). Parameters used to generate this
figure are given in figure caption and are useful to give an idea of the order of
magnitude of different processes.
Figure 7. Range of characteristic times and lengths for different biological and
physical phenomena in cell interaction with soluble factors. ─ Characteristic time
of cell uptake of soluble factors according to (2.2) for a ligand concentration of 50
ng/ml with a molecular weight of 10 kDa. ─ Characteristic time of diffusion under
static conditions according to (2.1). ─ Characteristic time of diffusion in stirred
culture according to (2.1). ─ Characteristic time of cell relative motion with respect
to the medium according to (2.4). ─ Characteristic time of mixing according to
(2.3). The three length scales are, from left to right: cell/cluster radius (5÷2.5∙10-5
um), niche length (calculated as Nc-1/3
), system length (0.5÷1 cm). kon (106÷10
9 M
-1
min-1
, from Lauffenburger et al, 1993): kinetic constant of the receptor-ligand
forward reaction, Nc (103÷10
6 cell/ml): cell density, D (10
-9÷10-11
m2/s, from
Lauffenburger et al, 1993): diffusion coefficient, Rcell (5÷2.5∙10-5
μm, the second
value represents the approximate radius of a cluster formed by 100 cells):
cell/cluster of cells radius, Ns (1÷100 rpm): stirring rate.

26
2.4 Intrinsic cell population heterogeneity
As highlighted from experimental data drawn from stem cell characterization at
population level, heterogeneity is always present in a stem cell sample at different
levels, such as marker expression, asynchrony, and morphology. In Section 2.3
some considerations on mass transport and uptake/release kinetics were reported to
show how different cell behavior can be generated because of a different local
microenvironment. Thus, cell population heterogeneity is partly generated as a
consequence of spatial concentration gradients of important signaling molecules
and local inhomogeneities of cell density in culture. This environmental
heterogeneity, dependent on culture conditions, will be next referred to as extrinsic
heterogeneity. However, another important source of heterogeneity, which is
intrinsic in the cell population, is cell division. A theoretical study is reported in
Chapter 5 on this topic.
2.5 Concluding remarks
In this chapter, some topics on cell population heterogeneity were discussed. First
how it is experimentally detectable, then the different mechanisms that affect cell
quality products not only terms of average properties, but also in terms of
heterogeneity in the cell population. Because of the complexity of biological and
physical phenomena that come into play, it is difficult to design a cell culture
system that completely avoids heterogeneity. One of the main reason for that is that
our ability to keep the system homogeneous is limited by the need to keep low the
shear stress, that poses an upper bound to the feasible stirring rates. Besides, even
under perfectly homogeneous external conditions, heterogeneity intrinsically arises
in the population because of cell division process. On the overall, the important

Rational design principles 27
conclusion from this analysis is that we cannot completely eliminate heterogeneity,
but to design safe manufacturing processes we need to be aware of the sources that
generate it and of the variability in the system.
2.6 References
Alberts B, Johnson A, Lewis J, Raff M, Roberts K, Walter P. 2002.
Molecular Biology of the Cell, 4th ed. New York:Garland.
Blanch HW, Clark DS. 1997. Biochemical engineering. New York: Marcel
Dekker Inc. 702 p.
Cabrita GJM, Ferreira BS, da Silva CL, Gonçalves R, Almeida-Porada G,
Cabral JMS. 2003. Hematopoietic stem cells: from the bone to the bioreactor.
Trends Biotechnol 21:233-240.
Collins PC, Nielsen LK, Patel SD, Papoutsakis ET, Miller WM. 1998.
Characterization of hematopoietic cell expansion, oxygen uptake, and glycolysis in
a controlled, stirred-tank bioreactor system. Biotechnol Prog 14(3): 466-472.
Flaibani M, Luni C, Sbalchiero E, Elvassore N. Flow cytometric cell cycle
analysis of muscle precursor cells cultured within 3D scaffolds in a perfusion
bioreactor. Biotech Prog DOI: 10.1002/btpr.40. In press.
King JA, Miller WM. 2007. Bioreactor development for stem cell
expansion and controlled differentiation. Curr Opin Chem Biol 11:394-398.
Kirouac DC, Zandstra PW. 2008. The systematic production of cells for cell
therapies. Cell Stem Cell 3:369-381.
Lauffenburger DA, Linderman JJ. 1993. Receptors. Model for binding,
trafficking and signaling. New York:Oxford University Press.
Morrison SJ, Spradling AC. 2008. Stem cells and niches: mechanisms that
promote stem cell maintenance throughout life. Cell 132:598–611.

28
Nielsen LK. 1999. Bioreactors for hematopoietic cell culture. Annu Rev
Biomed Eng 01:129-152.
Nienow AW. 1997. On impeller circulation and mixing effectiveness in the
turbulent flow regime. Chem Eng Sci 52(15):2557-2565.
Ormerod M. 2000. Flow cytometry. A practical approach. Oxford
University Press.
Sardonini CA, Wu YJ. 1993. Expansion and differentiation of human
hematopoietic cells from static cultures through small-scale bioreactors. Biotechnol
Prog 9 (2):131-137.
Scadden DT. 2006. The stem-cell niche as an entity of action. Nature
441(29):1075-1079.
Verfaillie CM. 1992. Direct contact between human primitive
hematopoietic progenitors and bone marrow stroma is not required for long-term in
vitro hematopoiesis. Blood 79(11):2821-2826.
Zandstra PW, Eaves CJ, Piret, JM. 1994. Expansion of hematopoietic
progenitor cell populations in stirred suspension bioreactors of normal human bone
marrow cells. Bio/Technology 12:909-914.

Chapter 3
Microliter-bioreactor array stirred
by thermoconvection
In this chapter the design and development of an array of up to 96 microliter-
bioreactors to perform parallel experiments of cell culture in suspension is
presented. A validation of a prototype is performed using human umbilical cord
blood hematopoietic cells. The device is useful for exploring a wide range of
experimental conditions at the stage of process optimization (Fig. 1, Chapter 1).
3.1 Introduction
The number of cells in a donor-derived cell sample is usually too small for
therapeutic applications. If, in an efficient large-scale production, bioreactors play a
fundamental role, process optimization needs a high-throughput small-scale
technology, but suitable to transfer information on a larger scale. Further progress
should be made in process optimization, reproducing in vitro stem cell niche
signals, principally playing on time-dependent dosing of soluble factors (Verfaillie,
1992). The optimization of protocols for stem cell culture needs to span a wide

30
range of experimental conditions, in terms of type, timing and dose of growth
factors. Even supported by experimental design strategies, such a wide
experimental campaign has prohibitive costs in bioreactors that have volumes of
hundred of milliliters.
The present work presents a system for medium stirring when cells are cultured in a
96-well plate. This number of wells can fit to the requirement of wide screening in
process optimization, and this well volume is sufficient to have an enough number
of cells for biological characterization of the culture outcome. Mechanical stirring
at this scale would result rather complex. Thus, in the system developed in this
work, mixing is provided by a mechanism of thermoconvection (Fig. 1). A
micrometric heater is put in correspondence of each well bottom to generate a very
localized temperature increase. As a consequence of the temperature gradient, a
convective flow arises into the well, homogenizing the culture medium.
In the past Dexter et al. (1977) were able to maintain hematopoiesis in vitro for a
long period of time culturing cells at 33°C, thus up to 4°C of temperature
difference at the well bottom are acceptable, but even less is sufficient for mixing
and keeping cells suspended. Shear stress is not a concern even at 4°C temperature
difference (Hua et al, 1993).
As the temperature gradient at the well bottom and the temperature profile in the
well are not directly measured, a mathematical model is used to correlate
temperature and velocity profiles in the well to the experimental operative
variables. The model is validated by experiments of micro-particle image
velocimetry, before being used to define proper operative conditions for
experiments of cell culture.
Parameters important for a successful stem cell culture are temperature and pH,
besides biocompatibility of the materials used. It is possible to dispense with

Microliter-bioreactor array stirred by thermoconvection 31
complex control of temperature and pH, as the device is put inside the biological
incubator, what makes the system proposed easily usable also by people not
familiar with engineering equipment. The cell culture is in contact only with the
polystyrene multiwell, which is a well-know biocompatible material (LaIuppa et al,
1997).
Figure 1. Schematic of one micro-liter bioreactor stirred by thermoconvection.
Suspension cell culture is performed in a polystyrene well. A temperature gradient
at the well bottom generates a stirring inside the well by natural convection. The
gradient is produced by placing the well on a silicon substrate where a micro-
fabricated heater provides a very localized heat flux. Under the silicon wafer a
cooler is used to maintain the heat localization. All the system is incubated at the
same temperature as the cooler.
The bioreactor array developed is tested with preliminary cultures of human cord
blood-derived CD34+ cells. Five different low-mixing conditions are investigated

32
in six repeated one-week experiments. Results of cell count, viability and CD34
expression are presented.
While the system developed is suitable for culturing HSCs, as they grow as single-
cells, its application can be extended to cells that form agglomerates, as long as
medium mixing is required without cell suspension.
3.2 Materials and methods
3.2.1 Bioreactor device
3.2.1.1 Complete bioreactor system
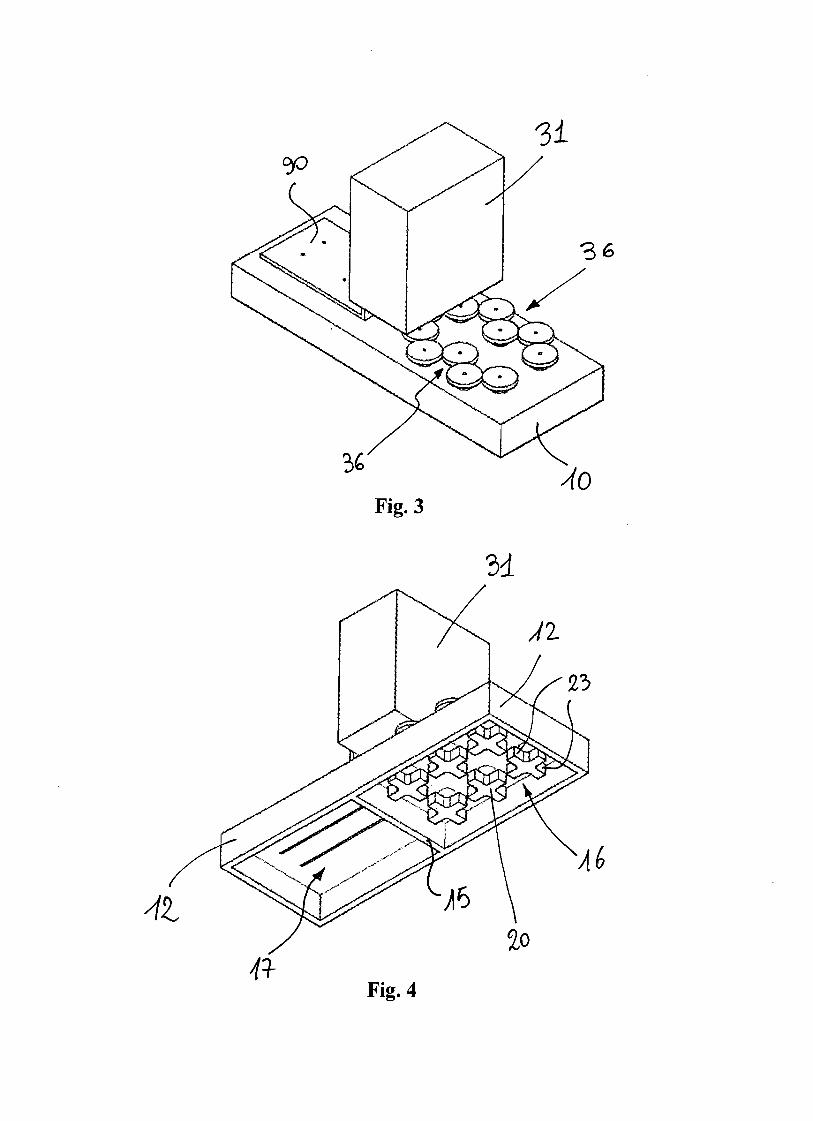
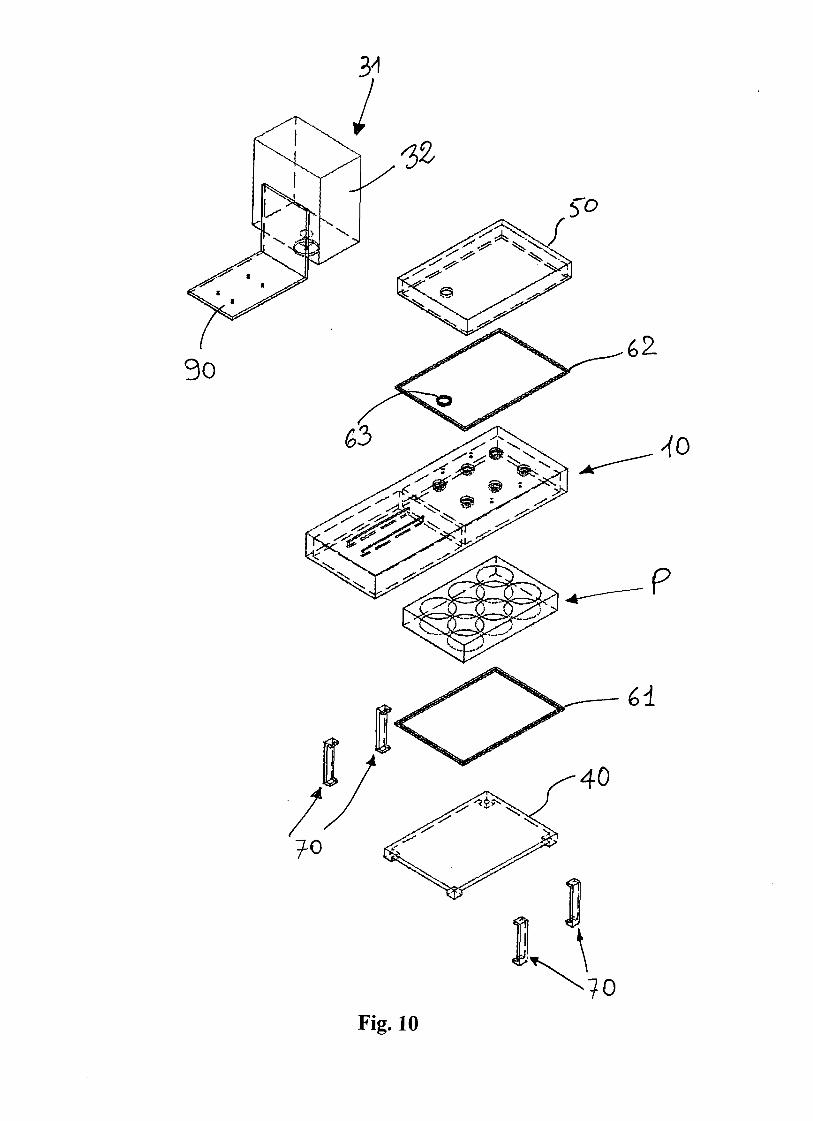
Fig. 2 illustrates the main components of the microliter-bioreactor array. Cells are
cultured in a 96-well plate (CLS3614; Sigma-Aldrich, Milan, Italy) with lid
(CLS3099; Sigma-Aldrich, Milan, Italy). This multiwell is made of polystyrene,
and has a flat bottom of 0.127-mm thickness.
A silicon wafer, see details below, is put in contact with the bottom of the
multiwell. A miniaturized electrical circuit, including an electrical resistor at the
bottom of each well, is printed on its surface. Electrical wires (1 mm diameter) are
attached to the electrical connections of the circuit on the wafer. For this purpose,
first a conductive epoxy (Chemtronix, Georgia) is applied over night, and then, to
guarantee a stronger mechanical fixing, a 2 Ton Clear Epoxy (Devcon, Danvers,
MA) is applied for 2 hours. The wires are then connected to a DC power supply
(6220B, Hewlett-Packard) which provides a stable voltage.
A thermoelectric cooler (CP-031; TE Technology, MI) is used to regulate the
temperature below the wafer. An aluminum block (90x60x8 mm) is put between
the wafer and the cooler to guarantee a better temperature homogeneity. A

Microliter-bioreactor array stirred by thermoconvection 33
temperature probe (PT100 ,10mm, class A; RS Components, Milan) monitors the
temperature on the upper surface of the aluminum block. It is connected to a PID
controller (998D-22CC-JARR; Watlow, MN) that regulates the temperature by
turning on and off the cooler regulating its connection to a DC power supply
(Digimaster, PS3003DA).
Figure 2. Schematic of the micro-liter bioreactor array. A conventional 96-well
plate is placed on a silicon wafer, where a micro-fabricated electrical circuit
provides a heater at the bottom of each well. A thermoelectric cooler is used to
maintain localized the hot spot at the bottom of each well, regulating the
temperature around the spot at CT . An aluminum block is put between the silicon
wafer and the cooler to enhance temperature homogeneity. A PT100 temperature
probe is put on the aluminum block top surface, and is connected to a PID
controller that regulates the activation of the cooler. All the system is placed inside
an incubator whose temperature is fixed at CT .
The 96-well plate with lid, the silicon wafer, the aluminum block, the temperature
sensor, and the cooler are the only components that are put inside the biological
incubator. The electrical wires provide the connections with components outside.

34
3.2.1.2 Miniaturized electrical circuit fabrication
A miniaturized electrical circuit is micro-fabricated (University of California at
Santa Barbara Nanofabrication facility) on a silicon substrate. A 2- m layer of
insulating silicon dioxide (SiO2) is thermally grown using an oxidation furnace.
Figure 3. Top view schematic of the micro-fabricated electrical circuit. A possible
configuration of the electrical circuit is shown. It is composed by 5 rows of 6
parallel heaters, that are placed in correspondence to the position of the wells
(dashed red line) from the 96-well plate. Each heater is a resistor, shaped as a
serpentine (enlargement) to maximize its resistance and thus the heat produced. A
different voltage can be applied to each row to perform cell cultures at 5 different
stirring conditions.
Photolithography techniques are employed to transfer the micro-circuit design from
a transparency mask to the SiO2 layer. The micro-circuit is made of thin films:
200Å of titanium and 1800Å of platinum, deposited via electron-beam evaporation.
Titanium is used as an adhesive layer, and platinum provides the robustness and
linear resistance-temperature relationship needed for the micro-heater electrode
components characterization.

Microliter-bioreactor array stirred by thermoconvection 35
Different configurations of the electrical circuit are feasible. Fig. 3 shows the
micro-circuit used for the biological experiments in this paper. It includes five
parallel rows, which have six resistors each, connected in parallel. A different
voltage can be applied to each row to produce five different stirring conditions.
3.2.1.3 Heater characterization
The micro-fabricated resistors, in the electrical circuit above, function as resistive
heaters. They are put in direct contact with the base of each well. A constant
voltage, V, is applied to the ends of each resistor that dissipates a heat flow rate, P,
given, according to Ohm's law, by:
2VP
R (3.1)
where R is the resistance of each resistor.
In order to minimize the necessary external power, the resistors are designed to
maximize their resistance. The resistance of an individual heater is given by:
L
Rw t
(3.2)
where is platinum resistivity (105 n m at 20 C), L is the length of the resistor, w
the width, and t the thickness. To increase heater resistance, its length is maximized
with a serpentine structure (L=28.11 mm), and the width minimized enough to
create the winds in the serpentine within the resolution limits of a transparency
mask (w=40±5 m). The heater thickness is t=1800 Å. The theoretical resistance of
the heater, calculated by (3.2), is R=410±10 at 20°C, in accordance to that
experimentally measured. As shown in Fig. 3, the serpentine heater is designed
rod-shaped, such that the ratio between the lens width and the parallel chord of the
circular well is kept at the constant value of 0.1.

36
The temperature-dependence of platinum resistivity is linear for the narrow
operating temperature ranges used. The change in the resistance of each heater with
temperature is calculated by:
0 0( )R R a T T (3.3)
where R0 is the resistance at the reference temperature, T0; ∆R=R-R0, R is the
resistance at temperature T; a is the temperature coefficient of resistance, which is
determined experimentally to be 0.0033 ºC-1
.
3.2.1.4 Numerical model
A numerical model is developed to investigate thermoconvective flow in the well.
The physical system simulated includes three subdomains: the silicon wafer, with a
heater on its surface whose thickness is neglected, the polystyrene well bottom, and
the liquid inside the well. Because of the symmetrical geometry of the system, only
one quarter of an individual well is simulated.
An energy balance at steady-state is applied to each subdomain:
2 Pk T c u T (3.4)
where T is the temperature, u is the velocity (different from zero only for the
liquid in the well); k is the thermal conductivity, the density at the average
temperature in the well, and Pc the heat capacity at constant pressure of silicon,
polystyrene and medium, whose properties are approximated with those of water.
In the subdomain that includes the liquid in the well, the energy balance is coupled,
at steady-state, with the continuity equation for an incompressible fluid:
0 ,u (3.5)
and the Navier-Stokes equation:
20 ( ) ,p u T g (3.6)

Microliter-bioreactor array stirred by thermoconvection 37
where p is the pressure, medium dynamic viscosity, approximated with that of
water, g is the gravitational acceleration. In the gravity term medium density, ,
is considered dependent on temperature, according to Boussinesq approximation.
The boundary conditions for the model are insulation and symmetry in all the
external boundaries, except the bottom surface of the silicon wafer, where
temperature is fixed at the cooler temperature, TC. Continuity is assumed in all
internal boundaries. The temperature of the resistive heater is fixed at TH.
The model is solved using the software COMSOL Multiphysics V3.4 (COMSOL,
Inc. Stockholm, Sweden). The parameter values used are summarized in Tab. I.
Table I. Parameter values. * from Ito et al. (2001). ** from volume in Hunt et al.
(2003) under the assumption of cell spherical shape. § from COMSOL material
library. Medium properties are approximated with water properties.
3.2.1.5 Micro-particle image velocimetry (μPIV)
The fluid velocity in a convectively-stirred well is experimentally measured by
micro-particle image velocimetry ( PIV) technique, as described in detail in
Meinhart et al. (1999) and Santiago et at. (1998). Briefly, a well from a 96-well
plate (Sigma-Aldrich) is filled with deionized water for a working volume of 76 μl,

38
and seeded with 1- m diameter fluorescent polystyrene beads (Duke Scientific,
Fremont, CA).
A Solo-PIV Nd:YAG Laser (New Wave Research Inc, Fremont, CA) is used to
illuminate at 532 nm the flow-tracing particles, which are imaged with an
epifluorescent microscope (Nikon E600FN) through a 10x lens (NA=0.25). The
particle images are recorded with a cooled CCD camera with a time delay of 1 s
between exposures. The captured images pairs are analyzed to determine the in-
plane velocity field, ( , )u x y . All measurements are taken at a room temperature of
22°C.
3.2.2 Cell culture
3.2.2.1 Cell isolation and culture conditions
Cord blood (CB) units are obtained from Bone Marrow Stem Cell Transplant
Laboratory (Pediatric Oncohaematology Department, Padua, Italy), after informed
consent. Cord blood is eluted with 20 ml PBS 1X (Gibco, Invitrogen, Milan, Italy)
and mononuclear cells are isolated by density-gradient centrifugation (2000 rpm,
30 min), layering on equal volume of Ficoll (GE Healthcare). Mononuclear cells
are counted by hematocytometer, and analyzed by flow cytometry as a negative
control.
CD34+ cells are isolated by superparamagnetic microbeads (CD34 antibody,
QBEND-10, Abcam, Cambridge, UK) selection using high-gradient magnetic field
and mini-MACS columns (Miltenyi Biotech, Glodbach, Germany). A fraction of
CD34+-cells of more than 70% is obtained, as verified by flow cytometry (FACS
Calibur, Becton Dickinson) after counterstaining with CD34-phycoerythrin
antibody (AC136 clone, Miltenyi Biotec).
Microliter-bioreactor array stirred by thermoconvection 39
The selected cells are suspended in Iscove’s Modified Dulbecco’s Medium
(Gibco), 10% scomplemented (56°C, 30 min), with 10% FBS (Gibco), 1%
Penicillin/Streptomycin (Gibco), and supplemented with the following human
citokynes (PeproTech Inc, Rocky Hill, NJ): hSCF (50 ng/ml), hTPO (10 ng/ml),
hIL-6 (10 ng/ml), hFL (50 ng/ml), according to the protocol in Gunetti et al (2008).
CD34+ cells are seeded into 30 wells of a 96-well plate of the micro-liter bioreactor
array, in correspondence to the heaters in the silicon wafer below, and in 6
separated wells as a static culture control. Cell seeding density is 104 cell/ml. The
voltages applied to the resistors in each row are summarized in Table II.
3.2.2.2 Cell viability, cell count and flow cytometry analyses
At day 4 and 7 cell count is performed by hematocytometer. The medium removed
at day 4 is substituted with fresh medium to restore the original volume.
At day 7 cells are suspended with 40 μl PBS 1X and incubated at 4°C for 15 min
with 8 μl anti-CD34-PE antibody (GIBCO, Invitrogen), and 5 μl of 7-amino-
actinomicyn D (7-AAD). Labelled cells are then suspended in 1 ml PBS 1X,
centrifuged (1200 rpm, 5 min), and suspended in 200 μl PBS 1X for flow
cytometer acquisition.
3.3 Results and discussion
3.3.1 Numerical simulations and μPIV data
Numerical simulations are performed to assist in bioreactor design, and to define
feasible experimental conditions for HSC culture in the device. Experiments of

40
PIV are carried out to validate numerical simulation results for the fluid velocity
in the well.
The bioreactor has a working volume for cell culture of 250 l (8-mm height), but
for PIV experiments the working volume is reduced to 76 l (2.4-mm height),
because the larger working volume created significant background glow and
impaired discrete particle visibility on the measurement plane. The numerical
model is modified accordingly.
Comparing the PIV measurements to the reduced-height model yields insight to
the accuracy and predictability of the model to the experimental thermoconvective
stirring conditions used in biological experiments.
The temperature and velocity fields are calculated by the numerical model for a
temperature difference, T , between the heater and the cooler of 0.5°C. The
results are shown in Fig. 4 A and B, respectively.
A first set of PIV data investigated the velocity field as a function of fluid height,
z . Measurements are taken in the region of expected fastest in-plane velocity to
improve data accuracy, and averaged in the (x,y)-plane. The region of interest is
shaded in Fig. 4 B.
The relationship between T , used as an input in the numerical model, and the
voltage applied to the ends of the resistive heater, V , used for PIV measurements,
is shown in Fig. 4 C. A T of 0.5°C corresponds to a V of 10 V. The comparison
of the numerically-simulated in-plane velocity with that experimentally measured
is shown in Fig. 4 D, as a function of the distance from the well bottom. The
excellent match between the two results confirms the reliability of the numerical
model in simulating the experimental conditions.

Microliter-bioreactor array stirred by thermoconvection 41
Figure 4. Comparison between the numerical simulation results and the
experimental μPIV data. Numerical simulation results of the temperature (A) and
the velocity field (B) in a quarter of a well filled with 76 μl of deionized water, for
22CT C and for a H CT T T (see Fig. 1) of 0.5°C at the bottom of the
well. In (B) the region of interest for the μPIV measurements is indicated.
Numerical simulation results and experimental μPIV data are compared
considering the relationship between V and ΔT shown in (C). Comparison of μPIV
measurements (bullet points), for a voltage, V, of 10 V applied to the ends of the
heater, with simulation results (line) in terms of in-plane velocity vs. vertical
coordinate (D).
A second set of PIV experiments evaluates the in-plane fluid velocity dependence
on the voltage applied to the ends of the resistive heater.
Velocity measurements are taken at a distance from the well bottom, z , of 400 m,
in the region of interest shown in Fig. 4 B, with increasing voltages applied to the
heater. Fig. 5 shows the PIV experimental data as well as the numerical model
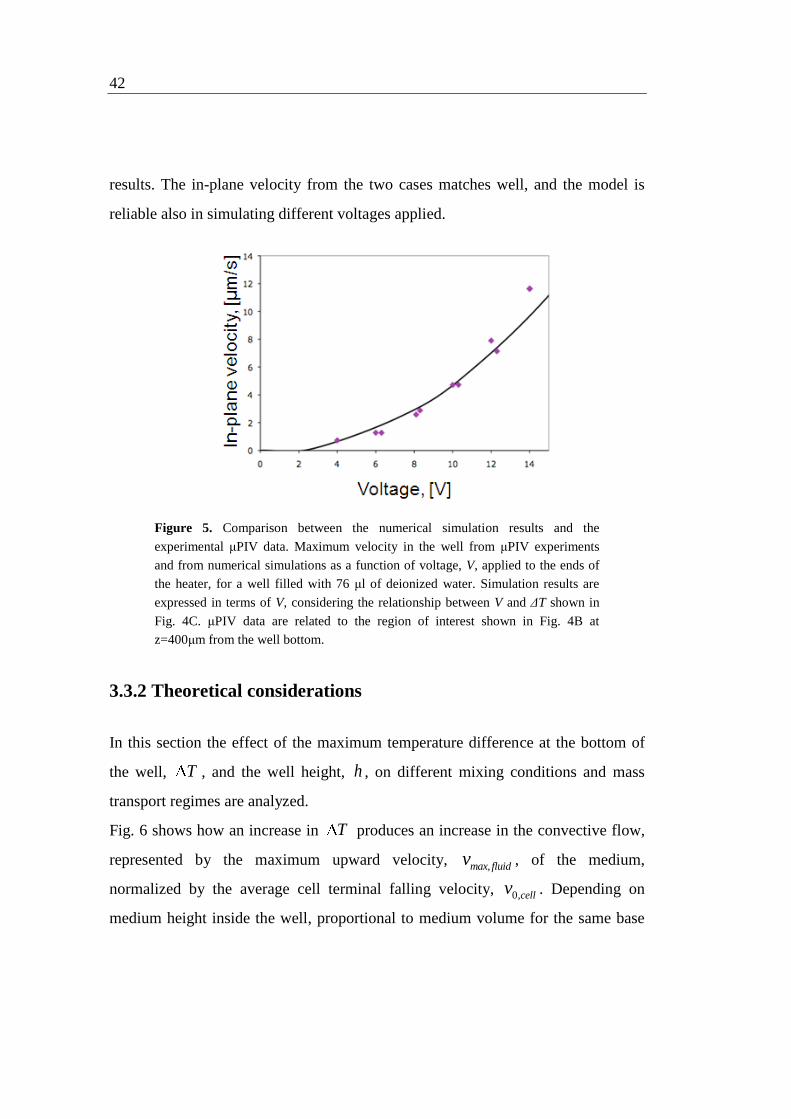
42
results. The in-plane velocity from the two cases matches well, and the model is
reliable also in simulating different voltages applied.
Figure 5. Comparison between the numerical simulation results and the
experimental μPIV data. Maximum velocity in the well from μPIV experiments
and from numerical simulations as a function of voltage, V, applied to the ends of
the heater, for a well filled with 76 μl of deionized water. Simulation results are
expressed in terms of V, considering the relationship between V and ΔT shown in
Fig. 4C. μPIV data are related to the region of interest shown in Fig. 4B at
z=400μm from the well bottom.
3.3.2 Theoretical considerations
In this section the effect of the maximum temperature difference at the bottom of
the well, T , and the well height, h , on different mixing conditions and mass
transport regimes are analyzed.
Fig. 6 shows how an increase in T produces an increase in the convective flow,
represented by the maximum upward velocity, max, fluidv , of the medium,
normalized by the average cell terminal falling velocity, 0,cellv . Depending on
medium height inside the well, proportional to medium volume for the same base

Microliter-bioreactor array stirred by thermoconvection 43
area, a given T produces a different max, fluidv . As shown in Fig. 6, this difference
is not very significant in the range of volumes of a 96-well plate (a medium volume
range of 76-250 μl is shown), thus a possible imprecision in the filling volume has
negligible effect on the convective flow generated.
The cells in culture moves as a whole with the medium, but at the same time they
settle with a terminal falling velocity given by Stokes' equation:
2
0,
2( )
9
cell cellcell
R gv (3.7)
where and are medium density and viscosity respectively; g is the
acceleration of gravity; cell
is cell density, and cellR is cell radius.
The condition for cell suspension in the medium is represented by
0,/ 1max, fluid cellv v . Because of the distribution of cell density and radius (Hunt et
al, 2003) in a cell population, the transition between cell suspension and not-
suspension culture conditions is not sharp. In Fig. 6 a region is highlighted where
for increasing values of 0,cellv , cells of increasing dimension start being suspended.
In the zone where there is no cell suspension, the transport of molecules of gases,
growth factors, and metabolites can be either diffusion-driven or convection-
driven, depending on the magnitude of medium convective flow. A first insight of
the dominant mass transport mechanism is achievable by analyzing Péclet
dimensionless group, Pe , which is the ratio of convection rate to diffusion rate,
given by /Pe L v D . Where v is a characteristic velocity of the fluid, max, fluidv
is used in this analysis; L is a characteristic length of the system; and D is the
diffusivity of the molecule of interest in the medium. When 1Pe diffusion
prevails, conversely when 1Pe convective transport is dominant.

44
Figure 6. Simulation results. Numerical simulation results for the dependence of
the ratio , 0,/max fluid cellv v from ΔT at the bottom of the well.
0, 2.58 /cell m sv , calculated by (3.7). Two curves are plotted for a filling
volume of 76 μl (used in μPIV measurements) and 250 μl (used in biological
experiments), in dashed and solid lines respectively. The horizontal dotted lines
include the region of transition between the condition of cell suspension and that of
medium mixing only without cell suspension, dependent on cell radius, Rcell.
Pe depends on max, fluidv , the characteristic length of the system, L , and the
molecule diffusion coefficient in the medium, D . max, fluidv is fixed for a certain
T . D depends on the molecule of observation; thus, at the same T condition,
the transport of different growth factors can be regulated by different mechanisms.
L is defined differently depending on which molecule is under consideration,
either exogenous or endogenous. L equals the medium height in the well in the

Microliter-bioreactor array stirred by thermoconvection 45
first case, and the average cell-cell distance, which is cell concentration-, and thus
time-, dependent, in the last case. We can conclude that generally endogenous
factors require a higher mixing velocity to be homogenized.
It is important to notice that for cells, different from HSCs, that form agglomerates,
the T required for cell suspension could be not feasible, because of a higher cell
terminal falling velocity, but a mixing effect can still be achieved producing
different Pe numbers.
3.3.3 Experiments of HSC culture
3.3.3.1 Temperature effect on HSCs
In Dexter et al. (1977) pioneering work, they were able to maintain hematopoiesis
in vitro for several months. HSC cultures were performed on a feeder layer
composed by stromal cells that provided molecular signaling important for
hematopoiesis. They reported better results performing cell culture at 33°C. This
temperature does not seem harmful for HSCs, and positively affects HSC
interaction with the stromal layer. HSC cultures are currently performed at 37°C
(see, for example, Gunetti et al, 2008), because the feeder layer has been
substituted by medium enriched in protein content.
Thus, a temperature difference of half degree, with respect to 37°C, sufficient for
cell suspension (Fig. 6), can be considered having negligible effects on HSC
culture.
3.3.3.2 Biological experiments
The culture of human cord blood-derived CD34+ cells in the microliter-bioreactor
array is examined at five different stirring conditions of medium, and compared to

46
cell culture in regular 96-well plate under static conditions. Six parallel bioreactor
devices are used for repeated experiments. Cells are seeded at an initial cell
concentration of 104 cell/ml, and allowed to expand for 7 days. Stirring is produced
by the voltage, V , applied to the heaters shown in Tab. II, where T from model
simulations is also reported.
In these biological experiments cells are not suspended because of the low voltage
applied (Fig. 6). They are used to preliminarily investigate the practical feasibility
of cell culture in these conditions. It is necessary to verify the device stability in the
biological incubator, which is a closed environment with high levels of humidity. It
is checked that the natural heat dissipation of the incubator is sufficient to remove
the heat generated by the thermoelectric cooler as long as it is used without
ventilation. Furthermore, because of the small culture volume (250 μl) it is
necessary to test the entity of medium evaporation during cell culture in mixed
conditions. This is an important parameter because cell culture becomes more
concentrated if volume decreases, it is detected an acceptable level of evaporation
of about 10 μl/well in 7 days.
Cell viability results show a comparable percentage of dead cells after 7 days in
culture at different stirring conditions (Tab. II). This confirms that a temperature of
37°C is not exceeded during the experiments, in accordance with numerical
simulation results. No statistically significant effect on cell proliferation rate is
observed for any of the agitation rates tested as compared to the static control both
at day 4 and 7 (Tab. II).
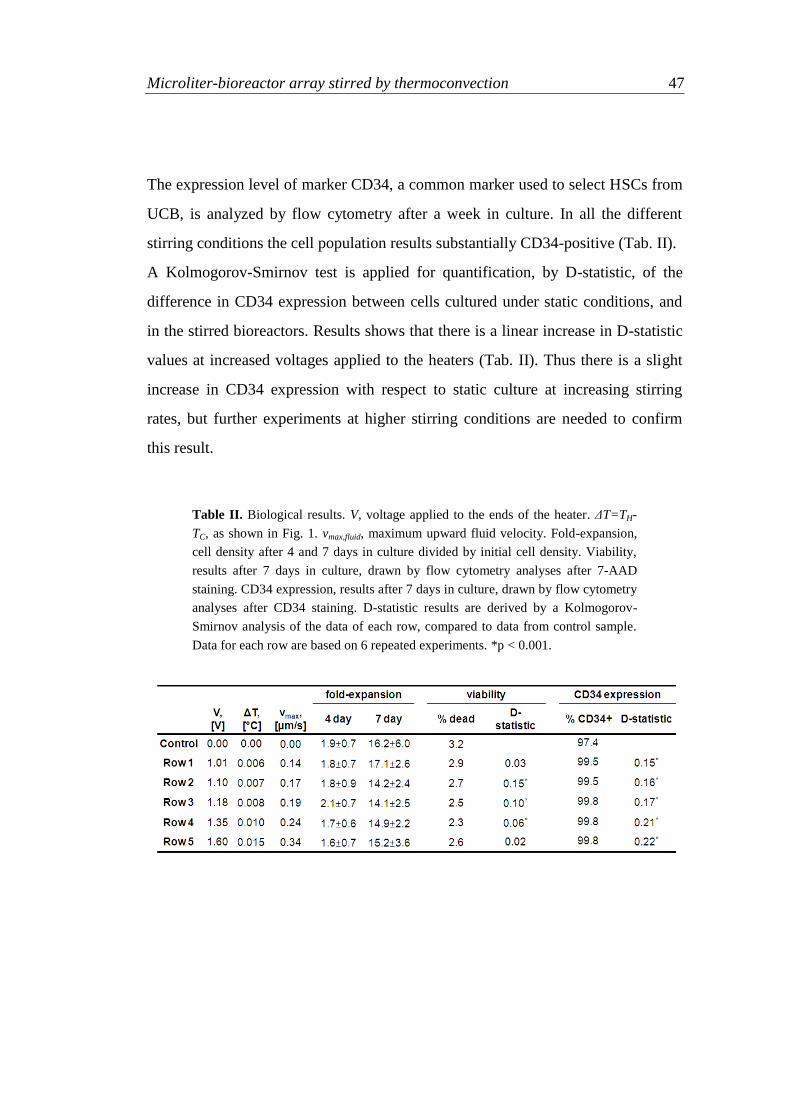
Microliter-bioreactor array stirred by thermoconvection 47
The expression level of marker CD34, a common marker used to select HSCs from
UCB, is analyzed by flow cytometry after a week in culture. In all the different
stirring conditions the cell population results substantially CD34-positive (Tab. II).
A Kolmogorov-Smirnov test is applied for quantification, by D-statistic, of the
difference in CD34 expression between cells cultured under static conditions, and
in the stirred bioreactors. Results shows that there is a linear increase in D-statistic
values at increased voltages applied to the heaters (Tab. II). Thus there is a slight
increase in CD34 expression with respect to static culture at increasing stirring
rates, but further experiments at higher stirring conditions are needed to confirm
this result.
Table II. Biological results. V, voltage applied to the ends of the heater. ΔT=TH-
TC, as shown in Fig. 1. vmax,fluid, maximum upward fluid velocity. Fold-expansion,
cell density after 4 and 7 days in culture divided by initial cell density. Viability,
results after 7 days in culture, drawn by flow cytometry analyses after 7-AAD
staining. CD34 expression, results after 7 days in culture, drawn by flow cytometry
analyses after CD34 staining. D-statistic results are derived by a Kolmogorov-
Smirnov analysis of the data of each row, compared to data from control sample.
Data for each row are based on 6 repeated experiments. *p < 0.001.

48
3.4 Conclusions
In this work a bioreactor array was developed to culture HSCs under stirred
conditions at a microliter scale. Thermoconvective stirring is applied to a
commonly-used multiwell plate. The system can be implemented to perform up to
96 parallel experiments.
Small-scale devices are required for a wide screening of different experimental
conditions to optimize cell culture protocols. Because of the variability between
different umbilical cord units and of the scarce number of cells a unit contains, it is
important to have a system to perform HSC cultures under many different
conditions using cells from the same umbilical cord unit. The advantage of having
a stirred system, to perform this screening at a micro-liter scale, is helpful in the
scale-up process, when bioreactors are used at a production scale.
Numerical simulations were used to analyze the temperature and velocity field
inside the stirred well. The results were validated by experiments of particle
tracking that confirmed the accuracy of the model in predicting the velocity in the
well. They were performed both in different regions of the well, and for different
voltages applied to the resistive heater under the well.
Numerical simulations were used to define the operative conditions for biological
experiments. In particular the feasibility of having cells suspended without
overheating the culture medium was analyzed, considering stem cell sensitivity to
temperatures above 37°C.
Cell cultures were performed using HSCs from human umbilical cord blood in the
device developed in this work. Operative conditions used gave a bland mixing
without cell suspension. These preliminary experiments were useful for defining
the feasibility of the culture process in this bioreactor array. Conditions that were
tested are the possibility to remove the heat generated by the thermoelectric cooler

Microliter-bioreactor array stirred by thermoconvection 49
by exploiting the natural dissipations of the incubator, and the importance played
by medium evaporation in such a small volume under stirring conditions.
The biological results show a comparable behavior between cells cultured under
static conditions and in presence of a bland mixing. Furthermore the volume of the
individual well results sufficient to perform flow cytometry analyses, important for
characterizing the cellular outcome at the end of the culture in the bioreactor array.
In perspective, the system should be tested to find the optimal degree of mixing
that keeps cells suspended, before being used for multiparametric studies of culture
conditions for optimized protocols.
3.5 References
Dexter TM, Allen TD, Lajtha LG. 1977. Conditions controlling the
proliferation of haemopoietic stem cells in vitro. J Cell Physiol 91(3):335-44.
Gunetti M, Ferrero I, Rustichelli D, Berger M, Gammaitoni L, Timeus F,
Piacibello W, Aglietta M, Fagioli F. 2008. Refreezing of cord blood hematopoietic
stem cells for allogenic transplantation: in vitro and in vivo validation of a clinical
phase I/II protocol in European and Italian Good Manufacturing Practice
conditions. Exp Hematol 36(2):235-43.
Hua JM, Erickson LE, Yiin TY, Glasgow LA. 1993. A review of the effects
of shear and interfacial phenomena on cell viability. Crit Rev Biotechnol
13(4):305-328.
Hunt CJ, Armitage SE, Pegg DE. 2003. Cryopreservation of umbilical cord
blood: 1. Osmotically inactive volume, hydraulic conductivity and permeability of
CD34+ cells to dimethyl sulphoxide. Cryobiology 46(1):61-75.

50
Ito Y, Shinomiya K. 2001. A new continuous-flow cell separation method
based on cell density: principle, apparatus, and preliminary application to
separation of human buffy coat. J Clin Apher 16(4):186-91.
LaIuppa JA, McAdams TA, Papoutsakis ET, Miller WM. 1997. Culture
materials affect ex vivo expansion of hematopoietic progenitor cells. J Biomed
Mater Res 36:347-59.
Meinhart CD, Wereley ST, Santiago JG. 1999. PIV measurements of a
microchannel flow. Experiments in Fluids 27(5):414-419.
Santiago JG, Wereley ST, Meinhart CD, Beebe DJ, Adrian RJ. 1998. A
particle image velocimetry system for microfluidics. Experiments in Fluids
25(4):316-319.
Verfaillie CM. 1992. Direct contact between human primitive
hematopoietic progenitors and bone marrow stroma is not required for long-term in
vitro hematopoiesis. Blood 79(11):2821-2826.

Chapter 4
Six-well stirred suspension
bioreactor
In this chapter a six-well bioreactor system designed to perform stirred suspension
cultures in a working volume of some milliliters is described. Experimental data
obtained culturing human hematopoietic stem cells in the proposed device are
presented, both at normal oxygen concentration and under hypoxic conditions. This
bioreactor system is useful for process optimization purposes and for small-scale
stem cell production (Fig. 1, Chapter 1).
4.1 Introduction
As already pointed out (Chapter 2), the most attractive feature of a stirred
bioreactor is the reduction of spatial gradients in the working volume, and the
possibility to perform cell culture under controlled and defined conditions in space
and in time. For application to stem cells, essential design and operative
requirements are sterility and biocompatibility of the materials used, temperature
and pH control, low-shear mixing, and possibly cell suspension.

52
The bioreactor system developed in this work is composed by six 10-ml volume
stirred wells. It is suitable both for process optimization and for stem cell
production. In the first case, after a step of wide exploration of different
experimental conditions (microliter scale), it is necessary to perform a more
confined screening at a working volume that produces a sufficient cell number to
perform a more accurate characterization of the cellular outcome. In the second
case, stem cell production, a milliliter-scale bioreactor is promising in view of a
personalized cell-based therapy, where stem cells are expanded ad hoc for a single
patient (Kirouac et al, 2008). A cost-effective disposable version of the bioreactor
system proposed is implementable for this purpose, as safety is a major clinical
concern.
Because most of the currently available hematopoietic cell culture protocols were
developed in conventional culture systems, like multiwells or flasks (Morgan et al,
1999), having a bioreactor that has a high degree of continuity with these systems
makes straightforward the adaptation of these protocols. Besides, it helps
understanding the effective role of mixing in stem cell culture, without the
interference of other culture variables.
Considering the interdisciplinary of stem cell field, where for example biologists,
biotechnologists, and engineers work together on in vitro stem cell culture, it is
important to develop a robust device that can be handled even by users without a
strong technical background, for a wide-spread use, and repeatability of the results
obtained. Thus simplicity in a bioreactor for stem cell culture is not a secondary
aspect.
The milliliter-scale bioreactor designed in this work is constituted by a lid with an
integrated mechanical stirring system, which can be coupled to a standard

Six-well stirred suspension bioreactor 53
disposable six-well plate, and placed inside a biological incubator. Thus, it can take
advantage of incubator temperature and pH control and avoid complex systems to
control these parameters. Furthermore, it allows up to six experiments to be
performed in parallel under stirred suspension conditions.
Physiological oxygen partial pressure is in the range of 2–9% for most adult cells.
Several studies have revealed that oxygen tension affects differently the various
subsets of hematopoietic cells (Simon et al, 2008). Thus a study of oxygen
solubility in different types of media, with and without serum, is performed. The
proposed bioreactor is then implemented to be suitable to perform hypoxia cell
cultures.
Results of CD34+-cell culture in the proposed bioreactor are presented, along with
cellular outcome characterization by hematocytometer, flow cytometry, and
colony-forming cell assays. CD34+-cells were selected from human umbilical cord
blood by either one or two immunomagnetic separation steps.
The bioreactor presented is a promising tool to perform accessible stem cell
cultures under dynamic conditions, and to investigate the effect of convective mass
transport on cell interaction with the local surrounding environment, also under
hypoxia conditions.
4.2 Materials and methods
4.2.1 Bioreactor device
The bioreactor system (Fig. 1) is composed of two principal components: a
conventional polystyrene six-well plate (Becton Dickinson, Milan, Italy), and a lid
with an integrated stirring system. The whole system is put inside a biological
incubator during the cell culture.

54
Figure 1. Section of the bioreactor system coupled with a 6-well plate.
The lid, made of polycarbonate, has a portion that fits the multiwell as a cover, and
a portion that sustains an electrical engine (RS-Components, Milan, Italy).
The first part has six openings, in correspondence to the center of each well of the
plate, for the passage of the stirrer shafts. A detailed view of the coupling between
the opening and the stirrer is shown in Fig. 2 A.
The impeller, made of teflon polytetrafluoroethylene (PTFE), is shaped as a turbine
with 45°-pitched blades (Fig. 2 B), and it is connected to a gear (RS-Components)
by a screw of stainless steel. The motion is transmitted from the electrical engine to
the impellers by a gear train, where the driving gear is directly fixed to the engine
shaft.

Six-well stirred suspension bioreactor 55
The engine is closed into an airtight plastic box for protection from incubator
humidity, and removably fixed to the lid by a bracket. Electrical wires connect the
engine to a power supply (Kert, KAT4VD), which is the only component of the
system that is placed outside of the incubator during cell culture.
The system is designed according to the guidelines in Brodkey et al. (1988).
Figure 2. (A) Section of the impeller embedded in the polycarbonate lid. (B)
Three-dimensional representation of the impeller, shaped as a turbine with 45°-
pitched blades.
4.2.2 Study of oxygen solubility
4.2.2.1 Experimental setup
An experimental setup is developed to perform accurate measurements of oxygen
solubility in different media. A 25-ml Schott Duran bottle (Zetalab Srl, Padua,
Italy) is filled with 5 ml of medium. A definite-composition gas mixture is fed on
medium surface with a flow rate of 100 ml/min. A fluorescent probe is put inside

56
the medium in proximity of the bottle bottom. The bottle top has a silicon part that
is perforated for the probe, and the inlet and outlet gas tubing to pass through.
Briefly the main components of the experimental setup are a system to produce
definite-composition mixtures, a system to ensure temperature control, and the
system of detection itself.
Compressed nitrogen and oxygen cylinders with a purity of 99.999% (Air Liquide,
Milan, Italy) are employed. Thermal mass flow meters EL-FLOW Series F-201C
(Precision Fluid Controls Srl, Milan, Italy), equipped with HAM-LET filters of 7
μm (Precision Fluid Controls Srl), are used to produce mixtures with definite
composition. Gases from flow meters are mixed in a 3-way coupling. All the
connections are non-porous polyamide Rilsan tubing of 4-mm internal diameter,
except a 250-μm diameter tube used to feed the gas mixture at medium surface.
Temperature control is accomplished by putting the 25-ml bottle, containing the
medium, in a thermostatic bath, where temperature is controlled by PID
thermoregulation with GTR2000 Circulator (Isco, Milan, Italy).
Fiber Optic Oxygen Sensor System (GHT Photonics, Padua, Italy) is used to detect
oxygen solubility by fluorescence measurements.
4.2.2.2 Calibration
The oxygen probe is calibrated with water at three different temperatures (27, 37,
47°C). For each temperature, first 100% nitrogen is fed until equilibrium is
reached. Then mixtures of nitrogen with oxygen at different partial pressures (0.04,
0.08, 0.12, 0.16, 0.20 atm) are used, allowing the system to reach equilibrium. All
measurements are repeated three times. Calibration is obtained by comparing the
data to those in Benson and Krause (1976) to convert fluorescence intensity data to
oxygen solubilities.

Six-well stirred suspension bioreactor 57
4.2.2.3 Oxygen solubility measurements
Oxygen solubility in Iscove's Modified Dulbecco's Medium (IMDM), with and
without 10% Fetal Bovine Serum (FBS), is experimentally measured at three
different temperatures (27, 37, 47°C) and partial pressures (0.04, 0.08, 0.12, 0.16,
0.20 atm), following the same procedure used for calibration with water.
Analogous measurements are performed also for Dubecco's Modified Eagle's
Medium (DMEM), with and without 10% FBS, a type of medium commonly used
for stem cell cultures, even if not used in the biological experiments presented in
this work.
4.2.3 Cell culture
4.2.3.1 Cell isolation and culture conditions
Cord blood (CB) units are obtained from Bone Marrow Stem Cell Transplant
Laboratory (Pediatric Oncohaematology Department, Padua, Italy), after informed
consent. The blood from five or six units is used for each experiment.
Cord blood is eluted with 20 ml PBS 1X (Gibco, Invitrogen, Milan, Italy) and
mononuclear cells are isolated by density-gradient centrifugation (2000 rpm, 30
min), layering on equal volume of Ficoll (GE Healthcare). Mononuclear cells are
counted by hematocytometer, and analyzed by flow cytometry as a negative
control.
CD34+ cells are isolated by superparamagnetic microbeads (CD34 antibody,
QBEND-10, Abcam, Cambridge, UK) selection using high-gradient magnetic field
and mini-MACS columns (Miltenyi Biotech, Glodbach, Germany). The magnetic
separation step is repeated twice. A fraction of CD34+-cells of more than 70% was
obtained after one column passage, and of more than 90% after two column

58
passages, verified by flow cytometry (FACS Calibur, Becton Dickinson) after
counterstaining with CD34-phycoerythrin antibody (AC136 clone, Miltenyi
Biotec).
The selected cells are suspended in Iscove’s Modified Dulbecco’s Medium
(Gibco), 10% scomplemented (56°C, 30 min), with 10% FBS (Gibco), 1%
Penicillin/Streptomycin (Gibco), and supplemented with the following human
citokynes (PeproTech Inc, Rocky Hill, NJ): hSCF (50 ng/ml), hTPO (10 ng/ml),
hIL-6 (10 ng/ml), hFL (50 ng/ml), according to the protocol in Gunetti et al (2008).
CD34+ cells are seeded in a 6-well plate (Becton Dickinson) filled with 10 ml of
medium each, and cultured for up to 13 days both under normal oxygen conditions
and in hypoxia. Impeller speed is 15 rpm in all the experiments. Hypoxia cell
cultures are performed by feeding to the system a gas mixture of 5% CO2, 5% O2,
and N2, from a gas cylinder.
4.2.3.2 Cell analyses
In experiments at normal oxygen concentration and hypoxia, cell count and
viability is detected by hematocytometer.
Flow cytometry analyses are performed at day 0, 5.5, and 12.5. After suspension in
40 μl PBS 1X, cells are stained by incubation at 4°C for 15 min with a panel of
monoclonal antibodies: 8 μl of PE-conjugated CD34 (AC136 clone, Miltenyi
Biotec), 7 μl of APC-conjugated CD117 (104D2 clone, Biolegend, Milan, Italy),
and 5 μl of FITC-conjugated CD38 (HIT2 clone, Biolegend), CD41 (HIP 8 clone,
Biolegend), CD61 (monoclonal antibody, Immunotech, Czech Republic). Cells are
also incubated with 5 μl 7-amino-actinomicyn D, 7-AAD (Becton Dickinson), to
analyze only viable cells. Labelled cells are then suspended in 1 ml PBS 1X,

Six-well stirred suspension bioreactor 59
centrifuged (1200 rpm, 5 min) and suspended in 200 μl PBS 1X for flow cytometry
acquisition.
Colony-forming cell (CFC) assays are performed seeding 1000 cells from each
well in a 24-well plate and grown in a semisolid medium (400 μl of
Methylcellulose-MethoCult® GF H4434, StemCell Technologies, Grenoble,
France) for two weeks. The hematopoietic progenitor cell colonies are then
counted: burst-forming unit- erythroid (BFU-E), colony-forming unit granulocyte-
macrophage (CFU-GM).
4.3 Results and discussion
4.3.1 Bioreactor design
The bioreactor is designed to keep cells suspended in conditions that respond to the
essential requirements for a stem cell culture: biocompatibility of materials,
maintenance of sterility, and low shear stress.
All the materials either in contact or in proximity to the cell culture are
biocompatible: polystyrene from the 6-well plate, PTFE from the impellers, and
polycarbonate from the lid (LaIuppa et al, 1997).
The system ensures cell culture sterility as the six-well plate is disposable, and the
lid, after engine removal, is autoclavable at 121°C. Furthermore, as shown in Fig. 1
B, the openings on the lid for the stirrer shaft passage are shaped so that entering
gases pass through a tortuous path that blocks the suspended solids responsible of
carrying contamination agents.
The impeller is shaped as a turbine with 45°-pitched blades to produce an axial
flow pattern that favors cell suspension from the bottom of the well, where cells
otherwise settle. The impeller Reynolds number, Re, is defined as 2
/Re D N ,

60
where D is the impeller diameter (25 mm), N is the impeller rotational speed,
and the medium density and dynamic viscosity respectively. A stirring rate of
15 rpm is chosen for the experiments, to avoid dead zones in the well and to keep
the shear on the cells at low values. In this condition, approximating medium
properties with those of water, Re ≈ 102 and the flow is in the transitional regime
between laminar and turbulent. To verify the maximum shear stress on the cells at
this impeller rate, an approximate calculation of the shear, , at well bottom is
performed by:
tipx vv
y
(4.1)
where tipv is the velocity of the impeller tip (0.02 m/s), and is the distance of the
impeller from the well bottom (5.5mm). The approximate maximum shear stress in
the well is 3
3.6 10
Pa, which is orders of magnitude lower than the critical shear
stress that is harmful for the cells (Hua et al, 1993).
The bioreactor is also implemented to perform hypoxia cell cultures. All the
different components of the bioreactor are sealed to avoid gas leak, and the lid is
provided with an inlet and an outlet. The system is then fed with a gas mixture of
5% O2, 5% CO2, and N2, from a cylinder, after a humidification step.
4.3.2 Oxygen solubility
Accurate measurements of oxygen dissolved in different media, at thermodynamic
equilibrium, are performed at 27, 37, and 47°C. Results for experiments at 37°C are
shown in Fig. 3 for water, DMEM, DMEM supplemented with 10% FBS, IMDM,
and IMDM with 10% FBS. A linear fitting, according to Henry's law, is in
excellent agreement with the experimental data in all cases. From these data

Six-well stirred suspension bioreactor 61
Henry's constants at 37°C are determined, which are reported in Tab. I, along with
the constants at 27 and 47°C.
Figure 3. Thermodynamic data of oxygen solubility at 37°C. Experimental data
and linear fitting of oxygen partial pressure as a function of mol fraction in the
liquid phase, in different media (see legend).
As shown in Tab. I, Henry's constant increases from water to DMEM, and from
DMEM to IMDM, because the high concentration of salts, glucose and other
solutes in the medium causes a phenomenon of salting-out that reduces oxygen
solubility, IMDM is in fact a more protein-rich medium than DMEM.
It is more important to notice the strong impact that 10% FBS supplementation
have on oxygen solubility. At 0.2 bar of oxygen partial pressure, serum decreases
solubility by 9.4% in DMEM, and by 12.2% in IMDM. The effect of serum on
hematopoietic cell cultures involves many complex interactions (Sandstrom et al,
1994), and it is often difficult to discern which serum components and properties
contribute to a particular effect. As oxygen has a significant influence on

62
hematopoietic cell behavior (Nielsen, 1999), one of the aspects to take into
account, when considering serum effects on the cells, is the decreased solubility of
oxygen in culture medium.
Table I. Henry’s constant. Experimentally-derived Henry’s constants for different
media at temperature of 27, 37, and 47°C.
HO2
, [bar] T = 27°C T = 37°C T = 47°C
H2O 45071 51848 57835
DMEM 52401 60411 64148
DMEM+FBS 56788 66675 72533
IMDM 60048 71807 76991
IMDM+FBS 67446 81732 84482
4.3.3 Cell culture
The bioreactor system is used to culture CD34+ cord blood cells. CD34 is a marker
that is associated to stem cell behavior in cord blood, and is commonly used to
isolate cells before seeding. First, preliminary experiments, whose results are not
shown here, are used to optimize the design of the system, for example impeller
geometry, and to choose the proper operative conditions, like working volume and
mixing rate. Then cell cultures are performed, both under normal oxygen
conditions and in hypoxia. Each type of experiment is repeated 2-4 times (as
indicated in figure captions) to account for variability.

Six-well stirred suspension bioreactor 63
4.3.3.1 Experiments at 20% oxygen partial pressure
CD34 is a surface marker commonly used to select hematopoietic stem cells from
the whole pool of umbilical cord blood cells (Jaatinen et al, 2007). The first two
experiments are performed to compare the different proliferation rate of CD34+
cells isolated by either a single- or a double-step magnetic separation. Because of
the efficiency in the separation steps, the fraction of CD34+ cells in the two case is
higher than 70% and 90% respectively, as detected by flow cytometry
measurements immediately after selection (Fig. 4).
Figure 4. Results from flow cytometry measurements of CD34 marker at
pO2=20%. Experimental measurement of CD34 marker on the surface of cells
isolated by a single- (A), and a double-step magnetic separation (B).
Isolated cells are then cultured in the stirred bioreactor and under static conditions
as a control. The two experiments are performed at different initial cell densities

64
because of the scarce number of cells available in the case of a double-step
selection.
In Fig. 5 the fold expansion, which is the cell density normalized by its initial
value, is shown for the two experiments. The initial drop in cell concentration
shown for the double-selection case is the normal cell response at the beginning of
a cell culture because of the adaptation process to the environment.
In both cases, single- and double-selection, stirring increases the proliferation rate,
but this effect was enhanced in the single-step selected cell culture, because of a
higher seeding density that makes material transport a more relevant concern.
Figure 5. Growth curve of cells cultured under static and dynamic conditions at
pO2=20%. Hematocytometer measurements of fold expansion of cells isolated by
one (dashed), and by two magnetic separation steps (solid) cultured under static
conditions (blue) and in bioreactor (red). Initial cell density is 54000 cell/ml for
single-step selected cells, and 10000 cell/ml for double-step selected cells. Mean
and standard deviation data for three repeated experiments for single-step selected
cells, and two repeated experiments for double-step selected cells.

Six-well stirred suspension bioreactor 65
Even if starting from a lower cell density, double-selected cells have a higher
division rate. This confirms that the cells mainly contributing to the population
proliferation are the CD34+ cell fraction. Thus, next experiments will all be
performed seeding cells isolated by an immunomagnetic double-selection.
A second set of experiments at normal oxygen concentration is performed for a cell
culture period of 13 days both under static conditions and in the bioreactor system.
Fig. 6 A and B report the data of cell count and viability measurements performed
by hematocytometer. Results are comparable for cells cultured under static and
dynamic conditions. The lack of difference in cell behavior between the two
conditions is attributed to the lower cell seeding density in these experiments (3600
cell/ml).
Figure 6. Growth curve and viability of cells cultured under static and dynamic
conditions at pO2=20%. Hematocytometer measurements of fold expansion (A)
and percentage of dead cells (B), cultured under static conditions (blue) and in
bioreactor (red). Initial cell density is 3600 cell/ml. Mean and standard deviation
data for three repeated experiments.

66
Fig. 7 shows the results from flow cytometry analyses taken after 5.5 and 12.5 days
of static cell culture. Markers CD34, CD38, CD41, CD61, and CD117 were
analyzed. Human hematopoietic stem cells are CD34+, CD117
+, CD38
–, CD41
–,
CD61– (Iwasaki et al, 2007), but during in vitro culture they change their marker
profile. For example, as shown in Fig. 7, they become more CD34– and CD38
+, this
can be attributed either to cell differentiation or to aberrant changes that occur
because of unsuitable culture conditions.
Figure 7. Flow cytometry measurements of cells cultured under static conditions at
pO2=20%. Profile of markers CD34, CD38, CD41, CD61, and CD117 in the cell
population cultured in static conditions (blue) at day 5.5 (A) and 12.5 (B). Initial
cell density is 3600 cell/ml. Black curves refer to the negative control without
fluorescent staining.
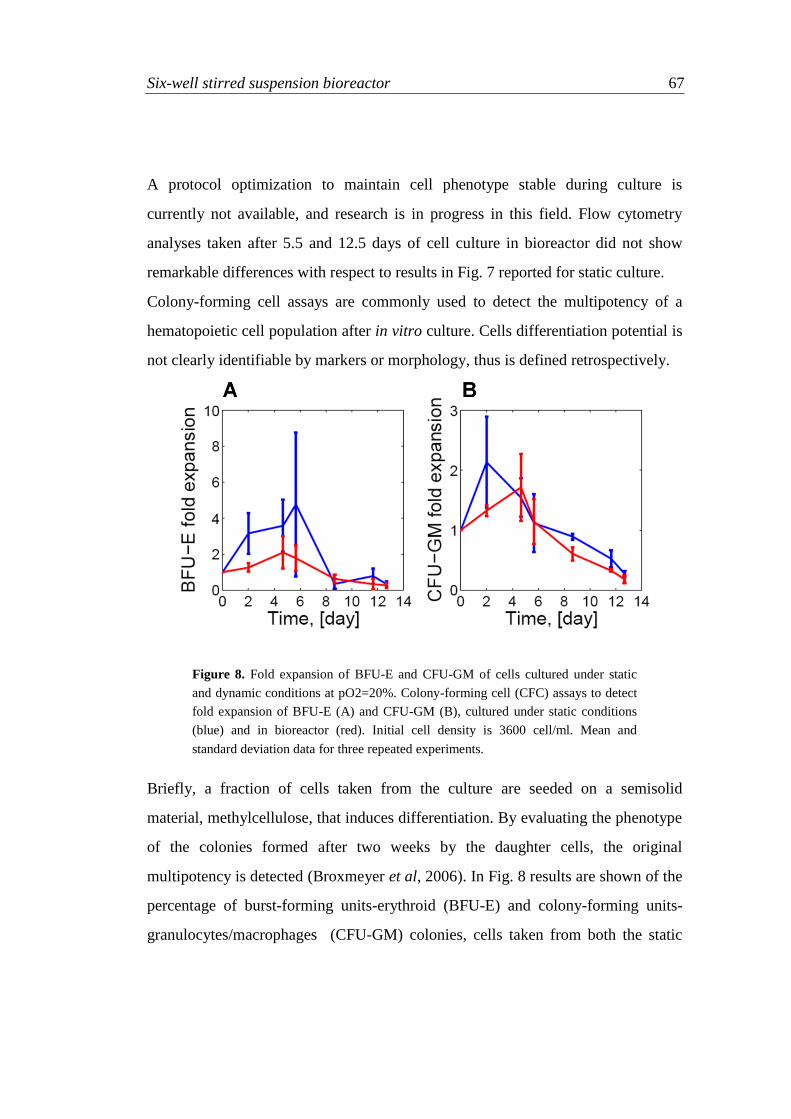
Six-well stirred suspension bioreactor 67
A protocol optimization to maintain cell phenotype stable during culture is
currently not available, and research is in progress in this field. Flow cytometry
analyses taken after 5.5 and 12.5 days of cell culture in bioreactor did not show
remarkable differences with respect to results in Fig. 7 reported for static culture.
Colony-forming cell assays are commonly used to detect the multipotency of a
hematopoietic cell population after in vitro culture. Cells differentiation potential is
not clearly identifiable by markers or morphology, thus is defined retrospectively.
Figure 8. Fold expansion of BFU-E and CFU-GM of cells cultured under static
and dynamic conditions at pO2=20%. Colony-forming cell (CFC) assays to detect
fold expansion of BFU-E (A) and CFU-GM (B), cultured under static conditions
(blue) and in bioreactor (red). Initial cell density is 3600 cell/ml. Mean and
standard deviation data for three repeated experiments.
Briefly, a fraction of cells taken from the culture are seeded on a semisolid
material, methylcellulose, that induces differentiation. By evaluating the phenotype
of the colonies formed after two weeks by the daughter cells, the original
multipotency is detected (Broxmeyer et al, 2006). In Fig. 8 results are shown of the
percentage of burst-forming units-erythroid (BFU-E) and colony-forming units-
granulocytes/macrophages (CFU-GM) colonies, cells taken from both the static

68
and dynamic cultures are able to produce. The decrease in the number of colonies
formed in both cases, static and dynamic, demonstrates a loss of differentiative
potential that is attributable to a culture protocol not adequate to maintain a stable
cell phenotype.
4.3.3.2 Experiments at 5% oxygen partial pressure
Experiments of CD34+ cell culture are performed under hypoxia conditions, with
an oxygen partial pressure of 5%. Cells are seeded at a density of 3600 cell/ml both
in static conditions and in the bioreactor. Fig. 9 presents the data of cell count and
viability.
Figure 9. Growth curve and viability of cells cultured under static and dynamic
conditions at pO2=5%. Hematocytometer measurements of fold expansion (A) and
percentage of dead cells (B), cultured under static conditions (blue) and in
bioreactor (red). Initial cell density is 3600 cell/ml. Mean and standard deviation
data for four repeated experiments.
Comparing results in Fig. 9 A to Fig. 6 A, where cells are cultured in the same
conditions but for oxygen tension, the overall proliferation rate after 12.5 days is
similar. However, in hypoxia conditions there is no decrease in cell density in the
first two days of culture, prove that conditions requires less time for the cells to
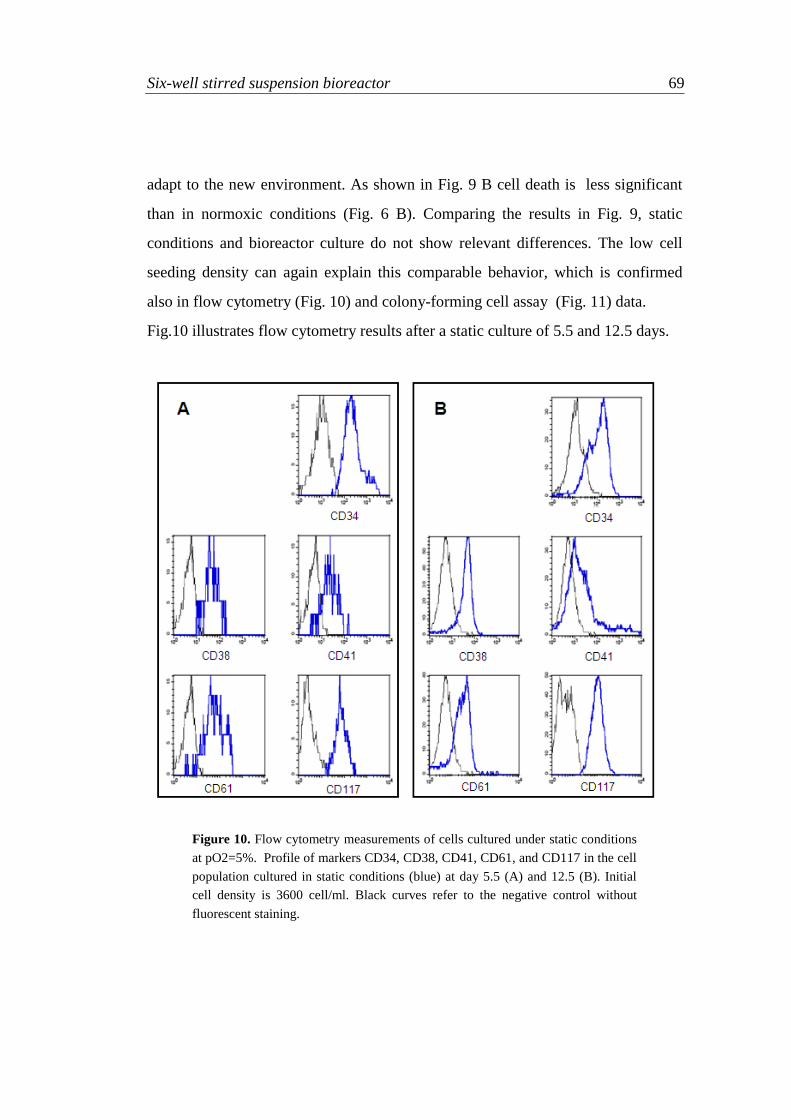
Six-well stirred suspension bioreactor 69
adapt to the new environment. As shown in Fig. 9 B cell death is less significant
than in normoxic conditions (Fig. 6 B). Comparing the results in Fig. 9, static
conditions and bioreactor culture do not show relevant differences. The low cell
seeding density can again explain this comparable behavior, which is confirmed
also in flow cytometry (Fig. 10) and colony-forming cell assay (Fig. 11) data.
Fig.10 illustrates flow cytometry results after a static culture of 5.5 and 12.5 days.
Figure 10. Flow cytometry measurements of cells cultured under static conditions
at pO2=5%. Profile of markers CD34, CD38, CD41, CD61, and CD117 in the cell
population cultured in static conditions (blue) at day 5.5 (A) and 12.5 (B). Initial
cell density is 3600 cell/ml. Black curves refer to the negative control without
fluorescent staining.

70
A comparison with data obtained at 5% oxygen partial pressure (Fig. 7), shows
some immunophenotypic differences: at day 5.5, cells cultured in hypoxia have
higher expression of CD38, CD61, and CD117, whereas a decreased expression of
CD41; at day 12.5, they have comparable profiles of CD34 and CD38, and
increased expression of CD41, CD61, CD117. More biological understanding is
needed to comprehend the implication of these different profiles.
Fig. 11 shows the results from colony-forming cell assays, the trend of BFU-E fold
expansion seems comparable to that reported in Fig. 8 A for normoxic conditions,
whereas that of CFU-GM fold expansion shows an opposite trend. This result
needs further confirmation, seen the high variability detected in these
measurements among the four repeated experiments.
Figure 11. Fold expansion of BFU-E and CFU-GM of cells cultured under static
and dynamic conditions at pO2=5%. Colony-forming cell (CFC) assays to detect
fold expansion of BFU-E (A) and CFU-GM (B), cultured under static conditions
(blue) and in bioreactor (red). Initial cell density is 3600 cell/ml. Mean and
standard deviation data for four repeated experiments.

Six-well stirred suspension bioreactor 71
4.4 Conclusions
In this work a stirred bioreactor system was developed for hematopoietic stem cell
culture. It is a lid with an integrated stirring system that has dimensions compatible
with conventional disposable six-well plates. It was designed as simple, user-
friendly, and robust as possible, and requires a little bit more than handling a lid for
use. Only essential features for stem cell culture were included, such as
biocompatibility of materials, sterility, low-shear mixing with cell suspension. It
was possible to reduce system complexity by exploiting temperature and pH
control of the biological incubator, where the bioreactor is placed during cell
culture.
In this device cell culture is performed under mixing conditions, which is the only
difference respect to conventional culture systems, such as multiwell or flasks,
where medium is stagnant. Thus it allows the use of already developed protocols of
hematopoietic stem cell culture, looking exclusively at the effect of mixing. Any
introduced difference with respect to this reference culture system may impact
cellular outcome in a still unknown way, considering that our understanding of
stem cell behavior is still underway.
Besides the bioreactor allows up to six parallel cell cultures under identical
conditions. This is particularly interesting when cell culture is performed for long
periods of time with demi-populations (Gammaitoni et al, 2004), where at fixed
intervals of time cell culture from one well is split in two wells and diluted, to
decrease cell density, and then re-cultured.
A slightly more complex version of the bioreactor allows cultures to be performed
under hypoxia conditions, as oxygen tension seems to play a key role in regulating
hematopoietic stem cell behavior. In this work, the oxygen solubility in different
types of media was studied, in order to understand the actual cell concentration

72
present during cell culture. This is important for example when comparing different
amounts of serum added to the culture medium, as serum strongly affects oxygen
solubility.
The bioreactor system was tested for up to 13-day cultures of human hematopoietic
stem cells from umbilical cord blood, both under normal oxygen conditions and in
hypoxia. Experiments at high cell density showed an increase in cell proliferation
rate under dynamic conditions with respect to static conditions, whereas at low cell
densities no remarkable difference was noticed. This can be a confirmation of the
comparable behavior of the bioreactor culture system with respect to the static
culture under conditions where mass transport is not limiting. However, the
absence of differences could also be attributable to unknown cell feedback
regulatory mechanisms that can possibly hide variations in cell behavior at the
conditions under study in this work. More biological insight in biological
mechanisms is needed to understand concentration-dependent cell behavior.
4.5 References
Benson BB, Krause D. 1976. Empirical laws for dilute aqueous solutions of
nonpolar gases. J Chem Phys 64:689-709.
Brodkey RS, Hershey HC. 1988. Transport phenomena: a unified approach.
Singapore: McGraw-Hill Inc. 847 p.
Broxmeyer HE, Srour E, Orschell C, Ingram DA, Cooper S, Plett PA, Mead
LE, Yoder MC. 2006. Cord blood stem and progenitor cells. Meth Enzymol
419:439-473.
Gammaitoni L, Weisel KC, Gunetti M, Wu KD, Bruno S, Pinelli S, Bonati
A, Aglietta M, Moore MA, Piacibello W. 2004. Elevated telomerase activity and
Six-well stirred suspension bioreactor 73
minimal telomere loss in cord blood long-term cultures with extensive stem cell
replication. Blood 103(12):4440-8.
Gunetti M, Ferrero I, Rustichelli D, Berger M, Gammaitoni L, Timeus F,
Piacibello W, Aglietta M, Fagioli F. 2008. Refreezing of cord blood hematopoietic
stem cells for allogenic transplantation: in vitro and in vivo validation of a clinical
phase I/II protocol in European and Italian Good Manufacturing Practice
conditions. Exp Hematol 36(2):235-43.
Hua JM, Erickson LE, Yiin TY, Glasgow LA. 1993. A review of the effects
of shear and interfacial phenomena on cell viability. Crit Rev Biotechnol
13(4):305-328.
Iwasaki H, Akashi K. 2007. Hematopoietic developmental pathways: on
cellular basis. Oncogene 26:6687-6696.
Jaatinen T, Laine J. 2007. Isolation of hematopoietic stem cells from human
cord blood. Curr Protoc Stem Cell Biol. John Wiley & Sons Inc.
LaIuppa JA, McAdams TA, Papoutsakis ET, Miller WM. 1997. Culture
materials affect ex vivo expansion of hematopoietic progenitor cells. J Biomed
Mater Res 36:347-59.
Kirouac DC, Zandstra PW. 2008. The systematic production of cells for cell
therapies. Cell Stem Cell 3:369-381.
Morgan J.R. and Yarmush M.L. Tissue engineering methods and protocols.
Humanda Press 1999
Nielsen LK. 1999. Bioreactors for hematopoietic cell culture. Annu Rev
Biomed Eng 01:129-152.
Sandstrom CE, Miller WM, Papoutsakis ET. 1994. Serum-free media for
cultures of primitive and mature hematopoietic cells. Biotechnol Bioeng 43(8):706-
33.

74
Simon MC, Keith B. 2008. The role of oxygen availability in embryonic
development and stem cell function. Molec Cell Biol 9:285-296.

Chapter 5
Cell population modeling describes
intrinsic heterogeneity
In this chapter a theoretical study of the intrinsic heterogeneity of a stem cell
population is presented. The analysis is performed by a computational approach
based on a population balance model in the absence of the environmental extrinsic
heterogeneity sources described in Chapter 2.
5.1 Introduction
In this work, a theoretical study of the intrinsic heterogeneity of a cell population
under homogeneous environmental conditions is performed. HSCs have a number
of different type of receptors on their surface to be sensitive to a variety of stimuli
from the stem cell local environment in which they reside (Metcalf et al, 1971). It
is a difficult task to model contemporarily these different kinds of interactions at
the population level. As increasing the complexity of the mathematical model by
enhancing the detail level precludes a more general insight into the system
(Stelling, 2004), the cell population is considered heterogeneous only in the

76
number of cell surface receptors and receptor-ligand complexes formed, and
consideration of the intracellular pathways is kept at a minimum. A single receptor-
ligand pair is considered, selected on the basis of the crucial role it covers in the
first steps of HSC expansion, in fact this ligand is present in most of the expansion
protocols: c-kit and Stem Cell Factor (SCF) (Sharma et al, 2006).
The model is in the form of a population balance equation (Ramkrishna, 2000),
coupled with an equation for ligand consumption. At the single-cell level it
accounts for the following processes: the reversible reaction between receptors and
ligand molecules to form receptor-ligand complexes, the production and
degradation of receptors, the degradation of complexes, and cell division. As an
understanding of a HSC culture is the result of the combination of experimental
and computational approaches (Kitano et al, 2002), the model is developed to
connect the influence of an operative culture variable, ligand concentration, to a
macroscopic measurable quantity, receptor distribution in the population. First
simulations reproduce the cell population behavior in ideal culture conditions
where ligand concentration is kept constant. Then a simulation is performed to
describe the heterogeneity evolution in culture when ligand is added all at once at
the beginning of the cell culture, as happens in most of the conventional culture
protocols. Finally some general considerations are drawn on the mechanisms that
generate the intrinsic heterogeneity in the cell population, and on the conditions to
reduce heterogeneity for optimized protocols.
5.2 Theoretical framework
The intrinsic heterogeneity of a cell population is related to many different
phenomena. In this work, we consider only heterogeneity in the number of surface
cell receptors, and receptor-ligand complexes produced in presence of ligand in

Cell population modeling describes intrinsic heterogeneity 77
culture medium, because of the importance of receptor-ligand interactions in cell
response to the environment. A multiscale approach is used, the bottom-up
processes examined are:
single-cell signaling related to production and consumption of receptors and
complexes;
ligand-dependent cell proliferation at population level;
overall consumption of ligand in the cell culture system.
Fig. 1 A shows a graphical representation of the processes considered at the single-
cell level. Receptors are produced by a cell at constant rate, and internalized and
degraded at a rate proportional to their number on cell surface. Ligand, as a dimer,
reacts reversibly with two receptor molecules forming one complex molecule.
Complex molecules are internalized at a rate proportional to their number on cell
surface. The number of complex molecules in a cell is strictly related to
downstream intracellular processes. In particular its effect in enhancing cell
proliferation rate is considered (Fig. 1 B). Cell division has an important impact in
producing heterogeneity in the cell population. First, receptors and complexes are
split between the two daughters when a mother cell divides, and thus the two cells
formed are different from the mother that have produced them (Fig. 1 B).
Furthermore, cells divide at different rates because of the different number of
complexes they have, consequently different generations of cells are present in
culture at the same time (Fig. 1 C). The overall mass balance of ligand in the cell
culture system is performed, taking into consideration that ligand is consumed by
each cell in the population at different rates, according to the number of receptors
on its surface.

78
Figure 1. Schematic representation of the mechanisms taken into account in the
mathematical model. (A) At the single cell level, receptors are produced and
degraded; ligand is present as a dimer in the extra-cellular space and reacts with
two receptor molecules to form a complex; the complex is degraded. (B) At cell
division, receptors and complexes are split equally between the two daughter cells;
the complex enhances the proliferation rate. (C) The population is composed by
cells belonging to different generations (exemplified by the numbers inside the
cells). Model simulates the distribution of the number of receptors/cell (red) and of
the number of complexes/cell (blue) for the total population (thick line) and for
each cell generation (thin line).

Cell population modeling describes intrinsic heterogeneity 79
The combination of these phenomena leads to a population of cells that has
distributed properties as for the number of receptors and complexes. The
mathematical model developed can be used to understand the relative importance
of different contributions that lead to the intrinsic cell population heterogeneity.
The model is analyzed for two different experimental situations:
cell culture performed in batch mode, where all the ligand is added at the
beginning of the experiment;
cell culture performed at constant ligand concentration.
These two cases represent, respectively, the more common actual methodology
used in biological experiments of HSC culture, and the ideal case in presence of a
perfect control system that add exactly the L amount that is consumed by the cells.
5.3 Mathematical model
5.3.1 General population balance model
A population balance equation (PBE) (Ramkrishna, 2000) is a conservation
equation that accounts for various ways in which cells of a specific state can either
form in or disappear from the system, like by cell division and cell growth. The
complete formulation of the mathematical model developed in this work is given
by the bivariate PBE:
(5.1)
( , , )( , ) ( , , ) ( , ) ( , , )
( ) ( , , ) 2 ( ') ( , | ', ') ( ', ', ) ' ' ,
x y
y x
W x y tr x y W x y t r x y W x y t
t x y
y W x y t y p x y x y W x y t dx dy

80
where the independent variables are: x , number of receptors per cell; y , number
of complexes per cell; and t , time. x and y are approximated as continuous
variables. ( , , )W x y t is the joint probability density function in x and y multiplied
by the cell density; in particular, ( , , )W x y t dxdy represents the number of cells
per unit culture volume having number of receptors between x and x dx , and
number of complexes between y and y dy , at time t .
( , )xr x y is the rate of variation of receptor number at the single-cell level, whereas
( , )yr x y that of the number of complexes. ( )y is the cell division rate; in the
case of a perfectly homogeneous population (same number of complexes in all the
cells), it is equivalent to the commonly used specific growth rate, :
(5.2)
where cellN is the cell density.
( , | ', ')p x y x y dxdy , the partitioning function, represents the probability that a
mother cell with status [ ', ' ']x x dx and [ ', ' ']y y dy will produce upon division
a daughter cell with status [ , ]x x dx and [ , ]y y dy . Because of the
conservation of the number of receptors and complexes at cell division, it must be
satisfied the equality ( , | ', ') ( ' , ' | ', ')p x y x y p x x y y x y .
The first term on the rhs of Eq. (5.1) accounts for mother cells disappearing after
cell division, while the second term for the two daughter cells introduced by the
same process.
The PBE is coupled with the equation for ligand consumption, given by:
2
2 ,2
L onL x off y
dN kN N k N
dt (5.3)
where 2LN is the number of ligand dimer molecules per unit volume of culture;
onk and offk are model parameters; xN and yN are the total number of receptors
1 ,cell
cell
dN
N dt

Cell population modeling describes intrinsic heterogeneity 81
and complexes, respectively, per unit volume of culture, derived as first moments
of ( , , )W x y t :
0 0
( , , ) .xN x W x y t dxdy (5.4)
An analogous expression holds for yN .
5.3.2 Single-cell process kinetics
The mathematical expressions of xr and yr depend on the rates of different
phenomena: the reversible receptor-ligand reaction:
2 22 ( ) ,on
off
k
kR L RL (5.5)
the receptor synthesis and degradation:
,prod degk kR (5.6)
and the complex internalization:
2( ) .intkRL (5.7)
The final balances are given by:
2 2 ,x on L off prod deg
dxr k N x k y k k x
dt (5.8)
and
2 .2
ony L off int
dy kr N x k y k y
dt (5.9)
82
Cell division rate, , is composed of a basal rate in absence of ligand, and a
second term proportional to the number of complex molecules present in the cell:
2 .div divk k y (5.10)
Receptors and complexes are assumed to be split equally between the two daughter
cells. Thus, the partitioning function, p , is given by:
(5.11)
5.3.3 PBE model by generations
As previously pointed out, an important source of heterogeneity in the cell
population is introduced at cell division. Thus a system of PBEs can be used to
track the temporal evolution of cells belonging to different generations:
(5.12)
where superscript 2,...,q Q is the number of the generation, and Q is the total
number of generations present during the culture period. The mother cells
disappearing from ( 1)q -generation are introduced in the q -generation PBE as
daughter cells. The equations for each generation are similar except for the first
generation, the oldest present in culture, whose equation does not show the
(1)(1) (1) (1)
( )( ) ( ) ( ) ( 1)2 ' '
x y
qq q q q
x y
y x
Wr W r W W
t x y
Wr W r W W pW dx dy
t x y
' ', .
2 2
x yp x y

Cell population modeling describes intrinsic heterogeneity 83
daughter-entrance term. Eqs. (5.12) are coupled with Eq. (5.3) for ligand
consumption.
Cells in each generation, before dividing, tend to a steady-state, dependent on
ligand concentration, that is calculated by solving the coupled Eqs. (5.8) and (5.9),
given by:
deg 2
( ) ,
( )
int off prodss
int off int on L
k k kx
k k k k k N (5.13)
and
2
deg 2
/ 2 ,
( )
on prod Lss
int off int on L
k k Ny
k k k k k N (5.14)
where subscript ss stands for steady-state.
5.4 Simulation and analysis
5.4.1 Numerical solution and parameter estimation
A numerical solution of the mathematical model given by Eqs. (5.3) and (5.12) has
been developed in this work. Briefly, each ( )qW is approximated by a bivariate
normal distribution with time-dependent parameters. The Method of Moments
(Ramkrishna, 2000) is then applied to convert the model to a set of ordinary
differential equations, as described in detail in Appendix 5.8.1. All model
simulations in this work are performed using the ode113 solver in Matlab. Specific
parameter values used for the kinetic expressions are summarized in Tab. I,
whereas their derivation is provided in Appendix 5.8.2.

84
Table I. Parameter values used for all the simulations, if not otherwise specified.
* indicates references for data directly available
** indicates references for data adapted from literature
Parameter Value Unit Reference
onk 162.8 10 ml/molecule/s Yee et al. (1993)
offk 43.36 10 1/s Lev et al. (1992)
intk 31.5 10 1/s Yee et al. (1993)
prodk 2 molecule/cell/s Lauffenburger et al (1993)
degk 410 1/s Lauffenburger et al (1993)
divk 63.7 10 1/s Ko et al. (2007)
2divk 97 10 cell/molecule/s Piacibello et al. (1997)
5.4.2 Model output
A preliminary simulation is performed to generate the initial conditions for all the
simulations shown in the Results section. At the beginning the population is
considered containing all cells in the first generation, with mean number of
receptors equal to ssx , mean number of complexes equal to ssy , and null standard
deviation of both receptors and complexes. This first simulation is run for a time
interval of 3 days in absence of ligand. The final distributions of receptors and
complexes are used as input for the subsequent simulations, where the initial cell
density is fixed at 610 cell/ml.
The proposed model can simulate the temporal evolution of the distributions of
receptors and complexes per cell for each generation. The results will be
summarized in the form of the following statistics: the mean number of receptors
and complexes per cell, x and y , both for the total population and for
each cell generation; the coefficient of variation (which is the standard deviation

Cell population modeling describes intrinsic heterogeneity 85
divided by the mean), xCV and yCV , of the number of receptors and complexes
per cell, both for the total population and for each cell generation; the standard
error of the mean for the generations with respect to the mean values of the total
population normalized by the mean, /xSEM x and
/ySEM y :
(5.15)
where ( )qx is the mean number of receptors in the q -generation. An analogous
expression holds for ySEM . Simulations are performed for the two cell culture
conditions of constant ligand concentration, and with ligand added all at once at
0t , thus progressively decreasing in concentration.
5.5 Results
5.5.1 Simulations at constant ligand concentration
First a simulation is computed at constant ligand concentration. As it is shown in
Fig. 2 A (dashed line), it is necessary to continuously add ligand to keep the
concentration constant, because of single-cell ligand consumption, coupled with the
increase of cell density. The cell density in culture, cellN , increases exponentially
(Fig. 2 B). On the contrary, each cell generation, after its entrance, first increases in
cell number, and then decreases and disappears. Thus, the cell population has a
time-dependent composition in terms of fraction of cells belonging to different
generations. Cells in each generation appear with half the number of receptors and
complexes of their mother cells, and then tend to the steady-state given by Eqs.
(5.13) and (5.14). When a new generation enters, its mean properties, x and
1/22
( )
1 ,
qx
x x
SEMQ

86
y , are quite different from those of the total population, but its contribution to
the whole is limited by the few cells it contains (Fig. 2 C and E).
Figure 2. Results at constant ligand concentration (20 ng/ml). (A) Constant ligand
concentration in culture (solid line), total amount of ligand added to keep
concentration constant (dashed line). (B) Cell density of the total population (thick
line), and of the generations indicated (thin lines) as a function of time. (C) Mean
number of receptors/cell for the total population (black solid line), and for the same
generations indicated in B (red lines), as a function of time. Steady-state of the
number of receptors/cell (black dashed line) as a function of time. (D) Coefficient
of variation of the number of receptors/cell for the total population (black line), and
for the same generations indicated in B (red line). (E-F) Analogous to C-D for the
number of complexes/cell.

Cell population modeling describes intrinsic heterogeneity 87
The coefficients of variation for the number of receptors and complexes, xCV and
yCV , quantitatively describe the heterogeneity in the cell population and inside
each generation. They are calculated by the expression:
,x
xCVx
(5.16)
where x is the standard deviation of the number of receptors, either of the total
population or of the single generations. An analogous expression holds for yCV .
Unlike standard deviations, coefficients of variation of different distributions can
be compared as they are normalized by the respective mean. A part from the first
generation that has practically null xCV and yCV , because all of its cells reach the
steady-state, all next generations have a certain degree of heterogeneity because of
cells from the previous generation continuously entering with a smaller number of
receptors and complexes (Fig. 2 D and F).
Whereas the properties of each cell generation are time-dependent, the total
population distribution of receptors and complexes exhibits a pseudo-steady-state.
In Fig. 3 results are presented to show the dependence of this steady-state from
different constant ligand concentrations. A higher ligand concentration produces an
increase in y (Fig. 3 G) that affects the proliferation rate, according to Eq. 10,
increasing final cell density (Fig. 3 B). As the dependence of y on ligand
concentration is not linear this effect is more relevant at small values of 2LC . At
the single generation level, an increase of ligand concentration causes a decrease of
heterogeneity, xCV and yCV (Fig. 3 E and H), because of the reduction of time
cells need to reach the steady-state, given by Eqs. (5.13) and (5.14).

88
The total population heterogeneity, xCV and yCV (Fig. 3 E and H), arises from
three different sources:
the cell population is composed of a distribution of different generations
(Fig. 3 C);
it has an inter-generational heterogeneity, because the mean properties of
each generation, x and y , differ from each other (Fig. 3 D and G);
it has an intra-generational heterogeneity, as each generation is
heterogeneous on its own (Fig. 3 E and H).
The first source of heterogeneity is negligible as long as different generations have
the same properties. The relative importance of the second and third sources is
dependent on the particular kinetics considered for the single-cell processes and for
cell division. xCV and yCV are a measure of the global heterogeneity of the
population, whereas xSEM and ySEM quantify only the inter-generational
contribution.
5.5.2 Different ligand administration profiles
In the previous case of constant ligand concentration, ligand needs to be
continuously added to the system. In the absence of a precise control, ligand
concentration in culture is usually changing with time. In Fig. 4 and Fig. 5 results
are presented that show a comparison between the case of constant ligand
concentration, already analyzed, and that where ligand is added to the cell culture
all at once at 0t . The simulations cover a period of 7 days. To ensure a fair
comparison, an equal amount of ligand is administered in the two cases for the
whole period.
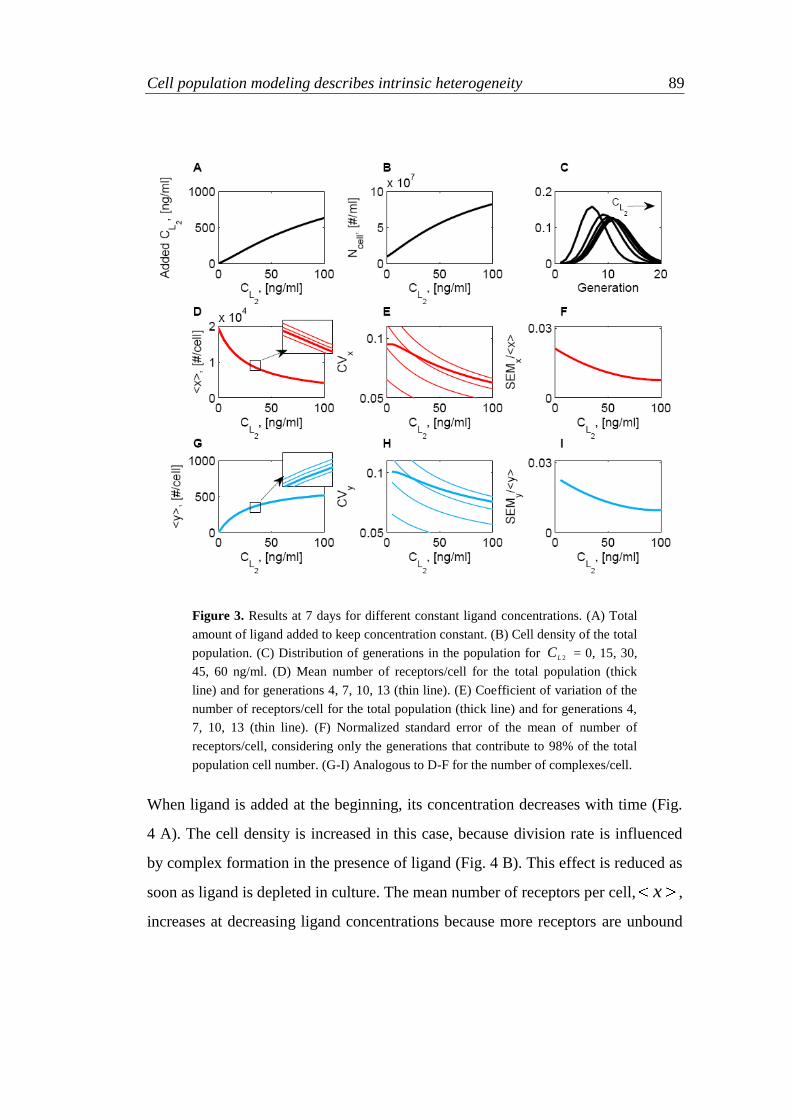
Cell population modeling describes intrinsic heterogeneity 89
Figure 3. Results at 7 days for different constant ligand concentrations. (A) Total
amount of ligand added to keep concentration constant. (B) Cell density of the total
population. (C) Distribution of generations in the population for 2LC = 0, 15, 30,
45, 60 ng/ml. (D) Mean number of receptors/cell for the total population (thick
line) and for generations 4, 7, 10, 13 (thin line). (E) Coefficient of variation of the
number of receptors/cell for the total population (thick line) and for generations 4,
7, 10, 13 (thin line). (F) Normalized standard error of the mean of number of
receptors/cell, considering only the generations that contribute to 98% of the total
population cell number. (G-I) Analogous to D-F for the number of complexes/cell.
When ligand is added at the beginning, its concentration decreases with time (Fig.
4 A). The cell density is increased in this case, because division rate is influenced
by complex formation in the presence of ligand (Fig. 4 B). This effect is reduced as
soon as ligand is depleted in culture. The mean number of receptors per cell, x ,
increases at decreasing ligand concentrations because more receptors are unbound
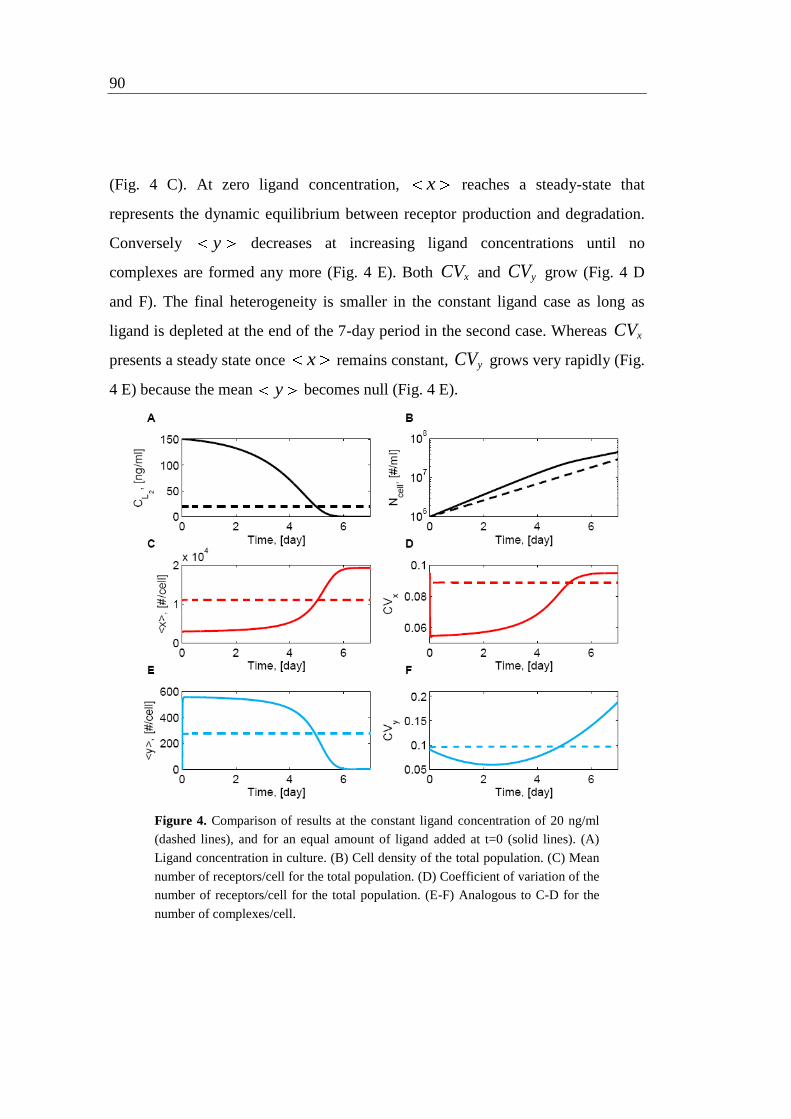
90
(Fig. 4 C). At zero ligand concentration, x reaches a steady-state that
represents the dynamic equilibrium between receptor production and degradation.
Conversely y decreases at increasing ligand concentrations until no
complexes are formed any more (Fig. 4 E). Both xCV and yCV grow (Fig. 4 D
and F). The final heterogeneity is smaller in the constant ligand case as long as
ligand is depleted at the end of the 7-day period in the second case. Whereas xCV
presents a steady state once x remains constant, yCV grows very rapidly (Fig.
4 E) because the mean y becomes null (Fig. 4 E).
Figure 4. Comparison of results at the constant ligand concentration of 20 ng/ml
(dashed lines), and for an equal amount of ligand added at t=0 (solid lines). (A)
Ligand concentration in culture. (B) Cell density of the total population. (C) Mean
number of receptors/cell for the total population. (D) Coefficient of variation of the
number of receptors/cell for the total population. (E-F) Analogous to C-D for the
number of complexes/cell.

Cell population modeling describes intrinsic heterogeneity 91
Fig. 5 is analogous to Fig. 3. But, while in Fig. 3 2LC is the actual ligand
concentration in culture, in Fig. 5 it refers to the total amount added in 7 days. The
concentration *
2LC instead refers to the actual ligand concentration in culture after
7 days (Fig. 5 A).
Figure 5. Results at 7 days for different total amounts of ligand added for the two
cases: ligand constant (dashed lines) and ligand added at t = 0 (solid lines).
Abscissas always refer to the total amount of ligand added in 7 days. (A) Ligand
concentration in culture. (B) Cell density of the total population. (C) Distribution
of generations in the population for 2LC = 0 and 500 ng/ml. (D) Mean number of
receptors/cell for the total population. (E) Coefficient of variation of the number of
receptors/cell for the total population. (F) Normalized standard error of the mean of
number of receptors/cell, considering only the generations that contribute to 98%
of the total population cell number. (G-I) Analogous to D-F for the number of
complexes/cell.

92
The proliferation rate is highly enhanced when ligand is added since the beginning
(Fig. 5 B), but the cell population composition in terms of fraction of cells for each
generation is almost not affected (Fig. 5 C). The increased proliferation rate is thus
not related to a higher number of generations in culture, but to an increase of the
proliferation rate of the first generations, because they experienced a very high
ligand concentration in the first period of culture. In the case of ligand added at
0t , the simulation results show that population properties are almost invariant to
changes of ligand total amount (Fig. 5 D-I). This can be explained considering that
a higher amount of ligand increases the proliferation rate, thus in any case after 7
days almost all the ligand is depleted, and population heterogeneity increased (Fig.
5 E and H).
5.5.3 Dimensionless analysis of cell population heterogeneity
A dimensionless analysis is performed to understand the fundamental mechanisms
that play a crucial role in determining intrinsic heterogeneity in a cell population.
To determine how close to the steady-state cells in each generation arrive before
dividing, two characteristic times are calculated. The characteristic time of cell
division, div , is given by the average doubling time of the cell population:
2
log(2) ,div
div div ssk k y (5.17)
where ssy is calculated for different ligand concentrations. The characteristic time
for a newborn cell to reach the steady-state, ss , is calculated by solving the
system of Eqs. (5.8) and (5.9), with the initial condition of a cell having
/ 2ssx x and / 2ssy y , for different ligand concentrations. ss represents the
time needed to reach 99% the number of receptors and complexes of the steady-
state. Fig. 6 A shows the relationship between the ligand concentration and the

Cell population modeling describes intrinsic heterogeneity 93
characteristic time ratio for the single-cell kinetics considered in this work. Fig. 6 B
and C show the dependence of population heterogeneity in the number of receptors
and complexes, xCV and yCV , from the ratio /div ss . xCV and yCV are
calculated by solving Eqs. (5.12) at different constant ligand concentrations. The
distinct curves are obtained for different sets of parameters. In particular, one
parameter was doubled at a time.
Figure 6. Dimensionless analysis of intrinsic heterogeneity. Different types of
lines refer to results obtained by doubling the parameter indicated by the legend.
(A) Relationship between the ratio of the characteristic times and ligand
concentration. (B) Coefficient of variation of the number of receptors/cell for the
total population as a function of the ratio of the characteristic times. (C) Analogous
to B for the number of complexes/cell.

94
Intrinsic heterogeneity shows a dependence on the characteristic time ratio. In
particular a reduction of cell population heterogeneity is achieved when cells
proliferate more slowly, for higher div . This dependence is insensitive to arbitrary
parameter changes in the model (Fig. 6 B and C). Thus the ratio /div ss is a
dimensionless number that can be used to characterize intrinsic heterogeneity in the
case presented in this work, calculated for ligand concentration kept constant in
culture. If ligand concentration changes slowly in culture, with a characteristic time
much larger than div and ss , then results in Fig. 6 A and B are a good
approximation, even in that conditions. This is useful to understand the efficiency
in ligand concentration control that is necessary to reduce cell population intrinsic
heterogeneity.
Because of their generality, Fig. 6 B and C could be considered as operative
diagrams for protocol optimization, once it is known the relationship between
/div ss and ligand concentration, which is dependent on the particular kinetics of
the system under study.
5.6 Conclusions
Expansion of HSCs in vitro is required for a wider use of UCB as a source of stem
cells for cell therapy (Hofmeister et al, 2006). The control of the phenotype of cells
from the culture is necessary for a safe clinical application (Kirouac et al, 2008).
Heterogeneity in the expanded cell population needs to be reduced, as small
fractions of different cells can contribute negatively to the clinical response to the
therapy (Bryder et al, 2006). It is widely recognized that heterogeneity in a cell
population arises because of spatial gradients in metabolite and growth factor
concentrations over the culture volume. Dynamic culture systems, like bioreactors,
are convenient means to reduce these spatial inhomogeneities (Blanch et al, 1997).

Cell population modeling describes intrinsic heterogeneity 95
But even in perfect mixing conditions, a cell population presents a certain degree of
intrinsic heterogeneity.
In this work, a theoretical study was performed to understand the sources of
intrinsic heterogeneity under perfectly homogeneous culture conditions. The
heterogeneity considered was that in the number of receptors and complexes per
cell. The focus on receptor-ligand mechanism was motivated by the importance it
has in the cell interaction with the environment. Furthermore it connects an
operative variable in cell culture, ligand concentration, to a measurable single-cell
property, receptor number. In particular, the mathematical model developed
focuses on c-kit-SCF pair.
First, intrinsic heterogeneity was studied in the ideal case of constant ligand
concentration representing the ideal condition to have a constant quality of cell
culture outcome. Even in this case, intrinsic heterogeneity is generated at cell
division, because of the partitioning of receptors and complexes molecules from a
mother cell to the two daughters. The overall population presents steady
distributions of receptors and complexes, whereas the different generations of cells
that it contains have time-dependent properties. Working at different ligand
concentrations produces a cellular outcome with different properties. The effect of
a change in ligand concentration resulted more pronounced at low ligand
concentrations because of the nonlinear dependence of the different processes from
ligand concentration.
To study the importance of ligand administration kinetics, a case was studied where
the ligand is added all at once at the beginning of culture. Cell population
properties become time-dependent in this case also for the total population, thus the
time duration of cell culture becomes an additional parameter to consider. A
comparison was performed between the ideal case of constant ligand concentration

96
and the case where an equal amount of ligand is added all at once at the beginning.
The final cellular outcome has a different heterogeneity in the two cases. In
particular cell population heterogeneity increases very rapidly as soon as ligand
concentration falls under a certain threshold in the second case. On the overall, it
seems important not to completely deplete ligand concentration in culture to
maintain reasonable values of heterogeneity. The same comparison was performed
for different amounts of ligand added in the same span of time. Heterogeneity
remains higher in the condition with ligand added at the beginning, because the
higher proliferation rate causes ligand to be depleted in 7 days, even when starting
at very high initial ligand concentrations. In the range of ligand concentrations
normally used (20-100 ng/ml), keeping ligand concentration constant helps in
reducing population heterogeneity.
The intrinsic heterogeneity is not avoidable as long as cells are dividing, but
working close to constant ligand conditions can effectively reduce it. The choice of
optimal ligand concentration to minimize population heterogeneity is dependent on
the relative rates of cell division and single-cell steady-state achievement, Fig. 6
summarizes this result. Fig. 6 B and C can be considered as operative diagrams, as
they have a much wider applicability than the model presented here. In fact,
besides being invariant to the model parameters used, it accounts also for different
mathematical forms of single-cell kinetics, xr and yr , as long as the cells tend to
one stable steady-state, and do not interact with each other. Other simple
expression of the division rate, , can be also included in Fig. 6 B and C, but a
deeper analysis should be performed in this case. Given the relationship between
ligand concentration in culture and the characteristic time ratio, which is dependent
on the specific kinetics considered, it is possible to estimate cell population

Cell population modeling describes intrinsic heterogeneity 97
heterogeneity from Fig. 6 B and C, in the ideal case when external environmental
sources of heterogeneity are neglected.
5.7 References
Blanch HW, Clark DS. 1997. Biochemical engineering. New York: Marcel
Dekker Inc. 702 p.
Bryder D, Rossi DJ, Weissman IL. 2006. Hematopoietic stem cells - The
paradigmatic tissue-specific stem cell. Am J Pathol 169(2):338-346.
Hofmeister CC, Zhang J, Knight KL, Le P, Stiff PJ. 2007. Ex vivo
expansion of umbilical cord blood stem cells for transplantation: growing
knowledge from the hematopoietic niche. Bone Marrow Transplantation 39:11-23.
Kirouac DC, Zandstra PW. 2008. The systematic production of cells for cell
therapies. Cell Stem Cell 3:369-381.
Kitano H. 2002. Computational systems biology. Nature 420:206-210.
Ko KH, Odell R, Nordon RE. 2007. Analysis of cell differentiation by
division tracking cytornetry. Cytometry part A 71A(10):773-782.
Lauffenburger DA, Linderman JJ. 1993. Receptors. Model for binding,
trafficking and signaling. New York:Oxford University Press.
Lev S, Yarden Y, Givol D. 1992. Dimerization and activation of the kit
receptor by monovalent and bivalent binding of the Stem Cell Factor. J Biol Chem
267(22):15970-15977.
Metcalf D, Moore, MAS. 1971. Hematopoietic Cells. Amsterdam: North
Holland.
Piacibello W, Sanavio F, Garetto L, Severino A, Bergandi D, Ferrario J,
Fagioli F, Berger M, Aglietta M. 1997. Hematopoietic stem cells from cord blood

98
extensive amplification and self-renewal of human primitive hematopoietic stem
cells from cord blood. Blood 89: 2644-2653.
Ramkrishna D. 2000. Population balances theory and applications to
particulate systems in engineering. San Diego:Academic Press.
Sharma S, Gurudutta GU, Satija NK, Pati S, Afrin F, Gupta P, Verma YK,
Singh VK, Tripathi RP. 2006. Stem cell c-KIT and HOXB4 genes: Critical roles
and mechanisms in self-renewal, proliferation, and differentiation. Stem Cells Dev
15(6):755-78.
Stelling J. 2004. Mathematical models in microbial systems biology. Curr
Opin Microbiol 7:513-518.
Yee NS, Langen H, Besmer P. 1993. Mechanism of kit ligand, phorbol
ester, and calcium-induced down-regulation of c-kit receptors in mast cells. J Biol
Chem 268(19):14189-14201.
5.8 Appendices
5.8.1 Model solution method
Each generation was approximated by a bivariate normal distribution given by:
(5.18)
where:
(5.19)
and:
(5.20)
( ) ( )( )
( )2( ) ( ) ( )2exp ,
2(1 )2 1
q qq cell
qq q qxx yy
N zW
( ) ( ) ( ) ( ) 2( ) 2( )
( ) ( )( ) ( )
2 ( )( ) ( )( ) ,
q q q qqx y yxq
q qq qxx yyxx yy
x y yxz
( )( )
( ) ( ) .
qxyq
q qxx yy

Cell population modeling describes intrinsic heterogeneity 99
There are 6 unknowns for each generation: ( )( )qcellN t ,
( )( )qx t ,
( )( )qy t ,
( )( )qxy t ,
( )( )qxx t ,
( )( )qyy t , and one for ligand concentration, 2( )LN t . Thus, (6 1)Q
equations are needed to solve the model: 6Q equations of moments and one
equation from 2LN balance.
The following moments were chosen for solving the system: ( )00
qM , ( )10
qM , ( )01
qM ,
( )20
qM , ( )02
qM , ( )21
qM . The general ( , )i j -moment is given by:
(5.21)
The general equation for the ( , )i j -moment applied to Eq. (5.12) is:
(5.22)
Eq. (5.3) in terms of moments becomes:
(5.23)
This solution method by generations was verified comparing the results to those
obtained by solving Eq. (5.1) by the Direct Quadrature Method of Moments (Zucca
et al, 2007). Results were obtained running the two programs with parameter
values in Tab. I, and initial conditions consisting of a homogeneous cell population
with 410cellN cell/ml, ssx x , ssy y , at a ligand concentration equal
to 50 ng/ml for 7 days. The Direct Quadrature Method of Moments (DQMOM)
was applied with two nodes, choosing the equations of the following moments:
00M , 10M , 01M , 20M , 02M , 21M , coupled with Eq. (5.3). The deviation
between the two solution methods results in the range of numerical uncertainty.
( ) ( ),
0 0
( ) ( , , ) .q i j qi jM t x y W x y t dxdy
( ), ( ) ( ) ( ) ( )
2 , 1, 1 1, ,
( ) ( )2 1, 1 ,
( ) ( ), 2 , 1
1 ( 1) ( 1), 2 , 1
2
/ 2 ( )
2
qi j q q q q
on L i j off i j prod i j deg i j
q qon L i j off int i j
q qdiv i j div i j
i j q qdiv i j div i j
dMi k N M k M k M k M
dt
j k N M k k M
k M k M
k M k M
2 ( ) ( )2 10 01
1 12
Q QL on q q
L off
q q
dN kN M k M
dt

100
5.8.2 Parameter derivations
Model parameters were obtained from data in the literature for the system c-kit and
SCF, when available, and are summarized in Tab. I. The kinetic constant of the
direct receptor-ligand reaction, onk , is equal to 162.8 10 ml/molecule/s, derived
from Yee et al. (1993). The kinetic constant of the reverse receptor-ligand reaction,
offk , is calculated by off on eqk k K , where eqK is the dissociation constant for the
reaction, having a value of 2 nM (Lev at al., 1992).
The rate constant of complex internalization for the system, intk , is 31.5 10 s
-1 as
reported in Yee et al. (1993). C-kit production rate constant, prodk , was not
available for the system under consideration. Its value was fixed to 2 s-1
, similar to
the value of Epidermal Growth Factor Receptor (EGF-R) synthesis rate from
Lauffenburger and Linderman (1993), as c-kit and EGF-R belong to the same
family of tyrosine-kinase receptors. The same assumption was used for the
internalization rate constant of free receptors, degk , whose value was fixed to 410
s-1
.
The doubling time of hematopoietic cells cultured in presence of 100 ng/ml of
SCF, as described in Ko et al. (2007), is 1 26dt h. In absence of SCF the
proliferation rate is highly decreased (McNiece et al, 1995), and it was assumed a
double doubling time in this case, 2 52dt h, this value is consistent with the data
reported in Piacibello et al. (1997). From these data, values of divk and 2divk were
derived according to 2log(2) /div dk t , and 2 1(log(2) / ) /div d div ssk t k y .

Chapter 6
Conclusions
This work aimed at rationally understanding biological and physical phenomena in
hematopoietic process of cell expansion in vitro, and their related technological
implications. A particular focus was on the development of strategies to improve
the final product quality, i.e. the stem cell clinical therapeutic potential. In
particular, the importance of stem cell quality in terms of distributed properties in
the population was investigated.
Methodologies to produce experimental data on a population level were gained and
used during this PhD program. Experimental data highlighted the importance of a
rational understanding of which operative parameters from different culture
conditions affect cell behavior. In fact, the complexity and the competition between
different biological and physical phenomena hide the different sources of
heterogeneity, in terms of marker expression.

102
In this thesis the concepts of intrinsic and extrinsic heterogeneity were introduced,
along with those of intra-generational and inter-generational heterogeneity when
thinking to the whole population. These aspects can be investigated from both an
experimental and a computational approach.
A bioreactor array was designed to culture HSCs under stirred conditions at a
microliter scale. Small-scale devices are required for a wide screening of different
experimental conditions to optimize cell culture protocols. Because of the
variability between different umbilical cord units and of the scarce number of cells
a unit contains, it is important to have a system to perform HSC cultures under
many different conditions using cells from the same umbilical cord unit. Besides,
the advantage of having a stirred system, to perform this screening at a micro-liter
scale, is helpful in the scale-up process, when bioreactors are used at a production
scale. In perspective, the system developed in this work should be used for
multiparametric studies of culture conditions for optimized protocols.
A six-well stirred bioreactor was developed with a very simple design to perform
cultures under mixing conditions. Mixing in this system is the only difference
respect to conventional culture systems, such as multiwell or flasks, where medium
is stagnant. Thus, this bioreactor allows the use of already developed protocols for
hematopoietic stem cell culture, looking exclusively at the effect of mixing.
Considering the interdisciplinary of stem cell field, it is important to develop a
robust device that can be handled even by users without a strong technical
background, for a wide-spread use, and repeatability of the results obtained. Thus
simplicity in a bioreactor for stem cell culture is not a secondary aspect, and it was
considered during the design of this system.
A theoretical study was performed to understand the sources of intrinsic
heterogeneity under perfectly homogeneous culture conditions. The heterogeneity

Conclusions 103
considered was that in the number of receptors and complexes per cell. The focus
on receptor-ligand mechanism was motivated by the importance it has in the cell
interaction with the environment. Furthermore it connects an operative variable in
cell culture, ligand concentration, to a measurable single-cell property, receptor
number. The intrinsic heterogeneity is not avoidable as long as cells are dividing,
but optimal protocols for ligand administration can be developed to reduce it.
On the overall, the most important conclusion from this work is that we cannot
completely eliminate heterogeneity, but to design safe manufacturing processes we
need to be aware of the sources that generate it and of the variability in the system.

Appendix A
Flow cytometric cell cycle analysis
of muscle precursor cells cultured
within 3D scaffolds in a perfusion
bioreactor
Marina Flaibani, Camilla Luni, Elisa Sbalchiero, Nicola Elvassore*
Department of Chemical Engineering, University of Padova, I-35131 Padova, Italy
(*)To whom correspondence should be addressed
E-mail: [email protected]
phone: +39 (049) 8275469; fax: +39 (049) 8275461

106
A.1 Abstract
It has been widely demonstrated that perfusion bioreactors improve in vitro three-
dimensional (3D) cultures in terms of high cell density and uniformity of cell
distribution; however, the studies reported in literature were primarily based on
qualitative analysis (histology, immunofluorescent staining) or on quantitative data
averaged on the whole population (DNA assay, PCR). Studies on the behavior, in
terms of cell cycle, of a cell population growing in 3D scaffolds in static or
dynamic conditions are still absent. In this work, a perfusion bioreactor suitable to
culture C2C12 muscle precursor cells within 3D porous collagen scaffolds was
designed and developed and a method based on flow cytometric analyses for
analyzing the cell cycle in the cell population was established. Cells were extracted
by enzymatic digestion of the collagen scaffolds after 4, 7, and 10 days of culture,
and flow cytometric live/dead and cell cycle analyses were performed with
Propidium Iodide. A live/dead assay was used for validating the method for cell
extraction and staining. Moreover, to investigate spatial heterogeneity of the cell
population under perfusion conditions, two stacked scaffolds in the 3D domain, of
which only the upstream layer was seeded, were analyzed separately. All results
were compared with those obtained from static 3D cultures. The live/dead assay
revealed the presence of less than 20% of dead cells, which did not affect the cell
cycle analysis. Cell cycle analyses highlighted the increment of cell fractions in
proliferating phases (S/G2/M) owing to medium perfusion in long-term cultures.
After 7–10 days, the percentage of proliferating cells was 8–12% for dynamic
cultures and 3–5% for the static controls. A higher fraction of proliferating cells
was detected in the downstream scaffold. From a general perspective, this method
provided data with a small standard deviation and detected the differences between

Flow cytometric cell cycle analysis of muscle precursor cells 107
static and dynamic cultures and between upper and lower scaffolds. Our
methodology can be extended to other cell types to investigate the influence of 3D
culture conditions on the expression of other relevant cell markers.
A.2 Introduction
Tissue engineering has been presented as a potential strategy in the field of
regenerative medicine and, more recently, in the field of in vitro applications for
developing models for physiology studies or drug testing(Khetani et al, 2006). Both
applications require the in vitro development of three dimensional, high cell density
grafts. Growing mammalian tissues in vitro is considered extremely challenging
because of their need for important nutrients and their sensitivity to nitrogenated
wastes (Freshney et al, 2000); a highly controlled environment and a culture
method, capable of generating an in vivo-like microenvironment, are therefore
indispensable (Martin et al, 2004; Gomes et al, 2006; Wang et al, 2003).
The different requirements in terms of nutrient supply and waste disposal in
different tissues can be satisfied by using bioreactor systems capable of meeting
those needs by modulating mass transfer (Martin et al, 2005). A bioreactor can be
defined as "a device that reproduces the physiological environment (including
biochemical and mechanical functions) specific to the tissue that is to be
regenerated" (Bilodeau et al, 2006). Medium perfusion through cellularized 3D
scaffolds enables the reduction of internal mass-transfer limitations (Bancroft et al,
2003); in particular, efficient oxygen transport is fundamental while culturing cells
with high oxygen uptake rates, i.e. muscle cells. Mass-transfer improvement leads
to an enhancement in cell numbers, which in turn improves the uniformity of cell
distribution (Gomes et al, 2006; Vunjak-Novakovic et al, 2006; Radisic et al,
2006) and – in the case of stem cell cultures – can influence their differentiation

108
(Bilodeau et al, 2006; Janssen et al, 2006). These general effects of medium flow
are well known, but the mechanism by which it influences single cell behavior is
not yet clear, e.g., the enhancement in cell numbers can be attributed to an effect on
the cell cycle increasing cell proliferation or to other factors such as cell viability.
In addition, it is not well understood whether the proliferation rate (or the cell
viability) is uniform within the cell population inside the 3D-domain of the
perfused scaffold. Studies on in vitro 3D cultures are mainly focused on
investigating cell number (DNA assay), viability (MTT test), morphology
(scanning electron microscopy, histologies), and gene and protein expression
(immunofluorescence staining, PCR). As some of these analytical methods do not
provide quantitative information on a statistically relevant number of cells, and
others only give mean values averaged on the whole population, different analytical
techniques are needed to answer the questions posed earlier. Among the different
experimental techniques available, flow cytometry is a powerful tool widely
applied in 2D cultures to obtain quantitative information on cell size, viability,
DNA content, and protein expression (Ormerod, 2000). Instead of supplying
averaged values, this tool provides information on the distribution of these
variables within the cell population. Flow cytometry has recently been applied to
study dynamic cultures in suspension (Alam et al, 2004; Dang et al, 2004) and, in
only a few cases, to investigate 3D cultures of adherent cells (Braccini et al, 2005;
Schmidt et al, 2006). In these studies, the cells were extracted from the scaffold
after detachment from trypsin (or analogue) and marked for phenotypic
characterization. For our current research, we developed protocols to perform flow
cytometric analyses of adherent cells cultured on 3D collagen scaffolds in a
perfusion bioreactor with a particular focus on skeletal muscle cells. We analyzed
the cell cycle to describe the fraction of cells in the duplication phases within a

Flow cytometric cell cycle analysis of muscle precursor cells 109
culture, because no other method of analysis can furnish the same detailed
information about cell cycles. Initially, live/dead cell fraction measurement was
performed to verify the presence of a high percentage of living cells in the culture
and to obtain repeatable data with flow cytometry after enzymatic scaffold
degradation. To evaluate the uniformity of cell viability and cell cycle within the
3D-domain in the perfused scaffold, we analyzed two scaffold domains separately:
the top one seeded with cells from the outset and the bottom one, without cells.
Data on the live/dead cell fraction and its distribution within the cell population
enabled us to investigate the presence and extension of areas with nonviable cells
that could falsify cell cycle data. The cell cycle is a complex and highly ordered
process that results in the duplication and transmission of genetic information from
the parent cell to the duplicated cells.13 The cell cycle can be divided into mitosis
(M phase) and a period of cell growth termed interphase, which can be subdivided
into the DNA synthesis period (S phase), and the pre- and post-DNA gap phases
(G1 and G2 phases, respectively) (Alberts et al, 2002). Following the M phase, two
possible outcomes occur for the new cells: the immediate start of another round of
growth and division or the end of the active cell cycle that enters a state of
quiescence termed G0. A cell in the G0 phase may perform normal cellular
functions, but it is not preparing for division. Normal quiescent cells maintain the
capability to re-enter the cell cycle, but need appropriate signals (Alberts et al,
2002). The percentage of cells in S/G2/M phases is linked both to the frequency
with which cells enter the duplication process and the proliferation rate. Data on the
influence of medium perfusion on cell viability and/or on cell cycle can help
explain how a bioreactor enhances cell numbers and uniformity of cell distribution.
For this reason, we developed protocols to perform Propidium Iodide (PI) assays
on adherent cells cultured on 3D scaffolds for investigating both the live/dead

110
fraction and the proliferation rate taking care to reduce data variability in order to
measure any significant differences between them. Analogous protocols can be
identified so that flow cytometry may be of value in a wide range of applications in
investigating 3D cultures of any type of adherent cells, analyzing not only cell size,
cell viability, and DNA content, but also protein expression, as it does for 2D
cultures (Ormerod et al, 2000).
A.3 Materials and methods
A.3.1 Cell culture
The murine skeletal muscle cell line C2C12 (ATCC, Manassas VA, USA) was
grown in Dulbecco’s modified Eagle medium (DMEM, Sigma-Aldrich, Milano,
Italy) supplemented with 10% fetal bovine serum (FBS, Gibco-Invitrogen, Milano,
Italy) and 1% penicillin-streptomycin solution (1000 U/ml, Invitrogen, Milano,
Italy) on standard 100 mm Petri Tissue Culture dishes, in a 95% humidified and
5% CO2 atmosphere at 37°C and maintained at low confluence. The medium was
regularly changed every other day.
A.3.2 Dynamic culture system
Our dynamic culture system was designed with 8 independent units, each
composed of a culture chamber and a gas exchanger (Fig. 1). The culture chambers
were designed with two distinct platforms made of polycarbonate (PC), each
chamber containing a15 ml medium hold up, which also served as a culture
medium reservoir. Medium perfusion was ensured by an 8-channel peristaltic pump
(Masterflex® L/S Variable-Speed Modular Driver, Ismatec
® Minicartridge Pump
Heads, General Control, Milan, Italy). The scaffolds were placed inside a 5 mm

Flow cytometric cell cycle analysis of muscle precursor cells 111
diameter hole created on a polydimethylsiloxane (PDMS) disk; the disk prevented
the scaffolds from floating and ensured medium perfusion from the top to the
bottom, thus avoiding fluid shortcutting and channeling (insert in Fig. 1A).
Figure 1. Dynamic culture system. The perfusion system is composed of a
peristaltic pump, a gas exchanger and a culture chamber that also acts as a medium
culture reservoir (A). On the right, an enlargement shows in more detail the culture
chamber with two stacked scaffolds (the seeded one in purple and the unseeded
one in red) placed in the PDMS punched disk (light blue). The medium flows from
the top to the bottom (as indicated by the arrows). Between the PDMS disk and the
medium outlet there is a nylon mesh (orange) to equalize medium flow. Images
taken every minute (B) of the flow dynamic test performed by a step of colored
tracer confirmed the absence of shortcuttings and stagnant regions. The scaffolds
extracted after 5 minutes of flow dynamic testing were uniformly colored (C).

112
Between the PDMS disk and the medium outlet, a 100 μm mesh nylon netting was
inserted to give mechanical support and induce equalization of the flow. To
visualize the flow pattern developed in our bioreactors, we performed dynamic
experiments introducing a step disturbance of a colored tracer in the system (Fig.
1B shows pictures taken each minute); the scaffold samples were then extracted
and analyzed (Fig. 1C).
The gas exchanger unit was constructed with a gas permeable, non-porous silicon
membrane (Platinum Cured Silicone Tubing, Vetrotecnica, Padua, Italy) and
designed to ensure adequate oxygen and carbon dioxide concentrations, i.e. pH
value in the culture medium.
Pharmed®
tubing (General Control, Milan, Italy) was used to connect the culture
chambers to the gas exchanger and the peristaltic pump. All connections were
made with Luer® fittings (General Control, Milan, Italy).
The dynamic system was assembled and sterilized in an autoclave at 121°C for 20
min.
A.3.3 Cell seeding
The scaffold was a highly porous collagen sponge (Avitene® UltrafoamTM
Collagen Hemostat. Davol inc., Craston, USA) shaped in disks of 7 mm in
diameter and 3 mm in thickness. Previous research demonstrated how this material
could be successfully used as a substrate for in vitro cell adhesion and growth 18,
19. The scaffold was cut larger than the hole in the silicon holder; as sponge
shrinkage after wetting was taken into consideration, a larger scaffold was needed
to ensure the formation of shortcutting or channeling.

Flow cytometric cell cycle analysis of muscle precursor cells 113
The dry scaffolds were pre-treated with a culture medium inside standard 35 mm
Petri dishes and incubated for 1 hour to allow protein deposition onto the matrix.
The excess medium was then removed through absorption using sterile gauzes.
Confluent plates of C2C12 were detached using trypsin/EDTA (Invitrogen, Milan,
Italy), pelleted by centrifugation for 5 minutes at 250 g and counted with a
hemocytometer. At day 0, either 5·105 or 1·10
6 cells were suspended in 10·10
-3 ml
of culture medium and seeded on a scaffold placed in a 35 mm Petri dish. The
scaffold was incubated for 4 hours and 5·10-3
ml of medium was added on top of it
every 30 minutes; before overnight incubation, 2 ml of medium was added in the
Petri dish. Each seeded scaffold was then coupled with an identical but unseeded
scaffold.
A.3.4 Static culture
On day 1, PDMS (Sylgard 184 distributed by Dow Corning, USA) punched disks
were placed in 35 mm Petri dishes and two stacked collagen scaffolds − the
unseeded scaffold on the bottom and the seeded scaffold on the top − were placed
into the 5 mm diameter hole in the center of each silicon disk within the culture
chamber (Fig. 1B). Three ml of culture medium was added and the cultures were
kept at 37°C in a humidified atmosphere with 5% CO2 for 4, 7, and 10 days
changing the medium every three days.
A.3.5 Dynamic culture
On day 1, the culture chambers were filled with 9 ml of culture medium and the
pump was operated for 30 minutes to fill the tubing. The 7 ml of culture medium
remaining outside the tubing was subsequently removed, and two stacked collagen

114
scaffolds, unseeded at the bottom and seeded at the top, were placed into the PDMS
punched disk inside each culture chamber. 9 ml of culture medium was then added
inside each unit. The medium was pumped at a flow rate of 0.5 ml/min chosen on
the basis of previous experience on other perfusion bioreactors developed in our
laboratory. The apparatus was maintained at 37°C in a humidified atmosphere with
5% CO2 for 4, 7, and 10 days without any other external, operator intervention.
A.3.6 Collagen scaffold degradation
Enzymatic degradation of the scaffold material was necessary to analyze the cells
by flow cytometry. Each cellularized scaffold was placed in a 1.5 ml Eppendorf
tube. 10·10-3
ml of DMEM with 2 mg/ml collagenase from Clostridium hystoliticus
(Sigma-Aldrich, Milan, Italy) was then added and incubated for 1 hour at 37°C to
allow complete collagen digestion. After which, 1 ml of culture medium was added
to the scaffold. The suspension was filtered with a 0.05 mm filter to remove debris
and centrifuged at 250 g for 5 min to pellet the cells, which were finally re-
suspended in the culture medium.
A 50·10-3
ml solution was taken, with tripan blue added, and used to count the cells
in suspension in a Burker chamber.
The degradation protocol was preliminarily tested by exploiting solubilized
collagen absorbance around 270 nm. Collagen samples were placed in 1.5 ml of
PBS (Phosphate Buffered Saline, Invitrogen, Milan, Italy) and amounts of
collagenase ranging between 5-20·10-3
ml were added. The solution was analyzed
by a UV-VIS spectrophotometer (UV 500 Spectronic Unicam, Cambridge,
England) at different time points. The Collagenase quantity affected the
degradation times while the peak of the spectra depended only on the collagen
sample volume. According to a calibration curve (data not shown), we used

Flow cytometric cell cycle analysis of muscle precursor cells 115
spectrophotometric analyses to provide preliminary verification that our protocol
would lead to complete scaffold degradation.
A.3.7 Measurement of mitochondrial activity
Cellular viability was measured by the MTT test (Sigma-Aldrich, Milan, Italy): 300
µL of the dye solution containing 5 mg/ml of the tetrazolium salt MTT in PBS
were diluted to a final volume of 3 ml with PBS and added to the samples, which
were incubated for 3 hours at 37°C. After the removal of the dye solution, a 3 ml
solubilization solution made of 10% DMSO (Dimethyl Sulfoxide, Sigma-Aldrich,
Milan, Italy) and 90% Isopropanol (Acros, Milan, Italy) was added to dissolve the
formazan crystals. The samples were again incubated at 37°C, enabling complete
dissolution, and then centrifuged at 250 g for 5 minutes to precipitate wastes. Clear
solutions were then processed for absorbance readings at 580 nm with an UV500
spectrophotometer, Spectronic Unicam (Cambridge, UK). The recorded optical
density (OD) is a function of the mitochondrial activity and is related to cell
number.
A.3.8 Histological analyses
Samples seeded with 5·105 cells and cultured for 4 days, were fixed in 4%
Paraformaldehyde (PFA, Sigma-Aldrich, Milan, Italy) for at least 1 hour, rinsed
three times with PBS for 10 min, and maintained at +4°C covered by a thin layer of
PBS. Before sectioning, fixed tissue specimens were dehydrated and embedded in
paraffin (Sigma-Aldrich, Milan, Italy). Sectioning was accomplished with a
microtome and 7-μm thick sections of the cultured collagen matrices were analyzed
both by Hematoxylin-Eosin (H-E) (Sigma-Aldrich, Milan, Italy) staining and

116
Masson’s trichrome staining using phosphomolybdic acid (Sigma-Aldrich, Milan,
Italy). Cell density and distribution within the scaffold were then assessed by
microscope observations (inverted microscope Olympus IX51 Tokyo, Japan);
images were captured and acquired using a JVC KY-F30 3-CC camera supported
by Pinnacle, DVTools - Capture & Playback Application software.
A.3.9 Flow cytometry
Flow cytometric analyses were performed using a FACScan Flow Cytometer
Becton Dickinson (BD Biosciences, Milan Italy) equipped with an argon-ion laser
(488 nm). All data were acquired and analyzed using CellQuest Pro (Becton
Dickinson) software, with the exception of the cellcycle related analyses, which
were performed with the ModFit LT (Verity Software House, Inc.) software
specific for the DNA histogram deconvolution. Each sample was run through the
flow cytometer to record 1-3·104 events.
A.3.9.1 Live/Dead assay using Propidium Iodide (PI) nucleic acid stain
PI binds to DNA by intercalating between the bases with little or no sequence
preference and with a stoichiometry of one dye per 4-5 base pairs of DNA. PI is
membrane-impermeant and generally excluded from viable cells, so that cells
showing a positive fluorescence can be identified as non-viable.
The flow cytometry protocol follows: after the scaffold digestion procedure, cells
were suspended in 400 µL of PBS. 50 µL of the PI (Sigma-Aldrich, Milan, Italy)
solution (400 µL/ml PI in distilled water) and 50 µL of the Ribonuclease (RNAse)
(Sigma-Aldrich, Milan, Italy) solution (1 mg/ml RNAse in PBS) were added for
staining. The suspension was incubated at 37°C for 30 min and then analyzed with
Flow cytometric cell cycle analysis of muscle precursor cells 117
the flow cytometer detecting the forward (FSC) and side light scatter (SSC) and the
fluorescence emission at 542/85 nm, acquired on a logarithmic scale.
A.3.9.2 Live/Dead® Viability/Cytotoxicity kit
The Live/Dead®
Viability/Cytotoxicity kit (Invitrogen, Milan, Italy) provides a
two-color fluorescence cell viability assay that is based on the simultaneous
determination of live and dead cells by two different dyes. Live cells are
distinguished by the presence of intracellular esterase activity by the enzymatic
conversion of the virtually non-fluorescent cell-permeant calcein AM to the
intensely fluorescent calcein. The polyanionic dye calcein is retained within live
cells, producing an intense uniform green fluorescence. Ethidium homodimer
(EthD-1) enters cells with damaged membranes and undergoes a 40-fold
enhancement of fluorescence upon binding to nucleic acids, thereby producing a
bright red fluorescence in dead cells.
The flow cytometry protocol follows: after the scaffold digestion procedure, the
cells were suspended in 1 ml of culture medium; 2 µL of calcein AM working
solution (50 µM) and 4 µL of ethidium homodimer-1 solution (2 mM) were added.
The cells were incubated for 15-20 minutes at room temperature, protected from
light. After the incubation period, the stained cells were analyzed by flow
cytometer detecting the forward and side light scatter, the calcein fluorescence
emission at 530/30 nm, and the ethidium homodimer-1 fluorescence emission at
585/42 nm, acquired on logarithmic scales.
A.3.9.3 Cell Cycle Analysis
The DNA content of the cells was detected after the staining with PI. This dye
behaves as already described; but, in this case, fixing cells prior to the staining
118
protocol permeabilizes the cell membrane, so that the DNA content of all the cells
is accessible to the dye.
The flow cytometry Protocol follows: before digestion, the scaffold was incubated
in 70% ethanol at 4°C for 30 minutes to fix the cells. The scaffold was then washed
twice with PBS and digested by collagenase; collected cells were then suspended in
400 µL of PBS. 50 µL of the PI solution (400 µL/ml PI in distilled water) and 50
µL of RNAse solution (1 mg/ml RNAse in PBS) were added. The suspension was
incubated at 37°C for 30 min and then analyzed by flow cytometer detecting the
forward and side light scatter and the fluorescence emission at 585/42 nm, acquired
on linear scale.
A.3.10 Statistical analyses
All the quantitative results were obtained from three or more samples. Data were
expressed as mean values ± their standard deviations (SD). All collected data were
analyzed by ANOVA from multiple comparisons, and the statistical significance
was accepted at p<0.05.
A.4 Results and discussion
Scientific literature agrees on the need for efficient dynamic culture systems for the
in vitro realization of 3D high density grafts (Martin et al, 2005; Vunjak-
Novakovic et al, 2006; Wendt et al, 2005). The reduction of the oxygen-transfer
limitation (Bancroft et al, 2003) is fundamental for culturing cells with high
oxygen uptake rates, i.e. skeletal muscle cells. Elevated number of cells, high cell
viability, and uniformity of spatial distribution are the major advantages of
dynamic culture systems (Radisic et al, 2006; Strehl et al, 2005), but it is not clear

Flow cytometric cell cycle analysis of muscle precursor cells 119
how medium flow leads to these important improvements. The elevated cell
numbers and the uniformity of cell density could be due to the activation of
different mechanisms regulating, for example, the cell cycle or the cell viability.
The commonly performed analyses on 3D cultures of adherent cells cannot provide
useful information to assist in the investigation of the bioreactor effects on cell
cycle. On the other hand, flow cytometry is a powerful technique widely applied to
2D cultures, for example, in collecting information on cell viability and DNA
content. Flow cytometry can be used to identify the presence of one or more
markers in the same population and obtain quantitative information on statistically
significant samples (Ormerod, 2000). Furthermore, flow cytometry allows us to
evaluate not only a marker’s average value, but also to evaluate the distribution of a
specific marker in a population. Flow cytometry has been used to study dynamic
cultures in suspension (Alam et al, 2004; Dang et al, 2004) and, in only a few
cases, to investigate 3D cultures of adherent cells (Braccini et al, 2005; Schmidt et
al, 2006). In these studies the cells were extracted from the scaffold after
detachment with trypsin (or analogue); however, with these methods the complete
cell extraction from a 3D scaffold with highly interconnected pores present certain
difficulties. Using a method of scaffold degradation, which does not damage the
cells, e.g. enzymatic digestion, ensures that all the cells can be collected. Moreover,
to our knowledge flow cytometry has never been applied to study the cell cycle
within a population of cell grown in a 3D scaffold.
In this study, we first developed a new perfusion bioreactor and verified its
functionality in supporting a uniform skeletal muscle cell culture within porous 3D
scaffolds. We carried out different tests on the fluid-dynamic and on the cell
growth for validating the bioreactor, in terms of reproducibility and repeatability of

120
the data. We then developed protocols to perform accurate flow cytrometric
analyses of these cell populations. In particular, we tested our protocols with
adherent C2C12 cells cultured on 3D collagen scaffolds and stained with PI in order
to investigate live/dead cell fraction. Finally, we applied PI flow cytometry for the
measurement of the fraction of doubling cells.
A.4.1 Validation of bioreactor for cell culture
The dynamic cell culture method was validated by flow dynamic tests, cell count,
histologies and MTT tests.
The uniformity of flow perfusion was assessed using a colored tracer; a step
disturbance of the tracer gave a uniform color distribution in the culture chamber
within 5 minutes, confirming the absence of stagnant regions (Fig. 1B). Moreover,
the intense and uniform scaffold coloration gave additional evidence of the absence
of shortcutting and channeling of the flowing solution (Fig. 1 B and C). The
uniformity of the medium flow permitted accurate control of the cell
microenvironment by means of an optimized dynamic culture protocol, which
resulted in a low standard deviation of the obtained data.
The cell behavior is highly influenced by oxygen and metabolite concentrations,
which can be far from uniform in a 3D culture inducing a position-dependent cell
behavior. To better investigate the uniformity of cell behavior, we analyzed
separately two scaffolds stacked in the same chamber and simulated one 6mm thick
scaffold. An unseeded scaffold was placed at the bottom of the hole in the center of
the PDMS disk and a seeded one was placed on top of the other (Fig. 1A).
Cell counts were performed on C2C12 cells cultured in static and dynamic
conditions for 4 days. Data obtained from cell counts showed an enhancement of
cell numbers in dynamic cultures (Fig. 2 A and B) and confirmed the efficiency of

Flow cytometric cell cycle analysis of muscle precursor cells 121
our perfusion bioreactor as a cell culture apparatus. In detail, the dynamic culture
inside our bioreactor led to a doubling of the cell number in the seeded scaffolds
(Fig. 2 A) and a tripling in the unseeded scaffolds (Fig. 2 B) when compared with
static culture conditions. As expected, the positive influence of medium flow was
much more evident in the lower scaffold, where static conditions maintain little
control over metabolites and waste concentration. The effect was not dependent on
the initial seeding density as the proportions were the same for the two cases of
5·105 and 1·10
6 seeded cells.
Figure 2. Number of cells counted in the seeded (A) and unseeded (B) scaffolds,
cultured in static and dynamic conditions for 4 days, starting from either 5·105 or
1·106 seeded cells. Hematoxylin-Eosin histologies (C): images of the seeded
surface (1, 2) and the opposite one (3, 4) of scaffolds seeded with 5·105
cells and
cultured in static (1, 3) and dynamic conditions (2, 4) for 4 days (Magnification
x200. Scale bar 100 m). Plot of cell density vs. the distance from the seeded
surface (D) obtained by analysis on histology images.

122
Histological analyses were performed on scaffolds seeded with 5·105 cells and
cultured for 4 days. H-E and Masson’s trichrome staining were performed, and
representative examples of H-E microscope images are reported in Fig. 2 C.
Staining of the scaffolds maintained in static conditions confirmed a high cell
density in the seeded surface (Fig. 2 C1) and the almost total absence of cells in the
lower part (Fig. 2 C3). On the contrary, cell culturing inside the bioreactor allowed
not only a high density near the seeded surface (Fig. 2 C2), but also the presence of
a detectable number of cells in the opposite region (Fig. 2 C4). A quantitative
description of cell distribution is given in Fig. 2D where the cell density in different
sections of the seeded scaffold, evaluated using images of H-E staining, is plotted
as a function of the distance from the seeded surface. Static cultures resulted in a
steep decrement of cell density down from 40 cells/cm2 to almost zero within 1 mm
in thickness. On the contrary, dynamic culture induced a smoother decrement in the
upper part of the scaffold as the density reached a minimum of approximately 25
cells/cm2 in 1 mm and then stabilized. High resistance to oxygen, metabolite, and
waste diffusion in static cultures led to the presence of cells only within a thickness
of 1 mm (Vunjak-Novakovic et al, 2006; Wendt et al, 2006).
With regards to long-term cultures, only the MTT test was performed. The optical
absorbance was recorded after 4 and 7 days of culture both in static and dynamic
conditions. The MTT semi-quantitative assay confirmed the importance of using a
perfusion bioreactor for long-term cultures: after 7 days dynamic culture resulted in
doubled cell viability (p<0.01) (data not shown).
We thus verified that this newly designed bioreactor allowed skeletal muscle cell
growth and proliferation throughout the entire scaffold thickness, in line with data
reported in literature (Radisic et al, 2006; Cimetta et al, 2007; Zhao et al, 2005).

Flow cytometric cell cycle analysis of muscle precursor cells 123
Moreover, the system culture was robust and allowed repeatability data with small
standard deviation.
A.4.2 Flow cytometric analysis
A.4.2.1 Validation of flow cytometry protocol
To collect the cells for flow cytometric analyses, the scaffold was degraded with
the specific enzyme collagenase. Enzyme concentration and digestion time were
optimized to minimize the damage of cell membranes and the presence of scaffold
debris, as collagen particles with the dimension of a cell must be avoided as they
would over-estimate the number of unmarked cells and, consequently, of the total
cell number.
The degradation process was followed with UV-VIS spectrophotometry, as
reported in the Materials and Methods section. This analysis permitted the
identification of the optimal amount of collagenase and degradation time;
however, the sensitivity of this technique is too low to ensure the absence of debris
at the end. The presence of negligible debris had to be checked by flow cytometry.
Both scaffolds - the upper, seeded one and lower, unseeded one - were analyzed
and in every case the debris signal was located in the bottom-left corner of the side-
forward scatter dot plot, as commonly happens for 2D cultures (Fig. 3 A and C).
This dot-plot fashion made it possible to easily distinguish debris from the cell
population (Fig. 3 C).
After the scaffold degradation, flow cytometric analysis was performed using PI to
investigate both the percentage of living cells and the cell cycle. Fig. 3 shows the
obtained dot plots and histograms. Each fluorescence signal detected by the flow-
cytometer is characterized by a width correlated with the particle dimension and by

124
an area related with the total particle fluorescence. Dot plot of PI fluorescence area
versus width in the case of cell cycle analysis (Fig. 3 E) allowed for the distinction
between cells, debris, and aggregates.
Figure 3. Examples of data collected by flow cytometry. Fig. (A) represents a dot
plot showing forward (FSC) vs. side light scatter (SSC) of a population of C2C12
cultured in Petri dish; dots related to single cells were selected by using a gate, as
shown. Fig. (B) represents the histogram of the fluorescent intensity of the cell
population gated in Fig. (A) and stained with PI for live/dead assay; live cells (low
fluorescence) can be distinguished from non-viable cells (high fluorescence). Fig.
(C) and (D) are equivalent graphs of (A) and (B) but refer to a population of C2C12
cultured in the 3D collagen scaffold. Fig. (E) is an example of a dot plot showing

Flow cytometric cell cycle analysis of muscle precursor cells 125
the area vs. width of the fluorescence signal emitted by a cell and detected by the
flow-cytometer. This dot plot refers to cells cultured in 3D scaffold, fixed with
ethanol and stained with PI: the area of the PI fluorescence signal is proportional to
DNA content; the width of PI fluorescence signal is used to discriminate between
single cells and aggregated cells with the same overall DNA content. Based on
these two parameters, events were classified as debris and apoptotic cells (sub-G1
DNA content), single cells, and aggregates. Fig. (F) represents a histogram of the
single cell population stained with PI after fixation and gated as shown in Fig. (E);
the peak at low fluorescence represents cells in G1 (2N = diploid cells), at double
fluorescence there is a small peak corresponding to cells in the G2 and M phases
(4N = tetraploid cells), intermediate fluorescence values represent cells in the S
phase which are doubling their DNA.
The negligibility of the collagen debris was further verified for live/dead assays; in
this case, PI marked only cells with damage on the cytoplasmatic membrane while
living cells were not marked (Robinson et al, 1997). The histogram for PI
fluorescence allows for identification of the marked dead cells (Fig. 3 B and D).
Quantifying the living cells, instead, requires a correct gating in the side-forward
dot plot to exclude collagen debris from the count. Inappropriate collagen
degradation would lead to relevant error in estimating the number of living cells.
To verify our protocol, we performed the analogue measurement with a live/dead
kit as reported in the Materials and Methods section. This kit is widely used, and it
has a double fluorescence with emission at 530/30 nm for living and 585/42 nm for
dead cells. The double fluorescence reduces the risk of including scaffold debris in
the statistical data analysis. This assay was performed on a 4-day static culture and
the results were comparable with the ones obtained using PI (data not shown); for
this reason, all other measurements were carried out only using PI.
The protocol for cell cycle analysis required a fixation step with 70% ethanol
before scaffold digestion, and we verified that such a step had not reduced the
collagenase efficiency.

126
Finally, we verified that the scaffold degradation protocol did not alter cell
viability. Two cell populations were cultured on Petri dishes under the same static
conditions; one was suspended in a collagenase solution, simulating the scaffold
degradation protocol, while the other was used as a control. Both populations were
then analyzed by flow cytometry after PI staining. Experimental viability data were
drawn from the PI histogram as shown in Fig. 3 D; live/dead percentages of the two
samples were comparable, confirming that the presence of collagenase had a
negligible effect.
The flow cytometric protocols were developed and tested, as pointed out above,
than applied to investigate the effect of dynamic cultures on C2C12 viability and
percentage of doubling cells.
A.4.2.2 Live/Dead Cell Fraction
The percentages of living cells for two time points (4 and 7 days) and for the two
seeding densities were measured. In static cultures, the viability set between 70 and
85% was neither significantly dependent on the number of seeded cells nor on the
culture period. After 7 days, the percentage of living cells for 1·106 seeded cells, set
around 83% in both seeded and unseeded scaffolds, showed the spatial uniformity
of this parameter. At the first time point, the analysis was not performed on the
unseeded scaffold as the number of cells was not sufficient to proceed with the
flow cytometry protocol. This observation is in agreement with the histological
analyses (Fig. 2 C and D) and demonstrates the importance of medium perfusion in
allowing cell growth in regions far from the seeded surface (Radisic et al, 2006).
The dynamic culture improved mass transport allowing a rapid enhancement of cell
viability and led to 95±1% of living cells after 4 days. In the seeded scaffold the
percentage decreased to a value of 87±3% after 7 days, slightly higher than that of

Flow cytometric cell cycle analysis of muscle precursor cells 127
static cultures. At this time point, living cells in the unseeded scaffolds were
94±2%, a significantly higher percentage (p=0.002) than the one measured for the
seeded scaffolds, and it was comparable to the data obtained after 4 days of
dynamic culture. These data confirmed the ability of a perfusion bioreactor to
maintain C2C12 high viability during long term cultures. This information verifies
that data on cell cycles are not influenced by non-viable cells.
A.4.2.3 Cell Cycle
The property of PI to bind stoichiometrically to DNA allowed us to distinguish
between cells in the G1 phase from cells in the S, G2 and M phases (Fig. 3 E and F)
(Anderson et al, 1998). The percentages of doubling cells (cells in the S, G2 and M
phases) were evaluated at three time points (4, 7 and, 10 days) in static and
dynamic cultures, and resulting data are reported in Tab. 1. Data for the unseeded
scaffold in static cultures at day 4 and 7 were not available due to an insufficient
number of cells grown in this area.
Table 1. Percentage of cells in S/G2/M phases detected by flow cytometer after PI
staining. The scaffolds were seeded with either 5·105 or 1·10
6 cells and cultured for
4, 7 and 10 days in static and dynamic conditions. The number of cells was not
sufficient to perform flow cytometric analysis in unseeded scaffolds cultured in
static conditions for 4 and 7 days (n.d. = not detectable).
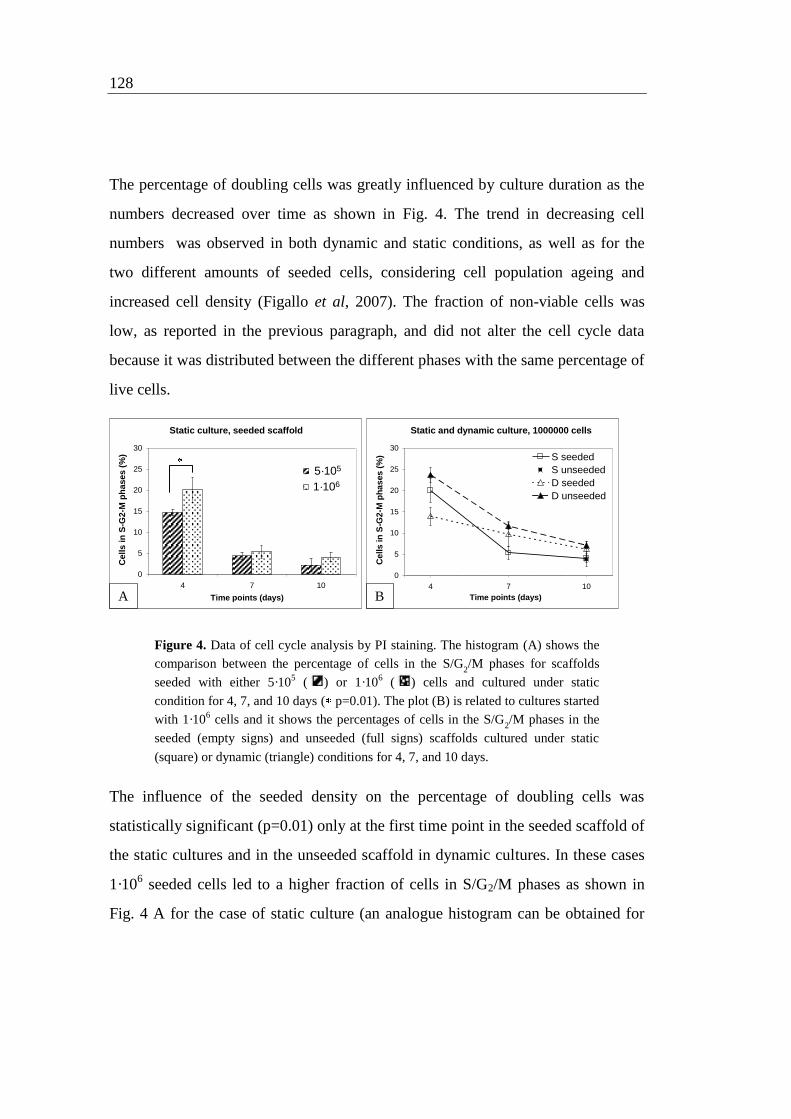
128
Static culture, seeded scaffold
0
5
10
15
20
25
30
4 7 10
Time points (days)
Cells in
S-G
2-M
ph
ases (
%)
5 E5
1 E6
5·105
1·106
A
Static and dynamic culture, 1000000 cells
0
5
10
15
20
25
30
3 4 5 6 7 8 9 10 11
Time points (days)
Ce
lls
in
S-G
2-M
ph
as
es
(%
) S seeded
S unseeded
D seeded
D unseeded
B
The percentage of doubling cells was greatly influenced by culture duration as the
numbers decreased over time as shown in Fig. 4. The trend in decreasing cell
numbers was observed in both dynamic and static conditions, as well as for the
two different amounts of seeded cells, considering cell population ageing and
increased cell density (Figallo et al, 2007). The fraction of non-viable cells was
low, as reported in the previous paragraph, and did not alter the cell cycle data
because it was distributed between the different phases with the same percentage of
live cells.
Figure 4. Data of cell cycle analysis by PI staining. The histogram (A) shows the
comparison between the percentage of cells in the S/G2/M phases for scaffolds
seeded with either 5·105 ( ) or 1·10
6 ( ) cells and cultured under static
condition for 4, 7, and 10 days ( p=0.01). The plot (B) is related to cultures started
with 1·106 cells and it shows the percentages of cells in the S/G
2/M phases in the
seeded (empty signs) and unseeded (full signs) scaffolds cultured under static
(square) or dynamic (triangle) conditions for 4, 7, and 10 days.
The influence of the seeded density on the percentage of doubling cells was
statistically significant (p=0.01) only at the first time point in the seeded scaffold of
the static cultures and in the unseeded scaffold in dynamic cultures. In these cases
1·106 seeded cells led to a higher fraction of cells in S/G2/M phases as shown in
Fig. 4 A for the case of static culture (an analogue histogram can be obtained for

Flow cytometric cell cycle analysis of muscle precursor cells 129
dynamic cultures from data in Tab. 1). At the same time points, no significant
differences were observed in the seeded scaffold dynamically cultured in the
bioreactor. After 4 days these scaffolds had the highest cell density (Fig. 2 A),
suggesting the presence of a critical cell density level above which the cell numbers
do not affect cell cycle. This hypothesis provides an explanation for the flow
cytometric data, and this could justify the absence of significant differences for
long term cultures, but further investigation is needed in order to confirm these
results.
Comparison between the time trends of static and dynamic conditions is reported in
Fig. 4 B in the case of 1·106 seeded cells. This figure shows how dynamic cultures
in our bioreactor allows a slower decrement of the percentage rate of doubling
cells, thus keeping it higher than in static conditions in long term cultures by
stimulating the cells to enter the S/G2/M phases. In static cultures, the fraction of
doubling cells dropped from 15-20% at the first time point to 4-5% after 7 days,
values similar to the minimum reached after 10 days. The decrement was smoother
in dynamic cultures leading to a higher proliferation rate at 7 and 10 days in both
the seeded (p<0.01 for 5·105 seeded cells) and unseeded scaffolds (p<0.05).
Moreover, the unseeded scaffolds showed the highest percentage of cells in S/G2/M
phases during the entire culture period, but the difference decreased over time.
A.5 Conclusions
In our research we focused on the development of new analysis protocols for
obtaining quantitative information on a population of adherent cells cultured in a
3D scaffold. Researchers agree that cells adhered within 3D scaffolds need proper
bioreactors to grow and proliferate and we suggest that the protocol we proposed in
this study can help to obtain information for understanding the influences of

130
medium flow on cellular behavior. In particular, we focused our attention on flow
cytometry techniques and their application for investigating the fraction of
doubling cells within a population of skeletal muscle cells.
A critical step of protocol for flow cytometric analysis of culture in 3D-domain is
the cell detachment and extraction from the scaffold. We performed the scaffold
degradation; parameters of this step were optimized leading to the negligible
presence of scaffold debris so that their signal could be easily distinguished from
those of the cells. Furthermore, we verified that the digestion protocol did not alter
the live/dead cell fraction and that the presence of dead cells has a negligible
influence on the cell cycle data.
The data collected in this study using PI staining demonstrated the application of
flow cytometry for investigating the effect of medium flow on C2C12 cell cycles:
the data has small standard deviation and, in some cases, the difference between
static and dynamic cultures or between seeded and non-seeded scaffolds was
statistically significant. In agreement with the literature, the medium perfusion
through the collagen scaffold led to an improvement of mass transport inside the
culture 3D-domain, especially in the lower scaffold, where the control of
metabolite and waste concentration is in static conditions (Radisic et al, 2006;
Cimetta et al, 2007; Wendt et al, 2005): both cell viability and the percentage of
doubling cells had their highest values in the non-seeded scaffold when cultured in
a bioreactor.
This research is relevant to a wide application of flow cytometry to in vitro 3D
cultures of every type of adherent cells; analogous protocols can now be identified
to achieve quantitative information on other parameters commonly investigated in
2D cultures, such as protein expression.

Flow cytometric cell cycle analysis of muscle precursor cells 131
A.6 Acknowledgment
We would like to thank Christopher Cannizzaro and the Tissue Engineering
Resource Center for the precious assistance provided during the bioreactor
development. We would also like to thank Città della Speranza, the Regione
Veneto (Azione Biotech II), the MIUR (Italian Ministry of University and
Research), and the University of Padua for the financial support.
A.7 References
Alberts B, Johnson A, Lewis J, Raff M, Roberts K, Walter P. 2002.
Molecular biology of the cell. 4th ed. Garland:New York.
Alam S, Sen A, Behie LA, Kallos MS. 2004. Cell Cycle Kinetics of
Expanding Populations of Neural Stem and Progenitor Cells In Vitro. Biotech
Bioeng 88(3):332-347.
Anderson HJ, de Jong G, Vincent I, Roderge M. 1998. Flow Cytometry of
Mitotic Cells. Exp Cell Res 238:498-502.
Bancroft GN, Sikavitsas VI, Mikos AG. 2003. Design of a flow perfusion
bioreactor system for bone tissue engineering applications. Tissue Eng 9:549-554.
Bilodeau K, Mantovani D. 2006. Bioreactors for Tissue Engineering: Focus
on Mechanical Constraints. A Comparative Review. Tissue Eng 12(8):2367-2383.
Braccini A, Wendt D, Jaquiery C, Jakob M, Heberer M, Kenins L, Wodnar-
Filipowicz A, Quarto R, Martin I. 2005. Three-Dimensional Perfusion Culture of
Human Bone Marrow Cells and Generation of Osteoinductive Grafts. Stem Cells
23:1066–1072.

132
Cannizzaro C, Tandon N, Figallo E, Park H, Gerecht S, Radisic M,
Elvassore N, Vunjak-Novakovic G. 2007. Practical aspects of cardiac tissue
engineering with electrical stimulation. Methods Mol Med. 140:291-307.
Cimetta E, Flaibani M, Mella M, Serena E, Boldrin L, De Coppi P,
Elvassore N. 2007. Enhancement of viability of muscle precursor cells on 3D
scaffold in a perfusion bioreactor. Int J Artif Org 30:415-428.
Dang SM, Gerecht-Nir S, Chen J, Itskovitz-Eldor J, Zandstra PW. 2004.
Controlled, Scalable Embryonic Stem Cell Differentiation Culture. Stem Cells 22:
275-282.
Figallo E, Flaibani M, Zavan B, Abatangelo G, Elvassore N. 2007.
Micropatterned Biopolymer 3D Scaffold for Static and Dynamic Culture of Human
Fibroblasts. Biotechnol Prog 23(1):210-216.
Freshney R. 2000. Culture of animal cells—a manual of basic techniques.
4th ed. Wiley-Liss:New York.
Gomes ME, Bossano CM, Johnston CM, Reis RL, Mikos AG. 2006. In
Vitro Localization of Bone Growth Factors in Constructs of Biodegradable
Scaffolds Seeded with Marrow Stromal Cells and Cultured in Flow Perfusion
Bioreactor. Tissue Eng 12(1):177-188.
Janssen FW, Oostra J, van Oorschot A, van Blitterswijk CA. 2006. A
perfusion bioreactor system capable of producing clinically relevant volumes of
tissue-engineered bone: In vivo bone formation showing proof of concept.
Biomaterials 27:315-323.
Khetani SR, Bhatia SN. 2006. Engineering tissues for in vitro applications.
Current Opinion in Biotechnology 17:524–531.
Martin I, Wendt D, Heberer M. 2004. The role of bioreactors in tissue
engineering. Trends Biotechnol 22(2):80-86.

Flow cytometric cell cycle analysis of muscle precursor cells 133
Martin Y, Vermette P. 2005. Bioreactors for tissue mass culture: Design,
characterization, and recent advances. Biomaterials 26:7481–7503.
Ormerod M. 2000. Flow cytometry-a practical approach. Oxford University
Press.
Radisic M, Cannizzaro C, Vunjak-Novakovic G. 2006. Scaffolds and fluid
flow in cardiac tissue engineering. Fluid Dynamics and Material Processing 2(1):1-
15.
Robinson J, Darzynkiewicz Z, Dean P, Dressler L, Rabinovich P, Stewart
C, Tanke H, Wheeless L. 1997. Current Protocols in Cytometry. John Wiley &
Sons, Inc: New York.
Schmidt D, Asmis LM, Odermatt B, Kelm J, Breymann C, Gössi M,
Genoni M, Zund G, Hoerstrup SP. 2006. Engineered Living Blood Vessels:
Functional Endothelia Generated From Human Umbilical Cord-Derived
Progenitors. Ann Thorac Surg 82:1465–71.
Strehl R, Tallheden T, Sjogren-Jansson E, Minuth WW, Lindahl A. 2005.
Long-term maintenance of human articular cartilage in culture for biomaterial
testing. Biomaterials 26:4540-4549.
Vunjak-Novakovic G, Radisic M, Obradovic B. 2006. Cardiac tissue
engineering: effects of bioreactor flow environment on tissue constructs. J Chem
Tech Biotech 81(4):485-490.
Wang Y, Uemura T, Dong J, Kojima H, Tanaka J, Tateishi T. 2003.
Application of Perfusion Culture System Improves in Vitro and in Vivo
Osteogenesis of Bone Marrow-Derived Osteoblastic Cells in Porous Ceramic
Materials. Tissue Eng 9(6):1205-1214.

134
Wendt D, Jakob M, Martin I. 2005. Bioreactor-based engineering of
osteochondral grafts: from model systems to tissue manufacturing. Journal of
Biosci and Bioeng 100(5):489-494.
Wendt D, Stroebel S, Jakob M, John GT, Martin I. 2006. Uniform tissues
engineered by seeding and culturing cells in 3D scaffolds under perfusion at
defined oxygen tensions. Biorheol 43(3-4):481-488.
Zhao F, Ma T. 2005. Perfusion Bioreactor System for Human Mesenchymal
Stem Cell Tissue Engineering: Dynamic Cell Seeding and Construct Development.
Biotech Bioeng 91:482-493.
Appendix B
Population balance model of a
muscle stem cell culture
C. Luni1, M. Strumendo
1, L. Boldrin
2, P. De Coppi
2 and N. Elvassore
1,*
1Dip. di Principi e Impianti di Ingegneria Chimica, Università di Padova, Italy.
2Dip. di Oncoematologia Pediatrica, Università di Padova, Italy.
*Corresponding author:
Nicola Elvassore
Department of Chemical Engineering
University of Padova
Via Marzolo, 9
35131 Padova (PD)
Italy
Telephone: +390498275469 - FAX: +390498275461

136
B.1 Abstract
Stem cell is becoming an important cell source in now emerging fields such as
tissue engineering, regenerative medicine, or cell therapy. In particular, muscle
stem cells and muscle precursor cells derived from skeletal muscle are of enormous
importance for their potential in muscle regeneration and gene transfer. Prediction
and control of a stem cell population growth are essential to design and optimize in
vitro cultures. In this work, the expansion of satellite stem cells, a muscle precursor
cell, is modeled by a population balance equation (PBE). Two biological
phenomena are considered: cell growth and division. Both phenomena take into
account the contact inhibition that occurs at high cell density due to a complex
network of molecular signals: an original approach based on cell radial distribution
function is proposed. The PBE, solved using the method of moments, gives the
temporal evolution of cell number density as a function of volume. Model
parameters are fitted to experimental data, consisting of measurements by a Coulter
Counter® at different time points. Satellite stem cells are isolated by single muscle
fibers of adult rat and cultured on plastic dishes. A sensitivity analysis highlights
the importance of single processes, such as proliferation, growth, and contact
inhibition. The model is validated by the experimental results and is capable of
predicting the number density evolution of satellite cell cultures with different
initial cell seeding densities. In addition, the temporal evolution of cell number
densities for each cell generation is simulated.

Population balance model of a muscle stem cell culture 137
B.2 Introduction
Stem cells are becoming an important cell source in now emerging fields such as
tissue engineering, regenerative medicine or cell therapy. They are characterized by
two properties: multipotency and self-renewal ability. Firstly described by Mauro
(1961), satellite cells, derived from skeletal muscle myofibers, are able of self-
renewal but are committed to muscle phenotype. Nonetheless, it is now recognized
their important role in muscle regeneration (Seale and Rudnicki, 2000; Chargé and
Rudnicki, 2004). Their progeny, myoblasts, fuse to form multinucleated myotubes
sharing their nuclei. This feature suggests that satellite cells can be used as a
powerful vector for gene transfer by in vivo satellite cell delivery (Negroni, et al.,
2006). However, their therapeutic use will require a means to expand in vitro the
cell population from a biopsy, and some complications still need to be solved to
define a robust clinical procedure. As biological experiments are highly costly and
time-consuming due to the complexity of biological mechanisms, the use of quasi
trial-and-error experiments may require a large number of experiments to optimize
the operational activities (Viswanathan and Zandstra, 2003; Davey and Zandstra,
2004).
An accurate modeling of stem cell cultures may be used to pursue this goal. The
first step in stem cell modeling is to elaborate a mathematical framework to
rationally describe experimental observations; then, the prototype model may be
used for a priori experimental design (Sidoli, et al., 2004). Viswanathan and
Zandstra (2003) recently reviewed different types of models developed to
characterize and predict the behavior of stem cells such as haematopoietic,
intestinal crypt, neural and embryonic stem cells. They can be classified in
stochastic models, where cell processes occur randomly because of cell-

138
autonomous properties, and deterministic models, where cells give precise
responses to exogenous stimuli. Models that attempt to combine both approaches
were recently proposed (Viswanathan, et al., 2005). In particular, Deasy et al.
(2002) developed a model, applied to muscle-derived stem cells, to calculate the
cell mitotic fraction from the cell cycle time and population growth data.
Mantzaris (2005) reviewed many possible sources of heterogeneity in a cell culture,
difficult to be all taken into account within a mathematical framework. Some
models describe bulk responses of stem cell populations, whereas other models
consider a detailed characterization of a single cell without the ability of describing
a cell property distribution within a population.
Instead, a PBE approach is a mathematical tool able to rationally describe not only
average properties but also distributed properties within an ensemble of cells, i.e.
within a whole cell population. In fact, in this kind of model, cell properties are
defined at single-cell level. Since the first paper by Eakman, et al. (1966), several
papers were devoted to PBE models of microbial cell populations (for references
on this topic see Ramkrishna, 2000), few papers to PBEs of mammalian cells (Pisu,
et al., 2004), but, so far, no works reported the use of PBEs for describing stem cell
cultures.
In this work, we developed a PBE model to rationally describe the expansion of
satellite stem cells in culture. The values of model parameters were obtained from
experimental data and they were used to predict the cell number density and the
volume distribution as a function of time.
The model was also enhanced to simulate the temporal evolution of cell number
densities for each cell generation. Due to telomere shortening, there is a maximum
number of generations that satellite cells can achieve before reaching a non-
proliferative state called cellular senescence (Wernig et al., 2005). In this context,

Population balance model of a muscle stem cell culture 139
the model can be effectively used to predict the myogenic potential of a population
of satellite cells by keeping track of which generation cells belong to.
B.3 Materials and methods
B.3.1 Satellite cells isolation
Satellite cells derived from primary culture are used in the experiments. Myofibers
are isolated as previously described (Rosenblatt, et al., 1995). Briefly, flexor
digitorum brevis (FDB) muscles of Winstar rat (Charles River, Monza, Italy) are
digested for 3 h at 37°C in 0.2% (weight/vol) collagenase type I (Sigma-Aldrich,
Milano, Italy) diluted in Dulbecco’s modified Eagles medium (DMEM, Sigma-
Aldrich). Following muscle digestion, single fibers are selected at the inverted
microscope (Olympus IX71, Tokyo, Japan) and plated on deep plastic dishes
(Falcon, BD Biosciences, San Diego, California, USA), pre-coated with rat
collagen (Sigma-Aldrich). Myofibers are incubated at 37.5°C, 5% CO2 in a
humidified tissue culture incubator. At the third day in culture, the proliferating
medium, consisting of DMEM containing 20% (vol/vol) of foetal bovine serum
(Gibco-Invitrogen, Milano, Italy), 10% (vol/vol) of horse serum (Gibco-Invitrogen)
and 0.5% (vol/vol) of chicken embryo extract (MP-Biomedicals, Verona, Italy), is
added to the dishes. Medium is changed every 2 days. At 70-80% confluence, cells
are trypsinized and seeded for the experiments.
B.3.2 Experiments and analysis
Two sets of experiments are performed in order to define model parameters and to
check model reliability. In the first set, cells are seeded at 0 500N cell/cm2

140
density on 7 plastic dishes (10 cm2 area) and cultured in identical conditions with
proliferating medium which is changed every 48 hours. Every 24 hours, cells from
one plastic dish are detached with trypsin (Gibco-Invitrogen) and counted by Z1™
Series Coulter Counter®
Cell and Particle Counter (Beckman Coulter, Milano,
Italy) which provides the cell number density as a function of volume. This
procedure is adopted for a one-week culture period and this experiment is repeated
twice to detect variability.
In the second set of experiments, cells are seeded on plastic dishes at different
densities: 0 100,500,1000N cell/cm2. The measurements of the cell number
density as a function of volume are carried out as reported above.
B.4 Mathematical modeling
B.4.1 Process description
We assume that the state of a cell in the culture is defined by its volume. The
choice of cell volume as the internal variable is motivated by flow cytometric
studies: we stained a satellite population by propidium iodide (Sigma-Aldrich,
Milano, Italy) and we analyzed it by a FACScanTM
flow cytometer (Becton
Dickinson, Milano, Italy). It was observed that cells at the beginning of the S-phase
had a larger forward scatter (FSC) intensity, which is related to cell volume, than
cells in G1-phase. This result suggests that, for skeletal muscle stem cell cultures,
cell volume can be assumed to be the driving force to enter the division phase.
Cells are approximated by round disks adherent on the surface of a Petri dish,
assumed to be a two-dimensional system. ( , )W V t dV represents the number of

Population balance model of a muscle stem cell culture 141
cells per unit plastic dish surface that at time t have volume between V and
V dV .
The biological process we reproduce by our model is schematically illustrated in
Figure 1. In the model we neglect the lag phase occurring in the first two days after
seeding, when cells adapt themselves to the new environment. The model initial
conditions refer to experimental data at the beginning of the third day in culture.
The initial cell population is heterogeneous in terms of cell volume. Cell growth
increases cell volume deterministically, whereas cell division can occur at different
cell volumes following a statistical distribution. Cell division can be asymmetric,
which implies a different lifetime for each daughter cell. All these phenomena
increase population heterogeneity. As soon as a critical cell density is attained (
max , where is the cell packing factor), contact inhibition decreases cell
division and growth rates. It is assumed that no significant cell death occurs as
resulting from experimental observation.
The PBE model is formulated as follows:
max( , )( , ( )) ( , ) 2 ( ', ( )) ( , ') ( ', ) ' ( , ( )) ( , )
V
V
W V tr V N t W V t V N t p V V W V t dV V N t W V t
t V
(B1)
where V and 'V are both cell volumes, but the latter referred to cells which
undergo division; maxV is the maximum volume that a single cell can attain; N is
the cell density; r is the single cell growth rate; is the division rate function; p
is the partition probability density function. The PBE is subject to a regularity
boundary condition:
max
0
( , ( )) ( , ) 0
V
r V N t W V t dVV
(B2)

142
and an appropriate initial distribution. Equations (B1) and (B2) were
mathematically derived by Ramkrishna (2000).
B.4.2 Growth
Cell growth rate represents the increase in cell volume with time. The growth rate
is defined as the difference between nutrient uptake and product release rates,
assuming the first proportional to the cell surface and the latter to the cell volume
(Eakman, et al., 1966):
* 2 3
1 2( )r V k V k V , (B3)
where 1k and 2k are constants. The maximum volume, maxV , that a spherical cell
can attain yields a growth rate equal to zero. Thus, once defined the parameter 1k ,
2k is given by:
1 3
2 1 maxk k V . (B4)
Taking account of the inhibitory process, the growth rate is defined by:
2/3
1 2( , ) ( ) rnr V N k V k V G N , max0,V V , (B5)
where ( )G N is the inhibition factor described successively in Equation (B10), and
rn a model parameter.
B.4.3 Cell division
We assume that cell division volume is normally distributed around the mean cell
division volume, cV . From this assumption, cell division rate is defined as in
Eakman, et al. (1966) and modified to take into account contact inhibition:

Population balance model of a muscle stem cell culture 143
2
2exp ( )
( , ) ( )
c
n
c
V Vr V
V N G NV V
erfc
, (B6)
where 2 is the cell division volume standard deviation and n is a model
parameter.
The division process is further characterized by the partition probability density
function ( , ')p V V , which describes the probability that a cell with volume 'V will
produce upon cell division two cells with volumes V and 'V V . As in Hatzis, et
al. (1995), it is assumed that the newborn cells probability density function is a
symmetric beta distribution:
1 11 1
( , ') 1( , ) ' ' '
q qV V
p V Vq q V V V
, (B7)
where 'V is the mother cell volume and V the daughter one, ( , )q q is the beta
function and q is a model parameter. We assume that, even though division can be
asymmetric, the most probable is a symmetric cell division; the acceptability of this
assumption is discussed later in the sensitivity analysis.
B.4.4 Contact inhibition
During the cell culture, frequent medium changes allow bulk properties to be
almost constant, thus, we neglect bulk changes in the intercellular
microenvironment. However endogenous factors are very diluted regulatory
molecules, and even small variations in their concentration have a consistent
impact on cell behavior (Lauffenburger and Linderman, 1993). These molecules

144
are produced by cells themselves and it is reasonable to assume that their influence
on cell growth and division parameters is related to cell density. We call “contact
inhibition” a complex network of phenomena which increase in importance as cell
density on the culture dish increases, and we define an inhibition term G to
represent a lumped function where all these phenomena are taken into account. In
this way it is possible to develop a basic model that considers only the macroscopic
effect of complex molecular signaling, which has not been totally elucidated yet.
Inhibition is taken into account by using the radial distribution function (RDF) that
gives the probability of cell-cell contact as function of cell packing fraction, i.e. cell
density. It is defined by Bravo Yuste and Santos (1993) for hard disks (we refer to
a two-dimensional culture system):
max2
1( ) 1,
(1 )
ag g , (B8)
where 2 3 2
3a and is the packing factor, defined as:
2
max[0; ]inhibN v d , (B9)
N is the cell density (number of cells per unit surface), 4v and inhibd
represents, in general, the hard disk diameter. represents the fraction of surface
on the Petri dish occupied by the cells. In particular, as cell inhibition is present
before contact occurs, inhibd is the cell “diameter” considering also the area around
the cell where it has an influence by molecular signals.
The RDF is used to define the inhibition factor, G , which represents the
probability of contact between different cell influence areas:

Population balance model of a muscle stem cell culture 145
max
1( ) 1 0,1
1
gG
g. (B10)
B.4.5 Numerical solution
The PBE in (B1) is solved by the method of moments (Ramkrishna, 2000). The
initial cell number density, 0 ( )W V , is taken as being lognormal and subsequent
time-dependent cell number densities, ( , )W V t , are assumed to remain lognormal:
2
2
log( / )/( , ) exp
22 ( / )
VNW V t
V, (B11)
where , and N are the distribution parameters. Although the solution is
restricted to a lognormal distribution, the three parameters are allowed to vary with
time. The experimental results indicate that the lognormal function is a good fitting
for the cell volume distributions.
Taking the zeroth, first and second moments of equation (B1) in dimensionless
variables, the following equations system is obtained:
1
1/3
0
2
1
1/3
0
2 21 121/3 1/3
0 0
exp2
exp 2 2 2 1
m
m
m m
t kdNWdV
dt
t kdN rWdV
dt
t k t kdN rWVdV K WV dV
dt
(B12)
where mt represents the maximum time of experimental observation and N , t , ,
W , V , r are dimensionless variables. The resulting nonlinear ordinary differential
equation system (B12) is integrated by a variable-order solver based on the

146
numerical differentiation formulas (NDFs), to find the lognormal parameters as
functions of time. The initial conditions are derived from the experimental data at
48t hour, end of the lag phase.
B.4.6 Description of generations
The model is extended to track the temporal evolution of cell number densities for
each cell generation (Liou, et al., 1997). The proposed model is a system of f
gn
(total number of generations) partial-integro-differential equations similar to (B1)
one for each generation, in dimensionless form it is:
1 1
1/3 1/3
1 1 111/3 1/3 1/3
1
2 ' 2,3,..., ( 1)
g
g g
g
g g g
n m mn n g
n fm m mn n n g g
V
W t k t kr W W n
t V
W t k t k t kr W p W dV W n n
t V
1 1
11/3 1/32 '
g
g g
n fm mn n g g
V
W t k t kr W p W dV n n
t V
. (B13)
Cells are assumed to be all in the first generation at 0t . In the first generation
there is no source term, and in the last one there is no exit term. In fact stem cells
undergo a finite number of replicative cycles before showing cellular senescence,
differentiation and fusion into myotubes. Thus, after ( 1)f
gn divisions cells stop
duplicating.
As experimental data were available only for the overall population, model
parameters were not changed from generation to generation, even though it is
possible to define differently the growth and cell division rates, and the inhibition
influence for each generation.

Population balance model of a muscle stem cell culture 147
In the numerical solution we assume that the cell number density functions of each
generation, gnW for 1,2,..., f
g gn n , can be approximated by lognormal
distributions. The equation system (B13) is solved by the method of moments, as
reported before. The resulting nonlinear ordinary differential equation model is
integrated by a variable-order solver based on the numerical differentiation
formulas (NDFs), to find the lognormal parameters as functions of time for each
generation.
B.5 Results
B.5.1 Experimental data and model fitting
Figure 1 shows a schematic representation of the phenomena that are described by
the population balance equation: cell growth, mitosis and contact inhibition which
becomes prevailing at high cell density values ( max ).
The cell growth is responsible for the cell volume increase, while mitosis is the
process occurring when a cell divides and unequally partitions its volume into two
daughter cells. Both growth and division are influenced by contact inhibition, a
complex network of cell-density-dependent phenomena, related to autocrine and
paracrine communication.
In a first set of experiments, we seeded 0 500N cell/cm2 on 14 plastic dishes.
Every 24 hours, the cells from two different Petri dishes where analyzed by the
Coulter Counter®, giving similar results according to the Kolmogorov-Smirnov
test. The measurements from a second set of experiments at the same culturing
conditions confirmed the results from the first set. Therefore, the experimental
148
method turns out to be reproducible even for different cell biopsies, which is a
fundamental prerequisite for the experimental validation of the model.
The experimental data from the first set of experiments are shown in Figure 2. At
each time point, experimental cell number densities from the Coulter Counter®
measurements are fitted by lognormal distributions.
Between day 1 and 3 the volume distributions do not change visibly probably
because of the lag phase; the model simulation starts from day 2 neglecting this
period. In the lower part of the graph in Figure 2a, the contour plot shows lines
connecting points of equal number densities as functions of time and cell volume.
For comparison, the cell mean volume (--■--) is also reported as a function of time.
During the 7-day culture, the cell mean volume remains almost constant between
2000 and 33000 m , whereas the cell volume distribution is wider for the last
experimental time points (day 5-7).
Figure 3 shows a comparison between the experimental data and the model
calculation for cell density (Fig. 3a) and cell volume (Fig. 3b). The values of the
parameters used in the population balance equation are reported in Table I. These
values are used for the correlation and the prediction of both set of experiments.
The cell density is the zeroth moment of the number density, while the average cell
volume is the ratio between the first moment and the zeroth moment. For both
cases, the model is able to give a fair description of the experimental data within
the experimental uncertainties. In Figure 3a the increase of experimental
uncertainty at longer times in culture, represented by larger error bars, is mostly
related to the cell differentiation process which ends in myoblast fusion and
myofiber formation.

Population balance model of a muscle stem cell culture 149
Figure 4 shows a comparison between the time evolution of experimental (Figure
4a) and calculated (Figure 4b) cell volume distribution. The population balance
equation reasonably reproduces both the average cell volume (--■--) and the cell
volume distribution.
Our results show that the PBE may be successfully used to accurately represent the
time evolution of average and segregated properties of the population of satellite
cells in a bi-dimensional culture. The volume was chosen as the only independent
variable, however the use of other internal properties, such as cell age, protein or
gene expression levels could be implemented as internal variables of the model.
B.5.2 Sensitivity analysis
In order to rationally understand the dependence of the model output on each
parameter, a local sensitivity analysis (LSA) is performed (Saltelli, et al., 2000) for
two model outputs: the cell density, N , and the cell mean volume, V . An
experiment (lag phase excluded) is simulated for 5 days and the sensitivity
coefficients, ( )ijS t
, are calculated by the following expression:
( , ) ( , )( )
j i i j i
ij
i
Y t k k Y t kS t
k
1...8
1,2
i
j (B14)
where jY is a normalized output variable ( N or V ), ik is a dimensionless
parameter value from Table I and 1%i ik k .
Figure 5 shows the results of the LSA. Parameters maxN , rn , n and q are scarcely
relevant for both outputs. In particular, the observation that the partitioning
function constant ( q ) is not a significant parameter, justifies our definition of a

150
symmetric partition probability density function, ( , ')p V V . However, more
accurate definition of ( , ')p V V would be required for better describing the self-
renewal and the asymmetric cell division phenomena which can be relevant in
satellite cell cultures (Holterman and Rudnicki, 2005).
The parameter related to cell growth, 1k , influences the cell density ( N ) because
cell volume controls cell division. Both N and V are very sensitive to cV and
variations, which are involved in the model description of cell division.
maxN is the parameter that takes into account contact inhibition. It increases in
importance in the last phase of the simulation when N is larger. By plotting N vs.
t (Figure 3a) we obtain a sigmoid curve which tends to a constant value of maxN
for large t .
B.5.3 Model prediction
The capability of the model to predict the time-evolution of a cell population
properties is of overwhelming importance to optimize cell expansion processes.
A second set of experiments was performed to validate the model. The double
repetition of the same experiment as in the first set ( 0 500N cell/cm2) gave very
similar results, confirming the reliability of the experimental procedure.
Changing the seeding cell density ( 0 100,1000N cell/cm2), we obtained data
shown in Figure 6. The experimental data in Figure 6b show that the average cell
volume remains quite constant for both 0 100N and 0 1000N cell/cm2 and
shows values within the range of 2000 - 33000 m as reported for the experiment at
0 500N cell/cm2. A comparison between experimental data and model

Population balance model of a muscle stem cell culture 151
simulations in terms of cell density is shown in Figure 6a for two time points: day 3
and 7. The model reveals a good predictive ability.
Even if our model does not contain variables related to external conditions in
culture that can be controlled for optimization purposes, it is a first important step
to predict experimental data generated at different cell seeding densities.
B.5.4 Generation model description
In a clinical perspective of using stem cells for tissue engineering, regenerative
medicine or cell therapy, it is of paramount importance not only to rapidly and
easily expand the stem cells isolated from a biopsy, but also to preserve cell quality
in terms of both viability and myogenic differentiative potential. This latter
requirement is relevant in order to realize an effective integration of the implanted
cells within the damaged or injured tissue (Montarras, 2005).
Because it was recently shown that the myogenic potential is related to the cell
generation (Wernig, et al, 2005), it is possible to have a measure of the culture
myogenic potential by identifying which generation cells belong to. This is
attainable by applying PBEs to each individual generation as reported in (B13).
For instance, Figure 7 shows the simulation results at two time points for the initial
condition 0 500N cell/cm2 and assuming 10f
gn . This model can reproduce the
number density of each generation as a function of time: as the number densities of
the first generations move to the right (larger volumes), cells from new generations
appear with smaller cell volumes. To ease the result view, in Figure 8 the evolution
of the cell density is presented as in Figure 3a highlighting the contribution of each
generation to the total cell density.

152
Data from Figure 8 are normalized with respect to the total cell density and shown
in Figure 9a. This is a useful representation in a clinical perspective, as it is
immediately apparent the proliferative senescence degree of the cell population. In
Figure 9b, the model results are shown from a simulation where the initial
conditions were determined from the model results at day 7 for each generation, but
the overall cell density was dropped again to 0 500N cell/cm2. In this way, it is
simulated the situation that occurs after detaching the cells from the plastic dish
and seeding them again at a lower concentration. The time in Figure 9b starts from
day 9 because of the lag phase of two days in the second Petri dish. This kind of
simulation could result particularly useful to determine the conditions (time for cell
passages and seeding concentration) that minimize the proliferative senescence of
the cell population.
Further studies will be required to experimentally validate the time evolution of
segregated properties described for each generation by the PBE; in particular it
would be important to determine the model parameters related to the biological
processes from generation to generation. In this simulation the values of the
parameters are common to all the generations and are given in Table I.
B.6 Conclusion
In this paper we develop a mathematical model that determines the volume
distribution of a satellite cell population as a function of time. The model
incorporates growth and cell division processes, both influenced by contact
inhibition, a consequence of cell-cell interactions. The model is based on a PBE
using cell volume as the internal variable to describe the cell state. An original

Population balance model of a muscle stem cell culture 153
approach is adopted to consider the contact inhibition influence, defining an
inhibition factor related to the radial distribution function. The model is supported
by experimental data to obtain parameters values. A sensitivity analysis on the
parameters is performed; in particular, we report the influence of those controlling
growth, cell division and inhibition processes. The model is validated by further
experimental data at different initial conditions and it results reliable in predicting
the temporal evolution of the cell culture. Besides, an enhancement of the model is
introduced applying the PBE to each generation in the cell population.
Our model can be used to improve cell expansion efficiency in vitro. In fact, as
shown in Figure 3a, it is advisable to design cell expansion protocol where the
average duplication rate, represented by the curve slope, is kept at the maximum
values. This can be achieved by adjusting the initial cell seeding density, the
number of cell passages and, in general, avoiding culture conditions where contact
inhibition starts preventing cell division.
As future work, it would be opportune to explicitate the contact inhibition term, for
instance by including ligand-receptor kinetics, in order to define the cell processes
dependence on the micro-environment surrounding the cells.
B.5.4 Nomenclature
a constant in RDF (dimensionless)
inibd cell inhibition diameter ( cm )
g radial distribution function (dimensionless)
G contact inhibition factor function (dimensionless)
1k cell growth parameter ( 1 m h )

154
2k cell growth parameter ( 1h )
rn model parameter for cell growth inhibition (dimensionless)
n model parameter for cell mitosis inhibition (dimensionless)
N cell density ( 2cm )
p distribution of cell volumes for the newborn cells ( 3m )
q constant in newborn cell volume distribution (dimensionless)
r cell growth rate ( 3 1m h )
*r cell growth rate according to Eakman, et al. (1966) ( 3 1m h )
t time ( h )
mt experiment time ( h )
v constant for the packing factor calculation (dimensionless)
V cell volume ( 3m )
cV cell mean division volume ( 3m )
W cell number density ( 2 3cm m )
Greek Symbols
cell division rate ( 1h )
cell division volume standard deviation times 2 ( 3m )
packing factor (dimensionless)
parameter of cell number density (dimensionless)
parameter of cell number density (dimensionless)
Subscripts

Population balance model of a muscle stem cell culture 155
gn generation number (dimensionless)
f
gn first generation without myogenic potential (dimensionless)
max maximum
0 initial condition
tot referred to the whole cell population
Superscripts
' referred to mother cells
dimensionless

156
B.5.5 References
Bravo Yuste S, Santos A. 1993. A heuristic radial distribution function for hard
disks. J Chem Phys 99:2020-2024.
Chargé S B P, Rudnicki M A. 2004. Cellular and molecular regulation of muscle
regeneration. Physiol Rev 84:209-238.
Davey R E, Zandstra P W. 2004. Signal processing underlying extrinsic control of
stem cell fate. Curr Opin Hematol 11:95-101.
Deasy B M, Qu-Peterson Z, Greenberger J S, Huard J. 2002. Mechanisms of
muscle stem cell expansion with cytokines. Stem Cells 20:50-60.
Eakman J M, Fredrickson A G, Tsuchiya H M. 1966. Statistics and dynamics of
microbial cell populations. Chem Eng Prog Symp Series No 69 62:37-49.
Hatzis C, Srienc F, Fredrickson A G. 1995. Multistaged corpuscular models of
microbial growth: Monte Carlo simulations. Biosystems 36:19-35.
Holterman C E, Rudnicki M A. 2005. Molecular regulation of satellite cell
function. Semin Cell Dev Biol 16:575-584.
Lauffenburger D A, Linderman J J. 1993. Receptors. Model for binding, trafficking
and signaling. New York: Oxford University Press.
Liou J J, Srienc F, Fredrickson A G. 1997. Solutions of population balance models
based on a successive generations approach. Chem Eng Sci 52:1529-1540.
Mantzaris N V. 2005. Single-cell gene-switching networks and heterogeneous cell
population phenotypes. Comp Chem Eng 29:631-643.
Mauro A. 1961. Satellite cell of skeletal muscle fibers. J Biophys Biochem Cytol
9:493-495.

Population balance model of a muscle stem cell culture 157
Montarras D, Morgan J, Collins C, Relaix F, Zaffran S, Cumano A, Partridge T,
Buckingham M. 2005. Direct isolation of satellite cells for skeletal muscle
regeneration. Science 309(5743):2064-7.
Negroni E, Butler-Browne G S, Mouly V. 2006. Myogenic stem cells: regeneration
and cell therapy in human skeletal muscle. Pathol Biol 54:100-108.
Pisu M, Lai N, Cincotti A, Concas A, Cao G. 2004. Modeling of engineered
cartilage growth in rotating bioreactors. Chem Eng Sci 59:5035-5040.
Ramkrishna D. 2000. Population balances. Theory and applications to particulate
systems in engineering. San Diego: Academic Press.
Rosenblatt J D, Lunt A I, Parry D J, Partridge T A. 1995. Culturing satellite cells
from living single muscle fiber explants. In Vitro Cell Dev Biol Anim 31:773-779.
Saltelli A, Chan K, Scott E M. 2000. Sensitivity analysis, probability and statistics
series. London: Wiley.
Seale P, Rudnicki M A. 2000. A new look at the origin, function, and “stem-cell”
status of muscle satellite cells. Dev Biol 218:115-124.
Sidoli F R, Mantalaris A, Asprey S P. 2004. Modelling of mammalian cells and
cell culture processes. Cytotechnology 44:27-46.
Viswanathan S, Zandstra P W. 2003. Towards predictive models of stem cell fate.
Cytotechnology 41:75-92.
Viswanathan S, Davey R E, Cheng D, Raghu R C, Lauffenburger D A, Zandstra P
W. 2005. Clonal evolution of stem and differentiated cells can be predicted by
integrating cell-intrinsic and extrinsic parameters. Biotechnol & Appl Biochem.
Published on the web.

158
Wernig A, Schafer R, Knauf U, Mundegar R R, Zweyer M, Hogemeier O, Martens
U M, Zimmermann S. 2005. On the regenerative capacity of human skeletal
muscle. Artificial Organs 29:192-198.
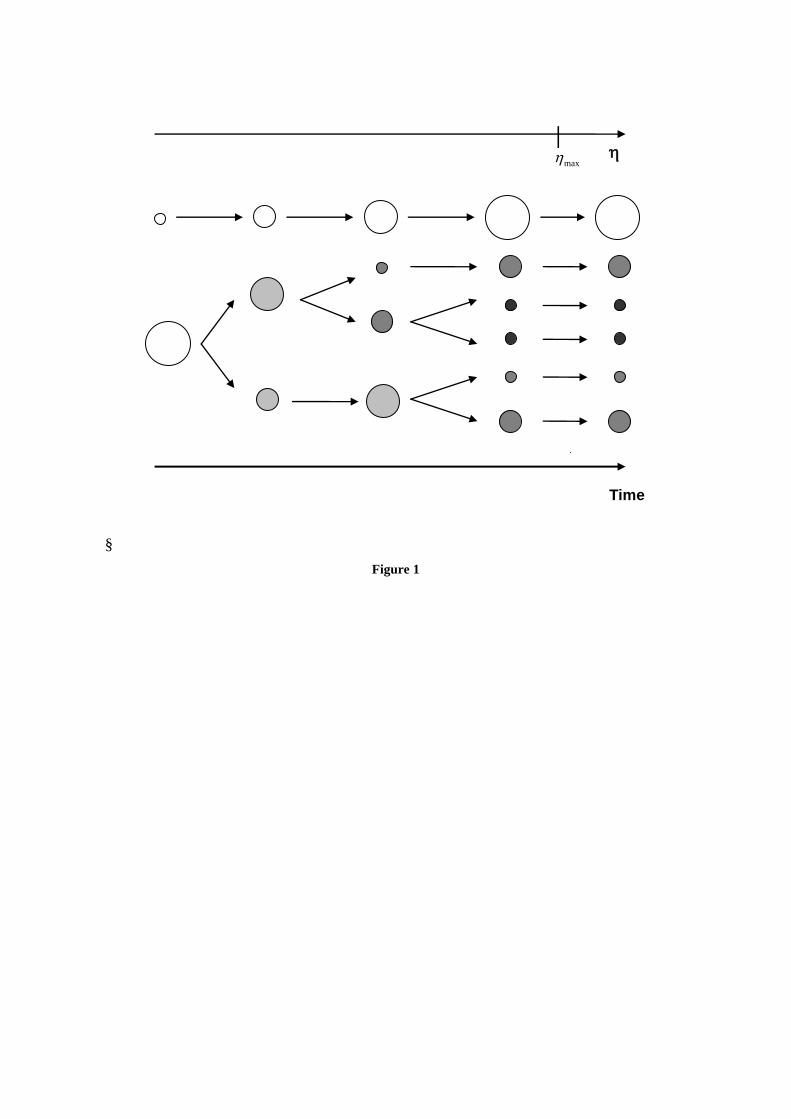
§
Figure 1
Time
│
max

Figure 2
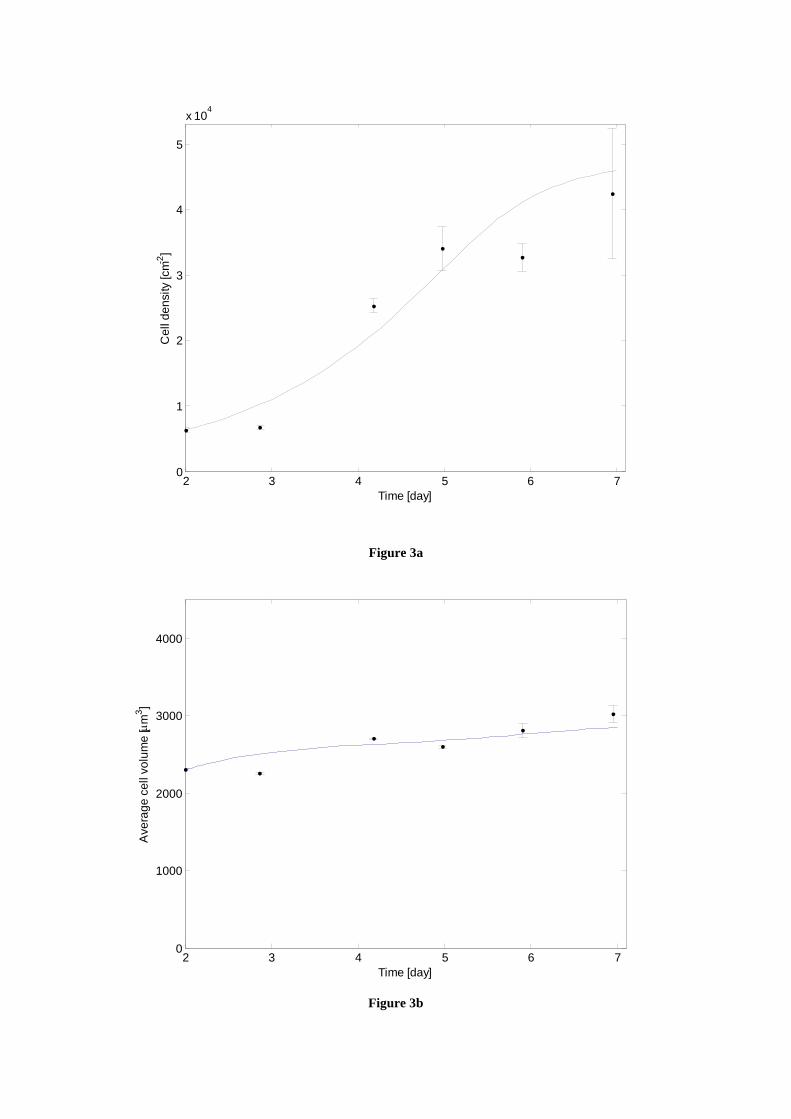
2 3 4 5 6 70
1
2
3
4
5
x 104
Ce
ll d
en
sity [cm
-2]
Time [day]
Figure 3a
2 3 4 5 6 70
1000
2000
3000
4000
Ave
rag
e c
ell v
olu
me
[ m
3]
Time [day]
Figure 3b

Figure 4a
Figure 4b

2
3
4
5
6
7
Model parameters
Tim
e [d
ay]
-0.8
-0.6
-0.4
-0.2
0
0.2
0.4
0.6
0.8
n
nr
k1
Vmax
Vc
Nmax
q
Figure 5a
3
4
5
6
7
Model parameters
Tim
e [d
ay]
0
0.05
0.1
0.15
0.2
Nmax
Vc
Vmax
k1
nr
n
q
Figure 5b

Figure 6a
0
10000
20000
30000
40000
50000
60000
Day 3 Day 7 Day 3 Day 7 Day 3 Day 7
Time
Ce
ll d
en
sity [
cm
-2]
Experimental
Calculated
N0=100 cell/cm2
N0=500
cell/cm2
N0=1000 cell/cm2
0
500
1000
1500
2000
2500
3000
3500
4000
Day 3 Day 7 Day 3 Day 7 Day 3 Day 7
Time
Ave
rag
e c
ell
vo
lum
e [μ
m3]
Experimental
Calculated
N0=100 cell/cm2
N0=500 cell/cm2 N0=1000
cell/cm2
Figure 6b

0 1000 2000 3000 4000 5000 6000 70000
5
10
15
Cell volume [m3]
Nu
mb
er
de
nsity [cm
-2
m-3
]
t=3 day
Gen. 1
Gen. 2
Gen. 3
Gen. 4
Figure 7a
0 1000 2000 3000 4000 5000 6000 70000
5
10
15
Cell volume [m3]
Nu
mb
er
de
nsity [cm
-2
m-3
]
t=5 day
Gen. 1
Gen. 2
Gen. 3
Gen. 4
Gen. 5
Gen. 6
Gen. 7
Gen. 8
Figure 7b

Time [day]
Ce
ll d
en
sity [cm
-2]
2 3 4 5 6 70
1
2
3
4
5x 10
4
N1
N2
N3
N4
N5
N6
N7
N8
N9
N10
Figure 8

Time [day]
Ni/N
tot,
i=1
..1
0
2 3 4 5 6 70
0.1
0.2
0.3
0.4
0.5
0.6
0.7
0.8
0.9
1
N1/N
tot
N2/N
tot
N3/N
tot
N4/N
tot
N5/N
tot
N6/N
tot
N7/N
tot
N8/N
tot
N9/N
tot
N10
/Ntot
Figure 9a
Time [day]
Ni/N
tot,i
=1
..1
0
9 10 11 12 13 140
0.1
0.2
0.3
0.4
0.5
0.6
0.7
0.8
0.9
1
N1/N
tot
N2/N
tot
N3/N
tot
N4/N
tot
N5/N
tot
N6/N
tot
N7/N
tot
N8/N
tot
N9/N
tot
N10
/Ntot
Figure 9b

Appendix C
Dispositivo di miscelazione
meccanica per piastre di coltura
In this Appendix the patent application for the device described in Chapter 4 is
reported, whose details are:
Application number: PD2008A000371
Applicant: Università degli Studi di Padova
Inventors: Nicola Elvassore, Camilla Luni, Laura Gallimberti
Class: C12M106
Camera di Commercio Industria, Artigianato e Agricoltura of Padova
Date of deposit: 2008/12/17
C.1 Riassunto
Dispositivo per la miscelazione meccanica di colture cellulari in sospensione
contenute in una piastra di coltura, comprendente: - un coperchio 10 destinato ad

172
essere amovibilmente associato ad una piastra di coltura P per schermare il
pozzetto o i pozzetti W di quest’ultima limitando l’ingresso di solidi sospesi
nell’aria ambiente, e al contempo permettendo l’ingresso di gas e umidità esterni; -
almeno una girante di miscelazione 20 per ciascun pozzetto W della piastra di
coltura P; - mezzi motori 30 collegabili cinematicamente a ciascuna girante 20.
La girante 20 è rotazionalmente associata al coperchio 10 in corrispondenza della
faccia di quest’ultimo destinata ad essere rivolta verso detta piastra di coltura P.
Almeno il coperchio 10 e le giranti 20 sono realizzate con materiali che possono
essere sottoposti a trattamenti di sterilizzazione e sono in grado di resistere alle
condizioni di umidità, temperatura e pH che si creano in un incubatore biologico.
[Fig. 1]
C.2 Descrizione
C.2.1 Campo di applicazione
Forma oggetto della presente invenzione un dispositivo di miscelazione meccanica
per piastre di coltura. Vantaggiosamente, il dispositivo secondo l’invenzione può
essere utilizzato in tutti i settori che prevedano l’utilizzo di piastre coltura, in
particolare per colture cellulari o microbiologiche in sospensione, quali il settore
biotecnologico, alimentare, farmaceutico e biomedico.
C.2.2 Stato della tecnica
Come è noto, alcuni tipi di cellule coltivate in vitro non aderiscono ad un supporto
(es. fondo di una piastra di coltura), ma crescono in sospensione.
Comunemente questi tipi di cellule si coltivano in medium liquido non mescolato
contenuto in piastre di coltura, come ad esempio piastre Petri a singolo pozzetto o

Dispositivo di miscelazione meccanica per piastre di coltura 173
piastre a pozzetti multipli o multiwell (come illustrato nella Figura A allegata),
oppure in fiasche che garantiscono volumi maggiori rispetto alle piastre. In questi
sistemi di coltura “statici” le cellule sono portate ad accumularsi sul fondo a causa
del proprio peso con distribuzioni non ripetibili da esperimento a esperimento. Nel
volume di coltura vengono inoltre a formarsi gradienti di concentrazione di
nutrienti, gas e fattori di crescita. Ciò rende sostanzialmente impossibile ottenere
condizioni ambientali omogenee in tutto l’ambiente di coltura.
Si stanno quindi sempre più diffondendo sistemi di coltura in sospensione di tipo
mescolato, allo scopo di ottenere colture più ripetibili e condizioni ambientali
omogenee in termini, ad esempio, di concentrazioni di metaboliti e principi attivi.
Sistemi mescolati permettono inoltre di migliorare lo scambio di gas con
l’ambiente esterno.
La necessità di colture in condizioni dinamiche ha quindi portato allo sviluppo di
diversi sistemi di mescolamento.
In generale i sistemi di mescolamento attualmente utilizzati possono essere
ricondotti a tre tipologie principali: agitatori magnetici; agitatori a scuotimento
(scuotitori); agitatori meccanici o a giranti.
Per applicazioni specifiche su piastre di coltura, Petri o multipozzetto, si adottano
solo agitatori magnetici o a scuotimento. Tipicamente le piastre multipozzetto
possono avere 6 pozzetti (come illustrato in Figura A), oppure 12, 24, 48 o 96
pozzetti. Queste piastre sono utilizzate in particolare per colture cellulari molto
costose (come possono essere quelle di cellule staminali). I pozzetti hanno volumi
da 200 microlitri a 10 millilitri (e comunque mai superiori a 20 ml).
Per applicazioni su piastre di coltura ed in generale su volumi di pochi millilitri non
si utilizzano, invece, agitatori meccanici.

174
Com’è noto, infatti, aspetti critici di un sistema di coltura mescolato sono il
controllo contemporaneo di temperatura e pH e il mantenimento di condizioni di
sterilità. Per “mantenimento della sterilità” si intende impedire o sostanzialmente
schermare l’ingresso di solidi sospesi nell’aria, veicolo di contaminazione
biologica.
Sono queste esigenze che hanno reso fino ad oggi praticamente inutilizzabili per
volumi di pochi millilitri i miscelatori meccanici a girante, che pur garantirebbero
ottime prestazioni di mescolamento. La presenza dell’albero di rotazione della
girante e il suo collegamento con i relativi mezzi motori impongono, infatti, tutta
una serie di complicazioni costruttive per garantire la sterilità del sistema ed il
controllo di temperatura e pH, giustificabili solo per contenitori aventi volumi non
inferiori a 100 ml.
Per questi motivi i miscelatori meccanici si adottano principalmente in bioreattori,
ossia in sistemi costruttivamente complessi e destinati al trattamento di volumi
rilevanti, tali da giustificare anche l’utilizzo di sonde per la misura di temperatura e
pH, e il controllo della temperatura in genere tramite camicie d’acqua termostatata.
Gli agitatori magnetici - che operano trascinando in rotazione tramite un campo
magnetico un’ancoretta magnetica (opportunamente sagomata) posta sul fondo di
ciascun singolo pozzetto – ben si adattano invece a sistemi di coltura semplici e con
volumi ridotti. Questo tipo di agitatori permette infatti di ottenere una miscelazione
efficace e facilmente regolabile in intensità senza imporre complicazioni costruttive
particolari per garantire il controllo di pH e della temperatura ed il mantenimento
della sterilità. Il limite principale di questi sistemi è legato al fatto che il
trascinamento dell’ancoretta magnetica posta sul fondo del pozzetto produce sforzi
di taglio, meccanici e di pressione, che possono danneggiare le colture.

Dispositivo di miscelazione meccanica per piastre di coltura 175
Anche gli agitatori a scuotimento, in quanto sistemi “non invasivi”, ben si adattano
all’impiego per volumi di coltura ridotti e quindi in sistemi semplici da un punto di
vista costruttivo ed impiantistico. Il limite principale è dato dal fatto che il livello di
miscelazione che garantiscono è molto blando e quindi sostanzialmente inefficace
per colture cellulari in sospensione soprattutto per volumi ridotti in cui, ad esempio,
le forze di superficie sono paragonabili alle forze di inerzia.
C.2.3 Presentazione dell'invenzione
Pertanto, scopo della presente invenzione è quello di eliminare gli inconvenienti
della tecnica nota sopra descritta, mettendo a disposizione un dispositivo di
miscelazione meccanica per piastre di coltura, che non richieda complicazioni
impiantistiche per il controllo della temperatura e pH e per il mantenimento della
sterilità.
Un ulteriore scopo della presente invenzione è quello di mettere a disposizione un
dispositivo di miscelazione meccanica per piastre di coltura, che sia di semplice ed
economica realizzazione.
Un ulteriore scopo della presente invenzione è quello di mettere a disposizione un
dispositivo di miscelazione meccanica per piastre di coltura, che sia utilizzabile in
modo semplice e pratico.
C.2.4 Breve descrizione dei disegni
Le caratteristiche tecniche dell'invenzione, secondo i suddetti scopi, sono
chiaramente riscontrabili dal contenuto delle rivendicazioni sotto riportate ed i
vantaggi della stessa risulteranno maggiormente evidenti nella descrizione

176
dettagliata che segue, fatta con riferimento ai disegni allegati, che ne rappresentano
una o più forme di realizzazione puramente esemplificative e non limitative, in cui:
la Figura 1 mostra un vista prospettica di una prima forma realizzativa del
dispositivo di miscelazione secondo l’invenzione associato ad una piastra di
coltura;
la Figura 2 mostra in modo schematico una modalità di utilizzo del
dispositivo di miscelazione illustrato nella Figura 1;
le Figure 3 e 4 mostrano una vista prospettica del dispositivo illustrato nella
Figura 1, presa rispettivamente dall’alto e dal basso;
la Figura 5 mostra una vista prospettica in trasparenza di un dettaglio del
dispositivo di miscelazione illustrato nella Figura 1 relativo ad un
coperchio;
la Figura 6 mostra il dispositivo illustrato nella Figura 1 parzialmente
sezionato, associato ad una piastra di coltura;
la Figura 7 mostra una vista in esploso del dispositivo di miscelazione
illustrato nella Figura 1;
la Figura 8 mostra una vista in sezione di un dettaglio del dispositivo di
miscelazione secondo l’invenzione relativo a mezzi di miscelazione;
la Figura 9 mostra una vista prospettica di un dettaglio del dispositivo di
miscelazione secondo l’invenzione relativo ad una girante;
la Figura 10 mostra una vista in esploso del dispositivo di miscelazione
realizzato in accordo ad una seconda forma realizzativa dell’invenzione;
le Figure 11 e 12 mostrano una vista prospettica, presa rispettivamente
dall’alto e dal basso, di un dettaglio del dispositivo illustrato nella Figura 10
relativo a mezzi di protezione;

Dispositivo di miscelazione meccanica per piastre di coltura 177
la Figura 13 mostra una vista laterale dei mezzi di protezione illustrati nelle
Figure 11 e 12;
la Figura 14 mostra una vista prospettica del dispositivo illustrato nella
Figura 10, in configurazione assemblata, associato ad una piastra di coltura;
e - la Figura 15 mostra uno schema cinematico di un sistema di trasmissione
del moto di un dispositivo realizzato in accordo ad una soluzione
realizzativa particolare dell’invenzione.
C.2.5 Descrizione dettagliata
Il dispositivo di miscelazione meccanica per piastre di coltura secondo l’invenzione
verrà indicato nel suo complesso con 1 nella descrizione e nei disegni allegati.
Vantaggiosamente, il dispositivo secondo l’invenzione può essere utilizzato in tutti
i settori che prevedono l’utilizzo di piastre di coltura, in particolare per colture
cellulari o microbiologiche in sospensione, quali il settore biotecnologico,
alimentare, farmaceutico e biomedico.
Il dispositivo di miscelazione secondo la presente invenzione può essere utilizzato
– nelle sue diverse varianti – sia con piastre di coltura Petri a singolo pozzetto, sia
con piastre di coltura multipozzetto, simili a quella illustrata nella Figura A allegata
(dove i pozzetti sono indicati con W e la piastra multipozzetto nel suo complesso
con P).
Come già accennato, i pozzetti di piastre di coltura standard definiscono volumi di
coltura che variano da un massimo di 10 ml (nel caso di piastra Petri a singolo
pozzetto) ad un minimo di 200 μl (nel caso di piastre con 96 pozzetti).
Il dispositivo secondo l’invenzione consente di operare una miscelazione di tipo
meccanico tramite giranti sul contenuto dei pozzetti (ad esempio, colture cellulari
in sospensione), permettendo il controllo della temperatura e pH ed il

178
mantenimento della sterilità senza le complicazioni impiantistiche tipiche dei
sistemi di miscelazione meccanica di tipo noto. In tal senso - come sarà ripreso nel
seguito - il dispositivo 1 secondo l’invenzione è stato ideato e strutturato per poter
essere utilizzato all’interno di incubatori biologici (come illustrato nella Figura 2,
dove l’incubatore biologico è schematizzato da un riquadro in linea tratteggiata ed
indicato con I).
Secondo l’invenzione, il dispositivo di miscelazione meccanica 1 comprende
innanzitutto un coperchio 10 destinato ad essere amovibilmente associato ad una
piastra di coltura P per schermarne il pozzetto o i pozzetti W limitando così
l’ingresso di solidi sospesi nell’aria ambiente A (veicolo di contaminazione
biologica), e al contempo permettendo l’ingresso di gas e umidità esterni.
Più in dettaglio, ai fini del mantenimento della sterilità all’interno dei pozzetti W
della piastra di coltura P è sufficiente che il coperchio 10 crei un percorso tortuoso
per l’ingresso dell’aria esterna. Tale percorso tortuoso impedisce o quantomeno
limita l’ingresso di corpi solidi sospesi nell’aria A.
In tal modo il coperchio 10 e la piastra di coltura P viene quindi a crearsi una
camera di coltura mantenuta sterile.
Per ciascun singolo pozzetto W di una piastra di coltura P il dispositivo 1
comprende inoltre almeno una girante di miscelazione 20 rotazionalmente associata
al suddetto coperchio 10 in corrispondenza della faccia di quest’ultimo destinata ad
essere rivolta verso la piastra di coltura P.
Il numero di giranti 20 varia in funzione del numero di pozzetti W della piastra di
coltura P.
Il dispositivo 1 comprende inoltre mezzi motori 30 collegabili cinematicamente a
ciascuna girante di miscelazione 20.

Dispositivo di miscelazione meccanica per piastre di coltura 179
Secondo l’invenzione, almeno il coperchio 10 e ciascuna girante 20 sono realizzati
con materiali biocompatibili che possono essere sottoposti a trattamenti di
sterilizzazione e che sono in grado di resistere alle condizioni di umidità,
temperatura e pH che si creano in un incubatore biologico.
Per “biocompatibilità” di un materiale si intende la proprietà di un materiale di non
interferire con l’attività di organismi, e quindi in particolare la sua inerzia chimica.
Per “trattamento di sterilizzazione” si intende un trattamento di tipo chimico e/o
fisico atto ad eliminare da un substrato eventuali organismi o microrganismi, come
ad esempio il trattamento termico in autoclave (con temperature non inferiori a
120°C e tempi di trattamento non inferiori a 30 minuti).
Le condizioni di temperatura, umidità e pH che si creano in un incubatore biologico
variano in funzione delle esigenze specifiche della coltura biologica. Mediamente,
tuttavia, le temperature sono comprese tra 35°C e 38°C, pH tra 4 e 8 e umidità tra
80% e 100%.
Vantaggiosamente, il dispositivo 1 secondo l’invenzione può comunque essere
impiegato in un più ampio spettro di condizioni, con temperature tra 0 e 100°C, pH
tra 1 e 13 e umidità tra 0 e 100%.
Preferibilmente, vengono usati materiali come il policarbonato (in particolare per
realizzare il coperchio 10) o il teflon (in particolare per realizzare le giranti di
miscelazione 20).
Possono tuttavia essere usati in alternativa anche altri materiali, come ad esempio
polistirene e altri polimeri plastici, vetro, metalli, ceramiche e siliconi, con
proprietà tali da risultare biocompatibili e resistere - senza subire deterioramenti - a
trattamenti di sterilizzazione e alle condizioni di pH, temperatura e umidità che si
vengono a creare in un incubatore biologico.

180
Il dispositivo di miscelazione 1 secondo l’invenzione può pertanto essere utilizzato
direttamente all’interno di un incubatore biologico. In questo modo, pur operando
una miscelazione meccanica mediante giranti, è possibile controllare le condizioni
di temperatura, umidità e pH (regolando la concentrazione di CO2 nell’aria) della
coltura biologica presente nella piastra di coltura senza dover prevedere soluzioni
impiantistiche ad hoc.
Preferibilmente i mezzi motori 30 sono associati meccanicamente al coperchio 10 e
sono quindi destinati ad operare all’interno di un incubatore biologico. Ciò rende
più semplice e pratico l’utilizzo del dispositivo 1.
In questo caso, vantaggiosamente, i mezzi motori 30 sono provvisti di mezzi di
schermatura 32 atti a proteggere le parti elettriche dei mezzi motori 30 sensibili
all’umidità.
In alternativa, è possibile prevedere un dispositivo 1 in cui i mezzi motori non sono
meccanicamente associati al coperchio 10 per poter operare dall’esterno di un
incubatore biologico. Questa soluzione impone tuttavia complicazioni costruttive
ed operative in quanto si deve prevedere un collegamento cinematico tra le giranti
disposte all’interno dell’incubatore e i mezzi motori disposti all’esterno dello
stesso.
Preferibilmente i mezzi motori 30 comprendono almeno un motore elettrico 31
cinematicamente collegabile a ciascuna girante 20.
Preferibilmente, come previsto nelle soluzioni realizzative illustrate rispettivamente
nelle Figure 1 e 14, il motore elettrico 31 è destinato ad essere amovibilmente
associato sulla parte sommitale del coperchio 10.
Vantaggiosamente, il motore elettrico 31 è provvisto di un contenitore ermetico 32
atto a proteggerlo dall’umidità in modo da consentirne un uso sicuro all’interno di
un incubatore biologico I. Come si può osservare in particolare nelle Figure 1 e 12,

Dispositivo di miscelazione meccanica per piastre di coltura 181
il contenitore ermetico 32 è provvisto di un’apposita apertura attraverso la quale
passa l’albero 35 del motore 31.
In accordo ad una soluzione realizzativa preferita, i mezzi motori 30 comprendono
almeno un alimentatore elettrico 33 collegabile elettricamente al motore elettrico
31.
Operativamente, il motore elettrico 31 è destinato ad operare - associato al
coperchio 10 - all’interno di un incubatore biologico I, mentre l’alimentatore 33 è
destinato ad operare all’esterno dell’incubatore I (come illustrato schematicamente
nella Figura 2).
Funzionalmente, l’alimentatore 33 e il motore 31 vengono collegati tra loro tramite
cavi di connessione elettrica 80 che possono essere fatti passare semplicemente
attraverso aperture normalmente previste in tutti gli incubatori biologici.
Preferibilmente, l’alimentatore elettrico 33 è atto a fornire corrente elettrica
stabilizzata, dalla cui intensità dipende la velocità di rotazione trasmessa dal motore
31 a ciascuna girante 20.
Vantaggiosamente, l’alimentatore elettrico 33 può essere provvisto di un sistema di
regolazione dell’intensità della corrente elettrica stabilizzata in modo che sia
possibile adattare l’intensità di miscelazione alle specifiche esigenze della coltura
biologica.
In accordo ad una soluzione realizzativa alternativa (non illustrata nelle Figure
allegate), il motore elettrico 31 può essere alimentato da batterie elettriche
alloggiate internamente al contenitore ermetico. In tal modo il motore elettrico 31
può operare autonomamente, senza che sia necessaria alcuna connessione elettrica
esternamente all’incubatore biologico. Il dispositivo 1 risulta essere inoltre
complessivamente più compatto.
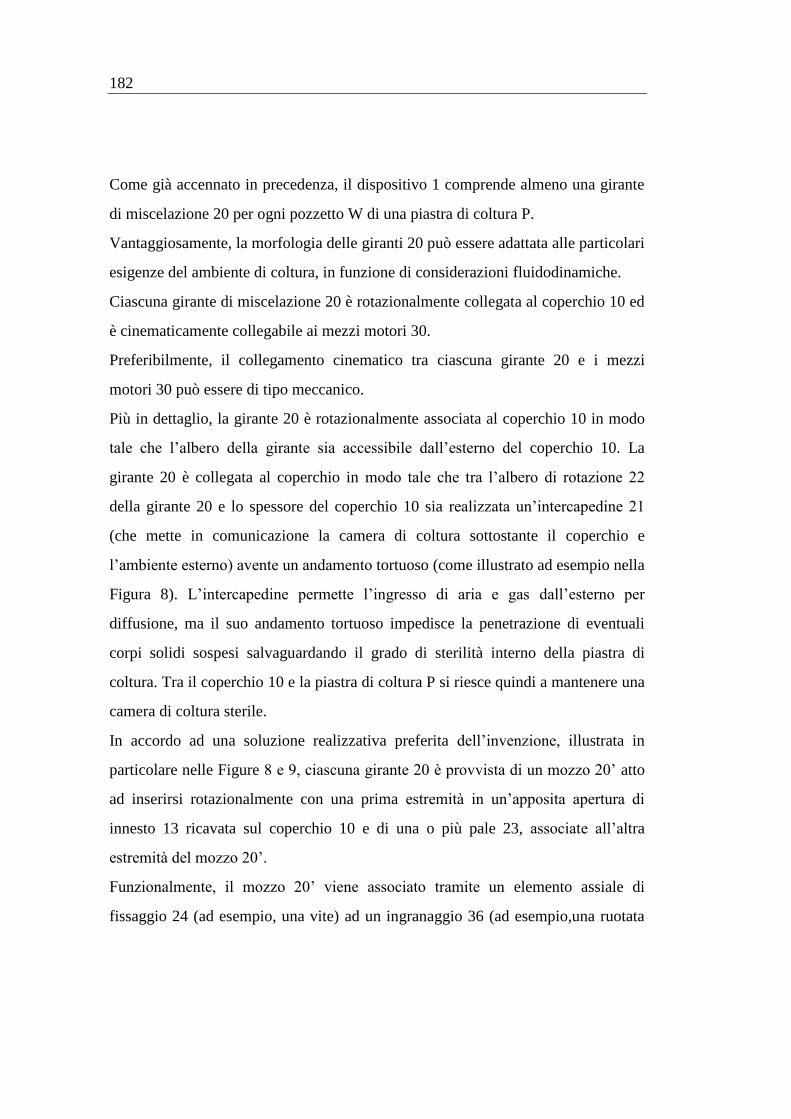
182
Come già accennato in precedenza, il dispositivo 1 comprende almeno una girante
di miscelazione 20 per ogni pozzetto W di una piastra di coltura P.
Vantaggiosamente, la morfologia delle giranti 20 può essere adattata alle particolari
esigenze del ambiente di coltura, in funzione di considerazioni fluidodinamiche.
Ciascuna girante di miscelazione 20 è rotazionalmente collegata al coperchio 10 ed
è cinematicamente collegabile ai mezzi motori 30.
Preferibilmente, il collegamento cinematico tra ciascuna girante 20 e i mezzi
motori 30 può essere di tipo meccanico.
Più in dettaglio, la girante 20 è rotazionalmente associata al coperchio 10 in modo
tale che l’albero della girante sia accessibile dall’esterno del coperchio 10. La
girante 20 è collegata al coperchio in modo tale che tra l’albero di rotazione 22
della girante 20 e lo spessore del coperchio 10 sia realizzata un’intercapedine 21
(che mette in comunicazione la camera di coltura sottostante il coperchio e
l’ambiente esterno) avente un andamento tortuoso (come illustrato ad esempio nella
Figura 8). L’intercapedine permette l’ingresso di aria e gas dall’esterno per
diffusione, ma il suo andamento tortuoso impedisce la penetrazione di eventuali
corpi solidi sospesi salvaguardando il grado di sterilità interno della piastra di
coltura. Tra il coperchio 10 e la piastra di coltura P si riesce quindi a mantenere una
camera di coltura sterile.
In accordo ad una soluzione realizzativa preferita dell’invenzione, illustrata in
particolare nelle Figure 8 e 9, ciascuna girante 20 è provvista di un mozzo 20’ atto
ad inserirsi rotazionalmente con una prima estremità in un’apposita apertura di
innesto 13 ricavata sul coperchio 10 e di una o più pale 23, associate all’altra
estremità del mozzo 20’.
Funzionalmente, il mozzo 20’ viene associato tramite un elemento assiale di
fissaggio 24 (ad esempio, una vite) ad un ingranaggio 36 (ad esempio,una ruotata

Dispositivo di miscelazione meccanica per piastre di coltura 183
dentata o una puleggia), che viene disposto sulla faccia esterna del coperchio ed è a
sua volta cinematicamente collegabile ai mezzi motori 30 per ricevere un moto
rotativo. L’elemento di fissaggio 24 funge così da albero di rotazione della girante
20.
Più in dettaglio, sempre in accordo alla suddetta soluzione realizzativa preferita
illustrata nella Figura 8, in corrispondenza della faccia esterna del coperchio
l’apertura di innesto 13 presenta una sezione allargata definente una sede 14. Tale
sede 14 è destinata ad alloggiare una boccola 25, che va ad interporsi assialmente
tra il mozzo 20’ e l’ingranaggio 36 ricevendo internamente l’elemento assiale di
fissaggio 22.
La boccola 25 funge da cuscinetto e da elemento distanziatore tra l’ingranaggio 36
e la superficie del coperchio 10. La boccola è realizzata in teflon, così da facilitare
il moto rotativo sfruttando le proprietà autolubrificanti di questo materiale.
Questa soluzione costruttiva rende sostanzialmente superfluo l’inserimento di
elementi di tenuta ad O-ring. Infatti, grazie alla variazione di sezione lungo
l’apertura 13 e alla presenza della boccola 25 viene a crearsi un percorso tortuoso
che impedisce l’ingresso di corpi solidi sospesi nell’aria esterna.
Preferibilmente, come si può osservare nella Figura 8, la porzione 20” con la quale
il mozzo 20’ si inserisce nell’apertura 13 ha una sezione ridotta. In corrispondenza
dello scalino formato dalla porzione 20” viene così a crearsi tra la faccia interna del
coperchio 10 ed il mozzo 20’ una zona di battuta che aumenta ulteriormente la
tortuosità del percorso che l’aria deve percorrere per passare dall’esterno all’interno
della camera di coltura.
In alternativa al collegamento di tipo meccanico, il collegamento cinematico tra
ciascuna girante 20 e i mezzi motori 30 può essere di tipo a trascinamento
magnetico.

184
Più in dettaglio, la girante 20 è ancora rotazionalmente associata al coperchio 10 (in
modo tale che le sollecitazioni meccaniche che si generano durante la rotazione
possano scaricarsi principalmente sul coperchio 10), ma è portata in rotazione per
trascinamento magnetico dall’esterno del coperchio 10. In tal modo si evita di
dover realizzare sul coperchio aperture che (pur schermate e protette) sono
comunque zone potenziali di ingresso di elementi di contaminazione.
In accordo ad una soluzione realizzativa alternativa (non illustrata nella Figure
allegate) ciascuna girante 20 è provvista di un mozzo atto ad inserirsi
rotazionalmente con una prima estremità in un’apposita sede cieca ricavata sulla
faccia interna del coperchio e di una o più pale, associate all’altra estremità del
mozzo. La girante è provvista di un elemento sensibile al campo magnetico. Sulla
faccia esterna del coperchio 10 viene rotazionalmente collegato un ingranaggio (ad
esempio,una ruotata dentata o una puleggia) provvisto a sua volta di un elemento
magnetico. Grazie a tale elemento magnetico l’ingranaggio riesce a trascinare la
girante nel movimento di rotazione che a sua volta riceve dai mezzi motori.
Vantaggiosamente, i mezzi motori 30 comprendono un sistema di trasmissione del
moto 36, 37 dall’albero motore 35 del motore elettrico 31 all’albero 22 di ciascuna
girante 20 (tramite collegamento meccanico o magnetico).
Come già accennato in precedenza il dispositivo di miscelazione 1 secondo
l’invenzione può essere utilizzato con piastre di coltura, del tipo Petri a singolo
pozzetto o del tipo multipozzetto. Il numero e la disposizione delle giranti 20 varia
dunque in funzione del numero di pozzetti W della piastra di coltura P.
Nel caso di utilizzo con piastre Petri a singolo pozzetto, il dispositivo 1 è provvisto
di un’unica girante 20. In questo caso l’ingranaggio 36 cinematicamente collegato
al mozzo 20’ della girante può essere collegato direttamente all’albero motore 35
del motore 31. Il sistema di trasmissione del moto è quindi molto semplice e può

Dispositivo di miscelazione meccanica per piastre di coltura 185
essere realizzato da due ruote dentate oppure da due pulegge collegate da una
cinghia o una catena.
Nel caso di utilizzo con piastre di coltura multipozzetto, come illustrato nelle
Figure allegate, il sistema di trasmissione del moto 36, 37 deve essere più articolato
dovendo essere asservito ad una pluralità di giranti. In funzione della disposizione e
del numero delle giranti il sistema di trasmissione comprende una o più catene
cinematiche 36, ciascuna delle quali asservita ad una o più giranti 20.
In accordo ad una soluzione realizzativa preferita illustrata nella Figura 1, le catene
cinematiche sono costituite da una pluralità di ingranaggi 36 (ruote dentate).
Nel caso di una piastra di coltura a 6 pozzetti (disposte in due file da tre), una
soluzione preferita prevede due cascate di ruote dentate 36 in parallelo, ciascuna
delle quali asservita a tre giranti.
Più in dettaglio, lo schema cinematico prevede una ruota dentata motrice 35’
(associata all’albero motore 35) e due cascate di ruote dentate ciascuna della quali
composta da 3 ruote dentate principali 36 cinematicamente collegate alla rispettiva
girante 20 e 2 ruote dentate di collegamento 37. Lo schema cinematico di questa
soluzione è illustrato nella Figura 15.
La struttura e la disposizione delle catene cinematiche 36 varia in funzione del
numero e della disposizione delle giranti 20 e quindi della struttura della piastra di
coltura P.
In accordo a soluzioni realizzative alternative le catene cinematiche possono essere
realizzate anche con pluralità di pulegge e cinghie o catene.
Vantaggiosamente, gli ingranaggi vengono realizzati con materiali, aventi proprietà
tali da risultare biocompatibili e resistere - senza subire deterioramenti - a
trattamenti di sterilizzazione e alle condizioni di pH, temperatura e umidità che si

186
vengono a creare in un incubatore biologico. In particolare le ruote dentate possono
essere realizzate in materiale polimerico.
Riprendendo quanto già accennato in precedenza, il coperchio 10 del dispositivo di
miscelazione 1 è destinato ad essere amovibilmente associato ad una piastra di
coltura P allo scopo di schermarne i pozzetti W impedendo così l’ingresso di solidi
sospesi nell’aria ambiente, e al contempo permettendo l’ingresso di gas e umidità
esterni.
Preferibilmente, come si può osservare nelle Figure 4 e 5, il coperchio 10
comprende:
una porzione principale 11, destinata a sovrapporsi alla piastra di coltura P
con funzione di schermo e a supportare le catene cinematiche 36 del sistema
di trasmissione del moto; ed
una porzione secondaria 12, destinata a supportare meccanicamente ed
amovibilmente i mezzi motori 30 (nello specifico il motore elettrico 31) in
posizione scostata rispetto alla piastra di coltura P; in tal modo si riduce
l’interferenza che il motore 31 può eventualmente esercitare sulla coltura, in
particolare tramite vibrazioni, campi magnetici/elettrici e/o scambi di
calore.
Come si può osservare in particolare nella Figura 5, nella porzione principale 11
del coperchio 10 vengono realizzate sulla superficie sommitale le aperture di
innesto 13 o sedi cieche (non illustrate) per le giranti, nonché le sedi di rotazione 18
per le ruote dentate di collegamento 37 (nel caso in cui siano previste catene
cinematiche con ruote dentate).
Nella porzione secondaria 12, sempre sulla superficie sommitale del coperchio 10,
vengono invece realizzate apposite aperture 19 per il fissaggio di mezzi di supporto
90 del motore 31.

Dispositivo di miscelazione meccanica per piastre di coltura 187
Più in dettaglio, i suddetti mezzi di supporto 90 possono consistere semplicemente
in una staffa che con un primo braccio viene collegata amovibilmente al coperchio
10 e con un secondo braccio viene associata stabilmente al motore 31 o
eventualmente al contenitore ermetico 32.
Vantaggiosamente, le aperture 19 possono essere realizzate in forma di feritoie o
serie di fori allineati così da permettere una regolazione nel posizionamento del
motore 31 rispetto alle catene cinematiche 36 e alle giranti 20.
Preferibilmente, il coperchio 10 presenta una struttura scatolare aperta avente base
sostanzialmente rettangolare. Il volume interno del coperchio 10 è diviso in due
camere 16 e 17 tramite una parete divisoria interna 15, che corrispondono
rispettivamente alla porzione principale 11 e alla porzione secondaria 12.
La forma e le dimensioni del coperchio possono tuttavia variare per adattarsi alle
piastre di coltura P disponibili in commercio.
Vantaggiosamente, il coperchio 10 può essere sagomato opportunamente per
facilitarne la presa e la manipolazione.
In accordo alla soluzione realizzativa illustrata in particolare nelle Figure da 3 a 7,
il coperchio 10 è realizzato in modo da racchiudere perimetralmente al suo interno
la piastra di coltura P appoggiandosi direttamente sullo stesso piano di appoggio
della piastra.
In accordo ad una soluzione realizzativa alternativa, il coperchio 10 può essere
realizzato per andare invece in appoggio sul bordo perimetrale della piastra di
coltura P, almeno limitatamente alla porzione principale 11. Questa soluzione
richiede, però, che il coperchio abbia sostanzialmente le stesse dimensioni della
piastra di coltura.
In accordo ad una soluzione realizzativa particolare illustrata nelle Figure da 10 a
14, il dispositivo 1 comprende:

188
una base di appoggio 40 atta a supportare la piastra di coltura P e almeno la
porzione principale 11 del coperchio 10;
un corpo di protezione 50 destinato ad essere disposto almeno sopra la
porzione principale 11 del coperchio 10. Più in dettaglio vengono inoltre
previsti:
primi mezzi di tenuta 61 (ad esempio in materiale elastomerico) destinati ad
essere interposti nella zona di battuta tra la base di appoggio 40 e il
coperchio 10;
secondi mezzi di tenuta 62 destinati ad essere interposti nella zona di battuta
tra il corpo di protezione 50 e il coperchio 10;
terzi mezzi di tenuta 63 destinati ad essere inseriti nella zona di innesto
dell’albero 35 del motore 31 nel corpo di protezione 50.
Il dispositivo comprende inoltre mezzi di assiemaggio 70 suscettibili di agire in
corrispondenza del coperchio 10, della base di appoggio 40 e/o del corpo di
protezione 50 per trattenere insieme la varie parti e comprimere i mezzi di tenuta
61, 62 e 63.
Più in dettaglio, i suddetti mezzi di assiemaggio possono essere realizzati da una
pluralità di staffe 90, come illustrato nella Figura 14.
Questa forma realizzativa particolare del dispositivo 1 secondo l’invenzione è
destinata ad essere utilizzata nel caso in cui ci sia la necessità di garantire
all’interno dell’ambiente di coltura un grado di sterilità superiore rispetto a quello
ottenibile con il dispositivo 1 realizzato in accordo alla soluzione realizzativa
illustrata nelle figure da 1 a 7.
In questo caso specifico, il dispositivo 1 viene provvisto di mezzi di controllo e
regolazione dell’atmosfera gassosa (O2, umidità, CO2) interna della camera di
coltura. Tali mezzi (non illustrati nelle figure allegate) possono consistere

Dispositivo di miscelazione meccanica per piastre di coltura 189
semplicemente in una serie di condotti di ingresso e uscita comunicanti con la
camera di coltura e con apposita strumentazione di controllo. Tali condotti vengono
inseriti all’interno della camera di coltura tramite apposite aperture ricavate sul
coperchio 10 e sul corpo di protezione 50.
Il dispositivo di miscelazione 1 secondo l’invenzione – nelle sue diverse varianti –
offre una serie di vantaggi, in parte già esplicitati nel corso della descrizione.
Un primo importante vantaggio del dispositivo 1 è dato dalla sua praticità d’uso e
la sua integrabilità con comuni attrezzature presenti in un laboratorio biologico.
L’impiego del dispositivo 1 non va infatti ad influire in maniera rilevante sulla
procedura normalmente seguita per una normale coltura biologica.
Una volta preparata la coltura nella piastra P si procede ad associare alla stessa il
coperchio 10: è poi sufficiente disporre con poche e semplici operazioni il motore
31 sul coperchio e impostare l’intensità di miscelazione. L’utilizzo del dispositivo 1
non richiede pertanto particolari abilità o conoscenze tecniche.
Il fatto che il dispositivo 1 possa essere usato direttamente su piastre di coltura,
Petri o multiwell, di tipo standard permette all’utilizzatore di seguire senza alcuna
modifica i protocolli di coltura biologici specificamente studiati per tali piastre. È
noto infatti che molte colture cellulari, ad esempio colture di cellule staminali, sono
estremamente sensibili alle condizioni ambientali, potendo essere influenzate, ad
esempio, anche da semplici variazioni dei volumi e delle proprietà chimiche e
meccaniche delle superfici di coltura.
Un altro importante vantaggio dato dal dispositivo 1 secondo l’invenzione è legato
alla possibilità di utilizzo in un normale incubatore biologico. Come già
ampiamente descritto in dettaglio, ciò semplifica il controllo della temperatura, pH
e della composizione dell’atmosfera gassosa.

190
Il dispositivo 1 può quindi essere utilizzato senza richiedere servizi esterni (come
ad esempio acqua o CO2) ad esso specificamente dedicati.
Il dispositivo 1 non necessita di nessun accorgimento particolare per il
mantenimento della sterilità, essendo strutturato per limitare l’ingresso di corpi
solidi sospesi nell’aria esterna.
Il dispositivo è infine di semplice ed economica realizzazione non richiedendo
componenti sofisticati o complessi.
L’invenzione così concepita raggiunge pertanto gli scopi prefissi.
Ovviamente, essa potrà assumere, nella sua realizzazione pratica anche forme e
configurazioni diverse da quella sopra illustrata, senza che, per questo, si esca dal
presente ambito di protezione.
Inoltre tutti i particolari potranno essere sostituiti da elementi tecnicamente
equivalenti e le dimensioni, le forme ed i materiali impiegati potranno essere
qualsiasi a seconda delle necessità.
C.3 Rivendicazioni
1. Dispositivo di miscelazione meccanica per piastra di coltura, comprendente:
un coperchio (10) destinato ad essere amovibilmente associato ad una
piastra di coltura (P) per schermare il pozzetto o i pozzetti (W) di
quest’ultima limitando l’ingresso di solidi sospesi nell’aria ambiente, e al
contempo permettendo l’ingresso di gas e umidità esterni;
almeno una girante di miscelazione (20) per ciascun pozzetto (W) di detta
piastra di coltura (P), detta girante (20) essendo rotazionalmente associata a
detto coperchio (10) in corrispondenza della faccia di quest’ultimo destinata
ad essere rivolta verso detta piastra di coltura (P);

Dispositivo di miscelazione meccanica per piastre di coltura 191
mezzi motori (30) collegabili cinematicamente a detta almeno una girante
(20);
detto coperchio (10) e detta almeno una girante (20) essendo realizzati con
materiali che possono essere sottoposti a trattamenti di sterilizzazione e sono in
grado di resistere alle condizioni di umidità, temperatura e pH che si creano in un
incubatore biologico.
2. Dispositivo secondo la rivendicazione 1, in cui il collegamento cinematico tra
detta almeno una girante (20) e detti mezzi motori (30) è di tipo meccanico.
3. Dispositivo secondo la rivendicazione 1 o 2, in cui detta girante (20) è
rotazionalmente associata a detto coperchio (10) in modo tale che tra l’albero (22)
di detta girante (20) e detto coperchio (10) sia realizzata un’intercapedine (21)
avente un andamento tortuoso per limitare l’ingresso di corpi solidi sospesi.
4. Dispositivo secondo la rivendicazione 1 o 2, in cui il collegamento cinematico
tra detta almeno una girante (20) e detti mezzi motori (30) è di tipo a trascinamento
magnetico.
5. Dispositivo secondo una qualsiasi delle rivendicazioni precedenti, in cui detti
mezzi motori (30) sono associabili meccanicamente a detto coperchio (10).
6. Dispositivo secondo una qualsiasi delle rivendicazioni precedenti, in cui detti
mezzi motori (30) sono provvisti di mezzi di schermatura (32) atti a proteggere le
parti di detti mezzi motori (30) sensibili all’umidità.
7. Dispositivo secondo una o più delle rivendicazioni precedenti, in cui detti mezzi
motori (30) comprendono almeno un motore elettrico (31) cinematicamente
collegabile a detta almeno una girante (20).

192
8. Dispositivo secondo la rivendicazione 7, in cui detto motore elettrico (31) è atto
ad essere amovibilmente associato a detto coperchio (10).
9. Dispositivo secondo la rivendicazione 7 o 8, in cui detto motore elettrico (31) è
provvisto di un contenitore ermetico (32) atto a proteggerlo dall’umidità.
10. Dispositivo secondo una o più delle rivendicazioni da 4 a 6, in cui detti mezzi
motori (30) comprendono almeno un alimentatore elettrico (33) collegabile
elettricamente a detto motore elettrico.
11. Dispositivo secondo la rivendicazione precedente, in cui detto alimentatore
elettrico (33) è atto a fornire una corrente elettrica stabilizzata, dalla cui intensità
dipende la velocità di rotazione trasmessa da detto motore (31) a detta almeno una
girante (20).
12. Dispositivo secondo la rivendicazione precedente, in cui detto alimentatore
elettrico (33) è provvisto di un sistema di regolazione dell’intensità della corrente
elettrica stabilizzata.
13. Dispositivo secondo una o più delle rivendicazione da 7 a 12, in cui detti mezzi
motori (30) comprendono un sistema di trasmissione del moto (36, 37) dall’albero
motore (35) di detto motore elettrico (31) all’albero (22) di detta almeno una
girante (20).
14. Dispositivo secondo la rivendicazione precedente, in cui detto sistema di
trasmissione del moto (36, 37) comprende una o più catene cinematiche (36),
ciascuna delle quali asservita ad una o più giranti (20).

Dispositivo di miscelazione meccanica per piastre di coltura 193
15. Dispositivo secondo la rivendicazione 14, in cui dette una o più catene
cinematiche comprendono una pluralità di ingranaggi (36).
16. Dispositivo secondo la rivendicazione precedente, in cui detti ingranaggi (36)
sono cinematicamente collegati a dette giranti (20).
17. Dispositivo secondo la rivendicazione 14, in cui dette una o più catene
cinematiche comprendono una pluralità di pulegge e cinghie o catene.
18. Dispositivo secondo la rivendicazione precedente, in cui dette pulegge sono
cinematicamente collegate a dette giranti.
19. Dispositivo secondo una o più delle rivendicazioni da 14 a 18, in cui dette
catene cinematiche (36) sono supportate da detto coperchio (10).
20. Dispositivo secondo una o più delle rivendicazioni precedenti, in cui detto
coperchio (10) comprende una porzione principale (11), destinata a sovrapporsi a
detta piastra di coltura (P) con funzione di schermo, ed una porzione secondaria
(12), destinata a supportare meccanicamente ed amovibilmente detti mezzi motori
(30) in posizione scostata rispetto a detta piastra di coltura (P).
21. Dispositivo secondo una o più delle rivendicazioni precedenti, in cui detto
coperchio (10) è atto a racchiudere perimetralmente al suo interno detta piastra di
coltura (P) appoggiandosi direttamente sullo stesso piano di appoggio di detta
piastra di coltura (P).
22. Dispositivo secondo una o più delle rivendicazioni da 1 a 20, comprendente una
base di appoggio (40) atta a supportare detta piastra di coltura (P) e almeno la
porzione principale (11) di detto coperchio (10).

194
23. Dispositivo secondo una o più delle rivendicazioni precedenti, comprendente
un corpo di protezione (50) destinato ad essere disposto sopra detta almeno
porzione principale (11) di detto coperchio (10).
24. Dispositivo secondo una o più delle rivendicazioni precedenti, comprendente
primi mezzi di tenuta (61) destinati ad essere interposti nella zona di battuta tra
detta base di appoggio (40) e detto coperchio (10).
25. Dispositivo secondo una o più delle rivendicazioni precedenti, comprendente
secondi mezzi di tenuta (62) destinati ad essere interposti nella zona di battuta tra
detto corpo di protezione (50) e detto coperchio (10).
26. Dispositivo secondo una o più delle rivendicazioni precedenti, comprendente
terzi mezzi di tenuta (63) destinati ad essere inseriti nella zona di innesto
dell’albero motore (35) di detto motore (31) in detto corpo di protezione (50).
27. Dispositivo secondo una o più delle rivendicazioni precedenti, comprendente
mezzi di assiemaggio (70) suscettibili di agire su detto coperchio (10) e/o su detta
base di appoggio (40) e/o su detto corpo di protezione (50) per comprimere detti
mezzi di tenuta (61, 62, 63).
28. Dispositivo secondo una o più delle rivendicazioni da 22 a 27, comprendente
mezzi di controllo e regolazione dell’atmosfera gassosa interna alla camera di
coltura delimitata da detto coperchio (10), detta base di appoggio (40) e detto corpo
di protezione (50).
29. Dispositivo secondo una o più delle rivendicazioni procedenti, in cui detto
coperchio (10) è realizzato in policarbonato.

Dispositivo di miscelazione meccanica per piastre di coltura 195
30. Dispositivo secondo una o più delle rivendicazioni precedenti, in cui detta
almeno una girante (20) è realizzata in teflon.