UNIVERSIDAD DEL TURABO Using Existing Data to Study the...
94
UNIVERSIDAD DEL TURABO Using Existing Data to Study the Effects of the Trade Winds and Aquifer Vulnerability in Puerto Rico By Ronald T. Richards DISSERTATION Submitted to the School of Natural Science and Technology of the Universidad del Turabo in partial fulfillment of the requirements for the degree of Doctor of Philosophy In Environmental Sciences Management Option Gurabo, Puerto Rico April, 2016
Transcript of UNIVERSIDAD DEL TURABO Using Existing Data to Study the...

UNIVERSIDAD DEL TURABO
Using Existing Data to Study the Effects of the Trade Winds and Aquifer
Vulnerability in Puerto Rico
By
Ronald T. Richards
DISSERTATION
Submitted to the School of Natural Science and Technology of the Universidad del Turabo
in partial fulfillment of the requirements for the degree of Doctor of Philosophy
In Environmental Sciences
Management Option
Gurabo, Puerto Rico
April, 2016

UNIVERSIDAD DEL TURABO
CERTIFICATE OF APPROVAL OF DISSERTATION
This dissertation presented by Ronald T. Richards was revised and approved by the
members of the Dissertation Committee. The form certifying Fulfillment of Academic
Requirements for the Doctorate, signed by the members of the committee, has been
filed with the Registrar and with the Center for Doctoral Studies of the Universidad del
Turabo.
MEMBERS OF THE DISSERTATION COMMITTEE
Anastacio Emiliano-Sosa, PhD.
Professor Universidad del Turabo
Chair Dissertation Committee
Teresa Lipsett-Ruiz, PhD.
Dean, Universidad del Turabo
Member
Eddie Laboy-Nieves, PhD.
Professor Universidad del Turabo
Member
Rafael Méndez Tejeda, PhD.
Professor, University of Puerto Rico Campus of Carolina
Member
Jorge R. Ortiz-Zayas, PhD.
Professor, University of Puerto Rico, Río Piedras
Member

©Copyright, 2016
Ronald T. Richards, All Rights Reserved.

iv
Dedication
This dissertation is dedicated to my parents James E. Richards Jr. and
Sherley Richards who instilled in me a love for science.

v
Ronald T. Richards
Curriculum Vitae
Education
BS in Physics from Lewis and Clark College, Portland, Oregon, 1976.
MS in Physics from University of Puerto Rico at Río Piedras, 2003. Thesis: The
barometric efficiency of observation wells in Puerto Rico and the US Virgin
Islands.
Teaching Experience: Physics, Chemistry, Environmental Science, and English
Universidad del Este, Carolina, Puerto Rico, 2015 to 2016.
University of Puerto Rico in Humacao, 2008 to 2010 and 2015.
University of Puerto Rico at Río Piedras, 2009 to 2010.
Edic College in Caguas, 2014
Department of Education
Alejandro Tapia y Rivera Intermediate School, Trujillo Alto, 2015.
Amalia Marín High School, San Juan, 2014.
Benjamin Harrison Vocational School, Cayey, 2011 to 2012.
St. Johns School, San Juan, 1987 to 1988.
Field Experience: Hydrologic Technician
US Geological Survey Florida Caribbean Water Science Center 1988 to 2008 (retired).

vi
Table of Contents
Page
List of Tables ..............................................................................................viii
List of Figures ............................................................................................ix
List of Appendix ..........................................................................................xi
Abstract .....................................................................................................xii
Resumen (in Spanish) ................................................................................xiv
Chapter One. Overall Introduction ..........................................................1
Literature Cited ...............................................................................20
Chapter Two. The Effects of the Trade Winds on the Distribution of
Relative Humidity and the Diurnal Air Temperature Cycle
on Oceanic Tropical Islands .............................................24
Abstract .........................................................................................24
Introduction .....................................................................................24
Materials and Methods ....................................................................29
Results .........................................................................................31
Discussion ......................................................................................33
Conclusion ......................................................................................37
Acknowledgements .........................................................................37
Literature Cited ...............................................................................37
Chapter Three. Using the correlation between ground-water levels and
temperature to study aquifer vulnerability in Puerto Rico ..41
Abstract ..........................................................................................41
Introduction .....................................................................................41

vii
Materials and Methods ....................................................................51
Results ............................................................................................54
Discussion……………………………………………………………….57
Conclusion ......................................................................................64
Literature Cited ...............................................................................65
Chapter Four. Overall Conclusions ..........................................................74
Literature Cited ...............................................................................74

viii
List of Tables
page
Table 1.1 The five wettest years in the San Juan metropolitan
area, Saint Thomas, and Saint Croix ...................................3
Table 2.1 Results of assaying the hypotheses on oceanic
tropical Islands ....................................................................32

ix
List of Figures
Page
Figure 1.1. Map of average annual rainfall in Puerto Rico and
the United States Virgin Islands from 1981 to 2010 .............4
Figure 1.2. Average global daily rainfall versus latitude .........................6
Figure 1.3. The Köppen climate classification system in Puerto Rico ....8
Figure 1.4. Average monthly distribution of rainfall in Puerto Rico ........9
Figure 1.5. Stations with maximum average rainfall in May ...................11
Figure 1.6. Monthly distribution of rainfall from 1981 to 2010 at
Hacienda Constanza, Mayagüez .........................................12
Figure 1.7. Distribution of the wettest and driest months in
Puerto Rico .........................................................................13
Figure 1.8. Wet and dry years in Puerto Rico from 1953 to 2012...........14
Figure 1.9. Discharge on Río Grande de Manatí from
November 21st to 25th, 2013 ................................................15
Figure 2.1 Locations of the oceanic tropical islands used in
this study .............................................................................30
Figure 2.2 Hypothesis #1--Average relative humidity versus longitude
for Hispaniola ......................................................................33

x
Figure 2.3 Hypothesis #2--Average monthly air temperature cycle
versus longitude for Hispaniola and Puerto Rico ......... 34
Figure 2.4 Hypothesis #2--Average monthly air temperature
cycle versus longitude for four Hawaiian Islands ......... 35
Figure 3.1. Location of the observation wells used in this study
and a geologic map of the North Coast Limestone ...... 48
Figure 3.2. Hourly water level and water temperature of the
JBNERR East 1, Salinas observation well ................... 56
Figure 3.3. Hourly water levels and temperature of the Cbgar,
Quebradillas observation well ...................................... 57
Figure 3.4. Distribution of the Pearson correlation coefficients
between the depth-to-water and the water
temperature .................................................................. 58
Figure 3.5. Hourly water levels and water temperature for the
Maguayo 2, Dorado observation well ........................... 59
Figure 3.6. Hourly water levels and temperature for the
Tortuguero 3, Vega Baja observation well ................... 60
Figure 3.7. Cbgar Well on July 14th, 2006 at 0200 ......................... 63

xi
List of Appendix
Appendix 1 Data about the Observations Wells used in the
Study of Aquifer Vulnerability ...............................................79

xii
Abstract
RONALD T. RICHARDS (PhD, Environmental Science)
Using Existing Data to Study the Effects of the Trade Winds and Aquifer Vulnerability in
Puerto Rico (April, 2016)
Abstract of a doctoral dissertation at the Universidad del Turabo. Dissertation supervised by Dr. Anastacio Emiliano
No. of pages in text 74
This goal of this dissertation is to improve the science that is used to manage
water and other natural resources in Puerto Rico. The theme of the first article is that on
many oceanic tropical islands the trade winds blow from the east, as air moves to the
west it loses moisture to rain and becomes drier. Two hypotheses were proposed,
compared to the east of the island, the west is less humid and has a larger diurnal air
temperature cycle. Using data on the Internet, the two hypotheses were assayed seven
times with data from six islands in the Caribbean and the Pacific. The first hypothesis
was tested only in Hispaniola and is valid. The second hypothesis is valid on four out of
six islands. The probability that would occur by chance is six in a million trials.
For the second article, hourly data for 12 to 18 months from 33 observation wells
were used to study the correlation between depth-to-water and temperature in Puerto
Rico. Often rain is colder than ambient conditions. If the rain reaches the observation
well quickly then there will be a correlation between depth-to-water and temperature. If
the water movement is slow, then the water level will rise independently of the
temperature. The hypothesis is that the upper unit of the karst North Coast Limestone
aquifer will on average have a higher Pearson correlation coefficient between depth-to-

xiii
water and temperature than the non-karst South Coastal Plain aquifer. The hypothesis
was not significant. In the karst aquifer, the average Pearson correlation coefficient
between depth-to-water and temperature is 0.29 with a standard deviation of 0.62. In the
non-karst aquifer the average Pearson correlation coefficient is 0.01 with a standard
deviation of 0.50. The p-value is 0.25, the intra-aquifer variability is large enough that the
results are not significant. Two areas in the karst aquifer are at the highest risk from
surficial contaminants. One area is the adjoining municipalities of Quebradillas and
Camuy and the other is in the adjoining municipalities of Manatí and Vega Baja.

xiv
RONALD T. RICHARDS (PhD en Ciencias Ambientales)
El uso de datos existentes para estudiar los efectos de los vientos alisios y la
vulnerabilidad de los acuíferos en Puerto Rico
(abril/2016)
Resumen de una disertación doctoral en la Universidad del Turabo.
Disertación Supervisada por el profesor Dr Anastacio Emiliano.
Núm. de páginas en el texto 74
El propósito de esta disertación es contribuir científicamente a las estrategias de
manejo del agua y otros recursos naturales en Puerto Rico. Este trabajo ha sido
seccionada en dos artículos, el primero de ellos trata sobre el hecho de que en muchas
islas oceánicas tropicales los vientos alisios provienen del este; a medida que el aire se
desplaza al oeste pierde humedad en la lluvia, haciéndose más seco. Se han propuesto
dos hipótesis relacionadas a este hecho: Comparado con el este de las islas, el oeste
es menos húmedo y posee más largo ciclo diurno de temperatura del aire. Utilizando
datos disponibles en la internet, las dos hipótesis se ensayaron siete veces con datos
de seis islas en el caribe y el pacifico; la primera hipótesis fue ensayada sóla La
Española y resulto ser válida. La segunda hipótesis es válida en cuarto de las seis islas;
la probabilidad de que esto ocurra por coincidencia es seis en un millón pruebas.
Para el segundo artículo, datos por hora para 33 pozos de observación durante
12 a 18 meses fueron utilizados para estudiar la correlación entre el nivel de agua y
temperatura en Puerto Rico. A menudo, la lluvia es más fría que las condiciones
ambientales; si esta llega rápidamente al pozo de observación, deberá existir una
correlación entre la profundidad de agua y la temperatura. Si el movimiento del agua
hacia el pozo es lento, entonces el nivel de agua debe incrementar independiente de la

xv
temperatura. La hipótesis formulada para este fenómeno es que en la unidad superior
del acuífero en las rocas calizas del Carso en la costa norte tendrá en promedio más
alto coeficiente de correlación de Pearson entre el nivel del agua y la temperatura que el
acuífero de la zona no caliza la planicie de la costa sur. Esta hipótesis no fue
corroborada de forma significativa; en el acuífero de las rocas calizas, el coeficiente de
correlación de Pearson promedio entre el nivel de agua y temperatura es 0.29 con una
desviación estándar de 0.62. En el acuífero no calizo, el coeficiente de correlación de
Pearson promedio es 0.01 con una desviación estándar de 0.50. El valor p = 0.25, la
variabilidad intra-acuífero es suficiente grandes para que estos resultados no sean
significativos. El propósito particular de este estudio fue determinar la vulnerabilidad de
los acuíferos dependiendo si la lluvia les alcanza rápido, caso en sería más vulnerable a
contaminación desde la superficie o lentamente, caso en que sería menos vulnerable.
Dos áreas en al acuífero del Carso están a más riesgo de contaminación desde la
superficie, una es la que conecta los municipios de Quebradillas y Camuy y la otra es la
que conecta los municipios de Manatí y Vega Baja.

1
Chapter One
Overall Introduction
Water is essential for life and humans are dependent on fresh water provided by
the water cycle. The oceans are the reservoir of water on our planet and cover 71
percent its surface (NOAA 2016). Evaporation from the oceans converts the water from
liquid to gas. With evaporation the salt is left behind and saltwater is turned into fresh
water. The wind transports the water vapor over the land, the humid air is uplifted either
by convection caused by solar radiation heating the land or the orographic effect as the
wind blows over mountains. Condensation converts the water vapor back into a liquid
and clouds are formed, precipitation delivers fresh water to the land at an elevation
above sea level. The water flows back to the ocean to complete the cycle. Before
returning to the ocean the water can be used for power or to provide water for
ecosystems, humans, agriculture, or industry, the water cycle is powered by solar
radiation. From year to year, at a single point, at the top of the atmosphere, solar
radiation is almost constant but precipitation has enormous variability and is inherently
unpredictable. The inherent unpredictability of precipitation means that long term data
and statistics are needed to understand its patterns.
Precipitation includes rain, snow, hail, and other forms of atmospheric water
falling to the land surface. At high latitudes and elevations, winter precipitation can fall as
snow and remain unavailable to plants and animals, until it melts in the spring. In areas
where snowfall remains on the ground for months, rivers typically have peak discharge
in spring. Every year a tiny fraction of the snowfall is incorporated into glaciers where it
may remain in solid form for thousands of years. In the tropics, snow is rare below 3000
m above sea level and, in most areas; rain is the only significant form of precipitation.

2
Residence times of 10,000 years or more have been reported in glaciers
(Delmonte et al. 2002) and in groundwater (Remenda et al. 1994). Below 1.5 m
groundwater is too deep for either evaporation or intake by roots (Bear 2007) and is
unavailable to surficial ecosystems until it returns to the surface in springs or seeps.
Some water can become stagnant in geologic formations, although the majority of
ground water is still moving towards the ocean but at a much slower speed than surface
water. For at least 8000 years, humans have constructed wells to intercept ground water
and return it to the surface faster than it would naturally (Galili 1993). Ground water is
much more common on Earth than glaciers.
Puerto Rico is an oceanic tropical archipelago which has three inhabited islands
known as Puerto Rico, Vieques, and Culebra, the populations of which are 3,656,000;
9,300; and 1,800 respectively (USCB 2014). Vieques and Culebra previously used wells
and desalinization but are now receiving fresh water from the main island in an undersea
pipeline (Agency for Toxic Substances and Disease Registry 2001). The center of the
main island is near 18.2 °N and 66.5 °W, the highest elevation of Puerto Rico is Cerro de
Punta at 1338 m above sea level. San Juan is the capital of Puerto Rico and in the 2010
census it and nine surrounding municipios (Bayamón, Carolina, Caguas, Guaynabo, Toa
Baja, Trujillo Alto, Toa Alta, Canovanas, and Cataño) had a combined population of
1,335,340 people, which was 36 percent of the population of Puerto Rico (USCB 2014).
The most complete discussion of the climate of Puerto Rico was written seven
years ago by José A. Colón-Torres who was the director of the National Weather
Service (NWS) office in Puerto Rico for 23 years (2009). The book has a lot of
information about the history of meteorology in Puerto Rico and discusses what types of
data exist and what types are scarce. At some regional airports wind data are collected
only doing daylight hours when the airport is open for business.

3
The NWS has a vast amount of data on the Internet both about the current
conditions and the climate of Puerto Rico (NWS 2014). On January 1st, 2014, the NWS
announced that with 116 years of data, 2013 was the fourth wettest year for the San
Juan metropolitan area of Puerto Rico. The five wettest years in San Juan; Saint
Thomas; and Saint Croix are shown in table 1.1. Saint Thomas and Saint Croix are in
the United States Virgin Islands and are about 65 km east of Puerto Rico. Three of the
five wettest years in Saint Thomas also are wet years in either San Juan or Saint Croix.
There is no correlation between the five wettest years in San Juan and Saint Croix.
On the Internet, the NWS has 66 stations, in Puerto Rico, with rainfall data from
1981 to 2010. For the station Manatí 2 E, the data are inconsistent and this
Table 1.1. The five wettest years in the San Juan metropolitan area, Saint Thomas, and
Saint Croixa. ________________________________________________________________
San Juan Saint Thomas Saint Croix
Data since 1898 1956 1951
Rank
________________________________________________________________
1 2010b 2010 1979
2 2011 1960 2003
3 1931 2005 1952
4 2013 2013 ` 1996
5 1950 2003 1974
________________________________________________________________
a Data from the NWS (2014).
b Years that correlate with other stations are highlighted in grey.

4
station is excluded from this analysis. The average annual rainfall for the 65 remaining
stations is 1768 mm. The rainiest part of Puerto Rico is El Yunque Mountain in the
northeast corner of the island. The station with the highest rain, Pico del Este, Naguabo
has an average rainfall of 4381 mm, this is an outlier as the second rainiest station Río
Blanco Lower, Naguabo has 2721 mm of rain. There are no stations with rainfall
between 3000 and 4000 mm. The driest station is Ponce City with 737 mm and is along
the south coast. There are five stations with average annual rainfall of less than 1000
mm and they are located on the south-central coast between Guánica and Santa Isabel.
Figure 1.1 is a map of the 1981 to 2010 average annual rainfall in Puerto Rico.
Figure 1.1. Map of average annual rainfall in Puerto Rico and the United States Virgin
Islands from 1981 to 2010. One inch is 25.4 mm. Map provided by NWS (2014).

5
In many parts of the world the windward side of a mountain has more precipitation than
the leeward side. This effect is called a rain shadow. The rain shadow of El Yunque
extends from Gurabo to Ponce.
The National Aeronautics and Space Administration (NASA) has produced a
graph of the global average daily rainfall for each month versus latitude (NASA
2014). The modified graph is shown in figure 1.2. Puerto Rico averages 4.8 mm of rain
per day, which is above average for its latitude. Around 18 degrees north there is a
sharp gradient which means that a small lateral shift in the rainfall peak could
dramatically change the amount of rainfall at this latitude.
There are less than one hundred climate stations for Puerto Rico. Daly et al.
(2003) developed a climate model for Puerto Rico with a gridded output where each
block is 15 seconds or about 450 m on a side. They used a digital elevation model, an
airflow model, data on prevailing winds, distance to the coastline, and expert knowledge
to build the model. In their data set the most common wind was from the east with
northeast being second. The climate stations were used to calibrate the model. The
outputs were minimum and maximum temperatures and mean monthly and annual
precipitation. The model demonstrated that many mountains in Puerto Rico have rain
shadows. At 3098 m above sea level the highest mountain in the Caribbean is Pico
Duarte in Hispaniola and it creates a rain shadow that affects the climate of the
downwind islands of Jamaica and Cuba (Jury 2009).
Malmgren and Winter (1999) used data from 18 stations in Puerto Rico to look
for evidence of climate zonation. Rather than start with preconceived climate zones they
used a computer to analyze the data for clusters that were derived from the data. They
found four zones. The first was extreme coastal where many of the stations were 3m

6
Figure 1.2. Average global daily rainfall versus latitude. The red star
shows the position of Puerto Rico on the graph. Modified from NASA
(2014).
above sea level and this zone covered the northern, eastern, and southern coasts. Two
more zones were inland in the east but touched the coast on the northwest. The last
zone was interior and the west coast. The highest elevation station was around 400 m
and a large section of the southwestern interior had no data.
The Köppen climate classification system is the most commonly used in the
world (Peel et al. 2007) and was developed by Wladimir Köppen in the early part of the
20th century. In this system tropical rainforest is defined as areas where the monthly
average temperature is always at or above 18 °C and the monthly average rainfall is at
or above 60 mm. In Puerto Rico, there are 32 NWS stations that have data for both the

7
temperature and rain criteria. Of these 32 stations, there are 14 stations that fail the rain
criteria. The only stations that fail the temperature criteria are the high elevations
stations of Cerro Maravilla and Pico del Este. There are 33 stations that have rainfall
data but do not have temperature data. Because all of these stations are at low elevation
they were classified only on the basis of rainfall data. The results are shown in figure 1.3.
Of the 65 stations, the Köppen climate classification system classifies 34 as tropical
rainforest, which are more common in the northeast than in the southwest. Much of
northern and eastern Puerto Rico has the climate of a rainforest but has been
deforested. Malhi and Wright (2004) used the Food and Agriculture Organization
definition of a tropical rain forest which is less restrictive. This definition allows up to
three months where the average rainfall in millimeters is less than twice the average
temperature in Celsius, which in the case of Puerto Rico would mean rainfall less than
about 50 mm. With the less restrictive definition of tropical rainforest the number of
stations that are not rainforest drops from 31 to 8. All of the non-rainforest stations are
on the south coast. Helmer et al. (2002) used nine categories to map the island with
similar results. The dryer categories are the southwest and the wetter in the northeast.
The average monthly distribution of rain in Puerto Rico is shown in figure 1.4.
Between January and March the average monthly rainfall is 80 mm. This rises to 200
mm in May and then falls 33 percent to 134 mm in June. The peak for the year is
September at 225 mm and then it falls for the rest of the year. Jones and Banner (2003)
demonstrated that aquifer recharge occurs when monthly rainfall exceeds 200 mm. May,
September, and October average more than 200 mm of rain. Less aquifer recharge
occurs in May because the preceding months are dry and more of the rain goes to
replenish soil moisture. A study of how global climate change will affect Puerto Rico has

8
Figure 1.3. The Köppen climate classification system in Puerto Rico. This
map is based on NWS data (2014). The filled circles are tropical rain forest
and the rings are other classifications. Base map provided by USGS (2014).
raised the possibility that the wet season will become wetter and the dry season dryer.
Aquifers are recharged during extreme events, and thus increased rainfall in the wet
season will increase aquifer recharge (Harmsen et al. 2009).
Many stations have a pattern similar to the average but there are some
variations. The largest number of stations, 26, have a peak rainfall in September and 17
peak in October. There are however 11 stations that peak in May, ten of which are in the

9
Figure 1.4. Average monthly distribution of rainfall in Puerto Rico, n = 65. Data modified
from NWS (2014).
north-central part of the island. The stations that peak in May are shown in figure 1.5.
A different pattern is found in Mayagüez. The average monthly distribution of
Hacienda Constanza, Mayagüez is shown figure 1.6. The May peak is insignificant with
only a 2 percent drop between May and June. The driest month at Constanza is
December. Of all 65 stations, Hacienda Constanza has the least significant May peak
but other nearby stations have similar patterns.
The distribution of driest and wettest months is shown in figure 1.7. One station
has its driest month in June and the other 62 are between December and March. Fifty
two of the stations have their wettest month between July and November, eleven peak in
0
50
100
150
200
250
1 2 3 4 5 6 7 8 9 10 11 12
AV
ERA
GE
MO
NTH
LY R
AIN
FALL
, IN
MM
MONTH OF THE YEAR
AVERAGE MONTHLY RAINFALL IN PUERTO RICO

10
May and there are no overlaps. There are no months which have both driest and wettest
stations. The shape of the graph is similar to figure 1.4 which shows the average
monthly rainfall.
Figure 1.8 shows the pattern of dry and wet years in Puerto Rico between 1953
and 2012. The positive numbers are the number of stations that had record high rainfall
in the year in question. The negative numbers are the number of stations that had record
low rainfall in the year of question. The wettest year for San Juan and Saint Thomas was
2010. Using this island-wide metric, 2010 is in a three-way tie for fourth wettest year. Six
stations had record-high rainfall in1979, 2003, and 2010. The wettest year in Saint Croix
was 1979 which was also the wettest year for six stations in Puerto Rico: Yabucoa, San
Lorenzo, Fajardo, Canovanas, Río Piedras Experimental Station, and Toa Baja, all of
which are in the eastern part of the island. In this metric, the wettest year in Puerto Rico
was 1970 when nine stations had record high rainfall. Two periods of water rationing
occurred in 1994 and 1996. Between 1953 and 2012, the year in Puerto Rico with the
most dry-records was 1967 when 15 stations broke records for the least rainfall. Another
dry period was 1991 to 1997. Over a period of 7 years, 15 stations had record low
rainfall. The 1967 drought was a single year event whereas the drought over the 1990s
was seven years when stations were breaking new records for low rainfall. Water
rationing was more common in the drought of the 1990s than in 1967 which indicates
that the water-supply system had less reserves in 1994 than 1967 (Larsen 2000). The
second driest year was 1976 when 10 stations had record low rainfall. During water
rationing in 1994 and 1996, many homes had water for 12 hours and then were 36 hours
without water (Larsen 2000).
The natural hydrology of Puerto Rico has very little surface-water storage. After a
heavy rainfall, most of the rainwater is back in the ocean in less than 24 hours. The

11
Figure 1.5. Stations with maximum average rainfall in May. Filled circles are
stations with maximum rainfall in May. Rings have maximum rainfall in other
months. Ten of the 11 with maximum rainfall in May are on the north central part
of the island. Data from NWS (2014) and the base map is from the USGS (2014).
largest undammed river in Puerto Rico is the Río Grande de Manatí. The United States
Geological Survey (USGS) discharge data for two stations for five days beginning
November 21st, 2013 are shown in figure 1.9 (USGS 2014). The upstream station is Río
Grande de Manatí near Morovis (50031200) and the downstream station is Río Grande

12
Figure 1.6. Monthly distribution of rainfall from 1981 to 2010 at Hacienda Constanza,
Mayagüez. At this station the driest month is December and the May rainfall is only 2
percent more than June. Compare with figure 1.4 which is the average of all stations.
Data from NWS (2014).
de Manatí at Hwy 2 near Manatí (50038100). The direct distance is 21 km. On the first,
second, and third days the percentage of the total discharge above base flow that
passed by the lower station was 76, 20, and 4 percent respectively. Most of the
discharge pattern is natural but at Morovis on November 24th, 2013 there is a small peak
followed by an immediate valley. This pattern probably represents a tank being emptied
and then refilled.
0
50
100
150
200
250
300
1 2 3 4 5 6 7 8 9 10 11 12
AV
ERA
GE
MO
NTH
LY R
AIN
FALL
, IN
MM
MONTH OF THE YEAR
HACIENDA CONSTANZA, MAYAGUEZ

13
Figure 1.7. Distribution of the wettest and driest months in Puerto Rico. Data from NWS
(2014).
Combined Lago Carraizo and Lago La Plata provide 40 percent of the water
used in Puerto Rico. Lago Carraizo has a supply of only 50 days (Ortiz-Zayas et al.
2006). In Puerto Rico, and on other islands, one of the biggest problems in water
resources is lack of storage (Hophmayer-Tokich and Kadiman 2006).
-40
-30
-20
-10
0
10
20
30
1 2 3 4 5 6 7 8 9 10 11 12
NU
MB
ER O
F EX
TREM
E V
ALU
ES
MONTH OF THE YEAR
RAINFALL EXTREME MONTHS IN PUERTO RICO
Negative values are the number of statiionsthat are the driest. Positive values are the
number of stations that are the wettest.n = 63.

14
Figure 1.8. Wet and dry years in Puerto Rico from 1953 to 2012. A positive
(negative) number is the number of stations that hit record high (low) rainfall in that
year. The six driest years of the 20th century in Puerto Rico fall between 1964 and
1997 (Larsen 2000). The number is parenthesis is the rank. The red arrows
indicate periods of water rationing. Data modified from NWS.
Reservoirs in Puerto Rico store water on the time scale of months. Aquifers are
natural systems that, when there is heavy rain, capture a tiny fraction of the runoff and
store it, in some cases, for years. The natural discharge of aquifers are springs and
seeps where the water discharges at a different location, at lower elevation, at a later
time, and with higher dissolved solids then when it fell as rain. As an oceanic island both
-15
-10
-5
0
5
10
1945 1955 1965 1975 1985 1995 2005 2015
NU
MB
ER
YEAR
WET AND DRY YEARS IN PUERTO RICO, 1953-2012
1967 (1)
1976 (5)
1994 (3)
1997 (2)1991 (6)1973
1960
19701979
19812003 2010
1964 (4)

15
Figure 1.9. Discharge on Río Grande de Manatí from November 21st to 25th, 2013.
The small rise and fall of discharge at Morovis on November 24th, 2013 probably
represents a tank above the station that was emptied and then refilled. Data from
USGS (2014).
the rivers and the aquifers of Puerto Rico have shorter residence times for water than
continental areas.
Is rainfall in Puerto Rico increasing or decreasing? If long-term rainfall is
decreasing then it makes it more likely that the Island will need to build a desalination
plant. It is useful to look at the Carlsbad Desalination Plant that is currently under
0
10
20
30
40
50
60
70
80
21 22 23 24 25 26
DIS
CH
AR
GE,
IN C
UB
IC M
ETER
S P
ER S
ECO
ND
NOVEMBER 2013
RÍO GRANDE DE MANATÍ
The red line is Río Grande de Manatí near Morovis (50031200) and the black line isRío Grande de Manatí at Hwy 2 nearManatí (50038100). The peak at highway#2 is 8 hours after Morovis. The directdistance between the stations is 21 km.
Data from USGS.

16
construction in San Diego, California, USA. When completed in 2016 it will be the largest
such plant in the Americas.
The San Diego County Water Authority provides water to 3.2 million people. The
authority has signed a contract to buy water from the privately owned Carlsbad
Desalination Plant. The plant will provide 7 percent of the water for the county and over
the life of the thirty-year contract the cost will be 3 billion dollars. The water is twice as
expensive as the currently used surface water, which is from northern California or the
Colorado River. With expected price increases, the desalination water will be less
expensive than surface water by 2024. The plant will produce 48,000 acre-feet of water
(one acre-foot is 1233 cubic meters) per year. Each acre-foot of water requires 5000
kilowatt-hours of electricity (1 kWh is 3.6 MJ) (Barringer 2013). On an island that
produces 98 percent of its electricity by burning fossil fuels (PREPA 2013), desalination
would increase air pollution and the emission of climate-changing gasses.
In Puerto Rico, the six driest years of the 20th century were between 1964 and
1997 (Larsen 2000). If there was no long-term trend in rainfall, then the probability that
the six driest years of a century would be in the last half is the same as flipping a coin
and having it land on heads six times in a row which is 1:26 or 0.016. In Puerto Rico, in
the 20th century the drying trend is significant. Tropical rainfall has declined in the last
third of the 20th century (Diaz 1996). Several climate change models predict that rainfall
in the Caribbean in June, July, and August will decrease by the end of the 21st century
(Neelin et al. 2006). Climate change models need to be used with care because the
mountains of the Caribbean create sharp gradients in climate on a scale that are poorly
represented in climate change models (Jury 2009).
The Caribbean was getting dryer and this was supported by both theory and
empirical data. This was the state of scientific knowledge in the first few years of the 21st

17
century. The rains in the first 14 years of the 21st century have broken records. In Puerto
Rico, 14 stations have set rainfall records between 2003 and 2012. In the San Juan
metropolitan area, with 116 years of data, three of the four wettest years are 2010, 2011,
and 2013. The NWS has 59 rainfall stations, which have data for the wettest and driest
years. If the driest year is subtracted from the wettest year the result will be either
positive or negative. Zero is impossible because the same year cannot be both the
wettest and the driest. Of the 59 stations, 39 are positive. If the average annual rainfall
was stationery, then there should be equal positive and negative results. The binominal
distribution can be used to calculate the probability of this occurring by random chance,
and the result is 0.0092. Between 1953 and 2013 the increase in rainfall is significant.
Is the rainfall in Puerto Rico increasing or decreasing? Depending on the data
sets and the endpoints both can be shown to be significant. The data are not consistent
with a linear increase or decrease in rainfall. The data are consistent with rainfall that
rises and falls on the scale of decades for reasons that cannot be explained. There are
large uncertainties in any prediction about the future of rainfall in Puerto Rico. This view
is not held by all scientists writing on the subject, Torres-Valcarcel (2014) states that the
Caribbean has seen a century of declining rainfall.
There are multiple definitions of the tropics. One is based on astronomy and this
is the definition that will be used in this dissertation. The tropics are the regions of the
Earth between the Tropics of Cancer and Capricorn. The axis of the daily rotation of the
Earth is tilted 23.4 degrees from the plane of its yearly revolution around the Sun. Every
year on the summer solstice, about June 22nd, the Sun is 23.4 degrees north of the
equator and at local noon at 23.4 degrees north latitude, the Sun is directly overhead.
On the winter solstice, about December 22nd, the sun is overhead at 23.4 degrees south.
This is how the Tropics of Cancer and Capricorn are defined. The tropics cover 40

18
percent of the Earth and have almost half the world’s population (Wong and Chen 2009).
This tilt is what causes the seasons of the Earth. The climate of the tropics is
characterized by consistency. Compared to the temperate parts of the world, the tropics
show less variation in length of day, temperature, wind velocity, and relative humidity.
Oceanic tropical islands are surrounded by oceans which further moderates extremes in
temperature.
This dissertation was born in Puerto Rico with the intention that the science can
be used locally. At the same time the science in this dissertation is important not
because Puerto Rico is unique but because what is learned here can be applied in other
parts of the world. On many oceanic tropical islands environmental data are from sparse
to non-existent. Puerto Rico is one of the most data-rich places on Earth. The political
ties to the United States have given the island the wealth and the mandate to collect and
archive environmental data.
Temperature data are underutilized in environmental sciences. Many physical,
biological, and chemical processes create thermal signatures. Because water is slow to
reach thermal equilibrium with its environment, water often has a thermal memory of
where it has been. Ground water that descends deep into the Earth and then rises
quickly without mixing, will have geothermal heat and will be warmer than other nearby
ground or surface water. There are large existing temperature data bases. The
instruments used to collect temperature data are the least expensive environmental
sensors.
The warmest thermal spring of four in Puerto Rico is the Baños de Coamo in
Coamo, in the south central part of the island. The USGS has measured the temperature
of the Baños de Coamo (USGS ID# 180219066222500) 13 times between 1960 and
2005. The average temperature is 42 °C, with a standard deviation of 2.3 °C (USGS

19
2014). The site has engineered pools and the variation in temperature may be a result
not of geology but of different measuring points. After years, when the public could use a
rustic pool at no charge, the site has been remodeled and is operating as a spa with an
admission fee.
What is the probability that there is an undetected spring in Puerto Rico with
water hotter than the Baños de Coamo? Hot springs have been recognized as important
natural resources for thousands of years. In the past, people went to rivers to take water,
bathe, bathe animals, look for food, and wash clothes. Rivers were often the easiest
path between different points. Prior to the 21st century there was far more local
knowledge about rivers than there is today. The probability of undetected hot springs in
Puerto Rico is very low.
The core of this dissertation is contained in two chapters that have been written
as independent journal articles to be submitted for publication. Each article takes a
relatively simple temperature-related idea and explores its implications for understanding
the environment and the management of water and other natural resources. On oceanic
tropical islands all over the world, the trade winds blow consistently from the east. The
consistency of the wind causes the eastern part of the island to be humid and the west
to be dry. The western part of the island is in the rain shadow of the eastern end. Dryer
air is more transmissive of infrared radiation. The hypotheses supposed in the study are
that compared to the eastern part of the island the west will have lower relative humidity
and a larger diurnal air temperature cycle. The Earth has an estimated 45,000 tropical
islands larger than 5 hectare (0.05 km2) (Arnberger and Arnberger 2001), but only 6
have enough data on the Internet to verify the hypotheses.
The second study examines the correlation between groundwater level and
temperature in Puerto Rico. The hourly data from 33 observation wells were collected by

20
the author when he was an employee of the USGS and these data have never been
published. Large amounts of groundwater temperature data are the unintended, free
byproduct of the switch from measuring groundwater levels with floats and
counterweights to pressure transducers. Rain is colder than ambient conditions and the
idea is that the correlation between groundwater level and temperature is a proxy for
travel time from rain drops to aquifer recharge. If the rain water reaches the aquifer in a
few hours there will be a high correlation between depth-to-water and temperature, both
will decrease after a rain event. If the rain water takes months to reach the aquifer then it
will have warmed to ambient conditions, the water level will rise and the temperature will
be constant. The correlation between groundwater levels and temperature can be used
to produce a map identifying areas in Puerto Rico at high risk from the movement of
contaminants from the surface to the aquifer. In a study in Canada, the most common
hazardous material transported was gasoline (Verter and Kara 2001). In the advent that
a truck carrying hazardous material has an accident in a rain storm the map will identify
areas where the contaminant will reach the potable water system the fastest.
Literature Cited in Chapter One
Agency for Toxic Substances and Disease Registry. 2001. Vieques, Puerto Rico—Fact
Sheet—Public Health Assessment Ground and Drinking Water [Internet].
Available from
http://www.atsdr.cdc.gov/sites/vieques/ground_drinking_water_factsheet.html.
(Cited on 14 April 2014).
Arnberger H, Arnberger E. 2001. The tropical islands of the Indian and Pacific Oceans.
Austrian Academy of Sciences Press. Vienna, Austria. ISBN3-7001-2783-3.
Barringer F. 2013. In California, what price water. New York Times Business Day Energy
and Environment February 28th [Internet]. Available from http://www.nytimes.com

21
http://nytime.com/2013/03/01/business/energy-environment/a-costly-california-
desalination-plant-bets-on-future-affordability.html?pagewanted=1&_r-0 (Cited on
1 March 2014).
Bear J. 2007. Hydraulics of Groundwater. Dover Publications, Mineola NY.
Colón-Torres JA. 2009. Climatología de Puerto Rico. La Editorial Universidad de Puerto
Rico. San Juan, PR.
Daly C, Helmer EH, Quiñones M. 2003. Mapping the climate of Puerto Rico, Vieques
and Culebra. International Journal of Climatology. 23:1359-1381.
Delmonte B, Petit JR, Maggi V. 2002. Glacial to Holocene implications of the new
27000-year dust record from the EPICA Dome C (East Antarctica) ice core.
Climate Dynamics 18: 647-660. Doi:10.1007/s00382-001-0193-9.
Diaz HF. 1996. Precipitation monitoring for climate change detection. Meteorology and
Atmospheric Physics 60:179-190.
Galili E. 1993. The submerged pre-pottery Neolithic water well at Atlit Yam, northern
Israel, and its palaeoenvironmental implications. The Holocene 3:265-270.
Harmsen EW, Miller NL, Schlegel NJ, González JE. 2009. Seasonal climate change
impacts on evapotranspiration, precipitation deficit and crop yield in Puerto Rico.
Agricultural Water Management 96:1085-1095.
Helmer EH, Ramos O, López TM, Quiñones M, Díaz W. 2002. Mapping the forest types
and land cover of Puerto Rico, a component of the Caribbean Biodiversity
Hotspot. Caribbean Journal of Science. 38(3-4):165-183.
Hophmayer-Tokich S, Kadiman T. 2006. Water management on islands—Common
issues and possible actions. CTSM Studies and Reports number 27 ISSN 1381-
6357. P 1-30. [Internet] Available on

22
http://www.utwente.nl/mb/cstm/reports_downloads/watermanagement_on_island
s.pdf (Cited on 8 April 2014).
Jones IC, Banner JL. 2003. Estimating recharge thresholds in tropical karst island
aquifers: Barbados, Puerto Rico and Guam. Journal of Hydrology. 278:131-143.
Jury MR. 2009. An intercomparison of observational, reanalysis, satellite, and coupled
model data on mean rainfall in the Caribbean. Journal of Hydrometeorology.
19:413-430.
Larsen MC. 2000. Analysis of 20th century rainfall and streamflow to characterize
drought and water resources in Puerto Rico. Physical Geography. 21(6):494-521.
Malhi Y, Wright J. 2004. Spatial patterns and recent trends in the climate of tropical
rainforest regions. Philosophical Transactions of the Royal Society. 359:311-329.
Doi:10.1098/rstb.2003.1433.
Malmgren BA, Winter A. 1999. Climate zonation in Puerto Rico based on principal
component analysis and on artificial neural networks. Journal of Climate. 12:977-
985.
National Aeronautics and Space Administration (NASA). 2014. Zonal Global
Precipitation. [Internet] Available on
http://gmao.gsfc.nasa.gov/research/merra/sci_archive/GPCP_zonal_all.gif (Cited
on 20 January 2014).
National Oceanic and Atmospheric Administration (NOAA). 2016. Ocean Facts.
[Internet] Available on http://oceanservice.noaa.gov/facts (Cited on 11 January
2016).
National Weather Service (NWS). 2014. National Weather Service Weather Forecast
Office, San Juan, PR [Internet] Available on http://www.srh.noaa.gov/sju/ (Cited
on 20 January 2014).

23
Neelin JD, Mūnnich M, Su H, Meyerson JE, Holloway CE. 2006. Tropical drying trends in
global warming models and observations. Proceedings of the National Academy
of Sciences. 103(16):6110-6115.
Ortiz-Zayas JR, Cuevas E, Mayol-Bracero O, Donoso L, Trebbs I, Figueroa-Nieves D,
McDowell WH. 2006. Urban influences on the nitrogen cycle in Puerto Rico.
Biogeochemistry. 79:109-133. Doi:10.1007/s10533-006-9005y.
Peel MC, Finlayson BL, McMahon TA. 2007. Updated world map of the Köppen-Geiger
climate classification system. Hydrology and Earth System Science. 11:1633-
1644.
Puerto Rico Electric Power Authority (PREPA). 2013. [Internet] Available on
http://www.aeepr.com/ (Cited on 20 August 2013).
Remenda VH, Cherry JA, Edwards TWD. 1994. Isotopic composition of old groundwater
from Lake Agassiz: Implications for late Pleistocene climate. Science. 266: 1975-
1978.
Torres-Valcarcel A, Harbor J, González-Avilés C, Torres-Valcarcel A. 2014. Impacts of
urban development on precipitation in the tropical maritime climate of Puerto
Rico. Climate. 2:47-77. Doi:10.3390/cli2020047.
United States Census Bureau (USCB). 2014. [Internet] Available on www.census.gov
(cited 18 January 2014).
United States Geological Survey (USGS). 2014. Water resources of the Caribbean.
[Internet] Available on http://pr.water.usgs.gov (Cited 18 January 2014).
Verter V, Kara BY. 2001. A GIS-based framework for hazardous materials transport risk
assessment. Risk Analysis 21(6):1109-1120.
Wong NH, Chen Y. 2009. Tropical urban heat islands: Climate, buildings, and greenery.
Taylor and Francis, New York.

24
Chapter Two
The Effects of the Trade Winds on the Distribution of Relative Humidity and the
Diurnal Air Temperature Cycle on Oceanic Tropical Islands1
Abstract
On many oceanic tropical islands the trade winds blow from the east and as the
air passes over the island it loses moisture to rain. The two hypotheses for this study are
that the western part of the island is less humid and has a larger diurnal air temperature
cycle. Using data available on the Internet, the two hypotheses were assayed 7 times on
6 different islands in the Pacific and Caribbean. The islands used in this study are Puerto
Rico, Hispaniola, the Big Island of Hawaii, Maui, Oahu, and Kauai. The first hypothesis
was tested only on Hispaniola and is true. The second hypothesis was tested on all the
islands and is true on all the islands except on the Big Island of Hawaii and Maui. Using
a p-value of 0.05, these hypotheses are as predicted five of the seven times, which has
a p-value of 6 x 10⁻⁶. These findings should apply to thousands oceanic tropical islands
where data are sparse.
Keywords: rain shadow, oceanic, tropical, islands, trade winds
Introduction
The Earth has an estimated 45,000 tropical islands larger than 0.05 km2 (5
hectares) (Arnberger and Arnberger 2001). The populations of these islands range from
1 This chapter was published as: Richards RT, Emiliano A, Méndez-Tejeda R. 2015. The effects of the trade winds on the distribution of relative humidity and the diurnal air temperature cycle on oceanic tropical islands. Journal of Climatology and Weather Forecasting. 3:137. Doi:10.4172/2332-2594.1000137.

25
zero to 143 million on the Indonesian island of Java. Oceanic tropical islands often have
environmental problems that include high population densities, water scarcity, and
extinctions (Olson and James 1984). Data are often sparse (Arnberger and Arnberger
2001) but because inputs and processes are similar, many oceanic tropical islands have
commonalities including climate and in general vegetation. This study will look for
patterns on data-rich islands. Nothing in this study will prove that these patterns apply to
data-sparse islands but it will generate hypotheses that can help guide future research
on other oceanic tropical islands.
This study has two parts. First a simple theoretical approach, that examines how
on many oceanic tropical islands, the easterly trade winds shape the distribution of the
two variables of this study. And second, searching for available data to test the
hypotheses generated from the theoretical approach. This is a pilot study. The vast
majority of oceanic tropical islands do not have any available data to verify these
hypotheses.
Over open water, upwind of an oceanic tropical island the relative humidity is
typically around 80 percent (Emanuel 1984). The average value of relative humidity is an
equilibrium between evaporation which, on a daily basis, is almost constant and frequent
but light rain storms that remove moisture out of the air. As a parcel of air moves over
land it is disconnected from its source of moisture and from upwind to downwind it loses
moisture to rainfall and becomes drier. When the winds are consistent, the interaction
between the wind and the land creates a region with a reduced water vapor
concentration in the atmosphere. The western part of the island is in the rain shadow of
eastern end of the island. This structure in the atmosphere is a permanent feature even
as the air in it is being constantly replaced. The exact patterns of climate will be affected
by many factors including topography, the shape of the coastline, distance from the
coast, and anthropogenic factors such as urban heat islands. The existence of this area

26
of reduced water vapor content can be predicted solely on the basis of longitude and is
independent of the specifics of the other factors. The distance from the eastern tip of the
island can be measured either in degrees of longitude or kilometers and it would not
change the results. The rates of rainfall and runoff are typically much higher in the humid
tropics than in temperate regions (Bonell et al. 2005) and the higher rainfall will increase
the contrast between upwind and downwind areas.
There are at least three methods to study the interaction between the prevailing
trade winds and the land mass. Large numbers of temporary instruments can be
deployed to provide a large amount of data over the span of a few weeks. Such an
experiment is described for the Big Island of Hawaii by Chen and Nash (1994). A second
approach is to use digital elevation models, complex mathematical algorithms, and
expert knowledge to generate detailed maps of climate variables and this is the
approach used in the Parameter-elevations Regression on Independent Slope Model
(PRISM) (Daly et al. 2002). The application of PRISM to the island of Puerto Rico is in
Daly et al. (2003). A third approach is used in this study. This study looks at data-rich
islands and uses simplified mathematical relationships to look for generalized patterns
that probably exist on thousands of oceanic tropical islands where data are sparse. The
simplified relationship will require less data than more complex patterns.
On many oceanic tropical islands the trade winds consistently blow from the east.
This has been documented for Hawaii (Chen and Nash 1994), Hispaniola (Izzo et al.
2010) and Puerto Rico (Carter and Elsner 1996). The eastern two-thirds of Hispaniola is
the Dominican Republic while the western one-third is Haiti. In Puerto Rico, the wind
blows between northeast and southeast at least 65 percent of the time (Colón-Torres
2009). A detailed study of the trade winds in Hawaii is in Giambelluca and Nullet (1991).
Data-rich islands have studies but there are few studies that compare the environments
of widely separated islands.

27
The structure of the atmosphere in the Caribbean is important locally for the
islands and is connected to continental scale patterns. The North Atlantic Oscillation
(NAO) is derived from the difference in barometric pressure between Iceland and
Portugal. High levels of the NAO index are associated with high precipitation in northern
Europe and low precipitation in southern Europe and Puerto Rico (Malmgren et al.
1998). In late summer in the northern Antilles rainfall is associated with a negative NAO
index combined with warm conditions in the El Niño Southern Oscillation in the eastern
Pacific Ocean (Gouirand et al. 2012). The Caribbean Low Level Jet (CLLJ) transports
moisture to Central America and the eastern part of North America. Variability in the
CLLJ is associated with variability of precipitation in the downwind areas (Wang 2007).
Several studies have analyzed the inter-annual variability of Caribbean rainfall (Enfield
and Alfaro 1999, Giannini et al. 2000, Giannini et al. 2001, and Taylor et al. 2002). The
mean, annual, and monthly rainfall in Haiti is a complex function of fixed factors including
the topography and shape of the country, as well as the annual cycle of regional-scale
oceanic and atmospheric factors. The atmosphere in the northern Antilles is dominated
by the permanent Azores high, which induces permanent easterlies across the
Caribbean islands (Moron et al. 2014).
The variables in this study are affected by multiple factors such as elevation,
distance from coast, the shape of mountain ranges, and anthropogenic factors such as
urban heat islands. The central question of this study is if longitude is needed to be
added to the list to explain the observed data. The basic idea is that the consistency of
the trade winds creates a rain shadow in the western parts of oceanic tropical islands.
Mountains in Puerto Rico create a rain shadow (Daly et al. 2003). At 3098 m, Pico
Duarte is the highest mountain in Hispaniola and the Caribbean. The rain shadow of this
mountain affects the climate of Jamaica and eastern Cuba (Jury 2009). Data are
extremely limited for most oceanic tropical islands and this study will use simple patterns

28
with limited data requirements to see if the results are useful and can then be extended
to other islands.
The trade winds blow from the east and the air loses water to rain as it passes
over the land. This concept generated two hypotheses. The second hypothesis derives
from the first. In numerical form, the hypotheses will be stated for the western
hemisphere; in the eastern hemisphere the correlations are reversed. Each hypothesis
will be stated as a correlation with longitude. Longitude has an arbitrary datum in
Greenwich, United Kingdom but it would not affect the correlations of this study if the
datum were the eastern tip of the island or any other location. The hypotheses, for
oceanic tropical islands, are:
First: the western part of the island is in the rain shadow of the east and there will
be an inverse correlation between longitude and relative humidity.
Second: the diurnal air temperature cycle is the average difference between the
daily highs and the lows at night and will be correlated with longitude. Dry air is more
transmissive of infrared radiation (Pierrehumbert 2011), and with the same amount of
solar radiation, the days will be hotter and the nights will be colder, as occurs in deserts
(McGregor and Nieuwolt 1998). There is a published map of the diurnal air temperature
cycle in Puerto Rico (Colón-Torres 2009). The correlation with longitude is visible on the
map but the interpretation is based on distance from the coast.
The vast majority of the oceanic tropical islands on Earth have no data to assay
these hypotheses. There are other islands that have data but they are not readily
available. This study uses data collected by government meteorological agencies and
made available on the Internet. At least one hypothesis was tested on 6 islands. The two
Caribbean islands in this study are Hispaniola and Puerto Rico. All data from Hispaniola
are from the Dominican Republic as no data are available for the Haitian side of the

29
island. The Hawaiian Islands used in this study are the Big Island of Hawaii, Maui, Oahu,
and Kauai. Puerto Rico and Hawaii are part of the United States.
The six islands in this study are not representative of the 45,000 tropical islands
on Earth. All are in the northern hemisphere and all are in the western hemisphere. All
are near the Tropic of Cancer and none are in the deep tropics. None of the islands are
in the Indian Ocean. The largest concentration of tropical islands on Earth is between
Asia and Australia and none of the islands in this study are in this part of the world.
These are the islands for which data are available on the Internet and if the hypotheses
work on these islands it can guide the work of future researchers on other islands. The
islands of this study are well separated from continental landmasses. Future work will be
needed to understand the relationship between distance and the effect of continents on
the climate of tropical islands. The large masses of ocean water around the islands of
this study buffers the climate and reduces the annual air temperature cycle.
The location of the islands are in figure 2.1. The data were collected by the
National Weather Service (NWS), except in the Dominican Republic where they were
collected by the Oficina Nacional de Meteorología (ONAMET). NWS data are at the
Southeast Regional Climate Center (SERCC) (2014) and the Western Regional Climate
Center (WRCC) (2014). The data from the Dominican Republic are at World Climate
(2014) and were submitted to the World Meteorological Organization and edited by the
National Climate Data Center (NCDC). Both the NWS and the NCDC are part of the
National Oceanic and Atmospheric Administration of the United States.
Materials and Methods
The hypotheses were tested for every oceanic tropical island for which data
could be found on the Internet. Typically for each station the metadata includes latitude,
longitude, and elevation. For each hypothesis assayed, each island has between 15 and
30
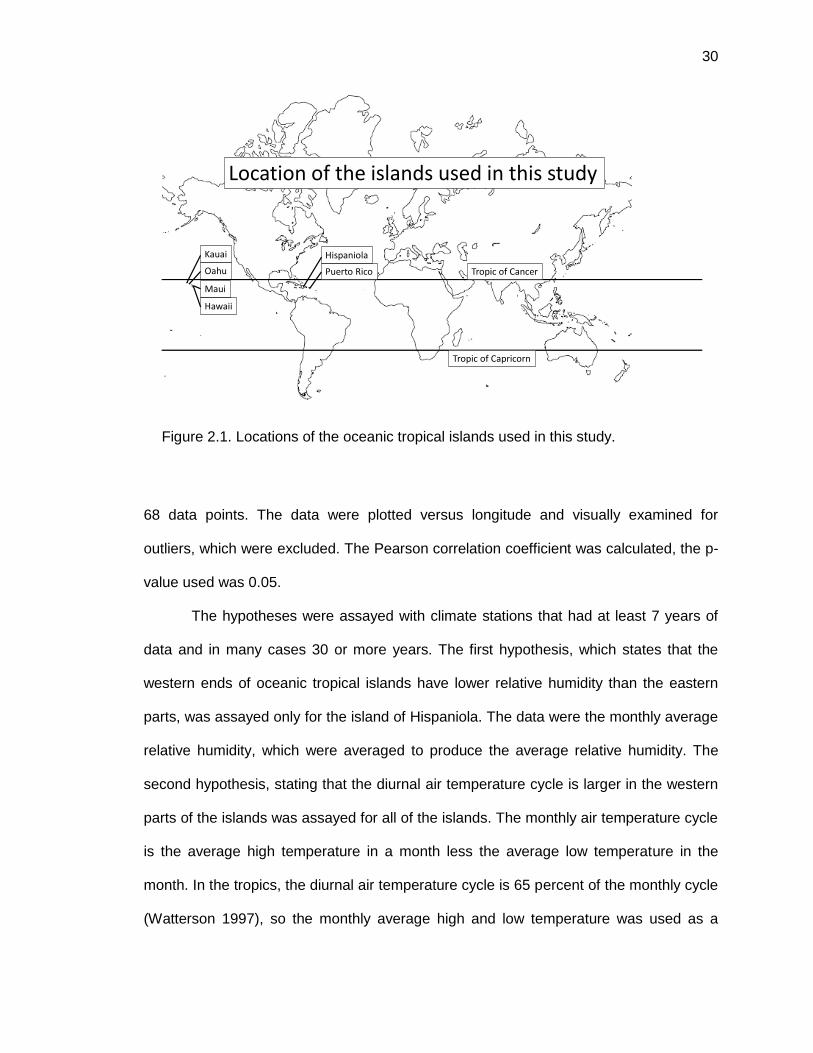
Figure 2.1. Locations of the oceanic tropical islands used in this study.
68 data points. The data were plotted versus longitude and visually examined for
outliers, which were excluded. The Pearson correlation coefficient was calculated, the p-
value used was 0.05.
The hypotheses were assayed with climate stations that had at least 7 years of
data and in many cases 30 or more years. The first hypothesis, which states that the
western ends of oceanic tropical islands have lower relative humidity than the eastern
parts, was assayed only for the island of Hispaniola. The data were the monthly average
relative humidity, which were averaged to produce the average relative humidity. The
second hypothesis, stating that the diurnal air temperature cycle is larger in the western
parts of the islands was assayed for all of the islands. The monthly air temperature cycle
is the average high temperature in a month less the average low temperature in the
month. In the tropics, the diurnal air temperature cycle is 65 percent of the monthly cycle
(Watterson 1997), so the monthly average high and low temperature was used as a
Tropic of Capricorn
Tropic of Cancer
Hawaii
Maui
Oahu
Kauai
Puerto Rico
Hispaniola
Location of the islands used in this study

31
proxy for the diurnal cycle. A proxy was needed because data on the diurnal air
temperature cycle are not readily available. Each station has a value for the monthly
difference between high and low temperature and these were averaged to produce a
single value for the station over the course of a year.
The hypotheses were also assayed for north-south differences. If the trade winds
are converging on the equator then it would be logical that the low latitude part of the
island would be dryer and have a larger diurnal air temperature cycle.
Results
The results are in table 2.1. The graph of average relative humidity versus
longitude for Hispaniola is shown in figure 2.2. There are 15 data points. The 13 data
points from stations below 200 m above sea level showed a clear trend from 83 to 63
percent relative humidity. The two stations higher than 400 m above sea level were more
humid and were excluded as outliers. The Pearson correlation coefficient was -0.74
which had a p-value of 0.0019.
Hypothesis number two predicts that the western parts of oceanic tropical islands
will have a larger diurnal air temperature cycle and this was tested with monthly air
temperature data. The average monthly air temperature cycles for Hispaniola and Puerto
Rico are shown in figure 2.3, while figure 2.4 has the same data for the four Hawaiian
Islands. All six islands had a larger diurnal temperature cycle in the western parts of the
islands but the correlations were not significant in the Big Island of Hawaii and Maui.
The hypotheses of this study were assayed 7 times on 6 oceanic tropical islands
in two groups in two oceans. The hypotheses were as predicted 5 of the 7 times. The
binomial distribution was used to calculate the p-value for this to occur by random
chance and the result is six times in a million trials. The testing of the north-south
hypotheses produced no significant results.

32
Table 2.1. Results of assaying the hypotheses on oceanic tropical islands.
_____________________________________________________________________________________________
Relative Humidity Diurnal Air Temperature Cycle
Hypothesis #1 Hypothesis #2
Island ma bb rc nd p-value m b r n p-value
_____________________________________________________________________________________________
Puerto Rico e 2.47 -154 0.54 44 <0.001
Hispaniola -4.05 362 -0.74 13 0.0019 1.00 -60 0.52 68 <0.001
Hawaii 0.379f -50 0.091 37 0.29
Maui 2.87 -439 0.37 20 0.054
Oahu 7.23 -1130 0.65 30 <0.001
Kauai 9.01 -1430 0.90 16 <0.001
a m is slope e blank cells represent no data
b b is intercept f highlighted in gray are insignificant
c r is Pearson correlation coefficient
d n is sample size

33
Figure 2.2. Hypothesis #1--Average relative humidity
versus longitude for Hispaniola. The excluded data are
from stations over 400 m in elevation while the rest of the
data are from stations within 200 m of sea level. Data
modified from World Climate (2014).
Discussion
The correlations in this study are based on the consistency of the easterly trade
winds. In parts of south Asia and the island-rich region between Asia and Australia, the
climate is dominated by the monsoon pattern which can include abrupt changes in wind
direction and precipitation (Chang et al. 2002). Understanding how the Asia monsoon
affects the climatology of tropical islands is crucial in the extension of this study to other
areas such as Indonesia and the Philippines; however none of the islands in this study
are affected by the monsoon pattern.

34
Figure 2.3. Hypothesis #2--Average monthly air temperature cycle
versus longitude for Hispaniola and Puerto Rico. Data modified from
World Climate (2014) and Southeast Regional Climate Center
(2014).
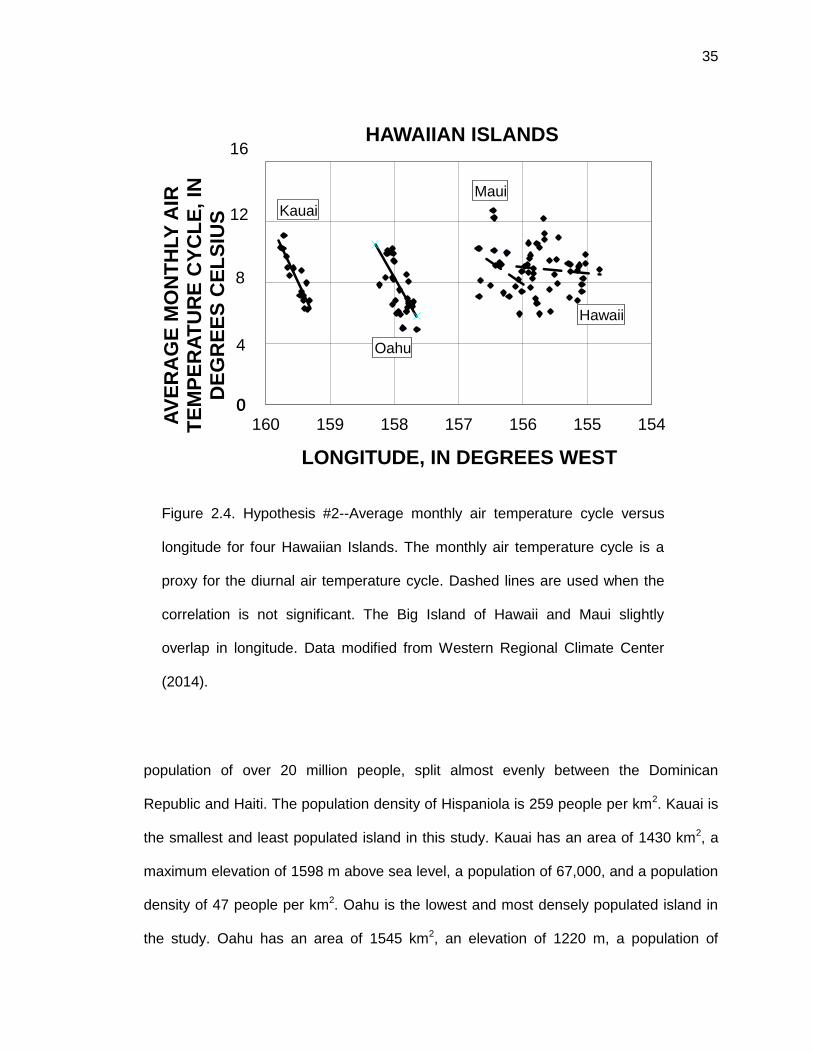
In Maui the hypothesis on the correlation between longitude and the monthly air
temperature cycle has 20 data points, a Pearson correlation coefficient of 0.37, and a p-
value of 0.054. It was classified as insignificant but it is right on the edge and with one
more station the correlation would be significant. The Big Island of Hawaii is a different
story. With 37 data points the Pearson correlation coefficient is 0.091, and the p-value is
0.29. To be significant a Pearson correlation coefficient of 0.1 requires more than 250
data points.
The largest and most populated island used in this study is Hispaniola, which has
an area of 76,500 km2, a maximum elevation of 3098 m above sea level, and a
35
Figure 2.4. Hypothesis #2--Average monthly air temperature cycle versus
longitude for four Hawaiian Islands. The monthly air temperature cycle is a
proxy for the diurnal air temperature cycle. Dashed lines are used when the
correlation is not significant. The Big Island of Hawaii and Maui slightly
overlap in longitude. Data modified from Western Regional Climate Center
(2014).
population of over 20 million people, split almost evenly between the Dominican
Republic and Haiti. The population density of Hispaniola is 259 people per km2. Kauai is
the smallest and least populated island in this study. Kauai has an area of 1430 km2, a
maximum elevation of 1598 m above sea level, a population of 67,000, and a population
density of 47 people per km2. Oahu is the lowest and most densely populated island in
the study. Oahu has an area of 1545 km2, an elevation of 1220 m, a population of
154155156157158159160AV
ER
AG
E M
ON
TH
LY
AIR
T
EM
PE
RA
TU
RE
CY
CL
E,
IN
DE
GR
EE
S C
EL
SIU
S
LONGITUDE, IN DEGREES WEST
HAWAIIAN ISLANDS
Hawaii
Maui
Oahu
Kauai
0
8
16
0
4
12

36
953,000, and a population density of 617 people per km2. The Big Island of Hawaii is the
highest in elevation and has the lowest population density. The Big Island of Hawaii has
an area of 10,432 km2, an elevation of 4205 m, and a population of 185,000 with a
population density of 18 people per km2.
The wind blows from the east, and as the air mass moves over land from east to
west it loses moisture to rain and becomes drier. The pattern is simplistic but it produced
two hypotheses which could be tested with data that are available on the Internet. The
hypotheses were successful in predicting observations on widely separated oceanic
tropical islands. The variables used in this study are affected by multiple factors like
elevation, proximity to the coast, the shape of mountains, and anthropogenic factors like
urban heat islands, the consistency of the easterly trade winds adds longitude to the list.
A simple correlation with limited data requirements produced useful results even though
the distance between Puerto Rico and Hawaii is more than 9,000 km.
Oceanic tropical islands are tiny specks of land spread out over vast distances of
ocean. On thousands of these islands, the easterly trade winds shape the environment
in predictable ways. This study is the first part of a larger effort to identify these
underlying physical processes that can help improve the management of water and
other natural resources on these islands. The easterly trade winds affects not only the
humidity and diurnal air temperature cycle but probably also the temperatures of sea
surface, rivers, and groundwater. These abiotic conditions shape the environment for
plants, animals, bacteria and fungi. Puerto Rico is a good place to start because its
political relationship with the United States has made it one of the most data-rich places
on Earth. The goal is science that can improve the management of water and other
natural resources in Puerto Rico while at the same time providing insights that can help
in the environmental management of thousands of islands where data are sparse.
Puerto Rico is an island but the viewpoint should not be insular but rather one that is

37
inclusive of the tens of thousands oceanic tropical islands with similar climates and
environmental problems.
Conclusion
The consistency of the easterly trade winds on oceanic tropical islands leads to
two predictions which can be assayed with data that are available on the Internet. The
hypotheses that were verified on two islands in the Caribbean and four in the Pacific are
that on the western end of the island the relative humidity is lower and the diurnal air
temperature cycle is larger. These patterns probably exist on thousands of islands for
which there are no readily available data. With more data it should be possible to
observe these patterns much more widely.
It has been observed that on islands, the topography of the island can act as an
obstacle or barrier to the wind causing an unequal distribution of humidity and diurnal air
temperature cycle. This study establishes the difference between the east (windward)
and the west (leeward) part of the islands. The east side benefit from the moisture of the
trade winds, while the west slope receives dryer wind. This generates microclimates that
also depend on elevation and large differences can occur across small horizontal
distances.
Acknowledgements
This study was possible because of the effort of observers and employees of
different agencies who for more than 50 years have collected, processed, and archived
the data used in this study. Their names are unknown, but their work is appreciated.
Literature Cited in Chapter Two
Arnberger H, Arnberger E. 2001. The tropical islands of the Indian and Pacific Oceans.
Austrian Academy of Sciences Press. Vienna, Austria. ISBN3-7001-2783-3.

38
Bonell, M, Hufschmidt, MM, Gladwell JS. 2005. Hydrology and Water Management in
the Humid Tropics: Hydrological Research. Edited by Cambridge University
Press.
Carter MM, Elsner JB. 1996. Collective rainfall regions of Puerto Rico. International
Journal of Climatology 16: 1033-1043.
Chang C-P, Wang Z, McBride J, Liu CH. 2005. Annual cycle of Southeast Asia –
Maritime Continent rainfall and the asymmetric monsoon transition. Institutional
Archive of the Naval Postgraduate School. http://hdl.handle.net/10945/36673.
Chen YL, Nash AJ. 1994. Diurnal variation of surface airflow and rainfall frequencies on
the island of Hawaii. Monthly Weather Review 122: 34-56.
Colón-Torres JA. 2009. Climatología de Puerto Rico. La Editorial Universidad de Puerto
Rico Sun Juan, PR.
Daly C, Gibson WP, Taylor GH, Johnson GL, Pasteris P. 2002. A knowledge-based
approach to the statistical mapping of climate. Climate Research 22: 99103.
Daly C, Helmer EH, Quiñones M. 2003. Mapping the climate of Puerto Rico, Vieques
and Culebra. International Journal of Climatology. 23:1359-1381.
Emanuel KA. 1987. The dependence of hurricane intensity on climate. Nature. 326:483-
485.
Enfield DB, Alfaro EJ. 1999. The dependence of Caribbean rainfall on the interaction of
the tropical Atlantic and Pacific Oceans. Journal of Climate 12: 2093–2103.
Giambelluca TW, Nullet D. 1991. Influence of the trade-wind inversion on the climate of
a leeward mountain slope in Hawaii. Climate Research 1:207-216.
Giannini A, Kushnir Y, Cane MA. 2000. Interannual variability of Caribbean rainfall,
ENSO, and the Atlantic Ocean. Journal of Climate 13: 297–311.
Giannini A, Chiang JCH, Cane MA, Kushnir Y, Seager, R. 2001. The ENSO
teleconnection to the tropical Atlantic Ocean: Contribution of the remote and local

39
SSTs to rainfall variability in the tropical Americas. Journal of Climate 14: 4530–
4544.
Gouirand I, Jury MR, Sing B. 2012. An analysis of low- and high frequency summer
climate variability around the Caribbean Antilles. Journal of Climate 25: 3942-
3952. doi:10.1175/JCLI-D-11-00269.1.
Izzo M, Rosskopf CM, Aucelli PPC, Maratea A, Méndez R, Pérez C, Segura H. 2010. A
new climatic map of the Dominican Republic based on the Thornthwaite
classification. Physical Geography 31(5): 455-472. doi:10.2747/0272-
3646.31.5.455.
Jury MR. 2009. An intercomparison of observational, reanalysis, satellite, and coupled
model data on mean rainfall in the Caribbean. Journal of Hydrometeorology.
19:413-430.
Malmgren BA, Winter A, Chen D. 1998. El Niño-Southern Oscillation and North Atlantic
Oscillation control of climate in Puerto Rico. Journal of Climate 11: 2713-2717.
McGregor GR, Nieuwolt S. 1998. Tropical climatology: an introduction to the climate of
the low latitudes (2nd edition). John Wiley and Sons. Hoboken, NJ.
Moron V, Frelat, R, Jean-Jeune PK, Gaucherel C. 2014. Interannual and intra-annual
variability of rainfall in Haiti. Climate Dynamics 45(3-4): 915-932.
Olson SL, James HF. 1984. The role of Polynesians in the extinction of the avifauna of
the Hawaiian Islands. Quaternary extinctions: A prehistoric revolution. Martin PS.
Klein RG. (editors). The University of Arizona Press. Tuscon, Arizona. 760-780.
Pierrehumbert, RT. 2011. Infrared Radiation and Planetary Temperature. Physics
Today. 64(1):33-38.
Southeast Regional Climate Center (SERCC). 2011. [Internet] Available on
http://www.sercc.com (Cited on 11 March 2011).

40
Taylor MA, Enfield DB, Chen AA. 2002. Influence of the tropical Atlantic versus the
Tropical Pacific on Caribbean rainfall. Journal of Geophysical Research 107:
3127. doi:10.1029/2001JC001097.
Wang C. 2007. Variability of the Caribbean Low-Level Jet and its Relations to Climate.
Climate Dynamics 29: 411–422. doi:10.1029/006GLO28579.
Watterson IG. 1997. The diurnal cycle of surface air temperature in simulated present
and doubled CO2 climates. Climate Dynamics. 13:533-545.
Western Regional Climate Center (WRCC). 2011. [Internet] Available on
http://www.wrcc.com (Cited on 11 March 2011).
World Climate. 2009. [Internet] Available on http://www.climate-charts.com (Cited on 6
October, 2012).

41
Chapter Three
Using the Correlation between Ground Water Levels and Temperature to Study
Aquifer Vulnerability in Puerto Rico
Abstract
Hourly data for 12 to 18 months from 33 non-pumping observation wells were
used to study the correlation between depth-to-water and water temperature in Puerto
Rico. This correlation was used to identify areas where the groundwater is at higher risk
from superficial contamination. The hypothesis of this study is that in Puerto Rico, the
upper unit of the karst North Coast Limestone aquifer will on average have a higher
Pearson correlation coefficient between depth-to-water and water temperature and is at
higher risk from superficial contamination than the alluvial South Coastal Plain aquifer.
The result of this study is that the hypothesis is not proven. In the upper unit of the karst
North Coast Limestone aquifer, the average Pearson correlation coefficient between
depth-to-water and water temperature is larger than in the alluvial South Coastal Plain
aquifer but the intra-aquifer variability is large enough to prevent the results from being
significant. Two areas in the upper unit of the North Coast Limestone aquifer,
Quebradillas-Camuy and Manatí-Vega Baja, have the highest correlation between
depth-to-water and water temperature and are at higher risk from superficial
contaminants both compared to the rest of the karst North Coast Limestone aquifer and
the alluvial aquifers.
Keywords: aquifer vulnerability, groundwater temperature, Puerto Rico
Introduction
In many environments, rainfall is colder than ambient conditions. If the rain water
becomes recharge water and reaches an observation well quickly, then there will be a

42
correlation between depth-to-water and water temperature. If the water reaches the
observation well slowly, then it will have warmed to ambient conditions and the water
level will rise independently of the temperature. The correlation between water level and
water temperature can be used to study the travel time from the surface to the aquifer
and the intrinsic vulnerability of the aquifer.
“Intrinsic vulnerability represents the inherent hydrogeological and geological
characteristics which determine the sensitivity of groundwater to contamination by
human activities; the term refers essentially to risk associated to non-point sources.
Intrinsic vulnerability considers all kind of contaminants, opposed to specific
vulnerability” (Doerfliger et al. 1999)
In both the United States and Europe a variety of schemes have been developed
to rank aquifer vulnerability. These schemes are usually based on the geographical
distribution of characteristics like depth-to-water, aquifer media, and recharge. There is
no consensus about which scheme works better (Gogu and Dessargues 2000). This
study will use the correlation between groundwater levels and water temperature to
examine the intrinsic vulnerability of aquifers in Puerto Rico.
Heat can be used as a tracer (Anderson 2005); in many environments, rainfall is
colder than ambient conditions. In Kentucky, USA, a spring was instrumented; after a
rain event, the discharge rose rapidly but the water temperature declined only after a lag.
The water that discharged between the rise in discharge and the fall in temperature was
interpreted as the storage in the aquifer that drains into the spring (Ryan and Meiman
1996).
In the Alps, wells are often drilled next to rivers, and government regulations in
Switzerland and Germany require a travel time between the river and the production well
of 10 and 50 days respectively. The transmission of the diurnal water temperature cycle

43
of the river into the aquifer was used to measure the travel time from river to monitoring
equipment located within one to two meters of the river (Hoehn and Cirpka 2006). At
mid-latitudes, which have a large annual air temperature cycle the seasonal cycle can be
detected up to 50 m away from the river (Molina-Giraldo et al. 2011). These techniques
will probably not be useful in Puerto Rico where both the diurnal and annual temperature
cycles are smaller than in temperate, continental regions.
Organic contaminants degrade over time and the longer the travel time from the
surface to the aquifer the lower is the risk of contamination. The degradation can be
caused by chemical or microbial processes. Pesticides are broken down faster in soils
than in aquifers because the soil has more dissolved oxygen, minerals, organic material,
surface area, and microbes than aquifers. The herbicide alachlor has a degradation half-
life of around 4 years in aquifers but only 20 days in soil (Sampat 2000). The median
degradation half-life in soil of 11 pesticides detected in groundwater in Santa Isabel,
Puerto Rico is 60 days (Rodríguez 2012). Atrazine is a pesticide that degrades to
deethylatrazine at a predictable rate and the ratio of these two chemicals was used to
identify a region in western Santa Isabel where the groundwater is older than average
(Rodríguez 2012).
High frequency groundwater temperature data are the unintended free byproduct
of the switch from floats to pressure transducers. Globally, many hydrologic agencies
have switched to pressure transducers and probably have large amounts of unused
groundwater temperature data. In the case of the United States Geological Survey
Caribbean-Florida Water Science Center (USGS-CFWSC) in Puerto Rico, the data
frequency is hourly. This study will determine if, in a tropical environment the
groundwater temperature data can be used to identify areas at high risk from superficial
contaminants. A tropical environment with a reduced annual and diurnal air temperature
cycles simplifies some aspects of this work.

44
Puerto Rico is a 9,104 km2 oceanic tropical island with an estimated population of
3,656,000 (USCB 2013) and a population density of 418 people/km2. More than 80
percent of the water used on the island is from surface water (Molina-Rivera and
Gómez-Gómez 2008). Puerto Rico has one desalinization plant that produces 7600
cubic meters of water per day (Ecoeléctica 2012), which represents about 0.3 percent of
total water usage. Desalination is energy intensive, and on an island where 98 percent of
the electricity is produced by burning fossil fuels (PREPA 2013), increased use of
desalination will increase air pollution and emissions of climate changing gasses. The
goals of this study are to demonstrate a new use for existing groundwater temperature
data and to enhance the science that is used to manage groundwater resources in
Puerto Rico. It is also expected that the techniques developed here will be useful in
other parts of the world.
In Puerto Rico, groundwater is an important backup when surface water is
unavailable due to drought. The two major aquifers on the island are the karst North
Coast Limestone (NCL) aquifer and the alluvial South Coastal Plain (SCP) aquifer
(Renken et al. 2002). Lugo et al. (2001) describes the geology, biology, and land use of
the karst of Puerto Rico and calls for it to be set aside for conservation. In this study a
group of smaller discontinuous alluvial aquifers are called Rest of Puerto Rico (ROP).
The journey of a rain drop that will recharge an aquifer has three components:
First as runoff the water quickly moves across the land surface until an increase in the
hydraulic conductivity allows it to drop underground. The second leg is downward until it
reaches the water table. In the third and longest section, it recharges the aquifer and the
water slowly moves horizontally to its discharge point in a spring, seep, or pumping well.
The speed of the water is slower with each of the three legs of the journey.
When the rain drop hits the land surface it is relatively cold, saturated with
oxygen, and low in dissolved solids. There has been little use of tracers in Puerto Rico

45
(Ghasemizadeh et al. 2012). In Puerto Rico there are a small number of studies that
document the water quality of rain (Osborne 1986) and more that document the water
quality of runoff (Rodríguez 1996, Conde-Costas and Gómez-Gómez 1999, Rodríguez
1999, and Rodríguez 2001). As it crosses the land surface the runoff picks up
sediments, organic material, and microbes. Runoff water in Puerto Rico often has the
color of coffee with milk.
The second leg of the journey is transient, occurs underground, and is almost
undocumented. In the NCL the closed depressions where the runoff goes underground
are often clogged with mats of decomposing leaves and logs mixed with inorganic
sediments. The only study that looks at the connection between the surface and the
aquifer is Rodríguez-Martínez (1997) which classified 58 springs as conduit and nine as
diffuse. Conduit springs are well connected to the surface and during rainfall events
conduit springs undergo a rapid change in discharge and water quality including
sediment load. Diffuse springs integrate water over a long period and do not undergo
dramatic changes during rainfall events. Heat can be used as a tracer to study the water
as moves vertically towards the water table.
Unlike the transient conditions in the flow of runoff and the vertical stage of
recharge water movement, the third leg of the journey, the horizontal flowing
groundwater below the water table is a permanent feature and is easier to study. In
Puerto Rico thousands of wells have been drilled and the vast majority is not pumped.
According to the USGS (2015), the National Water Information System (NWIS) for
Puerto Rico, has on the Internet 2492 wells with at least one water level and 79 with 100
or more. At 87 wells water level data have been collected in the past year.
Compared to some parts of the world, Puerto Rico has vast amounts of
groundwater data and much of it is available on the Internet. At the same time there are
limitations to the groundwater data that exists for Puerto Rico. NWIS has 1487 wells in

46
Puerto Rico or the U.S. Virgin Islands with at least one water quality sample but the first
sampling of groundwater quality at regular intervals began in 2011 (USGS 2015). Some
published groundwater models have been based on limited amounts of data. Data are
sparse for the model of northwest Puerto Rico from Aguadilla to the Río Camuy (Tucci
and Martínez 1995). The calibration of the groundwater model in Santa Isabel is almost
entirely based on data from the Alomar 1 observation well (Kuniansky et al. 2003).
Groundwater models have used hydraulic conductivity data generated from slug tests or
specific capacity data that only measure the aquifer properties within a few meters of the
test well (Ghasemizadeh et al. 2012). Multi-well aquifer tests which could provide data
over hundreds of meter are more expensive but have seldom been performed.
Kuniansky and Rodríguez (2010) is a study using a groundwater model in the SCP in
Salinas and noted the lack of multi-well aquifer tests.
Karst aquifers are dominated by solution processes. Dissolution occurs more
rapidly in environments that are warm, wet, and have high levels of carbon dioxide.
Puerto Rico is tropical and is warmer than non-tropical areas. The average annual
rainfall in Puerto Rico is 1654 mm (Larsen 2000) and this is more than in most places in
the world. In the humid tropics the biomass density is higher than in non-tropical areas
and the decomposition of this biomass raises the concentration of carbon dioxide in the
soil. In the tropics, secondary porosity will develop in limestone more rapidly than in non-
tropical areas.
The NCL is a northward sloping sedimentary wedge that was laid down during
the Oligocene and Miocene. The five geologic units of the NCL, from oldest to newest,
are the San Sebastian Formation, the Lares Limestone, the Cibao Formation, the
Aguada Limestone, and the Aymamón Limestone. The dip is northward and averages
five degrees. The list above is also the order that the formations outcrop from south to
north. In places, particularly in the east, the NCL is overlain by unconsolidated

47
Quatenary deposits. A geologic map of the North Coast Limestone is shown in figure
3.1. Hydrogeologically, the NCL is divided into two limestone dominated productive units
with high hydraulic conductivity. The productive units are separated and underlain by
clay-rich units of low hydraulic conductivity (Renken et al. 2002). The upper part of the
Cibao Formation is high in clay and low in hydraulic conductivity. This part of the Cibao
supports surface streams while the rest of the NCL is dominated by subsurface flow. The
upper unit of the NCL includes the Aguada and Aymamón Limestones. The lower unit of
the NCL includes the Lares Limestone and in some areas permeable parts of the Cibao
formation such as the Montebello Limestone. The lower unit has a longer travel time
between rainfall and aquifer recharge and the methods of this study would probably be
less useful. In this study, there is more data from the upper unit than from the lower unit.
In Puerto Rico, there is a longstanding discussion about how to digitally model
the mix of low-hydraulic conductivity matrix interspersed with fractures and conduits of
higher hydraulic conductivity. Digital groundwater models have been developed for the
NCL in the area of Barceloneta (Torres-González 1985), in the north central coast
between the Río Camuy and Río Grande de Manatí (Torres-González et al. 1996), and
in the Manati-Vega Baja area (Cherry 2001) and all of these models have estimated an
equivalent hydraulic conductivity. In the opinion of Ghasemizadeh et al. (2012) there are
not enough data to do a good job of modeling the NCL.
There are no studies on the travel time from the surface to the aquifer. The upper
unit of the NCL is recharged almost exclusively by direct rainfall. The lower unit of the
NCL is recharged by direct rainfall and also by streams that form on the volcanic rocks to
the south and then disappear underground when they cross onto the karst rocks. In the
karst NCL, aquifer recharge occurs when the monthly rainfall exceeds 200 mm

48
Figure 3.1. Location of the observation wells used in this study and a geologic map of
the North Coast Limestone. The upper panel is a map of Puerto Rico. The circles with
black centers are the stations with a Pearson correlation coefficient between the depth-
to-water and temperature above 0.85 and the circles with white centers have a Pearson
correlation coefficient below 0.85. The lower panel is a geologic map of the North Coast

49
Limestone aquifer. The base map of the upper panel is from the USGS and the lower
panel is modified from Olcott 1999.
(Jones and Banner 2003). In all the studied aquifers the generalized direction of flow is
towards the ocean. The volcanic core of the island has fractured-rock systems that
contribute to maintaining base flows in the rivers but there is little groundwater
production or data. It is commonly assumed that the karst NCL aquifer is at greater risk
from the rapid movement of superficial contaminants than the alluvial SCP aquifer.
However the intrinsic vulnerability of the NCL aquifer has not been tested. A key
question is if the NCL aquifer has consistent vulnerability or needs to be broken down
into smaller units.
The SCP aquifer is the most important aquifer in southern Puerto Rico, which is
drier than the north of the island (Colón-Torres 2009). The SCP aquifer is 70 km long
and 3 to 8 km wide. It consists of a series of fan deposits that have coalesced. The size
of the particles ranges from boulder to silt. The depositional environment is complex and
has included downward moving grabens (Renken et al. 2002). The SCP aquifer is
recharged both by direct rainfall and from intermittent streams that flow out of the
mountains that are north of the coastal plain. Often these streams are kilometers long
and permanent in the mountains and then the water sinks when the stream crosses onto
the alluvium. Some of the streams may not flow into the ocean for months during the dry
season.
Much of what we know about groundwater in Puerto Rico is from the observation
wells maintained by the USGS-CFWSC and the data in this study is from a subset of
these wells. Typically in a groundwater study, the USGS-CFWSC drills some
piezometers, after the short-term project, some of these piezometers become part of the
long-term network. The USGS-CFWSC constructed piezometers used in this study in

50
Naguabo (Graves 1989), Dorado (Troester 1999), Fajardo (Pérez-Blair 1996), and
Salinas (Kuniansky and Rodríguez 2010). These stations have been used to study the
water-level fluctuations in observation wells (Richards 2003). Long-term water level data
from these observation wells has been used to calibrate groundwater models in Santa
Isabel (Kuniansky et al. 2003) and Salinas (Kuniansky and Rodríguez 2010). A second
source of observation well is wells that were drilled to be production wells but then
abandoned.
Two of the observation wells used in this study Hill 2, Manatí and Palo Alto 2,
Vega Baja, are part of a group of six wells that were sampled for pesticides. The wells
had been drilled to study nitrate contamination near pineapple fields (Conde-Costas and
Gómez-Gómez 1999). Pineapples were grown in the area for many years but by 2008
production had stopped. The herbicide Bromacil was detected in all six wells with the
highest level, of 30 μg/L, at Hill 2 in February 1997 (Dumas 1999).
The United States Environmental Protection Agency has classified the most
contaminated sites in the United States and its territories in the National Priority List,
better known as “Superfund” sites. Puerto Rico has 16 sites of which 8 involve
contaminated groundwater. Bosque (2011) looked at three of these sites and
demonstrated that the benefits of remediation exceed the costs.
This study will look at the correlation between depth-to-water and water
temperature in observation wells. The hypothesis is that the average Pearson correlation
coefficient between depth-to-water and water temperature for the observation wells in
the karst upper unit of the NCL aquifer will be higher than in the observation wells in the
alluvial SCP aquifer. If this hypothesis is correct, then the karst upper unit of the NCL
aquifer as a whole is at greater risk from superficial contaminants than the alluvial SCP
aquifer. The null hypothesis is that the average Pearson correlation coefficient in the
karst upper unit of the NCL is not significantly different than the alluvial SCP aquifer. If

51
the null hypothesis cannot be rejected then it would mean that, in terms of intrinsic
vulnerability, there are no significant differences between the upper unit of the NCL and
the SCP aquifer. The hypothesis will fail if the ratio of intra-aquifer to inter-aquifer
differences is large. Either result is useful to improve the management of groundwater
resources in Puerto Rico. In terms of aquifer vulnerability it is important to know if the
upper unit of the NCL is one unit or needs to be managed on a smaller length scale. The
hypothesis applies to stations were the water level is controlled by rainfall and not tides
nor the cycling of production wells.
Materials and Methods
Globally, in the 20th century most water levels in observation wells were recorded
with a float-counterweight system. Early in the 21st century the USGS-CFWSC converted
its water-level recorders from floats-counterweights to pressure transducers. Pressure
transducers produce more reliable data and are less expensive because they need less
labor power to install, operate, and process the data.
Float-counterweights and pressure transducers do not measure the same
geophysical variable. The float detects the elevation of the density difference at the air-
water interface while the pressure transducer measures the pressure and the
temperature at a fixed point below the water surface and then calculates the water level.
An assumption is made that the water column is thermally homogenous; this assumption
is seldom violated in observation wells.
As of May 2015, the 33 stations used in this study have been visited by USGS-
CFWSC employees 5317 times. The complete data for each station are in Appendix I.
The daily and monthly water level data, and metadata such as location and well depth,
are available on the Internet (USGS 2015). The hourly data, both water level and water
temperature, are unpublished.

52
Between 1963 (Carter et al. 1963) and 2002 the USGS used the Automatic Data
Recorder (ADR). In Puerto Rico, for many years, this was the only equipment used to
record water levels in observation wells. At a regular time interval, the ADR punched
holes in a paper tape that represented the rotational position of the float wheel.
By 1998, the USGS-CFWSC was testing two ADR replacements (Richards
2003). One system still used the float-counterweight system but the digital electronic file
was created in the field and transported to the office on a data card. The second unit
being tested was a pressure transducer with an integrated data logger, the DH-21 made
by Design Analysis. The use of brand names is for identification purposes only and does
not constitute endorsement by the Universidad del Turabo. All of the data used in this
study were collected with the DH-21. This system has no moving parts and no display; it
must be read in the field with a computer.
The USGS-CFWSC had layoffs in 2002 and between 2003 and 2008 the
emphasis was less but higher quality data. Documentation was improved and protocols
were standardized. By 2006 the groundwater network was again standardized using the
pressure transducer in all non-telemetry stations.
All of the groundwater levels in this study were originally measured to the nearest
0.01 feet (3 mm). A pressure transducer is mounted at a fixed location, usually about 1.5
m, below the record low water level. The pressure transducer measures the pressure
and the temperature, and then calculates the water level. The unit is calibrated and then
on revisits the water level is independently measured to verify the calibration.
A one part per thousand (ppt) change in the calibration of the pressure sensor
changes the reported height of the water column above the sensor by one ppt. The
density of water is only slightly a function of temperature. A fractional change in
temperature is meaningful only in the Kelvin temperature scale. The ambient
temperature of groundwater in Puerto Rico is almost exactly 300 K. and a change of one

53
ppt is 0.3 K, which equals 0.3 °C. A one ppt increase in water temperature results in a
0.08 ppt reduction in water density (CRC Handbook of Chemistry and Physics 1989). A
typical station has 7 m of water above the sensor and would require a 7.2 K change in
the calibration of the temperature sensor to create an error of 15 mm, which would lead
to a reset of the DH-21, which has a resolution of 0.01 °C and an absolute accuracy of 1
°C (Fletcher 2010). In this study the relative is more important than the absolute
accuracy. About once a year, the in-situ water temperature of the observation well was
measured with an YSI model 85 digital temperature sensor with a 30 meter cable
between the sensor and the display. The unit has a resolution of 0.1 °C and in the
laboratory was always within 0.1 °C of a certified thermometer.
In this study, 39 percent of the observation wells were piezometers that had been
drilled by the USGS-CFWSC for scientific studies, 61 percent were abandoned
production wells drilled for public supply, agriculture, industry, or an orphanage. About
90 percent of all the production water wells drilled in Puerto Rico are abandoned.
Piezometers are designed to obtain data from a specific point in the aquifer, while
production wells are designed to maximize production. Compared to piezometers,
production wells tend to be larger diameter, deeper, and tend to be open to the aquifer
over a larger distance, the construction details of piezometers are better documented
than production wells. There are many things about a well that cannot be predicted
before its construction. The unknowns include its productivity, its response time to rain
events, and what will be the range in water level over time.
If a production well is producing large quantities of clean water, it will not be
abandoned and made available to be an observation well. Compared to operating
production wells, abandoned production wells tend to have lower hydraulic conductivity
or are contaminated. Tiburones, Barceloneta is a production well that was abandoned
after it became contaminated with carbon tetrachloride from a nearby spill (Hunter and

54
Arbona 1995). The 33 observation wells used in this study range in diameter from 50 to
510 mm, well depth ranges from 6 to 178 m, and average depth-to-water ranges from
0.4 to 127 m.
This study used raw hourly water level and temperature data from 33 non-
pumping observation wells located throughout the aquifers of the main island of Puerto
Rico. The locations are shown in figure 3.1. The upper unit of the NCL, the lower unit of
the NCL, SCP, and the ROP have 12, four, 13, and four stations respectively. Each
station has 12 to 18 months of data. Most years have 8760 hours, leap years have 8784.
If available, data from 2005 were used because this was when many observation wells
set new record highs. All of the data were collected with DH-21 pressure transducers
and are courtesy of the USGS-CFWSC. During bimonthly site visits, the water levels
calculated by the pressure transducer were compared to the water levels measured
independently. At the office, the raw data are subject to several corrections, and the
noon values are published. These corrections will not change the correlations presented
here.
Using a p-value of 0.05 and a sample size of 250, a Pearson correlation
coefficient of around 0.12 is significant. When the sample size reaches 10,000, a
Pearson correlation coefficient of 0.02 is significant. With large sample sizes even
relationships with very low correlation can be significant.
Results
Between 2002 and 2008, in 575 site visits, 85 percent of the time the DH-21 was
within the accepted error tolerance and was not reset to the measured water level. The
unit at Florida 1, Florida operated for five years with no reset. The other extreme was at
Alomar 1, Santa Isabel, where the equipment drifted on average, 36.9 millimeters per
month and was reset on 16 consecutive visits.

55
On 112 visits the water temperature was measured and compared to the live
instrument reading. The live temperature was within 1 °C of the temperature measured
by the electronic thermometer 77 percent of the time. A large temperature error that is
stable is not an obstacle to collecting high quality water level data. Paso Seco 7, Santa
Isabel, operated for a year with an error of 4 °C. It was eventually changed not because
of differences with the measured water level but when it would no longer communicate
with the computer.
The correlations between depth-to-water and water temperature are shown in
Appendix I. There are five stations were the depth-to-water and water temperature have
a Pearson correlation coefficient above 0.85 and four of these are in the upper unit of the
karst NCL. The water level and water temperature data of JBNERR East 1, Salinas are
in figure 3.2. This station has a Pearson correlation coefficient of 0.92. This is the only
station in the SCP that has a Pearson correlation coefficient above 0.85. The area
around the station is mudflats and mangrove swamps. The water level is within one
meter of the land surface and the hydrograph clearly shows that it is affected both by
tides and the cycling of production water wells. Because the water level is controlled by
tides and production wells, this station was excluded from the study.
The hypothesis is not significant. The average Pearson correlation coefficient of
the 12 stations in the upper unit of the karst NCL aquifer is 0.29 with a standard
deviation of 0.62. With the removal of JBNERR East 1, the average of the 12 stations in
the SCP is 0.01 and the standard deviation is 0.50. The p-value is 0.25. The difference
of the average Pearson correlation coefficients between the karst upper unit of the NCL
and the alluvial SCP aquifer is not significant and the null hypothesis cannot be rejected.

56
Figure 3.2. Hourly water level and water temperature of the JBNERR East 1,
Salinas observation well. This station was excluded because the water level is
controlled by the tides and the cycling of production water wells. Data courtesy of
USGS.
The Cbgar, Quebradillas observation well is the more highly correlated station
and the data are in figure 3.3. The four stations in karst NCL aquifer with the highest
correlation between depth-to-water and water temperature are not randomly distributed.
All are in the upper unit of the NCL. The two most highly correlated stations are in the
adjoining municipalities of Quebradillas and Camuy. Municipalities are the equivalent of
counties in the United States. The stations ranked 3rd and 4th are in the adjoining
municipalities of Manatí and Vega Baja. These two areas are at highest risk from
27.1
27.2
27.3
27.40.0
0.5
1.0
1.5
WA
TE
R T
EM
PE
RA
TU
RE
, IN
CE
LS
IUS
WA
TE
R L
EV
EL
, IN
ME
TE
RS
IN
BE
LO
W L
AN
D
SU
RF
AC
E
TIME, FROM 1 OCT 06 TO 30 SEP 07
JBNERR EAST 1, SALINAS, PUERTO RICO
Water Level (Black)
Water Temperature (Gray)
r = 0.92

57
Figure 3.3. Hourly water levels and temperature of the Cbgar, Quebradillas observation
well. This station is the most highly correlated in Puerto Rico. Data courtesy of USGS.
superficial contamination compared both to other parts of the karst NCL and the alluvial
aquifers.
Discussion
In this case it is important to publish the results because it is useful information
for water resource managers. In terms of aquifer vulnerability the upper unit of the NCL
cannot be viewed as a single unit at high risk, instead it needs to be divided and
managed in smaller pieces. This study documents two hot spots that are at higher risk to
superficial contaminants than the upper unit of the NCL as a whole.
Figure 3.4 shows the histograms of the distribution of Pearson correlation
coefficients for the upper unit of the NCL and all other aquifers combined. The width of
21.5
22.0
22.5
23.0
23.5
24.0
24.5121
122
123
124
125
126
127
WA
TE
R T
EM
PE
RA
TU
RE
, IN
CE
LS
IUS
WA
TE
R L
EV
EL
, IN
ME
TE
RS
BE
LO
W L
AN
D S
UR
FA
CE
TIME, FROM 1 JUL 05 TO 31 DEC 06
CBGAR WELL, QUEBRADILLAS, PUERTO RICO
Record High Water Level, 23 years of data
Temperature (Grey)
Water Level (Black ) r = 0.99

58
Figure 3.4. Distribution of the Pearson correlation coefficients between the depth-
to-water and the water temperature.
the bins is 0.4. The hypothesis failed because of the large intra-aquifer variability. For
the upper unit of the NCL 58 percent of the stations are in the two extreme bins, either
the most highly correlated or the least correlated. Outside of
the upper unit of the NCL only 20 percent of the stations are in these two categories.
The model is simplistic. The model predicts that there will be stations with
correlation or no correlation between depth-to-water and water temperature. It cannot
explain stations with an inverse correlation between depth-to-water and water
temperature. Maguayo 2, Dorado is an example of no correlation and the data are
shown in figure 3.5. Tortuguero 3, Vega Baja is an example of an inverse correlation
0.0
0.1
0.2
0.3
0.4
0.5
-1.2 -0.8 -0.4 0 0.4 0.8 1.2
FR
AC
TIO
N
PEARSON CORRELATION COEFFICIENT
DISTRIBUTION OF PEARSON CORRELATION COEFFICIENTS
The solid line is the upper unit of the North Coast Limestone. The dashed line is all other aquifers combined.

59
Figure 3.5. Hourly water levels and water temperature for the Maguayo 2, Dorado
observation well. This is an example of an observation well that has no correlation
between depth-to-water and temperature. Data courtesy of USGS.
between depth-to-water and water temperature and the data are shown in figure 3.6. In
a study with 32 observation wells the municipality of Vega Baja has stations that rank 4th
and 32nd in correlation between depth-to-water and water temperature. Palo Alto 2 has
the fourth highest correlation between water level and water temperature and is 2.6 km
from Tortuguero 3 which is ranked 32nd.
25.2
25.3
25.4
25.56.6
7.0
7.4
7.8
WA
TE
R T
EM
PE
RA
TU
RE
, IN
CE
LS
IUS
WA
TE
R L
EV
EL
, IN
ME
TE
RS
BE
LO
W L
AN
D
SU
RFA
CE
TIME, FROM 1 JAN 05 TO 31 MAR 06
MAGUAYO 2, DORADO, PUERTO RICO
Record High Water Level,13 years of data
r = -0.009
Water Temperature (Gray)
Water Level (Black)

60
Figure 3.6. Hourly water levels and temperature for the Tortuguero 3, Vega Baja
observation well. This is an example of an observation well that has an inverse
correlation between depth-to-water and temperature. Data courtesy of USGS.
The model predicts that non-correlated stations will have a constant temperature
which is clearly not the case. Apparently there are changes in groundwater temperature
that have a period of more than a year that are not associated with changes in water
level. No mechanism has been identified that can explain these long-period patterns
observed in the water-temperature data.
The Cbgar and Zanja 4, Camuy stations are both highly correlated. They are
about 7.4 km apart and they have different connections to the surface. In 18 months
Cbgar had five events that caused the water level to rise, while Zanja 4 had 26. Near
Zanja 4 there are two production wells, Zanja 2 and Zanja 3, which combined pump 31
24.0
24.5
25.0
25.56.8
6.9
7.0
7.1
7.2
7.3
7.4
WA
TE
R T
EM
PE
RA
TU
RE
, IN
CE
LS
IUS
WA
TE
R L
EV
EL
, IN
ME
TE
RS
BE
LO
W L
AN
D
SU
RF
AC
E
TIME, FROM 1 JUL 05 TO 31 DEC 06
TORTUGUERO 3, VEGA BAJA, PUERTO RICO
Record High Water Level, 12 years of data
r = -0.83
Water Temperature (Gray)
Water Level (Black)

61
liters per second (Tucci and Martínez 1995). Both at-risk areas are rolling terrain with no
surface drainage. The Quebradillas-Camuy area was traditionally dairy farms, and the
Manatí-Vega Baja area had pineapple production, but because of access to good
highways, housing construction has increased in both areas in recent years.
Construction of houses and roads will increase the impermeable areas and the runoff
which should cause less water to be returned to the atmosphere via evapotranspiration.
The increased runoff will increase the water that recharges the aquifer but the reduced
travel time may lower the quality of the water that reaches the aquifer.
It is too late to protect the aquifer in Manatí-Vega Baja. Both Hill 2 and Palo Alto
2 were drilled by the USGS-CFWSC to study nitrate contamination. The source of the
nitrates was the fertilizer that was used on the now-abandoned pineapple fields (Conde-
Costas and Gómez-Gómez 1999). Hill 2 sits about 10 m from an ephemeral channel that
terminates in a nearby sinkhole. At both of these observation wells, the correlation
between depth-to-water and water temperature is higher in large rain events than in
small rain events. In addition to the nitrate contamination, between the two observation
wells there is an abandoned pesticide warehouse that has been added to the Superfund
list (Puerto Rico Department of Health 2005). A description of the pesticide warehouse
as having a “semi-confined aquifer” (Puerto Rico Department of Health 2005) is in
conflict with this study, which finds that it is one of the most vulnerable areas in Puerto
Rico. The groundwater flow in this area was modeled by Cherry (2001) and there is no
correlation between the high risk area and a zone of high transmissivity identified in the
modeling study. The utility of the methodology of this study is demonstrated by the fact
that by studying the physics of the aquifer, areas with high intrinsic vulnerability can be
identified. One of the two highest at-risk areas is already contaminated and this confirms
the validity of the technique.

62
Heat can be moved by conduction, convection, or radiation, in an underground
environment there is no radiation, conduction is the transfer of heat between two
materials at different temperatures that are in contact with each other, and convection
uses moving fluids, either liquids or gasses, to move the heat. On July 14th, 2006 at
0200 at the Cbgar well the water level was 121.337 m below land surface, and the water
temperature was 22.48 °C. With 23 years of data, this was the record high water level up
to that point. The sensor for the pressure transducer was 140 m below land surface. A
heavy rain event in Puerto Rico is typically less than 200 mm of rain, and it would be
impossible for conduction alone to affect the temperature of the 19 m of water above the
sensor, convection is needed. There should be an operating mechanism that will cause
the cold recharge water to flow past the sensor.
The Cbgar well is classified as being in an unconfined aquifer (USGS 2015).
Suppose that in fact the aquifer has a layer with a lower hydraulic conductivity, although
not low enough to be classified as a confining layer. After a heavy rain event, the
recharge water would be moving downward and slowly crossing the less permeable
layer. An open well would act as a short circuit, and become the easiest route for the
water to cross the less permeable layer. This well is 168 m deep and is open hole to
within 2 m of the land surface. The rain event would cause radial flow inward towards the
well above the less permeable layer, vertical flow downward in the well to cross the
layer, and radial outward flow below the layer. This is shown in figure 3.7.
A pressure transducer installed too high in an observation well will hang dry in
the air if the water level drops below its level. For this reason, the pressure transducer is
normally installed about 1.5 m lower than the record low water level at the station. The

63
Figure 3.7. Cbgar Well on July 14th, 2006 at 0200. The open hole of
the well allows water to bypass the hypothesized confining layer and
flow by the sensor and would make it more sensitive to the
temperature of the rain event.
methodology of this study, which consists of a sensor at the bottom of the well looking
for changes in temperature that will occur on top of the saturated zone should detect
nothing, unless there is a preferential vertical flow path that brings the water from the top
to deeper into the aquifer. At the two stations with the highest rankings, Cbgar and Zanja
4, the preferential vertical flow path is probably the open-hole well itself. The two stations
ranked 3rd and 4th, Hill 2 and Palo Alto 2, are piezometers that were drilled as part of a
scientific study of nitrate contamination. Both stations are cased with PVC and have
screened intervals only over short distances. Hill 2 is near a sinkhole that is filled with

64
sediments deposited from an ephemeral stream with a drainage basin of 18 ha (0.18
km2) (Conde- Costas and Gómez-Gómez 1999). This station is correlated during heavy
rain events but not during small rain events. The preferential vertical flow path for Hill 2
is probably not the well but sinkhole. In the case of Palo Alto 2, it is not clear where the
preferential vertical flow path is located. The areas at high risk from the movement of
superficial contaminants have only thin soils above the limestone. Further to the east like
in Dorado, the observation wells are drilled in the flat valleys where the limestone is
overlain by alluvium. The presence of the alluvium above the limestone slows the
movement of rain from the surface to the aquifer, and these observation wells show little
or no correlation between depth-to-water and temperature. This is the variability within
the NCL that causes the hypothesis to fail.
This study identified areas in the NCL aquifer that are at high risk from superficial
contaminants. The next stage would be to identify production wells in the high risk areas
and install instrumentation to measure the amount and temperature of the rainfall and
the temperature of the water pumped out of the aquifer. In this manner it should be
possible to directly measure how quickly the rain water reaches the potable water
system. Temperature has the potential to be a useful tool to increase our knowledge of
groundwater resources of Puerto Rico.
Conclusion
This study demonstrated new things can be learned from existing data at stations
that have been visited thousands of times. Using USGS-CWSC data, a comparison was
made between depth-to-water and water temperature with hourly data from 33 non-
pumping observation wells in Puerto Rico. Rainfall is cold, and if it reaches the
observation well before it has reached thermal equilibrium, then there will be a
correlation between depth-to-water and water temperature. The longer the travel time
between the surface and the observation well, the less correlation there will be between

65
groundwater level and water temperature. The hypothesis was that the upper unit of the
karst NCL will have significantly higher correlations between depth-to-water and water
temperature than the alluvial SCP aquifer. The hypothesis is not in agreement with
experimental observations. The observation wells with the highest correlation between
depth-to-water and water temperature are in the upper unit of the NCL but the difference
is not significant because of the size of the intra-aquifer variations. This conclusion can
improve the management of groundwater resources in Puerto Rico because it
demonstrates that the NCL cannot be managed as a single unit but must be divided and
managed in smaller sections. In Puerto Rico, the two regions at the highest risk from
surficial contamination are the sections of the NCL aquifer in Quebradillas-Camuy and
Manatí-Vega Baja. In the hydrogeological literature of Puerto Rico the scarcity of data is
a recurring theme. This study demonstrates that existing groundwater temperature can
be used with new techniques to learn useful things about the water resources of the
island. The authors would like to thank the USGS for the use of the hourly water level
and water temperature data.
Literature Cited in Chapter Three
Anderson MP. 2005. Heat as a Ground Water Tracer. Ground Water. 43(6): 951-968.
Doi:10.1111/j.1745-6584.2005.00052.x.
Bosque A. 2011. Economic valuation of groundwater remediation costs and benefits:
Towards a more comprehensive approach. Unpublished doctoral dissertation
Universidad del Turabo School of Science and Technology, Gurabo, PR.
Carter RW, Anderson WL, Isherwood WL, Rolfe KW, Showen CR, Smith W. 1963.
Automation of Streamflow Records. Geological Survey Circular 474. United
States Geological Survey, Washington DC.

66
Cherry GA. 2001. Simulation of flow in the upper North Coast Limestone Aquifer,
Manatí-Vega Baja area, Puerto Rico. United States Geological Survey Water
Resources Investigations Report 00-4266. San Juan, PR.
Colón-Torres JA. 2009. Climatología de Puerto Rico. La Editorial Universidad de Puerto
Rico. San Juan, PR.
Conde-Costas C, Gómez-Gómez F. 1999, Assessment of nitrate contamination of the
upper aquifer in the Manatí-Vega Baja area, Puerto Rico, U.S. Geological Survey
Water-Resources Investigations Report 99-4040. San Juan, PR.
CRC Handbook of Chemistry and Physics. 1989. Density of Water. Weast RC (editor).
CRC Press. Boca Raton, FL. p F-4.
Doerfliger N, Jeannin PY, Zwahlen F. 1999. Water vulnerability assessment in karst
environments: a new method of defining protection areas using a multiattribute
approach and GIS tools (EPIK method). Environmental Geology. 39(2):165-176.
Dumas JA. 1999. Limestone soils: Interaction with pesticides and its impact on the north
coast aquifer of Puerto Rico. Unpublished doctoral dissertation. Chemistry
Department, University of Puerto Rico at Río Piedras. San Juan, PR.
Ecoeléctrica. 2012. Aumentado la producción de agua en el sur. [Internet] Available on
http://173.83.96.97/ecolectrica/?page_id=10 (Cited on 26 November 2012).
Fletcher T. 2010. Model DH-21 Owners Manual. Design Analysis, Logan UT. [Internet]
Available on http://www.waterlog.com/media/pdfs/DH-21-Manual-v1-5.pdf (Cited
on 9 November 2013).
Ghasemizadeh R, Hellweger F, Butscher C, Padilla I, Vesper D, Field M, Alshawabkeh
A. 2012. Review of ground water flow and transport models of karst aquifers, with
particular reference to the North Coast Limestone aquifer systems of Puerto
Rico. Hydrogeological Journal. 20(8):1441-1461.

67
Gogu RC, Dessargues A. 2000. Current trends and future challenges in groundwater
vulnerability assessment using overlay and index methods. Environmental
Geology 39(6):549-559.
Graves RP. 1989. Water resources of the Humacao-Naguabo area, eastern Puerto Rico,
U.S. Geological Survey Water-Resources Investigations Report 87-4088. San
Juan, PR.
Hoehn E, Cirpka OA. 2006. Assessing residence times of hyporheic ground water in two
alluvial flood plains of the Southern Alps using water temperature and tracers.
Hydrology and Earth Systems Science. 10:553-563.
Hunter JM, Arbona SI. 1995. Paradise lost: an introduction to the geography of water
pollution in Puerto Rico. Journal of Society, Science, and Medicine 40(10):1331-
1355.
Jones IC, Banner JL. 2003. Estimating recharge thresholds in tropical karst island
aquifers: Barbados, Puerto Rico and Guam. Journal of Hydrology. 278:131-143.
Kuniansky EL, Gómez-Gómez F, Torres-Gonzáles S. 2003. Effects of aquifer
development and changes in irrigation practices on ground-water availability in
the Santa Isabel area, Puerto Rico. United States Geological Survey Water-
Resources Investigative Report 03-4303. San Juan, PR.
Kuniansky EL, Rodríguez JM. 2010. Effects of Changes in Irrigation Practices and
Agricultural Development on Ground Water Discharge to the Jobos Bay National
Estuary Research Reserve near Salinas, Puerto Rico. United States Geological
Survey Scientific Investigations Report 2010-5022. San Juan, PR.
Larsen MC. 2000. Analysis of 20th century rainfall and streamflow to characterize
drought and water resources in Puerto Rico. Physical Geography. 21(6):494-521.
Lugo AE, Castro LM, Vale A, del Mar López T, Hernández PE, García Martinó A, Puente
Rolón AR, Tossas AG, McFarlane DA, Miller T, Rodríguez A, Lundberg J,

68
Thomlinson J, Colón J, Schellekens JH, Ramos O, Helmer E. 2001. Puerto Rican
karst—A vital resource. United States Forest Service General Technical Report
WO-65.
Molina-Giraldo N, Bayer P, Blum P, Cirpka OA. 2011. Propagation of seasonal
temperature signals into an aquifer upon bank infiltration. Ground Water
49(4):491-502.
Molina-Rivera WL, Gómez-Gómez F. 2008. Estimated water use in Puerto Rico, 2005.
United States Geological Survey Open File Report 2008-1286. San Juan, PR.
Olcott PG. 1999. Groundwater atlas of the United States: Alaska, Hawaii, Puerto Rico
and the United States Virgin Islands. HA 730 N. Puerto Rico and the United
States Virgin Islands North Coast Limestone aquifer system. [Internet] Available
on http://pubs.usgs.gov/ha/ha730N/ch_n/N-PR_VINorth_Coast.html. (Accessed
on 5 March 2016).
Osborne, ED. 1986. Acid rain in Puerto Rico. Final technical report to U.S. Department
of the Interior. Project #G930-02. Grant Agreement #14-08-0001-G930.
Engineering Research Center. University of Puerto Rico in Mayagüez.
Pérez-Blair F. 1996. Ground Water Resources of Alluvial Valleys in Northeastern Puerto
Rico—Río Espíritu Santo to Río Demajaua Area. United States Geological
Survey Water Resources Investigations Report 96-4201. San Juan, PR.
Puerto Rico Electric Power Authority (PREPA). 2013. [Internet] Available on
http://www.aeepr.com/ (Cited on 20 August 2013).
Puerto Rico Department of Health. 2005. Public Health Assessment—Pesticide
Warehouse III, Palo Alto, Manati County, Puerto Rico EPA Facility ID:
PRD987367299. U.S. Department of Health and Human Services, Agency for
Toxic Substances and Disease Registry. [Internet] Available on
69
http://www.atsdr.cdc.gov/hac/pha/pesticidewarehouseiii/pesticidewarehousepha0
90905 (Cited 25 May 2012).
Renken RA, Ward WC, Gill IP, Gómez-Gómez F, Rodríguez-Martínez J. 2002. Geology
and Hydrogeology of the Caribbean Islands Aquifer System of the
Commonwealth of Puerto Rico and the U.S. Virgin Islands: U.S. Geological
Survey Professional Paper 1419. Reston, VA.
Richards RT. 2003. The barometric efficiency of observation wells in Puerto Rico and
the U.S. Virgin Islands. Unpublished Masters Thesis, Physics Department,
University of Puerto Rico at Río Piedras. San Juan, PR.
Rodríguez JM. 1996. Characterization of stormwater discharges at the San Isidro
Industrial Park, Canóvanas, Puerto Rico. U.S. Geological Survey Open-File
Report 96-348. San Juan, PR.
Rodríguez JM. 1999. Characterization of stormwater discharges at the Guanajibo
Industrial Park, Mayagüez, Puerto Rico, 1997-98. U.S. Geological Survey Water-
Resources Investigations Report. San Juan, PR.
Rodríguez JM. 2001. Characterization of stormwater discharges from Las Flores
Industrial Park, Río Grande, Puerto Rico, 1998-99. U.S. Geological Survey
Open-File Report. San Juan, PR.
Rodríguez JM. 2012, Evaluation of groundwater quality and selected hydrologic
conditions in the South Coast Aquifer, Santa Isabel area, Puerto Rico, 2008-09:
U.S. Geological Survey Scientific Investigations Report 2012-5254. San Juan,
PR.
Rodríguez-Martínez J. 1997. Characterization of springflow in the North Coast
Limestone of Puerto Rico using physical, chemical, and stable isotopic methods.
U.S. Geological Survey Water-Resources Investigations Report 97-4122. San
Juan, PR.

70
Ryan M, Meiman J. 1996. An Examination of Short-Term Variations in Water Quality at a
Spring in Kentucky. Ground Water 34(1): 23-30.
Sampat P. 2000. Deep trouble: The hidden threat of ground water pollution. Worldwatch
Paper 154, Worldwatch Institute, Washington DC.
Torres-González A. 1985. Simulation of ground-water flow in the water table aquifer near
Barceloneta, Puerto Rico. United States Geological Survey Water-Resources
Investigations Report 844113. San Juan, PR.
Torres-González S, Planert M, Rodríguez JM. 1996. Hydrogeological and simulation of
the ground-water flow in the upper aquifer of the Río Camuy to Río Grande de
Manatí, Puerto Rico. United States Geological Survey Water Resources
Investigations Report 95-4286. San Juan, PR.
Troester JW. 1999. Geochemistry and hydrogeologic framework of the saline-freshwater
interface and the calculation of net recharge in the Dorado area, north-central
Puerto Rico, U.S. Geological Survey Water-Resources Investigations Report 98-
4030. San Juan, PR.
Tucci P, Martínez MI. 1995. Hydrology and simulation of ground-water flow in the
Aguadilla to Río Camuy area, Puerto Rico. U.S. Geological Survey Water
Resources Investigations Report 95-4028. San Juan, PR.
United States Census Bureau (USCB). 2013. Population and Housing Unit Estimates
[Internet] Available on http://www.census.gov (Cited 2 November 2013).
United States Geological Survey (USGS). 2015. Groundwater Levels for Puerto Rico
[Internet] Available on http://nwis.waterdata.usgs.gov/pr/nwis/gwlevels (Cited on
11 October 2015).

71
Chapter Four
Overall Conclusions
Globally, the management of freshwater resources will be extremely important in
the 21st century. As this is being written in January 2014, drought-related emergencies
have been declared in parts of 11 states in the western United States (Daniel 2014).
Human emissions of greenhouse gasses will cause the average temperature of the
Earth to rise. Global climate change will affect water supply in many parts of the world,
the exact nature of these changes is impossible to predict.
Is the average annual rainfall in Puerto Rico increasing or decreasing? If the
analysis is restricted to the 20th century (1900 to 1999), then there are significant
decreases in rainfall in Puerto Rico. When the analysis includes the first 14 years of the
21st century (2000 to 2013) then there are significant increases in rainfall. Rainfall in
Puerto Rico has decadal-scale patterns that are not fully understood.
The management of fresh-water resources requires data collected in a consistent
manner. Data need to be internally consistent at the same location for decades and to
be externally consistent with data collected in other parts of the world. Data are more
valuable if they are available to the public in all parts of the world. In the early 21st
century the best method to make data available is the Internet.
In the last six years the world has had the largest economic crisis in 70 years. All
over the world governments are looking for places to cut expenses. Globally the largest
provider of hydrologic data on the Internet is the USGS, which has about 8000 gaging
stations in the United States and 712 that have or will be closed due to funding problems
(USGS 2014).
One way to do high quality but cost-effective science is to learn new things from
existing data sources. The core of this doctoral dissertation is two articles that were
designed to be submitted for publication. The first article starts with a simple model,

72
develops two hypotheses, and then tests them seven times on six islands with data that
are publically available on the Internet. The article predicts patterns on thousands of
islands were publically-available data are from sparse to non-existent. The trade winds
blow from the east on thousands of oceanic tropical islands, the hypotheses are that the
consistency of the easterly winds means that compared to the eastern part of the same
island, the western part will have lower relative humidity and a larger diurnal air
temperature cycle.
The hypotheses were verified five of the seven times. The probability that this
would occur by chance is six in a million trials. The western part of oceanic tropical
islands are drier and a have a larger diurnal air temperature cycle. These conditions
affect other aspects of the environment which can be manifested in many ways. In dry
air clouds will form at higher elevation. It may be possible to use NWS radar data to
demonstrate that clouds from at higher elevation in western Puerto Rico. The east-west
gradients in climate may affect the distribution of flora, fauna, bacteria, and fungi. There
may be trees that grow at higher elevation in the western part of the island. One such
tree may be the water-loving common bamboo (Bambusa vulgaris).
Compared to the eastern end of the island, the western end of islands have a
larger diurnal air temperature cycle and are cooler at night. It may be possible to build
buildings that capture this coolness at night and release it during the day. The net result
would be a building that is a comfortable place for human beings but uses less electricity
for air conditioning. On many oceanic tropical islands virtually all electricity is produced
by burning fossil fuels that emit contamination and greenhouse gasses.
The second article uses the correlation between ground-water level and
temperature to identify the areas in Puerto Rico at the highest risk to surficial
contamination. The hypothesis of the study is that the karst upper unit of the NCL as a
unit would be at more risk than non-karst aquifers. Compared to the non-karst SCP

73
aquifer, the upper unit of the karst NCL aquifer does have a higher Pearson correlation
coefficient between ground-water levels and temperatures but the intra-aquifer variability
prevents it from being significant. The area at highest risk is not the karst NCL as a
whole but two smaller areas within it. The two areas at high risk are in the adjoining
municipalities of Quebradillas-Camuy and Manatí-Vega Baja. In areas where the karst
aquifer is overlain by unconsolidated alluvium then the travel time from raindrop to
aquifer recharge is longer and the risk is lower.
The data for the second study was the unpublished hourly ground-water levels
and temperature that the USGS-CWSC collected with pressure transducers. The
temperature data was never intended to be used except with the pressure data to
calculate the water level. The temperature data are the free unintended byproduct of the
switch from floats and counterweights to pressure transducers. The methodology of this
study can probably be applied to other parts of the world. Over the past 20 years, many
hydrologic agencies have switched from floats and counterweights to pressure
transducers. Many of the hydrologic agencies probably have unused temperature data.
In many karst areas of the world there are probably aquifers similar to the NCL of Puerto
Rico. The tropical karst of Puerto Rico has often been compared to China and Southeast
Asia where similar conditions exist on a much larger scale.
This dissertation has been successful in demonstrating how existing data can be
analyzed in new ways to learn new things about water and other natural resources. The
model of how the easterly trade winds shapes the climate should be useful in other
oceanic tropical islands which have less data than Puerto Rico. There are probably are
karst areas in the world where hydrologic agencies already have the temperature data
that can help them determine areas where the ground-water resources are most at risk
from superficial contamination.

74
Literature Cited in Chapter Four
Daniel M. 2014. Major drought for U.S. west, including California. [Internet] Available on
http:earthsky.org/earth/drought-for-u-s-west-including-California (Cited 20
January 2104).
United States Geological Survey (USGS). 2014. USGS threatened and endangered
stations. [Internet] Available on
http://streamstatsags.cr.usgs.gov/ThreatenedGages/ThreatenedGages.html
(Cited 20 January 2014).

75

76
Appendix I Data about the observation wells used in the study of aquifer vulnerability.
______________________________________________________________________
Rank Name ID Cata Munb Aqc Begin Months rd Depth- Visits
to-water
mm/yy (m)
1 Cbgar 182647066552400 pse Quebradillas NCLuf 7/05 18 0.99 127 238
2 Zanja 4 182723066511200 ps Camuy NCLu 8/99 18 0.92 94 169
g JBNERR
East 1 175711066143600 scih Salinas SCPi 10/06 12 0.92 1 87
3 Hill 2 182506055280200 sci Manatí NCLu 12/06 18 0.92 83 83
4 Palo
Alto 2 182614066261500 sci Vega Baja NCLu 6/02 18 0.89 73 47
5 Jobitos 175843066244100 agj Santa Isabel SCP 4/05 16 0.77 12 209
6 Cabo
Rojo P1 180542067084000 ps Cabo Rojo ROPk 7/04 18 0.73 8 145
7 Albergue
de Ninos 180045066381600 orl Ponce SCP 7/05 18 0.67 6 157
8 Griv 182737066370900 ag Arecibo NCLu 4/05 12 0.65 16 276
9 Pampanos
2 182330066185700 ps Vega Alta NCLlm 2/00 18 0.62 14 23

77
Appendix I (continued page 2)
Rank Name ID Cat Mun Aq begin months r Depth- Visits
to-water
(m)
10 Constancia
3 175934066364800 ag Ponce SCP 5/06 12 0.57 3 158
11 Restaurada
8A 175950066344200 ps Ponce SCP 11/05 16 0.34 7 198
12 Bar 1 182657066454700 ag Arecibo NCLu 1/02 18 0.33 49 52
13 Bldg 652 182531066075900 sci Guaynabo NCLu 1/05 18 0.16 2 132
14 A RASA 175833066145800 sci Salinas SCP 8/05 14 0.15 15 224
15 Tiburones 182626066345100 ps Barceloneta NCLu 12/06 18 0.10 89 156
16 Alomar
Oeste 175734066233300 sci Santa Isabel SCP 12/06 18 0.10 5 240
17 Higuillar 4 182620066163403 sci Dorado NCLu 5/05 17 0.06 11 109
18 Gmar 182308066260400 ag Vega Baja NCLl 10/01 12 0.04 13 285
19 Maguayo 2 182548066164401 sci Dorado NCLu 1/05 15 -0.01 7 145
20 Saltos 182422067015100 ps Isabela NCLl 2/07 16 -0.08 12 230
21 Coqui 1 Btr 175809066133100 ps Salinas SCP 8/05 18 -0.09 2 97

78
Appendix I (continued page 3)
Rank Name ID Cat Mun Aq Begin Months r Depth- Visits
to-water
(m)
22 Rio
Fajardo 12 181817065382701 sci Fajardo ROP 7/05 12 -0.13 2 97
23 Lve 180156066434000 ps Peñuelas ROP 1/00 18 -0.17 7 166
24 Aguadilla Cement
North 182442067091700 indn Aguadilla NCLl 7/06 12 -0.17 1 233
25 CA-1 181217065453000 sci Naguabo ROP 4/05 18 -0.18 2 127
26 Alomar 1 175829066232200 ag Santa Isabel SCP 9/05 18 -0.36 12 313
27 RASA D 175910066155500 sci Salinas SCP 4/06 12 -0.43 11 148
28 JBNERR
West 1 175721066151400 sci Salinas SCP 8/06 12 -0.47 0.4 86
29 Villodas 175841066102200 ps Guayama SCP 11/99 17 -0.51 7 36
30 Cab 1 180002066261500 ag Juana Díaz SCP 4/00 18 -0.62 11 182
31 Campanilla
Navy 182530066135800 ps Toa Baja NCLu 5/05 18 -0.72 3 255

79
Appendix I (continued page 4)
Rank Name ID Cat Mun Aq Begin Months r Depth Visits
32 Tortuguero
3 182712066251700 sci Vega Baja NCLu 7/05 18 -0.83 7 85
______________________________________________________________________
a Cat is category. h sci is scientific.
b Mun is municipality. i SCP is South Coastal Plain
c Aq is aquifer. j ag is agricultural.
d r is Pearson correlation coefficient. k ROP is rest of Puerto Rico
e ps is public supply l or is orphanage
f NCLu is the upper unit of the North Coast Limestone m NCLl is the lower unit of the North Coast Limestone
g This station was not ranked because the water level is n Ind is industrial
controlled by tides and the pumping of nearby
production wells and not rainfall.