UNIVERSAL INVESTMENT
53
ABSALON Annual Report as of December 31, 2020 Société d’Investissement à Capital Variable R.C.S. Lux B 195.023 Management Company and Domicilary: UNIVERSAL _,,,) INVESTMENT LUXEMBOURG
Transcript of UNIVERSAL INVESTMENT

ABSALON
Annual Report
as of December 31, 2020
Société d’Investissement à Capital Variable
R.C.S. Lux B 195.023
Management Company and Domicilary:
UNIVERSAL _,,,) INVESTMENT
LUXEMBOURG

ABSALON
Table of Contents
Organisation 3
Report of the Board of Directors 4
Derivative Exposure 4
Risk Management 5
Remuneration Policy of the Management Company 6
Remuneration Policy of the Portfolio Manager 6
Report of the Portfolio Manager 7 - 8
Combined Statement of Net Assets 9
Combined Statement of Operations 10 - 11
Combined Statement of Changes in Net Assets 12
ABSALON - EM Corporate Debt
Fund Structure 13
Statement of Net Assets 14 - 21
Derivatives 22 - 23
Statement of Operations 24 - 25
Statement of Changes in Net Assets 26
Statistical Information 27 - 31
ABSALON - Global High Yield
Fund Structure 32
Statement of Net Assets 33 - 38
Derivatives 39 - 40
Statement of Operations 41 - 42
Statement of Changes in Net Assets 43
Statistical Information 44 - 45
Notes to the Financial Statements 46 - 51
Report of the Réviseur d’Entreprises agréé 52 - 53
Page 2

ABSALON
Organisation
Registered Office Supervisory Board of the Management Company Paying Agent Austria
ABSALON Chairman of the Supervisory Board Erste Bank der oesterreichischen Sparkassen AG
R.C.S. Lux B 195.023 Am Belvedere 1, A - 1100 Vienna
15, rue de Flaxweiler, L - 6776 Grevenmacher Michael Reinhard
Spokesman of the Management Board of Representative Switzerland
Board of Directors Universal-Investment-Gesellschaft mbH, Frankfurt am Main
1741 Fund Solutions AG
Helle Bendorff Members of the Supervisory Board Burggraben 16, CH - 9000 St. Gallen
Chairwoman of the Board
Head of Institutional Client Management, Absalon Capital Fondsmæglerselskab A/S Frank Eggloff Paying Agent Switzerland
Member of the Management Board of
Jens Philip Hage Universal-Investment-Gesellschaft mbH, Frankfurt am Main Tellco AG
Member of the Board Bahnhofstraße 4, CH - 6431 Schwyz
Director Sales, Absalon Capital Fondsmæglerselskab A/S Markus Neubauer
Member of the Management Board of Distributor and Portfolio Manager
Daniel Flück Universal-Investment-Gesellschaft mbH, Frankfurt am Main
Member of the Board Formuepleje A/S
Director Sales, Universal-Investment-Gesellschaft mbH Management Board of the Management Company Værkmestergade 25, DK - 8000 Århus C
Jhon Mortensen Chairman of the Management Board Cabinet de révision agréé
Member of the Board
Independant Director Sean O`Driscoll KPMG Luxembourg, Société coopérative
Countryhead & Head of Management Board of 39, avenue John F. Kennedy, L - 1855 Luxembourg
Management Company, Domicilary and Corporate Agent Universal-Investment-Luxembourg S.A., Grevenmacher
Universal-Investment-Luxembourg S.A. Members of the Management BoardR.C.S. Lux B 75.014
15, rue de Flaxweiler, L - 6776 Grevenmacher Stefan Rockel (until December 31, 2020)
Universal-Investment-Luxembourg S.A., Grevenmacher
Depositary Bank, Paying Agent, Registrar and Transfer Agent
BROWN BROTHERS HARRIMAN (Luxembourg) S.C.A. Matthias Müller
80, route d'Esch, L - 1470 Luxembourg Universal-Investment-Luxembourg S.A., Grevenmacher
Page 3

ABSALON
Share class ISIN Net asset value in currency Performance of
the share price in % *)
ABSALON - EM Corporate Debt-R EUR LU1138630725 3,312,937.45 1.60
ABSALON - EM Corporate Debt-I EUR LU1138630998 156,780,383.63 2.61
ABSALON - EM Corporate Debt-I GBP (since February 18, 2020) LU1138631020 18,396,286.95 -0.56
ABSALON - EM Corporate Debt-I USD LU2004511809 11,012,094.44 3.51
ABSALON - EM Corporate Debt-I GBP (dis) (since February 18, 2020) LU2094523912 10,980,769.18 -0.30
ABSALON - Global High Yield-R EUR LU1138630139 3,793,670.11 2.79
ABSALON - Global High Yield-I EUR LU1138630212 190,612,977.43 3.54
*) Performance was recalculated by considering the following distributions: ex-date May 6, 2020 and value date May 8, 2020 ex-date July 31, 2020 and value date August 4, 2020
ABSALON - EM Corporate Debt-R EUR 4.47 EUR per share
ABSALON - EM Corporate Debt-I GBP (dis) (since February 18, 2020) 447.00 GBP per share
ABSALON - Global High Yield-R EUR 5.11 EUR per share
Sub-fund Derivative exposure in %
ABSALON - EM Corporate Debt 90.99
ABSALON - Global High Yield 68.23
The Board of Directors of the Fund has analyzed the current developments in relation to the coronavirus and is satisfied that business continuity plans address on-going operational risks and ensure that the Fund’s activities are not disrupted. As
a result of the Coronavirus there is a high uncertainty to the 2021 performance of all sub-funds. Please refer to the subsequent events paragraph in the notes of the financial statements.
Derivative Exposure (unaudited)
The table below shows the derivative exposure as per December 31, 2020:
As at December 31, 2020, the net assets and the performance of the share price of the sub-funds during the reporting period were as follows:
On 11 March 2020, the World Health Organisation declared the outbreak of COVID-19 as a pandemic. Persistent concerns about the impact of the virus on the global economy and the resulting uncertainty in the valuation of the investments in
this report may therefore lead to significant deviations from the actual value if the investments are sold today. Significant corrections in the market and increased volatility in recent months may have a significant impact on the Fund's future
valuation of the investments. The relevant committees will monitor further developments at national and international level closely, particularly with regard to the economic impact on the fund.
Report of the Board of Directors
Dear Shareholders,
We hereby present to you the annual report of ABSALON, together with its sub-funds ABSALON - EM Corporate Debt and ABSALON - Global High Yield.
ABSALON is organised in Luxembourg as a société d’investissement à capital variable ("SICAV") and qualifies as a collective investment undertaking under Part I of the Luxembourg law of December 17, 2010. The Company qualifies as an
undertaking for collective investment in transferable securities under article 1(2) of the Directive 2009/65/EC and may therefore be offered for sale in any EU Member State, subject to registration.
The Company was established on February 27, 2015 for an indefinite duration.
The Company is presently structured as an umbrella fund.
The share class ABSALON - EM Corporate Debt-I GBP and the share class ABSALON - EM Corporate Debt-I GBP (dis) were launched on February 18, 2020.
Page 4

ABSALON
Sub-fund
ABSALON - EM Corporate Debt
ABSALON - Global High Yield
Sub-fund Lowest VaR Highest VaR Average VaR
ABSALON - EM Corporate Debt 36.64 115.08 69.12
ABSALON - Global High Yield 57.36 161.69 102.87
The average leverage during the reporting period is shown below:
Sub-fund Average leverage in %
ABSALON - EM Corporate Debt 204.88
ABSALON - Global High Yield 166.79
The VaR is calculated based on a historical simulation and the following parameterization 99% confidence level, 1-day holding period and 1-year observation period.
The VaR of the sub-fund is set in relation to the VaR of the reference portfolio and should not exceed 200% VaR limit utilization.
Risk Management (unaudited)
Derivative-free reference portfolio
100% JP Morgan Emerging Markets Bond Index Global Diversified (USD)
60% BofA Merrill Lynch Global High Yield Index; 20% JP Morgan Emerging Markets Bond Index (EMBI) Global Diversified (USD); 20% MSCI AC World Local
During the period from January 1, 2020 until December 31, 2020 the relative VaR approach has been used for monitoring and measuring the global risk associated with derivatives.
The leverage is calculated in accordance with the sum of notional approach and guidelines specified in CESR/10-788. Hedging and netting effects are not considered in the calculation. Therefore an unleveraged portfolio results in a leverage of
100%.
The derivative-free reference portfolio is shown below:
When determining the global risk exposure of the fund, the Management Company uses the value-at-risk calculation as its risk management procedure for the ABSALON in accordance with CSSF circular (11/512). The relative value-at-risk
method has been used for its sub-funds.
The following VaR key figures have been calculated during the reporting period:
Page 5

ABSALON
The fees of the employees are specified as follows (as of September 30, 2020):
Total of paid remuneration 11.60 Mio. EUR
- thereof fixed fee 9.80 Mio. EUR
- thereof variable fee 1.80 Mio. EUR
Number of employees 105.9 FTE
Amount of paid carried Interest n/a
Total of paid fee to Risktaker 1.90 Mio. EUR
- thereof Executive Managers 1.90 Mio. EUR
- thereof other Risktaker 0.00 Mio. EUR
The remuneration policy is compliant with the requirements of the Management Company.
There were no changes in the remuneration system during the reporting period compared to the prior period.
The fees of the employees are specified as follows (as of December 31, 2020):
Total of paid remuneration 192,919,000.00 DKK
Number of employees 66 FTE
Remuneration Policy of the Portfoliomanager (unaudited)
Remuneration Policy of the Management Company (unaudited)
Details with regard to the remuneration system of the Management Company are available on the website of Universal-Investment-Gesellschaft mbH (http://www.universal-investment.com/en/Remuneration-system-Luxemburg) and in the
Prospectus.
The Remuneration Committee reviews compliance with the remuneration policy once a year. This includes the orientation towards the business strategy, objectives, values and interests of Universal-Investment-Luxembourg S. A. and the funds it
manages, as well as measures to avoid conflicts of interest. There were no findings which would have required an adjustment.
Page 6

ABSALON
Our key focus on companies with strong fundamentals means the portfolio is extremely attractively priced relative to the benchmark and peers. We are in the process of taking profit on some of those bonds that greatly benefit from a weak EM FX,
and re-focus on companies that are more domestically oriented. We expect this rotation will benefit our investors in 2021. Finally, we believe duration will also matter in 2021 as inflation expectations start to rise and consequently the low duration
of the fund will be a benefit. We believe that we can maintain the strong performance momentum we saw in the second half of 2020.
Even though many on-the-run corporate bonds have returned to pre-Covid spread levels, there is still value to be found. Some countries and sectors in the EM corporate debt market are still far from pre-pandemic levels – this is especially the
case for strong companies domiciled in weak economies. Turkish Sisecam is a great example of this. The Company did witness a Covid related hit to earnings during Q2 and Q3 like most companies, but prudent investment and cash management
has meant that Q3 numbers have improved. Leverage is now lower than ultimo 2019 yet bonds trade 50 basis points wider than a year ago. The default rate for EM corporate high yield was 3.5% for 2020 whereas the EM sovereign default rate
was above 19%. It highlights the tail risk in EM sovereign debt with a number of smaller and highly indebted countries that are struggling to pay down their obligations to IMF, World Bank and professional investors. All stakeholders will have to
take some pain to move on. Therefore, we expect to see a significant higher default rate among EM sovereign high yield countries relative to EM corporate high yield companies in 2021.
Other important factors are: 1) Any new Covid-19 mutations that will prolong the global lockdown and make the current known vaccines less effective, 2) global market participants all expect a strong global economic growth for the rest of 2021 – if
key economic numbers start to indicate less favorable outlook than expected markets may readjust accordingly, 3) a sudden change in the expected normalization in US relations with Mr. Biden elected as the new president. Key focus will be the
continued talk between China and US.
Risks for 2021
The main risk to the emerging fixed income is coming from rising inflation and interest rates. Central banks will have to look through a first wave of price hikes driving inflation higher in the short run as the economies reopens during the spring and
summer of 2021, if not, volatility will shoot up in financial markets as interest rates will increase too fast and by too much.
Report of the Portfolio Manager
Absalon – EM Corporate Debt
Performance 2020
The sub-fund delivered a return of 2.61% (ABSALON - EM Corporate Debt-I EUR) which was -1.96% behind of the index (JP Morgan CEMBI BD EUR Hedged) after costs. 2020 was in many ways a non-forgettable year with three very different
time periods. We entered year 2020 on the back of a generally positive view on global economic activity, fully aware that we were in the latter stages of an economic cycle. We aimed to have a fund beta close to one but with the usual value tilt and
off-benchmark positions resulting in a lower rating.
Expectations for 2021
The strong performance of EM corporate spreads during the autumn accelerated in the last quarter of the year. As the stars aligned, the interest in EM corporate debt picked up further and we saw a growing interest for the off-the-run issues where
we have historically had a strong focus. We expect this trend to continue and we see plenty of opportunities that will generate excess return for our investors going forward.
After a short but highly volatile March risky assets started to normalize and the financial markets slowly regained confident. Emerging markets risky assets was a little slower to recover relative to US and Europe, but Emerging Markets posted a
formidable performance during the last quarter of 2020. The outcome and clarity of the US Presidential Election, the USD underperformance in a low-rate environment and the positive news on Covid-19 vaccines formed a solid base for EM risk
assets.
During the last quarter of 2020 Absalon EM Corporate Debt fund performed extremely well and returned close to 7.1% for the quarter after cost. Indonesia excelled with a staggering 17.2% performance (benchmark 9.2%) as most bonds were up
more than 14%. Especially the bonds of the palm oil producer SSMS Plantation rose (from a price of 57 to 71) as the price of palm crude oil continued to rise and ended the year roughly 30% higher. The tire producer Gajah Tunggal also
contributed nicely as bonds returned about 23%.
The strong outperformance in Q4 was unfortunately not enough to catch up with the benchmark and index tracking competitors during 2020. The fund ended the year with a gross return of 3.51% (ABSALON - EM Corporate Debt-I USD) compared
to 5,59% for the benchmark. However, we believe that the current environment will benefit the less liquid and strong value cases that the fund holds.
March 2020 was the second worst month seen in history for EM credit markets; only surpassed by October 2008. At the index level credit spreads more than doubled as the oil price war took hold and the Covid-19 Virus moved from being a local
Chinese problem, to a full blown pandemic; bringing with it a global economic stand still. Most central banks and governments around the world acted promptly to provide liquidity and help with fiscal stimuli which reduced the speed of financial
distress and defaults.
Page 7

ABSALON
Report of the Portfolio Manager
The sub fund delivered a return of 3.54% (ABSALON - Global High Yield-I EUR), which was 1.18% below the fund’s benchmark (ICE Bank of America Global High Yield EUR Hedged) after costs.
We were pleased to see that our fund continued to recover strongly during the fourth quarter, with a gross return of 8.08% compared to 6.18% for the benchmark. But we were not surprised by the recovery in both relative and absolute
performance of the fund following the Covid-19 shock of the spring. In the beginning of 2020, we had been tilting the fund towards higher rating categories than normal and in comparison, to the benchmark. Because of the higher average credit
quality in the fund compared to the benchmark, we were able to keep default activity in the fund around 1% for 2020 compared to more than 6% in the benchmark as Covid-19 hit the world. Because permanent loss of capital in the fund was so low
during 2020, we always believed that the fund would regain lost market values from the initial Covid-19 shock in the spring and eventually outperform the market again.
In an environment of stronger growth and a search for yield in general, we believe that 2021 could produce strong relative performance for the Value and Small Cap factors that our strategy actively has been exploiting since 2006. We believe that
off-benchmark “forgotten” bonds and bonds from out of favor sectors like Insurance, Transportation and Energy has further room to compress versus index during 2021. In a historical context we find backing for such expected outperformance from
smaller bonds and bonds trading wide to their underlying default risk i.e. Value bonds. These bonds typically perform very well compared to index in the aftermath of big recessions. We saw this in the recovery periods of 2003-2007, 2009-2010,
2012-2013, 2016-2017 and 2019.
Absalon – Global High Yield
Performance 2020
We expect corporate credit fundamentals will recoup a considerable portion of the damage inflicted by the sudden stop in the economy during 2020, which should translate into a benign backdrop for rating migrations and defaults. The speed of
mean reversion in US HY defaults has surprised the market to the upside. After peaking in June, the pace of HY defaults has steeply declined over the past few months. On a 12-month trailing basis, the US HY default rate appears to have
reached a peak of 9% in August, edging down to 8% as of the end of October. For 2021, we expect that strong growth will allow defaults to further normalize in the US, and we believe the 12-month trailing default rate will decline below its long-run
average of around 4%. In Europe, defaults have also increased. For context, the 12-month trailing default rate stood at 4% by the end of October. Defaults among European firms were also lower than in the US in the aftermath of the global
financial crisis in 2009. But the gap appears to be more pronounced this time around as a result of different cyclical and structural drivers; 1) Lower exposure of the European HY universe to sectors that have been severely disrupted by the sudden
stop in the economy, 2) The broader direct government support for HY-rated companies in Europe, 3) The relative rigidity of most bankruptcy codes and the inability of companies to strategically default in most European jurisdictions, and 4) The
stronger reliance of European firms on bank lending relative to capital markets. At the same time recovery rates in Europe have outperformed those of the US market very significantly through 2020 and beginning 2021. Hence, the credit related
losses from investing in European credits has been significantly lower than in US credits.
Risks for 2021
The prospects for a strong global recovery in 2021 remain in place as central banks and fiscal policies continue to focus on supporting the economy through the pandemic. The main risk to the high yield market is coming from rising inflation and
interest rates. Central banks will have to look through a first wave of price hikes driving inflation higher in the short run as the economies reopen during the spring and summer of 2021, if not, volatility will shoot up in financial markets as interest
rates will increase too fast and by too much.
Long dated credits with high ratings performed the best during 2020, and Energy related credits performed the worst.
Expectations for 2021
We expect credit spreads will continue to inch toward their pre-pandemic levels. While the near-term growth path may prove bumpy during the next couple of months, vaccine developments, the accommodative stance of monetary policy and fiscal
policy and less headline noise from Brexit and US elections should support credit risk appetite, in our view. Valuations limit long-term upside relative to the stellar performance since late March, however. But credit will likely deliver decent excess
returns and solid Sharpe ratios in 2021.
Page 8

ABSALON
Combined Statement of Net Assets as at December 31, 2020
Market Value
in EUR
%
of Fund Assets *)
Assets
Portfolio at market value 361,293,289.57 91.24
Derivatives 5,291,019.99 1.34
Cash at bank 23,431,479.90 5.92
Interest receivable 6,167,100.85 1.56
Receivables from securities transactions 2,808,906.70 0.71
Receivables from share class transactions 677,755.98 0.17
Total Assets 399,669,552.99 100.93
Liabilities
Loan liabilities -116,898.92 -0.03
Interest payable -26,310.86 -0.01
Management fee payable -767,100.55 -0.19
Depositary Bank fee payable -21,586.38 -0.01
Audit fee payable -17,000.00 0.00
Taxe d'abonnement payable -17,853.87 -0.00
Liabilities from securities transactions -2,669,692.66 --0.67
Other payables -64,763.54 -0.02
Total Liabilities -3,701,206.78 -0.93
Total Net Assets as at December 31, 2020 395,968,346.21 100.00
*) There might be small differences due to rounding.
The combined statement of net assets, the combined statement of operations and the combined statement of changes in net assets consist
of the sum of the statements of each sub-fund.
The notes to the financial statement are an integral part of the annual report. Page 9

ABSALON
Combined Statement of Operations (including income equalisation)
for the period from 01/01/2020 to 31/12/2020Total
I. Income
- Dividends EUR 1,770.20
- Interest on securities EUR 21,773,110.18
- Interest on liquidity investments *) EUR -73,102.22
- Other income EUR 120,023.23
Total income EUR 21,821,801.39
II. Expenses
- Interest on bank overdraft EUR -2,226.93
- Management Company fee EUR -2,758,482.26
- Depositary Bank fee EUR -40,239.52
- Custody service expenses EUR -54,974.55
- Auditing and publication expenses EUR -17,343.25
- Subscription tax ("Taxe d`abonnement") EUR -36,544.47
- Registrar and Transfer Agent fee EUR -53,217.16
- Legal fee EUR -1,996.28
- Foreign withholding taxes EUR -587.09
- Incorporation expenses EUR -609.48
- Equalisation of ordinary expenses EUR -191,733.93
- Other expenses EUR -158,942.77
Total expenses EUR -3,316,897.69
III. Ordinary net result EUR 18,504,903.70
IV. Realised profit/loss on
1. Realised profit on EUR 60,216,232.96
- Securities EUR 16,070,677.54
- Forward exchange transactions EUR 41,597,803.91
- Futures transactions EUR 203,264.48
- Swap transactions EUR 2,047,433.76
- Foreign exchange transactions EUR 297,053.27
2. Realised loss on EUR -51,051,045.28
- Securities EUR -20,294,130.43
- Forward exchange transactions EUR -26,951,869.27
- Futures transactions EUR -1,562,025.84
- Swap transactions EUR -264,609.84
- Foreign exchange transactions EUR -1,978,409.90
Total realised profit/loss EUR 9,165,187.68
*) The position 'interest on liquidity investments' includes negative interest of 90,239.26 EUR.
The notes to the financial statement are an integral part of the annual report. Page 10

ABSALON
Combined Statement of Operations (including income equalisation)
for the period from 01/01/2020 to 31/12/2020Total
V. Net change in unrealised profit/loss
- Net change in unrealised profit EUR 20,900,342.09
- Net change in unrealised loss EUR -29,574,122.57
Total net change in unrealised profit/loss EUR -8,673,780.48
VI. Result of operations for the period EUR 18,996,310.90
The notes to the financial statement are an integral part of the annual report. Page 11
ABSALON
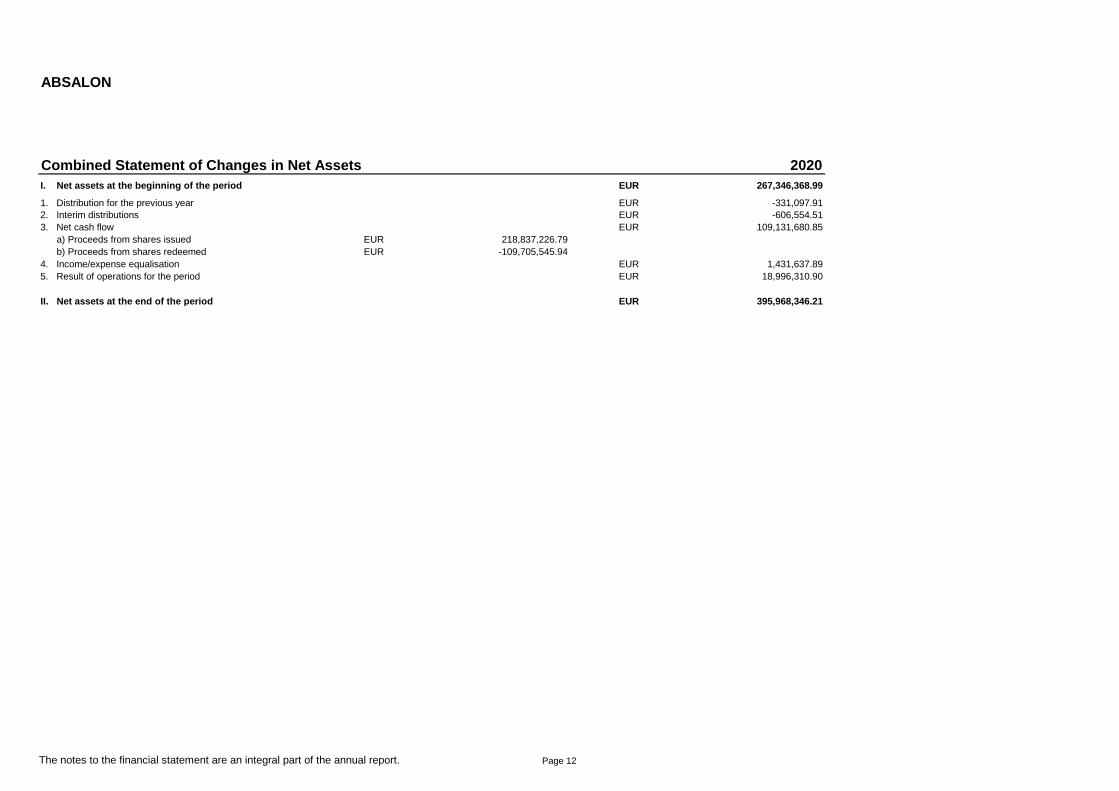
Combined Statement of Changes in Net Assets 2020
I. Net assets at the beginning of the period EUR 267,346,368.99
1. Distribution for the previous year EUR -331,097.91
2. Interim distributions EUR -606,554.51
3. Net cash flow EUR 109,131,680.85
a) Proceeds from shares issued EUR 218,837,226.79
b) Proceeds from shares redeemed EUR -109,705,545.94
4. Income/expense equalisation EUR 1,431,637.89
5. Result of operations for the period EUR 18,996,310.90
II. Net assets at the end of the period EUR 395,968,346.21
The notes to the financial statement are an integral part of the annual report. Page 12
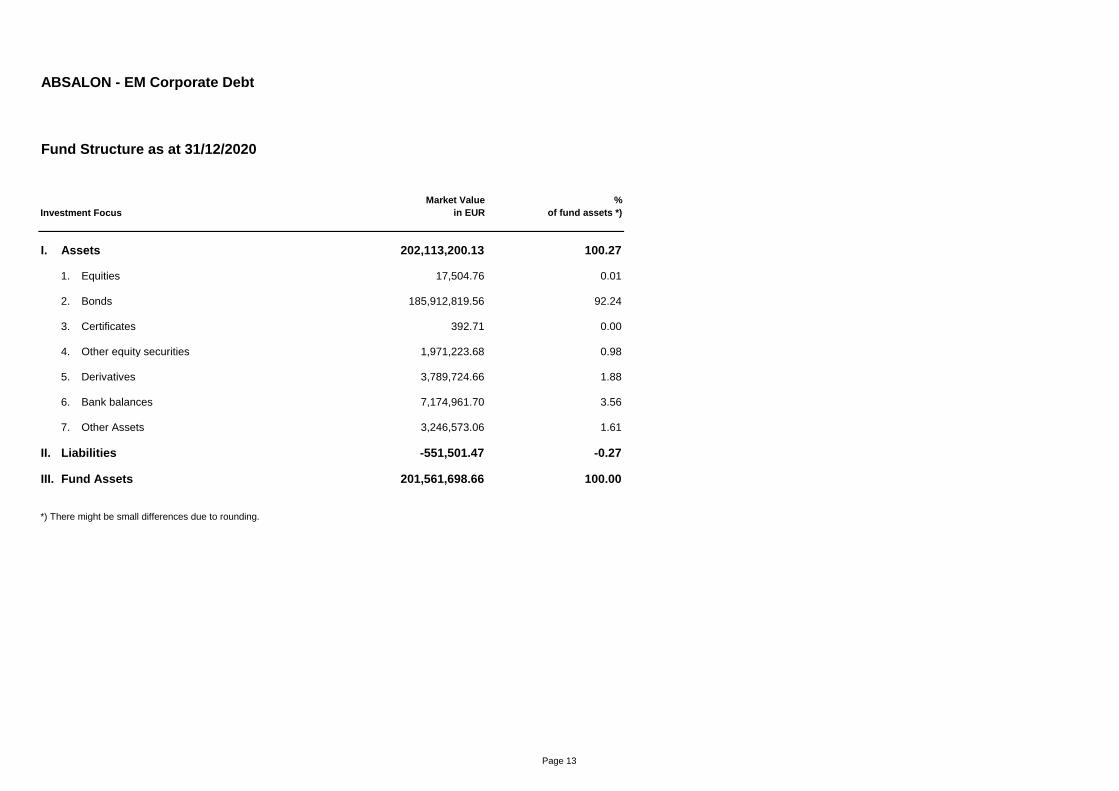
ABSALON - EM Corporate Debt
Fund Structure as at 31/12/2020
Investment Focus
Market Value
in EUR
%
of fund assets *)
I. Assets 202,113,200.13 100.27
1. Equities 17,504.76 0.01
2. Bonds 185,912,819.56 92.24
3. Certificates 392.71 0.00
4. Other equity securities 1,971,223.68 0.98
5. Derivatives 3,789,724.66 1.88
6. Bank balances 7,174,961.70 3.56
7. Other Assets 3,246,573.06 1.61
II. Liabilities -551,501.47 -0.27
III. Fund Assets 201,561,698.66 100.00
*) There might be small differences due to rounding.
Page 13
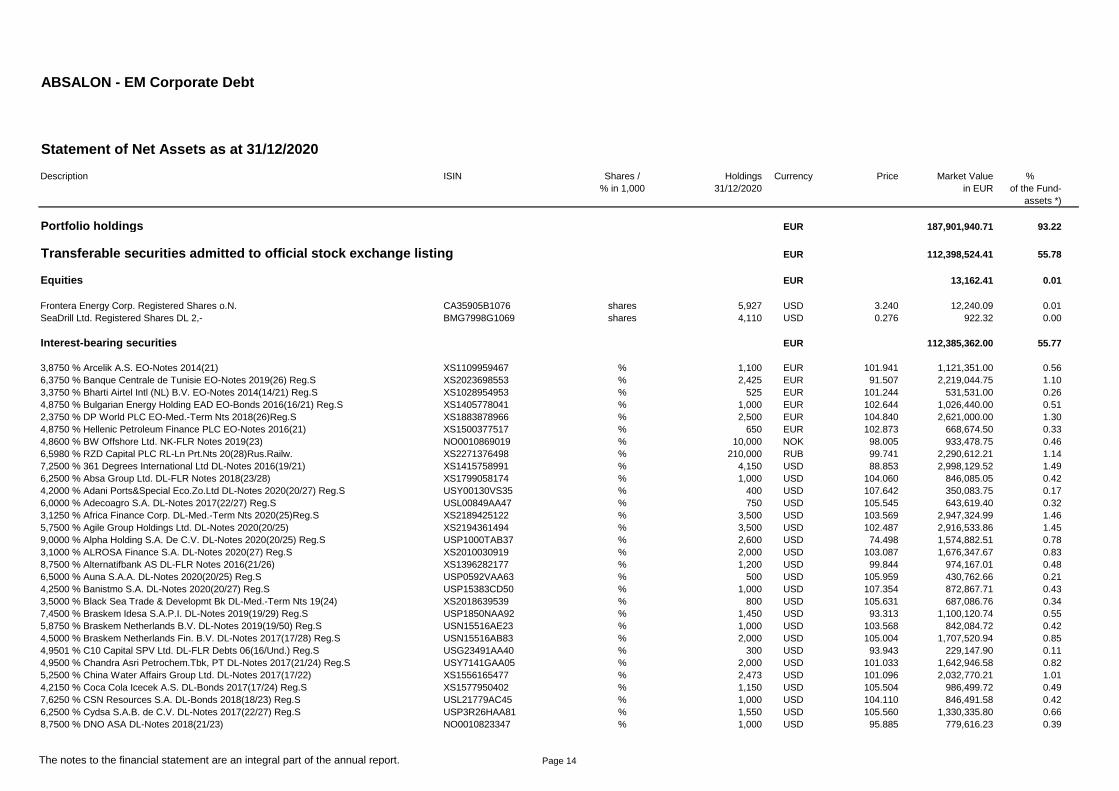
ABSALON - EM Corporate Debt
Statement of Net Assets as at 31/12/2020
Description ISIN Shares / Holdings Currency Price Market Value %
% in 1,000 31/12/2020 in EUR of the Fund-
assets *)
Portfolio holdings EUR 187,901,940.71 93.22
Transferable securities admitted to official stock exchange listing EUR 112,398,524.41 55.78
Equities EUR 13,162.41 0.01
Frontera Energy Corp. Registered Shares o.N. CA35905B1076 shares 5,927 USD 3.240 12,240.09 0.01
SeaDrill Ltd. Registered Shares DL 2,- BMG7998G1069 shares 4,110 USD 0.276 922.32 0.00
Interest-bearing securities EUR 112,385,362.00 55.77
3,8750 % Arcelik A.S. EO-Notes 2014(21) XS1109959467 % 1,100 EUR 101.941 1,121,351.00 0.56
6,3750 % Banque Centrale de Tunisie EO-Notes 2019(26) Reg.S XS2023698553 % 2,425 EUR 91.507 2,219,044.75 1.10
3,3750 % Bharti Airtel Intl (NL) B.V. EO-Notes 2014(14/21) Reg.S XS1028954953 % 525 EUR 101.244 531,531.00 0.26
4,8750 % Bulgarian Energy Holding EAD EO-Bonds 2016(16/21) Reg.S XS1405778041 % 1,000 EUR 102.644 1,026,440.00 0.51
2,3750 % DP World PLC EO-Med.-Term Nts 2018(26)Reg.S XS1883878966 % 2,500 EUR 104.840 2,621,000.00 1.30
4,8750 % Hellenic Petroleum Finance PLC EO-Notes 2016(21) XS1500377517 % 650 EUR 102.873 668,674.50 0.33
4,8600 % BW Offshore Ltd. NK-FLR Notes 2019(23) NO0010869019 % 10,000 NOK 98.005 933,478.75 0.46
6,5980 % RZD Capital PLC RL-Ln Prt.Nts 20(28)Rus.Railw. XS2271376498 % 210,000 RUB 99.741 2,290,612.21 1.14
7,2500 % 361 Degrees International Ltd DL-Notes 2016(19/21) XS1415758991 % 4,150 USD 88.853 2,998,129.52 1.49
6,2500 % Absa Group Ltd. DL-FLR Notes 2018(23/28) XS1799058174 % 1,000 USD 104.060 846,085.05 0.42
4,2000 % Adani Ports&Special Eco.Zo.Ltd DL-Notes 2020(20/27) Reg.S USY00130VS35 % 400 USD 107.642 350,083.75 0.17
6,0000 % Adecoagro S.A. DL-Notes 2017(22/27) Reg.S USL00849AA47 % 750 USD 105.545 643,619.40 0.32
3,1250 % Africa Finance Corp. DL-Med.-Term Nts 2020(25)Reg.S XS2189425122 % 3,500 USD 103.569 2,947,324.99 1.46
5,7500 % Agile Group Holdings Ltd. DL-Notes 2020(20/25) XS2194361494 % 3,500 USD 102.487 2,916,533.86 1.45
9,0000 % Alpha Holding S.A. De C.V. DL-Notes 2020(20/25) Reg.S USP1000TAB37 % 2,600 USD 74.498 1,574,882.51 0.78
3,1000 % ALROSA Finance S.A. DL-Notes 2020(27) Reg.S XS2010030919 % 2,000 USD 103.087 1,676,347.67 0.83
8,7500 % Alternatifbank AS DL-FLR Notes 2016(21/26) XS1396282177 % 1,200 USD 99.844 974,167.01 0.48
6,5000 % Auna S.A.A. DL-Notes 2020(20/25) Reg.S USP0592VAA63 % 500 USD 105.959 430,762.66 0.21
4,2500 % Banistmo S.A. DL-Notes 2020(20/27) Reg.S USP15383CD50 % 1,000 USD 107.354 872,867.71 0.43
3,5000 % Black Sea Trade & Developmt Bk DL-Med.-Term Nts 19(24) XS2018639539 % 800 USD 105.631 687,086.76 0.34
7,4500 % Braskem Idesa S.A.P.I. DL-Notes 2019(19/29) Reg.S USP1850NAA92 % 1,450 USD 93.313 1,100,120.74 0.55
5,8750 % Braskem Netherlands B.V. DL-Notes 2019(19/50) Reg.S USN15516AE23 % 1,000 USD 103.568 842,084.72 0.42
4,5000 % Braskem Netherlands Fin. B.V. DL-Notes 2017(17/28) Reg.S USN15516AB83 % 2,000 USD 105.004 1,707,520.94 0.85
4,9501 % C10 Capital SPV Ltd. DL-FLR Debts 06(16/Und.) Reg.S USG23491AA40 % 300 USD 93.943 229,147.90 0.11
4,9500 % Chandra Asri Petrochem.Tbk, PT DL-Notes 2017(21/24) Reg.S USY7141GAA05 % 2,000 USD 101.033 1,642,946.58 0.82
5,2500 % China Water Affairs Group Ltd. DL-Notes 2017(17/22) XS1556165477 % 2,473 USD 101.096 2,032,770.21 1.01
4,2150 % Coca Cola Icecek A.S. DL-Bonds 2017(17/24) Reg.S XS1577950402 % 1,150 USD 105.504 986,499.72 0.49
7,6250 % CSN Resources S.A. DL-Bonds 2018(18/23) Reg.S USL21779AC45 % 1,000 USD 104.110 846,491.58 0.42
6,2500 % Cydsa S.A.B. de C.V. DL-Notes 2017(22/27) Reg.S USP3R26HAA81 % 1,550 USD 105.560 1,330,335.80 0.66
8,7500 % DNO ASA DL-Notes 2018(21/23) NO0010823347 % 1,000 USD 95.885 779,616.23 0.39
The notes to the financial statement are an integral part of the annual report. Page 14

ABSALON - EM Corporate Debt
Statement of Net Assets as at 31/12/2020
Description ISIN Shares / Holdings Currency Price Market Value %
% in 1,000 31/12/2020 in EUR of the Fund-
assets *)
8,3750 % DNO ASA DL-Notes 2019(22/24) NO0010852643 % 1,400 USD 95.031 1,081,741.61 0.54
8,2500 % Eagle Bulk Shipco LLC DL-Notes 2017(17/18-22) NO0010810872 % 1,215 USD 98.482 972,877.89 0.48
2,6250 % ENN Energy Holdings Ltd. DL-Notes 2020(20/30) Reg.S USG3066LAF88 % 2,100 USD 100.413 1,714,507.68 0.85
4,2500 % Equate Petrochemical B.V. DL-Med.-Term Nts 2016(26)Reg.S XS1513739760 % 2,000 USD 111.722 1,816,765.59 0.90
5,6000 % Future Retail Ltd. DL-Notes 2020(23/25) Reg.S USY267BJGT59 % 1,302 USD 83.917 888,364.37 0.44
6,5000 % Geopark Ltd. DL-Notes 2017(17/24) Reg.S USG38327AA30 % 2,000 USD 104.078 1,692,462.80 0.84
6,4710 % Golar LNG Partners LP DL-FLR Notes 2017(21) NO0010786056 % 2,688 USD 81.314 1,777,089.40 0.88
4,6250 % Golden Eagle Retail Group Ltd. DL-Notes 2013(23) Reg.S USG3958RAB53 % 2,300 USD 102.386 1,914,690.63 0.95
8,8750 % Grupo Kaltex S.A. de C.V. DL-Notes 2017(17/22) Reg.S USP4953VAJ28 % 1,500 USD 71.622 873,510.04 0.43
6,5000 % Jababeka International B.V. DL-Notes 2016(16/23) Reg.S USN4717BAD84 % 2,500 USD 97.226 1,976,298.89 0.98
5,9500 % JSW Steel Ltd. DL-Notes 2019(24) XS1981202861 % 1,950 USD 106.506 1,688,647.04 0.84
4,8750 % Jubilant Pharma Ltd. DL-Notes 2016(16/21) XS1493722299 % 1,050 USD 100.979 574,723.95 0.29
6,0000 % Jubilant Pharma Ltd. DL-Notes 2019(19/24) XS1958658509 % 1,500 USD 105.980 1,292,544.11 0.64
3,5000 % Kia Motors Corp. DL-Notes 2017(27) Reg.S USY47606AH47 % 1,000 USD 109.672 891,714.77 0.44
6,5000 % Koc Holding A.S. DL-Bonds 2019(19/25) Reg.S XS1961766596 % 800 USD 108.755 707,407.11 0.35
3,6250 % LG Chem Ltd. DL-Notes 2019(29) Reg.S USY52758AD47 % 1,750 USD 111.952 1,592,942.52 0.79
4,5000 % Li & Fung Ltd. DL-Med.-T. Notes 2020(20/25) XS2214755345 % 1,750 USD 102.571 1,459,462.15 0.72
4,3750 % Li & Fung Ltd. DL-Medium-Term Notes 2019(24) XS2059681135 % 1,500 USD 102.354 1,248,321.00 0.62
4,9500 % Listrindo Capital B.V. DL-Notes 2016(16/26) Reg.S USN5276YAD87 % 1,300 USD 104.372 1,103,208.39 0.55
7,2500 % LMIRT Capital PTE Ltd. DL-Med.-Term Notes 2019(19/24) XS2010198260 % 2,450 USD 100.850 2,008,964.14 1.00
6,3750 % Medco Bell Pte Ltd. DL-Notes 2020(20/27) Reg.S USY56607AA51 % 2,300 USD 102.378 1,914,541.02 0.95
3,0000 % Meituan DL-Notes 2020(20/30) RegS USG59669AC89 % 800 USD 104.472 679,547.93 0.34
6,5000 % Minerva Luxembourg S.A. DL-Notes 2016(16/26) Reg.S USL6401PAF01 % 1,000 USD 105.278 855,988.29 0.42
4,7550 % MTN (Mauritius) Invest. Ltd. DL-Notes 2014(24) Reg.S XS1128996425 % 1,400 USD 105.896 1,205,418.33 0.60
6,5000 % MTN (Mauritius) Invest. Ltd. DL-Notes 2016(16/26) Reg.S XS1493823725 % 1,500 USD 114.841 1,400,613.87 0.69
5,6500 % Network i2i Ltd. DL-FLR Secs 2019(25/Und.)Reg.S USV6703DAA29 % 2,600 USD 106.750 2,256,687.54 1.12
6,6250 % Oztel Holdings SPC Ltd. DL-Notes 2018(28) Reg.S XS1805476659 % 1,650 USD 108.060 1,449,703.23 0.72
5,3750 % Peru LNG S.R.L. DL-Notes 2018(18/24-30) Reg.S USP7721BAE13 % 3,700 USD 88.660 2,667,224.98 1.32
6,2500 % Powerlong Real Est.Hldgs Ltd. DL-Notes 2020(20/24) XS2213954766 % 1,800 USD 104.069 1,523,084.80 0.76
8,3750 % PT Gajah Tunggal DL-Notes 2017(20/22) XS1655090139 % 1,500 USD 91.964 1,121,603.38 0.56
6,6700 % Renew Clean Energy Private Ltd DL-Notes 2019(21/24) Reg.S USY7275HAA69 % 1,500 USD 105.876 1,291,275.71 0.64
5,8750 % ReNew Power Private Ltd. DL-Notes 2020(20/23-27) Reg.S USY7279WAA90 % 1,500 USD 106.351 1,297,068.87 0.64
5,9000 % RKPF Overseas 2019 (A) Ltd. DL-Notes 2020(20/25) XS2127855711 % 2,000 USD 102.773 1,671,241.56 0.83
5,1000 % Shriram Transport Fin. Co.Ltd. DL-Med.-Term Nts 2020(23)Reg.S USY7758EEF44 % 1,500 USD 102.215 1,246,625.74 0.62
8,3750 % Soechi Capital Pte. Ltd. DL-Notes 2018(18/23) Reg.S USY8078LAA45 % 2,500 USD 69.475 1,412,208.31 0.70
7,7500 % SSMS Plantation Holdings Pte. DL-Notes 2018(21/23) XS1712553418 % 3,250 USD 71.300 1,884,096.27 0.93
5,1250 % TC Ziraat Bankasi A.S. DL-Med.-Term Nts 2017(23)Reg.S XS1691349010 % 1,700 USD 100.231 1,385,419.14 0.69
6,7500 % Theta Capital Pte Ltd. DL-Notes 2016(21/26) XS1506085114 % 2,350 USD 94.978 1,814,767.87 0.90
4,8750 % Turk Telekomunikasyon AS DL-Bonds 2014(24) Reg.S XS1028951264 % 900 USD 103.493 757,327.42 0.38
5,7500 % Turkcell Iletisim Hizmetl. AS DL-Bonds 2015(15/25) Reg.S XS1298711729 % 1,750 USD 107.088 1,523,733.64 0.76
4,5000 % Türkiye Petrol Rafinerileri AS DL-Notes 2017(17/24) Reg.S XS1686704948 % 1,800 USD 99.100 1,450,361.82 0.72
The notes to the financial statement are an integral part of the annual report. Page 15

ABSALON - EM Corporate Debt
Statement of Net Assets as at 31/12/2020
Description ISIN Shares / Holdings Currency Price Market Value %
% in 1,000 31/12/2020 in EUR of the Fund-
assets *)
6,9500 % Türkiye Sise ve Cam Fabri.A.S. DL-Notes 2019(19/26) Reg.S XS1961010987 % 2,200 USD 110.852 1,982,879.91 0.98
5,2500 % Turkiye Vakiflar Bankasi T.A.O DL-Med.-T.Nts 2020(25) Reg.S XS2112797290 % 2,600 USD 98.742 2,087,398.98 1.04
8,2500 % TV Azteca S.A.B. de C.V. DL-Notes 2017(17/24) XS1662406468 % 450 USD 56.704 207,470.53 0.10
6,9500 % Ülker Bisküvi Sanayi A.S. DL-Notes 2020(25) Reg.S XS2241387500 % 1,250 USD 108.494 1,102,670.95 0.55
4,6250 % UPL Corporation Ltd. DL-Notes 2020(20/30) Reg.S XS2189565992 % 1,750 USD 108.544 1,544,450.77 0.77
5,1250 % Vivo Energy Investments B.V. DL-Notes 2020(23/27) Reg.S XS2231814570 % 1,400 USD 106.251 1,209,459.31 0.60
6,1000 % Yapi Ve Kredi Bankasi A.S. DL-Med.-Term Nts 2018(23)Reg.S XS1788516679 % 1,200 USD 102.529 1,000,364.26 0.50
6,9000 % Yestar Healthcare Hldg.Co.Ltd. DL-Notes 2016(16/21) XS1485533944 % 4,405 USD 46.702 1,672,675.10 0.83
3,5000 % Zhongan Online P & C Insurance DL-Notes 2020(20/26) Reg.S XS2223576328 % 4,450 USD 101.312 3,665,650.87 1.82
Transferable securities admitted to or included in organised markets EUR 67,166,171.00 33.32
Equities EUR 4,342.35 0.00
McDermott International Ltd. Registered Shares DL 1 BMG5924V1063 shares 6,513 USD 0.820 4,342.35 0.00
Interest-bearing securities EUR 65,190,604.97 32.34
4,2970 % C10-EUR Capital SPV Ltd. EO-FLR Bonds 2007(17/Und.) XS0300179198 % 1,761 EUR 86.959 1,531,347.99 0.76
4,5000 % Jaguar Land Rover Automotive EO-Notes 2018(18/26) Reg.S XS1881005976 % 1,500 EUR 95.003 1,425,045.00 0.71
5,6250 % Metinvest B.V. EO-Notes 2019(25) Reg.S XS2056722734 % 1,300 EUR 104.578 1,359,514.00 0.67
6,7500 % Walnut Bidco PLC EO-Notes 2019(19/24) Reg.S XS2035469126 % 1,950 EUR 104.260 2,033,070.00 1.01
6,4500 % América Móvil S.A.B. de C.V. MN-Notes 2012(22) XS0860706935 % 12,000 MXN 102.052 500,381.63 0.25
7,8750 % ACI Airport SudAmerica S.A. DL-Nts 2020(20/21-32) 144A 3c7 US00102JAB17 % 955 USD 88.250 685,034.26 0.34
9,3750 % Aeropuertos Argentina 2000 SA DL-Notes 2020(20/21-27) 144A US00786PAD69 % 1,198 USD 86.758 845,334.29 0.42
7,7500 % AES Argentina Generación S.A. DL-Notes 2017(17/24) Reg.S USP1000CAA29 % 500 USD 82.352 334,791.45 0.17
7,1250 % AES Gener S.A. DL-FLR Notes 2019(24/79) Reg.S USP0607LAC74 % 900 USD 111.425 815,371.17 0.40
6,5000 % Ajecorp B.V. DL-Notes 2012(17/22) Reg.S USN01766AA73 % 2,424 USD 100.092 1,972,705.16 0.98
7,8750 % ASG Finance DAC DL-Notes 2019(19/24) Reg.S XS2010038573 % 4,325 USD 87.145 3,064,494.06 1.52
4,3750 % B2W Digital Lux S.à.r.l. DL-Notes 2020(20/30) Reg.S USL0527QAA15 % 800 USD 104.068 676,920.07 0.34
3,5000 % Banco de Credito e Inver.(BCI) DL-Med.-T.Nts 2017(17/27)Reg.S US05890PZA73 % 2,200 USD 111.154 1,988,281.97 0.99
8,5000 % Banco Santander (Mexico) S.A. DL-Notes 2016(22/Und.) US40053CAA36 % 2,000 USD 104.802 1,704,236.12 0.85
5,8750 % BBVA Bancomer SA(Texas Branch) DL-FLR Cap.Nts 19(29/34) Reg.S USP16259AN67 % 1,200 USD 114.765 1,119,749.57 0.56
5,7500 % BRF S.A. DL-Notes 2020(20/50) Reg.S USP1905CAJ91 % 500 USD 111.187 452,016.42 0.22
6,8750 % Capex S.A. DL-Notes 2017(21/24) Reg.S USP20058AC08 % 1,400 USD 88.168 1,003,619.81 0.50
5,4500 % Cemex S.A.B. de C.V. DL-Notes 2019(19/29) Reg.S USP2253TJN02 % 1,000 USD 110.134 895,471.18 0.44
4,5000 % Chelpipe Finance DAC DL-LPN 19(19/24)Reg.S Chelpipe XS2010044548 % 2,500 USD 104.036 2,114,724.77 1.05
4,9500 % Colombia Telecom. S.A. E.S.P. DL-Notes 2020(20/30) Reg.S USP28768AC69 % 500 USD 111.264 452,329.46 0.22
4,7500 % Com. Federal de Electr. (CFE) DL-Notes 2016(16/27) Reg.S USP29595AB42 % 1,700 USD 114.203 1,578,543.78 0.78
4,6250 % Corporación Lindley S.A. DL-Notes 2013(13/21-23) Reg.S USP31442AC34 % 44 USD 104.366 37,337.21 0.02
3,8750 % El Puerto de Liverp. SAB de CV DL-Notes 2016(16/26) Reg.S USP3691NBF61 % 1,500 USD 107.991 1,317,070.49 0.65
The notes to the financial statement are an integral part of the annual report. Page 16

ABSALON - EM Corporate Debt
Statement of Net Assets as at 31/12/2020
Description ISIN Shares / Holdings Currency Price Market Value %
% in 1,000 31/12/2020 in EUR of the Fund-
assets *)
9,7500 % Empr.Distrib. y Com.Norte S.A. DL-Notes 2010(18/22) Reg.S USP3710FAJ32 % 1,050 USD 86.000 734,206.03 0.36
10,2500 % Frigorífico Concepción S.A. DL-Notes 20(20/25) Reg.S Tr.2 USP40568CH10 % 800 USD 98.250 639,076.35 0.32
10,2500 % Frigorífico Concepción S.A. DL-Notes 2020(20/25) Reg.S USP40568BW95 % 2,250 USD 98.272 1,797,804.70 0.89
9,7000 % Frontera Energy Corp. DL-Notes 2018(18/23) Reg.S USC35898AA00 % 1,250 USD 95.019 965,718.76 0.48
8,1250 % Global Liman Isletmeleri A.S. DL-Bonds 2014(18/21) Reg.S XS1132825099 % 1,900 USD 77.940 1,204,049.11 0.60
9,3750 % Grupo IDESA S.A. de C.V. DL-Notes 2020(26) 144A US40053LAB18 % 1,050 USD 47.875 408,693.84 0.20
4,1500 % Industrias Peñoles S.A.B.de CV DL-Notes 2019(19/29) Reg.S USP55409AA77 % 500 USD 113.345 460,789.50 0.23
7,7500 % JSL Europe S.A. DL-Notes 2017(17/24) Reg.S USL5800PAB87 % 2,200 USD 105.810 1,892,690.46 0.94
4,7500 % JSM Global S.à.r.l. DL-Notes 2020(20/30) Reg.S USL5788AAA99 % 800 USD 107.794 701,156.19 0.35
8,5000 % Liquid Telecommunic.Fin. PLC DL-Notes 2017(20/22) Reg.S XS1644418904 % 2,400 USD 102.456 1,999,304.01 0.99
6,8750 % MARB BondCo PLC DL-Notes 2018(21/25) Reg.S USG5825AAB82 % 1,900 USD 103.754 1,602,834.38 0.80
5,3750 % Mersin Ulusl. Liman Isletm.AS DL-Notes 2019(19/24) Reg.S XS2071397850 % 1,250 USD 106.604 1,083,462.07 0.54
6,2500 % Millicom Intl Cellular S.A. DL-Notes 2019(19/29) Reg.S USL6388GHV51 % 1,550 USD 113.100 1,425,359.79 0.71
5,8750 % Nexteer Automotive Group Ltd. DL-Notes 2014(14/21) Reg.S USG6501MAA39 % 2,600 USD 100.070 2,115,472.80 1.05
8,0000 % Nostrum Oil & Gas Finance B.V. DL-Notes 2017(17/22) Reg.S USN64884AB02 % 1,750 USD 23.725 337,578.26 0.17
6,3500 % Odebrecht D.Norbe VIII/IX Ltd. DL-Nts 17(18/18-21) Reg.S Tr.1 USG67106AB35 % 133 USD 95.900 12,477.86 0.01
5,8750 % Petkim Petrokimya Holding AS DL-Notes 2018(21/23) Reg.S XS1747548532 % 1,050 USD 102.404 874,251.57 0.43
7,6900 % Petróleos Mexicanos (PEMEX) DL-Notes 2020(20/50) US71654QDD16 % 1,800 USD 100.765 1,474,729.65 0.73
8,1250 % Petropavlovsk 2016 Ltd. DL-Notes 2017(22/22) Reg.S XS1711554102 % 2,300 USD 104.913 1,961,947.31 0.97
4,5000 % San Miguel Industrias Pet S.A. DL-Notes 2017(17/22) Reg.S USP84523AB85 % 550 USD 102.405 457,945.77 0.23
7,5000 % Sappi Papier Holding GmbH DL-Notes 2002(02/32) Reg.S XS0149581935 % 2,340 USD 98.425 1,872,627.86 0.93
5,8750 % Sasol Financing USA LLC DL-Notes 2018(18/24) US80386WAA36 % 1,200 USD 106.832 1,042,348.16 0.52
12,0000 % Seadrill New Finance Ltd. DL-Notes 2018(18/25) Reg.S USG8000AAA19 % 14 USD 41.475 4,556.21 0.00
9,2500 % SEPLAT Petroleum Devel. Co.PLC DL-Bonds 2018(18/23) Reg.S XS1789190243 % 2,050 USD 103.112 1,718,673.06 0.85
11,0000 % Silknet JSC DL-Notes 2019(22/24) XS1843443430 % 1,950 USD 109.307 1,733,056.75 0.86
7,0000 % Suzano Austria GmbH DL-Notes 2017(17/47) Reg.S USA8372TAC20 % 750 USD 133.862 816,298.07 0.40
8,0000 % Telecom Argentina S.A. DL-Notes 2019(23/26) Reg.S USP9028NAV30 % 500 USD 93.029 378,197.41 0.19
4,8690 % Trust 1401 DL-Notes 2019(19/30) Reg.S USP9401CAA01 % 1,300 USD 114.337 1,208,538.09 0.60
6,6250 % Tupy Overseas S.A. DL-Notes 2014(19/24) Reg.S USL9326VAA46 % 900 USD 102.347 748,941.38 0.37
8,8750 % Unifin Finan. S.A.B. de C.V. DL-FLR Nts 2018(25/Und.) Reg.S USP94461AD52 % 2,300 USD 76.835 1,436,868.85 0.71
7,0000 % Unifin Finan. S.A.B. de C.V. DL-Notes 2017(17/25) Reg.S USP94461AC79 % 1,300 USD 96.069 1,015,445.97 0.50
8,3750 % Unifin Finan. S.A.B. de C.V. DL-Notes 2019(19/28) Reg.S USP9485MAA73 % 1,750 USD 97.206 1,383,124.64 0.69
5,8750 % Usiminas International S.a.r.l DL-Notes 2019(19/26) Reg.S USL95806AA06 % 750 USD 108.949 664,377.19 0.33
9,1250 % Walnut Bidco PLC DL-Notes 2019(19/24) Reg.S USG9410WAA56 % 600 USD 106.167 517,929.91 0.26
8,5000 % YPF S.A. DL-Bonds 2015(15/25) Reg.S USP989MJBE04 % 750 USD 77.614 473,294.58 0.23
8,5000 % YPF S.A. DL-Bonds 2019(19/29) Reg.S USP989MJBP50 % 200 USD 73.418 119,388.57 0.06
Other equity securities EUR 1,971,223.68 0.98
2,5000 % BW Offshore Ltd. DL-Conv. Bonds 2019(24) NO0010867948 % 2,800 USD 86.586 1,971,223.68 0.98
The notes to the financial statement are an integral part of the annual report. Page 17

ABSALON - EM Corporate Debt
Statement of Net Assets as at 31/12/2020
Description ISIN Shares / Holdings Currency Price Market Value %
% in 1,000 31/12/2020 in EUR of the Fund-
assets *)
Other transferable securities EUR 8,337,245.30 4.14
Interest-bearing securities EUR 8,336,852.59 4.14
8,5000 % Sherritt International Corp. CD-Notes 2020(20/26) CA823901AM50 % 915 CAD 54.015 315,021.51 0.16
10,7500 % Sherritt International Corp. CD-Notes 2020(20/29) CA823901AN34 % 191 CAD 21.958 26,731.97 0.01
0,0000 % Ceagro Agricola Ltda DL-Notes 2010(16) Reg.S USP3465UAA62 % 500 USD 2.104 8,553.54 0.00
8,8750 % Credivalores - Crediserv. SAS DL-Notes 2020(20/25) Reg.S USP32086AR44 % 3,100 USD 75.381 1,900,000.81 0.94
9,2500 % Genel Energy Finance 4 Ltd. DL-Notes 2020(20/25) NO0010894330 % 2,200 USD 101.426 1,814,271.08 0.90
10,0000 % Gulf Keystone Petroleum Ltd. DL-Notes 2018(18/23) NO0010828106 % 1,750 USD 102.057 1,452,148.55 0.72
0,0000 % Hilong Holding Ltd DL-Notes 2017(20) XS1628314889 % 2,275 USD 80.410 1,487,379.06 0.74
9,7500 % Noble Trading Hold Co. Ltd. DL-Notes 2018(18/25) 144A XS1912613723 % 73 USD 31.537 18,715.53 0.01
7,3500 % Odebrecht D.Norbe VIII/IX Ltd. DL-Nts 2017(18/26) Reg.S Tr.2 USG67106AC18 % 189 USD 26.232 40,231.86 0.02
6,5000 % UEP Penonome II S.A. DL-Nts 2020(20/38) Reg.S USP9434RAA88 % 1,500 USD 104.443 1,273,798.68 0.63
Certificates EUR 392.71 0.00
Odebrecht Oil & Gas Fin. Ltd. EO/DL Nts 2017(17/Und.) USG6712EAB41 % 92 USD 0.525 392.71 0.00
Total securities EUR 187,901,940.71 93.22
Derivatives EUR 3,789,724.66 1.88
Bank balances, non-securitised money market instruments and money market funds EUR 7,174,961.70 3.56
Bank balances EUR 7,174,961.70 3.56
Balances with Brown Brothers Harriman (Luxembourg) S.C.A.
Balances in the Fund currency
8,414.50 EUR 8,414.50 0.00
The notes to the financial statement are an integral part of the annual report. Page 18

ABSALON - EM Corporate Debt
Statement of Net Assets as at 31/12/2020
Description ISIN Shares / Holdings Currency Price Market Value %
% in 1,000 31/12/2020 in EUR of the Fund-
assets *)
Balances in the Fund currency (Initial Margin)
111,776.50 EUR 111,776.50 0.06
Balances in non-EU/EEA currencies
1,572,333.97 MXN 64,245.60 0.03
Balances in non-EU/EEA currencies (Initial Margin)
304,500.00 USD 247,581.10 0.12
Balances with Goldman Sachs Bank Europe SE
Balances in the Fund currency (Cash Collateral)
500,000.00 EUR 500,000.00 0.25
Balances with Brown Brothers Harriman Trust Co. [Cayman] Ltd.
deposits callable prior to maturity
547.70 CHF 504.42 0.00
61,518.99 DKK 8,270.13 0.00
45,815.93 SEK 4,551.33 0.00
Balances with Banco Bilbao Vizcaya Argentaria Madrid
deposits callable prior to maturity
3,303,664.35 EUR 3,303,664.35 1.64
2,904,544.66 USD 2,361,610.42 1.17
Balances with SUMITOMO Trust BK, London
deposits callable prior to maturity
365,690.76 GBP 404,749.04 0.20
Balances with Royal Bank of Canada CA
deposits callable prior to maturity
183,298.43 CAD 116,832.45 0.06
Balances with Nordea Bank Oslo
deposits callable prior to maturity
448,952.53 NOK 42,761.86 0.02
Other Assets EUR 3,246,573.06 1.61
Interest receivables 3,246,573.06 EUR 3,246,573.06 1.61
Loan liabilities EUR -94,483.50 -0.04
Loans with Brown Brothers Harriman (Luxembourg) S.C.A.
Loans in non-EU/EEA currencies
-18,593.75 USD -15,118.10 -0.01
Loans in non-EU/EEA currencies (Variation Margin)
-85,312.50 USD -69,365.40 -0.03
EUR - loans (Variation Margin)
-10,000.00 EUR -10,000.00 0.00
The notes to the financial statement are an integral part of the annual report. Page 19
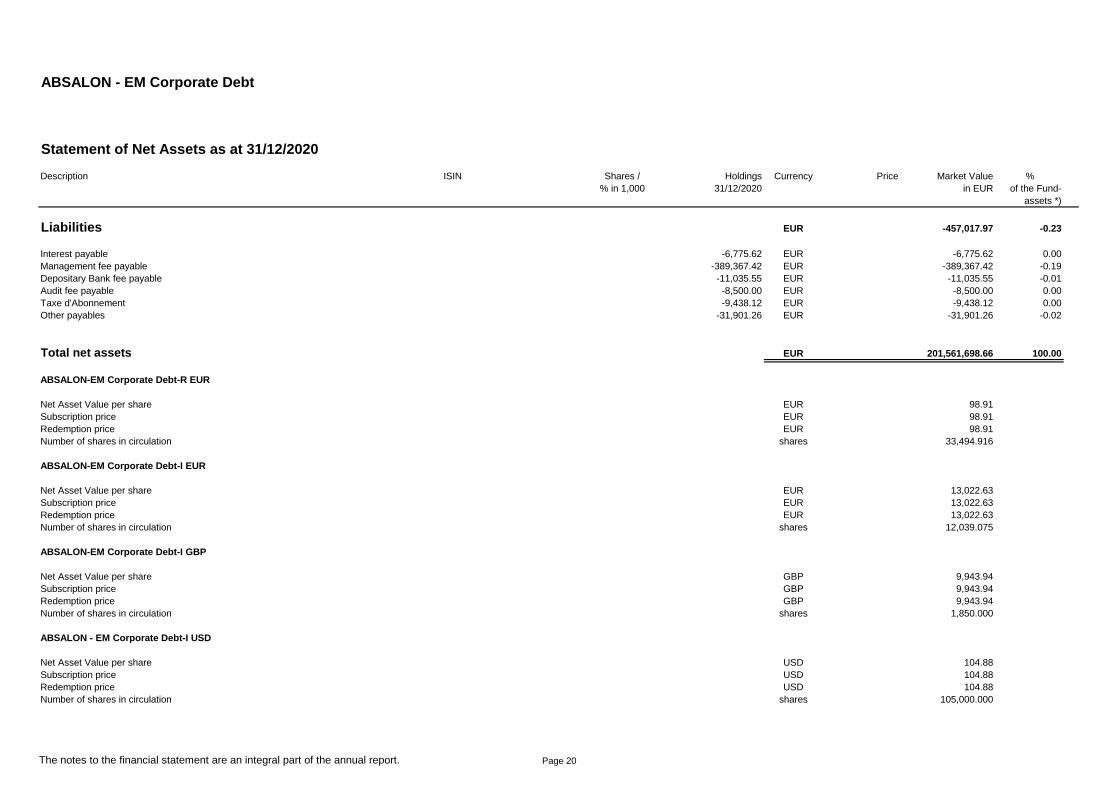
ABSALON - EM Corporate Debt
Statement of Net Assets as at 31/12/2020
Description ISIN Shares / Holdings Currency Price Market Value %
% in 1,000 31/12/2020 in EUR of the Fund-
assets *)
Liabilities EUR -457,017.97 -0.23
Interest payable -6,775.62 EUR -6,775.62 0.00
Management fee payable -389,367.42 EUR -389,367.42 -0.19
Depositary Bank fee payable -11,035.55 EUR -11,035.55 -0.01
Audit fee payable -8,500.00 EUR -8,500.00 0.00
Taxe d'Abonnement -9,438.12 EUR -9,438.12 0.00
Other payables -31,901.26 EUR -31,901.26 -0.02
Total net assets EUR 201,561,698.66 100.00
ABSALON-EM Corporate Debt-R EUR
Net Asset Value per share EUR 98.91
Subscription price EUR 98.91
Redemption price EUR 98.91
Number of shares in circulation shares 33,494.916
ABSALON-EM Corporate Debt-I EUR
Net Asset Value per share EUR 13,022.63
Subscription price EUR 13,022.63
Redemption price EUR 13,022.63
Number of shares in circulation shares 12,039.075
ABSALON-EM Corporate Debt-I GBP
Net Asset Value per share GBP 9,943.94
Subscription price GBP 9,943.94
Redemption price GBP 9,943.94
Number of shares in circulation shares 1,850.000
ABSALON - EM Corporate Debt-I USD
Net Asset Value per share USD 104.88
Subscription price USD 104.88
Redemption price USD 104.88
Number of shares in circulation shares 105,000.000
The notes to the financial statement are an integral part of the annual report. Page 20

ABSALON - EM Corporate Debt
Statement of Net Assets as at 31/12/2020
Description ISIN Shares / Holdings Currency Price Market Value %
% in 1,000 31/12/2020 in EUR of the Fund-
assets *)
ABSALON - EM Corporate Debt-I GBP (dis)
Net Asset Value per share GBP 9,481.10
Subscription price GBP 9,481.10
Redemption price GBP 9,481.10
Number of shares in circulation shares 1,158.175
*) There might be small differences due to rounding.
The notes to the financial statement are an integral part of the annual report. Page 21
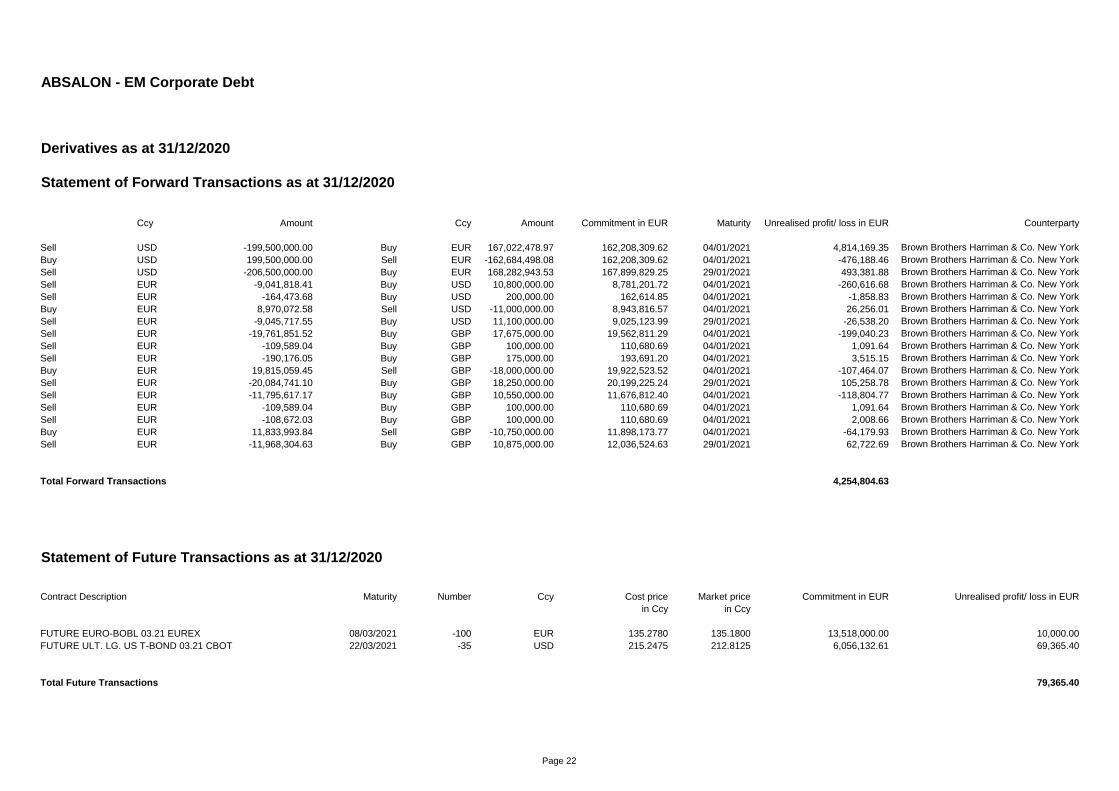
ABSALON - EM Corporate Debt
Derivatives as at 31/12/2020
Statement of Forward Transactions as at 31/12/2020
Ccy Amount Ccy Amount Commitment in EUR Maturity Unrealised profit/ loss in EUR Counterparty
Sell USD -199,500,000.00 Buy EUR 167,022,478.97 162,208,309.62 04/01/2021 4,814,169.35 Brown Brothers Harriman & Co. New York
Buy USD 199,500,000.00 Sell EUR -162,684,498.08 162,208,309.62 04/01/2021 -476,188.46 Brown Brothers Harriman & Co. New York
Sell USD -206,500,000.00 Buy EUR 168,282,943.53 167,899,829.25 29/01/2021 493,381.88 Brown Brothers Harriman & Co. New York
Sell EUR -9,041,818.41 Buy USD 10,800,000.00 8,781,201.72 04/01/2021 -260,616.68 Brown Brothers Harriman & Co. New York
Sell EUR -164,473.68 Buy USD 200,000.00 162,614.85 04/01/2021 -1,858.83 Brown Brothers Harriman & Co. New York
Buy EUR 8,970,072.58 Sell USD -11,000,000.00 8,943,816.57 04/01/2021 26,256.01 Brown Brothers Harriman & Co. New York
Sell EUR -9,045,717.55 Buy USD 11,100,000.00 9,025,123.99 29/01/2021 -26,538.20 Brown Brothers Harriman & Co. New York
Sell EUR -19,761,851.52 Buy GBP 17,675,000.00 19,562,811.29 04/01/2021 -199,040.23 Brown Brothers Harriman & Co. New York
Sell EUR -109,589.04 Buy GBP 100,000.00 110,680.69 04/01/2021 1,091.64 Brown Brothers Harriman & Co. New York
Sell EUR -190,176.05 Buy GBP 175,000.00 193,691.20 04/01/2021 3,515.15 Brown Brothers Harriman & Co. New York
Buy EUR 19,815,059.45 Sell GBP -18,000,000.00 19,922,523.52 04/01/2021 -107,464.07 Brown Brothers Harriman & Co. New York
Sell EUR -20,084,741.10 Buy GBP 18,250,000.00 20,199,225.24 29/01/2021 105,258.78 Brown Brothers Harriman & Co. New York
Sell EUR -11,795,617.17 Buy GBP 10,550,000.00 11,676,812.40 04/01/2021 -118,804.77 Brown Brothers Harriman & Co. New York
Sell EUR -109,589.04 Buy GBP 100,000.00 110,680.69 04/01/2021 1,091.64 Brown Brothers Harriman & Co. New York
Sell EUR -108,672.03 Buy GBP 100,000.00 110,680.69 04/01/2021 2,008.66 Brown Brothers Harriman & Co. New York
Buy EUR 11,833,993.84 Sell GBP -10,750,000.00 11,898,173.77 04/01/2021 -64,179.93 Brown Brothers Harriman & Co. New York
Sell EUR -11,968,304.63 Buy GBP 10,875,000.00 12,036,524.63 29/01/2021 62,722.69 Brown Brothers Harriman & Co. New York
Total Forward Transactions 4,254,804.63
Statement of Future Transactions as at 31/12/2020
Contract Description Maturity Number Ccy Cost price Market price Commitment in EUR Unrealised profit/ loss in EUR
in Ccy in Ccy
FUTURE EURO-BOBL 03.21 EUREX 08/03/2021 -100 EUR 135.2780 135.1800 13,518,000.00 10,000.00
FUTURE ULT. LG. US T-BOND 03.21 CBOT 22/03/2021 -35 USD 215.2475 212.8125 6,056,132.61 69,365.40
Total Future Transactions 79,365.40
Page 22
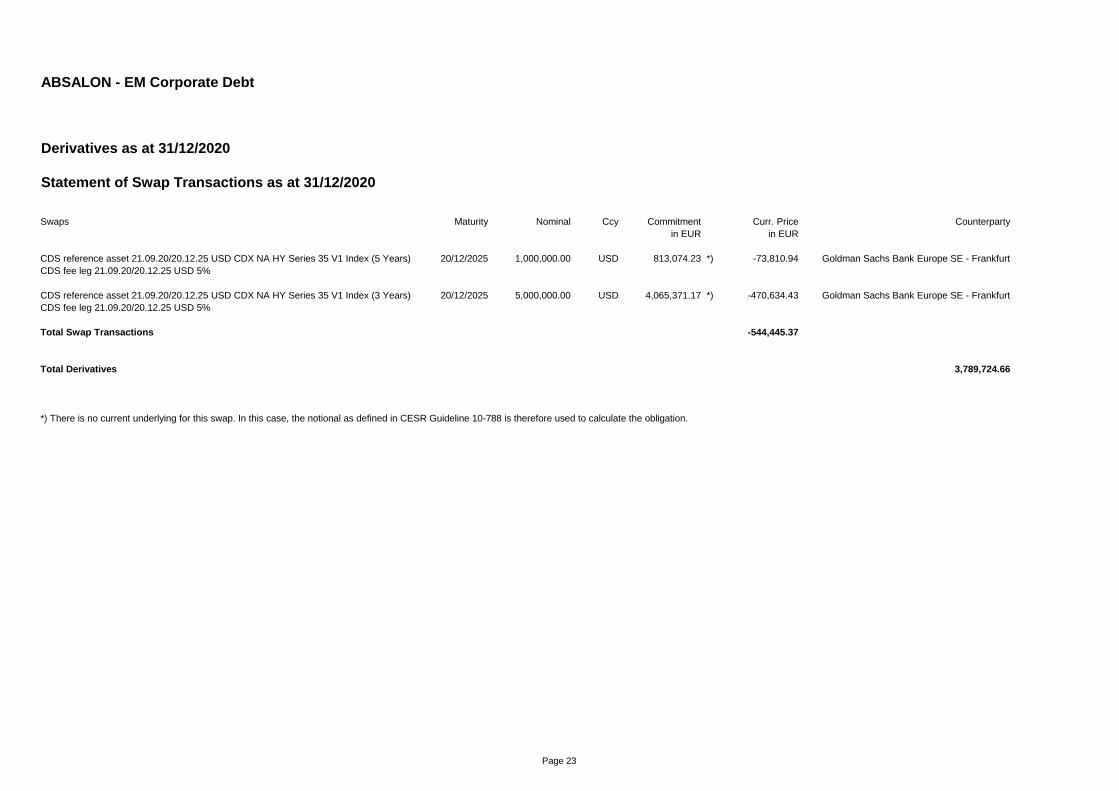
ABSALON - EM Corporate Debt
Derivatives as at 31/12/2020
Statement of Swap Transactions as at 31/12/2020
Swaps Maturity Nominal Ccy Commitment Curr. Price Counterparty
in EUR in EUR
CDS reference asset 21.09.20/20.12.25 USD CDX NA HY Series 35 V1 Index (5 Years) 20/12/2025 1,000,000.00 USD 813,074.23 *) -73,810.94 Goldman Sachs Bank Europe SE - Frankfurt
CDS fee leg 21.09.20/20.12.25 USD 5%
CDS reference asset 21.09.20/20.12.25 USD CDX NA HY Series 35 V1 Index (3 Years) 20/12/2025 5,000,000.00 USD 4,065,371.17 *) -470,634.43 Goldman Sachs Bank Europe SE - Frankfurt
CDS fee leg 21.09.20/20.12.25 USD 5%
Total Swap Transactions -544,445.37
Total Derivatives 3,789,724.66
*) There is no current underlying for this swap. In this case, the notional as defined in CESR Guideline 10-788 is therefore used to calculate the obligation.
Page 23

ABSALON - EM Corporate Debt
Statement of Operations (including income equalisation)
for the period from 01/01/2020 to 31/12/2020Total
I. Income
- Dividends EUR 1,770.20
- Interest on securities EUR 10,953,013.67
- Interest on liquidity investments *) EUR -40,727.06
- Other income EUR 64,422.79
Total income EUR 10,978,479.60
II. Expenses
- Interest on bank overdraft EUR -1,628.72
- Management Company fee EUR -1,428,827.58
- Depositary Bank fee EUR -20,624.09
- Custody service expenses EUR -29,146.80
- Auditing and publication expenses EUR -9,337.04
- Subscription tax ("Taxe d`abonnement") EUR -18,842.25
- Registrar and Transfer Agent fee EUR -28,450.48
- Legal fee EUR -996.28
- Foreign withholding taxes EUR -587.09
- Incorporation expenses EUR -302.36
- Equalisation of ordinary expenses EUR -60,059.22
- Other expenses EUR -100,019.87
Total expenses EUR -1,698,821.78
III. Ordinary net result EUR 9,279,657.82
IV. Realised profit/loss on
1. Realised profit on EUR 31,565,138.17
- Securities EUR 4,570,896.34
- Forward exchange transactions EUR 26,269,597.73
- Futures transactions EUR 154,333.93
- Swap transactions EUR 452,853.82
- Foreign exchange transactions EUR 117,456.35
2. Realised loss on EUR -25,690,484.77
- Securities EUR -4,179,154.89
- Forward exchange transactions EUR -19,202,180.08
- Futures transactions EUR -1,406,365.57
- Swap transactions EUR -69,237.38
- Foreign exchange transactions EUR -833,546.85
Total realised profit/loss EUR 5,874,653.40
*) The position 'interest on liquidity investments' includes negative interest of 46,952.49 EUR.
The notes to the financial statement are an integral part of the annual report. Page 24
ABSALON - EM Corporate Debt
Statement of Operations (including income equalisation)
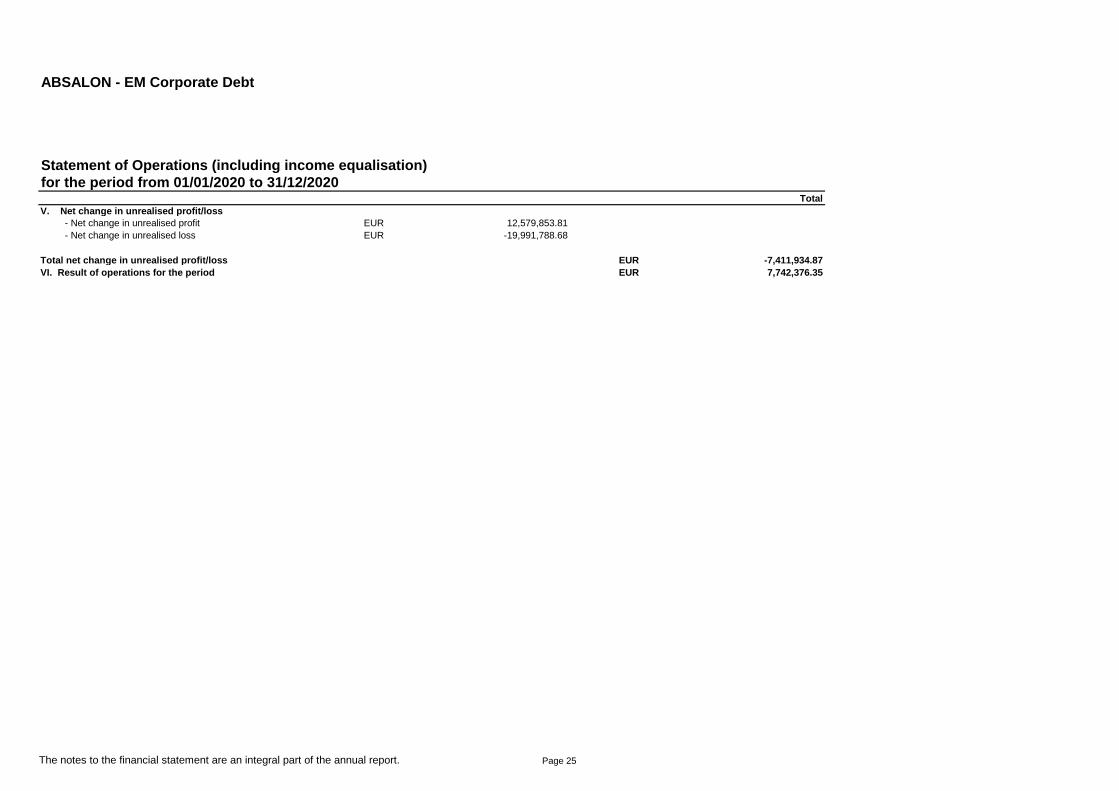
for the period from 01/01/2020 to 31/12/2020Total
V. Net change in unrealised profit/loss
- Net change in unrealised profit EUR 12,579,853.81
- Net change in unrealised loss EUR -19,991,788.68
Total net change in unrealised profit/loss EUR -7,411,934.87
VI. Result of operations for the period EUR 7,742,376.35
The notes to the financial statement are an integral part of the annual report. Page 25

ABSALON - EM Corporate Debt
Statement of Changes in Net Assets 2020
I. Net assets at the beginning of the period EUR 153,338,974.88
1. Distribution for the previous year EUR -151,331.47
2. Interim distributions EUR -606,554.51
3. Net cash flow EUR 40,628,735.82
a) Proceeds from shares issued EUR 92,772,486.62
b) Proceeds from shares redeemed EUR -52,143,750.80
4. Income/expense equalisation EUR 609,497.59
5. Result of operations for the period EUR 7,742,376.35
II. Net assets at the end of the period EUR 201,561,698.66
The notes to the financial statement are an integral part of the annual report. Page 26

ABSALON - EM Corporate Debt
ABSALON - EM Corporate Debt-R EUR
Statistical information
Financial period Number of shares outstanding Total net assets Net Asset Value per share
at the end of the financial period at the end of the financial period at the end of the financial period
2017 Shares 24,825.600 EUR 2,897,987.93 EUR 116.73
2018 Shares 25,567.616 EUR 2,759,552.57 EUR 107.93
2019 Shares 31,714.916 EUR 3,253,885.46 EUR 102.60
2020 Shares 33,494.916 EUR 3,312,937.45 EUR 98.91
Changes in the number of shares outstanding Shares
Number of shares outstanding at the beginning of the period 31,714.916
Number of shares issued 2,330.000
Number of shares redeemed -550.000
Number of shares outstanding at the end of the period 33,494.916
Page 27

ABSALON - EM Corporate Debt
ABSALON - EM Corporate Debt-I EUR
Statistical information
Financial period Number of shares outstanding Total net assets Net Asset Value per share
at the end of the financial period at the end of the financial period at the end of the financial period
2017 Shares 8,720.794 EUR 104,668,401.61 EUR 12,002.16
2018 Shares 8,620.794 EUR 99,155,522.69 EUR 11,501.90
2019 Shares 11,112.708 EUR 141,040,077.45 EUR 12,691.78
2020 Shares 12,039.075 EUR 156,780,383.63 EUR 13,022.63
Changes in the number of shares outstanding Shares
Number of shares outstanding at the beginning of the period 11,112.708
Number of shares issued 5,157.371
Number of shares redeemed -4,231.004
Number of shares outstanding at the end of the period 12,039.075
Page 28

ABSALON - EM Corporate Debt
ABSALON - EM Corporate Debt-I GBP
Statistical information
Financial period Number of shares outstanding Total net assets Net Asset Value per share
at the end of the financial period at the end of the financial period at the end of the financial period
2020 *) Shares 1,850.000 GBP 18,396,286.95 GBP 9,943.94
*) Inception: 18/02/2020
Changes in the number of shares outstanding Shares
Number of shares outstanding at the beginning of the period 0.000
Number of shares issued 1,875.000
Number of shares redeemed -25.000
Number of shares outstanding at the end of the period 1,850.000
Page 29

ABSALON - EM Corporate Debt
ABSALON - EM Corporate Debt-I USD
Statistical information
Financial period Number of shares outstanding Total net assets Net Asset Value per share
at the end of the financial period at the end of the financial period at the end of the financial period
2019 *) Shares 100,000.000 USD 10,132,222.42 USD 101.32
2020 Shares 105,000.000 USD 11,012,094.44 USD 104.88
*) Inception: 08/11/2019
Changes in the number of shares outstanding Shares
Number of shares outstanding at the beginning of the period 100,000.000
Number of shares issued 5,000.000
Number of shares redeemed 0.000
Number of shares outstanding at the end of the period 105,000.000
Page 30

ABSALON - EM Corporate Debt
ABSALON - EM Corporate Debt I GBP (dis)
Statistical information
Financial period Number of shares outstanding Total net assets Net Asset Value per share
at the end of the financial period at the end of the financial period at the end of the financial period
2020 *) Shares 1,158.175 GBP 10,980,769.18 GBP 9,481.10
*) Inception: 18/02/2020
Changes in the number of shares outstanding Shares
Number of shares outstanding at the beginning of the period 0.000
Number of shares issued 1,226.000
Number of shares redeemed -67.825
Number of shares outstanding at the end of the period 1,158.175
Page 31

ABSALON - Global High Yield
Fund structure as at 31/12/2020
Investment Focus
Market Value
in EUR
%
of fund assets *)
I. Assets 197,556,352.86 101.61
1. Equities 8,990.11 0.00
2. Bonds 172,537,545.83 88.75
3. Other equity securities 844,812.92 0.43
4. Derivatives 1,501,295.33 0.77
5. Bank balances 16,256,518.20 8.35
6. Other Assets 6,407,190.47 3.29
II. Liabilities -3,149,705.31 -1.61
III. Fund Assets 194,406,647.55 100.00
*) There might be small differences due to rounding.
Page 32
ABSALON - Global High Yield
Statement of Net Assets as at 31/12/2020
Description ISIN Shares / Holdings Currency Price Market Value %
% in 1,000 31/12/2020 in EUR of the Fund-
assets *)
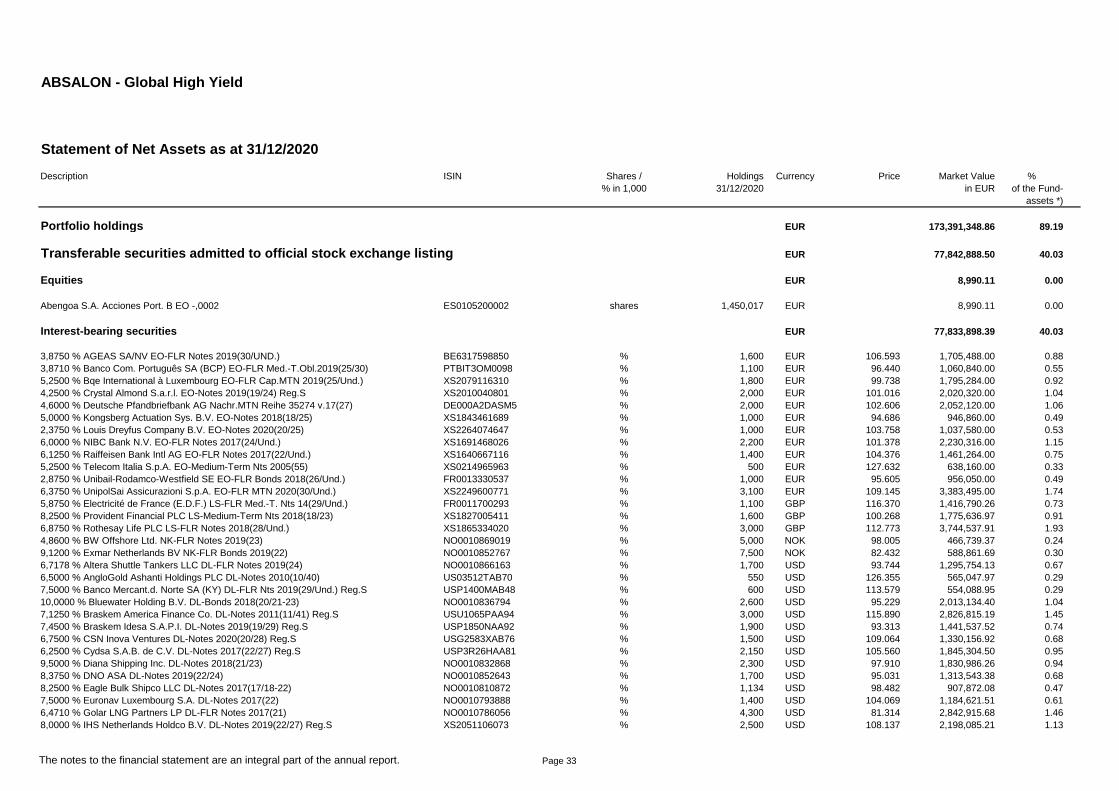
Portfolio holdings EUR 173,391,348.86 89.19
Transferable securities admitted to official stock exchange listing EUR 77,842,888.50 40.03
Equities EUR 8,990.11 0.00
Abengoa S.A. Acciones Port. B EO -,0002 ES0105200002 shares 1,450,017 EUR 8,990.11 0.00
Interest-bearing securities EUR 77,833,898.39 40.03
3,8750 % AGEAS SA/NV EO-FLR Notes 2019(30/UND.) BE6317598850 % 1,600 EUR 106.593 1,705,488.00 0.88
3,8710 % Banco Com. Português SA (BCP) EO-FLR Med.-T.Obl.2019(25/30) PTBIT3OM0098 % 1,100 EUR 96.440 1,060,840.00 0.55
5,2500 % Bqe International à Luxembourg EO-FLR Cap.MTN 2019(25/Und.) XS2079116310 % 1,800 EUR 99.738 1,795,284.00 0.92
4,2500 % Crystal Almond S.a.r.l. EO-Notes 2019(19/24) Reg.S XS2010040801 % 2,000 EUR 101.016 2,020,320.00 1.04
4,6000 % Deutsche Pfandbriefbank AG Nachr.MTN Reihe 35274 v.17(27) DE000A2DASM5 % 2,000 EUR 102.606 2,052,120.00 1.06
5,0000 % Kongsberg Actuation Sys. B.V. EO-Notes 2018(18/25) XS1843461689 % 1,000 EUR 94.686 946,860.00 0.49
2,3750 % Louis Dreyfus Company B.V. EO-Notes 2020(20/25) XS2264074647 % 1,000 EUR 103.758 1,037,580.00 0.53
6,0000 % NIBC Bank N.V. EO-FLR Notes 2017(24/Und.) XS1691468026 % 2,200 EUR 101.378 2,230,316.00 1.15
6,1250 % Raiffeisen Bank Intl AG EO-FLR Notes 2017(22/Und.) XS1640667116 % 1,400 EUR 104.376 1,461,264.00 0.75
5,2500 % Telecom Italia S.p.A. EO-Medium-Term Nts 2005(55) XS0214965963 % 500 EUR 127.632 638,160.00 0.33
2,8750 % Unibail-Rodamco-Westfield SE EO-FLR Bonds 2018(26/Und.) FR0013330537 % 1,000 EUR 95.605 956,050.00 0.49
6,3750 % UnipolSai Assicurazioni S.p.A. EO-FLR MTN 2020(30/Und.) XS2249600771 % 3,100 EUR 109.145 3,383,495.00 1.74
5,8750 % Electricité de France (E.D.F.) LS-FLR Med.-T. Nts 14(29/Und.) FR0011700293 % 1,100 GBP 116.370 1,416,790.26 0.73
8,2500 % Provident Financial PLC LS-Medium-Term Nts 2018(18/23) XS1827005411 % 1,600 GBP 100.268 1,775,636.97 0.91
6,8750 % Rothesay Life PLC LS-FLR Notes 2018(28/Und.) XS1865334020 % 3,000 GBP 112.773 3,744,537.91 1.93
4,8600 % BW Offshore Ltd. NK-FLR Notes 2019(23) NO0010869019 % 5,000 NOK 98.005 466,739.37 0.24
9,1200 % Exmar Netherlands BV NK-FLR Bonds 2019(22) NO0010852767 % 7,500 NOK 82.432 588,861.69 0.30
6,7178 % Altera Shuttle Tankers LLC DL-FLR Notes 2019(24) NO0010866163 % 1,700 USD 93.744 1,295,754.13 0.67
6,5000 % AngloGold Ashanti Holdings PLC DL-Notes 2010(10/40) US03512TAB70 % 550 USD 126.355 565,047.97 0.29
7,5000 % Banco Mercant.d. Norte SA (KY) DL-FLR Nts 2019(29/Und.) Reg.S USP1400MAB48 % 600 USD 113.579 554,088.95 0.29
10,0000 % Bluewater Holding B.V. DL-Bonds 2018(20/21-23) NO0010836794 % 2,600 USD 95.229 2,013,134.40 1.04
7,1250 % Braskem America Finance Co. DL-Notes 2011(11/41) Reg.S USU1065PAA94 % 3,000 USD 115.890 2,826,815.19 1.45
7,4500 % Braskem Idesa S.A.P.I. DL-Notes 2019(19/29) Reg.S USP1850NAA92 % 1,900 USD 93.313 1,441,537.52 0.74
6,7500 % CSN Inova Ventures DL-Notes 2020(20/28) Reg.S USG2583XAB76 % 1,500 USD 109.064 1,330,156.92 0.68
6,2500 % Cydsa S.A.B. de C.V. DL-Notes 2017(22/27) Reg.S USP3R26HAA81 % 2,150 USD 105.560 1,845,304.50 0.95
9,5000 % Diana Shipping Inc. DL-Notes 2018(21/23) NO0010832868 % 2,300 USD 97.910 1,830,986.26 0.94
8,3750 % DNO ASA DL-Notes 2019(22/24) NO0010852643 % 1,700 USD 95.031 1,313,543.38 0.68
8,2500 % Eagle Bulk Shipco LLC DL-Notes 2017(17/18-22) NO0010810872 % 1,134 USD 98.482 907,872.08 0.47
7,5000 % Euronav Luxembourg S.A. DL-Notes 2017(22) NO0010793888 % 1,400 USD 104.069 1,184,621.51 0.61
6,4710 % Golar LNG Partners LP DL-FLR Notes 2017(21) NO0010786056 % 4,300 USD 81.314 2,842,915.68 1.46
8,0000 % IHS Netherlands Holdco B.V. DL-Notes 2019(22/27) Reg.S XS2051106073 % 2,500 USD 108.137 2,198,085.21 1.13
The notes to the financial statement are an integral part of the annual report. Page 33

ABSALON - Global High Yield
Statement of Net Assets as at 31/12/2020
Description ISIN Shares / Holdings Currency Price Market Value %
% in 1,000 31/12/2020 in EUR of the Fund-
assets *)
4,8750 % Jubilant Pharma Ltd. DL-Notes 2016(16/21) XS1493722299 % 1,700 USD 100.979 930,505.46 0.48
7,2500 % LMIRT Capital PTE Ltd. DL-Med.-Term Notes 2019(19/24) XS2010198260 % 1,000 USD 100.850 819,985.36 0.42
6,6000 % Marathon Oil Corp. DL-Nts 2007(07/37) US565849AE68 % 2,000 USD 123.833 2,013,708.43 1.04
5,8750 % Minerva Luxembourg S.A. DL-Notes 2017(17/28) Reg.S USL6401PAH66 % 750 USD 108.191 659,754.86 0.34
6,8750 % Murphy Oil Corp. DL-Notes 2016(16/24) US626717AH56 % 1,500 USD 101.917 1,242,991.30 0.64
5,0000 % Nan Fung Treasury (III) Ltd. DL-Notes 2020(23/Und.) XS2226621840 % 800 USD 102.512 666,798.93 0.34
12,0000 % Navig8 Topco Holdings Inc. DL-Bonds 2019(19/23) NO0010850530 % 1,900 USD 100.538 1,553,152.29 0.80
8,0000 % Navigator Holdings Ltd. DL-Notes 2020(25) NO0010891955 % 750 USD 103.421 630,667.13 0.32
6,6250 % Neptune Energy Bondco PLC DL-Notes 2018(18/25) Reg.S USG64252AA01 % 2,600 USD 97.258 2,056,027.32 1.06
6,6250 % Nokia Oyj DL-Notes 2009(09/39) US654902AC90 % 1,000 USD 127.507 1,036,726.56 0.53
6,5000 % Perenti Finance Pty Ltd. DL-Notes 2020(22/25) Reg.S USQ7390AAA09 % 1,600 USD 107.151 1,393,947.48 0.72
8,3750 % PT Gajah Tunggal DL-Notes 2017(20/22) XS1655090139 % 450 USD 91.964 336,481.01 0.17
4,5000 % Sasol Financing Intern. Ltd. DL-Notes 2012(12/22) US803865AA25 % 1,500 USD 102.427 1,249,211.32 0.64
5,2500 % SCOR SE DL-FLR Notes 2018(29/Und.) FR0013322823 % 4,800 USD 105.981 4,136,180.18 2.13
9,0000 % Siccar Point Energy Bonds PLC DL-Notes 2018(18/23) NO0010815053 % 800 USD 98.430 640,247.17 0.33
7,8750 % Société Générale S.A. DL-FLR Notes 2013(23/Und.)RegS USF8586CRW49 % 1,750 USD 110.873 1,577,589.64 0.81
8,3750 % Soechi Capital Pte. Ltd. DL-Notes 2018(18/23) Reg.S USY8078LAA45 % 1,700 USD 69.475 960,301.65 0.49
7,1250 % Teekay Shuttle Tanker LLC DL-Notes 2017(22) NO0010801707 % 2,000 USD 100.868 1,640,263.44 0.84
7,2000 % Telecom Italia Capital S.A. DL-Notes 2006(06/36) US87927VAR96 % 1,100 USD 135.255 1,209,695.91 0.62
6,9500 % Türkiye Sise ve Cam Fabri.A.S. DL-Notes 2019(19/26) Reg.S XS1961010987 % 1,000 USD 110.852 901,309.05 0.46
6,9500 % Ülker Bisküvi Sanayi A.S. DL-Notes 2020(25) Reg.S XS2241387500 % 1,500 USD 108.494 1,323,205.14 0.68
5,1250 % Vivo Energy Investments B.V. DL-Notes 2020(23/27) Reg.S XS2231814570 % 1,100 USD 106.251 950,289.45 0.49
6,9000 % Yestar Healthcare Hldg.Co.Ltd. DL-Notes 2016(16/21) XS1485533944 % 1,250 USD 46.702 474,652.41 0.24
Transferable securities admitted to or included in organised markets EUR 83,551,452.62 42.96
Interest-bearing securities EUR 82,706,642.47 42.53
4,6250 % Achmea B.V. EO-FLR Notes 2019(29/Und.) XS2056490423 % 2,000 EUR 107.710 2,154,200.00 1.11
2,7500 % ADLER Group S.A. EO-Notes 2020(20/26) XS2248826294 % 1,000 EUR 102.757 1,027,570.00 0.53
5,6250 % AEGON N.V. EO-FLR Notes 2019(29/Und.) XS1886478806 % 2,800 EUR 118.940 3,330,320.00 1.71
4,6250 % ASR Nederland N.V. EO-FLR Cap. Secs 17(27/Und.) XS1700709683 % 2,200 EUR 108.491 2,386,802.00 1.23
6,1250 % Banco de Sabadell S.A. EO-FLR Bonds 2017(22/Und.) XS1720572848 % 3,600 EUR 99.234 3,572,424.00 1.84
5,1250 % BAWAG Group AG EO-FLR Notes 2020(25/Und.) XS2226911928 % 2,000 EUR 102.121 2,042,420.00 1.05
4,2970 % C10-EUR Capital SPV Ltd. EO-FLR Bonds 2007(17/Und.) XS0300179198 % 1,948 EUR 86.959 1,693,961.32 0.87
5,2500 % Caixabank S.A. EO-FLR Notes 2018(26/Und.) ES0840609012 % 1,800 EUR 102.881 1,851,858.00 0.95
5,1250 % Erste Group Bank AG EO-FLR Med.-T. Nts 19(25/Und.) XS1961057780 % 600 EUR 107.441 644,646.00 0.33
4,0000 % IKB Deutsche Industriebank AG FLR-Sub.Anl.v.2018(2023/2028) DE000A2GSG24 % 1,500 EUR 98.459 1,476,885.00 0.76
5,8750 % Jaguar Land Rover Automotive EO-Notes 2019(19/24) Reg.S XS2010037849 % 1,200 EUR 102.092 1,225,104.00 0.63
7,1250 % Kondor Finance PLC EO-LPN 19(24) Naftogaz Ukraine XS2027394233 % 2,500 EUR 104.363 2,609,075.00 1.34
5,6250 % Metinvest B.V. EO-Notes 2019(25) Reg.S XS2056722734 % 2,300 EUR 104.578 2,405,294.00 1.24
The notes to the financial statement are an integral part of the annual report. Page 34
ABSALON - Global High Yield
Statement of Net Assets as at 31/12/2020
Description ISIN Shares / Holdings Currency Price Market Value %
% in 1,000 31/12/2020 in EUR of the Fund-
assets *)
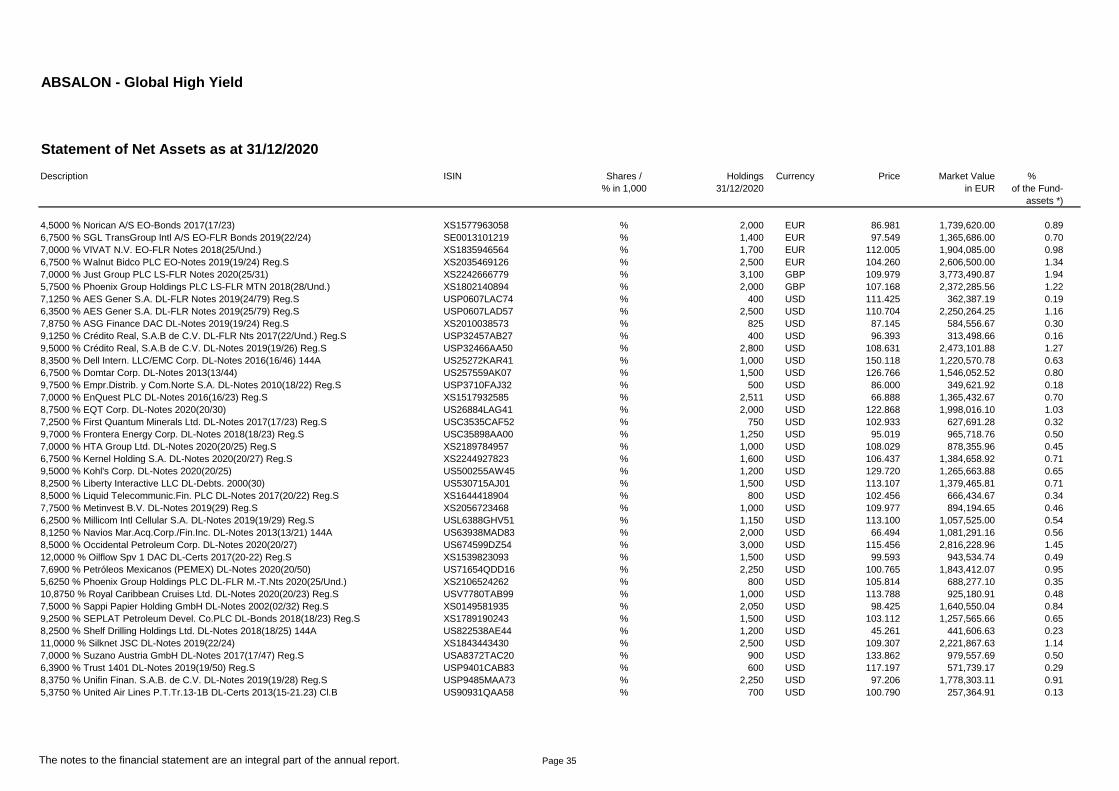
4,5000 % Norican A/S EO-Bonds 2017(17/23) XS1577963058 % 2,000 EUR 86.981 1,739,620.00 0.89
6,7500 % SGL TransGroup Intl A/S EO-FLR Bonds 2019(22/24) SE0013101219 % 1,400 EUR 97.549 1,365,686.00 0.70
7,0000 % VIVAT N.V. EO-FLR Notes 2018(25/Und.) XS1835946564 % 1,700 EUR 112.005 1,904,085.00 0.98
6,7500 % Walnut Bidco PLC EO-Notes 2019(19/24) Reg.S XS2035469126 % 2,500 EUR 104.260 2,606,500.00 1.34
7,0000 % Just Group PLC LS-FLR Notes 2020(25/31) XS2242666779 % 3,100 GBP 109.979 3,773,490.87 1.94
5,7500 % Phoenix Group Holdings PLC LS-FLR MTN 2018(28/Und.) XS1802140894 % 2,000 GBP 107.168 2,372,285.56 1.22
7,1250 % AES Gener S.A. DL-FLR Notes 2019(24/79) Reg.S USP0607LAC74 % 400 USD 111.425 362,387.19 0.19
6,3500 % AES Gener S.A. DL-FLR Notes 2019(25/79) Reg.S USP0607LAD57 % 2,500 USD 110.704 2,250,264.25 1.16
7,8750 % ASG Finance DAC DL-Notes 2019(19/24) Reg.S XS2010038573 % 825 USD 87.145 584,556.67 0.30
9,1250 % Crédito Real, S.A.B de C.V. DL-FLR Nts 2017(22/Und.) Reg.S USP32457AB27 % 400 USD 96.393 313,498.66 0.16
9,5000 % Crédito Real, S.A.B de C.V. DL-Notes 2019(19/26) Reg.S USP32466AA50 % 2,800 USD 108.631 2,473,101.88 1.27
8,3500 % Dell Intern. LLC/EMC Corp. DL-Notes 2016(16/46) 144A US25272KAR41 % 1,000 USD 150.118 1,220,570.78 0.63
6,7500 % Domtar Corp. DL-Notes 2013(13/44) US257559AK07 % 1,500 USD 126.766 1,546,052.52 0.80
9,7500 % Empr.Distrib. y Com.Norte S.A. DL-Notes 2010(18/22) Reg.S USP3710FAJ32 % 500 USD 86.000 349,621.92 0.18
7,0000 % EnQuest PLC DL-Notes 2016(16/23) Reg.S XS1517932585 % 2,511 USD 66.888 1,365,432.67 0.70
8,7500 % EQT Corp. DL-Notes 2020(20/30) US26884LAG41 % 2,000 USD 122.868 1,998,016.10 1.03
7,2500 % First Quantum Minerals Ltd. DL-Notes 2017(17/23) Reg.S USC3535CAF52 % 750 USD 102.933 627,691.28 0.32
9,7000 % Frontera Energy Corp. DL-Notes 2018(18/23) Reg.S USC35898AA00 % 1,250 USD 95.019 965,718.76 0.50
7,0000 % HTA Group Ltd. DL-Notes 2020(20/25) Reg.S XS2189784957 % 1,000 USD 108.029 878,355.96 0.45
6,7500 % Kernel Holding S.A. DL-Notes 2020(20/27) Reg.S XS2244927823 % 1,600 USD 106.437 1,384,658.92 0.71
9,5000 % Kohl's Corp. DL-Notes 2020(20/25) US500255AW45 % 1,200 USD 129.720 1,265,663.88 0.65
8,2500 % Liberty Interactive LLC DL-Debts. 2000(30) US530715AJ01 % 1,500 USD 113.107 1,379,465.81 0.71
8,5000 % Liquid Telecommunic.Fin. PLC DL-Notes 2017(20/22) Reg.S XS1644418904 % 800 USD 102.456 666,434.67 0.34
7,7500 % Metinvest B.V. DL-Notes 2019(29) Reg.S XS2056723468 % 1,000 USD 109.977 894,194.65 0.46
6,2500 % Millicom Intl Cellular S.A. DL-Notes 2019(19/29) Reg.S USL6388GHV51 % 1,150 USD 113.100 1,057,525.00 0.54
8,1250 % Navios Mar.Acq.Corp./Fin.Inc. DL-Notes 2013(13/21) 144A US63938MAD83 % 2,000 USD 66.494 1,081,291.16 0.56
8,5000 % Occidental Petroleum Corp. DL-Notes 2020(20/27) US674599DZ54 % 3,000 USD 115.456 2,816,228.96 1.45
12,0000 % Oilflow Spv 1 DAC DL-Certs 2017(20-22) Reg.S XS1539823093 % 1,500 USD 99.593 943,534.74 0.49
7,6900 % Petróleos Mexicanos (PEMEX) DL-Notes 2020(20/50) US71654QDD16 % 2,250 USD 100.765 1,843,412.07 0.95
5,6250 % Phoenix Group Holdings PLC DL-FLR M.-T.Nts 2020(25/Und.) XS2106524262 % 800 USD 105.814 688,277.10 0.35
10,8750 % Royal Caribbean Cruises Ltd. DL-Notes 2020(20/23) Reg.S USV7780TAB99 % 1,000 USD 113.788 925,180.91 0.48
7,5000 % Sappi Papier Holding GmbH DL-Notes 2002(02/32) Reg.S XS0149581935 % 2,050 USD 98.425 1,640,550.04 0.84
9,2500 % SEPLAT Petroleum Devel. Co.PLC DL-Bonds 2018(18/23) Reg.S XS1789190243 % 1,500 USD 103.112 1,257,565.66 0.65
8,2500 % Shelf Drilling Holdings Ltd. DL-Notes 2018(18/25) 144A US822538AE44 % 1,200 USD 45.261 441,606.63 0.23
11,0000 % Silknet JSC DL-Notes 2019(22/24) XS1843443430 % 2,500 USD 109.307 2,221,867.63 1.14
7,0000 % Suzano Austria GmbH DL-Notes 2017(17/47) Reg.S USA8372TAC20 % 900 USD 133.862 979,557.69 0.50
6,3900 % Trust 1401 DL-Notes 2019(19/50) Reg.S USP9401CAB83 % 600 USD 117.197 571,739.17 0.29
8,3750 % Unifin Finan. S.A.B. de C.V. DL-Notes 2019(19/28) Reg.S USP9485MAA73 % 2,250 USD 97.206 1,778,303.11 0.91
5,3750 % United Air Lines P.T.Tr.13-1B DL-Certs 2013(15-21.23) Cl.B US90931QAA58 % 700 USD 100.790 257,364.91 0.13
The notes to the financial statement are an integral part of the annual report. Page 35
ABSALON - Global High Yield
Statement of Net Assets as at 31/12/2020
Description ISIN Shares / Holdings Currency Price Market Value %
% in 1,000 31/12/2020 in EUR of the Fund-
assets *)
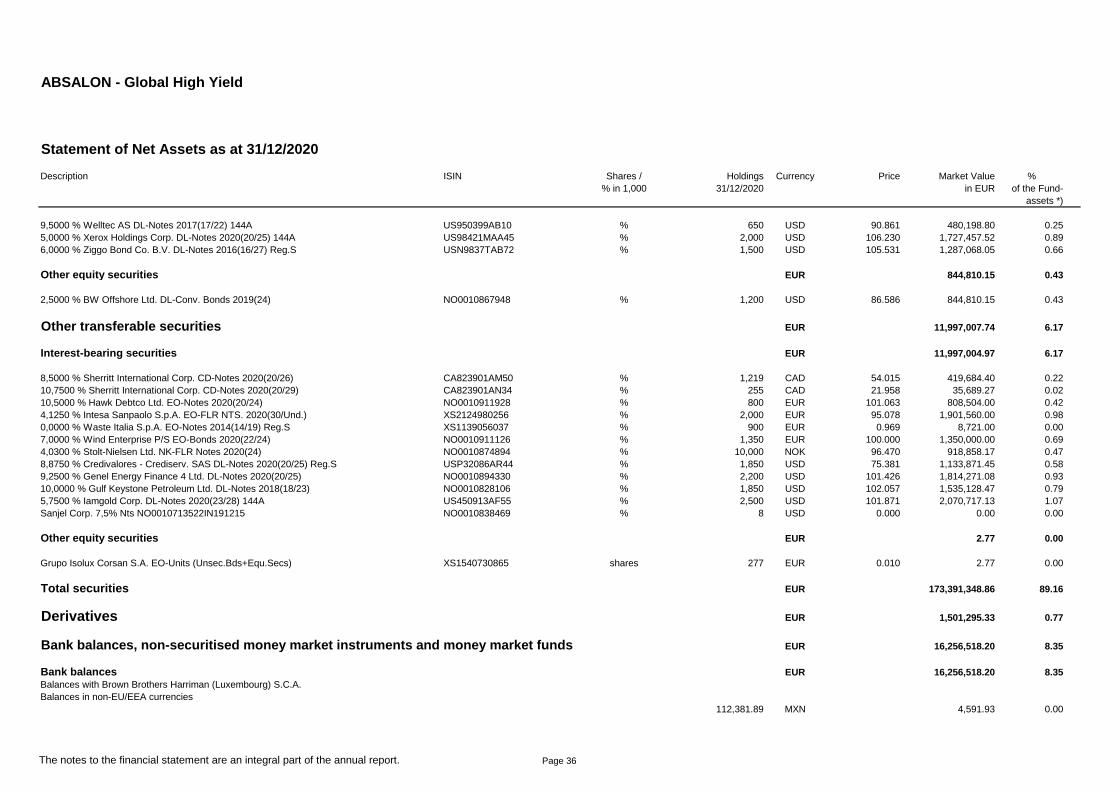
9,5000 % Welltec AS DL-Notes 2017(17/22) 144A US950399AB10 % 650 USD 90.861 480,198.80 0.25
5,0000 % Xerox Holdings Corp. DL-Notes 2020(20/25) 144A US98421MAA45 % 2,000 USD 106.230 1,727,457.52 0.89
6,0000 % Ziggo Bond Co. B.V. DL-Notes 2016(16/27) Reg.S USN9837TAB72 % 1,500 USD 105.531 1,287,068.05 0.66
Other equity securities EUR 844,810.15 0.43
2,5000 % BW Offshore Ltd. DL-Conv. Bonds 2019(24) NO0010867948 % 1,200 USD 86.586 844,810.15 0.43
Other transferable securities EUR 11,997,007.74 6.17
Interest-bearing securities EUR 11,997,004.97 6.17
8,5000 % Sherritt International Corp. CD-Notes 2020(20/26) CA823901AM50 % 1,219 CAD 54.015 419,684.40 0.22
10,7500 % Sherritt International Corp. CD-Notes 2020(20/29) CA823901AN34 % 255 CAD 21.958 35,689.27 0.02
10,5000 % Hawk Debtco Ltd. EO-Notes 2020(20/24) NO0010911928 % 800 EUR 101.063 808,504.00 0.42
4,1250 % Intesa Sanpaolo S.p.A. EO-FLR NTS. 2020(30/Und.) XS2124980256 % 2,000 EUR 95.078 1,901,560.00 0.98
0,0000 % Waste Italia S.p.A. EO-Notes 2014(14/19) Reg.S XS1139056037 % 900 EUR 0.969 8,721.00 0.00
7,0000 % Wind Enterprise P/S EO-Bonds 2020(22/24) NO0010911126 % 1,350 EUR 100.000 1,350,000.00 0.69
4,0300 % Stolt-Nielsen Ltd. NK-FLR Notes 2020(24) NO0010874894 % 10,000 NOK 96.470 918,858.17 0.47
8,8750 % Credivalores - Crediserv. SAS DL-Notes 2020(20/25) Reg.S USP32086AR44 % 1,850 USD 75.381 1,133,871.45 0.58
9,2500 % Genel Energy Finance 4 Ltd. DL-Notes 2020(20/25) NO0010894330 % 2,200 USD 101.426 1,814,271.08 0.93
10,0000 % Gulf Keystone Petroleum Ltd. DL-Notes 2018(18/23) NO0010828106 % 1,850 USD 102.057 1,535,128.47 0.79
5,7500 % Iamgold Corp. DL-Notes 2020(23/28) 144A US450913AF55 % 2,500 USD 101.871 2,070,717.13 1.07
Sanjel Corp. 7,5% Nts NO0010713522IN191215 NO0010838469 % 8 USD 0.000 0.00 0.00
Other equity securities EUR 2.77 0.00
Grupo Isolux Corsan S.A. EO-Units (Unsec.Bds+Equ.Secs) XS1540730865 shares 277 EUR 0.010 2.77 0.00
Total securities EUR 173,391,348.86 89.16
Derivatives EUR 1,501,295.33 0.77
Bank balances, non-securitised money market instruments and money market funds EUR 16,256,518.20 8.35
Bank balances EUR 16,256,518.20 8.35
Balances with Brown Brothers Harriman (Luxembourg) S.C.A.
Balances in non-EU/EEA currencies
112,381.89 MXN 4,591.93 0.00
The notes to the financial statement are an integral part of the annual report. Page 36

ABSALON - Global High Yield
Statement of Net Assets as at 31/12/2020
Description ISIN Shares / Holdings Currency Price Market Value %
% in 1,000 31/12/2020 in EUR of the Fund-
assets *)
Balances with Goldman Sachs Bank Europe SE
Balances in the Fund currency (Cash Collateral)
1,720,000.00 EUR 1,720,000.00 0.88
Balances with Brown Brothers Harriman Trust Co. [Cayman] Ltd.
deposits callable prior to maturity
301.96 CHF 278.10 0.00
117,453.03 DKK 15,789.46 0.01
Balances with Banco Bilbao Vizcaya Argentaria Madrid
deposits callable prior to maturity
8,191,051.36 EUR 8,191,051.36 4.21
5,194,173.24 USD 4,223,248.43 2.17
Balances with SUMITOMO Trust BK, London
deposits callable prior to maturity
887,981.61 GBP 982,824.14 0.51
Balances with Royal Bank of Canada CA
deposits callable prior to maturity
245,470.44 CAD 156,460.22 0.08
Balances with Nordea Bank Oslo
deposits callable prior to maturity
9,852,201.71 NOK 938,403.23 0.48
Balances with Skandinaviska Enskilda Banken AB Stockholm
deposits callable prior to maturity
240,300.76 SEK 23,871.33 0.01
Other Assets EUR 6,407,190.47 3.29
Interest receivables 2,920,527.79 EUR 2,920,527.79 1.50
Receivables from securities transactions 2,808,906.70 EUR 2,808,906.70 1.44
Receivables from share class transactions 677,755.98 EUR 677,755.98 0.35
Loan liabilities EUR -22,415.42 -0.01
Loans with Brown Brothers Harriman (Luxembourg) S.C.A.
EUR - loans -22,415.42 EUR -22,415.42 -0.01
The notes to the financial statement are an integral part of the annual report. Page 37
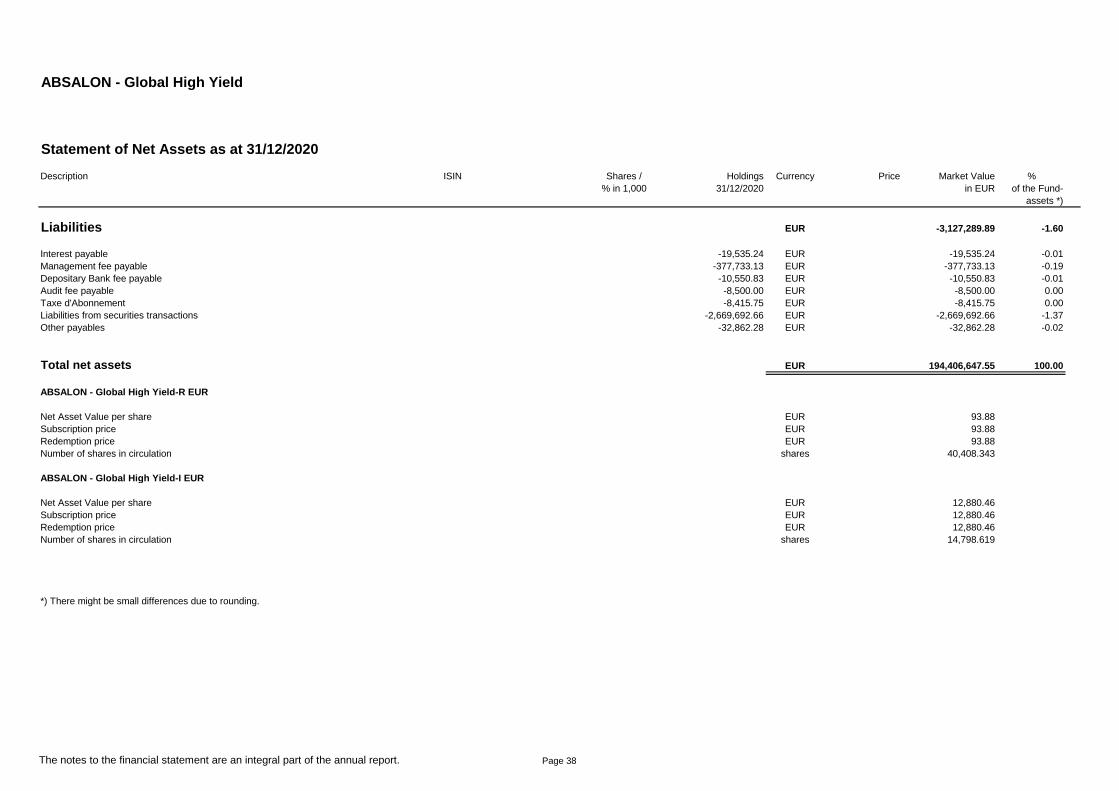
ABSALON - Global High Yield
Statement of Net Assets as at 31/12/2020
Description ISIN Shares / Holdings Currency Price Market Value %
% in 1,000 31/12/2020 in EUR of the Fund-
assets *)
Liabilities EUR -3,127,289.89 -1.60
Interest payable -19,535.24 EUR -19,535.24 -0.01
Management fee payable -377,733.13 EUR -377,733.13 -0.19
Depositary Bank fee payable -10,550.83 EUR -10,550.83 -0.01
Audit fee payable -8,500.00 EUR -8,500.00 0.00
Taxe d'Abonnement -8,415.75 EUR -8,415.75 0.00
Liabilities from securities transactions -2,669,692.66 EUR -2,669,692.66 -1.37
Other payables -32,862.28 EUR -32,862.28 -0.02
Total net assets EUR 194,406,647.55 100.00
ABSALON - Global High Yield-R EUR
Net Asset Value per share EUR 93.88
Subscription price EUR 93.88
Redemption price EUR 93.88
Number of shares in circulation shares 40,408.343
ABSALON - Global High Yield-I EUR
Net Asset Value per share EUR 12,880.46
Subscription price EUR 12,880.46
Redemption price EUR 12,880.46
Number of shares in circulation shares 14,798.619
*) There might be small differences due to rounding.
The notes to the financial statement are an integral part of the annual report. Page 38

ABSALON - Global High Yield
Derivatives as at 31/12/2020
Statement of Forward Transactions as at 31/12/2020
Ccy Amount Ccy Amount Commitment in EUR Maturity Unrealised profit/ loss in EUR Counterparty
Sell GBP -12,400,000.00 Buy EUR 13,852,891.23 13,724,405.09 04/01/2021 128,486.14 Brown Brothers Harriman & Co. New York
Sell GBP -200,000.00 Buy EUR 219,061.41 221,361.37 04/01/2021 -2,299.96 Brown Brothers Harriman & Co. New York
Buy GBP 12,600,000.00 Sell EUR -13,865,840.29 13,945,766.46 04/01/2021 79,926.17 Brown Brothers Harriman & Co. New York
Sell GBP -12,600,000.00 Buy EUR 13,858,611.37 13,945,766.46 29/01/2021 -80,752.44 Brown Brothers Harriman & Co. New York
Sell USD -123,250,000.00 Buy EUR 103,258,183.16 100,211,399.30 04/01/2021 3,046,783.86 Brown Brothers Harriman & Co. New York
Buy USD 123,250,000.00 Sell EUR -100,505,585.91 100,211,399.30 04/01/2021 -294,186.61 Brown Brothers Harriman & Co. New York
Sell USD -127,750,000.00 Buy EUR 104,107,244.72 103,870,233.35 29/01/2021 305,227.76 Brown Brothers Harriman & Co. New York
Total Forward Transactions 3,183,184.92
Page 39

ABSALON - Global High Yield
Derivatives as at 31/12/2020
Statement of Swap Transactions as at 31/12/2020
Swaps Maturity Nominal Ccy Commitment Curr. Price Counterparty
in EUR in EUR
CDS reference asset 21.09.20/20.12.25 USD CDX NA HY Series 35 V1 Index (3 Years) 20/12/2025 5,000,000.00 USD 4,065,371.17 *) -470,634.43 Goldman Sachs Bank Europe SE - Frankfurt
CDS fee leg 21.09.20/20.12.25 USD 5%
CDS reference asset 21.09.20/20.12.25 EUR iTraxx Europe Crossover Ser.34 Index (5 Year) 20/12/2025 10,000,000.00 EUR 10,000,000.00 *) -1,211,255.16 Goldman Sachs Bank Europe SE - Frankfurt
CDS fee leg 21.09.20/20.12.25 EUR 5%
Total Swap Transactions -1,681,889.59
Total Derivatives 1,501,295.33
*) There is no current underlying for this swap. In this case, the notional as defined in CESR Guideline 10-788 is therefore used to calculate the obligation.
Page 40

ABSALON - Global High Yield
Statement of Operations (including income equalisation)
for the period from 01/01/2020 to 31/12/2020Total
I. Income
- Interest on securities EUR 10,820,096.51
- Interest on liquidity investments *) EUR -32,375.16
- Other income EUR 55,600.44
Total income EUR 10,843,321.79
II. Expenses
- Interest on bank overdraft EUR -598.21
- Management Company fee EUR -1,329,654.68
- Depositary Bank fee EUR -19,615.43
- Custody service expenses EUR -25,827.75
- Auditing and publication expenses EUR -8,006.21
- Subscription tax ("Taxe d`abonnement") EUR -17,702.22
- Registrar and Transfer Agent fee EUR -24,766.68
- Legal fee EUR -1,000.00
- Incorporation expenses EUR -307.12
- Equalisation of ordinary expenses EUR -131,674.71
- Other expenses EUR -58,922.90
Total expenses EUR -1,618,075.91
III. Ordinary net result EUR 9,225,245.88
IV. Realised profit/loss on
1. Realised profit on EUR 28,651,094.79
- Securities EUR 11,499,781.20
- Forward exchange transactions EUR 15,328,206.18
- Futures transactions EUR 48,930.55
- Swap transactions EUR 1,594,579.94
- Foreign exchange transactions EUR 179,596.92
2. Realised loss on EUR -25,360,560.51
- Securities EUR -16,114,975.54
- Forward exchange transactions EUR -7,749,689.19
- Futures transactions EUR -155,660.27
- Swap transactions EUR -195,372.46
- Foreign exchange transactions EUR -1,144,863.05
Total realised profit/loss EUR 3,290,534.28
*) The position 'interest on liquidity investments' includes negative interest of 43,286.77 EUR.
The notes to the financial statement are an integral part of the annual report. Page 41

ABSALON - Global High Yield
Statement of Operations (including income equalisation)
for the period from 01/01/2020 to 31/12/2020Total
V. Net change in unrealised profit/loss
- Net change in unrealised profit EUR 8,320,488.28
- Net change in unrealised loss EUR -9,582,333.88
Total net change in unrealised profit/loss EUR -1,261,845.60
VI. Result of operations for the period EUR 11,253,934.56
The notes to the financial statement are an integral part of the annual report. Page 42

ABSALON - Global High Yield
Statement of Changes in Net Assets 2020
I. Net assets at the beginning of the period EUR 114,007,394.10
1. Distribution for the previous year EUR -179,766.44
2. Interim distributions EUR 0.00
3. Net cash flow EUR 68,502,945.03
a) Proceeds from shares issued EUR 126,064,740.17
b) Proceeds from shares redeemed EUR -57,561,795.14
4. Income/expense equalisation EUR 822,140.30
5. Result of operations for the period EUR 11,253,934.56
II. Net assets at the end of the period EUR 194,406,647.55
The notes to the financial statement are an integral part of the annual report. Page 43
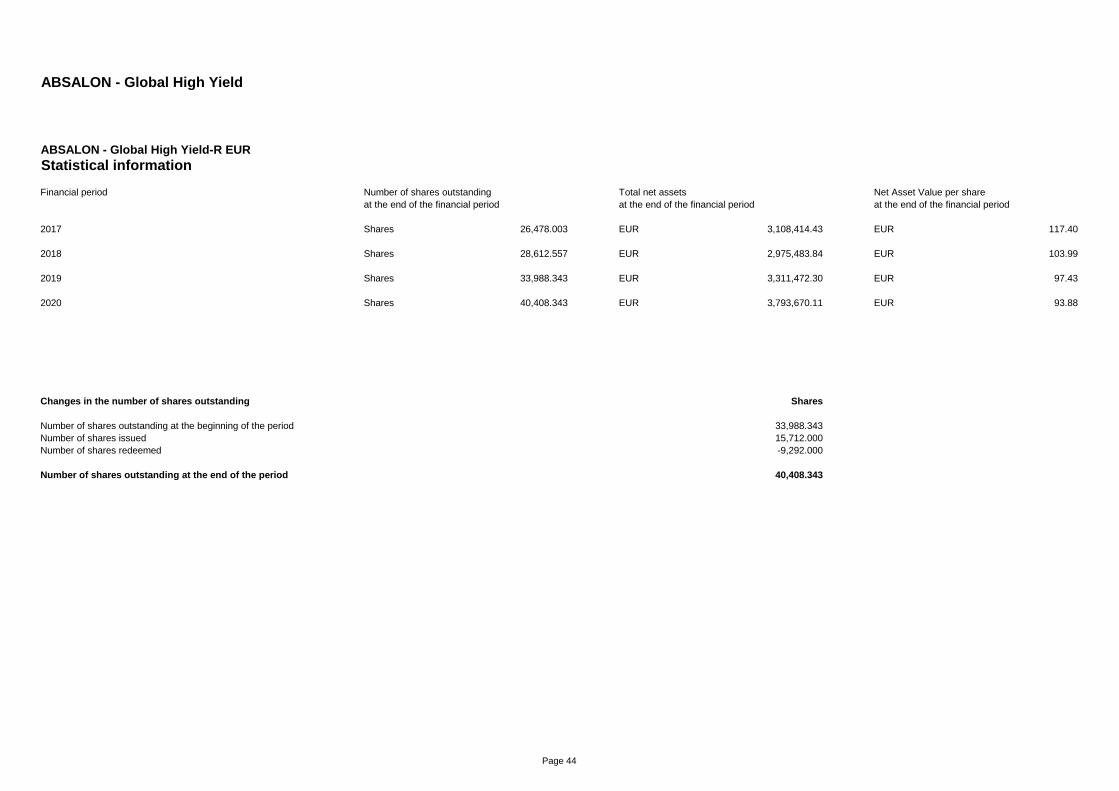
ABSALON - Global High Yield
ABSALON - Global High Yield-R EUR
Statistical information
Financial period Number of shares outstanding Total net assets Net Asset Value per share
at the end of the financial period at the end of the financial period at the end of the financial period
2017 Shares 26,478.003 EUR 3,108,414.43 EUR 117.40
2018 Shares 28,612.557 EUR 2,975,483.84 EUR 103.99
2019 Shares 33,988.343 EUR 3,311,472.30 EUR 97.43
2020 Shares 40,408.343 EUR 3,793,670.11 EUR 93.88
Changes in the number of shares outstanding Shares
Number of shares outstanding at the beginning of the period 33,988.343
Number of shares issued 15,712.000
Number of shares redeemed -9,292.000
Number of shares outstanding at the end of the period 40,408.343
Page 44

ABSALON - Global High Yield
ABSALON - Global High Yield-I EUR
Statistical information
Financial period Number of shares outstanding Total net assets Net Asset Value per share
at the end of the financial period at the end of the financial period at the end of the financial period
2017 Shares 6,887.941 EUR 83,025,838.59 EUR 12,053.80
2018 Shares 7,488.941 EUR 83,997,935.03 EUR 11,216.26
2019 Shares 8,898.554 EUR 110,695,921.81 EUR 12,439.77
2020 Shares 14,798.619 EUR 190,612,977.43 EUR 12,880.46
Changes in the number of shares outstanding Shares
Number of shares outstanding at the beginning of the period 8,898.554
Number of shares issued 10,812.412
Number of shares redeemed -4,912.347
Number of shares outstanding at the end of the period 14,798.619
Page 45

ABSALON
a.
b.
c.
d.
e.
f.
Securities which are not listed on an official stock exchange or traded on a regulated market shall be valued by the Company in accordance with valuation principles decided by the Board of Directors, at a price no lower than the bid price
and no higher than the ask price on the relevant valuation date.
Securities traded on a regulated market are valued in the same manner as listed securities.
The value of all securities which are listed on an official stock exchange is determined on the basis of the last available prices. If there is more than one stock exchange on which the securities are listed, the Board of Directors may in its
discretion select the stock exchange which shall be the principal stock exchange for such purposes.
Notes to the Financial Statements
1. General information
ABSALON ("the Company") was constituted in the Grand Duchy of Luxembourg on February 27, 2015 in accordance with Part I of the Law of December 17, 2010. The Company is organized as a company with variable capital, Société
d´investissement à capital variable ("SICAV"), under the Law of August 10, 1915 relating to commercial companies. The Company has been established for an indefinite period.
2. Significant Accounting Policies
2.1 Computation of the net asset value
The net asset value per sub-fund, net asset value per share, net asset value per class, the redemption price of shares and the issue price of shares shall be determined on each valuation date, at least twice a month. The valuation dates for
each sub-fund are indicated in the relevant appendix of the prospectus.
The net asset value of each sub-fund and the net asset value of the relevant class shall be expressed in the currency of each sub-fund as described in the relevant appendix of the Prospectus. Whilst the reporting currency of the Company is
the Euro, the net asset value is made available in the currency of each sub-fund as described in the relevant appendix of the Prospectus. The net asset value shall be determined on each valuation date separately for each share of each sub-
fund and for each class dividing the total net asset value of the relevant sub-fund and of the relevant class by the number of outstanding shares of such sub-fund and of the relevant class.
The net asset value shall be determined by subtracting the total liabilities of the sub-fund or class from the total assets of the respective sub-fund or class in accordance with the principles laid down in the Company’s articles of incorporation
and in such further valuation regulations as may be adopted from time to time by the Board of Directors.
2.2 Valuation of investments
The value of any cash in hand or on deposit, discount notes, bills and demand notes and accounts receivable, prepaid expenses, cash dividends and interest declared or accrued and not yet received shall be deemed to be the full amount
thereof, unless in any case the same is unlikely to be paid or received in full, in which case the value thereof shall be arrived at after making such provision as the Company may consider appropriate in such case to reflect the true value
thereof.
Investments shall be valued as follows:
The Company is presently structured as an umbrella fund. The reference currency and the reporting currency of the Company is the Euro (EUR).
The annual report was prepared in accordance with the legal provisions and regulations in force in Luxembourg concerning the preparation and presentation of the annual reports and under the assumption of going concern of the company.
The exclusive object of the Company is to place the funds available to it in transferable securities of all types and all other permitted assets as referred in Part I of the law dated 17 December 2010 (the "2010 Law") with the purpose of
spreading investment risks and affording its Shareholders the results of the management of its assets. The registered office of the Company is established in grevenmacher, in the Grand Duchy of Luxembourg.
The financial year begins on 1 January and ends on 31 December. The registered office of the Company is Grevenmacher in the Grand Duchy of Luxembourg.
Derivatives and repurchase agreements which are not listed on an official stock exchange or traded on a regulated market shall be valued by the Company in accordance with valuation principles decided by the Directors on the basis of
their marked-to-market price.
Term deposits shall be valued at their present value.
Page 46
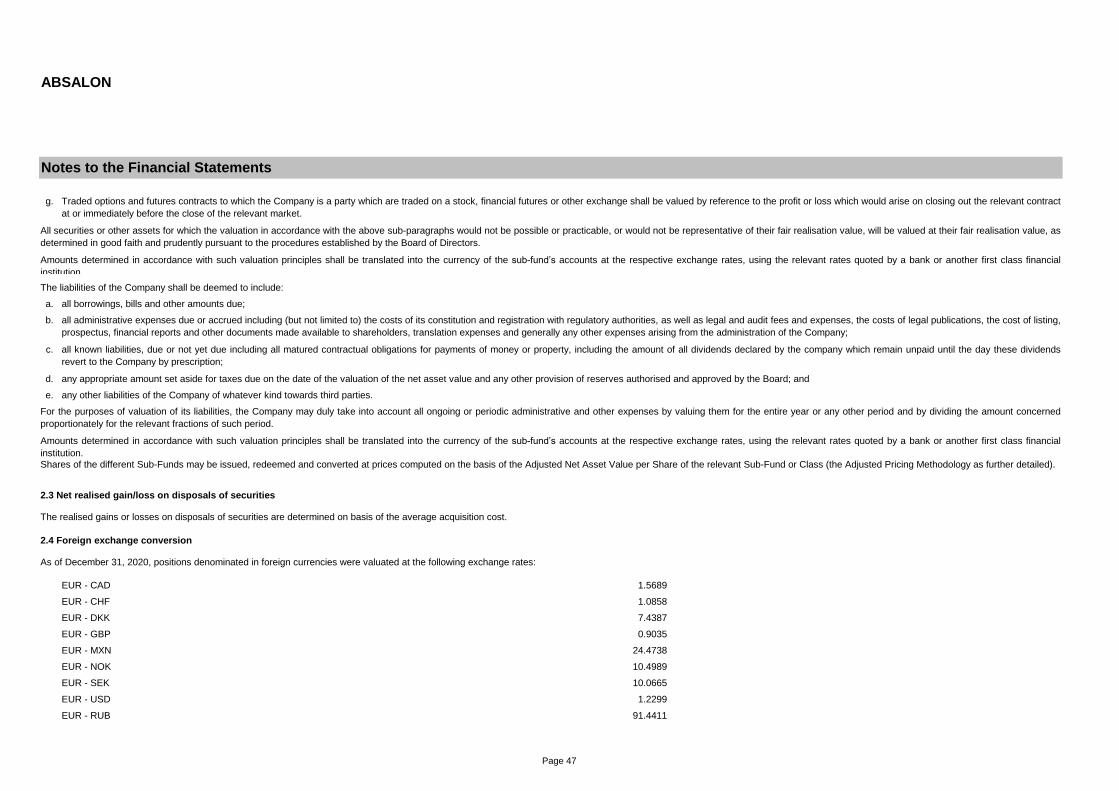
ABSALON
Notes to the Financial Statements
g.
a.
b.
c.
d.
e.
EUR - CAD 1.5689
EUR - CHF 1.0858
EUR - DKK 7.4387
EUR - GBP 0.9035
EUR - MXN 24.4738
EUR - NOK 10.4989
EUR - SEK 10.0665
EUR - USD 1.2299
EUR - RUB 91.4411
any appropriate amount set aside for taxes due on the date of the valuation of the net asset value and any other provision of reserves authorised and approved by the Board; and
Traded options and futures contracts to which the Company is a party which are traded on a stock, financial futures or other exchange shall be valued by reference to the profit or loss which would arise on closing out the relevant contract
at or immediately before the close of the relevant market.
All securities or other assets for which the valuation in accordance with the above sub-paragraphs would not be possible or practicable, or would not be representative of their fair realisation value, will be valued at their fair realisation value, as
determined in good faith and prudently pursuant to the procedures established by the Board of Directors.
Amounts determined in accordance with such valuation principles shall be translated into the currency of the sub-fund’s accounts at the respective exchange rates, using the relevant rates quoted by a bank or another first class financial
institution.
The liabilities of the Company shall be deemed to include:
all borrowings, bills and other amounts due;
all administrative expenses due or accrued including (but not limited to) the costs of its constitution and registration with regulatory authorities, as well as legal and audit fees and expenses, the costs of legal publications, the cost of listing,
prospectus, financial reports and other documents made available to shareholders, translation expenses and generally any other expenses arising from the administration of the Company;
all known liabilities, due or not yet due including all matured contractual obligations for payments of money or property, including the amount of all dividends declared by the company which remain unpaid until the day these dividends
revert to the Company by prescription;
Shares of the different Sub-Funds may be issued, redeemed and converted at prices computed on the basis of the Adjusted Net Asset Value per Share of the relevant Sub-Fund or Class (the Adjusted Pricing Methodology as further detailed).
2.4 Foreign exchange conversion
As of December 31, 2020, positions denominated in foreign currencies were valuated at the following exchange rates:
any other liabilities of the Company of whatever kind towards third parties.
For the purposes of valuation of its liabilities, the Company may duly take into account all ongoing or periodic administrative and other expenses by valuing them for the entire year or any other period and by dividing the amount concerned
proportionately for the relevant fractions of such period.
Amounts determined in accordance with such valuation principles shall be translated into the currency of the sub-fund’s accounts at the respective exchange rates, using the relevant rates quoted by a bank or another first class financial
institution.
2.3 Net realised gain/loss on disposals of securities
The realised gains or losses on disposals of securities are determined on basis of the average acquisition cost.
Page 47

ABSALON
Notes to the Financial Statements
Transactions on investments in securities are booked on a trade date basis.
The Management Company can accept a lower fee or waive the fee.
3. Management Company and Administration fee
The Management Company receives for the sub-fund ABSALON - EM Corporate Debt remuneration in the amount of up to 1.73% p.a. and for sub-fund ABSALON - Global High Yield up to 1.48% p.a. of the net asset value of the sub-fund with
a minimum fee of up to 45,000.- EUR p.a. per sub-fund, currently not subject to Luxembourg VAT.
4. Portfolio Manager fee
The Portfolio Manager receives for the subfund ABSALON - EM Corporate Debt remuneration in the amount of up to 0.75% p.a. of the net asset value of the share classes I EUR, I USD and I GBP and up to 1.45% p.a. of the net asset value
of the share class R EUR.
The Portfolio Manager receives for the sub-fund ABSALON - Global High Yield remuneration in the amount of up to 0.75% p.a. of the net asset value of the share class I EUR and up to 1.20% p.a. of the net asset value of the share class R
EUR.
5. Depositary Bank fee
The Depositary Bank receives remuneration in the amount of up to 0.05% p.a. of the net asset value of each sub-fund with a minimum fee of up to 30,000.- EUR p.a. The Depositary Bank fee shall be charged to sub-fund plus Luxembourg
VAT - currently 12%, monthly on a pro rata basis. Transaction costs are charged separately to each individual sub-fund.
2.7 Allocation of accrued expenses
2.6 Incorporation expenses
Accrued expenses which can be allocated directly to a sub-fund are charged to this sub-fund. Accrued expenses which cannot be allocated directly are divided among the sub-funds in proportion of their net assets.
2.5 Transactions on investments in securities
Incorporation expenses are amortised on a straight-line basis over a period of five years.
The Portfolio Manager fee will be paid out of the Management Company and Administration fee.
The amount of this remuneration is calculated on each valuation date, and paid to the investment manager, on a monthly basis. The Portfolio Manager can accept a lower fee or waive the fee.
6. Registrar and Transfer Agent fee
The company of the above named function receives a minimum fee of up to 24,000.- EUR p.a. The remuneration is payable monthly on a pro rata basis. Transaction costs are charged separately to each individual sub-fund.
Page 48
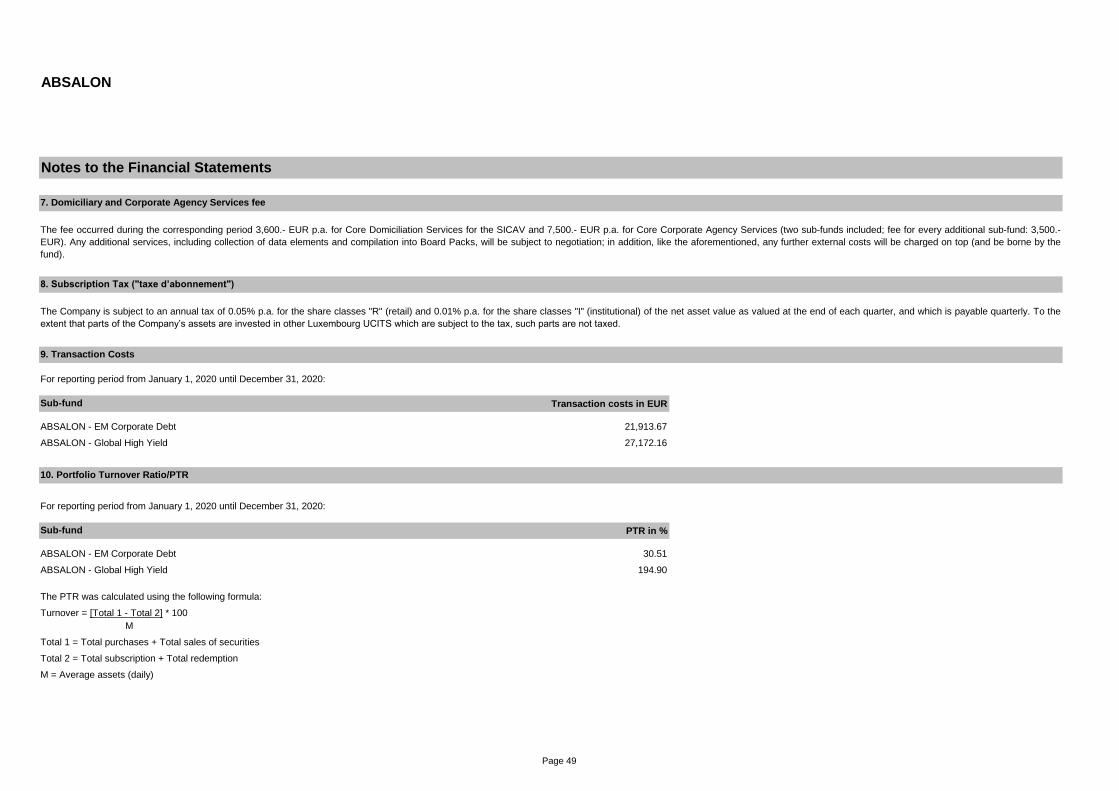
ABSALON
Notes to the Financial Statements
Transaction costs in EUR
ABSALON - EM Corporate Debt 21,913.67
ABSALON - Global High Yield 27,172.16
For reporting period from January 1, 2020 until December 31, 2020:
PTR in %
ABSALON - EM Corporate Debt 30.51
ABSALON - Global High Yield 194.90
The PTR was calculated using the following formula:
Turnover = [Total 1 - Total 2] * 100
M
Total 1 = Total purchases + Total sales of securities
Total 2 = Total subscription + Total redemption
M = Average assets (daily)
9. Transaction Costs
7. Domiciliary and Corporate Agency Services fee
The fee occurred during the corresponding period 3,600.- EUR p.a. for Core Domiciliation Services for the SICAV and 7,500.- EUR p.a. for Core Corporate Agency Services (two sub-funds included; fee for every additional sub-fund: 3,500.-
EUR). Any additional services, including collection of data elements and compilation into Board Packs, will be subject to negotiation; in addition, like the aforementioned, any further external costs will be charged on top (and be borne by the
fund).
10. Portfolio Turnover Ratio/PTR
Sub-fund
The Company is subject to an annual tax of 0.05% p.a. for the share classes "R" (retail) and 0.01% p.a. for the share classes "I" (institutional) of the net asset value as valued at the end of each quarter, and which is payable quarterly. To the
extent that parts of the Company’s assets are invested in other Luxembourg UCITS which are subject to the tax, such parts are not taxed.
8. Subscription Tax ("taxe d’abonnement")
Sub-fund
For reporting period from January 1, 2020 until December 31, 2020:
Page 49

ABSALON
Notes to the Financial Statements
For reporting period from January 1, 2020 until December 31, 2020:
Ongoing Charges in %
ABSALON - EM Corporate Debt-R EUR 1.89
ABSALON - EM Corporate Debt-I EUR 0.91
ABSALON - EM Corporate Debt-I GBP (since February 18, 2020) 0.90
ABSALON - EM Corporate Debt-I USD 1.04
ABSALON - EM Corporate Debt-I GBP (dis) (since February 18, 2020) 0.90
ABSALON - Global High Yield-R EUR 1.62
ABSALON - Global High Yield-I EUR 0.90
*) In the event of a short or extended financial year, the Ongoing Charges will be annualised.
The following poolfactors have been used:
Factor
0.66666666
0.12002003
0.77679715
0.44864634
Description
11. Ongoing Charges*)
Ongoing Charges - the ongoing charges figure shall include all types of cost borne by the UCITS, whether they represent expenses necessarily incurred in its operation, or the remuneration of any party connected with it or providing services
to it.
Share class
6.3500% Odebrecht D.Norbe VIII/IX Ltd. DL-Nts 17(18/18-21) Reg.S Tr.1
12. Poolfactor
The poolfactor is a percentage of the original principal that is left to be distributed in the debt security, as represented by numerical factor that will be attached on periodic market quotes. The original principal will be multiplied by the poolfactor.
4.8750% Jubilant Pharma Ltd. DL-Notes 2016(16/21)
12.0000% Oilflow Spv 1 DAC DL-Certs 2017(20-22) Reg.S
5.3750% United Air Lines P.T.Tr.13-1B DL-Certs 2013(15-21.23) Cl.B
Page 50

ABSALON
Notes to the Financial Statements
Did a Suspension of the net asset value calculation or of share transactions occur? No
Are there any problems regarding the liquidity? No
Is it foreseen to liquidate sub-funds? No
Did any operational issues occur? No
Is there a high amount of net-outflows? No
Were payments delayed or defaulted? No
During the reporting period no securities financing transactions and total return swaps as defined in the above mentioned regulation occurred.
15. Subsequent Events
The results of an analysis on (sub-)fund level for the period subsequent to the financial year up to the date of the audit report is shown below:
As a consequence of the coronavirus it is possible that specific events, such as a suspension of share transactions and of the net asset value calculation, a high amount of net-outflows resulting in a liquidity shortage could occur after the
balance sheet date.
13. Changes in Portfolio Composition
14. Disclosures according to Regulation (EU) 2015/2365 of the European Parliament and of the Council of November 25, 2015 on transparency of securities financing transactions and of reuse and amending regulation (EU)
No 648/2012 - Disclosure as per Section A (unaudited)
Details of purchases and sales of investments are available free of charge from the registered office of the Company.
Page 51

KPMG Luxembourg, Société coopérative 39, Avenue John F. Kennedy
L-1855 Luxembourg
Tel.: +352 22 51 51 1 Fax: +352 22 51 71 E-mail: [email protected] Internet: www.kpmg.lu
To the Shareholders of ABSALON
REPORT OF THE REVISEUR D’ENTREPRISES AGREE
Report on the audit of the financial statements
Opinion
We have audited the financial statements of ABSALON and each of its sub-funds (“the Fund”), which comprise the statement of net assets as at 31 December 2020 and the statement of operations and the statement of changes in net assets for the year then ended, and notes to the financial statements, including a summary of significant accounting policies.
In our opinion, the accompanying financial statements give a true and fair view of the financial position of ABSALON and each of its sub-funds as at 31 December 2020, and of the results of their operations and changes in their net assets for the year then ended in accordance with Luxembourg legal and regulatory requirements relating to the preparation and presentation of the financial statements.
Basis for opinion
We conducted our audit in accordance with the Law of 23 July 2016 on the audit profession (“Law of 23 July 2016”) and with International Standards on Auditing (“ISAs”) as adopted for Luxembourg by the Commission de Surveillance du Secteur Financier (“CSSF”). Our responsibilities under the Law of 23 July 2016 and ISAs as adopted for Luxembourg by the CSSF are further described in the «Responsibilities of “réviseur d’entreprises agréé” for the Audit of the Financial Statements» section of our report. We are also independent of the Fund in accordance with the International Code of Ethics for Professional Accountants, including International Independence Standards, issued by the International Ethics Standards Board for Accountants (“IESBA Code”) as adopted for Luxembourg by the CSSF together with the ethical requirements that are relevant to our audit of the financial statements, and have fulfilled our other ethical responsibilities under those ethical requirements. We believe that the audit evidence we have obtained is sufficient and appropriate to provide a basis for our opinion.
Other information
The Board of Directors of the Fund is responsible for the other information. The other information comprises the information stated in the annual report but does not include the financial statements and our report of “réviseur d’entreprises agréé” thereon.
Our opinion on the financial statements does not cover the other information and we do not express any form of assurance conclusion thereon.
In connection with our audit of the financial statements, our responsibility is to read the other information and, in doing so, consider whether the other information is materially inconsistent with the financial statements or our knowledge obtained in the audit or otherwise appears to be materially misstated. If, based on the work we have performed, we conclude that there is a material misstatement of this other information, we are required to report this fact. We have nothing to report in this regard.
Responsibilities of the Board of Directors of the Fund for the financial statements
The Board of Directors of the Fund is responsible for the preparation and fair presentation of these financial statements in accordance with Luxembourg legal and regulatory requirements relating to the preparation and presentation of the financial statements, and for such internal control as the Board of Directors of the Fund determines is necessary to enable the preparation of financial statements that are free from material misstatement, whether due to fraud or error.
KPMG Luxembourg, Societe cooperative, a Luxembourg entity and a member firm or the KPMG global organiution or independent member firms affiliated with KPMG International limited~ a private English company limited by guarantee. All rights reserved.
T.V.A. LU 27351518 A.C,S. Luxembourg B 149133

In preparing the financial statements, the Board of Directors of the Fund is responsible for assessing the Fund’s and each of its sub-funds’ ability to continue as a going concern, disclosing, as applicable, matters related to going concern and using the going concern basis of accounting unless the Board of Directors of the Fund either intends to liquidate the Fund or any of its sub-funds or to cease operations, or has no realistic alternative but to do so.
Responsibilities of the “réviseur d’entreprises agréé” for the audit of the financial statements
The objectives of our audit are to obtain reasonable assurance about whether the financial statements as a whole are free from material misstatement, whether due to fraud or error, and to issue a report of “réviseur d’entreprises agréé” that includes our opinion. Reasonable assurance is a high level of assurance, but is not a guarantee that an audit conducted in accordance with the Law of 23 July 2016 and with ISAs as adopted for Luxembourg by the CSSF will always detect a material misstatement when it exists. Misstatements can arise from fraud or error and are considered material if, individually or in the aggregate, they could reasonably be expected to influence the economic decisions of users taken on the basis of these financial statements.
As part of an audit in accordance with the Law of 23 July 2016 and with ISAs as adopted for Luxembourg by the CSSF, we exercise professional judgment and maintain professional skepticism throughout the audit. We also:
— Identify and assess the risks of material misstatement of the financial statements, whether due to fraud or error, design and perform audit procedures responsive to those risks,and obtain audit evidence that is sufficient and appropriate to provide a basis for our opinion. The risk of not detecting a material misstatement resulting from fraud is higher than for one resulting from error, as fraud may involve collusion, forgery, intentional omissions, misrepresentations, or the override of internal control.
— Obtain an understanding of internal control relevant to the audit in order to design audit procedures that are appropriate in the circumstances, but not for the purpose of expressingan opinion on the effectiveness of the Fund’s internal control.
— Evaluate the appropriateness of accounting policies used and the reasonableness of accounting estimates and related disclosures made by the Board of Directors of the Fund.
— Conclude on the appropriateness of the Board of Directors of the Fund’s use of the going concern basis of accounting and, based on the audit evidence obtained, whether amaterial uncertainty exists related to events or conditions that may cast significant doubt on the Fund’s or any of its sub-funds’ ability to continue as a going concern. If we conclude that a material uncertainty exists, we are required to draw attention in our report of the “réviseur d’entreprises agréé” to the related disclosures in the financial statements or, if such disclosures are inadequate, to modify our opinion. Our conclusions are based on the audit evidence obtained up to the date of our report of the “réviseur d’entreprises agréé”. However, future events or conditions may cause the Fund or any of its sub-funds to cease to continue as a going concern.
— Evaluate the overall presentation, structure and content of the financial statements, including the disclosures, and whether the financial statements represent the underlyingtransactions and events in a manner that achieves fair presentation.
We communicate with those charged with governance regarding, among other matters, the planned scope and timing of the audit and significant audit findings, including any significant deficiencies in internal control that we identify during our audit.
Luxembourg, 27 April 2021 KPMG Luxembourg, Société coopérative Cabinet de révision agréé
S. Kraiker