Univ. North Texas Health Science Ctr. Fort Worth UNT Health · PDF fileUniv. North Texas...
22
The Survey of Organizational Excellence Univ. North Texas Health Science Ctr. Fort Worth UNT Health Executive Summary 2007 ID: 763 Category: 112
Transcript of Univ. North Texas Health Science Ctr. Fort Worth UNT Health · PDF fileUniv. North Texas...
The Survey of Organizational Excellence
Univ. North Texas Health Science Ctr. Fort Worth
UNT Health
Executive Summary
2007
ID: 763 Category: 112

The Survey of Organizational Excellence
112-UNT Health
Executive Summary Table of Contents
Introduction 1Organizational Profile 3 Survey Administration 3 Organizational Category Profile 4 Survey Framework and Scoring 5 Dimension Analysis 6 Construct Analysis 7 Organizational Typology: Areas of Strength and Areas of Concern 8 Organizational Categories: Internal Comparisons 14Interpreting Internal Comparisons 15Participant Profile 16Interpretation and Intervention 18Timeline 19
The University of Texas at Austin www.survey.utexas.edu School of Social Work [email protected] 1925 San Jacinto Blvd Phone (512) 471-9831 Austin, Texas 78712 Fax (512) 471-9600
763 -Univ. North Texas Health Science Ctr. Fort Worth
The Survey of Organizational Excellence
112-UNT Health
Introduction Thank you for your participation in the Survey of Organizational Excellence (SOE). We trust that you will find the information helpful in your leadership and organizational development efforts. Acting as a powerful wave of change, the SOE is important in both the public and private sectors. The number of surveys distributed over the last 10 years has increased three-fold. Both organization and employee response has been tremendous. Such participation indicates the readiness, indeed the eagerness, of employees to engage in meaningful work to improve the organization. Organizational Leadership must build on this wave of engaged employees and begin initiatives to improve services and benchmark results against outstanding organizations. Above all, the Survey is not about just collecting data or fulfilling some type of compliance, but about promoting excellence through participation and accountability. The Survey reinforces the vital role every employee must play to the fullest at all times. The Survey emphasizes continuous thinking to formulate better, more efficient ways of getting work done. Finally, the Survey calls for candor among all employees towards building a quality organization. The Survey Framework assesses, at its highest level, five workplace dimensions capturing the total work environment. Each workplace dimension consists of survey constructs. The survey constructs are designed to profile organizational areas of strength and concern so that interventions are targeted appropriately.
Your Reports Include: An Executive Summary is provided in this document. The summary contains graphical representations of data from the organization as a whole or in the case of executive summaries for category codes, data specific to that category code. Your organization may or may not have elected to use category codes. In each executive report there is a demographic profile of the organization along with high order analysis of survey data on the construct and dimension level. Both organizational strengths and areas of concern are presented along additional narrative and analysis. Relative benchmark data is also pulled in for comparison purposes.
Survey Dimensions and Constructs
Dimension I Work Group
Dimension IIAccommodations
Dimension IIIOrganizational
Features
Dimension IV Information
Dimension VPersonal
Supervisor Effectiveness Fairness
Team Effectiveness Diversity
Fair PayPhysical Environment
Benefits Employment Development
Change OrientedGoal Oriented Holographic
Strategic Quality
Internal Availability
External
Job SatisfactionTime and Stress
Burnout Empowerment
763 -Univ. North Texas Health Science Ctr. Fort Worth Page 1
The Survey of Organizational Excellence
112-UNT Health
Introduction (cont.) A Data Summary accompanies this report. The data summary provides a greater detail than the executive summary. The data summary is largely a quantitative report of the survey responses. Demographic data are presented in percentages and real numbers. Construct means and benchmark comparison numbers are provided on all variables. Item data is broken into mean, frequency counts, standard deviations, and number of respondents and item benchmark data are also displayed. Electronic Reports are provided in two formats. First, all executive and data summary reports are included in pdf files for ease in distribution and for clear printability. This file format is widely used and a free pdf reader, called Adobe Acrobat reader is available from www.adobe.com. The second types of electronic reports are in Microsoft Excel format. These reports are constructs and item survey data in a flat spreadsheet format. This allows the user to sort highs and lows, search for individual items, or create custom reports from the survey data. Benchmark Data composed of the organizations participating in the survey are provided in your reports. Benchmarks are used to provide a unit of comparison of organizations of similar mission and size. If you selected to use organizational categories, internal benchmarks between categories as well as over time data illustrates differences and changes along item and construct scores. Our benchmark data are updated every two years and are available from our website at www.orgexcel.net. The most current benchmark data are provided in your report. Using the Survey as a Catalyst for organizational improvement is essential to the survey process. The survey creates momentum and interest. Towards the end of the executive summary report is a series of suggested next steps to assist in these efforts. Also, we have captured several presentations from other organizations that have used the data in strategic planning, organizational improvement, and employee engagement initiatives. These presentations are provided in streaming video from our website at www.orgexcel.net by clicking on the Best Practices link. Additional Services are available from our group. We conduct 360-Degree leadership and supervisory evaluations, special leadership assessments, customer and client satisfaction surveys along with the ability to create and administer a variety of custom hardcopy and online survey instruments. Consultation time for large presentations, focus groups, or individual meetings is available as well. For additional information, please contact us at anytime. Your Comments are Important to us. We welcome your comments (positive or negative) regarding the Survey, the level or type of service provided by our office, or suggestions you may have for ways we can improve our products or services. Comments can be sent directly to me or to the Survey's Principal Investigator, Dr. Michael L. Lauderdale at the UT School of Social Work, 1925 San Jacinto Blvd., Austin, TX 78712.
763 -Univ. North Texas Health Science Ctr. Fort Worth Page 2

The Survey of Organizational Excellence
112-UNT Health
Organization Profile
Univ. North Texas Health Science Ctr. Fort Worth
Organizational Leadership:
Scott Ransom, President Gayle Strange, Board Chair
ID: 763
Benchmark Categories:To get a better idea of how this organization compares to others like it, we provide three types of benchmark data: organizations with a similar size, similar mission, and organizations belonging to a special grouping. Visit www.survey.utexas.edu for a complete list of benchmark groups and scores.
Organization Size: Size category 4 includes organizations with 301 to 1000 employees. Mission Category: Education (Mission 3) The Education category includes Universities, Colleges, Institutes and other Agencies involved with students, teachers, administrators and families throughout many areas of learning. Special Grouping: None Survey Administration Profile:
Collection Period: 1/7/2008 - 1/25/2008
Additional Items and Categories: Organizations can add customization by creating additional items tailored to the organization and categories for employees to identify with. Refer to the Appendix of the Data Report for a complete list of categories and additional items.
20 additional items Category (13 codes)
Collection Method: There were 546 employees that took the survey online and 8 employees used a paper survey.
Survey Liaison:
Jolie Lyon 817-735-0297Process Improvement AnalystUniv. North Texas Health Science Ctr. Fort Worth3500 Camp Bowie BoulevardFort Worth, TX 76107
763 -Univ. North Texas Health Science Ctr. Fort Worth Page 3

The Survey of Organizational Excellence
112-UNT Health
Organizational Category Profile
UNT Health Organizational categories are designed to elicit more information about employees' roles in the organization. The data promote a more detailed analysis of survey data because the categories isolate certain areas, functions or other categories of interest in the organization. Organizations may elect to have employees identify up to three organizational categories in which they belong. Attributes such as employees' geographic location, work responsibilities or job description are examples of some common organizational category designs. Each organizational category is assigned a 3-digit code and employees mark the code on their survey instrument. Data reports are automatically provided for each category unless there are fewer than 5 respondents. Out of the 1273 employees who were invited to take the survey, 554 responded. UNT Health is one of the categories to which employees could identify themselves. Out of the 554 employees who took the survey, 134 identified themselves with this category.
Organizational Category Composition This Organizational Category represents 24% of the total number of survey respondents. The Organizational Composition of the Respondents is useful for determining the significance of internal comparisons. Organizational Categories that make up a high percentage of the respondents of the total organization can notice significance in even small deviations (1 to 4 points) from the scores of the whole organization. For Organizational Categories that hold a smaller portion of the percentage, larger deviations (five or more points) may be needed to note a significantly higher or lower score. It is important to examine how uniform or distinctive your scores are as compared to the total organization.
This Category 24%Other Categories 76%
Response Rate for the Whole Organization High rates mean that employees have an investment in the organization, want to see the organization improve and generally have a sense of responsibility to the organization. Low response rates can mean several things. There simply may not have been enough effort in making certain employees know the importance of completing the Survey. At a more serious level, low rates of response suggest a lack of organization focus or responsiveness. It may suggest critical levels of employee alienation, anger or indifference to organizational responsibilities. At 44%, your response rate is considered low.
Responded 44%Did Not Respond 56%
763 -Univ. North Texas Health Science Ctr. Fort Worth Page 4

The Survey of Organizational Excellence
112-UNT Health
Survey Framework and Scoring The Survey assessment is a framework that consists of survey items, constructs, and dimensions. Each level of the framework provides insight into the workings of an organization.
Items At the most basic level there are survey items, which provide specific feedback. For each item, employees are asked to indicate how strongly they agree or disagree that the item describes the organization. Possible responses include: (1) strongly disagree; (2) disagree; (3) feel neutral; (4) agree; (5) strongly agree; and, (not scored) don't know/not applicable. Any survey item with an average (mean) score above the neutral midpoint of "3.0" suggests that employees perceive the issue more positively than negatively. Scores of "4.0" or higher indicate areas of substantial strength for the organization. Conversely, scores below "3.0" are viewed more negatively by employees. Items that receive below a "2.0" should be a significant source of concern for the organization and should receive immediate attention.
Constructs The survey constructs are designed to broadly profile organizational strengths and areas of concern so that interventions may be targeted appropriately. Survey constructs are developed from a group of related survey items. The construct score is calculated by averaging the related item scores together and multiplying that result by 100. Scores for the constructs range from a low of 100 to a high of 500. An item may belong to one or several constructs, however, not every item is associated with a construct.
Dimensions The framework, at its highest level, consists of five workplace dimensions. These five dimensions capture the total work environment. Each dimension consists of several survey constructs. The dimension score also ranges from 100 to 500 and is an average of the construct scores belonging to the dimension.
Over Time and Benchmark Data
Comparison scores are provided when available. One of the benefits of continuing to participate in the survey is that over time data shows how employees' views have changed as a result of implementing efforts suggested by previous survey results. Additionally, benchmarks help to illustrate how this organization is performing relative to organizations of similar size, organizations with similar missions and to the performance of all organizations that participated in this survey.
Survey Dimensions and Constructs
Dimension I Work Group
Dimension IIAccommodations
Dimension IIIOrganizational
Features
Dimension IV Information
Dimension VPersonal
Supervisor Effectiveness Fairness
Team Effectiveness Diversity
Fair PayPhysical Environment
Benefits Employment Development
Change OrientedGoal Oriented Holographic
Strategic Quality
Internal Availability
External
Job SatisfactionTime and Stress
Burnout Empowerment
763 -Univ. North Texas Health Science Ctr. Fort Worth Page 5

The Survey of Organizational Excellence
112-UNT Health
Dimension Analysis In order for organizations to improve, there is a need to compare performance with other organizations. This comparison process is called benchmarking. The Survey provides a number of convenient and useful comparisons. Internal comparison is achieved by comparing the scores for this subgroup to the scores for the organization as a whole. Star-Performers can be identified for each area, and with some interpretation and analysis, other subunits can implement action plans to emulate those strengths. A second kind of benchmark focuses upon organizations that perform similar functions. The nature of an organization's work can have an impact on organizational features and employee experiences. Lastly, a benchmark is provided for a comparison against all other organizations that have taken the Survey in the current time frame. The data in this table are composed of the organization's scores for this iteration of the Survey and comparison data from the latest benchmark scores. The scores for the organization appear to the right. Dimensions Score
200 225 250 275 300 325 350 375 400 425 450 475 500
OM
A317Work Group
OMA
323Accommodations
OMA
333Organizational Features
OM
A324Information
OMA
337Personal
Scores for your Organizational Category (Numeric Score to the right in Blue)Organization - Score for your whole organizationOMission - Benchmark for organizations with a similar missionMAll Respondents - Benchmark for all of the survey respondentsA
763 -Univ. North Texas Health Science Ctr. Fort Worth Page 6

The Survey of Organizational Excellence
112-UNT Health
Construct Analysis Constructs have been color coded to highlight the subgroup's areas of strength and areas of concern. The 5 highest scoring constructs are blue, the 5 lowest scoring constructs are red, and the remaining 10 constructs are yellow.
Each construct is displayed below with its corresponding score. Highest scoring constructs are areas of strength for this subgroup while the lowest scoring constructs are areas of concern. Scores above 300 suggest that employees perceive the issue more positively than negatively, and scores of 400 or higher indicate areas of substantial strength. Conversely, scores below 300 are viewed more negatively by employees, and scores below 200 should be a significant source of concern for the organization and should receive immediate attention.
Constructs Score 200 225 250 275 300 325 350 375 400 425 450 475 500
322Supervisor Effectiveness
318Fairness
302Team Effectiveness
328Diversity
243Fair Pay
361Physical Environment
358Benefits
332Employment Development
317Change Oriented
322Goal Oriented
322Holographic
361Strategic
344Quality
297Internal
332Availability
343External
338Job Satisfaction
338Time and Stress
343Burnout
331Empowerment
Higher Scoring ConstructsModerate Scoring ConstructsLower Scoring Constructs
763 -Univ. North Texas Health Science Ctr. Fort Worth Page 7

The Survey of Organizational Excellence
112-UNT Health
Organizational Typology: Areas of Strength The following Constructs are relative strengths for this subgroup:
Strategic Score: 361General Description: The Strategic (Strategic Orientation) construct reflects employees' thinking about how the organization responds to external influences that should play a role in defining the organization's mission, vision, services, and products. Implied in this construct is the ability of the organization to seek out and work with relevant external entities. Average scores suggest that employees feel there is room for improvement in how the organization interprets and understands the environment. Likely there is a concern that some programs are less relevant than in the past and that some processes do not seem knit into an overall vision. In general problems with Strategic Orientation stem from these factors: employees having a limited grasp of the goals of the organization, high levels of "silos", organizational components that function in isolation from other organizational processes, and the nature of the specific work being performed. Remedying Strategic Orientation requires careful study to determine the correct causative factors but assessing environmental understandings is the starting point. Conduct and compile customer assessments and review findings with staff at all levels. Benchmark processes with similar and competitive organizations. Use the employee feedback sessions to make a more complete determination for the causes of low Strategic Orientation scores.
Physical Environment Score: 361General Description: The Physical Environment construct captures employees' perceptions of the total work atmosphere and the degree to which employees believe that it is a "safe" working environment. This construct addresses the "feel" of the workplace as perceived by the employee. Average scores suggest that room for improvement exists and lack of attention can lead to dropping scores. Attention may be needed to quality and amount of office space, equipment, parking and the location of facilities.
763 -Univ. North Texas Health Science Ctr. Fort Worth Page 8

The Survey of Organizational Excellence
112-UNT Health
Organizational Typology: Areas of Strength Relative Strengths Continued:
Benefits Score: 358General Description: The Benefits construct provides a good indication of the role the benefit package plays in attracting and retaining employees in the organization. It reflects comparable benefits that employees feel exist with other organizations in the area. Average scores suggest that room for improvement exists and lack of attention can lead to dropping scores. Benefits are often not viewed as motivators for employees but more as hygiene factors. This means employees will become restless, upset and dissatisfied when benefits are perceived as less than needed or fair. Part of the follow up to the Survey when data are returned is to discuss the results with employees and secure more elaborate explanations of important issues. In general concerns about benefits stem from these factors: level and type of benefits available, the cost and employees being able to understand and use the benefits package. Remedying concerns about benefits requires data collection from employees and competitive organizations to determine the correct causative factors. Use the employee feedback sessions to make a more complete determination for the causes of low Benefits scores.
Quality Score: 344General Description: The Quality construct focuses upon the degree to which quality principles, such as customer service and continuous improvement are a part of the organizational culture. This Construct also addresses the extent to which employees feel that they have the resources to deliver quality services. Quality comes from attention to detail, customers and overall effort. Average scores mean that there is important room for improvement. In general quality is a result of understanding the needs of customers or clients coupled with a continuous and zealous examination of products and processes for improvement. Achieving quality requires the full and thoughtful attention of all members of the organization. Essential to maintaining high levels is clear articulation of goals, careful attention to changes in the environment that might affect resources or heightened competition and vigorous participation by all members. Leadership must maintain a clear articulation of the importance of quality and the role of everyone in achieving quality. Improvement is best addressed by developing clear standards of quality at all levels, urging employee assessment and feedback, and creating measures of quality for all work.
763 -Univ. North Texas Health Science Ctr. Fort Worth Page 9

The Survey of Organizational Excellence
112-UNT Health
Organizational Typology: Areas of Strength Relative Strengths Continued:
External Score: 343General Description: The External Communication construct looks at how information flows into the organization from external sources, and conversely, how information flows from inside the organization to external constituents. It addresses the ability of organizational members to synthesize and apply external information to work performed by the organization. Average scores suggest that immediate consideration needs to be made to improve tools and process for external communication. In general External Communication is a function of these factors: nature of the organization's services or products and those who use the products, types of technology deployed for communication and knowledge of the organization of the needs of those who use its services. Remedying External Communication requires careful study to determine the correct causative factors. Carefully examine the customer base, operating hours of the organization, location of offices and knowledge of contact personnel with customer needs.
763 -Univ. North Texas Health Science Ctr. Fort Worth Page 10

The Survey of Organizational Excellence
112-UNT Health
Organizational Typology: Areas of Concern The following Constructs are relative areas of concern for this subgroup:
Fair Pay Score: 243Source of Concern
General Description: The Fair Pay construct addresses perceptions of the overall compensation package offered by the organization. It describes how well the compensation package "holds up" when employees compare it to similar jobs in other organizations. Low scores can come from many causes and may suggest a number of remedies. Part of the follow up to the Survey when data are returned is to discuss the results with employees and secure more elaborate explanations of important issues. Failure to successfully remedy Fair Pay problems is one of the more serious mistakes that leadership can make. These scores suggest that pay is a central concern or reason for satisfaction or discontent. Problems with pay can come from two or three causes and may suggest a number of remedies. In some situations pay does not meet comparables in similar organizations. In other cases individuals may perceive that pay levels are not appropriately set to work demands, experience and ability. At some times cost of living increases may cause sharp drops in purchasing power and employees will view pay levels as unfair. Remedying Fair Pay problems requires a determination of which of the above factors are serving to create the concerns. Triangulate low scores in Fair Pay by reviewing comparable positions in other organizations and cost of living information. Use the employee feedback sessions to make a more complete determination for the causes of low Fair Pay scores.
Internal Score: 297Source of Concern
General Description: The Internal Communication construct captures the flow of communication within the organization from the top-down, bottom-up, and across divisions or departments. It addresses the extent to which communication exchanges are open and candid and move the organization toward goal achievement. Low scores suggest that room for improvement is critical and lack of attention can lead to worsening coordination and embarrassing conflicts. Employees feel that information does not arrive in a timely fashion and often it is difficult to find needed facts. In general Internal Information problems stem from these factors: an organization that has outgrown an older verbal culture based upon a few people knowing "how to work the system", lack of investment and training in modern communication technology and, perhaps, vested interests that seek to control needed information. Remedying Internal Communication requires careful study to determine the correct causative factors. Triangulate low scores in Internal Communication by reviewing existing policy and procedural manuals to determine their availability. Assess how well telephone systems are articulated and if e-mail, faxing and Internet modalities are developed and in full use. Use the employee feedback sessions to make a more complete determination for the causes of low Internal Communication scores.
763 -Univ. North Texas Health Science Ctr. Fort Worth Page 11
The Survey of Organizational Excellence
112-UNT Health
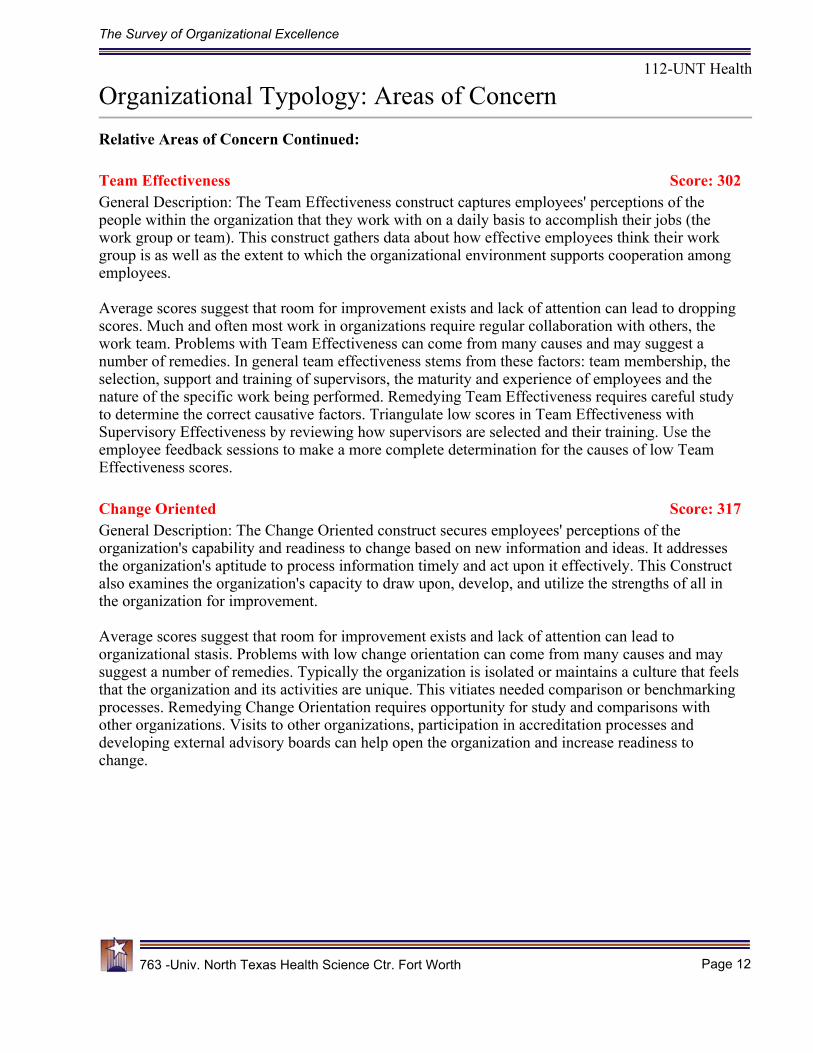
Organizational Typology: Areas of Concern Relative Areas of Concern Continued:
Team Effectiveness Score: 302General Description: The Team Effectiveness construct captures employees' perceptions of the people within the organization that they work with on a daily basis to accomplish their jobs (the work group or team). This construct gathers data about how effective employees think their work group is as well as the extent to which the organizational environment supports cooperation among employees. Average scores suggest that room for improvement exists and lack of attention can lead to dropping scores. Much and often most work in organizations require regular collaboration with others, the work team. Problems with Team Effectiveness can come from many causes and may suggest a number of remedies. In general team effectiveness stems from these factors: team membership, the selection, support and training of supervisors, the maturity and experience of employees and the nature of the specific work being performed. Remedying Team Effectiveness requires careful study to determine the correct causative factors. Triangulate low scores in Team Effectiveness with Supervisory Effectiveness by reviewing how supervisors are selected and their training. Use the employee feedback sessions to make a more complete determination for the causes of low Team Effectiveness scores.
Change Oriented Score: 317General Description: The Change Oriented construct secures employees' perceptions of the organization's capability and readiness to change based on new information and ideas. It addresses the organization's aptitude to process information timely and act upon it effectively. This Construct also examines the organization's capacity to draw upon, develop, and utilize the strengths of all in the organization for improvement. Average scores suggest that room for improvement exists and lack of attention can lead to organizational stasis. Problems with low change orientation can come from many causes and may suggest a number of remedies. Typically the organization is isolated or maintains a culture that feels that the organization and its activities are unique. This vitiates needed comparison or benchmarking processes. Remedying Change Orientation requires opportunity for study and comparisons with other organizations. Visits to other organizations, participation in accreditation processes and developing external advisory boards can help open the organization and increase readiness to change.
763 -Univ. North Texas Health Science Ctr. Fort Worth Page 12

The Survey of Organizational Excellence
112-UNT Health
Organizational Typology: Areas of Concern Relative Areas of Concern Continued:
Fairness Score: 318General Description: The Fairness construct measures the extent to which employees perceive that a level playing field exists for all members of the organization and that judgment of performance is based on fair, open, and job-based criteria. This Construct helps organizational leaders determine the extent to which employees perceive their general experience in the organization as positive. Average scores suggest that room for improvement exists and lack of attention can lead to dropping scores. No area in an organization is more important and often more resistant to change than the middle areas of the organization. Problems with fairness can come from many causes and may suggest a number of remedies. Part of the follow up to the Survey when data are returned is to discuss the results with employees and secure more elaborate explanations of important issues. In general Fairness perception stems from these factors: hiring, work assignment, promotions, the selection, support and training of supervisors, the maturity and experience of employees and the nature of the specific work being performed. Remedying Fairness requires careful study to determine the correct causative factors. Triangulate low scores in Fairness with Supervisory Effectiveness by reviewing how supervisors are selected and their training. Use the employee feedback sessions to make a more complete determination for the causes of low Fairness scores.
763 -Univ. North Texas Health Science Ctr. Fort Worth Page 13

The Survey of Organizational Excellence
112-UNT Health
Organizational Categories: Internal Comparisons Organizations have the option of tailoring the survey instrument to facilitate specific internal comparisons. SOE respondents may be asked to identify up to three workplace categories in which they belong. Data from these categories make it possible to understand the viewpoints of employees from different parts of the organization and to determine the extent to which perceptions may or may not be consistent throughout the organization. These data are also helpful for many managers who want to use results specific to their office or division in localized improvement efforts. Positive scores indicate that, on average, employee in this Organizational Category feel better about a construct than the organization as a whole. Negative scores indicate that employees feel worse.
Constructs Points Deviated from Organizational Score -50 -40 -30 -20 -10 0 10 20 30 40 50
-24Supervisor Effectiveness
-18Fairness
-22Team Effectiveness
-21Diversity
-14Fair Pay
-18Physical Environment
-6Benefits
-22Employment Development
-26Change Oriented
-26Goal Oriented
-25Holographic
-11Strategic
-26Quality
-22Internal
-17Availability
-17External
-20Job Satisfaction
-16Time and Stress
-22Burnout
-17Empowerment
Work GroupAccommodationsOrganizational FeaturesInformationPersonal
763 -Univ. North Texas Health Science Ctr. Fort Worth Page 14

The Survey of Organizational Excellence
112-UNT Health
Interpreting Internal Comparisons Interpreting Internal ComparisonsInternal Comparison Data adds another dimension to an organization's scores. By viewing the data from an organizational category alongside the data for the organization as a whole - data suddenly is capable of highlighting the strengths and areas of concern specific to different functional areas of the organization. Areas for future action on a local, departmental, or functional level are visually evident, and employees will be able to confirm the results and see the benefits of being proactive both at the work group level and organization wide. Deviation Each organizational category is unique, and scores may differ naturally due to the differences in function, location, and many other factors. Breaking down large organizations into useful and meaningful subgroups helps go beyond using overall simple mean comparisons as the measure of the organization. While the distinctiveness of each category may cause the tendency for higher or lower than average scores, it is still important to try to determine reasons for deviations. This organizational category has 0 constructs that scored higher than the organizational average. Determining Causes This is a turbulent time for many organizations, and the troubles an organization faces as a whole can also been seen in its sub-units. Any number of factors, both within and outside of leadership control can affect scores. While score deviations cannot be attributed directly to one particular factor, it is worthwhile to consider all possibilities and use the most likely culprits as a starting point for developing action plans and encouraging positive trends. Consider any factors unique to this sub-unit that may be cause for deviation in scores. Is the quality of facilities equal in all locations? Do all supervisors receive adequate training? Do some departments have better equipment than others? Does this category differ greatly in certain demographic areas such as gender, pay scale, or merit increase? The Data Report provides detailed data on each of the survey items and constructs including descriptions and item-construct relationships. Compare Organizational and Category scores for the individual items that make up a construct to try to isolate contributing factors. Once you have a list of factors, hold a focus group consisting of a diverse group of employees and try to get a better idea of why the employees responded the way they did. You may find that there are many other complex factors at work, but having a pre-compiled set of possible factors will provide a starting point. Targeting Improvement on Multiple Fronts By analyzing data for sub-units and the organization as a whole, you can approach organizational improvement on multiple fronts. The organization as a whole will likely target specific areas for improvement. Sub-unit data can be used to target areas for improvement within the sub-unit, or it can be used to help improve the entire organization. If there are any sub-units that scored particularly high in certain areas, they should be identified as star-performers and an effort should be made to identify the contributing factors so that they can be emulated organization wide. By using internal comparisons, solutions can be implemented using the resources an organization already has, rather than using expensive outside consultants with limited knowledge of the organization. Who knows the organization better than its employees?
763 -Univ. North Texas Health Science Ctr. Fort Worth Page 15

The Survey of Organizational Excellence
112-UNT Health
Participant Profile Demography data help one to see if the Survey response rate matches the general features of all employees in the organization. It is also an important factor in being able to determine the level of consensus and shared viewpoints across the organization. It may also help to indicate the extent to which the membership of the organization is representative of the local community and those persons that use the services and products of the organization. Charts and percentages are based on valid responses. Slight variations from the Data Aggregation Report are due to respondents who chose not to answer particular demographic items.
Race/Ethnic Identification Diversity within the workplace provides resources for innovation. A diverse workforce helps insure that different ideas are understood, and that the community sees the organization as representative of the community.
0% 25% 50% 75% 100%
8%African-American10%Hispanic-American
70%Anglo-American8%Asian-American
3%Multiracial/Other
Age Age Diversity contributes to having a well-balanced workplace. Different age groups bring different experiences and perspectives to the organization. Large percentages of older individuals may be a cause of concern if a number of key employees are nearing retirement age. Seek ways to preserve the culture and experiences these individuals have brought to the organization. Be mindful that people have different challenges and resources at various age levels and should see that leadership incorporates these understandings.
0% 25% 50% 75% 100%
13%16 to 29 years old12%30 to 39 years old
30%40 to 49 years old30%50 to 59 years old
15%60 years and older
Gender The ratio of males to females within an organization can vary among different organizations. However, extreme imbalances in the gender ratio should be a source of concern for the organization and may require immediate attention. Give consideration to the types of work being performed and be open to unintentional bias in job and employee selection as well as promotion consideration.
Male 23%Female 77%
763 -Univ. North Texas Health Science Ctr. Fort Worth Page 16

The Survey of Organizational Excellence
112-UNT Health
Participant Profile
Employee Retention The percent of employees that see themselves working for this organization in two years is a good indicator of how well the organization is doing at retaining its employees. Very low retention should be a source of concern and may require immediate attention.
Working in 2 yrs 89%Not working 11%
Promotion The percentage of employees that receive a promotion can vary among organizations. While organizational growth may increase the likelihood of promotional opportunities, organizations should not simply wait for growth. Low percentages may indicate that current employees do not compete well for promotional opportunities. This would urge study of the Employee Development Construct to gauge the level of employee interest. Promotion 25%
No Promotion 75%
Merit Increase The percentage of employees that receive a merit increase can vary between organizations. Low percentages may indicate that employers need to review expectations of current employees and those efforts that seek to increase performance.
Merit Increase 55%No Merit Increase 45%
763 -Univ. North Texas Health Science Ctr. Fort Worth Page 17

The Survey of Organizational Excellence
112-UNT Health
Interpretation and Intervention After the survey data has been complied, the results are returned to the survey liaison, executive director, and board or commission chair approximately one month after data collection stops. These individuals are strongly encouraged to share results with all survey participants in the organization. Survey results are provided in several formats to provide maximum flexibility in interpreting the data and sharing the data with the entire organization. The quick turnaround in reporting allows for immediate action upon the results while they are still current. The Executive Summary provides a graphical depiction of the data. Graphical data can easily be reproduced in a company newsletter or website. For additional detailed data, the Data Report is useful for examining survey data on the individual item level. Response counts, averages, standard deviations, and response distributions are provided for each item. Excel files provide electronic access to scores. Scores can be sorted in various ways to help determine strengths and areas of concern. The electronic data can also be used by Excel or other software to create additional graphs or charts. Any of these formats can be used alone or in combination to create rich information on which employees can base their ideas for change. Benchmark data provide an opportunity to get a true feel of the organization's performance. Comparing the organization's score to scores outside of the organization can unearth unique strengths and areas of concern. Several groups of benchmarks are provided to allow the freedom to choose which comparisons are most relevant. If organizational categories were used, then internal comparisons can be made between different functional areas of the organization. By using these comparisons, functional areas can be identified for star performance in a particular construct, and a set of "best practices" can be created to replicate their success throughout the organization. These Survey Data provide a unique perspective of the average view of all that took the Survey. It is important to examine these findings and take them back to the employees for interpretation and to select priority areas for improvement. This also provides an opportunity for the organization to recognize and celebrate areas that members have judged to be areas of relative strength. By seeking participation and engaging people on how the organization functions, you have taken a specific step in increasing organizational capital. High organizational capital means high trust among employees and a greater likelihood of improved efforts and good working relationships with clients and customers. Ideas for getting employees involved in the change process:
Hold small focus groups to find out how the employees would interpret the results Conduct small customized follow-up surveys to collect additional information including comments Provide employees with questionnaires/comment cards to express their ideas
Ideas for sharing data with the organization:
Publish results in an organizational newsletter or intranet site Discuss results in departmental meetings Create a PowerPoint presentation of the results and display them on kiosks
763 -Univ. North Texas Health Science Ctr. Fort Worth Page 18
The Survey of Organizational Excellence
112-UNT Health
Timeline
February and March: Interpreting the Data
Data is returned to survey liaisons, executive directors and board members Review Survey data including the Executive Summary with executive staff Develop plans for circulating all the data sequentially and providing interpretations for all staff
April: Distributing Results to the Entire Organization
Implement the plans for circulating the data to all staff Create 3 to 4 weekly or monthly reports or organization newsletters Report a portion of the Constructs and Questions, providing the data along with illustrations pertinent to the organization Select a time to have every employee participate in a work unit group to review the reports as they are distributed to all staff, with one group leader assigned to every group. The size of the groups should be limited to about a dozen people at a time. A time limit should be set not to exceed two hours.
May: Planning for Change
Designate the Change Team composed of a diagonal slice across the organization that will guide the effort Identify Work Unit Groups around actual organizational work units and start each meeting by reviewing strengths as indicated in the data report. Brainstorm on how to best address weaknesses Establish Procedures for recording the deliberations of the Work Unit Group and returning those data to the Change Team Decide upon the Top Priority Change Topic and Methods necessary for making the change. Web-based Discussion Groups and Mini-Surveys are convenient technologies First change effort begins Repeat for the next change topic
June and Beyond: Implementation and Interventions
Have the Change Team compile the Priority Change Topics and Methods necessary for making the change and present them to the executive staff Discuss the administrative protocols necessary for implementing the changes Determine the plan of action and set up a reasonable timeline for implementation Keep employees informed about changes as they occur through meetings, newsletters, or intranet publications Resurvey to document the effectiveness of the change
763 -Univ. North Texas Health Science Ctr. Fort Worth Page 19