UNITED STATES SECURITIES AND EXCHANGE …€¢ Diluted earnings per share to UnitedHealth Group...
37
ˆ200Gk8RZRjJqtXv75Š 200Gk8RZRjJqtXv75 922183 COV 1 UNITEDHEALTH GROUP I UHG FORM 10-Q 922183 07-May-2015 02:19 EST CLN PS MIN RR Donnelley ProFile SWRpf_rend 6* PMT 1C SWRP64RS25 11.6.18 g26i00-1.0 UNITED STATES SECURITIES AND EXCHANGE COMMISSION Washington, D.C. 20549 Form 10-Q È QUARTERLY REPORT PURSUANT TO SECTION 13 OR 15(d) OF THE SECURITIES EXCHANGE ACT OF 1934 FOR THE QUARTERLY PERIOD ENDED MARCH 31, 2015 or ‘ TRANSITION REPORT PURSUANT TO SECTION 13 OR 15(d) OF THE SECURITIES EXCHANGE ACT OF 1934 FOR THE TRANSITION PERIOD FROM TO Commission file number: 1-10864 UnitedHealth Group Incorporated (Exact name of registrant as specified in its charter) Minnesota 41-1321939 (State or other jurisdiction of incorporation or organization) (I.R.S. Employer Identification No.) UnitedHealth Group Center 9900 Bren Road East Minnetonka, Minnesota 55343 (Address of principal executive offices) (Zip Code) (952) 936-1300 (Registrant’s telephone number, including area code) Indicate by check mark whether the registrant (1) has filed all reports required to be filed by Section 13 or 15(d) of the Securities Exchange Act of 1934 during the preceding 12 months (or for such shorter period that the registrant was required to file such reports), and (2) has been subject to such filing requirements for the past 90 days. Yes È No ‘ Indicate by check mark whether the registrant has submitted electronically and posted on its corporate Web site, if any, every Interactive Data File required to be submitted and posted pursuant to Rule 405 of Regulation S-T (§232.405 of this chapter) during the preceding 12 months (or for such shorter period that the registrant was required to submit and post such files). Yes È No ‘ Indicate by check mark whether the registrant is a large accelerated filer, an accelerated filer, a non-accelerated filer, or a smaller reporting company. See the definitions of “large accelerated filer,” “accelerated filer” and “smaller reporting company” in Rule 12b-2 of the Exchange Act: Large accelerated filer È Accelerated filer ‘ Non-accelerated filer ‘ Smaller reporting company ‘ Indicate by check mark whether the registrant is a shell company (as defined in Rule 12b-2 of the Exchange Act). Yes ‘ No È As of April 30, 2015, there were 951,904,261 shares of the registrant’s Common Stock, $.01 par value per share, issued and outstanding.
Transcript of UNITED STATES SECURITIES AND EXCHANGE …€¢ Diluted earnings per share to UnitedHealth Group...

ˆ200Gk8RZRjJqtXv75Š200Gk8RZRjJqtXv75
922183 COV 1UNITEDHEALTH GROUP IUHG FORM 10-Q 922183
07-May-2015 02:19 ESTCLN PSMIN
RR Donnelley ProFile SWRpf_rend 6*PMT 1C
SWRP64RS2511.6.18
g26i00-1.0
UNITED STATESSECURITIES AND EXCHANGE COMMISSION
Washington, D.C. 20549
Form 10-Q
È QUARTERLY REPORT PURSUANT TO SECTION 13 OR 15(d) OF THESECURITIES EXCHANGE ACT OF 1934
FOR THE QUARTERLY PERIOD ENDED MARCH 31, 2015
or
‘ TRANSITION REPORT PURSUANT TO SECTION 13 OR 15(d) OF THESECURITIES EXCHANGE ACT OF 1934
FOR THE TRANSITION PERIOD FROM TO
Commission file number: 1-10864
UnitedHealth Group Incorporated(Exact name of registrant as specified in its charter)
Minnesota 41-1321939(State or other jurisdiction of
incorporation or organization)(I.R.S. Employer
Identification No.)
UnitedHealth Group Center9900 Bren Road East
Minnetonka, Minnesota 55343(Address of principal executive offices) (Zip Code)
(952) 936-1300(Registrant’s telephone number, including area code)
Indicate by check mark whether the registrant (1) has filed all reports required to be filed by Section 13 or 15(d)of the Securities Exchange Act of 1934 during the preceding 12 months (or for such shorter period that theregistrant was required to file such reports), and (2) has been subject to such filing requirements for the past 90days. Yes È No ‘
Indicate by check mark whether the registrant has submitted electronically and posted on its corporate Web site,if any, every Interactive Data File required to be submitted and posted pursuant to Rule 405 of Regulation S-T(§232.405 of this chapter) during the preceding 12 months (or for such shorter period that the registrant wasrequired to submit and post such files). Yes È No ‘
Indicate by check mark whether the registrant is a large accelerated filer, an accelerated filer, a non-acceleratedfiler, or a smaller reporting company. See the definitions of “large accelerated filer,” “accelerated filer” and“smaller reporting company” in Rule 12b-2 of the Exchange Act:
Large accelerated filer È Accelerated filer ‘ Non-accelerated filer ‘ Smaller reporting company ‘
Indicate by check mark whether the registrant is a shell company (as defined in Rule 12b-2 of theExchange Act). Yes ‘ No È
As of April 30, 2015, there were 951,904,261 shares of the registrant’s Common Stock, $.01 par value per share,issued and outstanding.
ˆ200Gk8RZRjKVk8S7\Š200Gk8RZRjKVk8S7\
922183 TOC 1UNITEDHEALTH GROUP IUHG FORM 10-Q 922183
07-May-2015 02:52 ESTCLN PSMIN
RR Donnelley ProFile SWRsamna0slSTART PAGE
8*PMT 1C
SWRFBU-MWE-XN1611.6.18
UNITEDHEALTH GROUP
Table of Contents
Page
Part I. Financial InformationItem 1. Financial Statements (unaudited) . . . . . . . . . . . . . . . . . . . . . . . . . . . . . . . . . . . . . . . . . . . . . . . . . . 1
Condensed Consolidated Balance Sheets as of March 31, 2015 and December 31, 2014 . . . . . . 1Condensed Consolidated Statements of Operations for the Three Months Ended March 31,
2015 and 2014 . . . . . . . . . . . . . . . . . . . . . . . . . . . . . . . . . . . . . . . . . . . . . . . . . . . . . . . . . . . . . . 2Condensed Consolidated Statements of Comprehensive Income for the Three Months Ended
March 31, 2015 and 2014 . . . . . . . . . . . . . . . . . . . . . . . . . . . . . . . . . . . . . . . . . . . . . . . . . . . . . . 3Condensed Consolidated Statements of Changes in Shareholders’ Equity for the Three Months
Ended March 31, 2015 and 2014 . . . . . . . . . . . . . . . . . . . . . . . . . . . . . . . . . . . . . . . . . . . . . . . . . 4Condensed Consolidated Statements of Cash Flows for the Three Months Ended March 31, 2015 and
2014 . . . . . . . . . . . . . . . . . . . . . . . . . . . . . . . . . . . . . . . . . . . . . . . . . . . . . . . . . . . . . . . . . . . . . . 5Notes to the Condensed Consolidated Financial Statements . . . . . . . . . . . . . . . . . . . . . . . . . . . . . 61. Basis of Presentation . . . . . . . . . . . . . . . . . . . . . . . . . . . . . . . . . . . . . . . . . . . . . . . . . . . . . . . . . 62. Investments . . . . . . . . . . . . . . . . . . . . . . . . . . . . . . . . . . . . . . . . . . . . . . . . . . . . . . . . . . . . . . . . . 73. Fair Value . . . . . . . . . . . . . . . . . . . . . . . . . . . . . . . . . . . . . . . . . . . . . . . . . . . . . . . . . . . . . . . . . . 94. Medicare Part D Pharmacy Benefits . . . . . . . . . . . . . . . . . . . . . . . . . . . . . . . . . . . . . . . . . . . . . 135. Medical Costs Reserve Development . . . . . . . . . . . . . . . . . . . . . . . . . . . . . . . . . . . . . . . . . . . . . 136. Health Insurance Industry Tax . . . . . . . . . . . . . . . . . . . . . . . . . . . . . . . . . . . . . . . . . . . . . . . . . . 137. Commercial Paper and Long-Term Debt . . . . . . . . . . . . . . . . . . . . . . . . . . . . . . . . . . . . . . . . . . 148. Share-Based Compensation . . . . . . . . . . . . . . . . . . . . . . . . . . . . . . . . . . . . . . . . . . . . . . . . . . . . 169. Commitments and Contingencies . . . . . . . . . . . . . . . . . . . . . . . . . . . . . . . . . . . . . . . . . . . . . . . . 1710. Segment Financial Information . . . . . . . . . . . . . . . . . . . . . . . . . . . . . . . . . . . . . . . . . . . . . . . . 19
Item 2. Management’s Discussion and Analysis of Financial Condition and Results of Operations . . . . 20Item 3. Quantitative and Qualitative Disclosures About Market Risk . . . . . . . . . . . . . . . . . . . . . . . . . . . . 30Item 4. Controls and Procedures . . . . . . . . . . . . . . . . . . . . . . . . . . . . . . . . . . . . . . . . . . . . . . . . . . . . . . . . . 31
Part II. Other InformationItem 1. Legal Proceedings . . . . . . . . . . . . . . . . . . . . . . . . . . . . . . . . . . . . . . . . . . . . . . . . . . . . . . . . . . . . . 32Item 1A. Risk Factors . . . . . . . . . . . . . . . . . . . . . . . . . . . . . . . . . . . . . . . . . . . . . . . . . . . . . . . . . . . . . . . . . . 32Item 2. Unregistered Sales of Equity Securities and Use of Proceeds . . . . . . . . . . . . . . . . . . . . . . . . . . . . 32Item 6. Exhibits . . . . . . . . . . . . . . . . . . . . . . . . . . . . . . . . . . . . . . . . . . . . . . . . . . . . . . . . . . . . . . . . . . . . . . 33Signatures . . . . . . . . . . . . . . . . . . . . . . . . . . . . . . . . . . . . . . . . . . . . . . . . . . . . . . . . . . . . . . . . . . . . . . . . . . . . . 34
ˆ200Gk8RZRjKBT6ThvŠ200Gk8RZRjKBT6Thv
922183 TX 1UNITEDHEALTH GROUP IUHG FORM 10-Q 922183
07-May-2015 02:37 ESTCLN PSMIN
RR Donnelley ProFile SWRsamna0slSTART PAGE
9*PMT 1C
SWRFBU-MWE-XN1611.6.18
PART I
ITEM 1. FINANCIAL STATEMENTS
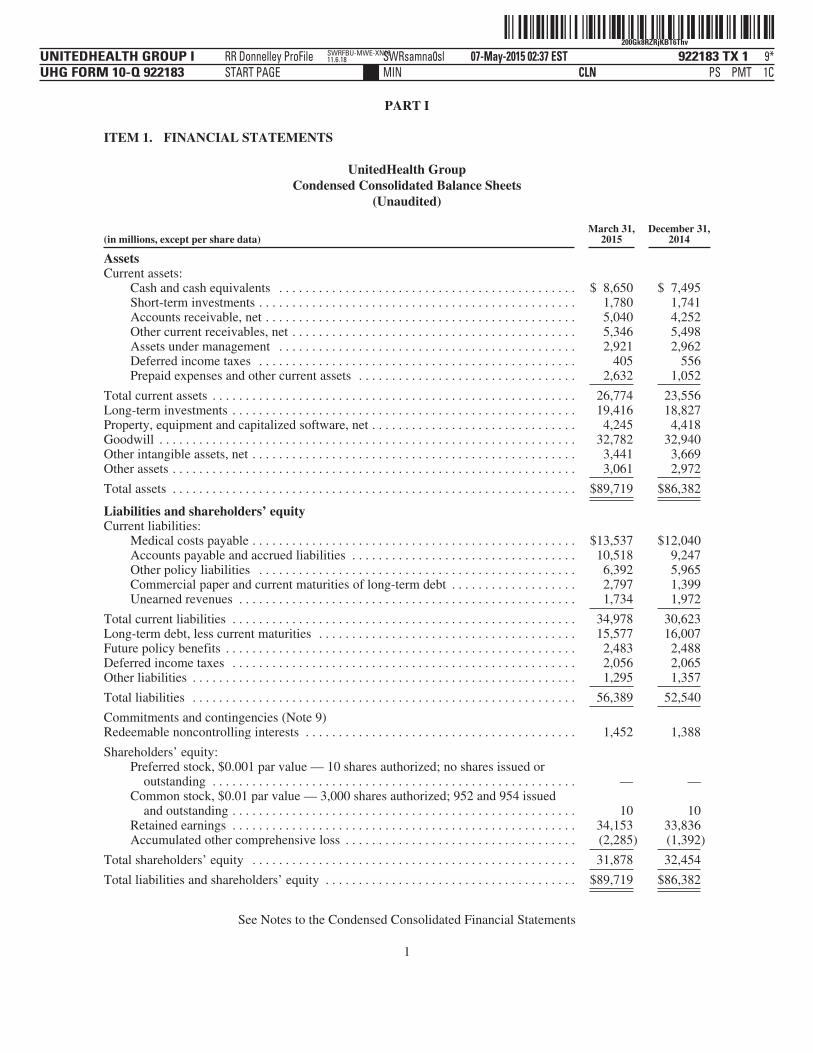
UnitedHealth GroupCondensed Consolidated Balance Sheets
(Unaudited)
(in millions, except per share data)March 31,
2015December 31,
2014
AssetsCurrent assets:
Cash and cash equivalents . . . . . . . . . . . . . . . . . . . . . . . . . . . . . . . . . . . . . . . . . . . . . $ 8,650 $ 7,495Short-term investments . . . . . . . . . . . . . . . . . . . . . . . . . . . . . . . . . . . . . . . . . . . . . . . . 1,780 1,741Accounts receivable, net . . . . . . . . . . . . . . . . . . . . . . . . . . . . . . . . . . . . . . . . . . . . . . . 5,040 4,252Other current receivables, net . . . . . . . . . . . . . . . . . . . . . . . . . . . . . . . . . . . . . . . . . . . 5,346 5,498Assets under management . . . . . . . . . . . . . . . . . . . . . . . . . . . . . . . . . . . . . . . . . . . . . 2,921 2,962Deferred income taxes . . . . . . . . . . . . . . . . . . . . . . . . . . . . . . . . . . . . . . . . . . . . . . . . 405 556Prepaid expenses and other current assets . . . . . . . . . . . . . . . . . . . . . . . . . . . . . . . . . 2,632 1,052
Total current assets . . . . . . . . . . . . . . . . . . . . . . . . . . . . . . . . . . . . . . . . . . . . . . . . . . . . . . . 26,774 23,556Long-term investments . . . . . . . . . . . . . . . . . . . . . . . . . . . . . . . . . . . . . . . . . . . . . . . . . . . . 19,416 18,827Property, equipment and capitalized software, net . . . . . . . . . . . . . . . . . . . . . . . . . . . . . . . 4,245 4,418Goodwill . . . . . . . . . . . . . . . . . . . . . . . . . . . . . . . . . . . . . . . . . . . . . . . . . . . . . . . . . . . . . . . 32,782 32,940Other intangible assets, net . . . . . . . . . . . . . . . . . . . . . . . . . . . . . . . . . . . . . . . . . . . . . . . . . 3,441 3,669Other assets . . . . . . . . . . . . . . . . . . . . . . . . . . . . . . . . . . . . . . . . . . . . . . . . . . . . . . . . . . . . . 3,061 2,972
Total assets . . . . . . . . . . . . . . . . . . . . . . . . . . . . . . . . . . . . . . . . . . . . . . . . . . . . . . . . . . . . . $89,719 $86,382
Liabilities and shareholders’ equityCurrent liabilities:
Medical costs payable . . . . . . . . . . . . . . . . . . . . . . . . . . . . . . . . . . . . . . . . . . . . . . . . . $13,537 $12,040Accounts payable and accrued liabilities . . . . . . . . . . . . . . . . . . . . . . . . . . . . . . . . . . 10,518 9,247Other policy liabilities . . . . . . . . . . . . . . . . . . . . . . . . . . . . . . . . . . . . . . . . . . . . . . . . 6,392 5,965Commercial paper and current maturities of long-term debt . . . . . . . . . . . . . . . . . . . 2,797 1,399Unearned revenues . . . . . . . . . . . . . . . . . . . . . . . . . . . . . . . . . . . . . . . . . . . . . . . . . . . 1,734 1,972
Total current liabilities . . . . . . . . . . . . . . . . . . . . . . . . . . . . . . . . . . . . . . . . . . . . . . . . . . . . 34,978 30,623Long-term debt, less current maturities . . . . . . . . . . . . . . . . . . . . . . . . . . . . . . . . . . . . . . . 15,577 16,007Future policy benefits . . . . . . . . . . . . . . . . . . . . . . . . . . . . . . . . . . . . . . . . . . . . . . . . . . . . . 2,483 2,488Deferred income taxes . . . . . . . . . . . . . . . . . . . . . . . . . . . . . . . . . . . . . . . . . . . . . . . . . . . . 2,056 2,065Other liabilities . . . . . . . . . . . . . . . . . . . . . . . . . . . . . . . . . . . . . . . . . . . . . . . . . . . . . . . . . . 1,295 1,357
Total liabilities . . . . . . . . . . . . . . . . . . . . . . . . . . . . . . . . . . . . . . . . . . . . . . . . . . . . . . . . . . 56,389 52,540
Commitments and contingencies (Note 9)Redeemable noncontrolling interests . . . . . . . . . . . . . . . . . . . . . . . . . . . . . . . . . . . . . . . . . 1,452 1,388
Shareholders’ equity:Preferred stock, $0.001 par value — 10 shares authorized; no shares issued or
outstanding . . . . . . . . . . . . . . . . . . . . . . . . . . . . . . . . . . . . . . . . . . . . . . . . . . . . . . . — —Common stock, $0.01 par value — 3,000 shares authorized; 952 and 954 issued
and outstanding . . . . . . . . . . . . . . . . . . . . . . . . . . . . . . . . . . . . . . . . . . . . . . . . . . . . 10 10Retained earnings . . . . . . . . . . . . . . . . . . . . . . . . . . . . . . . . . . . . . . . . . . . . . . . . . . . . 34,153 33,836Accumulated other comprehensive loss . . . . . . . . . . . . . . . . . . . . . . . . . . . . . . . . . . . (2,285) (1,392)
Total shareholders’ equity . . . . . . . . . . . . . . . . . . . . . . . . . . . . . . . . . . . . . . . . . . . . . . . . . 31,878 32,454
Total liabilities and shareholders’ equity . . . . . . . . . . . . . . . . . . . . . . . . . . . . . . . . . . . . . . $89,719 $86,382
See Notes to the Condensed Consolidated Financial Statements
1
ˆ200Gk8RZRjKBYL$7xŠ200Gk8RZRjKBYL$7x
922183 TX 2UNITEDHEALTH GROUP IUHG FORM 10-Q 922183
07-May-2015 02:37 ESTCLN PSMIN
RR Donnelley ProFile SWRsamna0slSTART PAGE
8*PMT 1C
SWRFBU-MWE-XN1611.6.18
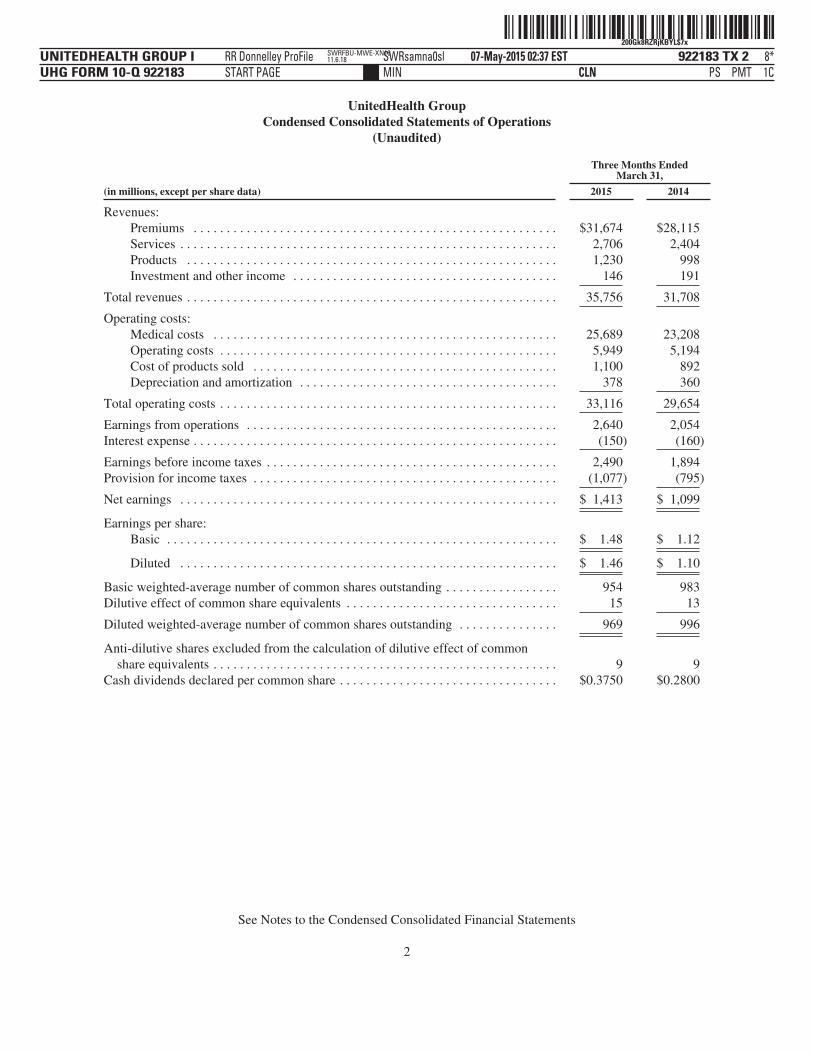
UnitedHealth GroupCondensed Consolidated Statements of Operations
(Unaudited)
Three Months EndedMarch 31,
(in millions, except per share data) 2015 2014
Revenues:Premiums . . . . . . . . . . . . . . . . . . . . . . . . . . . . . . . . . . . . . . . . . . . . . . . . . . . . . . . $31,674 $28,115Services . . . . . . . . . . . . . . . . . . . . . . . . . . . . . . . . . . . . . . . . . . . . . . . . . . . . . . . . . 2,706 2,404Products . . . . . . . . . . . . . . . . . . . . . . . . . . . . . . . . . . . . . . . . . . . . . . . . . . . . . . . . 1,230 998Investment and other income . . . . . . . . . . . . . . . . . . . . . . . . . . . . . . . . . . . . . . . . 146 191
Total revenues . . . . . . . . . . . . . . . . . . . . . . . . . . . . . . . . . . . . . . . . . . . . . . . . . . . . . . . . 35,756 31,708
Operating costs:Medical costs . . . . . . . . . . . . . . . . . . . . . . . . . . . . . . . . . . . . . . . . . . . . . . . . . . . . 25,689 23,208Operating costs . . . . . . . . . . . . . . . . . . . . . . . . . . . . . . . . . . . . . . . . . . . . . . . . . . . 5,949 5,194Cost of products sold . . . . . . . . . . . . . . . . . . . . . . . . . . . . . . . . . . . . . . . . . . . . . . 1,100 892Depreciation and amortization . . . . . . . . . . . . . . . . . . . . . . . . . . . . . . . . . . . . . . . 378 360
Total operating costs . . . . . . . . . . . . . . . . . . . . . . . . . . . . . . . . . . . . . . . . . . . . . . . . . . . 33,116 29,654
Earnings from operations . . . . . . . . . . . . . . . . . . . . . . . . . . . . . . . . . . . . . . . . . . . . . . . 2,640 2,054Interest expense . . . . . . . . . . . . . . . . . . . . . . . . . . . . . . . . . . . . . . . . . . . . . . . . . . . . . . . (150) (160)
Earnings before income taxes . . . . . . . . . . . . . . . . . . . . . . . . . . . . . . . . . . . . . . . . . . . . 2,490 1,894Provision for income taxes . . . . . . . . . . . . . . . . . . . . . . . . . . . . . . . . . . . . . . . . . . . . . . (1,077) (795)
Net earnings . . . . . . . . . . . . . . . . . . . . . . . . . . . . . . . . . . . . . . . . . . . . . . . . . . . . . . . . . $ 1,413 $ 1,099
Earnings per share:Basic . . . . . . . . . . . . . . . . . . . . . . . . . . . . . . . . . . . . . . . . . . . . . . . . . . . . . . . . . . . $ 1.48 $ 1.12
Diluted . . . . . . . . . . . . . . . . . . . . . . . . . . . . . . . . . . . . . . . . . . . . . . . . . . . . . . . . . $ 1.46 $ 1.10
Basic weighted-average number of common shares outstanding . . . . . . . . . . . . . . . . . 954 983Dilutive effect of common share equivalents . . . . . . . . . . . . . . . . . . . . . . . . . . . . . . . . 15 13
Diluted weighted-average number of common shares outstanding . . . . . . . . . . . . . . . 969 996
Anti-dilutive shares excluded from the calculation of dilutive effect of commonshare equivalents . . . . . . . . . . . . . . . . . . . . . . . . . . . . . . . . . . . . . . . . . . . . . . . . . . . . 9 9
Cash dividends declared per common share . . . . . . . . . . . . . . . . . . . . . . . . . . . . . . . . . $0.3750 $0.2800
See Notes to the Condensed Consolidated Financial Statements
2
ˆ200Gk8RZRjKBZuh7OŠ200Gk8RZRjKBZuh7O
922183 TX 3UNITEDHEALTH GROUP IUHG FORM 10-Q 922183
07-May-2015 02:37 ESTCLN PSMIN
RR Donnelley ProFile SWRsamna0slSTART PAGE
6*PMT 1C
SWRFBU-MWE-XN1611.6.18
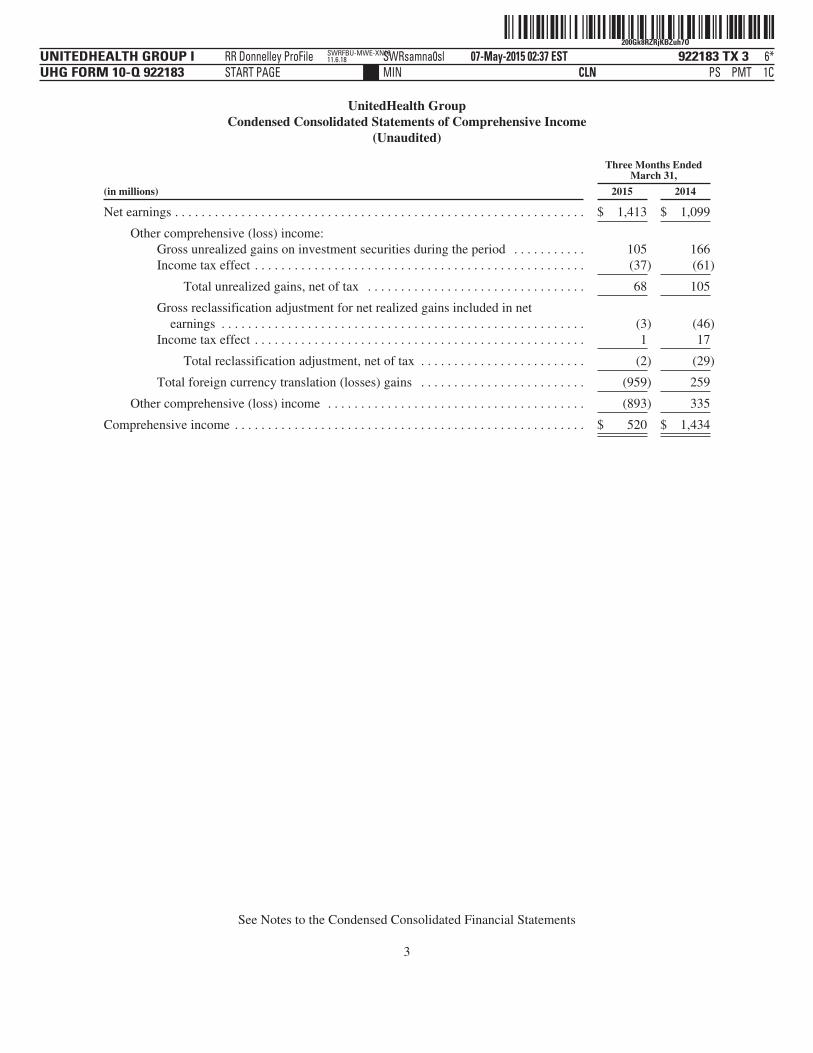
UnitedHealth GroupCondensed Consolidated Statements of Comprehensive Income
(Unaudited)
Three Months EndedMarch 31,
(in millions) 2015 2014
Net earnings . . . . . . . . . . . . . . . . . . . . . . . . . . . . . . . . . . . . . . . . . . . . . . . . . . . . . . . . . . . . . . $ 1,413 $ 1,099
Other comprehensive (loss) income:Gross unrealized gains on investment securities during the period . . . . . . . . . . . 105 166Income tax effect . . . . . . . . . . . . . . . . . . . . . . . . . . . . . . . . . . . . . . . . . . . . . . . . . . (37) (61)
Total unrealized gains, net of tax . . . . . . . . . . . . . . . . . . . . . . . . . . . . . . . . . 68 105
Gross reclassification adjustment for net realized gains included in netearnings . . . . . . . . . . . . . . . . . . . . . . . . . . . . . . . . . . . . . . . . . . . . . . . . . . . . . . . (3) (46)
Income tax effect . . . . . . . . . . . . . . . . . . . . . . . . . . . . . . . . . . . . . . . . . . . . . . . . . . 1 17
Total reclassification adjustment, net of tax . . . . . . . . . . . . . . . . . . . . . . . . . (2) (29)
Total foreign currency translation (losses) gains . . . . . . . . . . . . . . . . . . . . . . . . . (959) 259
Other comprehensive (loss) income . . . . . . . . . . . . . . . . . . . . . . . . . . . . . . . . . . . . . . . (893) 335
Comprehensive income . . . . . . . . . . . . . . . . . . . . . . . . . . . . . . . . . . . . . . . . . . . . . . . . . . . . . $ 520 $ 1,434
See Notes to the Condensed Consolidated Financial Statements
3
ˆ200Gk8RZRjKBaQK77Š200Gk8RZRjKBaQK77
922183 TX 4UNITEDHEALTH GROUP IUHG FORM 10-Q 922183
07-May-2015 02:37 ESTCLN PSMIN
RR Donnelley ProFile SWRsamna0slSTART PAGE
8*PMT 1C
SWRFBU-MWE-XN1611.6.18
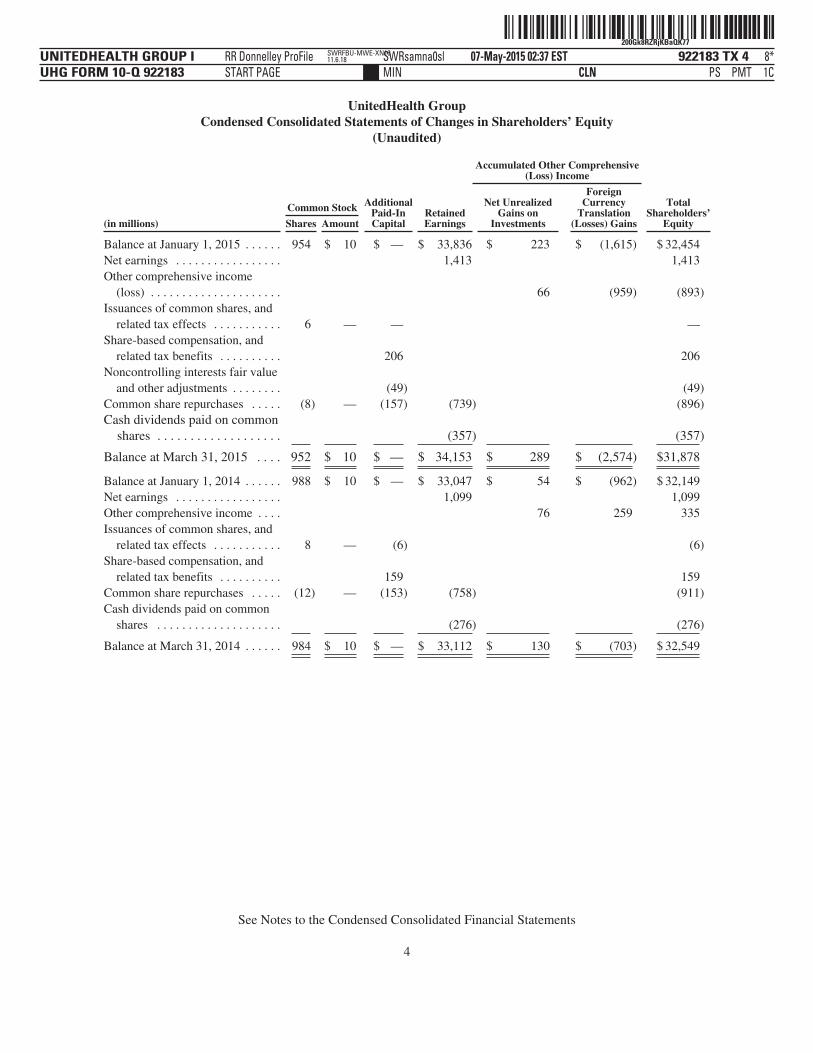
UnitedHealth GroupCondensed Consolidated Statements of Changes in Shareholders’ Equity
(Unaudited)
AdditionalPaid-InCapital
RetainedEarnings
Accumulated Other Comprehensive(Loss) Income
TotalShareholders’
Equity
Common Stock Net UnrealizedGains on
Investments
ForeignCurrency
Translation(Losses) Gains(in millions) Shares Amount
Balance at January 1, 2015 . . . . . . 954 $ 10 $ — $ 33,836 $ 223 $ (1,615) $ 32,454Net earnings . . . . . . . . . . . . . . . . . 1,413 1,413Other comprehensive income
(loss) . . . . . . . . . . . . . . . . . . . . . 66 (959) (893)Issuances of common shares, and
related tax effects . . . . . . . . . . . 6 — — —Share-based compensation, and
related tax benefits . . . . . . . . . . 206 206Noncontrolling interests fair value
and other adjustments . . . . . . . . (49) (49)Common share repurchases . . . . . (8) — (157) (739) (896)Cash dividends paid on common
shares . . . . . . . . . . . . . . . . . . . (357) (357)
Balance at March 31, 2015 . . . . 952 $ 10 $ — $ 34,153 $ 289 $ (2,574) $31,878
Balance at January 1, 2014 . . . . . . 988 $ 10 $ — $ 33,047 $ 54 $ (962) $ 32,149Net earnings . . . . . . . . . . . . . . . . . 1,099 1,099Other comprehensive income . . . . 76 259 335Issuances of common shares, and
related tax effects . . . . . . . . . . . 8 — (6) (6)Share-based compensation, and
related tax benefits . . . . . . . . . . 159 159Common share repurchases . . . . . (12) — (153) (758) (911)Cash dividends paid on common
shares . . . . . . . . . . . . . . . . . . . . (276) (276)
Balance at March 31, 2014 . . . . . . 984 $ 10 $ — $ 33,112 $ 130 $ (703) $ 32,549
See Notes to the Condensed Consolidated Financial Statements
4
ˆ200Gk8RZRjKBd1BhYŠ200Gk8RZRjKBd1BhY
922183 TX 5UNITEDHEALTH GROUP IUHG FORM 10-Q 922183
07-May-2015 02:37 ESTCLN PSMIN
RR Donnelley ProFile SWRsamna0slSTART PAGE
7*PMT 1C
SWRFBU-MWE-XN1611.6.18
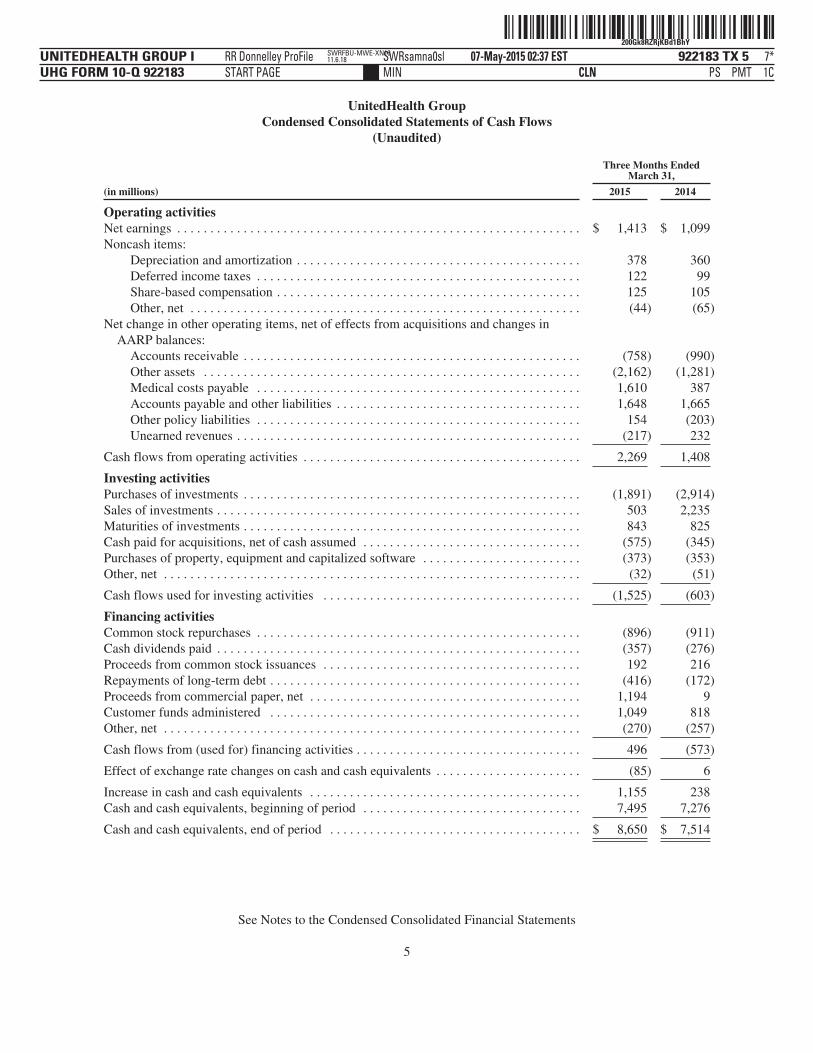
UnitedHealth GroupCondensed Consolidated Statements of Cash Flows
(Unaudited)
Three Months EndedMarch 31,
(in millions) 2015 2014
Operating activitiesNet earnings . . . . . . . . . . . . . . . . . . . . . . . . . . . . . . . . . . . . . . . . . . . . . . . . . . . . . . . . . . . . . $ 1,413 $ 1,099Noncash items:
Depreciation and amortization . . . . . . . . . . . . . . . . . . . . . . . . . . . . . . . . . . . . . . . . . . . 378 360Deferred income taxes . . . . . . . . . . . . . . . . . . . . . . . . . . . . . . . . . . . . . . . . . . . . . . . . . 122 99Share-based compensation . . . . . . . . . . . . . . . . . . . . . . . . . . . . . . . . . . . . . . . . . . . . . . 125 105Other, net . . . . . . . . . . . . . . . . . . . . . . . . . . . . . . . . . . . . . . . . . . . . . . . . . . . . . . . . . . . (44) (65)
Net change in other operating items, net of effects from acquisitions and changes inAARP balances:
Accounts receivable . . . . . . . . . . . . . . . . . . . . . . . . . . . . . . . . . . . . . . . . . . . . . . . . . . . (758) (990)Other assets . . . . . . . . . . . . . . . . . . . . . . . . . . . . . . . . . . . . . . . . . . . . . . . . . . . . . . . . . (2,162) (1,281)Medical costs payable . . . . . . . . . . . . . . . . . . . . . . . . . . . . . . . . . . . . . . . . . . . . . . . . . 1,610 387Accounts payable and other liabilities . . . . . . . . . . . . . . . . . . . . . . . . . . . . . . . . . . . . . 1,648 1,665Other policy liabilities . . . . . . . . . . . . . . . . . . . . . . . . . . . . . . . . . . . . . . . . . . . . . . . . . 154 (203)Unearned revenues . . . . . . . . . . . . . . . . . . . . . . . . . . . . . . . . . . . . . . . . . . . . . . . . . . . . (217) 232
Cash flows from operating activities . . . . . . . . . . . . . . . . . . . . . . . . . . . . . . . . . . . . . . . . . . 2,269 1,408
Investing activitiesPurchases of investments . . . . . . . . . . . . . . . . . . . . . . . . . . . . . . . . . . . . . . . . . . . . . . . . . . . (1,891) (2,914)Sales of investments . . . . . . . . . . . . . . . . . . . . . . . . . . . . . . . . . . . . . . . . . . . . . . . . . . . . . . . 503 2,235Maturities of investments . . . . . . . . . . . . . . . . . . . . . . . . . . . . . . . . . . . . . . . . . . . . . . . . . . . 843 825Cash paid for acquisitions, net of cash assumed . . . . . . . . . . . . . . . . . . . . . . . . . . . . . . . . . (575) (345)Purchases of property, equipment and capitalized software . . . . . . . . . . . . . . . . . . . . . . . . (373) (353)Other, net . . . . . . . . . . . . . . . . . . . . . . . . . . . . . . . . . . . . . . . . . . . . . . . . . . . . . . . . . . . . . . . (32) (51)
Cash flows used for investing activities . . . . . . . . . . . . . . . . . . . . . . . . . . . . . . . . . . . . . . . (1,525) (603)
Financing activitiesCommon stock repurchases . . . . . . . . . . . . . . . . . . . . . . . . . . . . . . . . . . . . . . . . . . . . . . . . . (896) (911)Cash dividends paid . . . . . . . . . . . . . . . . . . . . . . . . . . . . . . . . . . . . . . . . . . . . . . . . . . . . . . . (357) (276)Proceeds from common stock issuances . . . . . . . . . . . . . . . . . . . . . . . . . . . . . . . . . . . . . . . 192 216Repayments of long-term debt . . . . . . . . . . . . . . . . . . . . . . . . . . . . . . . . . . . . . . . . . . . . . . . (416) (172)Proceeds from commercial paper, net . . . . . . . . . . . . . . . . . . . . . . . . . . . . . . . . . . . . . . . . . 1,194 9Customer funds administered . . . . . . . . . . . . . . . . . . . . . . . . . . . . . . . . . . . . . . . . . . . . . . . 1,049 818Other, net . . . . . . . . . . . . . . . . . . . . . . . . . . . . . . . . . . . . . . . . . . . . . . . . . . . . . . . . . . . . . . . (270) (257)
Cash flows from (used for) financing activities . . . . . . . . . . . . . . . . . . . . . . . . . . . . . . . . . . 496 (573)
Effect of exchange rate changes on cash and cash equivalents . . . . . . . . . . . . . . . . . . . . . . (85) 6
Increase in cash and cash equivalents . . . . . . . . . . . . . . . . . . . . . . . . . . . . . . . . . . . . . . . . . 1,155 238Cash and cash equivalents, beginning of period . . . . . . . . . . . . . . . . . . . . . . . . . . . . . . . . . 7,495 7,276
Cash and cash equivalents, end of period . . . . . . . . . . . . . . . . . . . . . . . . . . . . . . . . . . . . . . $ 8,650 $ 7,514
See Notes to the Condensed Consolidated Financial Statements
5

ˆ200Gk8RZRjKBecuh}Š200Gk8RZRjKBecuh}
922183 TX 6UNITEDHEALTH GROUP IUHG FORM 10-Q 922183
07-May-2015 02:37 ESTCLN PSMIN
RR Donnelley ProFile SWRsamna0slSTART PAGE
7*PMT 1C
SWRFBU-MWE-XN1611.6.18
UnitedHealth GroupNotes to the Condensed Consolidated Financial Statements
(Unaudited)
1. Basis of Presentation
UnitedHealth Group Incorporated (individually and together with its subsidiaries, “UnitedHealth Group” and“the Company”) is a diversified health and well-being company dedicated to helping people live healthier livesand making the health system work better for everyone. Through its diversified family of businesses, theCompany leverages core competencies in advanced, enabling technology; health care data, information andintelligence; and clinical care management and coordination to help meet the demands of the health system. TheCompany offers a broad spectrum of products and services through two distinct platforms: UnitedHealthcare,which provides health care coverage and benefits services; and Optum, which provides information andtechnology-enabled health services.
The Company has prepared the Condensed Consolidated Financial Statements according to U.S. GenerallyAccepted Accounting Principles (GAAP) and has included the accounts of UnitedHealth Group and itssubsidiaries. The year-end condensed consolidated balance sheet was derived from audited financial statements,but does not include all disclosures required by GAAP. In accordance with the rules and regulations of the U.S.Securities and Exchange Commission (SEC), the Company has omitted certain footnote disclosures that wouldsubstantially duplicate the disclosures contained in its annual audited Consolidated Financial Statements.Therefore, these Condensed Consolidated Financial Statements should be read together with the ConsolidatedFinancial Statements and the Notes included in Part II, Item 8, “Financial Statements” of the Company’s AnnualReport on Form 10-K for the year ended December 31, 2014 as filed with the SEC (2014 10-K). Theaccompanying Condensed Consolidated Financial Statements include all normal recurring adjustments necessaryto present the interim financial statements fairly.
Use of Estimates
These Condensed Consolidated Financial Statements include certain amounts based on the Company’s bestestimates and judgments. The Company’s most significant estimates relate to estimates and judgments formedical costs payable and revenues, valuation and impairment analysis of goodwill and other intangible assets,estimates of other policy liabilities and other current receivables, valuations of certain investments, and estimatesand judgments related to income taxes and contingent liabilities. Certain of these estimates require theapplication of complex assumptions and judgments, often because they involve matters that are inherentlyuncertain and will likely change in subsequent periods. The impact of any change in estimates is included inearnings in the period in which the estimate is adjusted.
The accounting policies disclosed in Note 2 of Notes to the Consolidated Financial Statements in Part II, Item 8,“Financial Statements” in the 2014 10-K remain unchanged.
Recently Issued Accounting Standards
In May 2014, the Financial Accounting Standards Board (FASB) issued Accounting Standard Update (ASU)No. 2014-09, “Revenue from Contracts with Customers (Topic 606)” (ASU 2014-09). ASU 2014-09 willsupersede existing revenue recognition standards with a single model unless those contracts are within the scopeof other standards (e.g., an insurance entity’s insurance contracts). The revenue recognition principle in ASU2014-09 is that an entity should recognize revenue to depict the transfer of goods or services to customers in anamount that reflects the consideration to which the entity expects to be entitled in exchange for those goods orservices. In addition, new and enhanced disclosures will be required. Companies can adopt the new standardeither using the full retrospective approach, a modified retrospective approach with practical expedients, or acumulative effect upon adoption approach. In April 2015, the FASB announced its intention to delay ASU 2014-
6
ˆ200Gk8RZRjKBg4ZhvŠ200Gk8RZRjKBg4Zhv
922183 TX 7UNITEDHEALTH GROUP IUHG FORM 10-Q 922183
07-May-2015 02:37 ESTCLN PSMIN
RR Donnelley ProFile SWRsamna0sl 6*PMT 1C
SWRFBU-MWE-XN1611.6.18
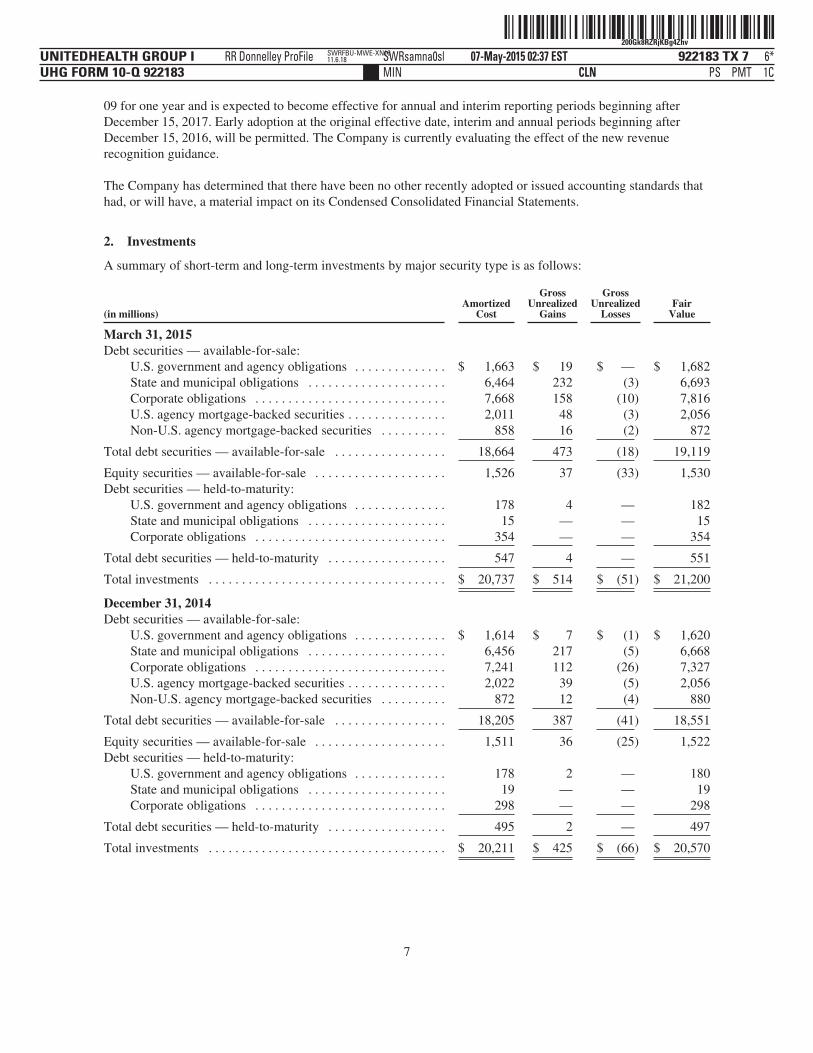
09 for one year and is expected to become effective for annual and interim reporting periods beginning afterDecember 15, 2017. Early adoption at the original effective date, interim and annual periods beginning afterDecember 15, 2016, will be permitted. The Company is currently evaluating the effect of the new revenuerecognition guidance.
The Company has determined that there have been no other recently adopted or issued accounting standards thathad, or will have, a material impact on its Condensed Consolidated Financial Statements.
2. Investments
A summary of short-term and long-term investments by major security type is as follows:
(in millions)Amortized
Cost
GrossUnrealized
Gains
GrossUnrealized
LossesFair
Value
March 31, 2015Debt securities — available-for-sale:
U.S. government and agency obligations . . . . . . . . . . . . . . $ 1,663 $ 19 $ — $ 1,682State and municipal obligations . . . . . . . . . . . . . . . . . . . . . 6,464 232 (3) 6,693Corporate obligations . . . . . . . . . . . . . . . . . . . . . . . . . . . . . 7,668 158 (10) 7,816U.S. agency mortgage-backed securities . . . . . . . . . . . . . . . 2,011 48 (3) 2,056Non-U.S. agency mortgage-backed securities . . . . . . . . . . 858 16 (2) 872
Total debt securities — available-for-sale . . . . . . . . . . . . . . . . . 18,664 473 (18) 19,119
Equity securities — available-for-sale . . . . . . . . . . . . . . . . . . . . 1,526 37 (33) 1,530Debt securities — held-to-maturity:
U.S. government and agency obligations . . . . . . . . . . . . . . 178 4 — 182State and municipal obligations . . . . . . . . . . . . . . . . . . . . . 15 — — 15Corporate obligations . . . . . . . . . . . . . . . . . . . . . . . . . . . . . 354 — — 354
Total debt securities — held-to-maturity . . . . . . . . . . . . . . . . . . 547 4 — 551
Total investments . . . . . . . . . . . . . . . . . . . . . . . . . . . . . . . . . . . . $ 20,737 $ 514 $ (51) $ 21,200
December 31, 2014Debt securities — available-for-sale:
U.S. government and agency obligations . . . . . . . . . . . . . . $ 1,614 $ 7 $ (1) $ 1,620State and municipal obligations . . . . . . . . . . . . . . . . . . . . . 6,456 217 (5) 6,668Corporate obligations . . . . . . . . . . . . . . . . . . . . . . . . . . . . . 7,241 112 (26) 7,327U.S. agency mortgage-backed securities . . . . . . . . . . . . . . . 2,022 39 (5) 2,056Non-U.S. agency mortgage-backed securities . . . . . . . . . . 872 12 (4) 880
Total debt securities — available-for-sale . . . . . . . . . . . . . . . . . 18,205 387 (41) 18,551
Equity securities — available-for-sale . . . . . . . . . . . . . . . . . . . . 1,511 36 (25) 1,522Debt securities — held-to-maturity:
U.S. government and agency obligations . . . . . . . . . . . . . . 178 2 — 180State and municipal obligations . . . . . . . . . . . . . . . . . . . . . 19 — — 19Corporate obligations . . . . . . . . . . . . . . . . . . . . . . . . . . . . . 298 — — 298
Total debt securities — held-to-maturity . . . . . . . . . . . . . . . . . . 495 2 — 497
Total investments . . . . . . . . . . . . . . . . . . . . . . . . . . . . . . . . . . . . $ 20,211 $ 425 $ (66) $ 20,570
7
ˆ200Gk8RZRjKBh%d7oŠ200Gk8RZRjKBh%d7o
922183 TX 8UNITEDHEALTH GROUP IUHG FORM 10-Q 922183
07-May-2015 02:37 ESTCLN PSMIN
RR Donnelley ProFile SWRsamna0sl 7*PMT 1C
SWRFBU-MWE-XN1611.6.18
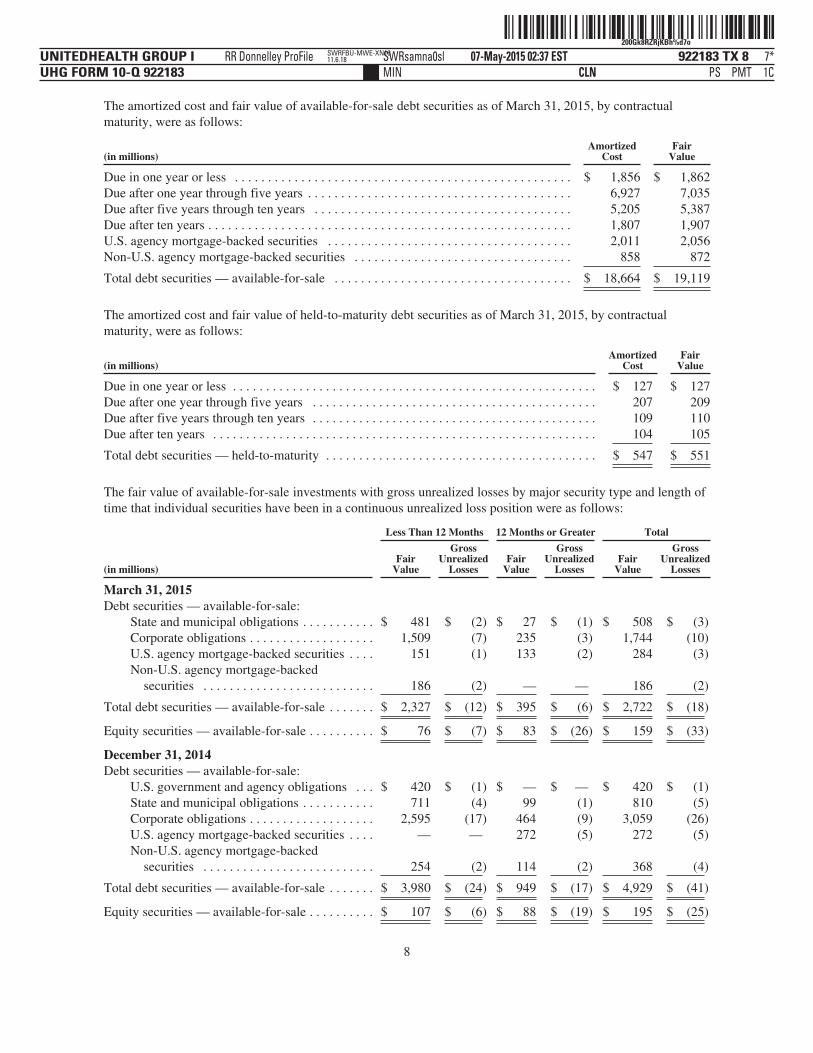
The amortized cost and fair value of available-for-sale debt securities as of March 31, 2015, by contractualmaturity, were as follows:
(in millions)Amortized
CostFair
Value
Due in one year or less . . . . . . . . . . . . . . . . . . . . . . . . . . . . . . . . . . . . . . . . . . . . . . . . . . . $ 1,856 $ 1,862Due after one year through five years . . . . . . . . . . . . . . . . . . . . . . . . . . . . . . . . . . . . . . . . 6,927 7,035Due after five years through ten years . . . . . . . . . . . . . . . . . . . . . . . . . . . . . . . . . . . . . . . 5,205 5,387Due after ten years . . . . . . . . . . . . . . . . . . . . . . . . . . . . . . . . . . . . . . . . . . . . . . . . . . . . . . . 1,807 1,907U.S. agency mortgage-backed securities . . . . . . . . . . . . . . . . . . . . . . . . . . . . . . . . . . . . . 2,011 2,056Non-U.S. agency mortgage-backed securities . . . . . . . . . . . . . . . . . . . . . . . . . . . . . . . . . 858 872
Total debt securities — available-for-sale . . . . . . . . . . . . . . . . . . . . . . . . . . . . . . . . . . . . $ 18,664 $ 19,119
The amortized cost and fair value of held-to-maturity debt securities as of March 31, 2015, by contractualmaturity, were as follows:
(in millions)Amortized
CostFair
Value
Due in one year or less . . . . . . . . . . . . . . . . . . . . . . . . . . . . . . . . . . . . . . . . . . . . . . . . . . . . . . . $ 127 $ 127Due after one year through five years . . . . . . . . . . . . . . . . . . . . . . . . . . . . . . . . . . . . . . . . . . . 207 209Due after five years through ten years . . . . . . . . . . . . . . . . . . . . . . . . . . . . . . . . . . . . . . . . . . . 109 110Due after ten years . . . . . . . . . . . . . . . . . . . . . . . . . . . . . . . . . . . . . . . . . . . . . . . . . . . . . . . . . . 104 105
Total debt securities — held-to-maturity . . . . . . . . . . . . . . . . . . . . . . . . . . . . . . . . . . . . . . . . . $ 547 $ 551
The fair value of available-for-sale investments with gross unrealized losses by major security type and length oftime that individual securities have been in a continuous unrealized loss position were as follows:
Less Than 12 Months 12 Months or Greater Total
(in millions)Fair
Value
GrossUnrealized
LossesFair
Value
GrossUnrealized
LossesFair
Value
GrossUnrealized
Losses
March 31, 2015Debt securities — available-for-sale:
State and municipal obligations . . . . . . . . . . . $ 481 $ (2) $ 27 $ (1) $ 508 $ (3)Corporate obligations . . . . . . . . . . . . . . . . . . . 1,509 (7) 235 (3) 1,744 (10)U.S. agency mortgage-backed securities . . . . 151 (1) 133 (2) 284 (3)Non-U.S. agency mortgage-backed
securities . . . . . . . . . . . . . . . . . . . . . . . . . . 186 (2) — — 186 (2)
Total debt securities — available-for-sale . . . . . . . $ 2,327 $ (12) $ 395 $ (6) $ 2,722 $ (18)
Equity securities — available-for-sale . . . . . . . . . . $ 76 $ (7) $ 83 $ (26) $ 159 $ (33)
December 31, 2014Debt securities — available-for-sale:
U.S. government and agency obligations . . . $ 420 $ (1) $ — $ — $ 420 $ (1)State and municipal obligations . . . . . . . . . . . 711 (4) 99 (1) 810 (5)Corporate obligations . . . . . . . . . . . . . . . . . . . 2,595 (17) 464 (9) 3,059 (26)U.S. agency mortgage-backed securities . . . . — — 272 (5) 272 (5)Non-U.S. agency mortgage-backed
securities . . . . . . . . . . . . . . . . . . . . . . . . . . 254 (2) 114 (2) 368 (4)
Total debt securities — available-for-sale . . . . . . . $ 3,980 $ (24) $ 949 $ (17) $ 4,929 $ (41)
Equity securities — available-for-sale . . . . . . . . . . $ 107 $ (6) $ 88 $ (19) $ 195 $ (25)
8
ˆ200Gk8RZRjKBl1x7tŠ200Gk8RZRjKBl1x7t
922183 TX 9UNITEDHEALTH GROUP IUHG FORM 10-Q 922183
07-May-2015 02:37 ESTCLN PSMIN
RR Donnelley ProFile SWRsamna0sl 8*PMT 1C
SWRFBU-MWE-XN1611.6.18
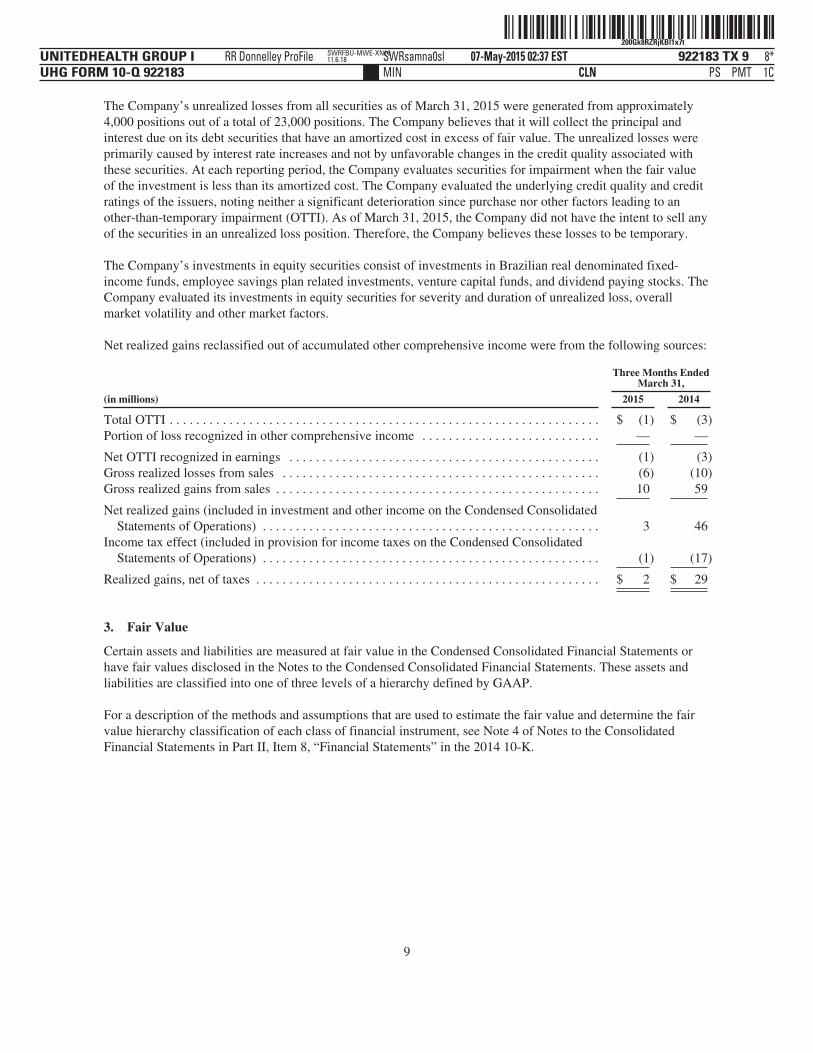
The Company’s unrealized losses from all securities as of March 31, 2015 were generated from approximately4,000 positions out of a total of 23,000 positions. The Company believes that it will collect the principal andinterest due on its debt securities that have an amortized cost in excess of fair value. The unrealized losses wereprimarily caused by interest rate increases and not by unfavorable changes in the credit quality associated withthese securities. At each reporting period, the Company evaluates securities for impairment when the fair valueof the investment is less than its amortized cost. The Company evaluated the underlying credit quality and creditratings of the issuers, noting neither a significant deterioration since purchase nor other factors leading to another-than-temporary impairment (OTTI). As of March 31, 2015, the Company did not have the intent to sell anyof the securities in an unrealized loss position. Therefore, the Company believes these losses to be temporary.
The Company’s investments in equity securities consist of investments in Brazilian real denominated fixed-income funds, employee savings plan related investments, venture capital funds, and dividend paying stocks. TheCompany evaluated its investments in equity securities for severity and duration of unrealized loss, overallmarket volatility and other market factors.
Net realized gains reclassified out of accumulated other comprehensive income were from the following sources:
Three Months EndedMarch 31,
(in millions) 2015 2014
Total OTTI . . . . . . . . . . . . . . . . . . . . . . . . . . . . . . . . . . . . . . . . . . . . . . . . . . . . . . . . . . . . . . . . . $ (1) $ (3)Portion of loss recognized in other comprehensive income . . . . . . . . . . . . . . . . . . . . . . . . . . . — —
Net OTTI recognized in earnings . . . . . . . . . . . . . . . . . . . . . . . . . . . . . . . . . . . . . . . . . . . . . . . (1) (3)Gross realized losses from sales . . . . . . . . . . . . . . . . . . . . . . . . . . . . . . . . . . . . . . . . . . . . . . . . (6) (10)Gross realized gains from sales . . . . . . . . . . . . . . . . . . . . . . . . . . . . . . . . . . . . . . . . . . . . . . . . . 10 59
Net realized gains (included in investment and other income on the Condensed ConsolidatedStatements of Operations) . . . . . . . . . . . . . . . . . . . . . . . . . . . . . . . . . . . . . . . . . . . . . . . . . . . 3 46
Income tax effect (included in provision for income taxes on the Condensed ConsolidatedStatements of Operations) . . . . . . . . . . . . . . . . . . . . . . . . . . . . . . . . . . . . . . . . . . . . . . . . . . . (1) (17)
Realized gains, net of taxes . . . . . . . . . . . . . . . . . . . . . . . . . . . . . . . . . . . . . . . . . . . . . . . . . . . . $ 2 $ 29
3. Fair Value
Certain assets and liabilities are measured at fair value in the Condensed Consolidated Financial Statements orhave fair values disclosed in the Notes to the Condensed Consolidated Financial Statements. These assets andliabilities are classified into one of three levels of a hierarchy defined by GAAP.
For a description of the methods and assumptions that are used to estimate the fair value and determine the fairvalue hierarchy classification of each class of financial instrument, see Note 4 of Notes to the ConsolidatedFinancial Statements in Part II, Item 8, “Financial Statements” in the 2014 10-K.
9
ˆ200Gk8RZRjKBmdb7eŠ200Gk8RZRjKBmdb7e
922183 TX 10UNITEDHEALTH GROUP IUHG FORM 10-Q 922183
07-May-2015 02:37 ESTCLN PSMIN
RR Donnelley ProFile SWRsamna0sl 6*PMT 1C
SWRFBU-MWE-XN1611.6.18
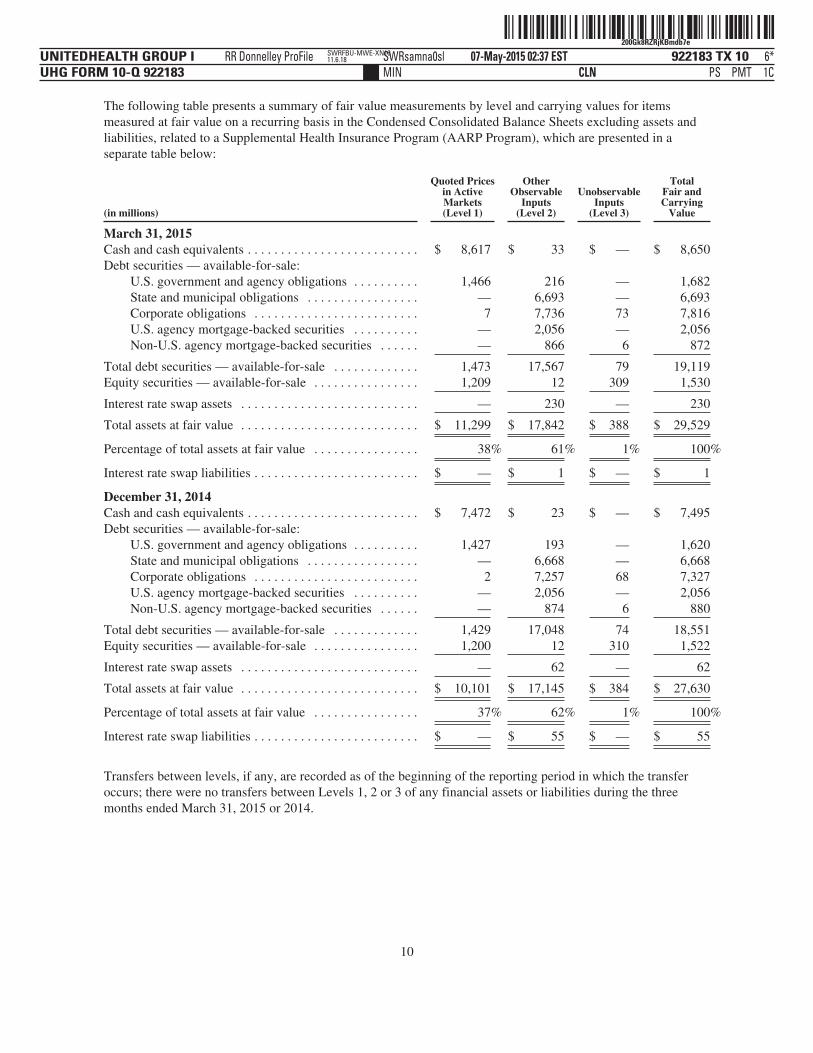
The following table presents a summary of fair value measurements by level and carrying values for itemsmeasured at fair value on a recurring basis in the Condensed Consolidated Balance Sheets excluding assets andliabilities, related to a Supplemental Health Insurance Program (AARP Program), which are presented in aseparate table below:
(in millions)
Quoted Pricesin ActiveMarkets(Level 1)
OtherObservable
Inputs(Level 2)
UnobservableInputs
(Level 3)
TotalFair andCarrying
Value
March 31, 2015Cash and cash equivalents . . . . . . . . . . . . . . . . . . . . . . . . . . $ 8,617 $ 33 $ — $ 8,650Debt securities — available-for-sale:
U.S. government and agency obligations . . . . . . . . . . 1,466 216 — 1,682State and municipal obligations . . . . . . . . . . . . . . . . . — 6,693 — 6,693Corporate obligations . . . . . . . . . . . . . . . . . . . . . . . . . 7 7,736 73 7,816U.S. agency mortgage-backed securities . . . . . . . . . . — 2,056 — 2,056Non-U.S. agency mortgage-backed securities . . . . . . — 866 6 872
Total debt securities — available-for-sale . . . . . . . . . . . . . 1,473 17,567 79 19,119Equity securities — available-for-sale . . . . . . . . . . . . . . . . 1,209 12 309 1,530
Interest rate swap assets . . . . . . . . . . . . . . . . . . . . . . . . . . . — 230 — 230
Total assets at fair value . . . . . . . . . . . . . . . . . . . . . . . . . . . $ 11,299 $ 17,842 $ 388 $ 29,529
Percentage of total assets at fair value . . . . . . . . . . . . . . . . 38% 61% 1% 100%
Interest rate swap liabilities . . . . . . . . . . . . . . . . . . . . . . . . . $ — $ 1 $ — $ 1
December 31, 2014Cash and cash equivalents . . . . . . . . . . . . . . . . . . . . . . . . . . $ 7,472 $ 23 $ — $ 7,495Debt securities — available-for-sale:
U.S. government and agency obligations . . . . . . . . . . 1,427 193 — 1,620State and municipal obligations . . . . . . . . . . . . . . . . . — 6,668 — 6,668Corporate obligations . . . . . . . . . . . . . . . . . . . . . . . . . 2 7,257 68 7,327U.S. agency mortgage-backed securities . . . . . . . . . . — 2,056 — 2,056Non-U.S. agency mortgage-backed securities . . . . . . — 874 6 880
Total debt securities — available-for-sale . . . . . . . . . . . . . 1,429 17,048 74 18,551Equity securities — available-for-sale . . . . . . . . . . . . . . . . 1,200 12 310 1,522
Interest rate swap assets . . . . . . . . . . . . . . . . . . . . . . . . . . . — 62 — 62
Total assets at fair value . . . . . . . . . . . . . . . . . . . . . . . . . . . $ 10,101 $ 17,145 $ 384 $ 27,630
Percentage of total assets at fair value . . . . . . . . . . . . . . . . 37% 62% 1% 100%
Interest rate swap liabilities . . . . . . . . . . . . . . . . . . . . . . . . . $ — $ 55 $ — $ 55
Transfers between levels, if any, are recorded as of the beginning of the reporting period in which the transferoccurs; there were no transfers between Levels 1, 2 or 3 of any financial assets or liabilities during the threemonths ended March 31, 2015 or 2014.
10

ˆ200Gk8RZRjKBrzN7GŠ200Gk8RZRjKBrzN7G
922183 TX 11UNITEDHEALTH GROUP IUHG FORM 10-Q 922183
07-May-2015 02:37 ESTCLN PSMIN
RR Donnelley ProFile SWRsamna0sl 10*PMT 1C
SWRFBU-MWE-XN1611.6.18
The following table presents a summary of fair value measurements by level and carrying values for certainfinancial instruments not measured at fair value on a recurring basis in the Condensed Consolidated BalanceSheets:
(in millions)
Quoted Pricesin ActiveMarkets(Level 1)
OtherObservable
Inputs(Level 2)
UnobservableInputs
(Level 3)Total Fair
ValueTotal Carrying
Value
March 31, 2015Debt securities — held-to-maturity:
U.S. government and agency obligations . . . $ 182 $ — $ — $ 182 $ 178State and municipal obligations . . . . . . . . . . — — 15 15 15Corporate obligations . . . . . . . . . . . . . . . . . . 93 10 251 354 354
Total debt securities — held-to-maturity . . . . . . . $ 275 $ 10 $ 266 $ 551 $ 547
Other assets . . . . . . . . . . . . . . . . . . . . . . . . . . . . . . $ — $ 490 $ — $ 490 $ 489
Long-term debt and other financingobligations . . . . . . . . . . . . . . . . . . . . . . . . . . . . $ — $ 18,826 $ — $ 18,826 $ 16,859
December 31, 2014Debt securities — held-to-maturity:
U.S. government and agency obligations . . . $ 180 $ — $ — $ 180 $ 178State and municipal obligations . . . . . . . . . . — — 19 19 19Corporate obligations . . . . . . . . . . . . . . . . . . 46 10 242 298 298
Total debt securities — held-to-maturity . . . . . . . $ 226 $ 10 $ 261 $ 497 $ 495
Other assets . . . . . . . . . . . . . . . . . . . . . . . . . . . . . . $ — $ 478 $ — $ 478 $ 484
Long-term debt and other financingobligations . . . . . . . . . . . . . . . . . . . . . . . . . . . . $ — $ 18,863 $ — $ 18,863 $ 17,085
Nonfinancial assets and liabilities or financial assets and liabilities that are measured at fair value on anonrecurring basis are subject to fair value adjustments only in certain circumstances, such as when the Companyrecords an impairment. There were no significant fair value adjustments for these assets and liabilities recordedduring the three months ended March 31, 2015 or 2014.
The carrying amounts reported on the Condensed Consolidated Balance Sheets for other current financial assetsand liabilities approximate fair value because of their short-term nature. These assets and liabilities are not listedin the table above.
A reconciliation of the beginning and ending balances of assets measured at fair value on a recurring basis usingLevel 3 inputs is as follows:
March 31, 2015 March 31, 2014
(in millions)Debt
SecuritiesEquity
Securities TotalDebt
SecuritiesEquity
Securities Total
Balance at beginning of period . . . . . . . . . . . . . . . $ 74 $ 310 $ 384 $ 42 $ 269 $ 311Purchases . . . . . . . . . . . . . . . . . . . . . . . . . . . . . . . . 4 4 8 3 44 47Sales . . . . . . . . . . . . . . . . . . . . . . . . . . . . . . . . . . . . — (1) (1) — (4) (4)Net unrealized gains (losses) in accumulated other
comprehensive income . . . . . . . . . . . . . . . . . . . . 1 (5) (4) 1 4 5Net realized gains in investment and other
income . . . . . . . . . . . . . . . . . . . . . . . . . . . . . . . . — 1 1 — — —
Balance at end of period . . . . . . . . . . . . . . . . . . . . . $ 79 $ 309 $ 388 $ 46 $ 313 $ 359
11
ˆ200Gk8RZRjKBtV%7oŠ200Gk8RZRjKBtV%7o
922183 TX 12UNITEDHEALTH GROUP IUHG FORM 10-Q 922183
07-May-2015 02:37 ESTCLN PSMIN
RR Donnelley ProFile SWRsamna0sl 7*PMT 1C
SWRFBU-MWE-XN1611.6.18
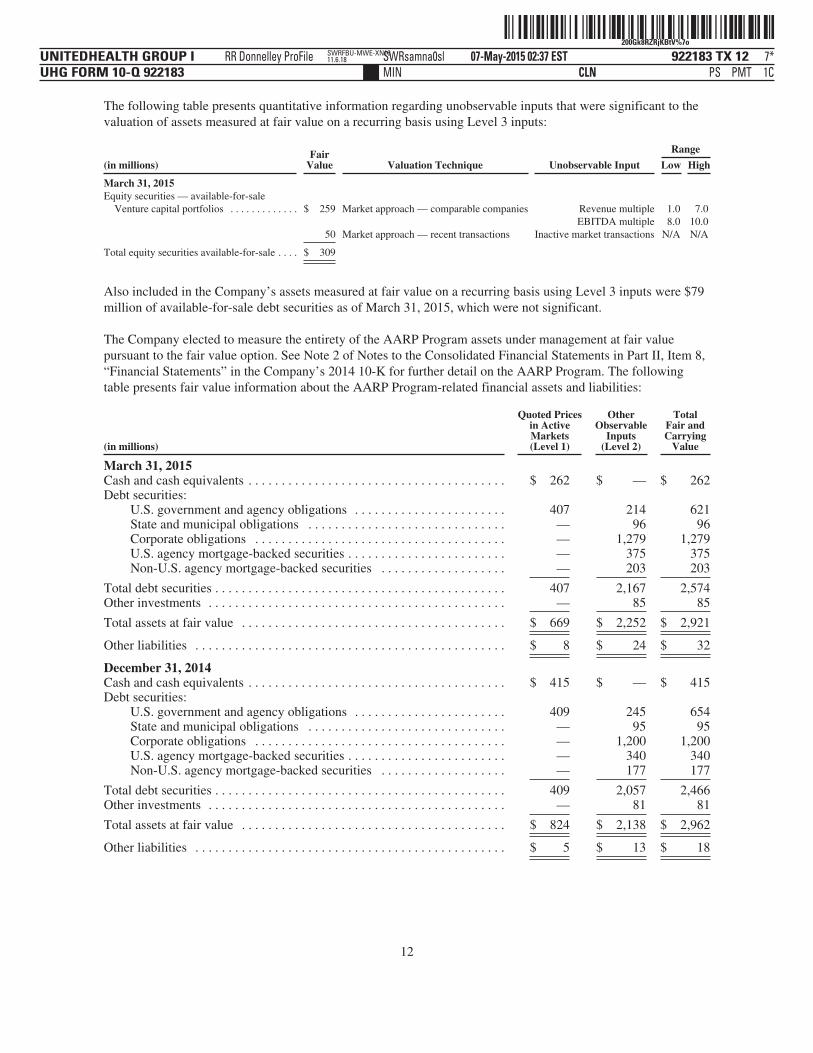
The following table presents quantitative information regarding unobservable inputs that were significant to thevaluation of assets measured at fair value on a recurring basis using Level 3 inputs:
(in millions)Fair
Value Valuation Technique Unobservable Input
Range
Low High
March 31, 2015Equity securities — available-for-sale
Venture capital portfolios . . . . . . . . . . . . . $ 259 Market approach — comparable companies Revenue multiple 1.0 7.0EBITDA multiple 8.0 10.0
50 Market approach — recent transactions Inactive market transactions N/A N/A
Total equity securities available-for-sale . . . . $ 309
Also included in the Company’s assets measured at fair value on a recurring basis using Level 3 inputs were $79million of available-for-sale debt securities as of March 31, 2015, which were not significant.
The Company elected to measure the entirety of the AARP Program assets under management at fair valuepursuant to the fair value option. See Note 2 of Notes to the Consolidated Financial Statements in Part II, Item 8,“Financial Statements” in the Company’s 2014 10-K for further detail on the AARP Program. The followingtable presents fair value information about the AARP Program-related financial assets and liabilities:
(in millions)
Quoted Pricesin ActiveMarkets(Level 1)
OtherObservable
Inputs(Level 2)
TotalFair andCarrying
Value
March 31, 2015Cash and cash equivalents . . . . . . . . . . . . . . . . . . . . . . . . . . . . . . . . . . . . . . . $ 262 $ — $ 262Debt securities:
U.S. government and agency obligations . . . . . . . . . . . . . . . . . . . . . . . 407 214 621State and municipal obligations . . . . . . . . . . . . . . . . . . . . . . . . . . . . . . — 96 96Corporate obligations . . . . . . . . . . . . . . . . . . . . . . . . . . . . . . . . . . . . . . — 1,279 1,279U.S. agency mortgage-backed securities . . . . . . . . . . . . . . . . . . . . . . . . — 375 375Non-U.S. agency mortgage-backed securities . . . . . . . . . . . . . . . . . . . — 203 203
Total debt securities . . . . . . . . . . . . . . . . . . . . . . . . . . . . . . . . . . . . . . . . . . . . 407 2,167 2,574Other investments . . . . . . . . . . . . . . . . . . . . . . . . . . . . . . . . . . . . . . . . . . . . . — 85 85
Total assets at fair value . . . . . . . . . . . . . . . . . . . . . . . . . . . . . . . . . . . . . . . . $ 669 $ 2,252 $ 2,921
Other liabilities . . . . . . . . . . . . . . . . . . . . . . . . . . . . . . . . . . . . . . . . . . . . . . . $ 8 $ 24 $ 32
December 31, 2014Cash and cash equivalents . . . . . . . . . . . . . . . . . . . . . . . . . . . . . . . . . . . . . . . $ 415 $ — $ 415Debt securities:
U.S. government and agency obligations . . . . . . . . . . . . . . . . . . . . . . . 409 245 654State and municipal obligations . . . . . . . . . . . . . . . . . . . . . . . . . . . . . . — 95 95Corporate obligations . . . . . . . . . . . . . . . . . . . . . . . . . . . . . . . . . . . . . . — 1,200 1,200U.S. agency mortgage-backed securities . . . . . . . . . . . . . . . . . . . . . . . . — 340 340Non-U.S. agency mortgage-backed securities . . . . . . . . . . . . . . . . . . . — 177 177
Total debt securities . . . . . . . . . . . . . . . . . . . . . . . . . . . . . . . . . . . . . . . . . . . . 409 2,057 2,466Other investments . . . . . . . . . . . . . . . . . . . . . . . . . . . . . . . . . . . . . . . . . . . . . — 81 81
Total assets at fair value . . . . . . . . . . . . . . . . . . . . . . . . . . . . . . . . . . . . . . . . $ 824 $ 2,138 $ 2,962
Other liabilities . . . . . . . . . . . . . . . . . . . . . . . . . . . . . . . . . . . . . . . . . . . . . . . $ 5 $ 13 $ 18
12

ˆ200Gk8RZRjKBu#i7yŠ200Gk8RZRjKBu#i7y
922183 TX 13UNITEDHEALTH GROUP IUHG FORM 10-Q 922183
07-May-2015 02:37 ESTCLN PSMIN
RR Donnelley ProFile SWRsamna0sl 6*PMT 1C
SWRFBU-MWE-XN1611.6.18
4. Medicare Part D Pharmacy Benefits
The Condensed Consolidated Balance Sheets include the following amounts associated with the Medicare Part Dprogram:
March 31, 2015 December 31, 2014
(in millions) Subsidies Drug Discount Risk-Share Subsidies Drug Discount Risk-Share
Other current receivables . . . . . . . . $ 1,448 $ 239 $ 46 $ 1,801 $ 719 $ 20Other policy liabilities . . . . . . . . . . — — — — 302 —
As of March 31, 2015, the Centers for Medicare and Medicaid Services (CMS) had underfunded the payment fordrug discounts and accordingly, the Company recorded a receivable from CMS along with the receivables frompharmaceutical manufacturers. See Note 2 of Notes to the Consolidated Financial Statements in Part II, Item 8,“Financial Statements” in the Company’s 2014 10-K for further detail on Medicare Part D.
5. Medical Costs Reserve Development
Favorable medical cost reserve development was $140 million and $220 million for the three months endedMarch 31, 2015 and 2014, respectively. In both periods, favorable development was driven by a number ofindividual factors that were not material.
6. Health Insurance Industry Tax
The Patient Protection and Affordable Care Act and a reconciliation measure, the Health Care and EducationReconciliation Act of 2010 (together, Health Reform Legislation) includes an annual, nondeductible insuranceindustry tax (Health Insurance Industry Tax). As of March 31, 2015, the liability recorded in accounts payableand accrued liabilities related to the Health Insurance Industry Tax was $1.8 billion. The corresponding deferredcost recorded in prepaid expenses and other current assets on the Condensed Consolidated Balance Sheets was$1.4 billion. There was no liability or asset related to the Health Insurance Industry Tax recorded as ofDecember 31, 2014 as the Health Insurance Industry Tax was paid in September 2014. See Note 2 of Notes to theConsolidated Financial Statements in Part II, Item 8, “Financial Statements” in the Company’s 2014 10-K forfurther detail on the Health Insurance Industry Tax.
13
ˆ200Gk8RZRjKBw5xhEŠ200Gk8RZRjKBw5xhE
922183 TX 14UNITEDHEALTH GROUP IUHG FORM 10-Q 922183
07-May-2015 02:37 ESTCLN PSMIN
RR Donnelley ProFile SWRsamna0sl 6*PMT 1C
SWRFBU-MWE-XN1611.6.18
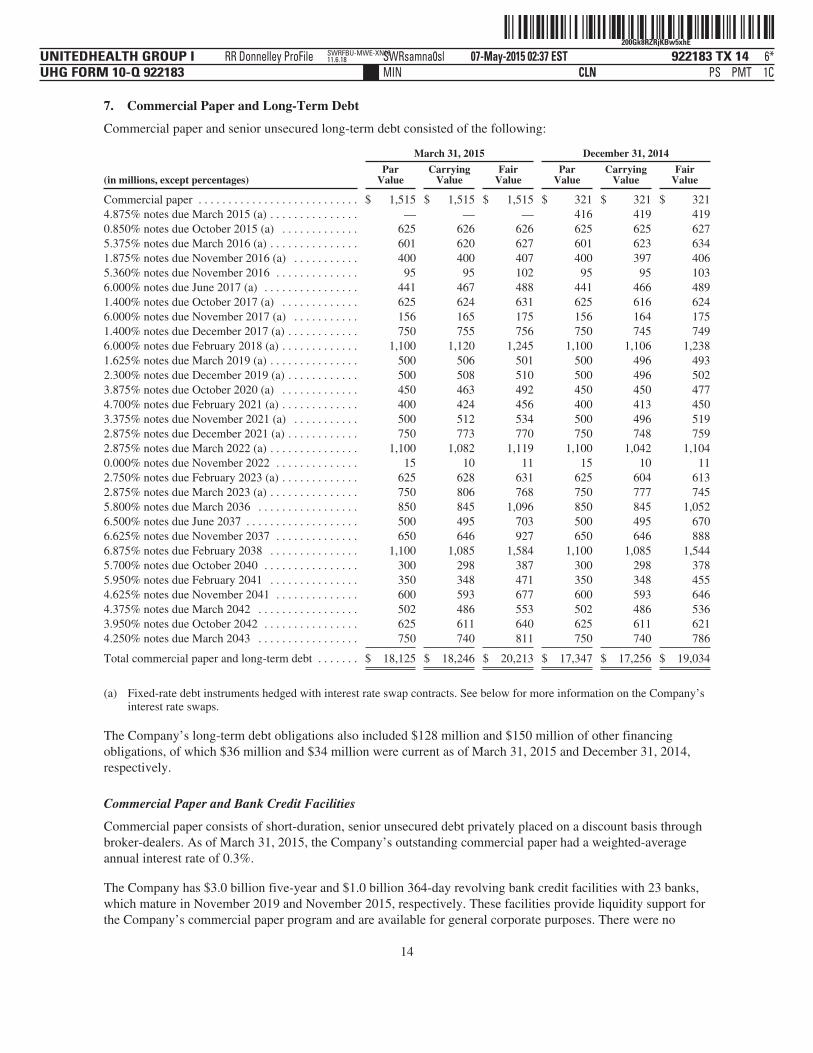
7. Commercial Paper and Long-Term Debt
Commercial paper and senior unsecured long-term debt consisted of the following:
March 31, 2015 December 31, 2014
(in millions, except percentages)Par
ValueCarrying
ValueFair
ValuePar
ValueCarrying
ValueFair
Value
Commercial paper . . . . . . . . . . . . . . . . . . . . . . . . . . . $ 1,515 $ 1,515 $ 1,515 $ 321 $ 321 $ 3214.875% notes due March 2015 (a) . . . . . . . . . . . . . . . — — — 416 419 4190.850% notes due October 2015 (a) . . . . . . . . . . . . . 625 626 626 625 625 6275.375% notes due March 2016 (a) . . . . . . . . . . . . . . . 601 620 627 601 623 6341.875% notes due November 2016 (a) . . . . . . . . . . . 400 400 407 400 397 4065.360% notes due November 2016 . . . . . . . . . . . . . . 95 95 102 95 95 1036.000% notes due June 2017 (a) . . . . . . . . . . . . . . . . 441 467 488 441 466 4891.400% notes due October 2017 (a) . . . . . . . . . . . . . 625 624 631 625 616 6246.000% notes due November 2017 (a) . . . . . . . . . . . 156 165 175 156 164 1751.400% notes due December 2017 (a) . . . . . . . . . . . . 750 755 756 750 745 7496.000% notes due February 2018 (a) . . . . . . . . . . . . . 1,100 1,120 1,245 1,100 1,106 1,2381.625% notes due March 2019 (a) . . . . . . . . . . . . . . . 500 506 501 500 496 4932.300% notes due December 2019 (a) . . . . . . . . . . . . 500 508 510 500 496 5023.875% notes due October 2020 (a) . . . . . . . . . . . . . 450 463 492 450 450 4774.700% notes due February 2021 (a) . . . . . . . . . . . . . 400 424 456 400 413 4503.375% notes due November 2021 (a) . . . . . . . . . . . 500 512 534 500 496 5192.875% notes due December 2021 (a) . . . . . . . . . . . . 750 773 770 750 748 7592.875% notes due March 2022 (a) . . . . . . . . . . . . . . . 1,100 1,082 1,119 1,100 1,042 1,1040.000% notes due November 2022 . . . . . . . . . . . . . . 15 10 11 15 10 112.750% notes due February 2023 (a) . . . . . . . . . . . . . 625 628 631 625 604 6132.875% notes due March 2023 (a) . . . . . . . . . . . . . . . 750 806 768 750 777 7455.800% notes due March 2036 . . . . . . . . . . . . . . . . . 850 845 1,096 850 845 1,0526.500% notes due June 2037 . . . . . . . . . . . . . . . . . . . 500 495 703 500 495 6706.625% notes due November 2037 . . . . . . . . . . . . . . 650 646 927 650 646 8886.875% notes due February 2038 . . . . . . . . . . . . . . . 1,100 1,085 1,584 1,100 1,085 1,5445.700% notes due October 2040 . . . . . . . . . . . . . . . . 300 298 387 300 298 3785.950% notes due February 2041 . . . . . . . . . . . . . . . 350 348 471 350 348 4554.625% notes due November 2041 . . . . . . . . . . . . . . 600 593 677 600 593 6464.375% notes due March 2042 . . . . . . . . . . . . . . . . . 502 486 553 502 486 5363.950% notes due October 2042 . . . . . . . . . . . . . . . . 625 611 640 625 611 6214.250% notes due March 2043 . . . . . . . . . . . . . . . . . 750 740 811 750 740 786
Total commercial paper and long-term debt . . . . . . . $ 18,125 $ 18,246 $ 20,213 $ 17,347 $ 17,256 $ 19,034
(a) Fixed-rate debt instruments hedged with interest rate swap contracts. See below for more information on the Company’sinterest rate swaps.
The Company’s long-term debt obligations also included $128 million and $150 million of other financingobligations, of which $36 million and $34 million were current as of March 31, 2015 and December 31, 2014,respectively.
Commercial Paper and Bank Credit Facilities
Commercial paper consists of short-duration, senior unsecured debt privately placed on a discount basis throughbroker-dealers. As of March 31, 2015, the Company’s outstanding commercial paper had a weighted-averageannual interest rate of 0.3%.
The Company has $3.0 billion five-year and $1.0 billion 364-day revolving bank credit facilities with 23 banks,which mature in November 2019 and November 2015, respectively. These facilities provide liquidity support forthe Company’s commercial paper program and are available for general corporate purposes. There were no
14
ˆ200Gk8RZRjKBxOŠ200Gk8RZRjKBxO
922183 TX 15UNITEDHEALTH GROUP IUHG FORM 10-Q 922183
07-May-2015 02:37 ESTCLN PSMIN
RR Donnelley ProFile SWRsamna0sl 6*PMT 1C
SWRFBU-MWE-XN1611.6.18
amounts outstanding under these facilities as of March 31, 2015. The interest rates on borrowings are variablebased on term and are calculated based on the London Interbank Offered Rate (LIBOR) plus a credit spreadbased on the Company’s senior unsecured credit ratings. As of March 31, 2015, the annual interest rates on thebank credit facilities, had they been drawn, would have ranged from 1.0% to 1.2%.
On May 1, 2015, the Company entered into an additional $2.0 billion 364-day revolving bank credit facility toprovide liquidity support for the Company’s commercial paper program. In addition, on the same date, theCompany entered into a $1.5 billion delayed draw term loan. The commercial paper and term loan proceeds willbe used to fund a portion of the purchase of Catamaran Corporation (Catamaran). No amounts have been drawnon the $2.0 billion bank credit facility or the $1.5 billion term loan. For more information on the purchase ofCatamaran, see Note 9.
Debt Covenants
The Company’s bank credit facilities contain various covenants including requiring the Company to maintain adebt to debt-plus-equity ratio of not more than 50%. The Company was in compliance with its debt covenants asof March 31, 2015.
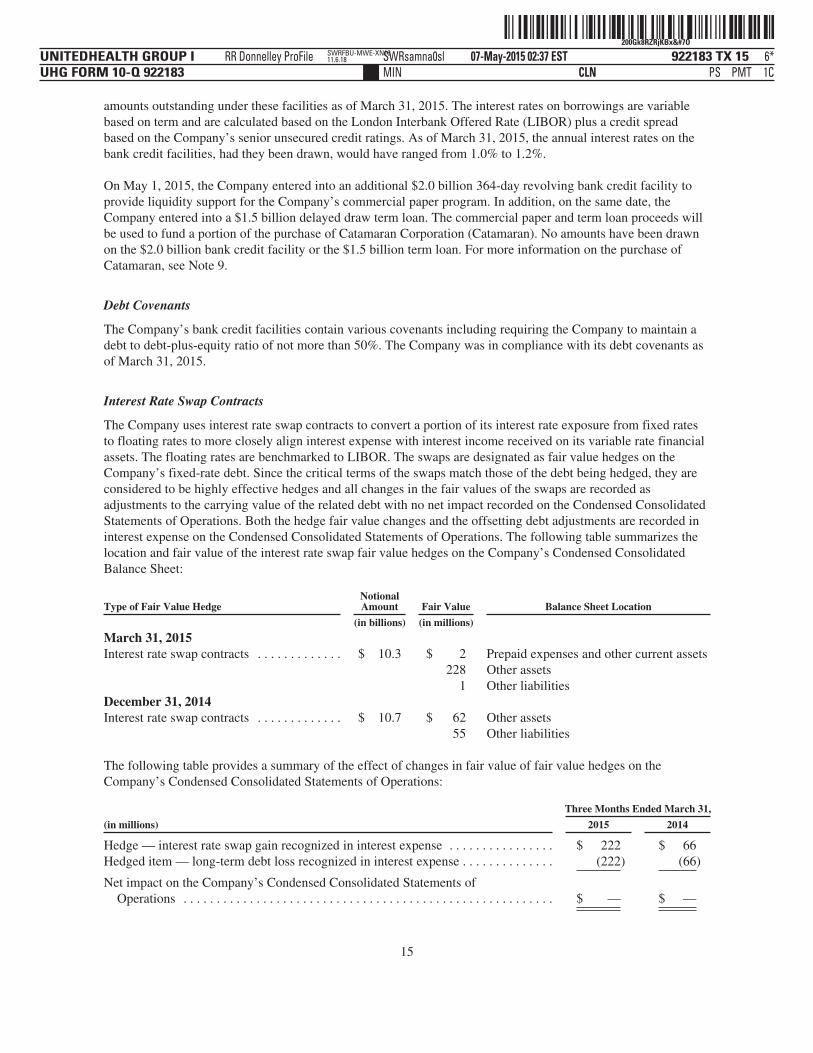
Interest Rate Swap Contracts
The Company uses interest rate swap contracts to convert a portion of its interest rate exposure from fixed ratesto floating rates to more closely align interest expense with interest income received on its variable rate financialassets. The floating rates are benchmarked to LIBOR. The swaps are designated as fair value hedges on theCompany’s fixed-rate debt. Since the critical terms of the swaps match those of the debt being hedged, they areconsidered to be highly effective hedges and all changes in the fair values of the swaps are recorded asadjustments to the carrying value of the related debt with no net impact recorded on the Condensed ConsolidatedStatements of Operations. Both the hedge fair value changes and the offsetting debt adjustments are recorded ininterest expense on the Condensed Consolidated Statements of Operations. The following table summarizes thelocation and fair value of the interest rate swap fair value hedges on the Company’s Condensed ConsolidatedBalance Sheet:
Type of Fair Value HedgeNotionalAmount Fair Value Balance Sheet Location
(in billions) (in millions)
March 31, 2015Interest rate swap contracts . . . . . . . . . . . . . $ 10.3 $ 2 Prepaid expenses and other current assets
228 Other assets1 Other liabilities
December 31, 2014Interest rate swap contracts . . . . . . . . . . . . . $ 10.7 $ 62 Other assets
55 Other liabilities
The following table provides a summary of the effect of changes in fair value of fair value hedges on theCompany’s Condensed Consolidated Statements of Operations:
Three Months Ended March 31,
(in millions) 2015 2014
Hedge — interest rate swap gain recognized in interest expense . . . . . . . . . . . . . . . . $ 222 $ 66Hedged item — long-term debt loss recognized in interest expense . . . . . . . . . . . . . . (222) (66)
Net impact on the Company’s Condensed Consolidated Statements ofOperations . . . . . . . . . . . . . . . . . . . . . . . . . . . . . . . . . . . . . . . . . . . . . . . . . . . . . . . . $ — $ —
15
ˆ200Gk8RZRjKBz!0hWŠ200Gk8RZRjKBz!0hW
922183 TX 16UNITEDHEALTH GROUP IUHG FORM 10-Q 922183
07-May-2015 02:37 ESTCLN PSMIN
RR Donnelley ProFile SWRsamna0sl 7*PMT 1C
SWRFBU-MWE-XN1611.6.18
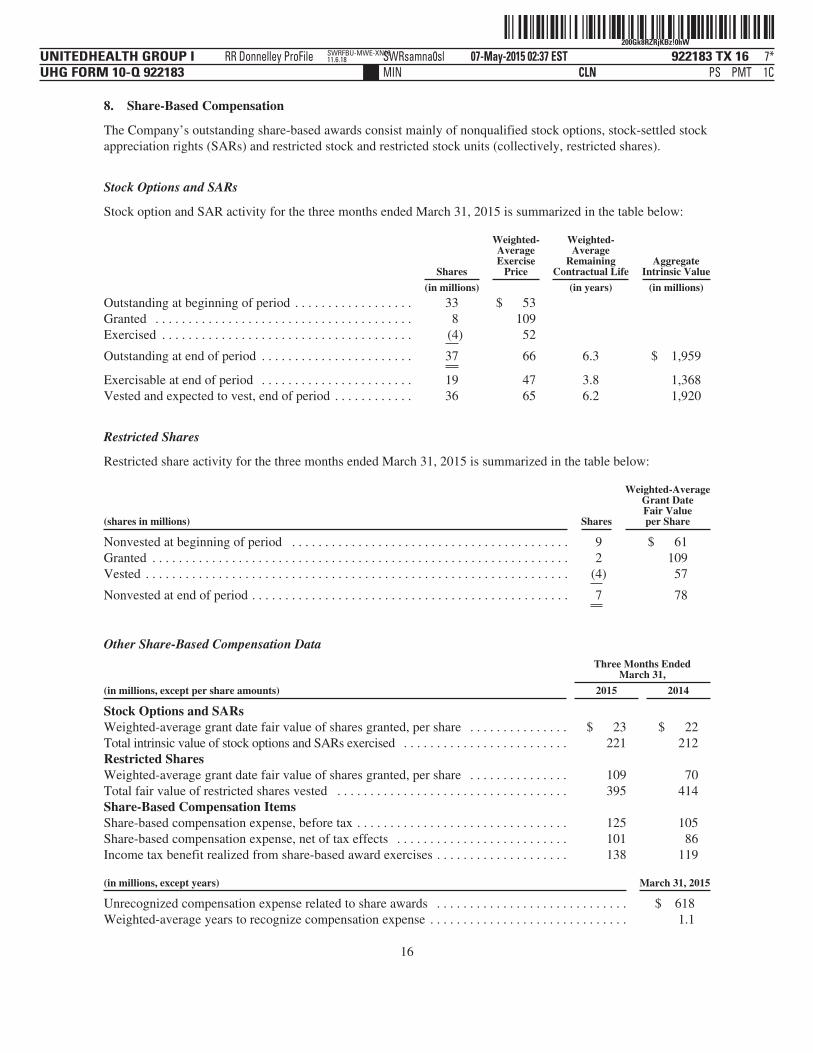
8. Share-Based Compensation
The Company’s outstanding share-based awards consist mainly of nonqualified stock options, stock-settled stockappreciation rights (SARs) and restricted stock and restricted stock units (collectively, restricted shares).
Stock Options and SARs
Stock option and SAR activity for the three months ended March 31, 2015 is summarized in the table below:
Shares
Weighted-AverageExercise
Price
Weighted-Average
RemainingContractual Life
AggregateIntrinsic Value
(in millions) (in years) (in millions)
Outstanding at beginning of period . . . . . . . . . . . . . . . . . . 33 $ 53Granted . . . . . . . . . . . . . . . . . . . . . . . . . . . . . . . . . . . . . . . 8 109Exercised . . . . . . . . . . . . . . . . . . . . . . . . . . . . . . . . . . . . . . (4) 52
Outstanding at end of period . . . . . . . . . . . . . . . . . . . . . . . 37 66 6.3 $ 1,959
Exercisable at end of period . . . . . . . . . . . . . . . . . . . . . . . 19 47 3.8 1,368Vested and expected to vest, end of period . . . . . . . . . . . . 36 65 6.2 1,920
Restricted Shares
Restricted share activity for the three months ended March 31, 2015 is summarized in the table below:
(shares in millions) Shares
Weighted-AverageGrant DateFair Valueper Share
Nonvested at beginning of period . . . . . . . . . . . . . . . . . . . . . . . . . . . . . . . . . . . . . . . . . . 9 $ 61Granted . . . . . . . . . . . . . . . . . . . . . . . . . . . . . . . . . . . . . . . . . . . . . . . . . . . . . . . . . . . . . . . 2 109Vested . . . . . . . . . . . . . . . . . . . . . . . . . . . . . . . . . . . . . . . . . . . . . . . . . . . . . . . . . . . . . . . . (4) 57
Nonvested at end of period . . . . . . . . . . . . . . . . . . . . . . . . . . . . . . . . . . . . . . . . . . . . . . . . 7 78
Other Share-Based Compensation Data
(in millions, except per share amounts)
Three Months EndedMarch 31,
2015 2014
Stock Options and SARsWeighted-average grant date fair value of shares granted, per share . . . . . . . . . . . . . . . $ 23 $ 22Total intrinsic value of stock options and SARs exercised . . . . . . . . . . . . . . . . . . . . . . . . . 221 212Restricted SharesWeighted-average grant date fair value of shares granted, per share . . . . . . . . . . . . . . . 109 70Total fair value of restricted shares vested . . . . . . . . . . . . . . . . . . . . . . . . . . . . . . . . . . . 395 414Share-Based Compensation ItemsShare-based compensation expense, before tax . . . . . . . . . . . . . . . . . . . . . . . . . . . . . . . . 125 105Share-based compensation expense, net of tax effects . . . . . . . . . . . . . . . . . . . . . . . . . . 101 86Income tax benefit realized from share-based award exercises . . . . . . . . . . . . . . . . . . . . 138 119
(in millions, except years) March 31, 2015
Unrecognized compensation expense related to share awards . . . . . . . . . . . . . . . . . . . . . . . . . . . . . $ 618Weighted-average years to recognize compensation expense . . . . . . . . . . . . . . . . . . . . . . . . . . . . . . 1.1
16
ˆ200Gk8RZRjKPKL47%Š200Gk8RZRjKPKL47%
922183 TX 17UNITEDHEALTH GROUP IUHG FORM 10-Q 922183
07-May-2015 02:45 ESTCLN PSMIN
RR Donnelley ProFile SWRsamna0sl 6*PMT 1C
SWRFBU-MWE-XN1611.6.18
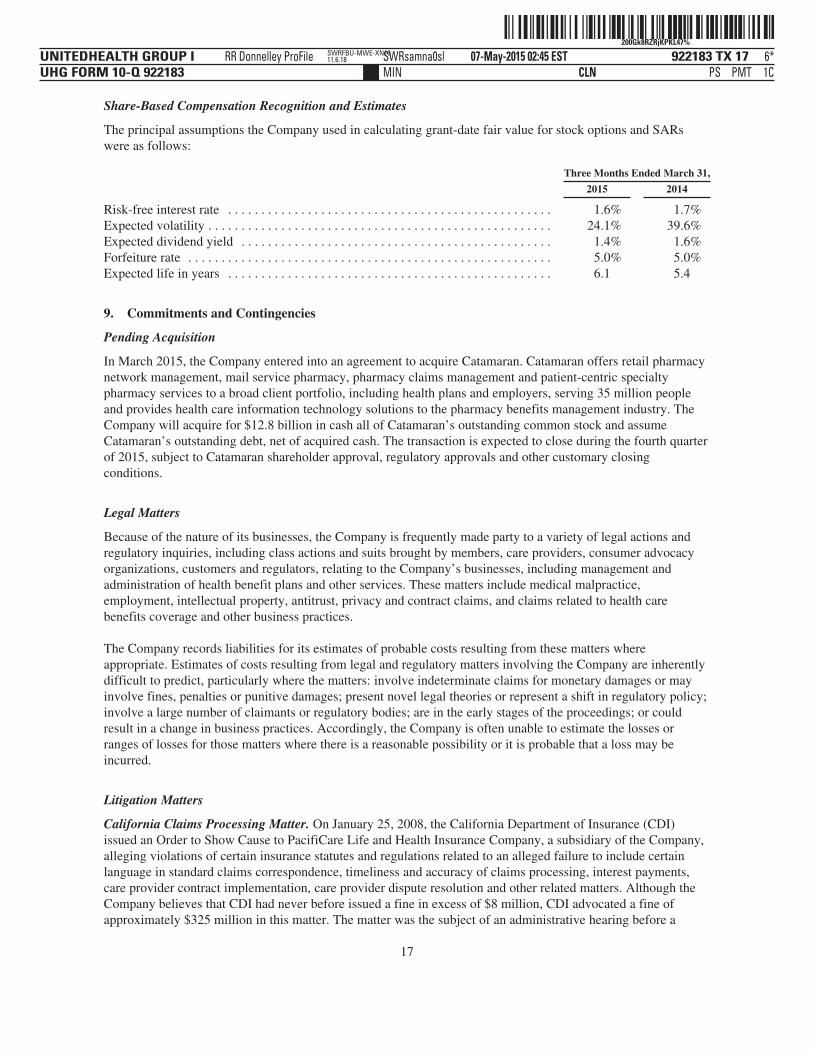
Share-Based Compensation Recognition and Estimates
The principal assumptions the Company used in calculating grant-date fair value for stock options and SARswere as follows:
Three Months Ended March 31,
2015 2014
Risk-free interest rate . . . . . . . . . . . . . . . . . . . . . . . . . . . . . . . . . . . . . . . . . . . . . . . . . 1.6% 1.7%Expected volatility . . . . . . . . . . . . . . . . . . . . . . . . . . . . . . . . . . . . . . . . . . . . . . . . . . . . 24.1% 39.6%Expected dividend yield . . . . . . . . . . . . . . . . . . . . . . . . . . . . . . . . . . . . . . . . . . . . . . . 1.4% 1.6%Forfeiture rate . . . . . . . . . . . . . . . . . . . . . . . . . . . . . . . . . . . . . . . . . . . . . . . . . . . . . . . 5.0% 5.0%Expected life in years . . . . . . . . . . . . . . . . . . . . . . . . . . . . . . . . . . . . . . . . . . . . . . . . . 6.1 5.4
9. Commitments and Contingencies
Pending Acquisition
In March 2015, the Company entered into an agreement to acquire Catamaran. Catamaran offers retail pharmacynetwork management, mail service pharmacy, pharmacy claims management and patient-centric specialtypharmacy services to a broad client portfolio, including health plans and employers, serving 35 million peopleand provides health care information technology solutions to the pharmacy benefits management industry. TheCompany will acquire for $12.8 billion in cash all of Catamaran’s outstanding common stock and assumeCatamaran’s outstanding debt, net of acquired cash. The transaction is expected to close during the fourth quarterof 2015, subject to Catamaran shareholder approval, regulatory approvals and other customary closingconditions.
Legal Matters
Because of the nature of its businesses, the Company is frequently made party to a variety of legal actions andregulatory inquiries, including class actions and suits brought by members, care providers, consumer advocacyorganizations, customers and regulators, relating to the Company’s businesses, including management andadministration of health benefit plans and other services. These matters include medical malpractice,employment, intellectual property, antitrust, privacy and contract claims, and claims related to health carebenefits coverage and other business practices.
The Company records liabilities for its estimates of probable costs resulting from these matters whereappropriate. Estimates of costs resulting from legal and regulatory matters involving the Company are inherentlydifficult to predict, particularly where the matters: involve indeterminate claims for monetary damages or mayinvolve fines, penalties or punitive damages; present novel legal theories or represent a shift in regulatory policy;involve a large number of claimants or regulatory bodies; are in the early stages of the proceedings; or couldresult in a change in business practices. Accordingly, the Company is often unable to estimate the losses orranges of losses for those matters where there is a reasonable possibility or it is probable that a loss may beincurred.
Litigation Matters
California Claims Processing Matter. On January 25, 2008, the California Department of Insurance (CDI)issued an Order to Show Cause to PacifiCare Life and Health Insurance Company, a subsidiary of the Company,alleging violations of certain insurance statutes and regulations related to an alleged failure to include certainlanguage in standard claims correspondence, timeliness and accuracy of claims processing, interest payments,care provider contract implementation, care provider dispute resolution and other related matters. Although theCompany believes that CDI had never before issued a fine in excess of $8 million, CDI advocated a fine ofapproximately $325 million in this matter. The matter was the subject of an administrative hearing before a
17
ˆ200Gk8RZRjKB$Pp7pŠ200Gk8RZRjKB$Pp7p
922183 TX 18UNITEDHEALTH GROUP IUHG FORM 10-Q 922183
07-May-2015 02:37 ESTCLN PSMIN
RR Donnelley ProFile SWRsamna0sl 5*PMT 1C
SWRFBU-MWE-XN1611.6.18
California administrative law judge beginning in December 2009, and in August 2013, the administrative lawjudge issued a nonbinding proposed decision recommending a fine of $11.5 million. The California InsuranceCommissioner rejected the administrative law judge’s recommendation and on June 9, 2014, issued his owndecision imposing a fine of approximately $174 million. On July 10, 2014, the Company filed a lawsuit inCalifornia state court challenging the Commissioner’s decision. The Company cannot reasonably estimate therange of loss, if any, that may result from this matter given the procedural status of the dispute, the wide range ofpossible outcomes, the legal issues presented (including the legal basis for the majority of the alleged violations),the inherent difficulty in predicting a regulatory fine in the event of a remand, and the various remedies andlevels of judicial review that remain available to the Company.
Government Investigations, Audits and Reviews
The Company has been involved or is currently involved in various governmental investigations, audits andreviews. These include routine, regular and special investigations, audits and reviews by CMS, state insuranceand health and welfare departments, the Brazilian national regulatory agency for private health insurance andplans (the Agência Nacional de Saúde Suplementar), state attorneys general, the Office of the Inspector General,the Office of Personnel Management, the Office of Civil Rights, the Government Accountability Office, theFederal Trade Commission, U.S. Congressional committees, the U.S. Department of Justice, the SEC, theInternal Revenue Service, the Brazilian federal revenue service (the Secretaria da Receita Federal), the U.S.Department of Labor, the Federal Deposit Insurance Corporation, the Defense Contract Audit Agency and othergovernmental authorities. Certain of the Company’s businesses have been reviewed or are currently underreview, including for, among other things, compliance with coding and other requirements under the Medicarerisk-adjustment model.
In February 2012, CMS announced a final Risk Adjustment Data Validation (RADV) audit and paymentadjustment methodology and that it will conduct RADV audits beginning with the 2011 payment year. Theseaudits involve a review of medical records maintained by care providers and may result in retrospectiveadjustments to payments made to health plans. CMS has not communicated how the final payment adjustmentunder its methodology will be implemented.
The Company cannot reasonably estimate the range of loss, if any, that may result from any material governmentinvestigations, audits and reviews in which it is currently involved given the inherent difficulty in predictingregulatory action, fines and penalties, if any, and the various remedies and levels of judicial review available tothe Company in the event of an adverse finding.
Guaranty Fund Assessments
Under state guaranty fund laws, certain insurance companies can be assessed (up to prescribed limits) for certainobligations to the policyholders and claimants of insolvent insurance companies. In 2009, the PennsylvaniaInsurance Commissioner placed long term care insurer Penn Treaty Network America Insurance Company andits subsidiary (Penn Treaty), neither of which is affiliated with the Company, in rehabilitation and petitioned astate court for approval to liquidate Penn Treaty. In 2012, the court denied the liquidation petition and orderedthe Insurance Commissioner to submit a rehabilitation plan. In December 2014, the court set a hearing for July2015 to consider the latest proposed rehabilitation plan.
If the current proposed rehabilitation plan, which contemplates the partial liquidation of Penn Treaty, is approvedby the court, the Company’s insurance entities and other insurers may be required to pay a portion of PennTreaty’s policyholder claims through state guaranty association assessments in future periods. The Companyintends to vigorously challenge the proposed rehabilitation plan. The Company is currently unable to estimatelosses or ranges of losses because the Company cannot predict whether, when or to what extent Penn Treaty willultimately be declared insolvent, the amount of the insolvency, if any, the amount and timing of any associatedguaranty fund assessments or the availability and amount of any premium tax and other potential offsets.
18
ˆ200Gk8RZRjKB&iG7OŠ200Gk8RZRjKB&iG7O
922183 TX 19UNITEDHEALTH GROUP IUHG FORM 10-Q 922183
07-May-2015 02:37 ESTCLN PSMIN
RR Donnelley ProFile SWRsamna0sl 6*PMT 1C
SWRFBU-MWE-XN1611.6.18
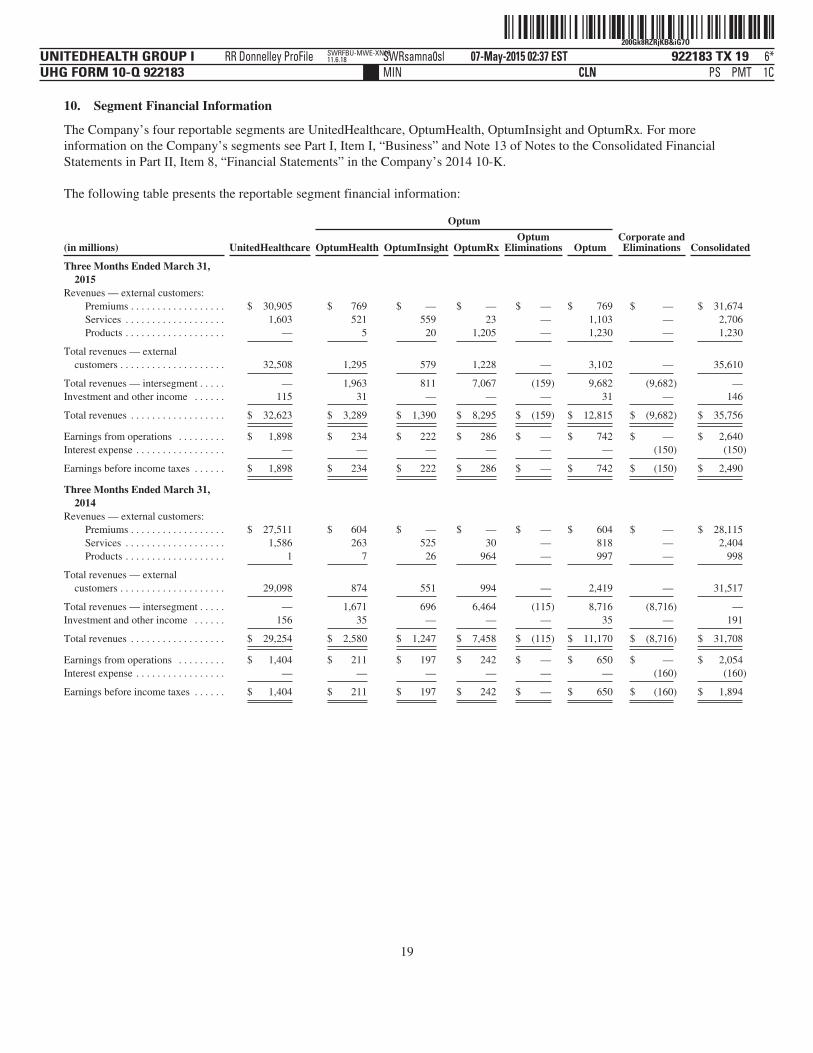
10. Segment Financial Information
The Company’s four reportable segments are UnitedHealthcare, OptumHealth, OptumInsight and OptumRx. For moreinformation on the Company’s segments see Part I, Item I, “Business” and Note 13 of Notes to the Consolidated FinancialStatements in Part II, Item 8, “Financial Statements” in the Company’s 2014 10-K.
The following table presents the reportable segment financial information:
Optum
(in millions) UnitedHealthcare OptumHealth OptumInsight OptumRxOptum
Eliminations OptumCorporate andEliminations Consolidated
Three Months Ended March 31,2015
Revenues — external customers:Premiums . . . . . . . . . . . . . . . . . . $ 30,905 $ 769 $ — $ — $ — $ 769 $ — $ 31,674Services . . . . . . . . . . . . . . . . . . . 1,603 521 559 23 — 1,103 — 2,706Products . . . . . . . . . . . . . . . . . . . — 5 20 1,205 — 1,230 — 1,230
Total revenues — externalcustomers . . . . . . . . . . . . . . . . . . . . 32,508 1,295 579 1,228 — 3,102 — 35,610
Total revenues — intersegment . . . . . — 1,963 811 7,067 (159) 9,682 (9,682) —Investment and other income . . . . . . 115 31 — — — 31 — 146
Total revenues . . . . . . . . . . . . . . . . . . $ 32,623 $ 3,289 $ 1,390 $ 8,295 $ (159) $ 12,815 $ (9,682) $ 35,756
Earnings from operations . . . . . . . . . $ 1,898 $ 234 $ 222 $ 286 $ — $ 742 $ — $ 2,640Interest expense . . . . . . . . . . . . . . . . . — — — — — — (150) (150)
Earnings before income taxes . . . . . . $ 1,898 $ 234 $ 222 $ 286 $ — $ 742 $ (150) $ 2,490
Three Months Ended March 31,2014
Revenues — external customers:Premiums . . . . . . . . . . . . . . . . . . $ 27,511 $ 604 $ — $ — $ — $ 604 $ — $ 28,115Services . . . . . . . . . . . . . . . . . . . 1,586 263 525 30 — 818 — 2,404Products . . . . . . . . . . . . . . . . . . . 1 7 26 964 — 997 — 998
Total revenues — externalcustomers . . . . . . . . . . . . . . . . . . . . 29,098 874 551 994 — 2,419 — 31,517
Total revenues — intersegment . . . . . — 1,671 696 6,464 (115) 8,716 (8,716) —Investment and other income . . . . . . 156 35 — — — 35 — 191
Total revenues . . . . . . . . . . . . . . . . . . $ 29,254 $ 2,580 $ 1,247 $ 7,458 $ (115) $ 11,170 $ (8,716) $ 31,708
Earnings from operations . . . . . . . . . $ 1,404 $ 211 $ 197 $ 242 $ — $ 650 $ — $ 2,054Interest expense . . . . . . . . . . . . . . . . . — — — — — — (160) (160)
Earnings before income taxes . . . . . . $ 1,404 $ 211 $ 197 $ 242 $ — $ 650 $ (160) $ 1,894
19
ˆ200Gk8RZRjKC3urhjŠ200Gk8RZRjKC3urhj
922183 TX 20UNITEDHEALTH GROUP IUHG FORM 10-Q 922183
07-May-2015 02:38 ESTCLN PSMIN
RR Donnelley ProFile SWRsamna0slSTART PAGE
5*PMT 1C
SWRFBU-MWE-XN1611.6.18
ITEM 2. MANAGEMENT’S DISCUSSION AND ANALYSIS OF FINANCIAL CONDITION ANDRESULTS OF OPERATIONS
The following discussion should be read together with the accompanying Condensed Consolidated FinancialStatements and Notes and with our 2014 10-K, including the Consolidated Financial Statements and Notes inPart II, Item 8, “Financial Statements” in that report. Unless the context indicates otherwise, references to theterms “UnitedHealth Group,” “we,” “our” or “us” used throughout this Management’s Discussion and Analysisof Financial Condition and Results of Operations refer to UnitedHealth Group Incorporated and its consolidatedsubsidiaries.
Readers are cautioned that the statements, estimates, projections or outlook contained in this Management’sDiscussion and Analysis of Financial Condition and Results of Operations, including discussions regardingfinancial prospects, economic conditions, trends and uncertainties contained in this Item 2, may constituteforward-looking statements within the meaning of the Private Securities Litigation Reform Act of 1995(PSLRA). These forward-looking statements involve risks and uncertainties that may cause our actual results todiffer materially from the results discussed or implied in the forward-looking statements. A description of someof the risks and uncertainties is set forth in Part I, Item 1A, “Risk Factors” in our 2014 10-K and in the discussionbelow.
EXECUTIVE OVERVIEW
General
UnitedHealth Group is a diversified health and well-being company dedicated to helping people live healthierlives and making the health system work better for everyone. Through our diversified family of businesses, weleverage core competencies in advanced, enabling technology; health care data, information and intelligence; andclinical care management and coordination to help meet the demands of the health system. We offer a broadspectrum of products and services through two distinct platforms: UnitedHealthcare, which provides health carecoverage and benefits services; and Optum, which provides information and technology-enabled health services.
Further information on our business is included in Part I, Item 1, “Business” and Part II, Item 7, “Management’sDiscussion and Analysis of Financial Condition and Results of Operations” in our 2014 10-K and additionalinformation on our segments can be found in this Item 2 and in Note 10 of Notes to the Condensed ConsolidatedFinancial Statements in Part I, Item 1 of this report.
Business Trends
Our businesses participate in the U.S., Brazilian and certain other international health economies. In the UnitedStates, health care spending comprises approximately 18% of gross domestic product and has grown consistentlyfor many years. We expect overall spending on health care to continue to grow in the future, due to inflation,medical technology and pharmaceutical advancement, regulatory requirements, demographic trends in thepopulation and national interest in health and well-being. The rate of market growth may be affected by a varietyof factors, including macro-economic conditions and regulatory changes, including enacted health reformlegislation in the United States, which have impacted and could further impact our results of operations.
Pricing Trends. To price our health care benefit products, we start with our view of expected future costs. Wefrequently evaluate and adjust our approach in each of the local markets we serve, considering all relevantfactors, such as product positioning, price competitiveness and environmental, competitive, legislative andregulatory considerations. Our review of regulatory considerations involves a focus on minimum loss ratio(MLR) thresholds and the risk adjustment, risk corridor and reinsurance provisions that impact the small groupand individual markets. We will continue seeking to balance growth and profitability across all of thesedimensions.
20
ˆ200Gk8RZRjKC5QWh/Š200Gk8RZRjKC5QWh/
922183 TX 21UNITEDHEALTH GROUP IUHG FORM 10-Q 922183
07-May-2015 02:38 ESTCLN PSMIN
RR Donnelley ProFile SWRsamna0sl 6*PMT 1C
SWRFBU-MWE-XN1611.6.18
We continue to be under pressure from ongoing market competition in commercial products and fromgovernment payment rates. The intensity of commercial pricing competition depends on local market conditionsand competitive dynamics. Annual commercial premium rate increases are subject to federal and state review andapproval procedures. The Medicare Advantage rate structure is changing and funding has been cut in recentyears, with additional reductions taking effect in 2015, as discussed below in “Regulatory Trends andUncertainties.” Although we expect continued Medicaid revenue increases due to anticipated growth in thenumber of people served through our offerings, the reimbursement rate environment creates the risk ofdownward pressure on Medicaid net margin percentages.
Medical Cost Trends. Our medical cost trends are primarily related to changes in unit costs, health systemutilization and prescription drug costs. Although Health Reform Legislation and prescription drug utilization,particularly use of new specialty medications, have exerted upward pressure on medical cost trends, our medicalcost management strategies have had a moderating impact on utilization trends in recent years.
Regulatory Trends and Uncertainties
Following is a summary of management’s view of the trends and uncertainties related to some of the keyprovisions of Health Reform Legislation and other regulatory items. For additional information regarding HealthReform Legislation and regulatory trends and uncertainties, see Part I, Item 1, “Business — GovernmentRegulation”, Item 1A, “Risk Factors”, and Part II, Item 7, “Management’s Discussion and Analysis of FinancialCondition and Results of Operations” in our 2014 10-K.
Medicare Advantage Rates. Medicare Advantage rates have been cut over the last several years, with additionalfunding reductions to be phased-in through 2017. The impact of these cuts to our 2015 Medicare Advantagerevenues is partially mitigated by reductions in provider reimbursements for those care providers with ratesindexed to Medicare Advantage revenues or Medicare fee-for-service reimbursement rates. Thesefactors affected our plan benefit designs, market participation, growth prospects and earnings expectations forour Medicare Advantage plans this year.
The 2016 Final Rate notice released by CMS in April 2015 provided some progress toward more stable programrates, with the industry seeing an average increase in funding of 125 basis points. However, these rates still trailthe pace of the rising cost of medical care and create continued pressure on the Medicare Advantage program.
Our Medicare Advantage rates are currently enhanced by CMS quality bonuses in certain counties based on ourlocal plans’ star ratings. The level of star ratings from CMS, based upon specified clinical and operationalperformance standards, will impact future quality bonuses. In addition, star ratings affect the amount of savings aplan has to generate to offer supplemental benefits, which ultimately may affect the plan’s membership andrevenue. The previous star bonus program, which paid bonuses to qualifying plans rated 3 stars or higher, expiredafter 2014. In 2015, quality bonus payments will be paid only to plans rated 4 stars and higher. For the 2015 starbonus payment year, 37% of our Medicare Advantage members are enrolled in plans rated 4 stars or higher. Weare dedicating substantial resources to advance our quality scores and star ratings to strengthen our local marketprograms and further improve our performance in future years.
Health Insurance Industry Tax and Premium Stabilization Programs. Health Reform Legislation includes aHealth Insurance Industry Tax levied on risk-based products proportionally across the industry. The industry-wide amount of the annual tax is $11.3 billion in 2015 and we expect that our proportionate share will be $1.8billion. Health Reform Legislation also includes three programs designed to stabilize the health insurancemarkets. These programs encompass: a temporary reinsurance program; a temporary risk corridors program; anda permanent risk adjustment program. Of the $8 billion allocated for the reinsurance program in 2015, $6 billionwill fund the reinsurance pool and $2 billion will fund the U.S. Treasury. While funding for the reinsuranceprogram will come from all commercial lines of business, only market reform compliant individual business willbe eligible for reinsurance recoveries.
21
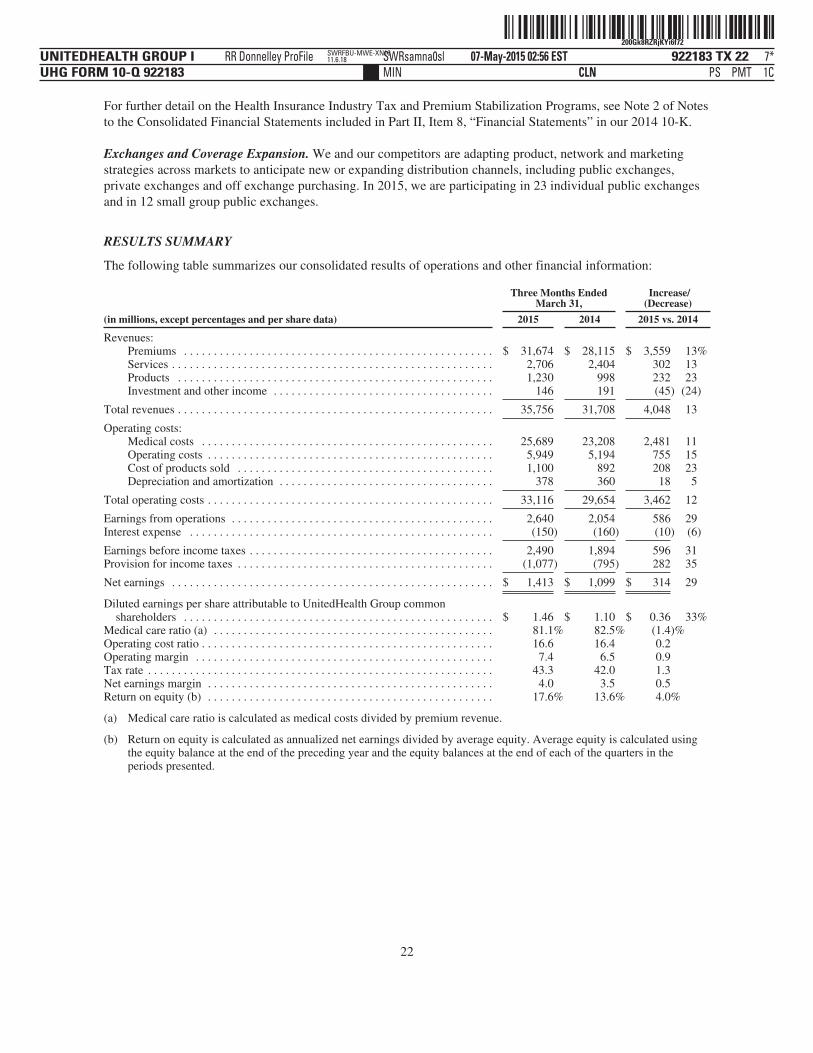
ˆ200Gk8RZRjKYi6f72Š200Gk8RZRjKYi6f72
922183 TX 22UNITEDHEALTH GROUP IUHG FORM 10-Q 922183
07-May-2015 02:56 ESTCLN PSMIN
RR Donnelley ProFile SWRsamna0sl 7*PMT 1C
SWRFBU-MWE-XN1611.6.18
For further detail on the Health Insurance Industry Tax and Premium Stabilization Programs, see Note 2 of Notesto the Consolidated Financial Statements included in Part II, Item 8, “Financial Statements” in our 2014 10-K.
Exchanges and Coverage Expansion. We and our competitors are adapting product, network and marketingstrategies across markets to anticipate new or expanding distribution channels, including public exchanges,private exchanges and off exchange purchasing. In 2015, we are participating in 23 individual public exchangesand in 12 small group public exchanges.
RESULTS SUMMARY
The following table summarizes our consolidated results of operations and other financial information:
(in millions, except percentages and per share data)
Three Months EndedMarch 31,
Increase/(Decrease)
2015 2014 2015 vs. 2014
Revenues:Premiums . . . . . . . . . . . . . . . . . . . . . . . . . . . . . . . . . . . . . . . . . . . . . . . . . . . . $ 31,674 $ 28,115 $ 3,559 13%Services . . . . . . . . . . . . . . . . . . . . . . . . . . . . . . . . . . . . . . . . . . . . . . . . . . . . . . 2,706 2,404 302 13Products . . . . . . . . . . . . . . . . . . . . . . . . . . . . . . . . . . . . . . . . . . . . . . . . . . . . . 1,230 998 232 23Investment and other income . . . . . . . . . . . . . . . . . . . . . . . . . . . . . . . . . . . . . 146 191 (45) (24)
Total revenues . . . . . . . . . . . . . . . . . . . . . . . . . . . . . . . . . . . . . . . . . . . . . . . . . . . . . 35,756 31,708 4,048 13
Operating costs:Medical costs . . . . . . . . . . . . . . . . . . . . . . . . . . . . . . . . . . . . . . . . . . . . . . . . . 25,689 23,208 2,481 11Operating costs . . . . . . . . . . . . . . . . . . . . . . . . . . . . . . . . . . . . . . . . . . . . . . . . 5,949 5,194 755 15Cost of products sold . . . . . . . . . . . . . . . . . . . . . . . . . . . . . . . . . . . . . . . . . . . 1,100 892 208 23Depreciation and amortization . . . . . . . . . . . . . . . . . . . . . . . . . . . . . . . . . . . . 378 360 18 5
Total operating costs . . . . . . . . . . . . . . . . . . . . . . . . . . . . . . . . . . . . . . . . . . . . . . . . 33,116 29,654 3,462 12
Earnings from operations . . . . . . . . . . . . . . . . . . . . . . . . . . . . . . . . . . . . . . . . . . . . 2,640 2,054 586 29Interest expense . . . . . . . . . . . . . . . . . . . . . . . . . . . . . . . . . . . . . . . . . . . . . . . . . . . (150) (160) (10) (6)
Earnings before income taxes . . . . . . . . . . . . . . . . . . . . . . . . . . . . . . . . . . . . . . . . . 2,490 1,894 596 31Provision for income taxes . . . . . . . . . . . . . . . . . . . . . . . . . . . . . . . . . . . . . . . . . . . (1,077) (795) 282 35
Net earnings . . . . . . . . . . . . . . . . . . . . . . . . . . . . . . . . . . . . . . . . . . . . . . . . . . . . . . $ 1,413 $ 1,099 $ 314 29
Diluted earnings per share attributable to UnitedHealth Group commonshareholders . . . . . . . . . . . . . . . . . . . . . . . . . . . . . . . . . . . . . . . . . . . . . . . . . . . . $ 1.46 $ 1.10 $ 0.36 33%
Medical care ratio (a) . . . . . . . . . . . . . . . . . . . . . . . . . . . . . . . . . . . . . . . . . . . . . . . 81.1% 82.5% (1.4)%Operating cost ratio . . . . . . . . . . . . . . . . . . . . . . . . . . . . . . . . . . . . . . . . . . . . . . . . . 16.6 16.4 0.2Operating margin . . . . . . . . . . . . . . . . . . . . . . . . . . . . . . . . . . . . . . . . . . . . . . . . . . 7.4 6.5 0.9Tax rate . . . . . . . . . . . . . . . . . . . . . . . . . . . . . . . . . . . . . . . . . . . . . . . . . . . . . . . . . . 43.3 42.0 1.3Net earnings margin . . . . . . . . . . . . . . . . . . . . . . . . . . . . . . . . . . . . . . . . . . . . . . . . 4.0 3.5 0.5Return on equity (b) . . . . . . . . . . . . . . . . . . . . . . . . . . . . . . . . . . . . . . . . . . . . . . . . 17.6% 13.6% 4.0%
(a) Medical care ratio is calculated as medical costs divided by premium revenue.
(b) Return on equity is calculated as annualized net earnings divided by average equity. Average equity is calculated usingthe equity balance at the end of the preceding year and the equity balances at the end of each of the quarters in theperiods presented.
22

ˆ200Gk8RZRjKC9c&7DŠ200Gk8RZRjKC9c&7D
922183 TX 23UNITEDHEALTH GROUP IUHG FORM 10-Q 922183
07-May-2015 02:38 ESTCLN PSMIN
RR Donnelley ProFile SWRsamna0sl 8*PMT 1C
SWRFBU-MWE-XN1611.6.18
SELECTED OPERATING PERFORMANCE AND OTHER SIGNIFICANT ITEMS
The following summarizes select first quarter 2015 year-over-year operating comparisons to first quarter 2014and other 2015 significant items.
• Consolidated revenues increased 13%, UnitedHealthcare revenues increased 12% and Optum revenuesgrew 15%.
• UnitedHealthcare grew to serve an additional 1.6 million people domestically.
• Earnings from operations increased 29%, including an increase of 35% at UnitedHealthcare and 14% atOptum.
• Diluted earnings per share to UnitedHealth Group shareholders increased 33% to $1.46.
• First quarter 2015 cash flows from operations were $2.3 billion an increase of 61%.
• In March 2015, we announced our agreement to acquire Catamaran through the purchase of all of itsoutstanding common stock for cash. See Note 9 of Notes to the Condensed Consolidated FinancialStatements included in Part I, Item 1 of this report for more information about this transaction.
2015 RESULTS OF OPERATIONS COMPARED TO 2014 RESULTS
Consolidated Financial Results
Revenues
The increase in revenues during the three months ended March 31, 2015 was primarily driven by growth in thenumber of individuals served across our benefits businesses and growth across all of Optum’s businesses.
Medical Costs and Medical Care Ratio
Medical costs during the three months ended March 31, 2015 increased due to risk-based membership growth inour benefits businesses. The medical care ratio for the three months ended March 31, 2015 decreased 140 basispoints primarily due to premium increases to cover the 2015 step up in the Health Insurance Industry Tax and ourperformance in managing health care costs across our benefits businesses.
Operating Cost Ratio
The increase in our operating cost ratio during the three months ended March 31, 2015 was due to servicesbusiness growth and acquisitions, which carry proportionately higher operating costs, partially offset byproductivity and operating performance gains.
23
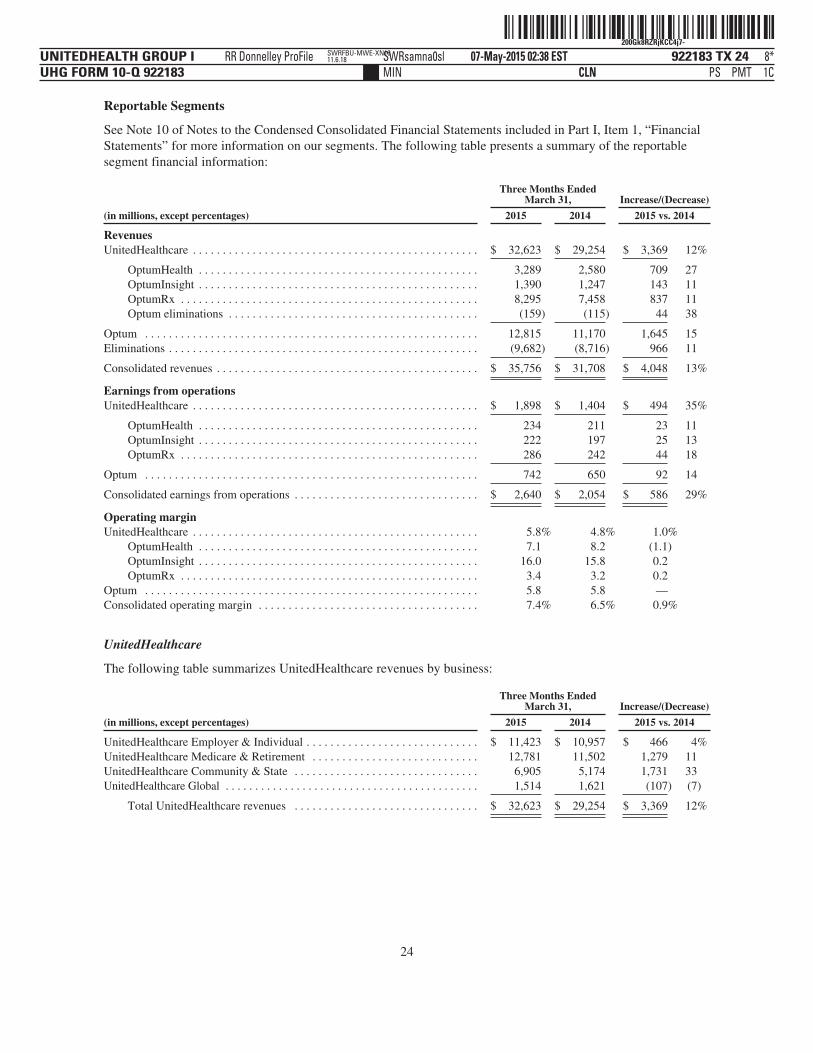
ˆ200Gk8RZRjKCC4j7-Š200Gk8RZRjKCC4j7-
922183 TX 24UNITEDHEALTH GROUP IUHG FORM 10-Q 922183
07-May-2015 02:38 ESTCLN PSMIN
RR Donnelley ProFile SWRsamna0sl 8*PMT 1C
SWRFBU-MWE-XN1611.6.18
Reportable Segments
See Note 10 of Notes to the Condensed Consolidated Financial Statements included in Part I, Item 1, “FinancialStatements” for more information on our segments. The following table presents a summary of the reportablesegment financial information:
Three Months EndedMarch 31, Increase/(Decrease)
(in millions, except percentages) 2015 2014 2015 vs. 2014
RevenuesUnitedHealthcare . . . . . . . . . . . . . . . . . . . . . . . . . . . . . . . . . . . . . . . . . . . . . . . . $ 32,623 $ 29,254 $ 3,369 12%
OptumHealth . . . . . . . . . . . . . . . . . . . . . . . . . . . . . . . . . . . . . . . . . . . . . . . 3,289 2,580 709 27OptumInsight . . . . . . . . . . . . . . . . . . . . . . . . . . . . . . . . . . . . . . . . . . . . . . . 1,390 1,247 143 11OptumRx . . . . . . . . . . . . . . . . . . . . . . . . . . . . . . . . . . . . . . . . . . . . . . . . . . 8,295 7,458 837 11Optum eliminations . . . . . . . . . . . . . . . . . . . . . . . . . . . . . . . . . . . . . . . . . . (159) (115) 44 38
Optum . . . . . . . . . . . . . . . . . . . . . . . . . . . . . . . . . . . . . . . . . . . . . . . . . . . . . . . . 12,815 11,170 1,645 15Eliminations . . . . . . . . . . . . . . . . . . . . . . . . . . . . . . . . . . . . . . . . . . . . . . . . . . . . (9,682) (8,716) 966 11
Consolidated revenues . . . . . . . . . . . . . . . . . . . . . . . . . . . . . . . . . . . . . . . . . . . . $ 35,756 $ 31,708 $ 4,048 13%
Earnings from operationsUnitedHealthcare . . . . . . . . . . . . . . . . . . . . . . . . . . . . . . . . . . . . . . . . . . . . . . . . $ 1,898 $ 1,404 $ 494 35%
OptumHealth . . . . . . . . . . . . . . . . . . . . . . . . . . . . . . . . . . . . . . . . . . . . . . . 234 211 23 11OptumInsight . . . . . . . . . . . . . . . . . . . . . . . . . . . . . . . . . . . . . . . . . . . . . . . 222 197 25 13OptumRx . . . . . . . . . . . . . . . . . . . . . . . . . . . . . . . . . . . . . . . . . . . . . . . . . . 286 242 44 18
Optum . . . . . . . . . . . . . . . . . . . . . . . . . . . . . . . . . . . . . . . . . . . . . . . . . . . . . . . . 742 650 92 14
Consolidated earnings from operations . . . . . . . . . . . . . . . . . . . . . . . . . . . . . . . $ 2,640 $ 2,054 $ 586 29%
Operating marginUnitedHealthcare . . . . . . . . . . . . . . . . . . . . . . . . . . . . . . . . . . . . . . . . . . . . . . . . 5.8% 4.8% 1.0%
OptumHealth . . . . . . . . . . . . . . . . . . . . . . . . . . . . . . . . . . . . . . . . . . . . . . . 7.1 8.2 (1.1)OptumInsight . . . . . . . . . . . . . . . . . . . . . . . . . . . . . . . . . . . . . . . . . . . . . . . 16.0 15.8 0.2OptumRx . . . . . . . . . . . . . . . . . . . . . . . . . . . . . . . . . . . . . . . . . . . . . . . . . . 3.4 3.2 0.2
Optum . . . . . . . . . . . . . . . . . . . . . . . . . . . . . . . . . . . . . . . . . . . . . . . . . . . . . . . . 5.8 5.8 —Consolidated operating margin . . . . . . . . . . . . . . . . . . . . . . . . . . . . . . . . . . . . . 7.4% 6.5% 0.9%
UnitedHealthcare
The following table summarizes UnitedHealthcare revenues by business:
Three Months EndedMarch 31, Increase/(Decrease)
(in millions, except percentages) 2015 2014 2015 vs. 2014
UnitedHealthcare Employer & Individual . . . . . . . . . . . . . . . . . . . . . . . . . . . . . $ 11,423 $ 10,957 $ 466 4%UnitedHealthcare Medicare & Retirement . . . . . . . . . . . . . . . . . . . . . . . . . . . . 12,781 11,502 1,279 11UnitedHealthcare Community & State . . . . . . . . . . . . . . . . . . . . . . . . . . . . . . . 6,905 5,174 1,731 33UnitedHealthcare Global . . . . . . . . . . . . . . . . . . . . . . . . . . . . . . . . . . . . . . . . . . . 1,514 1,621 (107) (7)
Total UnitedHealthcare revenues . . . . . . . . . . . . . . . . . . . . . . . . . . . . . . . $ 32,623 $ 29,254 $ 3,369 12%
24
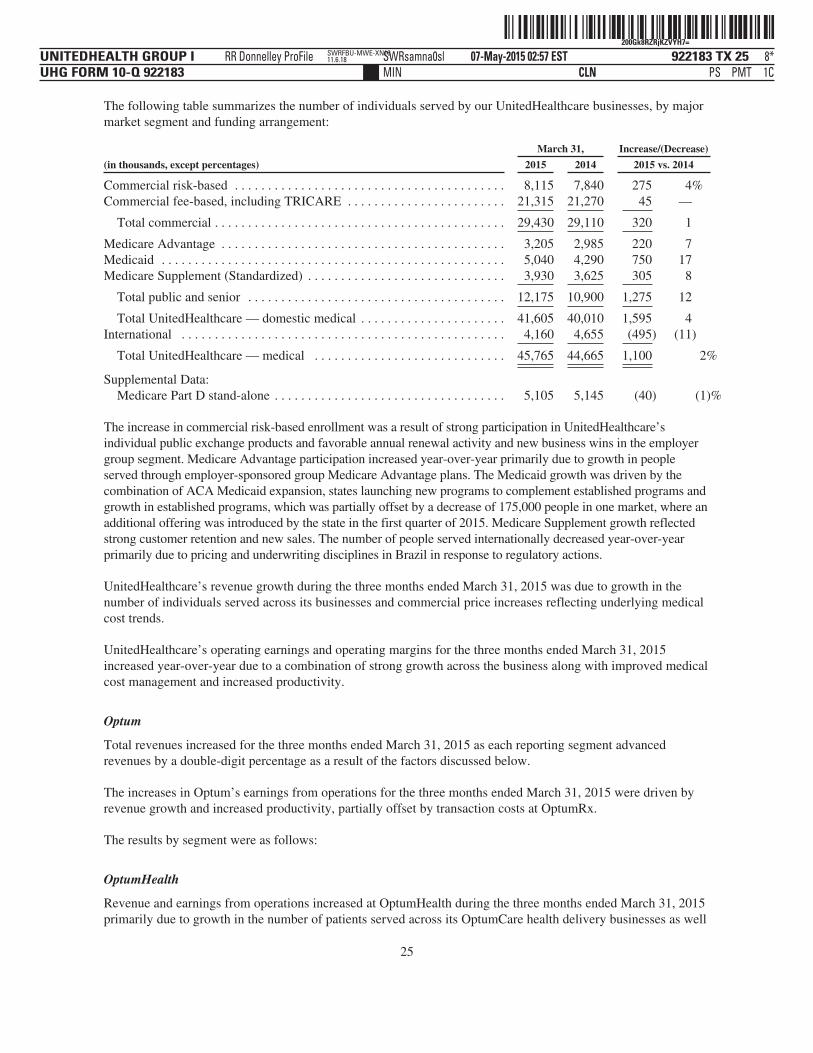
ˆ200Gk8RZRjKZVYH7=Š200Gk8RZRjKZVYH7=
922183 TX 25UNITEDHEALTH GROUP IUHG FORM 10-Q 922183
07-May-2015 02:57 ESTCLN PSMIN
RR Donnelley ProFile SWRsamna0sl 8*PMT 1C
SWRFBU-MWE-XN1611.6.18
The following table summarizes the number of individuals served by our UnitedHealthcare businesses, by majormarket segment and funding arrangement:
March 31, Increase/(Decrease)
(in thousands, except percentages) 2015 2014 2015 vs. 2014
Commercial risk-based . . . . . . . . . . . . . . . . . . . . . . . . . . . . . . . . . . . . . . . . . 8,115 7,840 275 4%Commercial fee-based, including TRICARE . . . . . . . . . . . . . . . . . . . . . . . . 21,315 21,270 45 —
Total commercial . . . . . . . . . . . . . . . . . . . . . . . . . . . . . . . . . . . . . . . . . . . . 29,430 29,110 320 1
Medicare Advantage . . . . . . . . . . . . . . . . . . . . . . . . . . . . . . . . . . . . . . . . . . . 3,205 2,985 220 7Medicaid . . . . . . . . . . . . . . . . . . . . . . . . . . . . . . . . . . . . . . . . . . . . . . . . . . . . 5,040 4,290 750 17Medicare Supplement (Standardized) . . . . . . . . . . . . . . . . . . . . . . . . . . . . . . 3,930 3,625 305 8
Total public and senior . . . . . . . . . . . . . . . . . . . . . . . . . . . . . . . . . . . . . . . 12,175 10,900 1,275 12
Total UnitedHealthcare — domestic medical . . . . . . . . . . . . . . . . . . . . . . 41,605 40,010 1,595 4International . . . . . . . . . . . . . . . . . . . . . . . . . . . . . . . . . . . . . . . . . . . . . . . . . 4,160 4,655 (495) (11)
Total UnitedHealthcare — medical . . . . . . . . . . . . . . . . . . . . . . . . . . . . . 45,765 44,665 1,100 2%
Supplemental Data:Medicare Part D stand-alone . . . . . . . . . . . . . . . . . . . . . . . . . . . . . . . . . . . 5,105 5,145 (40) (1)%
The increase in commercial risk-based enrollment was a result of strong participation in UnitedHealthcare’sindividual public exchange products and favorable annual renewal activity and new business wins in the employergroup segment. Medicare Advantage participation increased year-over-year primarily due to growth in peopleserved through employer-sponsored group Medicare Advantage plans. The Medicaid growth was driven by thecombination of ACA Medicaid expansion, states launching new programs to complement established programs andgrowth in established programs, which was partially offset by a decrease of 175,000 people in one market, where anadditional offering was introduced by the state in the first quarter of 2015. Medicare Supplement growth reflectedstrong customer retention and new sales. The number of people served internationally decreased year-over-yearprimarily due to pricing and underwriting disciplines in Brazil in response to regulatory actions.
UnitedHealthcare’s revenue growth during the three months ended March 31, 2015 was due to growth in thenumber of individuals served across its businesses and commercial price increases reflecting underlying medicalcost trends.
UnitedHealthcare’s operating earnings and operating margins for the three months ended March 31, 2015increased year-over-year due to a combination of strong growth across the business along with improved medicalcost management and increased productivity.
Optum
Total revenues increased for the three months ended March 31, 2015 as each reporting segment advancedrevenues by a double-digit percentage as a result of the factors discussed below.
The increases in Optum’s earnings from operations for the three months ended March 31, 2015 were driven byrevenue growth and increased productivity, partially offset by transaction costs at OptumRx.
The results by segment were as follows:
OptumHealth
Revenue and earnings from operations increased at OptumHealth during the three months ended March 31, 2015primarily due to growth in the number of patients served across its OptumCare health delivery businesses as well
25
ˆ200Gk8RZRjKCHKDhÇŠ200Gk8RZRjKCHKDh˙
922183 TX 26UNITEDHEALTH GROUP IUHG FORM 10-Q 922183
07-May-2015 02:38 ESTCLN PSMIN
RR Donnelley ProFile SWRsamna0sl 6*PMT 1C
SWRFBU-MWE-XN1611.6.18
as the impact of 2014 acquisitions. The operating margin for the three months ended March 31, 2015 decreasedfrom the prior year as overall business growth was offset by investments made to support future growth.
OptumInsight
Revenue and earnings from operations at OptumInsight for the three months ended March 31, 2015 increasedprimarily due to growth in technology and business operation services and the expansion and growth in careprovider revenue management services.
OptumRx
OptumRx revenue, earnings from operations and operating margin for the three months ended March 31, 2015increased due to an increase in prescription volume driven by serving an increasing number of people, partiallyoffset by $42 million in transaction costs related to the pending acquisition of Catamaran. For more informationabout the Catamaran transaction, see Note 9 in Notes to the Condensed Consolidated Financial Statements inPart I, Item 1 of this report.
LIQUIDITY, FINANCIAL CONDITION AND CAPITAL RESOURCES
Liquidity
Introduction
We manage our liquidity and financial position in the context of our overall business strategy. We continuallyforecast and manage our cash, investments, working capital balances and capital structure to meet the short-termand long-term obligations of our businesses while seeking to maintain liquidity and financial flexibility. Cashflows generated from operating activities are principally from earnings before noncash expenses.
Our regulated subsidiaries generate significant cash flows from operations and are subject to financial regulationsand standards in their respective jurisdictions. These standards, among other things, require these subsidiaries tomaintain specified levels of statutory capital, as defined by each jurisdiction, and restrict the timing and amountof dividends and other distributions that may be paid to their parent companies. In the United States, theseregulations and standards are generally consistent with model regulations established by the National Associationof Insurance Commissioners. These standards generally permit dividends to be paid from statutory unassignedsurplus of the regulated subsidiary and are limited based on the regulated subsidiary’s level of statutory netincome and statutory capital and surplus. These dividends are referred to as “ordinary dividends” and generallymay be paid without prior regulatory approval. If the dividend, together with other dividends paid within thepreceding twelve months, exceeds a specified statutory limit or is paid from sources other than earned surplus,the entire dividend is generally considered an “extraordinary dividend” and must receive prior regulatoryapproval.
For the three months ended March 31, 2015, our U.S. regulated subsidiaries paid their parent companies dividendsof $1.0 billion, and we had approximately $2.6 billion in ordinary dividend capacity remaining for the year.
Our nonregulated businesses also generate cash flows from operations that are available for general corporateuse. Cash flows generated by these entities, combined with dividends from our regulated entities and financingthrough the issuance of long-term debt as well as issuance of commercial paper or the ability to draw under ourcommitted credit facilities, further strengthen our operating and financial flexibility. We use these cash flows toexpand our businesses through acquisitions, reinvest in our businesses through capital expenditures, repay debt,and return capital to our shareholders through shareholder dividends and/or repurchases of our common stock,depending on market conditions.
26
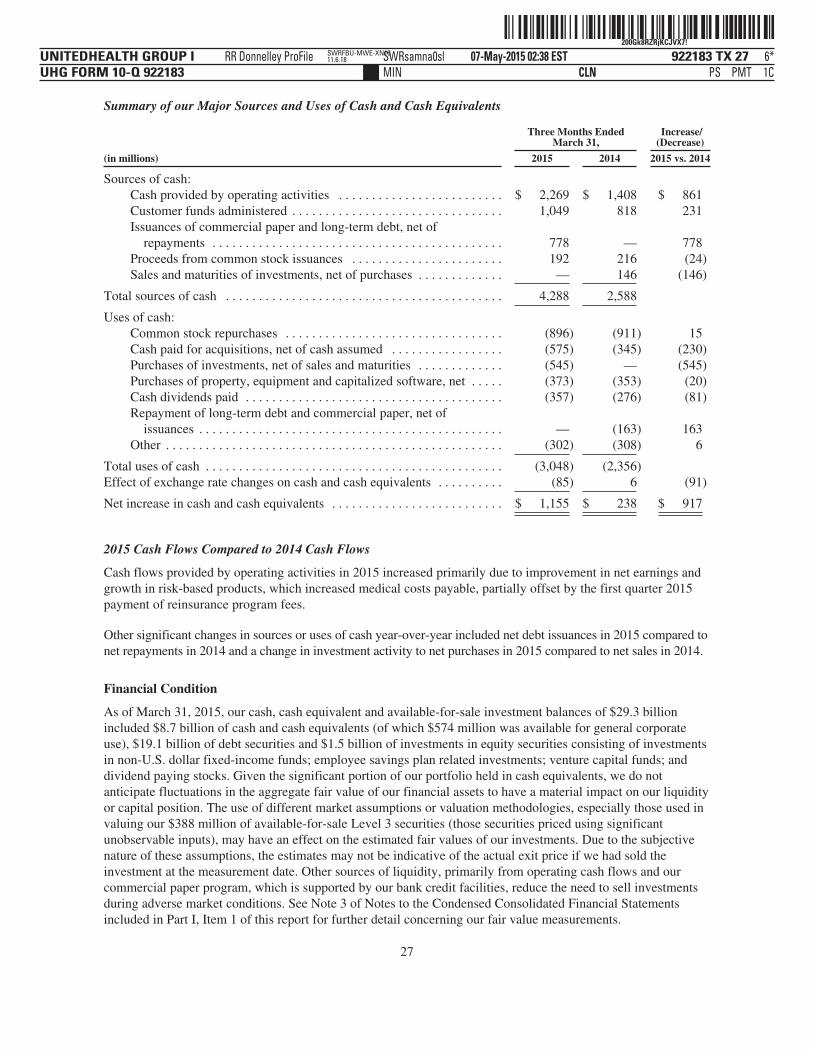
ˆ200Gk8RZRjKCJVX7!Š200Gk8RZRjKCJVX7!
922183 TX 27UNITEDHEALTH GROUP IUHG FORM 10-Q 922183
07-May-2015 02:38 ESTCLN PSMIN
RR Donnelley ProFile SWRsamna0sl 6*PMT 1C
SWRFBU-MWE-XN1611.6.18
Summary of our Major Sources and Uses of Cash and Cash Equivalents
Three Months EndedMarch 31,
Increase/(Decrease)
(in millions) 2015 2014 2015 vs. 2014
Sources of cash:Cash provided by operating activities . . . . . . . . . . . . . . . . . . . . . . . . . $ 2,269 $ 1,408 $ 861Customer funds administered . . . . . . . . . . . . . . . . . . . . . . . . . . . . . . . . 1,049 818 231Issuances of commercial paper and long-term debt, net of
repayments . . . . . . . . . . . . . . . . . . . . . . . . . . . . . . . . . . . . . . . . . . . . 778 — 778Proceeds from common stock issuances . . . . . . . . . . . . . . . . . . . . . . . 192 216 (24)Sales and maturities of investments, net of purchases . . . . . . . . . . . . . — 146 (146)
Total sources of cash . . . . . . . . . . . . . . . . . . . . . . . . . . . . . . . . . . . . . . . . . . 4,288 2,588
Uses of cash:Common stock repurchases . . . . . . . . . . . . . . . . . . . . . . . . . . . . . . . . . (896) (911) 15Cash paid for acquisitions, net of cash assumed . . . . . . . . . . . . . . . . . (575) (345) (230)Purchases of investments, net of sales and maturities . . . . . . . . . . . . . (545) — (545)Purchases of property, equipment and capitalized software, net . . . . . (373) (353) (20)Cash dividends paid . . . . . . . . . . . . . . . . . . . . . . . . . . . . . . . . . . . . . . . (357) (276) (81)Repayment of long-term debt and commercial paper, net of
issuances . . . . . . . . . . . . . . . . . . . . . . . . . . . . . . . . . . . . . . . . . . . . . . — (163) 163Other . . . . . . . . . . . . . . . . . . . . . . . . . . . . . . . . . . . . . . . . . . . . . . . . . . . (302) (308) 6
Total uses of cash . . . . . . . . . . . . . . . . . . . . . . . . . . . . . . . . . . . . . . . . . . . . . (3,048) (2,356)Effect of exchange rate changes on cash and cash equivalents . . . . . . . . . . (85) 6 (91)
Net increase in cash and cash equivalents . . . . . . . . . . . . . . . . . . . . . . . . . . $ 1,155 $ 238 $ 917
2015 Cash Flows Compared to 2014 Cash Flows
Cash flows provided by operating activities in 2015 increased primarily due to improvement in net earnings andgrowth in risk-based products, which increased medical costs payable, partially offset by the first quarter 2015payment of reinsurance program fees.
Other significant changes in sources or uses of cash year-over-year included net debt issuances in 2015 compared tonet repayments in 2014 and a change in investment activity to net purchases in 2015 compared to net sales in 2014.
Financial Condition
As of March 31, 2015, our cash, cash equivalent and available-for-sale investment balances of $29.3 billionincluded $8.7 billion of cash and cash equivalents (of which $574 million was available for general corporateuse), $19.1 billion of debt securities and $1.5 billion of investments in equity securities consisting of investmentsin non-U.S. dollar fixed-income funds; employee savings plan related investments; venture capital funds; anddividend paying stocks. Given the significant portion of our portfolio held in cash equivalents, we do notanticipate fluctuations in the aggregate fair value of our financial assets to have a material impact on our liquidityor capital position. The use of different market assumptions or valuation methodologies, especially those used invaluing our $388 million of available-for-sale Level 3 securities (those securities priced using significantunobservable inputs), may have an effect on the estimated fair values of our investments. Due to the subjectivenature of these assumptions, the estimates may not be indicative of the actual exit price if we had sold theinvestment at the measurement date. Other sources of liquidity, primarily from operating cash flows and ourcommercial paper program, which is supported by our bank credit facilities, reduce the need to sell investmentsduring adverse market conditions. See Note 3 of Notes to the Condensed Consolidated Financial Statementsincluded in Part I, Item 1 of this report for further detail concerning our fair value measurements.
27
ˆ200Gk8RZRjKCKdlhZŠ200Gk8RZRjKCKdlhZ
922183 TX 28UNITEDHEALTH GROUP IUHG FORM 10-Q 922183
07-May-2015 02:38 ESTCLN PSMIN
RR Donnelley ProFile SWRsamna0sl 6*PMT 1C
SWRFBU-MWE-XN1611.6.18
Our available-for-sale debt portfolio had a weighted-average duration of 3.3 years and a weighted-average credit ratingof “AA” as of March 31, 2015. When multiple credit ratings are available for an individual security, the average of theavailable ratings is used to determine the weighted-average credit rating.
Capital Resources and Uses of Liquidity
In addition to cash flows from operations and cash and cash equivalent balances available for general corporate use,our capital resources and uses of liquidity are as follows:
Commercial Paper and Bank Credit Facilities. Our bank credit facilities provide liquidity support for our commercialpaper borrowing program, which facilitates the private placement of unsecured debt through third-party broker-dealers,and are available for general corporate purposes. For more information on our commercial paper and bank creditfacilities, see Note 7 of Notes to the Condensed Consolidated Financial Statements included in Part I, Item 1 of thisreport.
Our bank credit facilities contain various covenants, including covenants requiring us to maintain a debt to debt-plus-equity ratio of not more than 50%. Our debt to debt-plus-equity ratio, calculated as the sum of debt divided by the sumof debt and shareholders’ equity, which reasonably approximates the actual covenant ratio, was 36.6% as of March 31,2015.
Long-Term Debt. Periodically, we access capital markets and issue long-term debt for general corporate purposes, forexample, to meet our working capital requirements, to refinance debt, to finance acquisitions or for share repurchases.
Credit Ratings. Our credit ratings as of March 31, 2015, after the announcement of the pending Catamaran acquisition,were as follows:
Moody’s Standard & Poor’s Fitch A.M. Best
Ratings Outlook Ratings Outlook Ratings Outlook Ratings Outlook
Senior unsecured debt . . . . . . . A3 Negative A+ Negative A- Negative Watch bbb+ StableCommercial paper . . . . . . . . . . P-2 n/a A-1 n/a F1 n/a AMB-2 n/a
The availability of financing in the form of debt or equity is influenced by many factors, including our profitability,operating cash flows, debt levels, credit ratings, debt covenants and other contractual restrictions, regulatoryrequirements and economic and market conditions. For example, a significant downgrade in our credit ratings oradverse conditions in the capital markets may increase the cost of borrowing for us or limit our access to capital.
Share Repurchase Program. Under our Board of Directors’ authorization, we maintain a share repurchase program.The objectives of the share repurchase program are to optimize our capital structure and cost of capital, therebyimproving returns to shareholders, as well as to offset the dilutive impact of share-based awards. Repurchases may bemade from time to time in open market purchases or other types of transactions (including structured repurchaseprograms), subject to certain Board restrictions. In June 2014, our Board renewed our share repurchase program withan authorization to repurchase up to 100 million shares of our common stock. During the three months endedMarch 31, 2015, we repurchased 8 million shares at an average price of $111 per share. As of March 31, 2015, we hadBoard authorization to purchase up to an additional 63 million shares of our common stock. We expect moderatedshare repurchase activity for the remainder of 2015 due to the pending acquisition of Catamaran.
Dividends. In June 2014, our Board of Directors increased our quarterly cash dividend to shareholders to an annualdividend rate of $1.50 per share. Declaration and payment of future quarterly dividends is at the discretion of the Boardand may be adjusted as business needs or market conditions change.
Catamaran Acquisition. In March 2015, we entered into an agreement to purchase all of Catamaran’s outstanding commonstock for cash. The transaction is expected to close during the fourth quarter of 2015, subject to Catamaran shareholder
28
ˆ200Gk8RZRjKCLm@7‹Š200Gk8RZRjKCLm@7
922183 TX 29UNITEDHEALTH GROUP IUHG FORM 10-Q 922183
07-May-2015 02:38 ESTCLN PSMIN
RR Donnelley ProFile SWRsamna0sl 6*PMT 1C
SWRFBU-MWE-XN1611.6.18
approval, regulatory approvals and other customary closing conditions. We plan to pay for the acquisition from existingcash resources and the proceeds of new indebtedness. For more information about the Catamaran transaction, see Note 9of Notes to the Condensed Consolidated Financial Statements included in Part I, Item 1 of this report.
CONTRACTUAL OBLIGATIONS AND COMMITMENTS
A summary of future obligations under our various contractual obligations and commitments as of December 31,2014 was disclosed in our 2014 10-K. During the three months ended March 31, 2015, other than the pendingCatamaran acquisition, there were no material changes to this previously disclosed information outside theordinary course of business. However, we continually evaluate opportunities to expand our operations, includingthrough internal development of new products, programs and technology applications and acquisitions.
RECENTLY ISSUED ACCOUNTING STANDARDS
In May 2014, the FASB issued ASU No. 2014-09 “Revenue from Contracts with Customers (Topic 606).” ASU2014-09 will supersede existing revenue recognition standards with a single model unless those contracts arewithin the scope of other standards (e.g., an insurance entity’s insurance contracts). The revenue recognitionprinciple in ASU 2014-09 is that an entity should recognize revenue to depict the transfer of goods or services tocustomers in an amount that reflects the consideration to which the entity expects to be entitled in exchange forthose goods or services. In addition, new and enhanced disclosures will be required. Companies can adopt thenew standard using either the full retrospective approach, a modified retrospective approach with practicalexpedients, or a cumulative effect upon adoption approach. In April 2015, the FASB announced its intention todelay ASU 2014-09 for one year and is expected to become effective for annual and interim reporting periodsbeginning after December 15, 2017. Early adoption at the original effective date, interim and annual periodsbeginning after December 15, 2016, will be permitted. The Company is currently evaluating the effect of the newrevenue recognition guidance.
We have determined that there have been no other recently issued, but not yet adopted, accounting standards thatwill have a material impact on our Condensed Consolidated Financial Statements.
CRITICAL ACCOUNTING ESTIMATES
In preparing our Condensed Consolidated Financial Statements, we are required to make judgments, assumptionsand estimates, which we believe are reasonable and prudent based on the available facts and circumstances.These judgments, assumptions and estimates affect certain of our revenues and expenses and their related balancesheet accounts and disclosure of our contingent liabilities. We base our assumptions and estimates primarily onhistorical experience and consider known and projected trends. On an ongoing basis, we re-evaluate our selectionof assumptions and the method of calculating our estimates. Actual results, however, may materially differ fromour calculated estimates and this difference would be reported in our current operations.
Our critical accounting estimates include medical costs payable, revenues, goodwill and intangible assets,investments, income taxes and contingent liabilities. For a detailed description of our critical accountingestimates, see “Management’s Discussion and Analysis of Financial Condition and Results of Operations” in PartII, Item 7 of our 2014 10-K. For a detailed discussion of our significant accounting policies, see Note 2 of Notesto the Consolidated Financial Statements in Part II, Item 8, “Financial Statements” in our 2014 10-K.
FORWARD-LOOKING STATEMENTS
The statements, estimates, projections, guidance or outlook contained in this document include “forward-looking” statements within the meaning of the PSLRA. These statements are intended to take advantage of the“safe harbor” provisions of the PSLRA. Generally the words “believe,” “expect,” “intend,” “estimate,”“anticipate,” “forecast,” “plan,” “project,” “should” and similar expressions identify forward-looking statements,
29

ˆ200Gk8RZRjKCN&V7hŠ200Gk8RZRjKCN&V7h
922183 TX 30UNITEDHEALTH GROUP IUHG FORM 10-Q 922183
07-May-2015 02:38 ESTCLN PSMIN
RR Donnelley ProFile SWRsamna0sl 7*PMT 1C
SWRFBU-MWE-XN1611.6.18
which generally are not historical in nature. These statements may contain information about financial prospects,economic conditions and trends and involve risks and uncertainties. We caution that actual results could differmaterially from those that management expects, depending on the outcome of certain factors.
Some factors that could cause actual results to differ materially from results discussed or implied in the forward-looking statements include: our ability to effectively estimate, price for and manage our medical costs, includingthe impact of any new coverage requirements; new laws or regulations, or changes in existing laws orregulations, or their enforcement or application, including increases in medical, administrative, technology orother costs or decreases in enrollment resulting from U.S., Brazilian and other jurisdictions regulations affectingthe health care industry; assessments for insolvent payers under state guaranty fund laws; our ability to achieveimprovement in CMS star ratings and other quality scores that impact revenue; reductions in revenue or delays tocash flows received under Medicare, Medicaid and TRICARE programs, including sequestration and the effectsof a prolonged U.S. government shutdown or debt ceiling constraints; changes in Medicare, including changes inrisk adjustment data validation audits, payment adjustment methodology or the CMS star ratings program; ourparticipation in federal and state health insurance exchanges which entail uncertainties associated with mix andvolume of business; cyber-attacks or other privacy or data security incidents; failure to comply with privacy anddata security regulations; regulatory and other risks and uncertainties of the pharmacy benefits managementindustry; competitive pressures, which could affect our ability to maintain or increase our market share;challenges to our public sector contract awards; our ability to execute contracts on competitive terms withphysicians, hospitals and other service providers; failure to achieve targeted operating cost productivityimprovements, including savings resulting from technology enhancement and administrative modernization;increases in costs and other liabilities associated with increased litigation, government investigations, audits orreviews; failure to manage successfully our strategic alliances or complete or receive anticipated benefits ofacquisitions and other strategic transactions, including our pending acquisition of Catamaran; fluctuations inforeign currency exchange rates on our reported shareholders equity and results of operations; downgrades in ourcredit ratings; adverse economic conditions, including decreases in enrollment resulting from increases in theunemployment rate and commercial attrition; the performance of our investment portfolio; impairment of thevalue of our goodwill and intangible assets in connection with dispositions or if estimated future results do notadequately support goodwill and intangible assets recorded for our existing businesses or the businesses that weacquire; increases in health care costs resulting from large-scale medical emergencies; failure to maintaineffective and efficient information systems or if our technology products do not operate as intended; and ourability to obtain sufficient funds from our regulated subsidiaries or the debt or capital markets to fund ourobligations, to maintain our debt to total capital ratio at targeted levels, to maintain our quarterly dividendpayment cycle or to continue repurchasing shares of our common stock.
This list of important factors is not intended to be exhaustive. We discuss certain of these matters more fully, aswell as certain risk factors that may affect our business operations, financial condition and results of operations,in our other periodic and current filings with the SEC, including our annual reports on Form 10-K, quarterlyreports on Form 10-Q and current reports on Form 8-K. Any or all forward-looking statements we make may turnout to be wrong, and can be affected by inaccurate assumptions we might make or by known or unknown risksand uncertainties. By their nature, forward-looking statements are not guarantees of future performance or resultsand are subject to risks, uncertainties and assumptions that are difficult to predict or quantify. Actual futureresults may vary materially from expectations expressed or implied in this document or any of our priorcommunications. You should not place undue reliance on forward-looking statements, which speak only as of thedate they are made. We do not undertake to update or revise any forward-looking statements, except as requiredby applicable securities laws.
ITEM 3. QUANTITATIVE AND QUALITATIVE DISCLOSURES ABOUT MARKET RISK
Our primary market risks are exposures to changes in interest rates that impact our investment income andinterest expense and the fair value of certain of our fixed-rate investments and debt, as well as foreign currencyexchange rate risk of the U.S. dollar primarily to the Brazilian real.
30
ˆ200Gk8RZRjKCRkMh{Š200Gk8RZRjKCRkMh{
922183 TX 31UNITEDHEALTH GROUP IUHG FORM 10-Q 922183
07-May-2015 02:38 ESTCLN PSMIN
RR Donnelley ProFile SWRsamna0sl 7*PMT 1C
SWRFBU-MWE-XN1611.6.18
We manage exposure to market interest rates by diversifying investments across different fixed income marketsectors and debt across maturities, as well as by endeavoring to match our floating-rate assets and liabilities overtime, either directly or through the use of interest rate swap contracts. Unrealized gains and losses on investmentsin available-for-sale securities are reported in comprehensive income.
The following table summarizes the impact of hypothetical changes in market interest rates across the entire yieldcurve by 1% point or 2% points as of March 31, 2015 on our investment income and interest expense per annum,and the fair value of our investments and debt (in millions, except percentages):
March 31, 2015
Increase (Decrease) in Market Interest Rate
InvestmentIncome PerAnnum (a)
InterestExpense PerAnnum (a)
Fair Value ofFinancialAssets (b)
Fair Value ofFinancialLiabilities
2% . . . . . . . . . . . . . . . . . . . . . . . . . . . . . . . . . . . . . . . . . . . . . . $ 212 $ 268 $ (1,376) $ (1,927)1 . . . . . . . . . . . . . . . . . . . . . . . . . . . . . . . . . . . . . . . . . . . . . . . 106 134 (692) (1,059)(1) . . . . . . . . . . . . . . . . . . . . . . . . . . . . . . . . . . . . . . . . . . . . . . (60) (24) 642 1,296(2) . . . . . . . . . . . . . . . . . . . . . . . . . . . . . . . . . . . . . . . . . . . . . . nm nm 1,006 2,891
nm = not meaningful(a) Given the low absolute level of short-term market rates on our floating-rate assets and liabilities as of March 31, 2015,
the assumed hypothetical change in interest rates does not reflect the full 100 basis point reduction in interest income orinterest expense as the rate cannot fall below zero and thus the 200 basis point reduction is not meaningful.
(b) As of March 31, 2015, some of our investments had interest rates below 2% so the assumed hypothetical change in thefair value of investments does not reflect the full 200 basis point reduction.
We have an exposure to changes in the value of the Brazilian real to the U.S. dollar in translation of Amil’soperating results at the average exchange rate over the accounting period, and Amil’s assets and liabilities at thespot rate at the end of the accounting period. The gains or losses resulting from translating foreign assets andliabilities into U.S. dollars are included in shareholders’ equity and comprehensive income.
An appreciation of the U.S. dollar against the Brazilian real reduces the carrying value of the net assetsdenominated in Brazilian real. For example, as of March 31, 2015, a hypothetical 10% and 25% increase in thevalue of the U.S. dollar against the Brazilian real would have caused a reduction in net assets of approximately$360 million and $790 million, respectively. We manage exposure to foreign currency risk by conducting ourinternational business operations primarily in their functional currencies.
ITEM 4. CONTROLS AND PROCEDURES
EVALUATION OF DISCLOSURE CONTROLS AND PROCEDURES
We maintain disclosure controls and procedures as defined in Rules 13a-15(e) and 15d-15(e) under the SecuritiesExchange Act of 1934 (Exchange Act) that are designed to provide reasonable assurance that informationrequired to be disclosed by us in reports that we file or submit under the Exchange Act is (i) recorded, processed,summarized and reported within the time periods specified in SEC rules and forms; and (ii) accumulated andcommunicated to our management, including our principal executive officer and principal financial officer, asappropriate to allow timely decisions regarding required disclosure.
In connection with the filing of this Form 10-Q, management evaluated, under the supervision and with theparticipation of our Chief Executive Officer and Chief Financial Officer, the effectiveness of the design andoperation of our disclosure controls and procedures as of March 31, 2015. Based upon that evaluation, our ChiefExecutive Officer and Chief Financial Officer concluded that our disclosure controls and procedures wereeffective at the reasonable assurance level as of March 31, 2015.
31
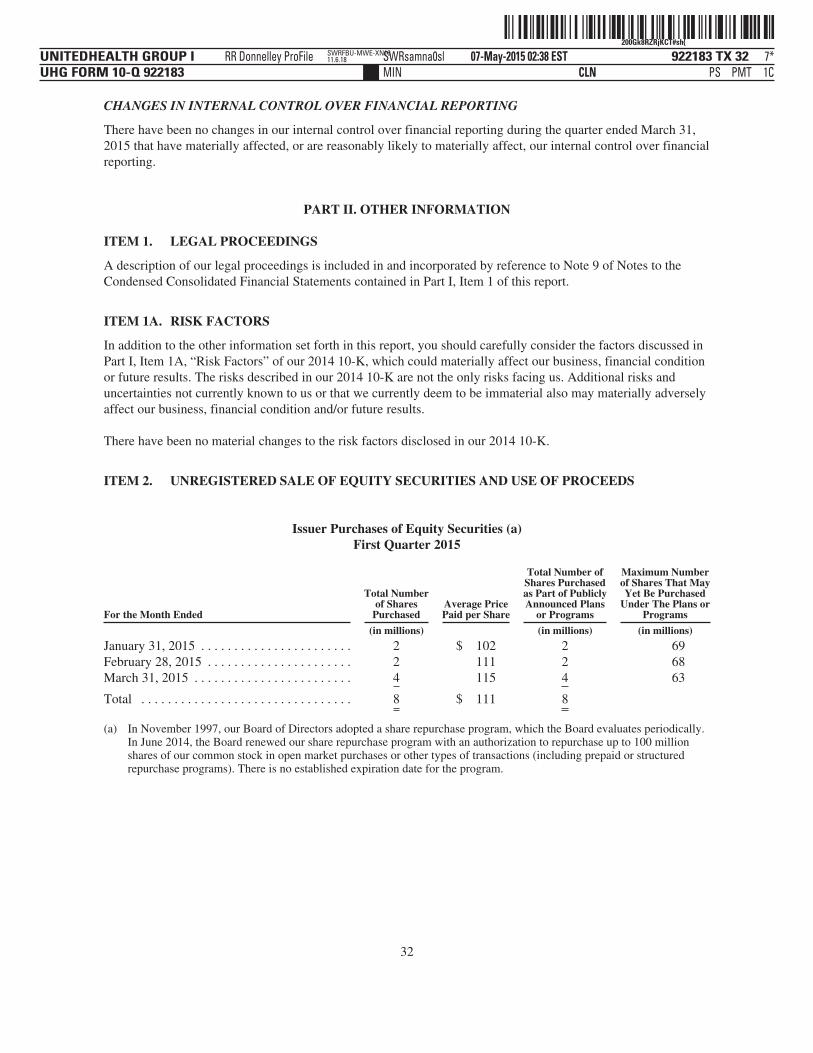
ˆ200Gk8RZRjKCT#sh{Š200Gk8RZRjKCT#sh{
922183 TX 32UNITEDHEALTH GROUP IUHG FORM 10-Q 922183
07-May-2015 02:38 ESTCLN PSMIN
RR Donnelley ProFile SWRsamna0sl 7*PMT 1C
SWRFBU-MWE-XN1611.6.18
CHANGES IN INTERNAL CONTROL OVER FINANCIAL REPORTING
There have been no changes in our internal control over financial reporting during the quarter ended March 31,2015 that have materially affected, or are reasonably likely to materially affect, our internal control over financialreporting.
PART II. OTHER INFORMATION
ITEM 1. LEGAL PROCEEDINGS
A description of our legal proceedings is included in and incorporated by reference to Note 9 of Notes to theCondensed Consolidated Financial Statements contained in Part I, Item 1 of this report.
ITEM 1A. RISK FACTORS
In addition to the other information set forth in this report, you should carefully consider the factors discussed inPart I, Item 1A, “Risk Factors” of our 2014 10-K, which could materially affect our business, financial conditionor future results. The risks described in our 2014 10-K are not the only risks facing us. Additional risks anduncertainties not currently known to us or that we currently deem to be immaterial also may materially adverselyaffect our business, financial condition and/or future results.
There have been no material changes to the risk factors disclosed in our 2014 10-K.
ITEM 2. UNREGISTERED SALE OF EQUITY SECURITIES AND USE OF PROCEEDS
Issuer Purchases of Equity Securities (a)First Quarter 2015
For the Month Ended
Total Numberof Shares
PurchasedAverage PricePaid per Share
Total Number ofShares Purchasedas Part of PubliclyAnnounced Plans
or Programs
Maximum Numberof Shares That MayYet Be Purchased
Under The Plans orPrograms
(in millions) (in millions) (in millions)
January 31, 2015 . . . . . . . . . . . . . . . . . . . . . . . 2 $ 102 2 69February 28, 2015 . . . . . . . . . . . . . . . . . . . . . . 2 111 2 68March 31, 2015 . . . . . . . . . . . . . . . . . . . . . . . . 4 115 4 63
Total . . . . . . . . . . . . . . . . . . . . . . . . . . . . . . . . 8 $ 111 8
(a) In November 1997, our Board of Directors adopted a share repurchase program, which the Board evaluates periodically.In June 2014, the Board renewed our share repurchase program with an authorization to repurchase up to 100 millionshares of our common stock in open market purchases or other types of transactions (including prepaid or structuredrepurchase programs). There is no established expiration date for the program.
32
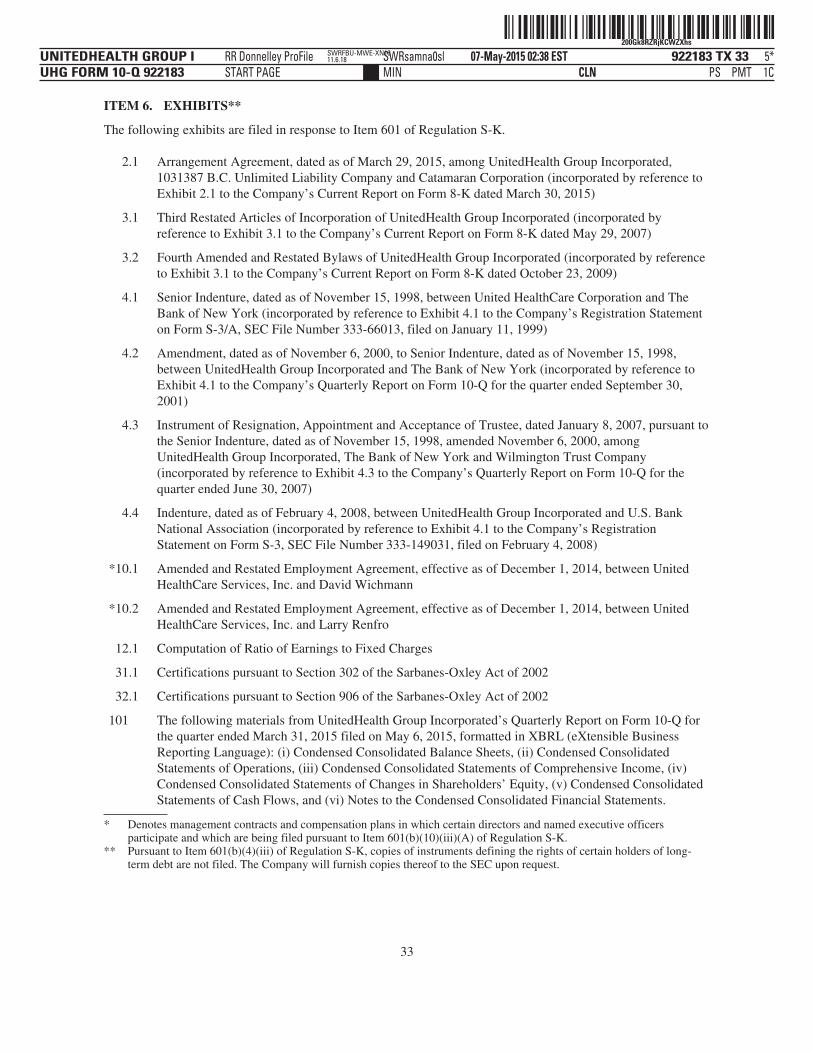
ˆ200Gk8RZRjKCWZXhsŠ200Gk8RZRjKCWZXhs
922183 TX 33UNITEDHEALTH GROUP IUHG FORM 10-Q 922183
07-May-2015 02:38 ESTCLN PSMIN
RR Donnelley ProFile SWRsamna0slSTART PAGE
5*PMT 1C
SWRFBU-MWE-XN1611.6.18
ITEM 6. EXHIBITS**
The following exhibits are filed in response to Item 601 of Regulation S-K.
2.1 Arrangement Agreement, dated as of March 29, 2015, among UnitedHealth Group Incorporated,1031387 B.C. Unlimited Liability Company and Catamaran Corporation (incorporated by reference toExhibit 2.1 to the Company’s Current Report on Form 8-K dated March 30, 2015)
3.1 Third Restated Articles of Incorporation of UnitedHealth Group Incorporated (incorporated byreference to Exhibit 3.1 to the Company’s Current Report on Form 8-K dated May 29, 2007)
3.2 Fourth Amended and Restated Bylaws of UnitedHealth Group Incorporated (incorporated by referenceto Exhibit 3.1 to the Company’s Current Report on Form 8-K dated October 23, 2009)
4.1 Senior Indenture, dated as of November 15, 1998, between United HealthCare Corporation and TheBank of New York (incorporated by reference to Exhibit 4.1 to the Company’s Registration Statementon Form S-3/A, SEC File Number 333-66013, filed on January 11, 1999)
4.2 Amendment, dated as of November 6, 2000, to Senior Indenture, dated as of November 15, 1998,between UnitedHealth Group Incorporated and The Bank of New York (incorporated by reference toExhibit 4.1 to the Company’s Quarterly Report on Form 10-Q for the quarter ended September 30,2001)
4.3 Instrument of Resignation, Appointment and Acceptance of Trustee, dated January 8, 2007, pursuant tothe Senior Indenture, dated as of November 15, 1998, amended November 6, 2000, amongUnitedHealth Group Incorporated, The Bank of New York and Wilmington Trust Company(incorporated by reference to Exhibit 4.3 to the Company’s Quarterly Report on Form 10-Q for thequarter ended June 30, 2007)
4.4 Indenture, dated as of February 4, 2008, between UnitedHealth Group Incorporated and U.S. BankNational Association (incorporated by reference to Exhibit 4.1 to the Company’s RegistrationStatement on Form S-3, SEC File Number 333-149031, filed on February 4, 2008)
*10.1 Amended and Restated Employment Agreement, effective as of December 1, 2014, between UnitedHealthCare Services, Inc. and David Wichmann
*10.2 Amended and Restated Employment Agreement, effective as of December 1, 2014, between UnitedHealthCare Services, Inc. and Larry Renfro
12.1 Computation of Ratio of Earnings to Fixed Charges
31.1 Certifications pursuant to Section 302 of the Sarbanes-Oxley Act of 2002
32.1 Certifications pursuant to Section 906 of the Sarbanes-Oxley Act of 2002
101 The following materials from UnitedHealth Group Incorporated’s Quarterly Report on Form 10-Q forthe quarter ended March 31, 2015 filed on May 6, 2015, formatted in XBRL (eXtensible BusinessReporting Language): (i) Condensed Consolidated Balance Sheets, (ii) Condensed ConsolidatedStatements of Operations, (iii) Condensed Consolidated Statements of Comprehensive Income, (iv)Condensed Consolidated Statements of Changes in Shareholders’ Equity, (v) Condensed ConsolidatedStatements of Cash Flows, and (vi) Notes to the Condensed Consolidated Financial Statements.
* Denotes management contracts and compensation plans in which certain directors and named executive officersparticipate and which are being filed pursuant to Item 601(b)(10)(iii)(A) of Regulation S-K.
** Pursuant to Item 601(b)(4)(iii) of Regulation S-K, copies of instruments defining the rights of certain holders of long-term debt are not filed. The Company will furnish copies thereof to the SEC upon request.
33
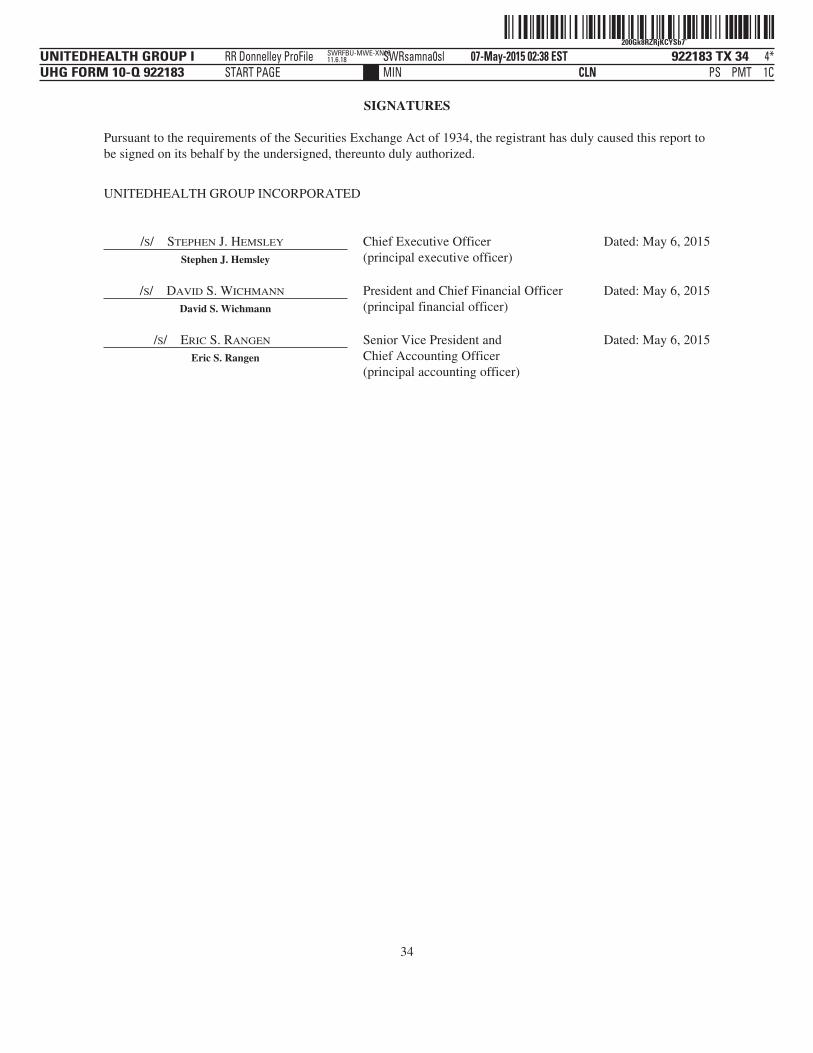
ˆ200Gk8RZRjKCYSb7ÆŠ200Gk8RZRjKCYSb7˘
922183 TX 34UNITEDHEALTH GROUP IUHG FORM 10-Q 922183
07-May-2015 02:38 ESTCLN PSMIN
RR Donnelley ProFile SWRsamna0slSTART PAGE
4*PMT 1C
SWRFBU-MWE-XN1611.6.18
SIGNATURES
Pursuant to the requirements of the Securities Exchange Act of 1934, the registrant has duly caused this report tobe signed on its behalf by the undersigned, thereunto duly authorized.
UNITEDHEALTH GROUP INCORPORATED
/S/ STEPHEN J. HEMSLEY
Stephen J. Hemsley
Chief Executive Officer(principal executive officer)
Dated: May 6, 2015
/S/ DAVID S. WICHMANN
David S. Wichmann
President and Chief Financial Officer(principal financial officer)
Dated: May 6, 2015
/S/ ERIC S. RANGEN
Eric S. Rangen
Senior Vice President andChief Accounting Officer(principal accounting officer)
Dated: May 6, 2015
34
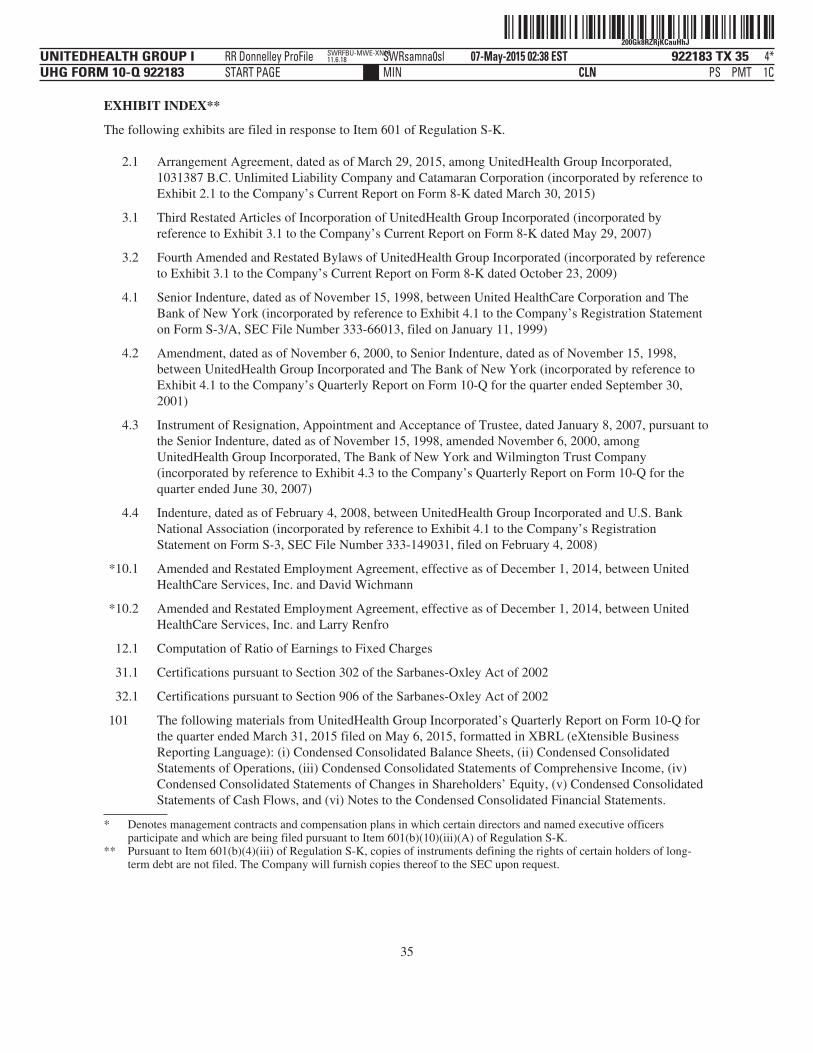
ˆ200Gk8RZRjKCauHhJŠ200Gk8RZRjKCauHhJ
922183 TX 35UNITEDHEALTH GROUP IUHG FORM 10-Q 922183
07-May-2015 02:38 ESTCLN PSMIN
RR Donnelley ProFile SWRsamna0slSTART PAGE
4*PMT 1C
SWRFBU-MWE-XN1611.6.18
EXHIBIT INDEX**
The following exhibits are filed in response to Item 601 of Regulation S-K.
2.1 Arrangement Agreement, dated as of March 29, 2015, among UnitedHealth Group Incorporated,1031387 B.C. Unlimited Liability Company and Catamaran Corporation (incorporated by reference toExhibit 2.1 to the Company’s Current Report on Form 8-K dated March 30, 2015)
3.1 Third Restated Articles of Incorporation of UnitedHealth Group Incorporated (incorporated byreference to Exhibit 3.1 to the Company’s Current Report on Form 8-K dated May 29, 2007)
3.2 Fourth Amended and Restated Bylaws of UnitedHealth Group Incorporated (incorporated by referenceto Exhibit 3.1 to the Company’s Current Report on Form 8-K dated October 23, 2009)
4.1 Senior Indenture, dated as of November 15, 1998, between United HealthCare Corporation and TheBank of New York (incorporated by reference to Exhibit 4.1 to the Company’s Registration Statementon Form S-3/A, SEC File Number 333-66013, filed on January 11, 1999)
4.2 Amendment, dated as of November 6, 2000, to Senior Indenture, dated as of November 15, 1998,between UnitedHealth Group Incorporated and The Bank of New York (incorporated by reference toExhibit 4.1 to the Company’s Quarterly Report on Form 10-Q for the quarter ended September 30,2001)
4.3 Instrument of Resignation, Appointment and Acceptance of Trustee, dated January 8, 2007, pursuant tothe Senior Indenture, dated as of November 15, 1998, amended November 6, 2000, amongUnitedHealth Group Incorporated, The Bank of New York and Wilmington Trust Company(incorporated by reference to Exhibit 4.3 to the Company’s Quarterly Report on Form 10-Q for thequarter ended June 30, 2007)
4.4 Indenture, dated as of February 4, 2008, between UnitedHealth Group Incorporated and U.S. BankNational Association (incorporated by reference to Exhibit 4.1 to the Company’s RegistrationStatement on Form S-3, SEC File Number 333-149031, filed on February 4, 2008)
*10.1 Amended and Restated Employment Agreement, effective as of December 1, 2014, between UnitedHealthCare Services, Inc. and David Wichmann
*10.2 Amended and Restated Employment Agreement, effective as of December 1, 2014, between UnitedHealthCare Services, Inc. and Larry Renfro
12.1 Computation of Ratio of Earnings to Fixed Charges
31.1 Certifications pursuant to Section 302 of the Sarbanes-Oxley Act of 2002
32.1 Certifications pursuant to Section 906 of the Sarbanes-Oxley Act of 2002
101 The following materials from UnitedHealth Group Incorporated’s Quarterly Report on Form 10-Q forthe quarter ended March 31, 2015 filed on May 6, 2015, formatted in XBRL (eXtensible BusinessReporting Language): (i) Condensed Consolidated Balance Sheets, (ii) Condensed ConsolidatedStatements of Operations, (iii) Condensed Consolidated Statements of Comprehensive Income, (iv)Condensed Consolidated Statements of Changes in Shareholders’ Equity, (v) Condensed ConsolidatedStatements of Cash Flows, and (vi) Notes to the Condensed Consolidated Financial Statements.
* Denotes management contracts and compensation plans in which certain directors and named executive officersparticipate and which are being filed pursuant to Item 601(b)(10)(iii)(A) of Regulation S-K.
** Pursuant to Item 601(b)(4)(iii) of Regulation S-K, copies of instruments defining the rights of certain holders of long-term debt are not filed. The Company will furnish copies thereof to the SEC upon request.
35