United Nations Development Programme FUNDING COMPENDIUM … · funding compendium 2014 · 2...
28
Empowered lives. Resilient nations. FUNDING COMPENDIUM 2014 United Nations Development Programme
Transcript of United Nations Development Programme FUNDING COMPENDIUM … · funding compendium 2014 · 2...

Empowered lives Resilient nations
FUNDING COMPENDIUM 2014
United Nations Development Programme
FUNDING COMPENDIUM 2014 2
CONTENTS
FOREWORD
UNDP IN 2014
EXECUTIVE SUMMARY
RESOURCES BY FUNDING TYPE
RESOURCES BY FUNDING CHANNEL
CORE RESOURCES
OTHER RESOURCES
Domestic Resources
Thematic Funds
Vertical Funds
UN Pooled Funds
RESOURCES BY PARTNER
3
4
5
6
8
11
15
16
18
20
22
24
Cover photo With UNDP support communities in Benin are getting access to renewable energy copyUNDP Benin
FOREWORD2015 IS A LANDMARK YEAR World leadersrsquo decisions in Sendai Addis Ababa New York and Paris offer a major opportunity to strengthen international cooperation for sustainable development and resilience The issues are not new But an opportunity to address them comprehensively is rare UNDP will pursue all available avenues to help people and countries prosper
WE WILL
Help countries raise domestic funds The Addis Ababa Action Agenda (AAAA) calls for global support to help developing countries achieve self-reliance and sustainable economic transformation by raising domestic revenues and attracting private finance Official development assistance (ODA) providers are recommitting to achieve the target of 07 of gross national income for ODA and 015 to 020 for least developed countries
Help countries explore public financing beyond ODA A more sophisticated approach to financing for development is needed Public and private finance (domestic and international) beyond ODA is needed We must also ensure that development financing is informed by risk
Pursue partnerships Different sources of financing are increasingly reinforcing each other and to ensure success we must build strong partnerships across governments the private sector civil society academia research institutions and multilateral organizations
Support countries to use public financing to leverage private funds International public finance will continue to play an important role in complementing domestic resources especially in the poorest and most vulnerable countries Given the scale of investments needed to achieve the SDGs additional financing is needed using public funds to leverage private investments
UNDP recognizes the important role of all resourcesmdashdomestic and international public and privatemdash to achieve sustainable development and implement the SDGs We will continue to be a partner to governments and help governments access different forms of development funds for country-driven priorities and strategies in line with our Strategic Plan and the SDGs
As the UNrsquos lead development agency UNDP oversees a nearly $5 billion portfolio The majority of initiatives we support are funded by earmarked resources from governments multilateral partners and vertical funds such as the Global Environment Facility and the Global Fund to Fight AIDS Tuberculosis and Malaria (GFATM) It is the continuing support to our core budget from partner countriesmdashtotaling $793 million in 2014mdashthat makes all those other initiatives possible Core funding is the bedrock of the organization and is what makes UNDP a reliable and effective partner
UNDP is grateful to our partners for their continued trust and support This report is part of our ongoing effort to recognize all contributions and demonstrate greater transparency
Michael OrsquoNeillAssistant Secretary-General amp
Assistant AdministratorBureau of External Relations and Advocacy
UNDP IN 2014
MEASURABLE IMPROVEMENT IN THE LIVES OF MILLIONS OF PEOPLE
Core resources enable UNDP to carry out its Strategic Plan maximize value from other forms of financing and achieve development results In 2014 UNDP projects led to
SUSTAINABLE DEVELOPMENT PATHWAYS
bull 112 million people (57 million women) benefiting from improved livelihoods in 94 countries
bull 920000 new jobs (41 for women) created in 77 countries
bull 33 countries adopting policies and systems to boost employment and livelihoods
bull Technology support in 48 countries to phase out gases that destroy the ozone layer
bull 40 countries implementing or completing MDG acceleration framework action plans
bull 39 countries implementing measures towards low-emission and climate-resilient development objectives
INCLUSIVE AND EFFECTIVE DEMOCRATIC GOVERNANCE
bull Over 18 million new voters registered in 21 countries including nearly 4 million in Afghanistan where one million more women registered than in 2009
bull 750000 people (51 women) in 22 countries gaining access to legal aid services
bull 14 million people receiving antiretroviral treatment in 20 countries
bull 22 million people receiving HIV-related behavioural change communication in 20 countries
bull Over 7 million people (49 women) expressing their vision for the future through the UNDP hosted lsquoMy Worldrsquo global survey the largest crowd-sourcing exercise in United Nations history
RESILIENCE BUILDING
bull 98 new disaster reduction and adaptation plans in place in 23 countries
bull 21 countries with enforceable lawsregulations to address disaster and climate risks
bull 13 million people achieving better access to energy in 26 countries
bull 158 new early warning systems in 17 countries
EXECUTIVE SUMMARY
The present Compendium gives an overview of UNDPrsquos funding resources
1 The first chapter shows resources by funding typemdashregular resources also referred to as core and other resourcesmdashas well as funding trends over the past five years
2 The second chapter explains how UNDP receives contributions from its partners
a Regular or ldquocorerdquo resources with a list of UNDPrsquos top contributors in 2014 and contribution trends over the past five years
b Funds earmarked to programmes and projects
c Thematic funding including the importance of flexible funding and total contributions received by UNDP for Thematic Trust Funds since 2010
d Vertical funds mainly with the Global Fund and the Global Environment Facility
e UN pooled funds featuring UNDPrsquos role as Administrative Agent for Multi-Donor Trust Funds and Joint Programmes in the UN system and the share of pooled funds UNDP implements as a participating organization
3 The third chapter shows funding by partnermdashsuch as governments multi-lateral organizations and UN entities
All funding channels are important for UNDP to mobilize the resources required to deliver on our Strategic Plan But core funds by virtue of not being earmarked are the most adaptable in addressing the priorities outlined in the Plan
RESOURCES BY FUNDING TYPE 6
RESOURCES BY
FUNDING TYPE
RESOURCES BY FUNDING TYPE 7
Over the past five years there has been a decline in the amount of core resource contributions to UNDP an increase in highly earmarked contributions and a growing imbalance between core and other resources
COREOTHER RESOURCES TREND 2010-2014
RESOURCES BY FUNDING TYPE
In 2014 overall contributions to UNDP amounted to $4715 billion decreasing by 3 compared to $484 billion in 2013 Core resources (comprising 17 of total contributions) decreased by 11 to $793 million from $896 million in 2013 due to reduced contributions from partners currency fluctuations and non-receipt of contributions intended for 2014 Other resources received amounted to $3922 billion falling by 1 from $3944 billion in 2013
1 This figure excludes cash and in-kind contributions towards Government Local Office Costs (GLOC)
Other Resources($392B)
Regular Resources($793M)17
83
0
$1B
$2B
$3B
$4B
$5B
$6B
20142013201220112010
($4715B)($4840B)($4826B)($5055B)
($5277B)
Other ResourcesRegular Resources Total
82($4310B)
18($967M)
81($4080B)
19($975M)
82($3980B)
18($846M)
81($3944B)
19($896M)
83($3922B)
17($793M)
RESOURCES BY FUNDING CHANNEL 8
RESOURCES BY
FUNDING CHANNEL
RESOURCES BY FUNDING CHANNEL 9
With total resources in the range of $5 billion annually and programmes in 177 countries and territories contributions to UNDP are channelled through any of the following modalities 1) voluntary contributions to core resources 2) funds intended for specific thematic areas 3) funds earmarked to programmes and projects including government domestic resources 4) UN pooled funds or 5) funds confined to a single development domain or vertical funds
The illustration below shows the range of the flexibility of resources offered by the different funding channels Core resources offer the most flexibility while vertical funds offer the least
MORE FLEXIBLE FUNDING LESS FLEXIBLE FUNDING
CORE
The bedrock of the Organization for its
exibility
THEMATIC FUNDING
Lightly earmarked funding that allows the Organization to allocate funds to programmes
and projects in accordance with needs
and in line with the Strategic Plan
FUNDING EARMARKED TO PROGRAMMES OR
PROJECTS
Bilateral andmultilateral
contributions including domestic ressources from
programme countries
UN POOLED FUNDS
Funds from multiple partners allocated to
multiple implementing entities to support
specic national regional or global priorities
Multi-Donor Trust Funds and Joint Programmes
are the main mechanisms used by the UN system
VERTICAL FUNDS
Funds intended for a specic development
area (eg health climate change etc) approved for projects through a
call-for-proposals process
The largest share of contributions received by UNDP in 2014 was from bilateral and multilateral funds (58) of which 19 are domestic resources invested by programme countries Core resources (17) was the second largest followed by vertical funds (15) UN pooled funds (6) thematic funds (3) and Government Local Office Costs or GLOC (1)
UN Pooled funds(6)
Bilateral and multilateral funds(58)
(Domestic resources)(19)
Vertical funds(15)
Core resources(17)
GLOC(1)
Thematic funds(3)
FUNDING BY CHANNEL 2014
RESOURCES BY FUNDING CHANNEL 10
FUNDING BY CHANNEL 2009-2014
Since 2009 funds earmarked to programmes and projects have remained the biggest source of funding for UNDP
0
$05B
$1B
$15B
$2B
$25B
Thematic Funds
UN Pooled Funds
Vertical Funds
Core
Domestic Resources
Funds earmarked to programmes and projects
201420132012201120102009
RESOURCES BY FUNDING CHANNEL CORE RESOURCES 11
CORE RESOURCES
Core resources form the bedrock of UNDP and hence are the bedrock of support to the worldrsquos poorest countries In 2014 56 partners contributed $793 million to core OECDDAC members contributed 975 of total core contribu-tions with the top 15 accounting for 96 of the total A total of $1927 million was received from non-DAC members
CORE CONTRIBUTIONS 2014
Africa2 Countries ($011M)
Other States1 Country ($010M)
Latin America and the Caribbean5 Countries ($055M)
Arab States7 Countries ($358M)
Europe and the CIS5 Countries ($428M)
Asia and the Pacic14 Countries ($1123M)
Non-DAC Members(25)
DAC Members(975)
RESOURCES BY FUNDING CHANNEL CORE RESOURCES 12
TOP 30 CONTRIBUTORS TO CORE RESOURCES
Contributions for 2014 from Canada and India were received in 2015 Contribution from Australia excludes amount intended for 2013 and received in 2014
0 $20M $40M $60M $80M $100M $120M
United Arab Emirates
Bangladesh
Iraq
Kuwait
Thailand
Russian Federation
Saudi Arabia
Austria
Turkey
Luxembourg
China
India
Italy
Korea Republic of
New Zealand
Ireland
Australia
France
Belgium
Germany
Finland
Canada
Netherlands
Denmark
Switzerland
Sweden
Japan
United States of America
United Kingdom
Norway $1122M
$903M
$810M
$805M
$729M
$635M
$601M
$368M
$356M
$303M
$291M
$237M
$186M
$181M
$117M
$66M
$64M
$44M
$43M
$38M
$36M
$30M
$21M
$20M
$11M
$09M
$06M
$05M
$04M
$03M
RESOURCES BY FUNDING CHANNEL CORE RESOURCES 13
PARTNERS THAT INCREASED THEIR CORE CONTRIBUTION IN 2014
PARTNERS THAT MADE EARLY PAYMENTS IN 2013 AND 2014
Austria
Bangladesh
Chile
Costa Rica
Estonia
Finland
France
Ireland
Kuwait
Belgium
Chile
Iraq
Mozambique
Luxembourg
New Zealand
Norway
Saudi Arabia
Singapore
South Africa
Thailand
UAE
United Kingdom
Republic of Korea
Sri Lanka
United States
RESOURCES BY FUNDING CHANNEL WHY INVEST IN THE CORE FUNDING OF UNDP 14
PARTNERS THAT INVEST IN UNDPrsquoS CORE FUNDING
JOIN FORCES WITH A LEADING SUSTAINABLE DEVELOPMENT ORGANIZATION AND ENSURE GLOBAL IMPACT
bull UNDP offers 50 years of experience in sustainable development and remains the partner of choice for governments and other actors across the globe to eradicate poverty and reduce inequalities and exclusion
bull Core resources enable UNDP to provide the international community with the most extensive field-based presence of the multilateral system to help countries deliver on internationally agreed development goals UNDPrsquos global reach represents the most cost-effective and strategic complement to bilateral cooperation
PROMOTE COHERENCE OF THE UN DEVELOPMENT SYSTEM EFFECTIVENESS AND TRANSPARENCY
bull Core resources form the bedrock of the UN Resident Coordinator system at country levelmdashmanaged and principally funded by UNDPmdash which brings together all UN development agencies for maximum impact This is crucial for UN country teamsrsquo support to implementing the Sustainable Development Goals
bull Core funds support the high standards of efficiency quality assurance and transparency UNDP has attained The new organizational structure is leaner by 10 overall and by 30 in New York allowing us to operate more effectively at the country level Tighter standards for project quality were introduced integrating UNDPrsquos new social and environmental standards In 2014 UNDP ranked as the most transparent organization in the world on the International Aid Transparency Index
SUPPORT THE MOST VULNERABLE PROMOTE EQUITY AND ENABLE PROMPT RESPONSE TO CRISIS
bull Core funds are the pillar of our support to the worldrsquos poorest countries In 2014 UNDP allocated 90 of core programme resources to Low Income Countries (LICs) and 74 to Least Developed Countries (LDCs) Although only 10 of UNDPrsquos core programme resources went to Middle Income Countries (MICs) for every $1 of core resources invested in MICs UNDP leveraged $25 in other resources
bull UNDPrsquos core funds enable us to respond quickly and flexibly to crises The UN Secretary-General has tasked UNDP with leading the UN systemrsquos support for economic recovery from the Ebola crisis In 2014 UNDP allocated $545 million of core funds for the immediate Ebola response and helped pay 100 for response workers in affected countries to ensure uninterrupted health services case tracing and safe burials
WHY INVEST IN THE CORE FUNDING OF UNDP
RESOURCES BY FUNDING CHANNEL OTHER RESOURCES 15
OTHER RESOURCESOther resources range from lightly earmarked funds such as in the case of thematic funds to funds highly earmarked to specific programmes and projects Funds can be earmarked at the global regional country and most commonly project levels UN pooled funds and vertical funds are also earmarked for specific purposes
Funds earmarked to specific programmes and projects are received by UNDP either through a co-financing modality called ldquocost-sharingrdquo or in the form of trust funds The table below shows the top government contributors to other resources in 2014
0 $100M $200M $300M $400M $500M
Chile
Uruguay
Armenia
China
Panama
Turkey
Republic of Korea
Kuwait
Lebanon
Paraguay
Canada
Finland
Australia
Saudi Arabia
El Salvador
Denmark
Egypt
Colombia
Venezuela
Switzerland
Brazil
Netherlands
Sweden
Peru
Norway
United Kingdom
Germany
Argentina
Japan
United States $4179M
$3046M
$1981M
$1252M
$927M
$910M
$885M
$875M
$675M
$613M
$552M
$532M
$478M
$476M
$353M
$352M
$296M
$250M
$230M
$229M
$217M
$209M
$202M
$185M
$183M
$151M
$143M
$136M
$130M
$123M
RESOURCES BY FUNDING CHANNEL DOMESTIC RESOURCES 16
DOMESTIC RESOURCESDomestic resources are funds earmarked to programmes and projects They are contributions channelled through UNDP by governments from their domestic resources through a modality known as ldquogovernment cost-sharingrdquo
The chart below ranks countriesrsquo domestic contributions through government cost-sharing (GCS) in terms of volume It does not reflect the relative importance of GCS to these countries as a proportion of their Gross Domestic Product (GDP) Some countries contribute a greater percentage of their GDPs towards GCS even if the volume of their contributions is smaller
For example Sao Tome and Principe contributed approximately 017 of its GDP towards GCS Similarly Guinea-Bis-sau Timor-Leste Benin and Chad contributed 009 006 005 and 005 respectively of their GDP towards GCS With a total of $851 million contributed in 2014 an increasing number of programme countries like Senegal are channelling their domestic resources towards a UNDP programme or project in support of their national priorities
0 $50M $100M $150M $200M
Equatorial Guinea
Kazakhstan
Macedonia former Yugoslav Rep
Guatemala
Serbia
Guyana
Azerbaijan
Honduras
Chad
Mexico
United Republic of Tanzania
Nigeria
India
Turkey
Morocco
Chile
China
Uruguay
Dominican Republic
Armenia
Panama
Kuwait
Lebanon
Paraguay
Saudi Arabia
El Salvador
Colombia
Egypt
Venezuela
Brazil
Peru
Argentina $1978M
$852M
$601M
$532M
$476M
$441M
$350M
$296M
$217M
$213M
$162M
$151M
$136M
$122M
$121M
$120M
$113M
$104M
$102M
$90M
$87M
$76M
$76M
$67M
$66M
$63M
$63M
$62M
$57M
$48M
$44M
$43M
RESOURCES BY FUNDING CHANNEL SENEGAL INVESTS USD 198 MILLION TO BOOST RURAL DEVELOPMENT 17
Senegal invests USD 198 million to boost rural developmentSenegal has initiated a vast local development programme to increase living standards across the countryside while at the same time stimulating the national economy
The initiative to be implemented by the United Nations Development Programme (UNDP) will accelerate the construction of roads and water points invest in agriculture and entrepreneurship and facilitate peoplersquos access to energy services
RESOURCES BY FUNDING CHANNEL THEMATIC FUNDS 18
THEMATIC FUNDS
With thematic funds partners channel their contributions to support activities on a particular theme UNDP has thematic funds for Crisis Prevention and Recovery Environment Democratic Governance Poverty Reduction Gender and Information Communication and Technology In 2014 contributions to thematic funds were $119 million or 3 of total contributions
0
$30M
$60M
$90M
$120M
$150M
Poverty Reduction
Information Communication and Technology
Gender
Environment
Democratic Governance
Crisis Prevention and Recovery
20142013201220112010
THEMATIC TRUST FUND CONTRIBUTIONS 2010-2014
RESOURCES BY FUNDING CHANNEL THEMATIC FUNDS 19
TOP CONTRIBUTORS TO THEMATIC FUNDS
NEW THEMATIC WINDOWS
UNDP is streamlining its thematic funding ldquowindowsrdquo to better respond to countriesrsquo needs and ensure that development funds are utilized more effectively and efficiently through improved management arrangements and results reporting
The new thematic windows to be operational in 2016 are in line with the objectives of the Strategic Plan and provide a vehicle for minimally earmarked contributions to be allocated to address priority needs and deliver quality results
GOVERNANCE AND PEACEBUILDING
bull Democratic Governancebull Conict Preventionbull HIVHealth and Development
POVERTY ERADICATION AND SUSTAINABLE DEVELOPMENT
bull Environment Mainstreamingbull Gender Empowerment and Equality
CLIMATE CHANGE AND DISASTER RISK REDUCTION
bull Climate Changebull Disaster Risk Reduction
CRISIS RESPONSE AND RECOVERY
bull Immediate Response to Crisisbull Crisis Recovery
INTEGRATED DEVELOPMENT PROGRAMMING
0 $5M $10M $15M $20M $25M $30M
United States
Australia
Finland
Luxembourg
Sweden
Switzerland
Denmark
Norway
United Kingdom
Netherlands
Germany $291M
$244M
$148M
$119M
$79M
$63M
$62M
$45M
$42M
$36M
$18M
RESOURCES BY FUNDING CHANNEL VERTICAL FUNDS 20
VERTICAL FUNDS
Vertical funds are created in response to single-issue advocacy campaigns and to tackle specific development issues They are governed by Steering Committees which decide on funding portfolios and allocation criteria and are assisted by independent Secretariats
Of the vertical funds UNDP engages with the Global Fund is the largest followed by the Global Environmental Facility and the Montreal Protocol
GLOBAL FUND
UNDP has partnered with the Global Fund to Fight AIDS Tuberculosis and Malaria since 2003 supporting pro-grammes in countries with limited ability to receive and manage this kind of fund
GLOBAL ENVIRONMENTAL FACILITY
As a Global Environmental Facility (GEF) implementing agency since 1992 UNDP supports countries to secure GEF resources and to meet global environmental obligations UNDP offers integrated technical services for countries including assistance on eligibility assessment programme formulation mobilization of co-financing implementation oversight and knowledge and results management
MULTILATERAL FUND FOR THE IMPLEMENTATION OF THE MONTREAL PROTOCOL
UNDP as an implementing agency of the Multilateral Fund supports investment projects demonstration projects that test approaches to development challenges and provides technical assistance and feasibility studies
Montreal Protocol($25M)
Global Fund($412M)
GEF($301M)
RESOURCES BY FUNDING CHANNEL VERTICAL FUNDS 21
GREEN CLIMATE FUND
The Green Climate Fund (GCF) is a new fund created under the United Nations Framework Convention on Climate Change (UNFCCC) aimed at combatting urgent and serious effects of climate change It is designed to support developing countries move towards low-emission and climate-resilient development
The GCF Board has approved UNDP as the first UN agency that will be able to access the Fundrsquos resources for devel-oping countries alongside six other entities from the public and private sector
The accreditation by GCF is a significant step allowing UNDP to continue its leadership role in scaling up climate change mitigation and adaptation for sustainable development
RESOURCES BY FUNDING CHANNEL UN POOLED FUNDS 22
UN POOLED FUNDS
Pooled fundingmdashmulti-donor trust funds (MDTFs) and joint programmesmdashis a mechanism for combining resources from multiple development partners and allocating such resources to multiple implementing entities to support specific national regional or global priorities
UNDP hosts the Multi-Partner Trust Fund Office (MPTFO) established in 2003 to facilitate coordinated action through-out the UN system It achieves this in part by designing and administering pooled financing instruments that are efficient accountable and transparent As the appointed fund administrator administrative agent the MPTFO helps design funds and channel contributions from a large number of contributors
EXAMPLES OF THE DIFFERENT POOLED FUND FUNCTIONS AND ADDED VALUE
MAIN FUNCTION OF THE FUND MAIN ADDED VALUE OF THE FUND
COHERENCEFills critical gaps and under-financed priorities to ensure a coherent and sequenced response in line with a strategic framework
CONSOLIDATIONReduces fragmentation with respect to particular priorities In many cases is the largest investment vehicle
SPECIALIZED OR THEMATIC
Has a specific expertise and focus on a particular thematic issue Usually the case for global funds
RISK MANAGEMENTReduces risks to governments and financial contributors through a comprehensive risk and result-based management system
INNOVATIONProvides a mechanism for clear attribution and transparency from innovative sources of finance Can also deepen national financing systems
RESOURCES BY FUNDING CHANNEL UN POOLED FUNDS 23
LARGEST POOLED FUNDS ADMINISTERED BY UNDP AS ADMINISTRATIVE AGENT
TOP 15 UN POOLED FUNDS IMPLEMENTED BY UNDP AS A PARTICIPATING UN ORGANIZATION
In 2014 UNDP received contributions of $273 million through pooled funds The table below shows pooled funds in which UNDP is a participating organization Aside from implementing programmes and projects UNDP also acts as Managing Agent for Common Humanitarian Funds (CHFs) by contracting monitoring and evaluating humanitarian NGOs as approved by the Humanitarian Coordinator
As Administrative and Fiscal Agent in 2014 the MPTFO received deposits of $906 million and made transfers of $842 million to participating organizations The chart below shows the largest pooled funds managed by UNDP as adminis-trative agent
0 $30M $60M $90M $120M $150M
Tanzania One UN Fund
UN REDD Programme Fund
CAR Common Humanitarian Fund
Somalia Common Humanitarian Fund
Afghanistan CHF
Sudan Common Humanitarian Fund
DRC Pooled Fund
Peacebuilding Fund
Ebola Response MPTF
South Sudan CHF $1294M
$1259M
$783M
$590M
$521M
$467M
$421M
$384M
$296M
$285M
0 $10M $20M $30M $40M $50M $60M $70M $80M
UN Action Against Sexual Violence
Darfur Peace amp Stability Fund
Rwanda One UN Fund
Iraq UNDAF Trust Fund
UN REDD Viet Nam Phase II MPTF
Lebanon Recovery Fund
JP Somalia Loc Gov amp Decentral
Ebola Response MPTF
Tanzania One UN Fund
UN REDD Programme Fund
DRC Pooled Fund
CAR Common Humanitarian Fund
Sudan Common Humanitarian Fund
Peacebuilding Fund
South Sudan CHF $742M
$325M
$247M
$243M
$146M
$134M
$111M
$109M
$62M
$58M
$58M
$46M
$44M
$35M
$31M
RESOURCES BY PARTNER 24
RESOURCES BY
PARTNER
RESOURCES BY PARTNER 25
RESOURCES BY PARTNER TYPE TREND 2010-2014
RESOURCES BY PARTNER TYPE
In 2014 governments contributed $3089 billion or 66 of total contributions whereas $1626 billion or 34 was received from other partners
Contributions from bilateral partners constituted 46 of total contributions followed by 19 from domestic resourc-es 16 from vertical funds 8 from the European Union 6 from UN pooled funds and 5 from the private sector foundations international financing institutions (IFIs) UN agencies and other partners
Private Sector Financing Institutions Foundations and other multilaterals
Bilateral Partners($2184M)
Others($96M)
UN Agencies($119M)
Domestic Resources($905M)
European Union($392)
UN Pooled Funds($281M)
Vertical Funds($738M)
UN Pooled Funds
Others
UN Agencies
Vertical Funds
European Union
Domestic Resources
Bilateral Partners
0
$05B
$1B
$15B
$2B
$25B
$3B
20142013201220112010
RESOURCES BY PARTNER 26
The majority of UNDPrsquos funding continues to come from bilateral governments (mostly OECD-DAC members) followed by government domestic resources vertical funds (mainly the Global Fund and the Global Environment Facility) and the European Union
Although the amounts received from the private sector and foundations are a small part of UNDPrsquos budget these contributions go beyond their financial benefit Private sector companies and foundations contribute their expertise in economic development and provide access to knowledge technology and innovation
In 2014 UNDP received a total of $38 million from the private sector and foundations with the largest contribution coming from the Bill and Melinda Gates Foundation ($97 million)
TOP 30 RESOURCE PARTNERS
Canadarsquos 2014 contribution was received in 2015 Excludes Australiarsquos 2013 contribution received in 2014
0 $100M $200M $300M $400M $500M
Regular Resources
Other Resources
France
Montreal Protocol
Republic of Korea
Other Multilaterals
Belgium
Saudi Arabia
El Salvador
Australia
Egypt
Colombia
Venezuela
Finland
Canada
Brazil
Peru
Denmark
Netherlands
Switzerland
UN Agencies
Germany
Sweden
United Kingdom
Argentina
Norway
UN Pooled Funds
Global Environmental Facility
Japan
European Union
Global Fund
United States $4989M
$4122M
$3916M
$3850M
$3015M
$2808M
$2032M
$1981M
$1830M
$1604M
$1543M
$1189M
$1187M
$1042M
$955M
$885M
$613M
$584M
$533M
$532M
$478M
$476M
$431M
$352M
$316M
$306M
$298M
$248M
$247M
$219M
RESOURCES BY PARTNER 27
The chart below shows total contributions from government partners including domestic resources channelled through UNDP
TOP 30 GOVERNMENT PARTNERS
Canadarsquos 2014 contribution was received in 2015 Excludes Australiarsquos 2013 contribution received in 2014
0 $100M $200M $300M $400M $500M
Regular Resources
Other ResourcesPanama
Ireland
China
Kuwait
Lebanon
Turkey
Paraguay
France
Republic of Korea
Belgium
Saudi Arabia
El Salvador
Australia
Egypt
Colombia
Venezuela
Finland
Canada
Brazil
Peru
Denmark
Netherlands
Switzerland
Germany
Sweden
United Kingdom
Argentina
Norway
Japan
United States $4989M
$3850M
$2032M
$1981M
$1830M
$1604M
$1543M
$1187M
$1042M
$955M
$885M
$613M
$584M
$533M
$532M
$478M
$476M
$431M
$352M
$316M
$306M
$248M
$219M
$217M
$213M
$209M
$207M
$181M
$168M
$153M
RESOURCES BY PARTNER 28
Who we work with
African Development Bank Arab African International Bank Asian Development Bank
Banco Santander Bank Beirut and Arab Countries Banque Libano-Francaise Banco do
Nordeste Banco do Brasil Central American Bank for Economic Integration Corporacion Andina de Fomento Ecobank Ghana Erste amp Steiermarische Bank Eurasian Development Bank European Bank for Reconstruction and
Development International Development Association Inter-American Development Bank International Finance Corporation International
Monetary Fund Islamic Development Bank Saudi Arabian British Bank World Bank Group
Africa
Angola Cameroon Comoros Congo Cote
drsquoIvoire Ethiopia Ghana Guinea-Bissau Lesotho Liberia Mali Mauritania Mozambique Sao Tome
and Principe South Africa South Sudan Tanzania
Zimbabwe
Latin America
Argentina Barbados Bolivia Brazil Costa Rica
Ecuador Guatemala Guyana Haiti Nicaragua
Paraguay Suriname Venezuela
Europe and the Commonwealth of
Independent States
Croatia Kazakhstan Kyrgyzstan Russian
Federation TajikistanTurkey
Uzbekistan
Asia Pacic
Afghanistan Bangladesh India Indonesia Nepal Papua New Guinea Sri
Lanka Thailand
Arab States
Egypt Lebanon Programme for
Palestinian People Saudi Arabia Somalia Sudan
Yemen
In order to diversify its partnership and funding base UNDP launched a lsquo100 partnersrsquo campaign targeting to reach 100 Member States contributing to core resources by 2017 UNDP is also cultivating its relationship with international financing institutions (IFIs) foundations and the private sector through new engagement strate-gies and platforms for collaboration to implement the SDGs Although the volume of contributions received from IFIs in 2014 was low UNDP engages with a variety of financial institutions on national priorities around the world as shown below
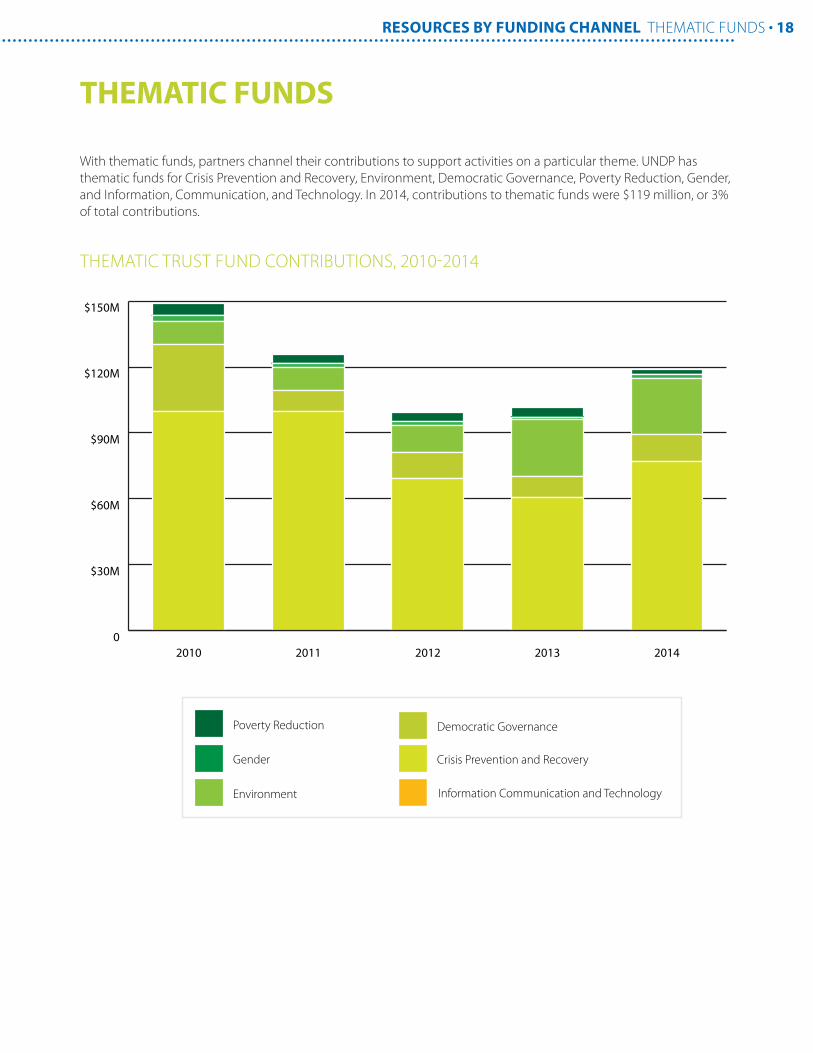