Human Resources for Health (HRH) Indicator Compendium · Human Resources for Health (HRH) Indicator...
37
Human Resources for Health (HRH) Indicator Compendium August 2015 Alfredo Fort, Sara Pacqué-Margolis, Crystal Ng, Sylvia Kauffman, and Emily Nicholson, IntraHealth International
Transcript of Human Resources for Health (HRH) Indicator Compendium · Human Resources for Health (HRH) Indicator...
Human Resources for Health (HRH) Indicator Compendium
August 2015
Alfredo Fort, Sara Pacqué-Margolis, Crystal Ng, Sylvia Kauffman, and
Emily Nicholson, IntraHealth International
Human Resources for Health (HRH) Indicator Compendium ii
TABLE OF CONTENTS Acronyms............................................................................................................................................................................................... iii
Introduction .......................................................................................................................................................................................... 1
Data Source Limitations ................................................................................................................................................................ 4
Thematic Gaps .................................................................................................................................................................................. 4
Document Structure ....................................................................................................................................................................... 4
Compendium of Indicators ........................................................................................................................................................... 5
1. Macro Level Indicators ................................................................................................................................................... 5
i. Leaderhip, Advocacy, and Partnerships ............................................................................................................... 5
ii. Legal Framework .......................................................................................................................................................... 5
iii. Finance ............................................................................................................................................................................ 5
iv. Gender ............................................................................................................................................................................ 6
v. Migration and Labor Market ................................................................................................................................... 6
2. Specific Programmatic Area Indicators.................................................................................................................... 7
i. Health Workforce Policy ............................................................................................................................................ 7
ii. Human Resources Planning..................................................................................................................................... 7
3. Human Resources for Health Information Systems............................................................................................ 8
4. Health Workforce Lifespan ........................................................................................................................................... 8
i. Preservice Education.................................................................................................................................................... 8
ii. Registration and Licensure ...................................................................................................................................... 9
iii. Recruitment ............................................................................................................................................................... 10
iv. Retention and Exit ................................................................................................................................................... 10
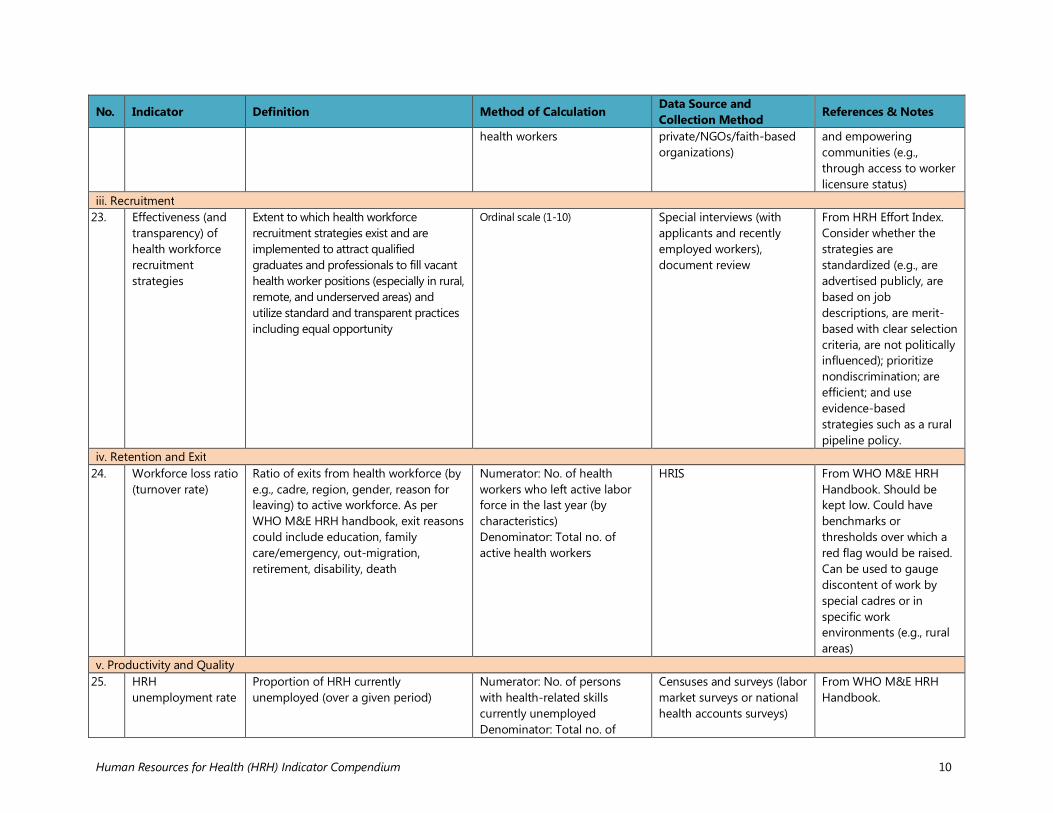
v. Productivity and Quality ........................................................................................................................................ 10
vi. Recognition and Promotion ................................................................................................................................ 12
vii. Transition ................................................................................................................................................................... 12
5. Health Workforce Performance Support and Enabling Environment ...................................................... 13
i. Job Descriptions ......................................................................................................................................................... 13
ii. Tools and Guidelines ............................................................................................................................................... 13
iii. Supportive Supervision and Feedback ............................................................................................................ 13
iv. Compensation/Remuneration/Incentives ...................................................................................................... 14
v. Communication and Connectivity...................................................................................................................... 14
vi. In-Service Training .................................................................................................................................................. 14
vii. Safety ........................................................................................................................................................................... 15
6. Monitoring and Evaluation of Human Resources for Health ....................................................................... 15
References........................................................................................................................................................................................... 16
Appendix A: Additional Resources ........................................................................................................................................ 17
Appendix B: Measurement Tools ........................................................................................................................................... 19
Human Resources for Health (HRH) Indicator Compendium iii
ACRONYMS
HAF HRH Action Framework HRH human resources for health HRIS human resources information systems HRM human resources management IMR infant mortality rate M&E monitoring and evaluation QoC quality of care USAID United States Agency for International Development WHO World Health Organization
Human Resources for Health (HRH) Indicator Compendium 1
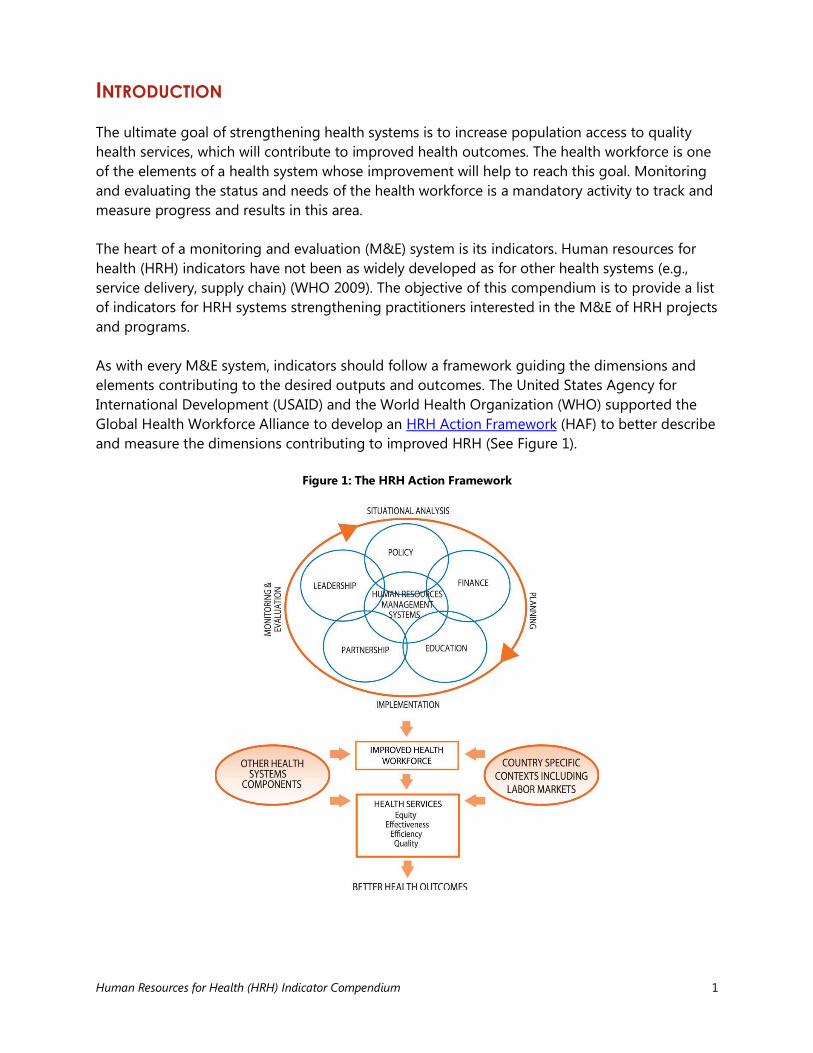
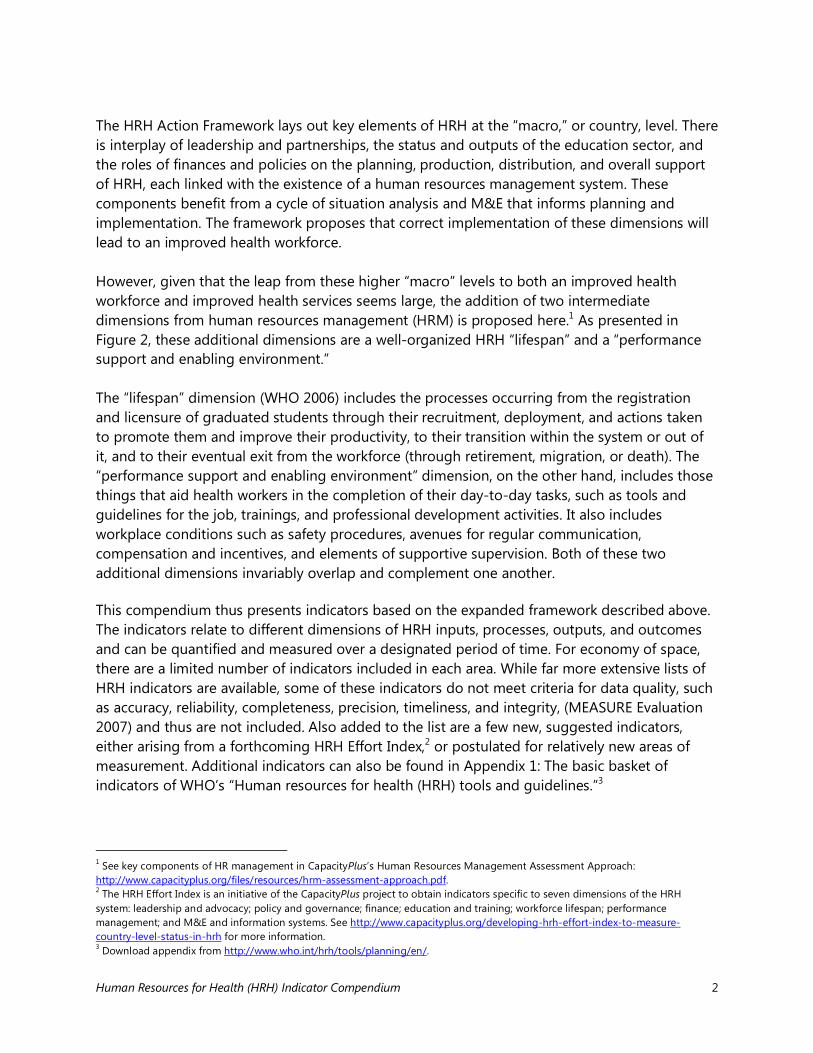
INTRODUCTION The ultimate goal of strengthening health systems is to increase population access to quality health services, which will contribute to improved health outcomes. The health workforce is one of the elements of a health system whose improvement will help to reach this goal. Monitoring and evaluating the status and needs of the health workforce is a mandatory activity to track and measure progress and results in this area. The heart of a monitoring and evaluation (M&E) system is its indicators. Human resources for health (HRH) indicators have not been as widely developed as for other health systems (e.g., service delivery, supply chain) (WHO 2009). The objective of this compendium is to provide a list of indicators for HRH systems strengthening practitioners interested in the M&E of HRH projects and programs. As with every M&E system, indicators should follow a framework guiding the dimensions and elements contributing to the desired outputs and outcomes. The United States Agency for International Development (USAID) and the World Health Organization (WHO) supported the Global Health Workforce Alliance to develop an HRH Action Framework (HAF) to better describe and measure the dimensions contributing to improved HRH (See Figure 1).
Figure 1: The HRH Action Framework
Human Resources for Health (HRH) Indicator Compendium 2
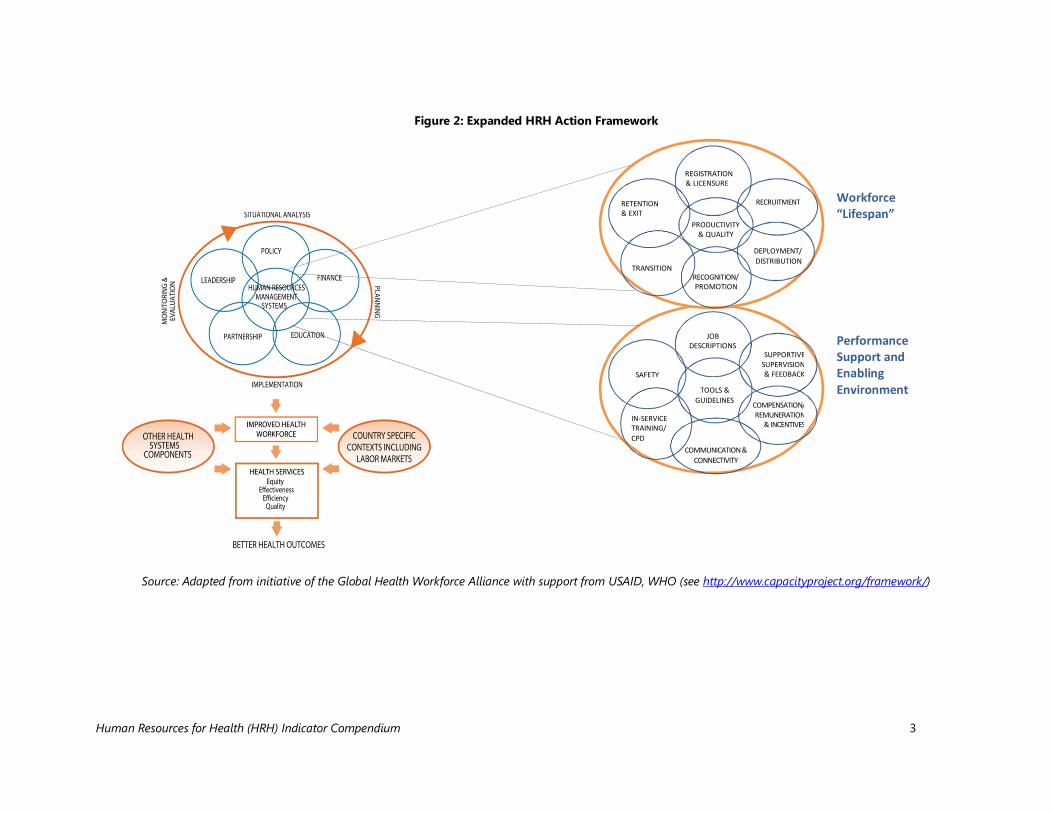
The HRH Action Framework lays out key elements of HRH at the “macro,” or country, level. There is interplay of leadership and partnerships, the status and outputs of the education sector, and the roles of finances and policies on the planning, production, distribution, and overall support of HRH, each linked with the existence of a human resources management system. These components benefit from a cycle of situation analysis and M&E that informs planning and implementation. The framework proposes that correct implementation of these dimensions will lead to an improved health workforce. However, given that the leap from these higher “macro” levels to both an improved health workforce and improved health services seems large, the addition of two intermediate dimensions from human resources management (HRM) is proposed here.1 As presented in Figure 2, these additional dimensions are a well-organized HRH “lifespan” and a “performance support and enabling environment.” The “lifespan” dimension (WHO 2006) includes the processes occurring from the registration and licensure of graduated students through their recruitment, deployment, and actions taken to promote them and improve their productivity, to their transition within the system or out of it, and to their eventual exit from the workforce (through retirement, migration, or death). The “performance support and enabling environment” dimension, on the other hand, includes those things that aid health workers in the completion of their day-to-day tasks, such as tools and guidelines for the job, trainings, and professional development activities. It also includes workplace conditions such as safety procedures, avenues for regular communication, compensation and incentives, and elements of supportive supervision. Both of these two additional dimensions invariably overlap and complement one another. This compendium thus presents indicators based on the expanded framework described above. The indicators relate to different dimensions of HRH inputs, processes, outputs, and outcomes and can be quantified and measured over a designated period of time. For economy of space, there are a limited number of indicators included in each area. While far more extensive lists of HRH indicators are available, some of these indicators do not meet criteria for data quality, such as accuracy, reliability, completeness, precision, timeliness, and integrity, (MEASURE Evaluation 2007) and thus are not included. Also added to the list are a few new, suggested indicators, either arising from a forthcoming HRH Effort Index,2 or postulated for relatively new areas of measurement. Additional indicators can also be found in Appendix 1: The basic basket of indicators of WHO’s “Human resources for health (HRH) tools and guidelines.”3
1 See key components of HR management in CapacityPlus’s Human Resources Management Assessment Approach: http://www.capacityplus.org/files/resources/hrm-assessment-approach.pdf. 2 The HRH Effort Index is an initiative of the CapacityPlus project to obtain indicators specific to seven dimensions of the HRH system: leadership and advocacy; policy and governance; finance; education and training; workforce lifespan; performance management; and M&E and information systems. See http://www.capacityplus.org/developing-hrh-effort-index-to-measure-country-level-status-in-hrh for more information. 3 Download appendix from http://www.who.int/hrh/tools/planning/en/.
Human Resources for Health (HRH) Indicator Compendium 3
Figure 2: Expanded HRH Action Framework
Source: Adapted from initiative of the Global Health Workforce Alliance with support from USAID, WHO (see http://www.capacityproject.org/framework/)
JOB DESCRIPTIONS
SUPPORTIVE SUPERVISION & FEEDBACK
COMPENSATION/ REMUNERATION
& INCENTIVES
COMMUNICATION & CONNECTIVITY
IN-SERVICE TRAINING/ CPD
SAFETY
TOOLS & GUIDELINES
Workforce “Lifespan”
Performance Support and Enabling Environment
RECRUITMENT
DEPLOYMENT/ DISTRIBUTION
RECOGNITION/ PROMOTION
TRANSITION
RETENTION & EXIT
REGNSURE
PRODUCTIVITY & QUALITY
REGISTRATION & LICENSURE
Human Resources for Health (HRH) Indicator Compendium 4
Data Source Limitations Many indicators require data sources that are currently not available in countries considered HRH “crisis” countries (WHO 2006) and where investments to strengthen HRH are being made. Examples include indicators based on data derived from population or facility surveys or functioning human resources information systems (HRIS). Lack of access to high-quality data represents a major barrier to the monitoring and evaluation of a wide range of health systems strengthening outputs and outcomes. This compendium is thus intended to serve as a user-friendly and practical resource for HRH practitioners, enabling them to select indicators that are appropriate and for which data can be obtained from reliable sources in each context. Thematic Gaps While measurements such as worker productivity and retention are more readily quantified, measurements pertaining to other context-specific areas such as management and partnership remain difficult to define and quantify. As a result, indicators for global leadership, HRH policy and planning, and workforce development are fewer and more qualitative than indicators for performance support. Document Structure This document presents indicators generally organized by the HAF and its expanded dimensions described above, followed by two appendices. The table of indicators provides, for each indicator, a name, description, method of calculation, and source of data, as well as notes or references. Appendix A provides information on the documents from which the indicators are drawn as well as additional reading resources. Appendix B provides examples of how different types of indicators, such as rates, indices, and ratios, are constructed.
Human Resources for Health (HRH) Indicator Compendium 5
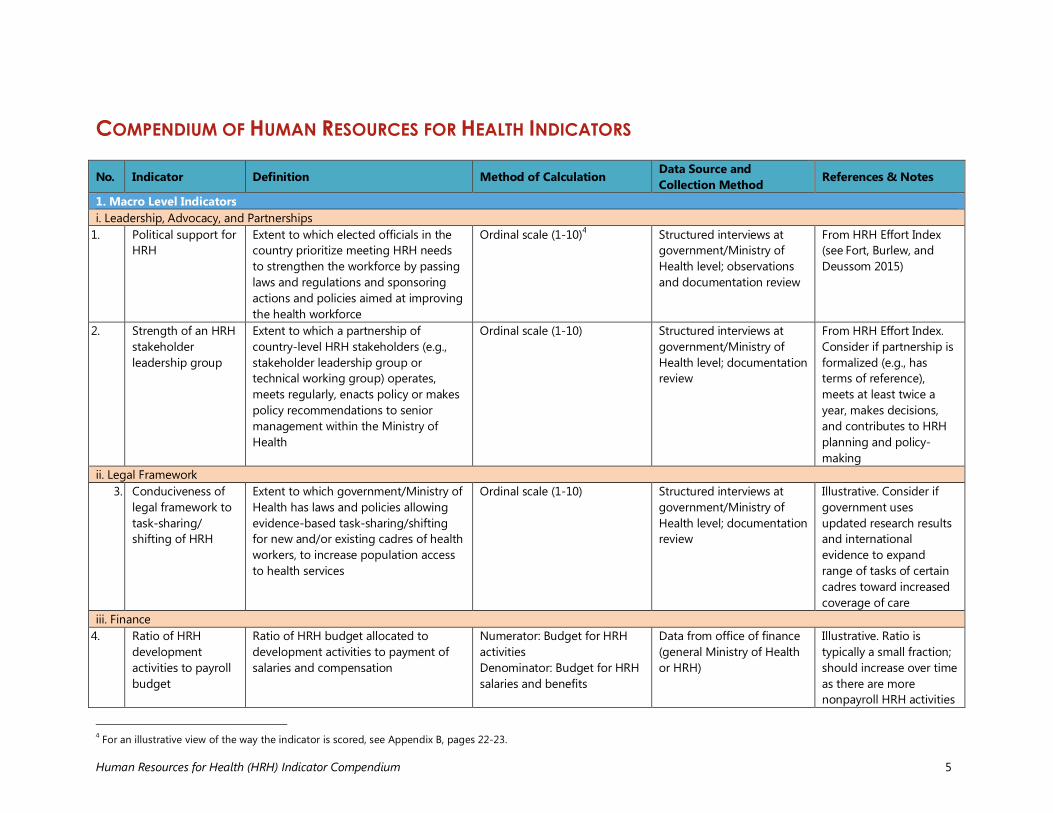
COMPENDIUM OF HUMAN RESOURCES FOR HEALTH INDICATORS
No. Indicator Definition Method of Calculation Data Source and Collection Method References & Notes
1. Macro Level Indicators i. Leadership, Advocacy, and Partnerships
1. Political support for HRH
Extent to which elected officials in the country prioritize meeting HRH needs to strengthen the workforce by passing laws and regulations and sponsoring actions and policies aimed at improving the health workforce
Ordinal scale (1-10)4 Structured interviews at government/Ministry of Health level; observations and documentation review
From HRH Effort Index (see Fort, Burlew, and Deussom 2015)
2. Strength of an HRH stakeholder leadership group
Extent to which a partnership of country-level HRH stakeholders (e.g., stakeholder leadership group or technical working group) operates, meets regularly, enacts policy or makes policy recommendations to senior management within the Ministry of Health
Ordinal scale (1-10) Structured interviews at government/Ministry of Health level; documentation review
From HRH Effort Index. Consider if partnership is formalized (e.g., has terms of reference), meets at least twice a year, makes decisions, and contributes to HRH planning and policy-making
ii. Legal Framework 3. Conduciveness of
legal framework to task-sharing/ shifting of HRH
Extent to which government/Ministry of Health has laws and policies allowing evidence-based task-sharing/shifting for new and/or existing cadres of health workers, to increase population access to health services
Ordinal scale (1-10) Structured interviews at government/Ministry of Health level; documentation review
Illustrative. Consider if government uses updated research results and international evidence to expand range of tasks of certain cadres toward increased coverage of care
iii. Finance 4. Ratio of HRH
development activities to payroll budget
Ratio of HRH budget allocated to development activities to payment of salaries and compensation
Numerator: Budget for HRH activities Denominator: Budget for HRH salaries and benefits
Data from office of finance (general Ministry of Health or HRH)
Illustrative. Ratio is typically a small fraction; should increase over time as there are more nonpayroll HRH activities
4 For an illustrative view of the way the indicator is scored, see Appendix B, pages 22-23.
Human Resources for Health (HRH) Indicator Compendium 6
No. Indicator Definition Method of Calculation Data Source and Collection Method References & Notes
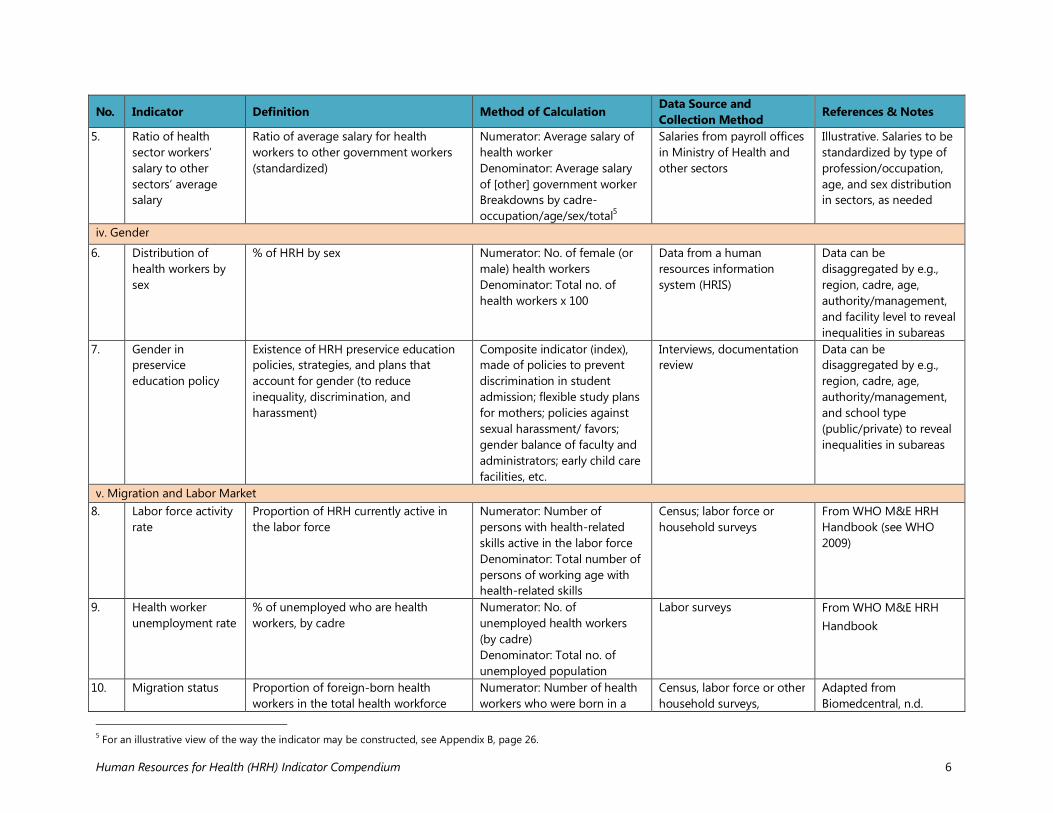
5. Ratio of health sector workers’ salary to other sectors’ average salary
Ratio of average salary for health workers to other government workers (standardized)
Numerator: Average salary of health worker Denominator: Average salary of [other] government worker Breakdowns by cadre-occupation/age/sex/total5
Salaries from payroll offices in Ministry of Health and other sectors
Illustrative. Salaries to be standardized by type of profession/occupation, age, and sex distribution in sectors, as needed
iv. Gender
6. Distribution of health workers by sex
% of HRH by sex Numerator: No. of female (or male) health workers Denominator: Total no. of health workers x 100
Data from a human resources information system (HRIS)
Data can be disaggregated by e.g., region, cadre, age, authority/management, and facility level to reveal inequalities in subareas
7. Gender in preservice education policy
Existence of HRH preservice education policies, strategies, and plans that account for gender (to reduce inequality, discrimination, and harassment)
Composite indicator (index), made of policies to prevent discrimination in student admission; flexible study plans for mothers; policies against sexual harassment/ favors; gender balance of faculty and administrators; early child care facilities, etc.
Interviews, documentation review
Data can be disaggregated by e.g., region, cadre, age, authority/management, and school type (public/private) to reveal inequalities in subareas
v. Migration and Labor Market 8. Labor force activity
rate Proportion of HRH currently active in the labor force
Numerator: Number of persons with health-related skills active in the labor force Denominator: Total number of persons of working age with health-related skills
Census; labor force or household surveys
From WHO M&E HRH Handbook (see WHO 2009)
9. Health worker unemployment rate
% of unemployed who are health workers, by cadre
Numerator: No. of unemployed health workers (by cadre) Denominator: Total no. of unemployed population
Labor surveys From WHO M&E HRH Handbook
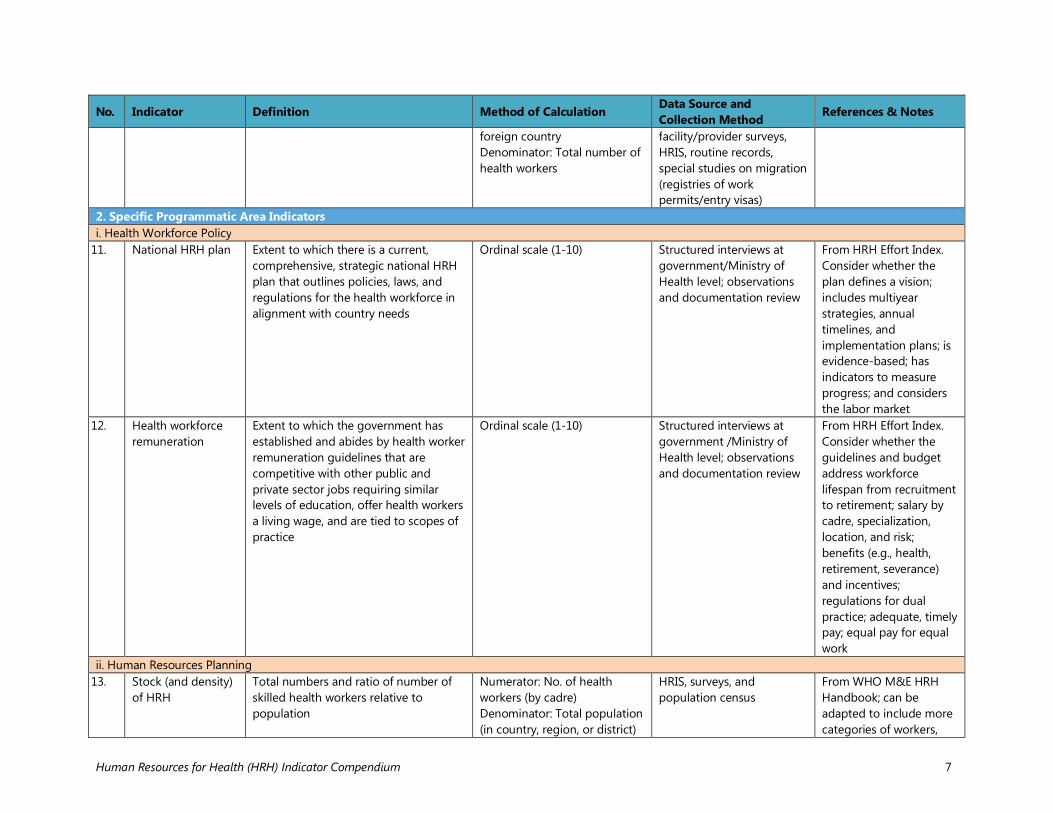
10. Migration status Proportion of foreign-born health workers in the total health workforce
Numerator: Number of health workers who were born in a
Census, labor force or other household surveys,
Adapted from Biomedcentral, n.d.
5 For an illustrative view of the way the indicator may be constructed, see Appendix B, page 26.
Human Resources for Health (HRH) Indicator Compendium 7
No. Indicator Definition Method of Calculation Data Source and Collection Method References & Notes
foreign country Denominator: Total number of health workers
facility/provider surveys, HRIS, routine records, special studies on migration (registries of work permits/entry visas)
2. Specific Programmatic Area Indicators i. Health Workforce Policy
11. National HRH plan
Extent to which there is a current, comprehensive, strategic national HRH plan that outlines policies, laws, and regulations for the health workforce in alignment with country needs
Ordinal scale (1-10) Structured interviews at government/Ministry of Health level; observations and documentation review
From HRH Effort Index. Consider whether the plan defines a vision; includes multiyear strategies, annual timelines, and implementation plans; is evidence-based; has indicators to measure progress; and considers the labor market
12. Health workforce remuneration
Extent to which the government has established and abides by health worker remuneration guidelines that are competitive with other public and private sector jobs requiring similar levels of education, offer health workers a living wage, and are tied to scopes of practice
Ordinal scale (1-10) Structured interviews at government /Ministry of Health level; observations and documentation review
From HRH Effort Index. Consider whether the guidelines and budget address workforce lifespan from recruitment to retirement; salary by cadre, specialization, location, and risk; benefits (e.g., health, retirement, severance) and incentives; regulations for dual practice; adequate, timely pay; equal pay for equal work
ii. Human Resources Planning 13. Stock (and density)
of HRH Total numbers and ratio of number of skilled health workers relative to population
Numerator: No. of health workers (by cadre) Denominator: Total population (in country, region, or district)
HRIS, surveys, and population census
From WHO M&E HRH Handbook; can be adapted to include more categories of workers,
Human Resources for Health (HRH) Indicator Compendium 8
No. Indicator Definition Method of Calculation Data Source and Collection Method References & Notes
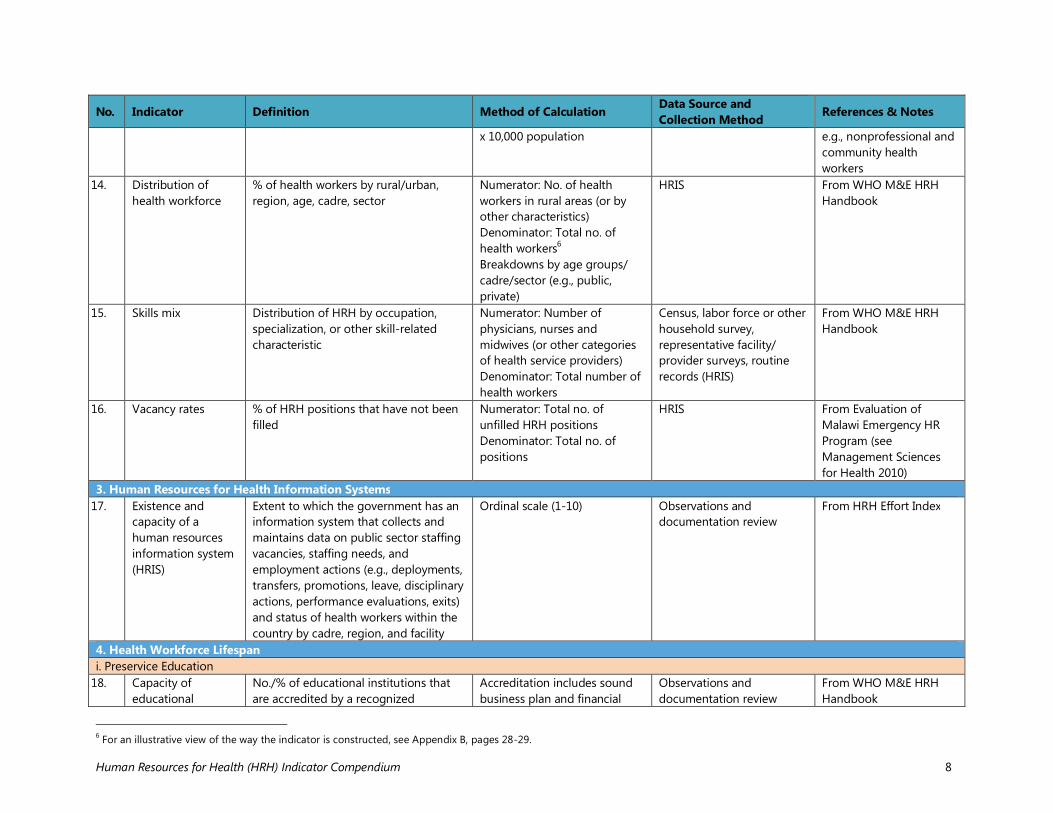
x 10,000 population e.g., nonprofessional and community health workers
14. Distribution of health workforce
% of health workers by rural/urban, region, age, cadre, sector
Numerator: No. of health workers in rural areas (or by other characteristics) Denominator: Total no. of health workers6 Breakdowns by age groups/ cadre/sector (e.g., public, private)
HRIS From WHO M&E HRH Handbook
15. Skills mix Distribution of HRH by occupation, specialization, or other skill-related characteristic
Numerator: Number of physicians, nurses and midwives (or other categories of health service providers) Denominator: Total number of health workers
Census, labor force or other household survey, representative facility/ provider surveys, routine records (HRIS)
From WHO M&E HRH Handbook
16. Vacancy rates % of HRH positions that have not been filled
Numerator: Total no. of unfilled HRH positions Denominator: Total no. of positions
HRIS From Evaluation of Malawi Emergency HR Program (see Management Sciences for Health 2010)
3. Human Resources for Health Information Systems 17. Existence and
capacity of a human resources information system (HRIS)
Extent to which the government has an information system that collects and maintains data on public sector staffing vacancies, staffing needs, and employment actions (e.g., deployments, transfers, promotions, leave, disciplinary actions, performance evaluations, exits) and status of health workers within the country by cadre, region, and facility
Ordinal scale (1-10) Observations and documentation review
From HRH Effort Index
4. Health Workforce Lifespan i. Preservice Education
18. Capacity of educational
No./% of educational institutions that are accredited by a recognized
Accreditation includes sound business plan and financial
Observations and documentation review
From WHO M&E HRH Handbook
6 For an illustrative view of the way the indicator is constructed, see Appendix B, pages 28-29.
Human Resources for Health (HRH) Indicator Compendium 9
No. Indicator Definition Method of Calculation Data Source and Collection Method References & Notes
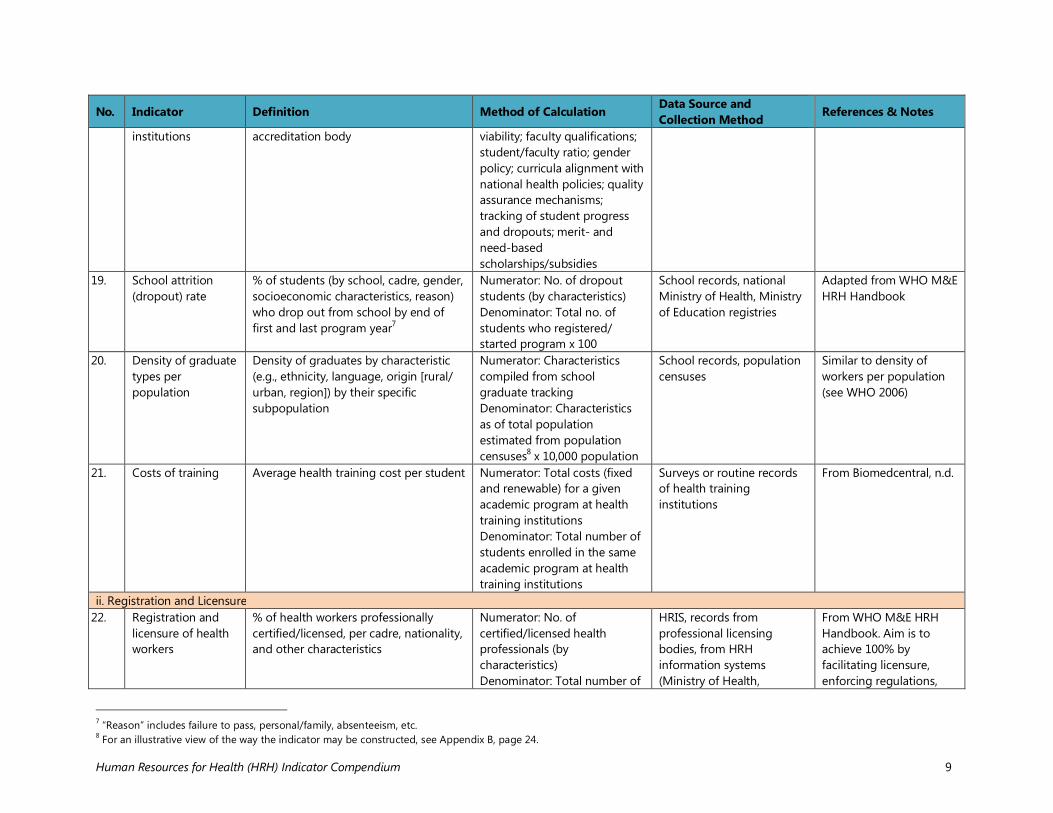
institutions accreditation body
viability; faculty qualifications; student/faculty ratio; gender policy; curricula alignment with national health policies; quality assurance mechanisms; tracking of student progress and dropouts; merit- and need-based scholarships/subsidies
19. School attrition (dropout) rate
% of students (by school, cadre, gender, socioeconomic characteristics, reason) who drop out from school by end of first and last program year7
Numerator: No. of dropout students (by characteristics) Denominator: Total no. of students who registered/ started program x 100
School records, national Ministry of Health, Ministry of Education registries
Adapted from WHO M&E HRH Handbook
20. Density of graduate types per population
Density of graduates by characteristic (e.g., ethnicity, language, origin [rural/ urban, region]) by their specific subpopulation
Numerator: Characteristics compiled from school graduate tracking Denominator: Characteristics as of total population estimated from population censuses8 x 10,000 population
School records, population censuses
Similar to density of workers per population (see WHO 2006)
21. Costs of training Average health training cost per student Numerator: Total costs (fixed and renewable) for a given academic program at health training institutions Denominator: Total number of students enrolled in the same academic program at health training institutions
Surveys or routine records of health training institutions
From Biomedcentral, n.d.
ii. Registration and Licensure 22. Registration and
licensure of health workers
% of health workers professionally certified/licensed, per cadre, nationality, and other characteristics
Numerator: No. of certified/licensed health professionals (by characteristics) Denominator: Total number of
HRIS, records from professional licensing bodies, from HRH information systems (Ministry of Health,
From WHO M&E HRH Handbook. Aim is to achieve 100% by facilitating licensure, enforcing regulations,
7 “Reason” includes failure to pass, personal/family, absenteeism, etc. 8 For an illustrative view of the way the indicator may be constructed, see Appendix B, page 24.
Human Resources for Health (HRH) Indicator Compendium 10
No. Indicator Definition Method of Calculation Data Source and Collection Method References & Notes
health workers private/NGOs/faith-based organizations)
and empowering communities (e.g., through access to worker licensure status)
iii. Recruitment 23. Effectiveness (and
transparency) of health workforce recruitment strategies
Extent to which health workforce recruitment strategies exist and are implemented to attract qualified graduates and professionals to fill vacant health worker positions (especially in rural, remote, and underserved areas) and utilize standard and transparent practices including equal opportunity
Ordinal scale (1-10) Special interviews (with applicants and recently employed workers), document review
From HRH Effort Index. Consider whether the strategies are standardized (e.g., are advertised publicly, are based on job descriptions, are merit-based with clear selection criteria, are not politically influenced); prioritize nondiscrimination; are efficient; and use evidence-based strategies such as a rural pipeline policy.
iv. Retention and Exit 24. Workforce loss ratio
(turnover rate) Ratio of exits from health workforce (by e.g., cadre, region, gender, reason for leaving) to active workforce. As per WHO M&E HRH handbook, exit reasons could include education, family care/emergency, out-migration, retirement, disability, death
Numerator: No. of health workers who left active labor force in the last year (by characteristics) Denominator: Total no. of active health workers
HRIS From WHO M&E HRH Handbook. Should be kept low. Could have benchmarks or thresholds over which a red flag would be raised. Can be used to gauge discontent of work by special cadres or in specific work environments (e.g., rural areas)
v. Productivity and Quality 25. HRH
unemployment rate Proportion of HRH currently unemployed (over a given period)
Numerator: No. of persons with health-related skills currently unemployed Denominator: Total no. of
Censuses and surveys (labor market surveys or national health accounts surveys)
From WHO M&E HRH Handbook.
Human Resources for Health (HRH) Indicator Compendium 11
No. Indicator Definition Method of Calculation Data Source and Collection Method References & Notes
persons with health-related skills x 100
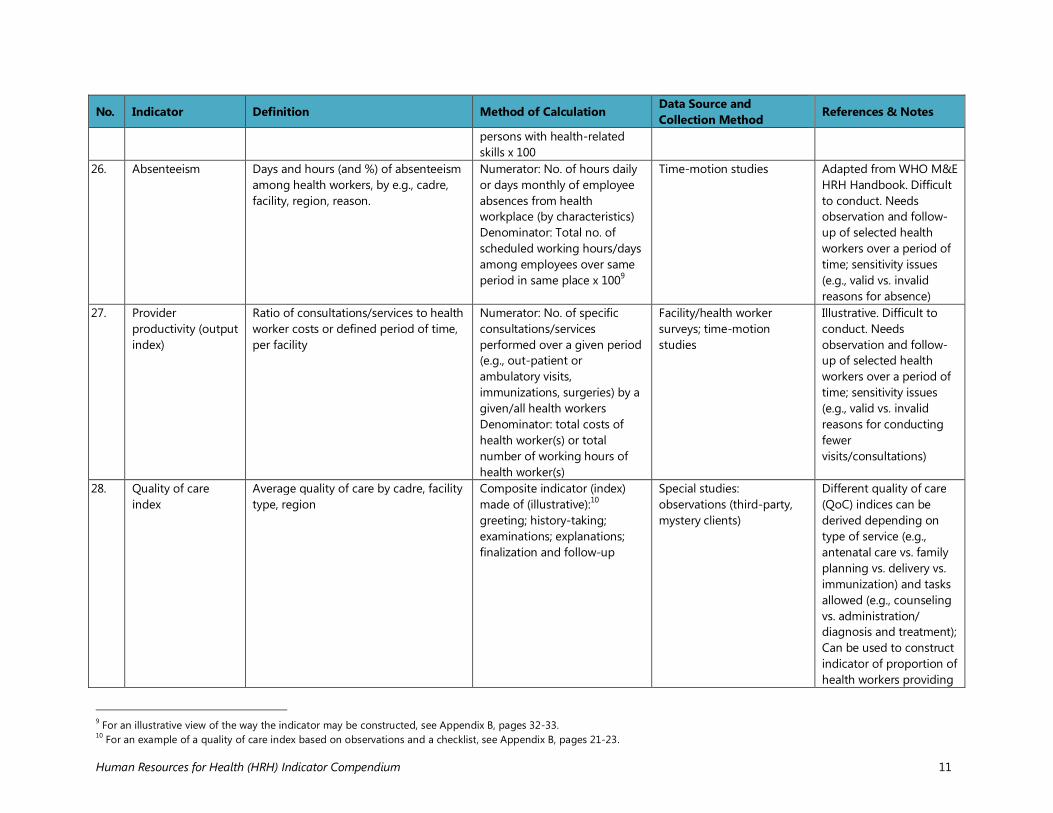
26. Absenteeism Days and hours (and %) of absenteeism among health workers, by e.g., cadre, facility, region, reason.
Numerator: No. of hours daily or days monthly of employee absences from health workplace (by characteristics) Denominator: Total no. of scheduled working hours/days among employees over same period in same place x 1009
Time-motion studies Adapted from WHO M&E HRH Handbook. Difficult to conduct. Needs observation and follow-up of selected health workers over a period of time; sensitivity issues (e.g., valid vs. invalid reasons for absence)
27. Provider productivity (output index)
Ratio of consultations/services to health worker costs or defined period of time, per facility
Numerator: No. of specific consultations/services performed over a given period (e.g., out-patient or ambulatory visits, immunizations, surgeries) by a given/all health workers Denominator: total costs of health worker(s) or total number of working hours of health worker(s)
Facility/health worker surveys; time-motion studies
Illustrative. Difficult to conduct. Needs observation and follow-up of selected health workers over a period of time; sensitivity issues (e.g., valid vs. invalid reasons for conducting fewer visits/consultations)
28. Quality of care index
Average quality of care by cadre, facility type, region
Composite indicator (index) made of (illustrative):10 greeting; history-taking; examinations; explanations; finalization and follow-up
Special studies: observations (third-party, mystery clients)
Different quality of care (QoC) indices can be derived depending on type of service (e.g., antenatal care vs. family planning vs. delivery vs. immunization) and tasks allowed (e.g., counseling vs. administration/ diagnosis and treatment); Can be used to construct indicator of proportion of health workers providing
9 For an illustrative view of the way the indicator may be constructed, see Appendix B, pages 32-33. 10 For an example of a quality of care index based on observations and a checklist, see Appendix B, pages 21-23.
Human Resources for Health (HRH) Indicator Compendium 12
No. Indicator Definition Method of Calculation Data Source and Collection Method References & Notes
QoC services vi. Recognition and Promotion
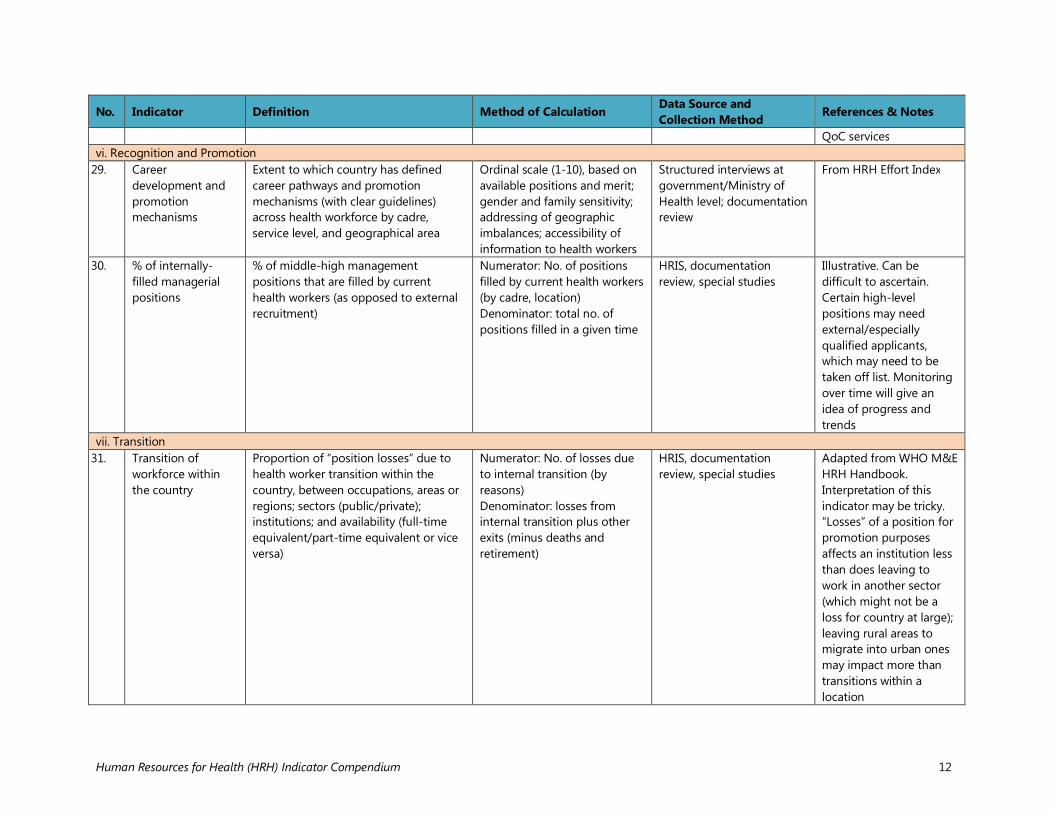
29. Career development and promotion mechanisms
Extent to which country has defined career pathways and promotion mechanisms (with clear guidelines) across health workforce by cadre, service level, and geographical area
Ordinal scale (1-10), based on available positions and merit; gender and family sensitivity; addressing of geographic imbalances; accessibility of information to health workers
Structured interviews at government/Ministry of Health level; documentation review
From HRH Effort Index
30. % of internally-filled managerial positions
% of middle-high management positions that are filled by current health workers (as opposed to external recruitment)
Numerator: No. of positions filled by current health workers (by cadre, location) Denominator: total no. of positions filled in a given time
HRIS, documentation review, special studies
Illustrative. Can be difficult to ascertain. Certain high-level positions may need external/especially qualified applicants, which may need to be taken off list. Monitoring over time will give an idea of progress and trends
vii. Transition 31. Transition of
workforce within the country
Proportion of “position losses” due to health worker transition within the country, between occupations, areas or regions; sectors (public/private); institutions; and availability (full-time equivalent/part-time equivalent or vice versa)
Numerator: No. of losses due to internal transition (by reasons) Denominator: losses from internal transition plus other exits (minus deaths and retirement)
HRIS, documentation review, special studies
Adapted from WHO M&E HRH Handbook. Interpretation of this indicator may be tricky. “Losses” of a position for promotion purposes affects an institution less than does leaving to work in another sector (which might not be a loss for country at large); leaving rural areas to migrate into urban ones may impact more than transitions within a location
Human Resources for Health (HRH) Indicator Compendium 13
No. Indicator Definition Method of Calculation Data Source and Collection Method References & Notes
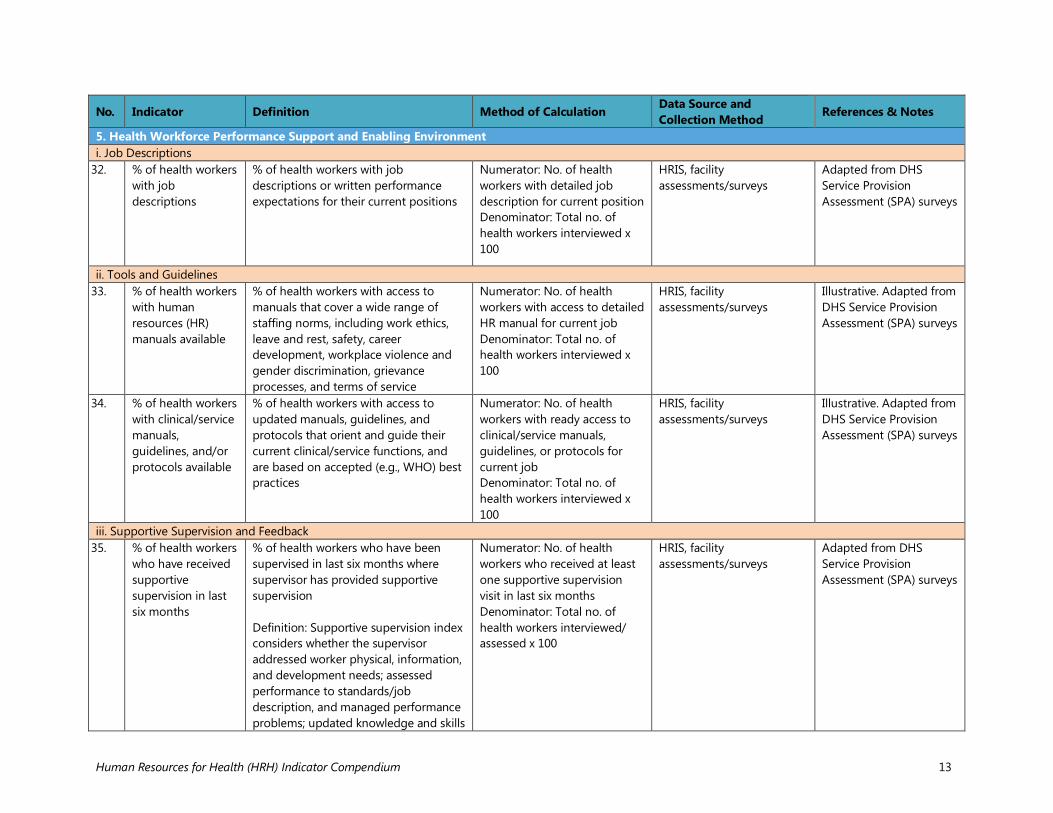
5. Health Workforce Performance Support and Enabling Environment i. Job Descriptions
32. % of health workers with job descriptions
% of health workers with job descriptions or written performance expectations for their current positions
Numerator: No. of health workers with detailed job description for current position Denominator: Total no. of health workers interviewed x 100
HRIS, facility assessments/surveys
Adapted from DHS Service Provision Assessment (SPA) surveys
ii. Tools and Guidelines 33. % of health workers
with human resources (HR) manuals available
% of health workers with access to manuals that cover a wide range of staffing norms, including work ethics, leave and rest, safety, career development, workplace violence and gender discrimination, grievance processes, and terms of service
Numerator: No. of health workers with access to detailed HR manual for current job Denominator: Total no. of health workers interviewed x 100
HRIS, facility assessments/surveys
Illustrative. Adapted from DHS Service Provision Assessment (SPA) surveys
34. % of health workers with clinical/service manuals, guidelines, and/or protocols available
% of health workers with access to updated manuals, guidelines, and protocols that orient and guide their current clinical/service functions, and are based on accepted (e.g., WHO) best practices
Numerator: No. of health workers with ready access to clinical/service manuals, guidelines, or protocols for current job Denominator: Total no. of health workers interviewed x 100
HRIS, facility assessments/surveys
Illustrative. Adapted from DHS Service Provision Assessment (SPA) surveys
iii. Supportive Supervision and Feedback 35. % of health workers
who have received supportive supervision in last six months
% of health workers who have been supervised in last six months where supervisor has provided supportive supervision Definition: Supportive supervision index considers whether the supervisor addressed worker physical, information, and development needs; assessed performance to standards/job description, and managed performance problems; updated knowledge and skills
Numerator: No. of health workers who received at least one supportive supervision visit in last six months Denominator: Total no. of health workers interviewed/ assessed x 100
HRIS, facility assessments/surveys
Adapted from DHS Service Provision Assessment (SPA) surveys
Human Resources for Health (HRH) Indicator Compendium 14
No. Indicator Definition Method of Calculation Data Source and Collection Method References & Notes
as needed; provided constructive feedback
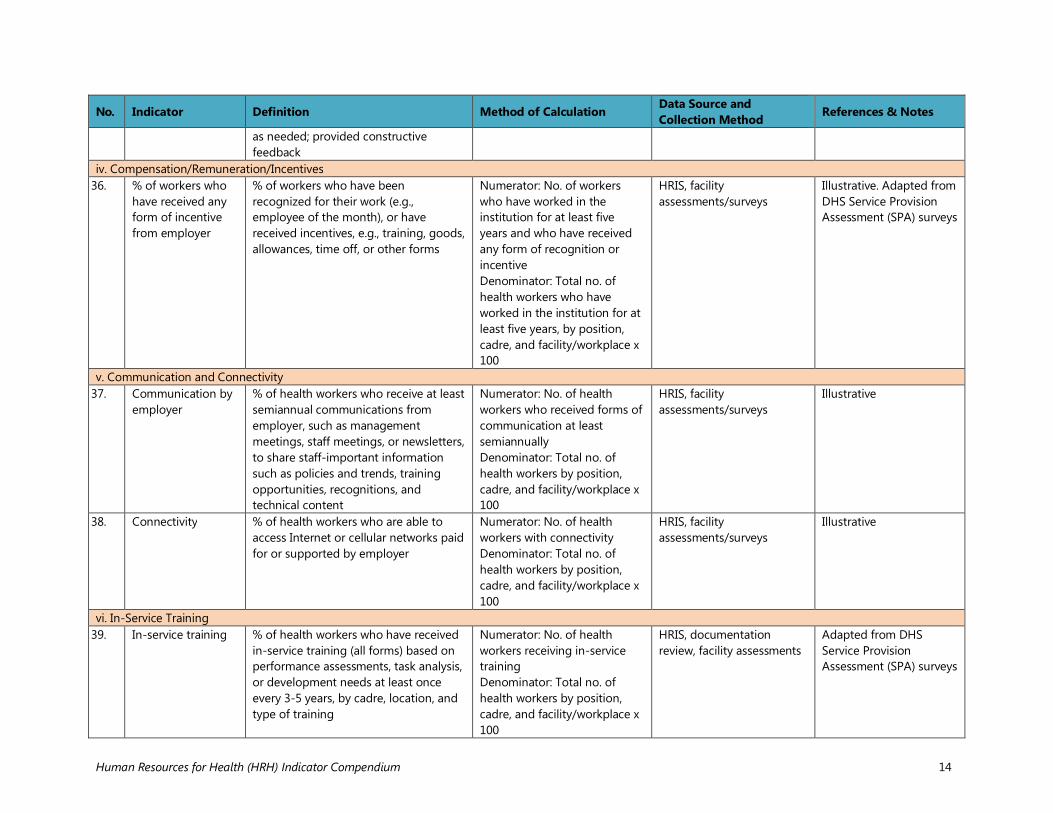
iv. Compensation/Remuneration/Incentives 36. % of workers who
have received any form of incentive from employer
% of workers who have been recognized for their work (e.g., employee of the month), or have received incentives, e.g., training, goods, allowances, time off, or other forms
Numerator: No. of workers who have worked in the institution for at least five years and who have received any form of recognition or incentive Denominator: Total no. of health workers who have worked in the institution for at least five years, by position, cadre, and facility/workplace x 100
HRIS, facility assessments/surveys
Illustrative. Adapted from DHS Service Provision Assessment (SPA) surveys
v. Communication and Connectivity 37. Communication by
employer % of health workers who receive at least semiannual communications from employer, such as management meetings, staff meetings, or newsletters, to share staff-important information such as policies and trends, training opportunities, recognitions, and technical content
Numerator: No. of health workers who received forms of communication at least semiannually Denominator: Total no. of health workers by position, cadre, and facility/workplace x 100
HRIS, facility assessments/surveys
Illustrative
38. Connectivity % of health workers who are able to access Internet or cellular networks paid for or supported by employer
Numerator: No. of health workers with connectivity Denominator: Total no. of health workers by position, cadre, and facility/workplace x 100
HRIS, facility assessments/surveys
Illustrative
vi. In-Service Training 39. In-service training % of health workers who have received
in-service training (all forms) based on performance assessments, task analysis, or development needs at least once every 3-5 years, by cadre, location, and type of training
Numerator: No. of health workers receiving in-service training Denominator: Total no. of health workers by position, cadre, and facility/workplace x 100
HRIS, documentation review, facility assessments
Adapted from DHS Service Provision Assessment (SPA) surveys
Human Resources for Health (HRH) Indicator Compendium 15
No. Indicator Definition Method of Calculation Data Source and Collection Method References & Notes
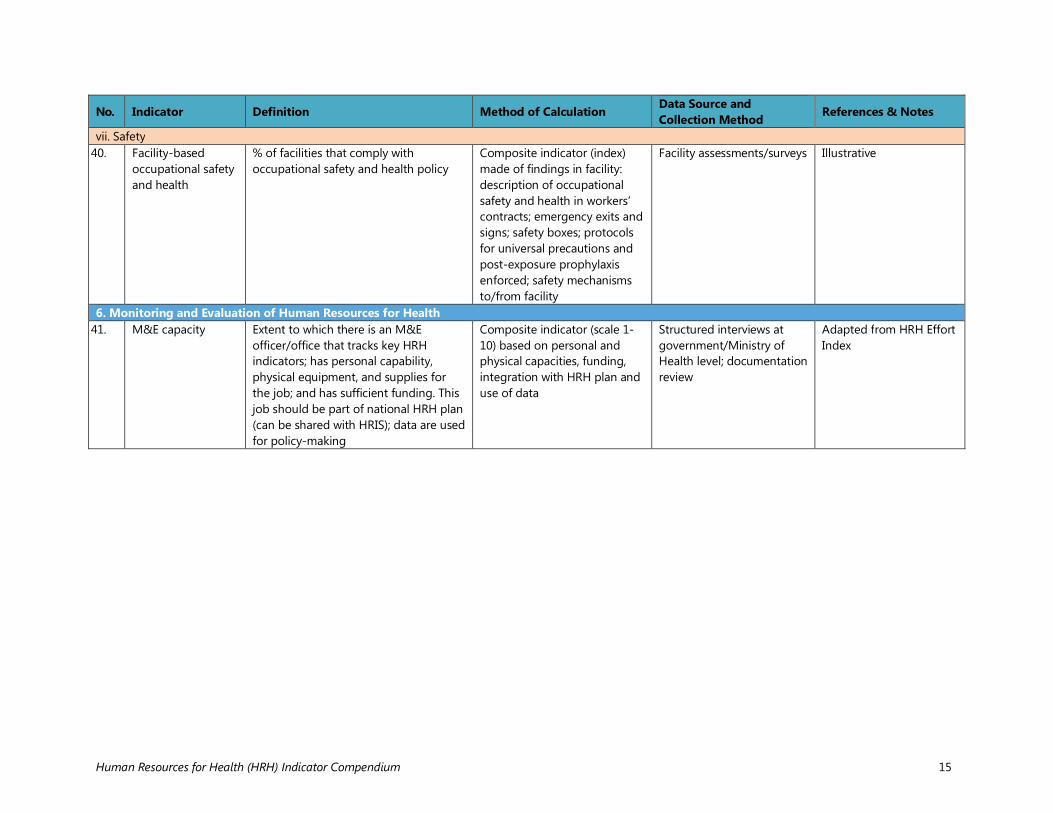
vii. Safety 40. Facility-based
occupational safety and health
% of facilities that comply with occupational safety and health policy
Composite indicator (index) made of findings in facility: description of occupational safety and health in workers’ contracts; emergency exits and signs; safety boxes; protocols for universal precautions and post-exposure prophylaxis enforced; safety mechanisms to/from facility
Facility assessments/surveys
Illustrative
6. Monitoring and Evaluation of Human Resources for Health 41. M&E capacity Extent to which there is an M&E
officer/office that tracks key HRH indicators; has personal capability, physical equipment, and supplies for the job; and has sufficient funding. This job should be part of national HRH plan (can be shared with HRIS); data are used for policy-making
Composite indicator (scale 1-10) based on personal and physical capacities, funding, integration with HRH plan and use of data
Structured interviews at government/Ministry of Health level; documentation review
Adapted from HRH Effort Index
Human Resources for Health (HRH) Indicator Compendium 16
REFERENCES Biomedcentral. Key indicators for monitoring and evaluation of HRH. http://www.biomedcentral.com/content/supplementary/1478-4491-1-3-S1.pdf (accessed August 3, 2015). Fort, Alfredo L., Randi Burlew, and Rachel Deussom. 2015. Developing a human resources for health (HRH) effort index to measure country-level status in HRH. Presented at Prince Mahidol Award Conference, Bangkok, Thailand. http://www.capacityplus.org/files/resources/developing-hrh-effort-index-to-measure-country-level-status-in-hrh.pdf (accessed August 3, 2015). Global Health Workforce Alliance, USAID, World Health Organization. n.d. HRH action framework. http://www.capacityproject.org/framework/ (accessed August 3, 2015). Management Sciences for Health. 2010. Evaluation of Malawi’s emergency human resources programme. EHRP final report. Cambridge, MA: Management Sciences for Health. https://www.k4health.org/sites/default/files/Evaluation-of-Malawi-Emergency-Human-Resources-Programme.pdf (accessed August 3, 2015). MEASURE Evaluation. 2012. Service Provision Assessment Questionnaires. http://dhsprogram.com/publications/publication-search.cfm?type=37 (accessed July 2, 2015). MEASURE Evaluation. 2007. Data quality assurance tool for program-level indicators. http://www.cpc.unc.edu/measure/publications/pdf/ms-07-19.pdf (accessed August 3, 2015). Ruwoldt, Paul and Philip Hassett. 2007. Zanzibar Health Care Worker Productivity Study: Preliminary Study Findings. CapacityProject. http://www.intrahealth.org/files/media/zanzibar-health-care-worker-productivity-study-preliminary-study-findings/zanzibar_productivity_study.pdf (accessed August 3, 2015). World Health Organization. 2009. Handbook on monitoring and evaluation of human resources for health with special applications for low- and middle-income countries. Geneva, Switzerland: World Health Organization. http://whqlibdoc.who.int/publications/2009/9789241547703_eng.pdf?ua=1 (accessed August 3, 2015). World Health Organization. 2006. World health report: Working together for health. Geneva, Switzerland: World Health Organization. http://www.who.int/whr/2006/en/ (accessed August 3, 2015). World Health Organization. Human Resources for Health (HRH) tools and guidelines. Appendix 1: The basic basket of indicators. http://www.who.int/hrh/tools/planning/en/ (accessed August 3, 2015).
Human Resources for Health (HRH) Indicator Compendium 17
APPENDIX A: ADDITIONAL RESOURCES Adano, Ummuro, Jim McCaffery, Paul Ruwoldt, and Barbara Stilwell. 2008. Human resources for health: Tackling the human resource management piece of the puzzle. Capacity Project Technical Brief No. 14. Chapel Hill, NC: Capacity Project/IntraHealth International. http://www.capacityplus.org/files/resources/projectTechBrief_14.pdf (accessed August 3, 2015). Araújo, Edson. 2014. Moving forward with the health labor market agenda. Presented at Supporting Country-Led Efforts to Recruit and Retain Health Workers and Improve Their Productivity, Washington, DC. http://www.capacityplus.org/files/resources/moving-forward-health-labor-market-agenda.pdf (accessed August 3, 2015). Bertrand, J. and G. Escudero. 2002. Compendium of indicators for evaluating reproductive health programs. MEASURE Evaluation Population and Reproductive Health (PRH). http://www.cpc.unc.edu/measure/publications/ms-02-06 (accessed August 3, 2015). Frankel, Nina, and Judith Winkler. 2009. Human resources for health (HRH) basics. Global Health eLearning Center. http://www.globalhealthlearning.org/course/human-resources-health-hrh-basics (accessed August 3, 2015). Melde, Susanne. 2012. Indicators of the impact of migration on human development and vice versa. ACP Observatory on Migration. http://www.ossrea.net/publications/images/acp/indicators-of-the-migration-on-human-dvpt-and-vice-versa.pdf (accessed August 3, 2015). Pacqué-Margolis, Sara, Crystal Ng, and Sylvia Kauffman. 2011. Human Resources for Health (HRH) Indicator Compendium. Washington, DC: CapacityPlus/IntraHealth International. http://www.capacityplus.org/hrhic (accessed August 3, 2015). Pacqué-Margolis, Sara, Crystal Ng, Rebecca Rhodes, and Beth Massie. 2012. An introduction to monitoring and evaluation of human resources for health. Washington, DC: CapacityPlus/IntraHealth International. http://www.capacityplus.org/introduction-monitoring-evaluation-human-resources-for-health (accessed August 3, 2015). Pan American Health Organization. 2011. Handbook for measurement and monitoring indicators of the regional goals for human resources for health: A shared commitment. Washington, DC: PAHO. http://www.paho.org/hq/index.php?option=com_content&view=article&id=5696%3Amanual-medicion-monitoreo-indicadores-metas-regionales-recursos-humanos-salud-un-compromiso-compartido&catid=526%3Ahss-03-human-resources-health&Itemid=2095&lang=en (accessed August 3, 2015). Settle, Dykki, Michael Webba Lwetabe, Amanda Puckett, and Carl Leitner. 2014. Establishing and using data standards in health workforce information systems. CapacityPlus Technical Brief no.
Human Resources for Health (HRH) Indicator Compendium 18
13. Washington, DC: CapacityPlus/IntraHealth International. http://www.capacityplus.org/files/resources/establishing-using-data-standards-health-workforce-information-systems.pdf (accessed August 3, 2015). Thatte, Nandita, and Yoonjoung Choi. 2015. “Does human resource management improve family planning service quality? Analysis from the Kenya Service Provision Assessment 2010.” Health Policy and Planning. 30, no. 3: 356-367. World Health Organization. 2010. Monitoring the building blocks of health systems: A handbook of indicators and their measurement strategies. Geneva, Switzerland: World Health Organization. http://www.who.int/healthinfo/systems/WHO_MBHSS_2010_full_web.pdf?ua=1 (accessed August 3, 2015).
Human Resources for Health (HRH) Indicator Compendium 19
APPENDIX B: MEASUREMENT TOOLS ILLUSTRATIVE DESCRIPTIONS AND CONSTRUCTION OF INDICATORS BY TYPE
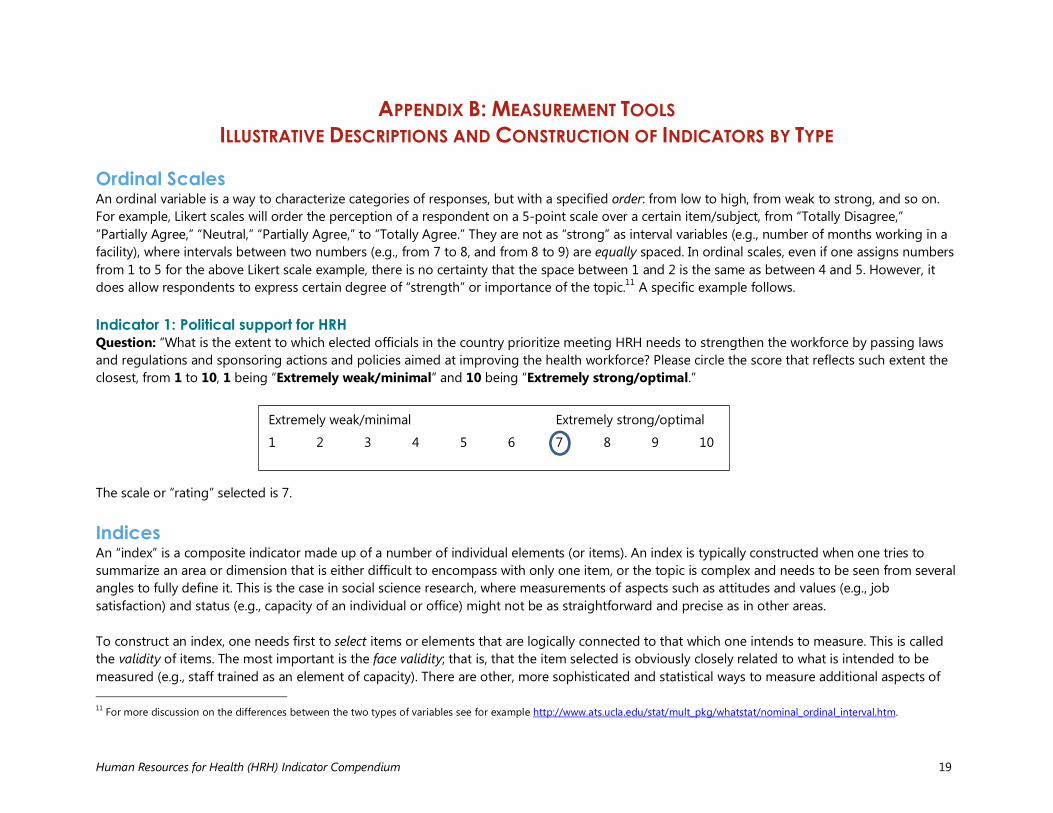
Ordinal Scales An ordinal variable is a way to characterize categories of responses, but with a specified order: from low to high, from weak to strong, and so on. For example, Likert scales will order the perception of a respondent on a 5-point scale over a certain item/subject, from “Totally Disagree,” “Partially Agree,” “Neutral,” “Partially Agree,” to “Totally Agree.” They are not as “strong” as interval variables (e.g., number of months working in a facility), where intervals between two numbers (e.g., from 7 to 8, and from 8 to 9) are equally spaced. In ordinal scales, even if one assigns numbers from 1 to 5 for the above Likert scale example, there is no certainty that the space between 1 and 2 is the same as between 4 and 5. However, it does allow respondents to express certain degree of “strength” or importance of the topic.11 A specific example follows. Indicator 1: Political support for HRH Question: “What is the extent to which elected officials in the country prioritize meeting HRH needs to strengthen the workforce by passing laws and regulations and sponsoring actions and policies aimed at improving the health workforce? Please circle the score that reflects such extent the closest, from 1 to 10, 1 being “Extremely weak/minimal” and 10 being “Extremely strong/optimal.” The scale or “rating” selected is 7. Indices An “index” is a composite indicator made up of a number of individual elements (or items). An index is typically constructed when one tries to summarize an area or dimension that is either difficult to encompass with only one item, or the topic is complex and needs to be seen from several angles to fully define it. This is the case in social science research, where measurements of aspects such as attitudes and values (e.g., job satisfaction) and status (e.g., capacity of an individual or office) might not be as straightforward and precise as in other areas. To construct an index, one needs first to select items or elements that are logically connected to that which one intends to measure. This is called the validity of items. The most important is the face validity; that is, that the item selected is obviously closely related to what is intended to be measured (e.g., staff trained as an element of capacity). There are other, more sophisticated and statistical ways to measure additional aspects of 11 For more discussion on the differences between the two types of variables see for example http://www.ats.ucla.edu/stat/mult_pkg/whatstat/nominal_ordinal_interval.htm.
Extremely weak/minimal Extremely strong/optimal
1 2 3 4 5 6 7 8 9 10
Human Resources for Health (HRH) Indicator Compendium 20
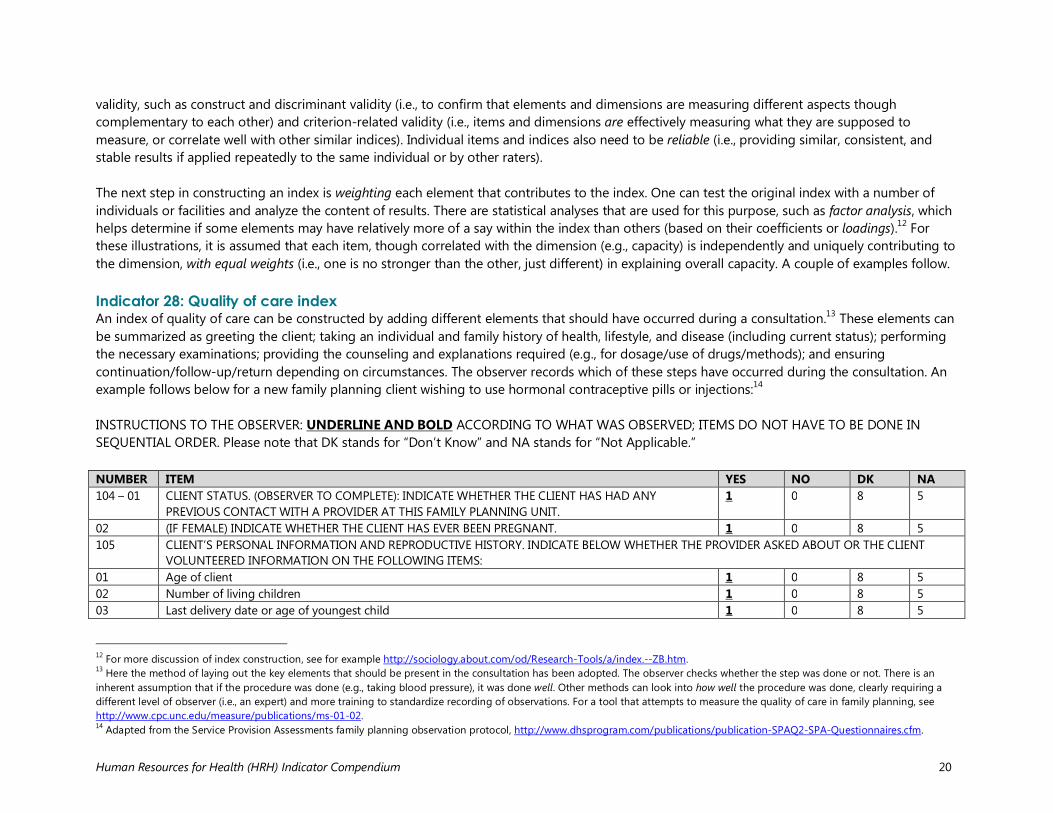
validity, such as construct and discriminant validity (i.e., to confirm that elements and dimensions are measuring different aspects though complementary to each other) and criterion-related validity (i.e., items and dimensions are effectively measuring what they are supposed to measure, or correlate well with other similar indices). Individual items and indices also need to be reliable (i.e., providing similar, consistent, and stable results if applied repeatedly to the same individual or by other raters). The next step in constructing an index is weighting each element that contributes to the index. One can test the original index with a number of individuals or facilities and analyze the content of results. There are statistical analyses that are used for this purpose, such as factor analysis, which helps determine if some elements may have relatively more of a say within the index than others (based on their coefficients or loadings).12 For these illustrations, it is assumed that each item, though correlated with the dimension (e.g., capacity) is independently and uniquely contributing to the dimension, with equal weights (i.e., one is no stronger than the other, just different) in explaining overall capacity. A couple of examples follow. Indicator 28: Quality of care index An index of quality of care can be constructed by adding different elements that should have occurred during a consultation.13 These elements can be summarized as greeting the client; taking an individual and family history of health, lifestyle, and disease (including current status); performing the necessary examinations; providing the counseling and explanations required (e.g., for dosage/use of drugs/methods); and ensuring continuation/follow-up/return depending on circumstances. The observer records which of these steps have occurred during the consultation. An example follows below for a new family planning client wishing to use hormonal contraceptive pills or injections:14 INSTRUCTIONS TO THE OBSERVER: UNDERLINE AND BOLD ACCORDING TO WHAT WAS OBSERVED; ITEMS DO NOT HAVE TO BE DONE IN SEQUENTIAL ORDER. Please note that DK stands for “Don’t Know” and NA stands for “Not Applicable.” NUMBER ITEM YES NO DK NA 104 – 01 CLIENT STATUS. (OBSERVER TO COMPLETE): INDICATE WHETHER THE CLIENT HAS HAD ANY
PREVIOUS CONTACT WITH A PROVIDER AT THIS FAMILY PLANNING UNIT. 1 0 8 5
02 (IF FEMALE) INDICATE WHETHER THE CLIENT HAS EVER BEEN PREGNANT. 1 0 8 5 105 CLIENT’S PERSONAL INFORMATION AND REPRODUCTIVE HISTORY. INDICATE BELOW WHETHER THE PROVIDER ASKED ABOUT OR THE CLIENT
VOLUNTEERED INFORMATION ON THE FOLLOWING ITEMS: 01 Age of client 1 0 8 5 02 Number of living children 1 0 8 5 03 Last delivery date or age of youngest child 1 0 8 5
12 For more discussion of index construction, see for example http://sociology.about.com/od/Research-Tools/a/index.--ZB.htm. 13 Here the method of laying out the key elements that should be present in the consultation has been adopted. The observer checks whether the step was done or not. There is an inherent assumption that if the procedure was done (e.g., taking blood pressure), it was done well. Other methods can look into how well the procedure was done, clearly requiring a different level of observer (i.e., an expert) and more training to standardize recording of observations. For a tool that attempts to measure the quality of care in family planning, see http://www.cpc.unc.edu/measure/publications/ms-01-02. 14 Adapted from the Service Provision Assessments family planning observation protocol, http://www.dhsprogram.com/publications/publication-SPAQ2-SPA-Questionnaires.cfm.
Human Resources for Health (HRH) Indicator Compendium 21
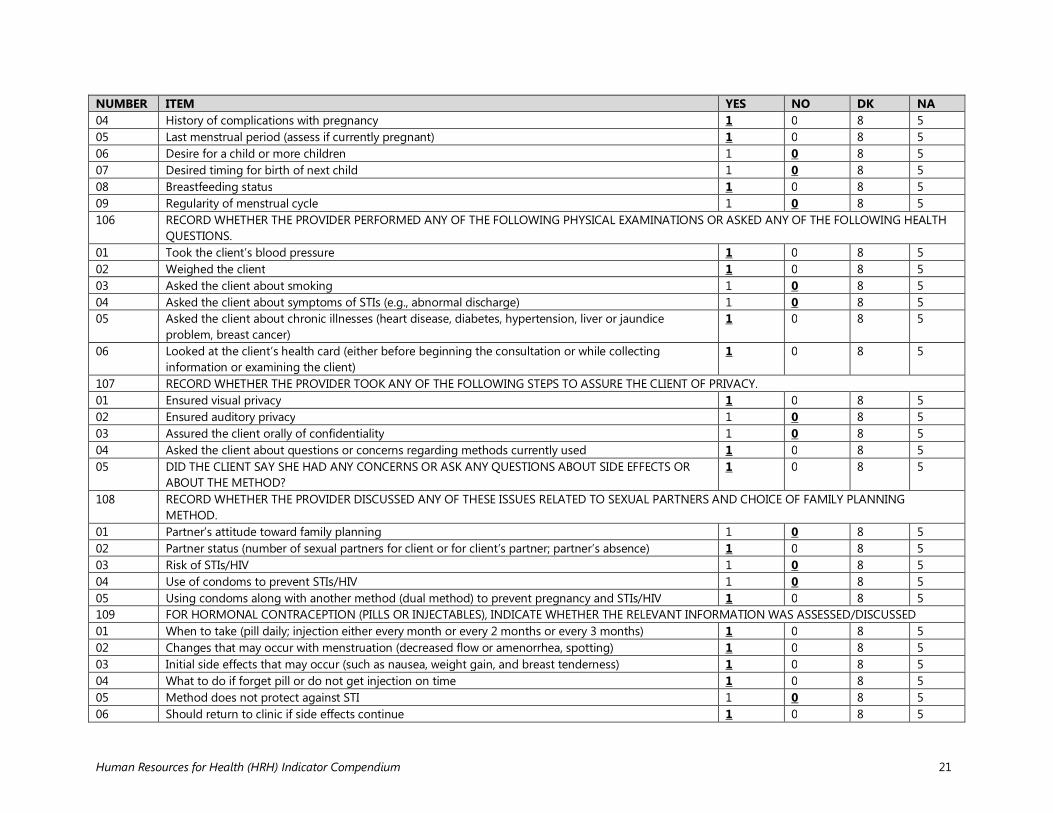
NUMBER ITEM YES NO DK NA 04 History of complications with pregnancy 1 0 8 5 05 Last menstrual period (assess if currently pregnant) 1 0 8 5 06 Desire for a child or more children 1 0 8 5 07 Desired timing for birth of next child 1 0 8 5 08 Breastfeeding status 1 0 8 5 09 Regularity of menstrual cycle 1 0 8 5 106 RECORD WHETHER THE PROVIDER PERFORMED ANY OF THE FOLLOWING PHYSICAL EXAMINATIONS OR ASKED ANY OF THE FOLLOWING HEALTH
QUESTIONS. 01 Took the client’s blood pressure 1 0 8 5 02 Weighed the client 1 0 8 5 03 Asked the client about smoking 1 0 8 5 04 Asked the client about symptoms of STIs (e.g., abnormal discharge) 1 0 8 5 05 Asked the client about chronic illnesses (heart disease, diabetes, hypertension, liver or jaundice
problem, breast cancer) 1 0 8 5
06 Looked at the client’s health card (either before beginning the consultation or while collecting information or examining the client)
1 0 8 5
107 RECORD WHETHER THE PROVIDER TOOK ANY OF THE FOLLOWING STEPS TO ASSURE THE CLIENT OF PRIVACY. 01 Ensured visual privacy 1 0 8 5 02 Ensured auditory privacy 1 0 8 5 03 Assured the client orally of confidentiality 1 0 8 5 04 Asked the client about questions or concerns regarding methods currently used 1 0 8 5 05 DID THE CLIENT SAY SHE HAD ANY CONCERNS OR ASK ANY QUESTIONS ABOUT SIDE EFFECTS OR
ABOUT THE METHOD? 1 0 8 5
108 RECORD WHETHER THE PROVIDER DISCUSSED ANY OF THESE ISSUES RELATED TO SEXUAL PARTNERS AND CHOICE OF FAMILY PLANNING METHOD.
01 Partner’s attitude toward family planning 1 0 8 5 02 Partner status (number of sexual partners for client or for client’s partner; partner’s absence) 1 0 8 5 03 Risk of STIs/HIV 1 0 8 5 04 Use of condoms to prevent STIs/HIV 1 0 8 5 05 Using condoms along with another method (dual method) to prevent pregnancy and STIs/HIV 1 0 8 5 109 FOR HORMONAL CONTRACEPTION (PILLS OR INJECTABLES), INDICATE WHETHER THE RELEVANT INFORMATION WAS ASSESSED/DISCUSSED 01 When to take (pill daily; injection either every month or every 2 months or every 3 months) 1 0 8 5 02 Changes that may occur with menstruation (decreased flow or amenorrhea, spotting) 1 0 8 5 03 Initial side effects that may occur (such as nausea, weight gain, and breast tenderness) 1 0 8 5 04 What to do if forget pill or do not get injection on time 1 0 8 5 05 Method does not protect against STI 1 0 8 5 06 Should return to clinic if side effects continue 1 0 8 5
Human Resources for Health (HRH) Indicator Compendium 22
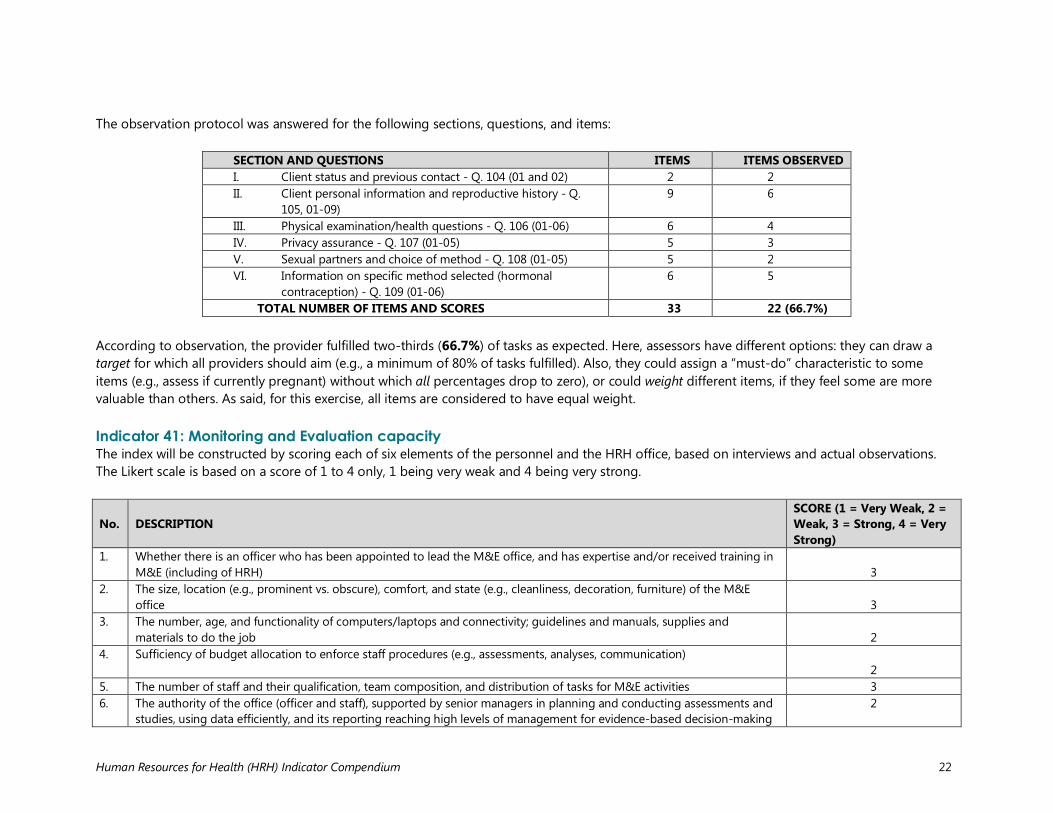
The observation protocol was answered for the following sections, questions, and items:
SECTION AND QUESTIONS ITEMS ITEMS OBSERVED I. Client status and previous contact - Q. 104 (01 and 02) 2 2 II. Client personal information and reproductive history - Q.
105, 01-09) 9 6
III. Physical examination/health questions - Q. 106 (01-06) 6 4 IV. Privacy assurance - Q. 107 (01-05) 5 3 V. Sexual partners and choice of method - Q. 108 (01-05) 5 2 VI. Information on specific method selected (hormonal
contraception) - Q. 109 (01-06) 6 5
TOTAL NUMBER OF ITEMS AND SCORES 33 22 (66.7%)
According to observation, the provider fulfilled two-thirds (66.7%) of tasks as expected. Here, assessors have different options: they can draw a target for which all providers should aim (e.g., a minimum of 80% of tasks fulfilled). Also, they could assign a “must-do” characteristic to some items (e.g., assess if currently pregnant) without which all percentages drop to zero), or could weight different items, if they feel some are more valuable than others. As said, for this exercise, all items are considered to have equal weight. Indicator 41: Monitoring and Evaluation capacity The index will be constructed by scoring each of six elements of the personnel and the HRH office, based on interviews and actual observations. The Likert scale is based on a score of 1 to 4 only, 1 being very weak and 4 being very strong. No.
DESCRIPTION
SCORE (1 = Very Weak, 2 = Weak, 3 = Strong, 4 = Very Strong)
1. Whether there is an officer who has been appointed to lead the M&E office, and has expertise and/or received training in M&E (including of HRH)
3
2. The size, location (e.g., prominent vs. obscure), comfort, and state (e.g., cleanliness, decoration, furniture) of the M&E office
3
3. The number, age, and functionality of computers/laptops and connectivity; guidelines and manuals, supplies and materials to do the job
2
4. Sufficiency of budget allocation to enforce staff procedures (e.g., assessments, analyses, communication) 2
5. The number of staff and their qualification, team composition, and distribution of tasks for M&E activities 3 6. The authority of the office (officer and staff), supported by senior managers in planning and conducting assessments and
studies, using data efficiently, and its reporting reaching high levels of management for evidence-based decision-making 2
Human Resources for Health (HRH) Indicator Compendium 23
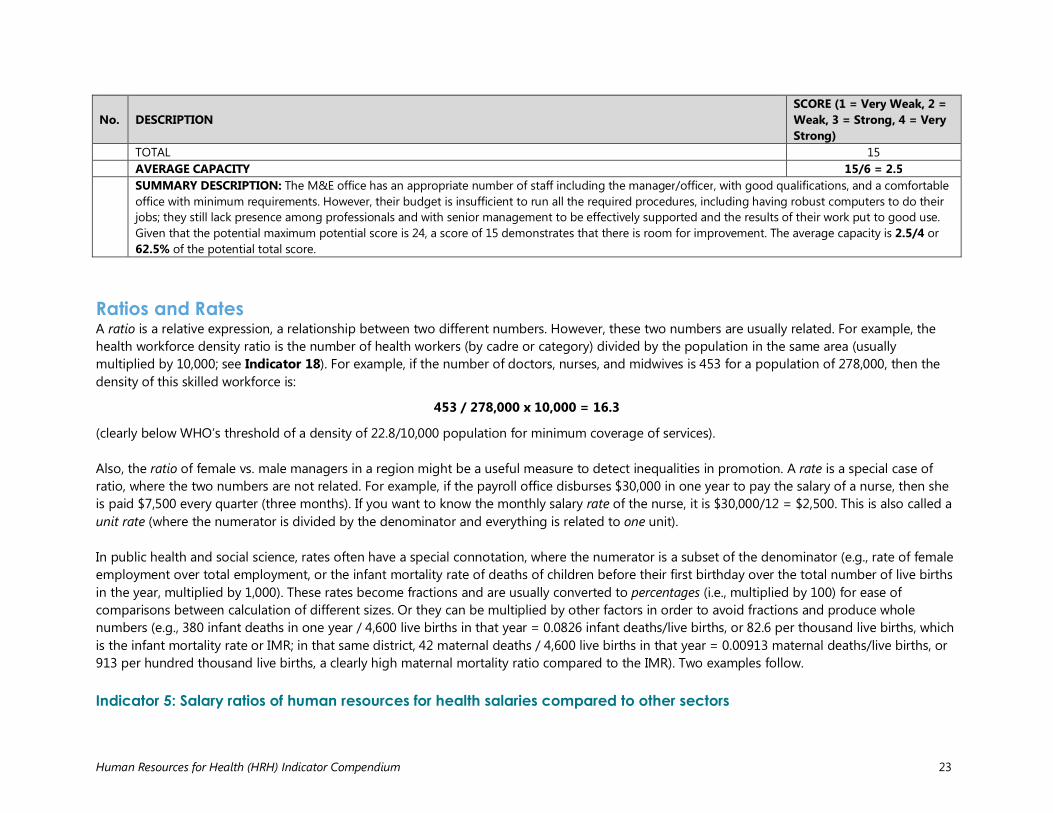
No.
DESCRIPTION
SCORE (1 = Very Weak, 2 = Weak, 3 = Strong, 4 = Very Strong)
TOTAL 15 AVERAGE CAPACITY 15/6 = 2.5 SUMMARY DESCRIPTION: The M&E office has an appropriate number of staff including the manager/officer, with good qualifications, and a comfortable office with minimum requirements. However, their budget is insufficient to run all the required procedures, including having robust computers to do their jobs; they still lack presence among professionals and with senior management to be effectively supported and the results of their work put to good use. Given that the potential maximum potential score is 24, a score of 15 demonstrates that there is room for improvement. The average capacity is 2.5/4 or 62.5% of the potential total score.
Ratios and Rates A ratio is a relative expression, a relationship between two different numbers. However, these two numbers are usually related. For example, the health workforce density ratio is the number of health workers (by cadre or category) divided by the population in the same area (usually multiplied by 10,000; see Indicator 18). For example, if the number of doctors, nurses, and midwives is 453 for a population of 278,000, then the density of this skilled workforce is:
453 / 278,000 x 10,000 = 16.3
(clearly below WHO’s threshold of a density of 22.8/10,000 population for minimum coverage of services). Also, the ratio of female vs. male managers in a region might be a useful measure to detect inequalities in promotion. A rate is a special case of ratio, where the two numbers are not related. For example, if the payroll office disburses $30,000 in one year to pay the salary of a nurse, then she is paid $7,500 every quarter (three months). If you want to know the monthly salary rate of the nurse, it is $30,000/12 = $2,500. This is also called a unit rate (where the numerator is divided by the denominator and everything is related to one unit). In public health and social science, rates often have a special connotation, where the numerator is a subset of the denominator (e.g., rate of female employment over total employment, or the infant mortality rate of deaths of children before their first birthday over the total number of live births in the year, multiplied by 1,000). These rates become fractions and are usually converted to percentages (i.e., multiplied by 100) for ease of comparisons between calculation of different sizes. Or they can be multiplied by other factors in order to avoid fractions and produce whole numbers (e.g., 380 infant deaths in one year / 4,600 live births in that year = 0.0826 infant deaths/live births, or 82.6 per thousand live births, which is the infant mortality rate or IMR; in that same district, 42 maternal deaths / 4,600 live births in that year = 0.00913 maternal deaths/live births, or 913 per hundred thousand live births, a clearly high maternal mortality ratio compared to the IMR). Two examples follow. Indicator 5: Salary ratios of human resources for health salaries compared to other sectors
Human Resources for Health (HRH) Indicator Compendium 24
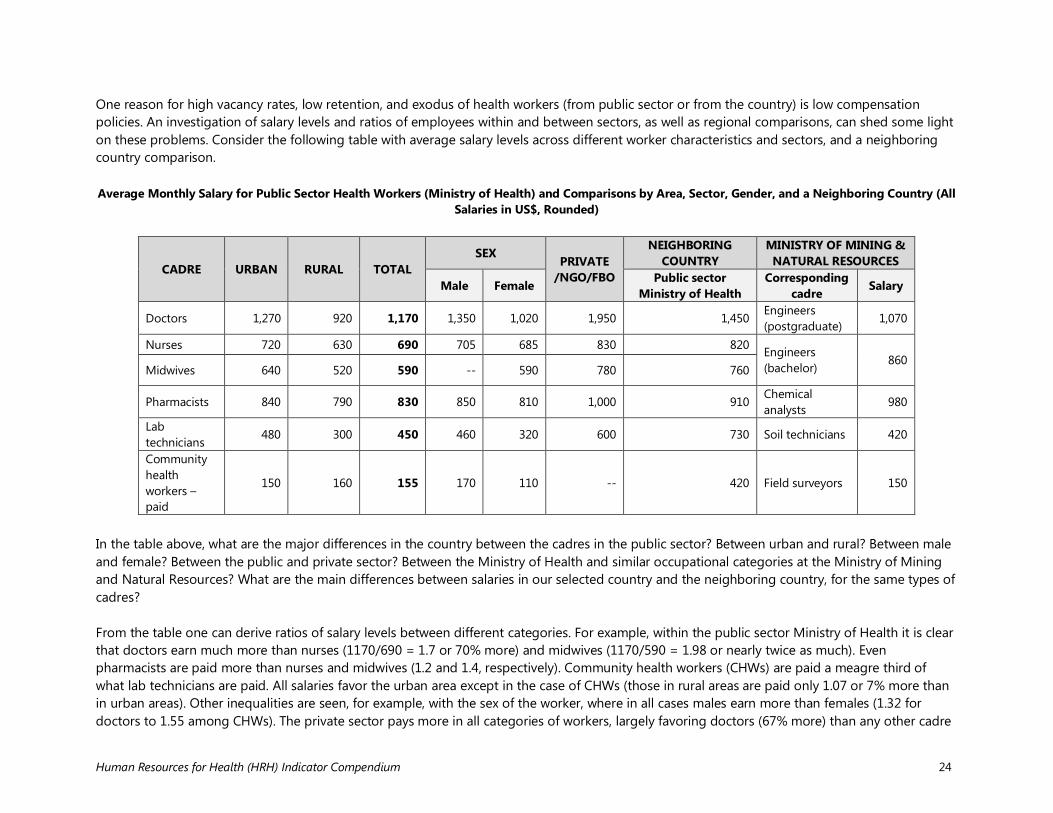
One reason for high vacancy rates, low retention, and exodus of health workers (from public sector or from the country) is low compensation policies. An investigation of salary levels and ratios of employees within and between sectors, as well as regional comparisons, can shed some light on these problems. Consider the following table with average salary levels across different worker characteristics and sectors, and a neighboring country comparison. Average Monthly Salary for Public Sector Health Workers (Ministry of Health) and Comparisons by Area, Sector, Gender, and a Neighboring Country (All
Salaries in US$, Rounded)
CADRE URBAN RURAL TOTAL SEX
PRIVATE /NGO/FBO
NEIGHBORING COUNTRY
MINISTRY OF MINING & NATURAL RESOURCES
Male Female Public sector Ministry of Health
Corresponding cadre Salary
Doctors 1,270 920 1,170 1,350 1,020 1,950 1,450 Engineers (postgraduate)
1,070
Nurses 720 630 690 705 685 830 820 Engineers (bachelor)
860 Midwives 640 520 590 -- 590 780 760
Pharmacists 840 790 830 850 810 1,000 910 Chemical analysts
980
Lab technicians
480 300 450 460 320 600 730 Soil technicians 420
Community health workers – paid
150 160 155 170 110 -- 420 Field surveyors 150
In the table above, what are the major differences in the country between the cadres in the public sector? Between urban and rural? Between male and female? Between the public and private sector? Between the Ministry of Health and similar occupational categories at the Ministry of Mining and Natural Resources? What are the main differences between salaries in our selected country and the neighboring country, for the same types of cadres? From the table one can derive ratios of salary levels between different categories. For example, within the public sector Ministry of Health it is clear that doctors earn much more than nurses (1170/690 = 1.7 or 70% more) and midwives (1170/590 = 1.98 or nearly twice as much). Even pharmacists are paid more than nurses and midwives (1.2 and 1.4, respectively). Community health workers (CHWs) are paid a meagre third of what lab technicians are paid. All salaries favor the urban area except in the case of CHWs (those in rural areas are paid only 1.07 or 7% more than in urban areas). Other inequalities are seen, for example, with the sex of the worker, where in all cases males earn more than females (1.32 for doctors to 1.55 among CHWs). The private sector pays more in all categories of workers, largely favoring doctors (67% more) than any other cadre
Human Resources for Health (HRH) Indicator Compendium 25
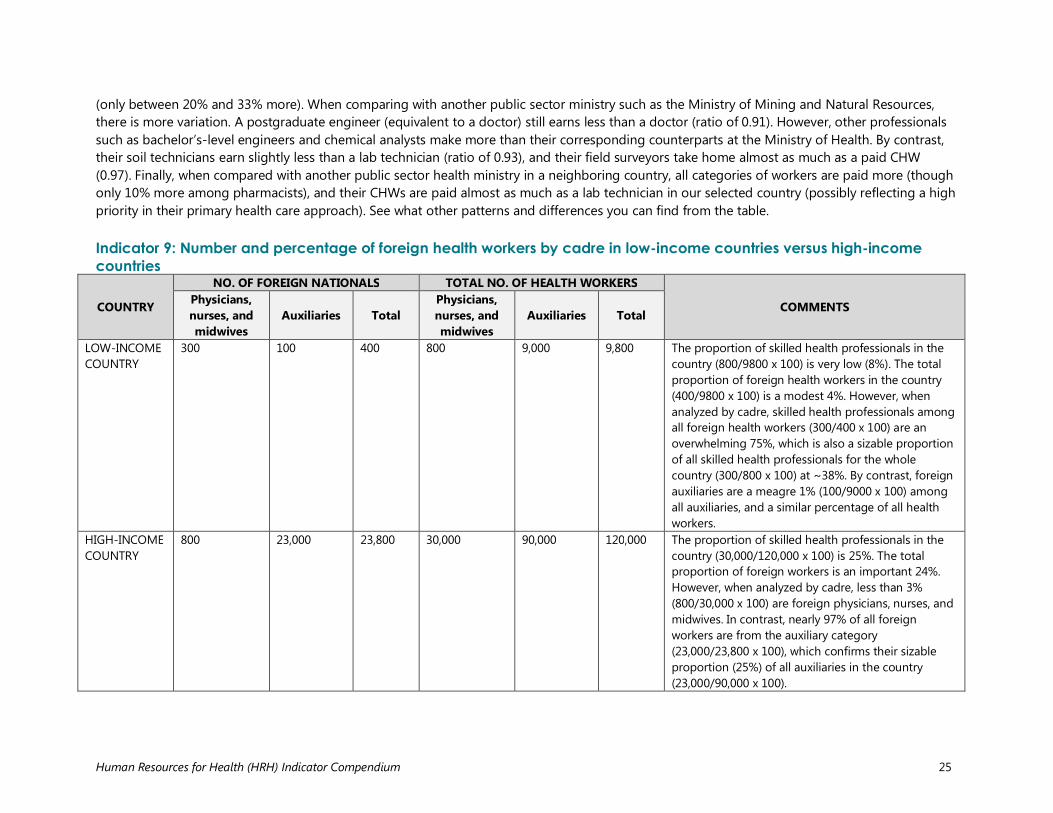
(only between 20% and 33% more). When comparing with another public sector ministry such as the Ministry of Mining and Natural Resources, there is more variation. A postgraduate engineer (equivalent to a doctor) still earns less than a doctor (ratio of 0.91). However, other professionals such as bachelor’s-level engineers and chemical analysts make more than their corresponding counterparts at the Ministry of Health. By contrast, their soil technicians earn slightly less than a lab technician (ratio of 0.93), and their field surveyors take home almost as much as a paid CHW (0.97). Finally, when compared with another public sector health ministry in a neighboring country, all categories of workers are paid more (though only 10% more among pharmacists), and their CHWs are paid almost as much as a lab technician in our selected country (possibly reflecting a high priority in their primary health care approach). See what other patterns and differences you can find from the table. Indicator 9: Number and percentage of foreign health workers by cadre in low-income countries versus high-income countries
COUNTRY
NO. OF FOREIGN NATIONALS TOTAL NO. OF HEALTH WORKERS
COMMENTS Physicians, nurses, and midwives
Auxiliaries Total Physicians, nurses, and midwives
Auxiliaries Total
LOW-INCOME COUNTRY
300 100 400 800 9,000 9,800 The proportion of skilled health professionals in the country (800/9800 x 100) is very low (8%). The total proportion of foreign health workers in the country (400/9800 x 100) is a modest 4%. However, when analyzed by cadre, skilled health professionals among all foreign health workers (300/400 x 100) are an overwhelming 75%, which is also a sizable proportion of all skilled health professionals for the whole country (300/800 x 100) at ~38%. By contrast, foreign auxiliaries are a meagre 1% (100/9000 x 100) among all auxiliaries, and a similar percentage of all health workers.
HIGH-INCOME COUNTRY
800 23,000 23,800 30,000 90,000 120,000 The proportion of skilled health professionals in the country (30,000/120,000 x 100) is 25%. The total proportion of foreign workers is an important 24%. However, when analyzed by cadre, less than 3% (800/30,000 x 100) are foreign physicians, nurses, and midwives. In contrast, nearly 97% of all foreign workers are from the auxiliary category (23,000/23,800 x 100), which confirms their sizable proportion (25%) of all auxiliaries in the country (23,000/90,000 x 100).
Human Resources for Health (HRH) Indicator Compendium 26
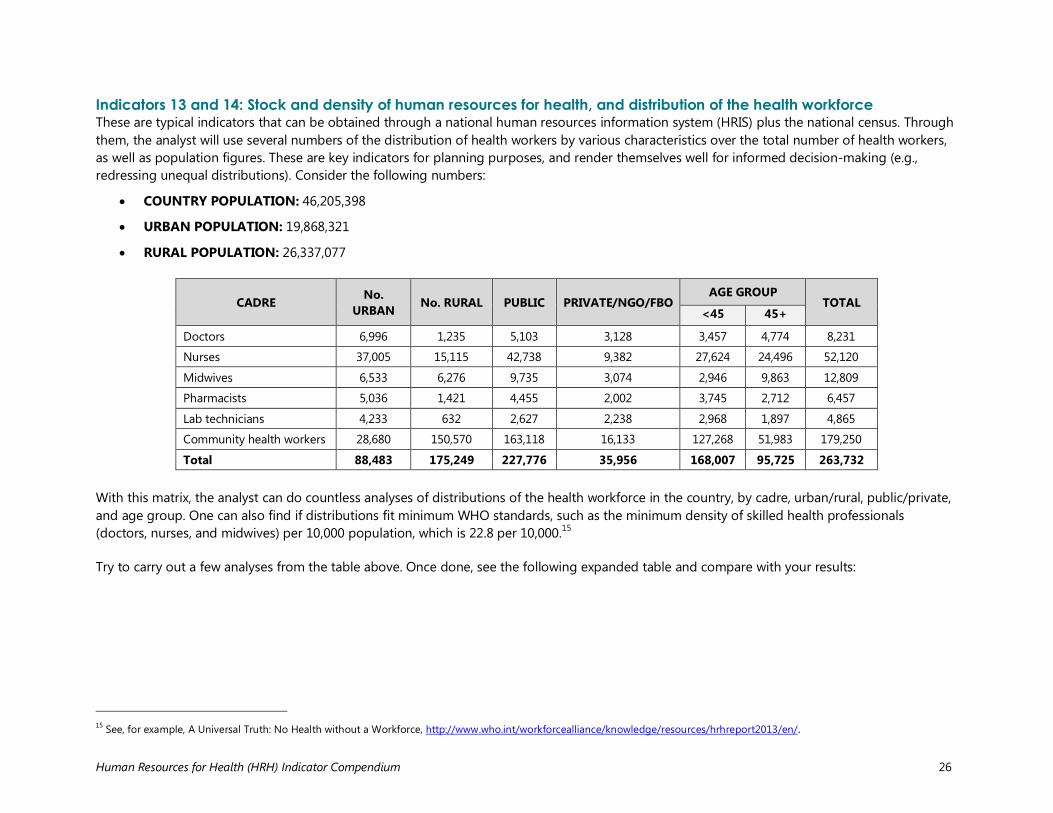
Indicators 13 and 14: Stock and density of human resources for health, and distribution of the health workforce These are typical indicators that can be obtained through a national human resources information system (HRIS) plus the national census. Through them, the analyst will use several numbers of the distribution of health workers by various characteristics over the total number of health workers, as well as population figures. These are key indicators for planning purposes, and render themselves well for informed decision-making (e.g., redressing unequal distributions). Consider the following numbers:
• COUNTRY POPULATION: 46,205,398
• URBAN POPULATION: 19,868,321
• RURAL POPULATION: 26,337,077
CADRE No. URBAN No. RURAL PUBLIC PRIVATE/NGO/FBO
AGE GROUP TOTAL
<45 45+
Doctors 6,996 1,235 5,103 3,128 3,457 4,774 8,231
Nurses 37,005 15,115 42,738 9,382 27,624 24,496 52,120
Midwives 6,533 6,276 9,735 3,074 2,946 9,863 12,809
Pharmacists 5,036 1,421 4,455 2,002 3,745 2,712 6,457
Lab technicians 4,233 632 2,627 2,238 2,968 1,897 4,865
Community health workers 28,680 150,570 163,118 16,133 127,268 51,983 179,250
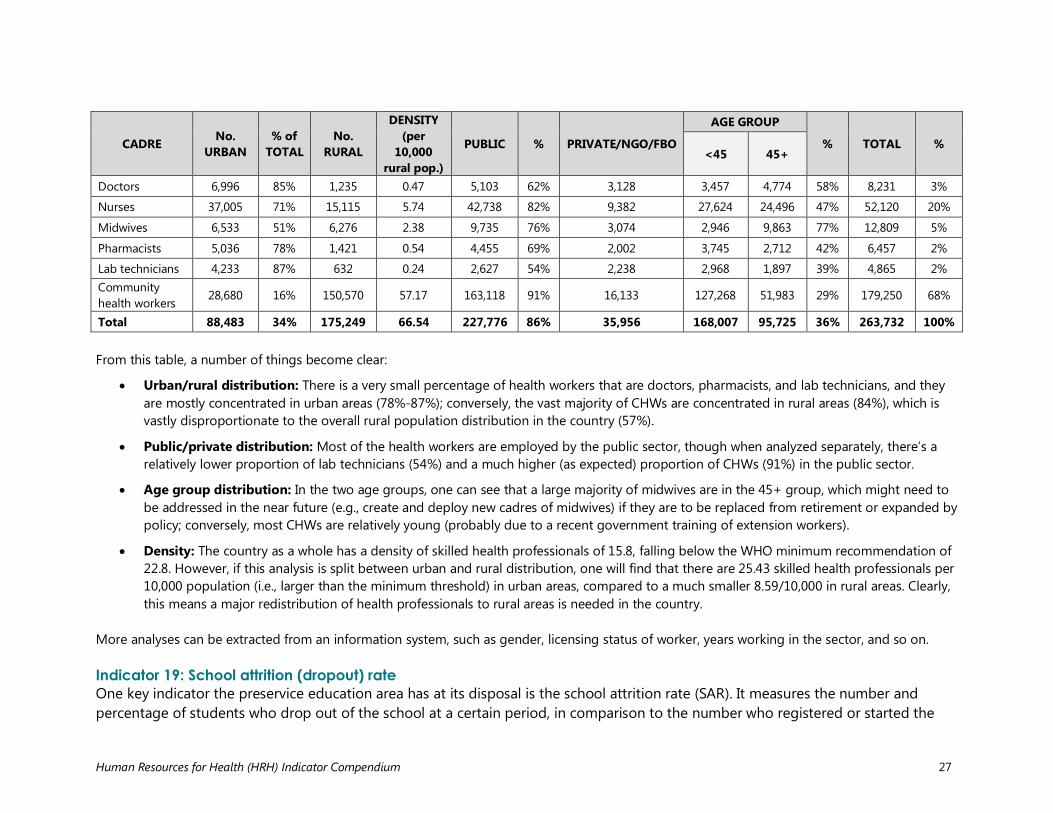
Total 88,483 175,249 227,776 35,956 168,007 95,725 263,732 With this matrix, the analyst can do countless analyses of distributions of the health workforce in the country, by cadre, urban/rural, public/private, and age group. One can also find if distributions fit minimum WHO standards, such as the minimum density of skilled health professionals (doctors, nurses, and midwives) per 10,000 population, which is 22.8 per 10,000.15 Try to carry out a few analyses from the table above. Once done, see the following expanded table and compare with your results:
15 See, for example, A Universal Truth: No Health without a Workforce, http://www.who.int/workforcealliance/knowledge/resources/hrhreport2013/en/.
Human Resources for Health (HRH) Indicator Compendium 27
CADRE No. URBAN
% of TOTAL
No. RURAL
DENSITY (per
10,000 rural pop.)
PUBLIC % PRIVATE/NGO/FBO
AGE GROUP
% TOTAL % <45 45+
Doctors 6,996 85% 1,235 0.47 5,103 62% 3,128 3,457 4,774 58% 8,231 3%
Nurses 37,005 71% 15,115 5.74 42,738 82% 9,382 27,624 24,496 47% 52,120 20%
Midwives 6,533 51% 6,276 2.38 9,735 76% 3,074 2,946 9,863 77% 12,809 5%
Pharmacists 5,036 78% 1,421 0.54 4,455 69% 2,002 3,745 2,712 42% 6,457 2%
Lab technicians 4,233 87% 632 0.24 2,627 54% 2,238 2,968 1,897 39% 4,865 2% Community health workers
28,680 16% 150,570 57.17 163,118 91% 16,133 127,268 51,983 29% 179,250 68%
Total 88,483 34% 175,249 66.54 227,776 86% 35,956 168,007 95,725 36% 263,732 100% From this table, a number of things become clear:
• Urban/rural distribution: There is a very small percentage of health workers that are doctors, pharmacists, and lab technicians, and they are mostly concentrated in urban areas (78%-87%); conversely, the vast majority of CHWs are concentrated in rural areas (84%), which is vastly disproportionate to the overall rural population distribution in the country (57%).
• Public/private distribution: Most of the health workers are employed by the public sector, though when analyzed separately, there’s a relatively lower proportion of lab technicians (54%) and a much higher (as expected) proportion of CHWs (91%) in the public sector.
• Age group distribution: In the two age groups, one can see that a large majority of midwives are in the 45+ group, which might need to be addressed in the near future (e.g., create and deploy new cadres of midwives) if they are to be replaced from retirement or expanded by policy; conversely, most CHWs are relatively young (probably due to a recent government training of extension workers).
• Density: The country as a whole has a density of skilled health professionals of 15.8, falling below the WHO minimum recommendation of 22.8. However, if this analysis is split between urban and rural distribution, one will find that there are 25.43 skilled health professionals per 10,000 population (i.e., larger than the minimum threshold) in urban areas, compared to a much smaller 8.59/10,000 in rural areas. Clearly, this means a major redistribution of health professionals to rural areas is needed in the country.
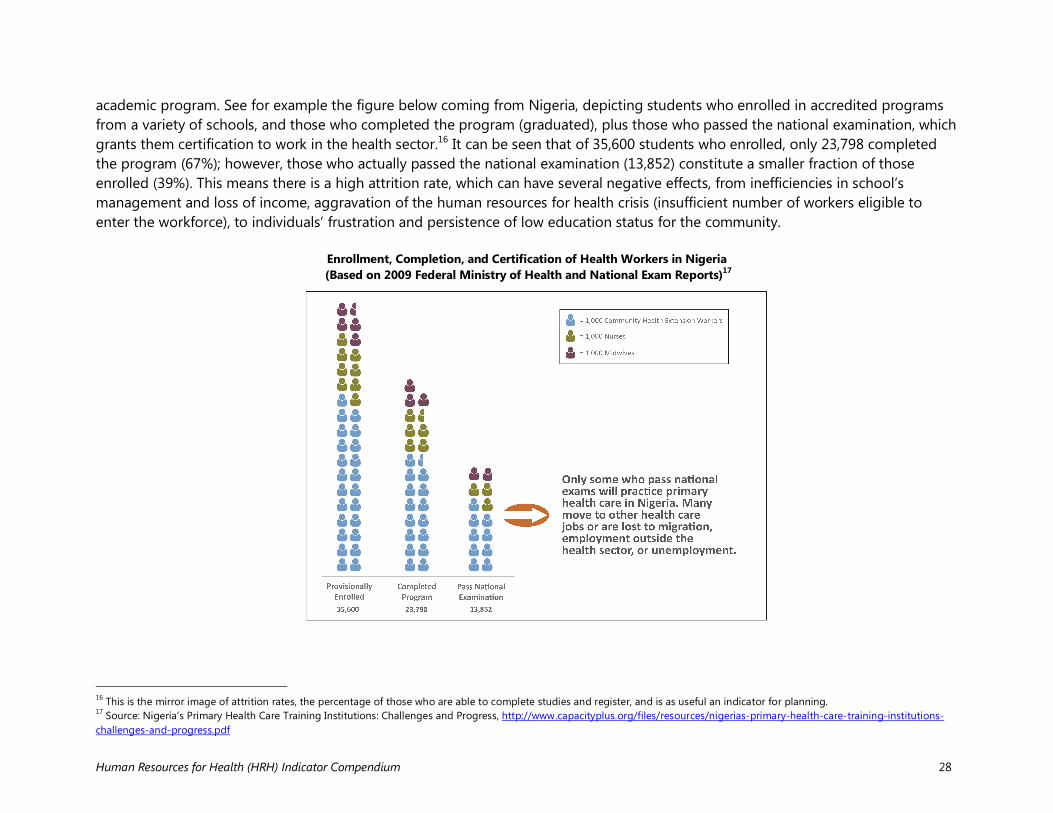
More analyses can be extracted from an information system, such as gender, licensing status of worker, years working in the sector, and so on. Indicator 19: School attrition (dropout) rate One key indicator the preservice education area has at its disposal is the school attrition rate (SAR). It measures the number and percentage of students who drop out of the school at a certain period, in comparison to the number who registered or started the
Human Resources for Health (HRH) Indicator Compendium 28
academic program. See for example the figure below coming from Nigeria, depicting students who enrolled in accredited programs from a variety of schools, and those who completed the program (graduated), plus those who passed the national examination, which grants them certification to work in the health sector.16 It can be seen that of 35,600 students who enrolled, only 23,798 completed the program (67%); however, those who actually passed the national examination (13,852) constitute a smaller fraction of those enrolled (39%). This means there is a high attrition rate, which can have several negative effects, from inefficiencies in school’s management and loss of income, aggravation of the human resources for health crisis (insufficient number of workers eligible to enter the workforce), to individuals’ frustration and persistence of low education status for the community.
Enrollment, Completion, and Certification of Health Workers in Nigeria (Based on 2009 Federal Ministry of Health and National Exam Reports)17
16 This is the mirror image of attrition rates, the percentage of those who are able to complete studies and register, and is as useful an indicator for planning. 17 Source: Nigeria’s Primary Health Care Training Institutions: Challenges and Progress, http://www.capacityplus.org/files/resources/nigerias-primary-health-care-training-institutions-challenges-and-progress.pdf
Human Resources for Health (HRH) Indicator Compendium 29
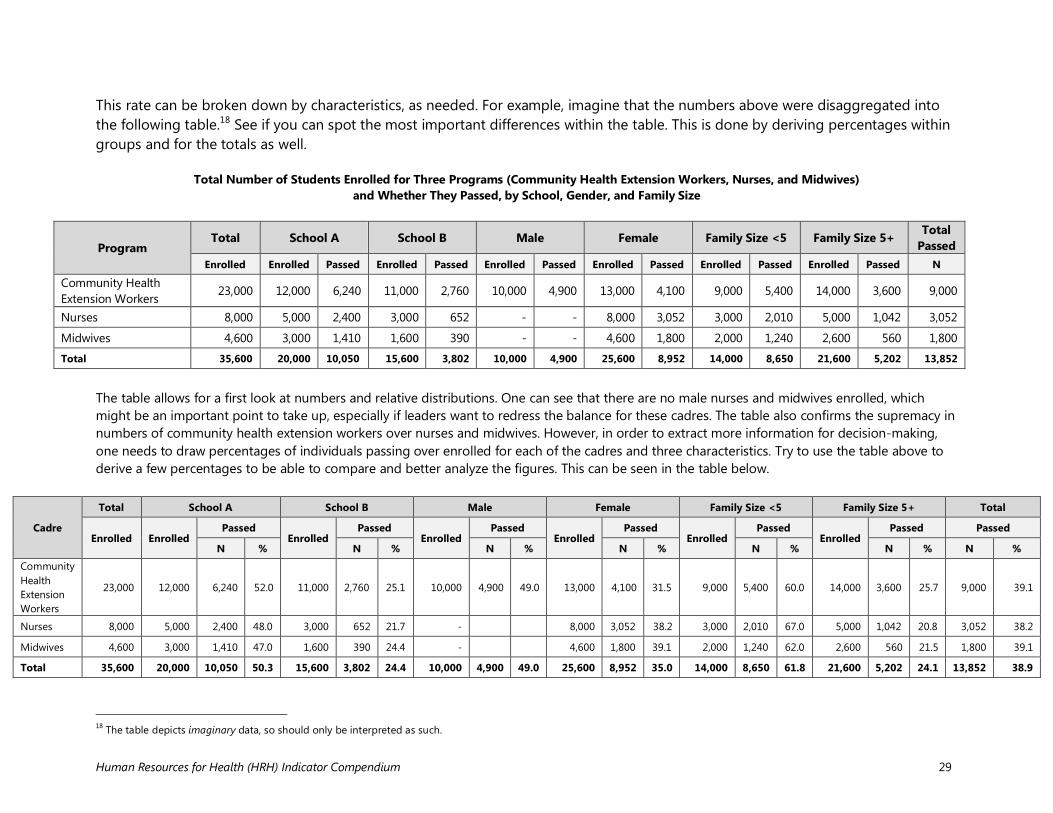
This rate can be broken down by characteristics, as needed. For example, imagine that the numbers above were disaggregated into the following table.18 See if you can spot the most important differences within the table. This is done by deriving percentages within groups and for the totals as well.
Total Number of Students Enrolled for Three Programs (Community Health Extension Workers, Nurses, and Midwives)
and Whether They Passed, by School, Gender, and Family Size
Program Total School A School B Male Female Family Size <5 Family Size 5+ Total
Passed Enrolled Enrolled Passed Enrolled Passed Enrolled Passed Enrolled Passed Enrolled Passed Enrolled Passed N
Community Health Extension Workers
23,000 12,000 6,240 11,000 2,760 10,000 4,900 13,000 4,100 9,000 5,400 14,000 3,600 9,000
Nurses 8,000 5,000 2,400 3,000 652 - - 8,000 3,052 3,000 2,010 5,000 1,042 3,052
Midwives 4,600 3,000 1,410 1,600 390 - - 4,600 1,800 2,000 1,240 2,600 560 1,800
Total 35,600 20,000 10,050 15,600 3,802 10,000 4,900 25,600 8,952 14,000 8,650 21,600 5,202 13,852
The table allows for a first look at numbers and relative distributions. One can see that there are no male nurses and midwives enrolled, which might be an important point to take up, especially if leaders want to redress the balance for these cadres. The table also confirms the supremacy in numbers of community health extension workers over nurses and midwives. However, in order to extract more information for decision-making, one needs to draw percentages of individuals passing over enrolled for each of the cadres and three characteristics. Try to use the table above to derive a few percentages to be able to compare and better analyze the figures. This can be seen in the table below.
Cadre
Total School A School B Male Female Family Size <5 Family Size 5+ Total
Enrolled Enrolled Passed
Enrolled Passed
Enrolled Passed
Enrolled Passed
Enrolled Passed
Enrolled Passed Passed
N % N % N % N % N % N % N %
Community Health Extension Workers
23,000 12,000 6,240 52.0 11,000 2,760 25.1 10,000 4,900 49.0 13,000 4,100 31.5 9,000 5,400 60.0 14,000 3,600 25.7 9,000 39.1
Nurses 8,000 5,000 2,400 48.0 3,000 652 21.7 -
8,000 3,052 38.2 3,000 2,010 67.0 5,000 1,042 20.8 3,052 38.2
Midwives 4,600 3,000 1,410 47.0 1,600 390 24.4 -
4,600 1,800 39.1 2,000 1,240 62.0 2,600 560 21.5 1,800 39.1
Total 35,600 20,000 10,050 50.3 15,600 3,802 24.4 10,000 4,900 49.0 25,600 8,952 35.0 14,000 8,650 61.8 21,600 5,202 24.1 13,852 38.9
18 The table depicts imaginary data, so should only be interpreted as such.
Human Resources for Health (HRH) Indicator Compendium 30
With the addition of the percentages, it is now possible to analyze further for specific characteristics:
• Schools: It is clear that School A not only has more people enrolled per cadre, but also their passing rates are higher than School B, although both rates could be improved.
• Gender: This can only be examined among the community health extension workers. The passing rate of males is definitely higher than that of females, revealing an important inequality that needs to be addressed through changes in study organization and enforcement of anti-discrimination policies.
• Family size: This is a proxy indicator for socioeconomic condition (e.g., urban/rural, education, access to public services). The relative percentages reveal huge disparities, with smaller families having passing rates about three times as high as larger families. This finding can also be used by the school management to find ways (e.g., flexible study times, child care facilities, extended tutoring) to support students who come from these backgrounds.
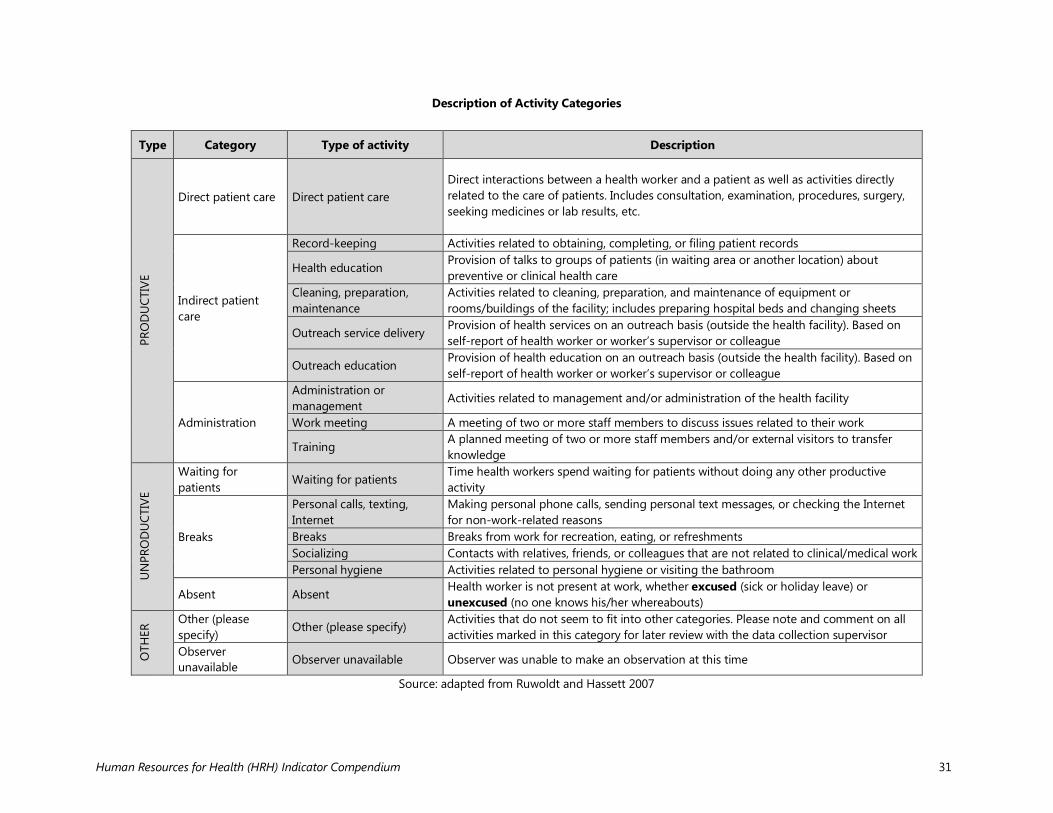
With additional time and resources, analysts can mine these data further to extract more information for improved planning. For example, cross-tabulating these and other variables can show whether students coming from certain areas are more prone to default, or if there are more women among students with larger family sizes, and so on. Follow-up surveys can also inform the specific reasons (e.g., pregnancy) that lead some students to drop out of the program. Indicator 26: Absenteeism This indicator is a difficult one to measure, but in some places such as health facilities, it may provide useful information for managers. It collects the percentage of days per week and/or hours per day that an employee is absent from his/her post. This indicator, like others, can be disaggregated by characteristics, such as reason for absence, cadre, facility and facility type, region, etc. In its most complete version, the methodology to obtain this indicator (plus other measures of productivity) is a time-motion study, where an observer “tags” a person at different points in time during working hours, and ascertains what the person is doing, including being absent from his/her post. The fractions of time observed are categorized into productive and unproductive segments, and each one can be further disaggregated as per need (see table below).
Human Resources for Health (HRH) Indicator Compendium 31
Description of Activity Categories
Type Category Type of activity Description PR
OD
UCT
IVE
Direct patient care Direct patient care Direct interactions between a health worker and a patient as well as activities directly related to the care of patients. Includes consultation, examination, procedures, surgery, seeking medicines or lab results, etc.
Indirect patient care
Record-keeping Activities related to obtaining, completing, or filing patient records
Health education Provision of talks to groups of patients (in waiting area or another location) about preventive or clinical health care
Cleaning, preparation, maintenance
Activities related to cleaning, preparation, and maintenance of equipment or rooms/buildings of the facility; includes preparing hospital beds and changing sheets
Outreach service delivery Provision of health services on an outreach basis (outside the health facility). Based on self-report of health worker or worker’s supervisor or colleague
Outreach education Provision of health education on an outreach basis (outside the health facility). Based on self-report of health worker or worker’s supervisor or colleague
Administration
Administration or management
Activities related to management and/or administration of the health facility
Work meeting A meeting of two or more staff members to discuss issues related to their work
Training A planned meeting of two or more staff members and/or external visitors to transfer knowledge
UN
PRO
DU
CTIV
E
Waiting for patients
Waiting for patients Time health workers spend waiting for patients without doing any other productive activity
Breaks
Personal calls, texting, Internet
Making personal phone calls, sending personal text messages, or checking the Internet for non-work-related reasons
Breaks Breaks from work for recreation, eating, or refreshments Socializing Contacts with relatives, friends, or colleagues that are not related to clinical/medical work Personal hygiene Activities related to personal hygiene or visiting the bathroom
Absent Absent Health worker is not present at work, whether excused (sick or holiday leave) or unexcused (no one knows his/her whereabouts)
OTH
ER Other (please
specify) Other (please specify)
Activities that do not seem to fit into other categories. Please note and comment on all activities marked in this category for later review with the data collection supervisor
Observer unavailable Observer unavailable Observer was unable to make an observation at this time
Source: adapted from Ruwoldt and Hassett 2007
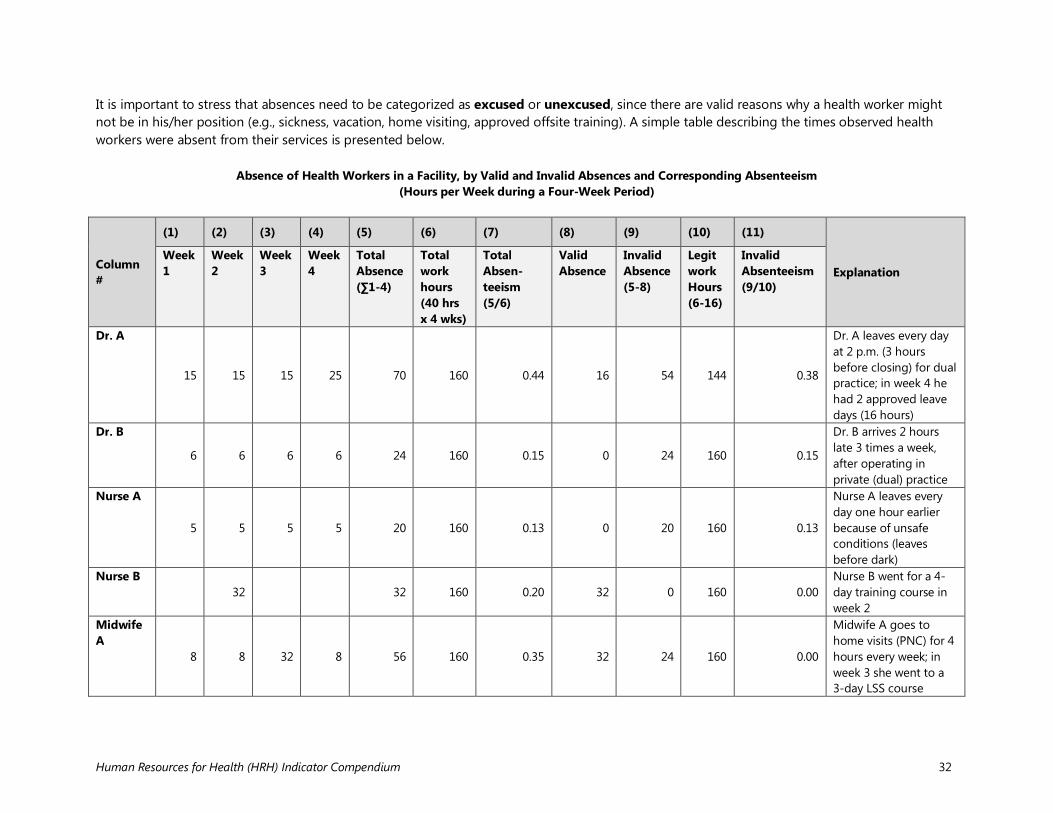
Human Resources for Health (HRH) Indicator Compendium 32
It is important to stress that absences need to be categorized as excused or unexcused, since there are valid reasons why a health worker might not be in his/her position (e.g., sickness, vacation, home visiting, approved offsite training). A simple table describing the times observed health workers were absent from their services is presented below. Absence of Health Workers in a Facility, by Valid and Invalid Absences and Corresponding Absenteeism
(Hours per Week during a Four-Week Period)
Column #
(1) (2) (3) (4) (5) (6) (7) (8) (9) (10) (11)
Explanation Week 1
Week 2
Week 3
Week 4
Total Absence (∑1-4)
Total work hours (40 hrs x 4 wks)
Total Absen-teeism (5/6)
Valid Absence
Invalid Absence (5-8)
Legit work Hours (6-16)
Invalid Absenteeism (9/10)
Dr. A
15 15 15 25 70 160 0.44 16 54 144 0.38
Dr. A leaves every day at 2 p.m. (3 hours before closing) for dual practice; in week 4 he had 2 approved leave days (16 hours)
Dr. B
6 6 6 6 24 160 0.15 0 24 160 0.15
Dr. B arrives 2 hours late 3 times a week, after operating in private (dual) practice
Nurse A
5 5 5 5 20 160 0.13 0 20 160 0.13
Nurse A leaves every day one hour earlier because of unsafe conditions (leaves before dark)
Nurse B
32
32 160 0.20 32 0 160 0.00
Nurse B went for a 4-day training course in week 2
Midwife A
8 8 32 8 56 160 0.35 32 24 160 0.00
Midwife A goes to home visits (PNC) for 4 hours every week; in week 3 she went to a 3-day LSS course
Human Resources for Health (HRH) Indicator Compendium 33
From the table it can be seen that health workers have a variety of reasons for being absent from their facilities. The table tracks the working hours (total and “legitimate”) and absences, whether valid and invalid. Dr. A has the most “invalid absenteeism” by leaving every day early for dual practice. Nurse A needs to leave early because of safety reasons. Management needs to consider if her absence should be considered “invalid absenteeism.” Also note that through home visiting plus a training episode, Midwife A had a total absenteeism similar to Dr. A. If she is the only midwife in the facility and her absence will affect onsite services for clients, management would need to reconsider the home visits (e.g., by using community health workers instead) and carefully selecting the number and length of training events that she will attend.
Human Resources for Health (HRH) Indicator Compendium