MR2300: MARKETING RESEARCH PAUL TILLEY Unit 9: Sampling Designs, Sampling Procedures & Sample Size.
Upload
dr-rahul-pratap-singh-kauravCategory
view
220download
1
SAMPLING
Rahul Pratap Singh Kaurav, Ph.D. Asst. Professor, Marketing
Unit II
MBA 203

Sampling Terminology
Sample A subset, or some part, of a larger population.
Population (universe) Any complete group of entities that share some common set of characteristics.
Population Element An individual member of a population.
Census An investigation of all the individual elements that make up a population.
Source: PPTs of Dr. Nim
itChowdhary, ava
ilable at
Slid
esh
are.com, file n
ame “13 Samplin
g”
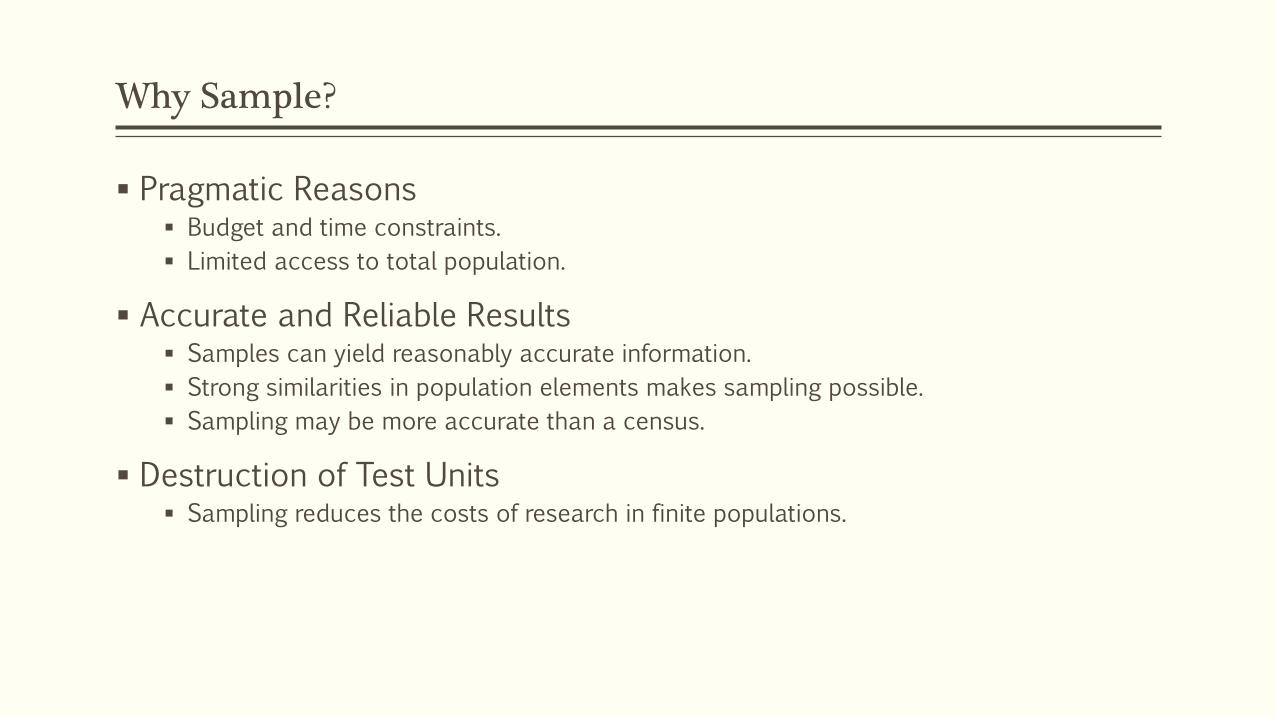
Why Sample?
Pragmatic Reasons Budget and time constraints.
Limited access to total population.
Accurate and Reliable Results Samples can yield reasonably accurate information.
Strong similarities in population elements makes sampling possible.
Sampling may be more accurate than a census.
Destruction of Test Units Sampling reduces the costs of research in finite populations.

Why Sample?
Source: PPTs of Dr. N
imit
Chowdhary, ava
ilable at
Slidesh
are.com, file name “13 Samplin
g”

Stages in the Selection of a Sample
Source: PPTs of Dr. Nimit Chowdhary, available at Slideshare.com, file name “13 Sampling”
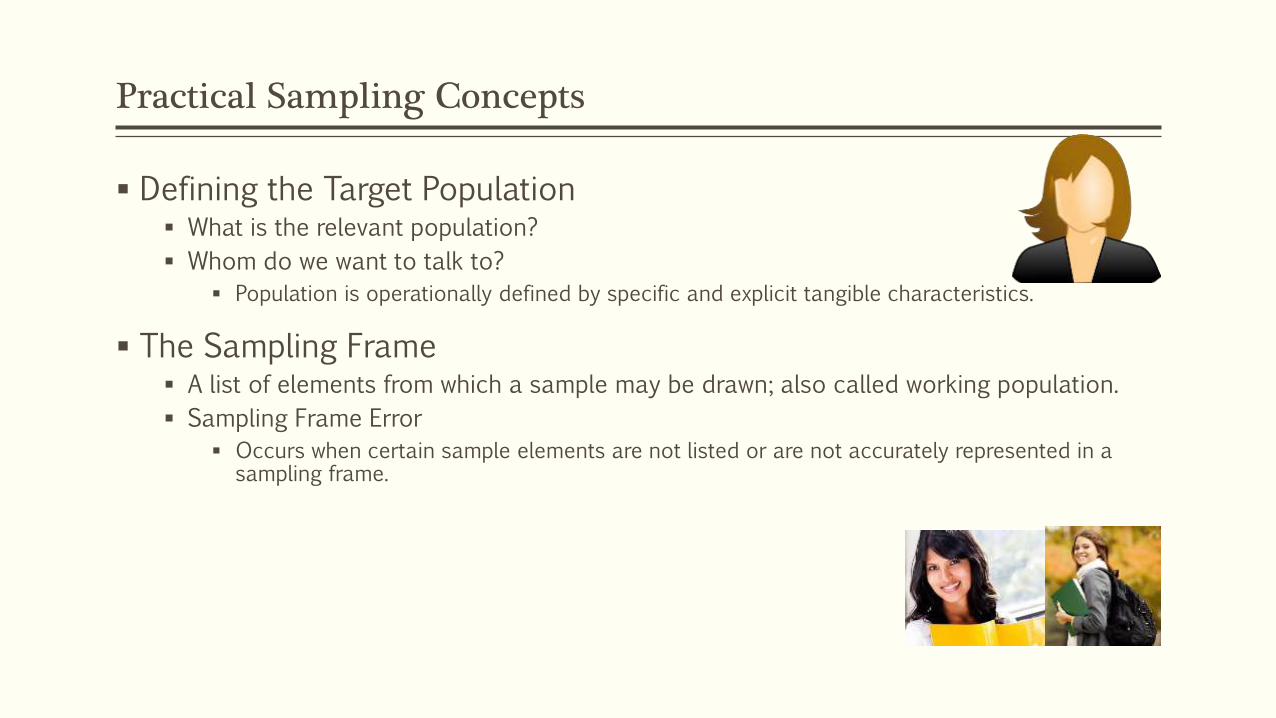
Practical Sampling Concepts
Defining the Target Population What is the relevant population?
Whom do we want to talk to?
Population is operationally defined by specific and explicit tangible characteristics.
The Sampling Frame A list of elements from which a sample may be drawn; also called working population.
Sampling Frame Error
Occurs when certain sample elements are not listed or are not accurately represented in a sampling frame.

Sampling Units
A single element or group of elements subject to selection in the sample.
Primary Sampling Unit (PSU) A unit selected in the first stage of sampling.
Secondary Sampling Unit (SSU) A unit selected in the second stage of sampling.
Tertiary Sampling Unit (TSU) A unit selected in the third stage of sampling.
GwaliorIndore
Jabalpur
Management CollegesEngineering Colleges

Errors Associated with Sampling

Probability versus Nonprobability Sampling
Probability Sampling A sampling technique in which every member of the population has a known, nonzero probability of selection.
Nonprobability Sampling A sampling technique in which units of the sample are selected on the basis of personal judgment or convenience.
The probability of any particular member of the population being chosen is unknown.

Tree of Sampling Types
Sampling

Tree of Sampling Types
Sampling
Non-Probability
Probability
Tree of Sampling Types
Sampling
Non-Probability
Probability
Convenience
Judgmental
Quota
Snowball
Random
Stratified
Cluster

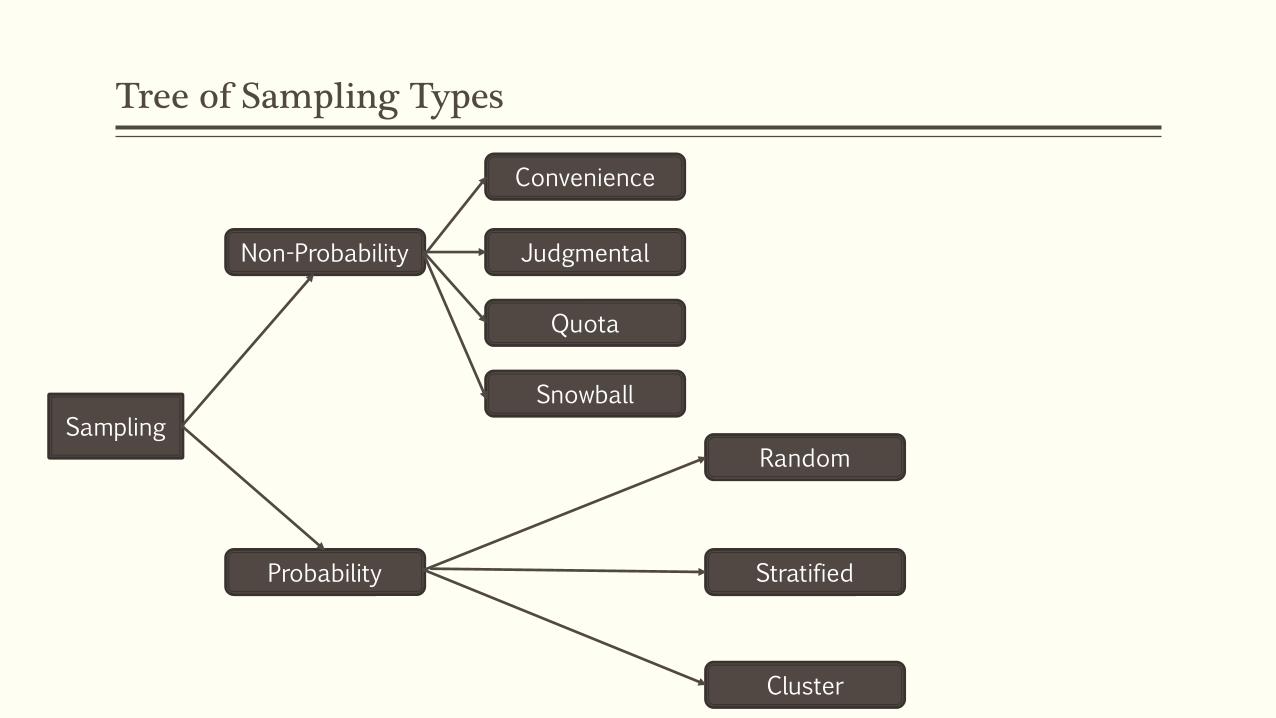
Tree of Sampling Types
Sampling
Non-Probability
Probability
Convenience
Judgmental
Quota
Snowball
Random
Stratified
Cluster
Simple Random
Systematic
Proportionate
Dis-Proportionate

Nonprobability Sampling - I
Convenience Sampling Obtaining those people or units that are most conveniently available.
DisadvantagesHighly vulnerable to selection biasGeneralisability unclearHigh level of sampling error
AdvantagesSimplicity of sampling and ease of researchHelpful for pilot studies and for hypothesis generationData collection can be facilitated in short duration of timeCost effectiveness
Source: http://research-methodology.net/sampling/convenience-sampling/
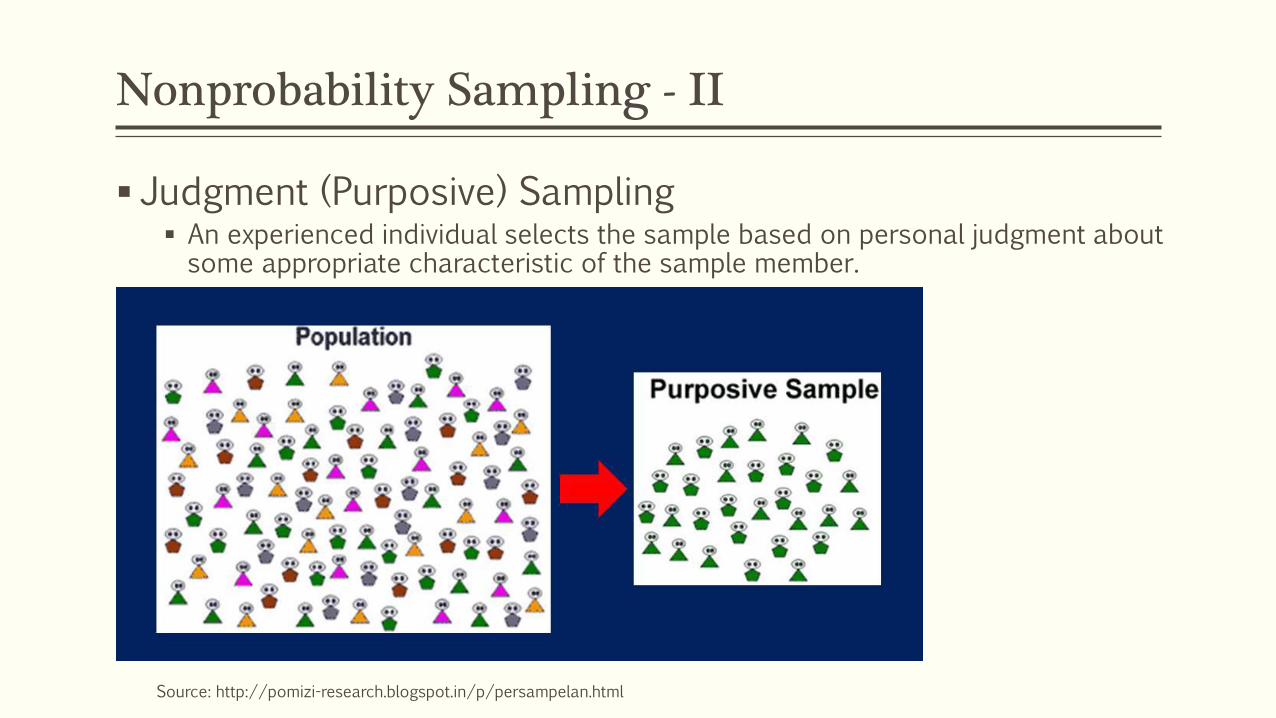
Nonprobability Sampling - II
Judgment (Purposive) Sampling An experienced individual selects the sample based on personal judgment about some appropriate characteristic of the sample member.
Source: http://pomizi-research.blogspot.in/p/persampelan.html

Nonprobability Sampling - III
Quota Sampling Ensures that various subgroups of a population will be represented on pertinent characteristics to the exact extent that the investigator desires.
Source: http://publish.uwo.ca/~craven/504/504sam.htmSource: http://www.askwillonline.com/2011/04/sampling-in-market-research-business.html
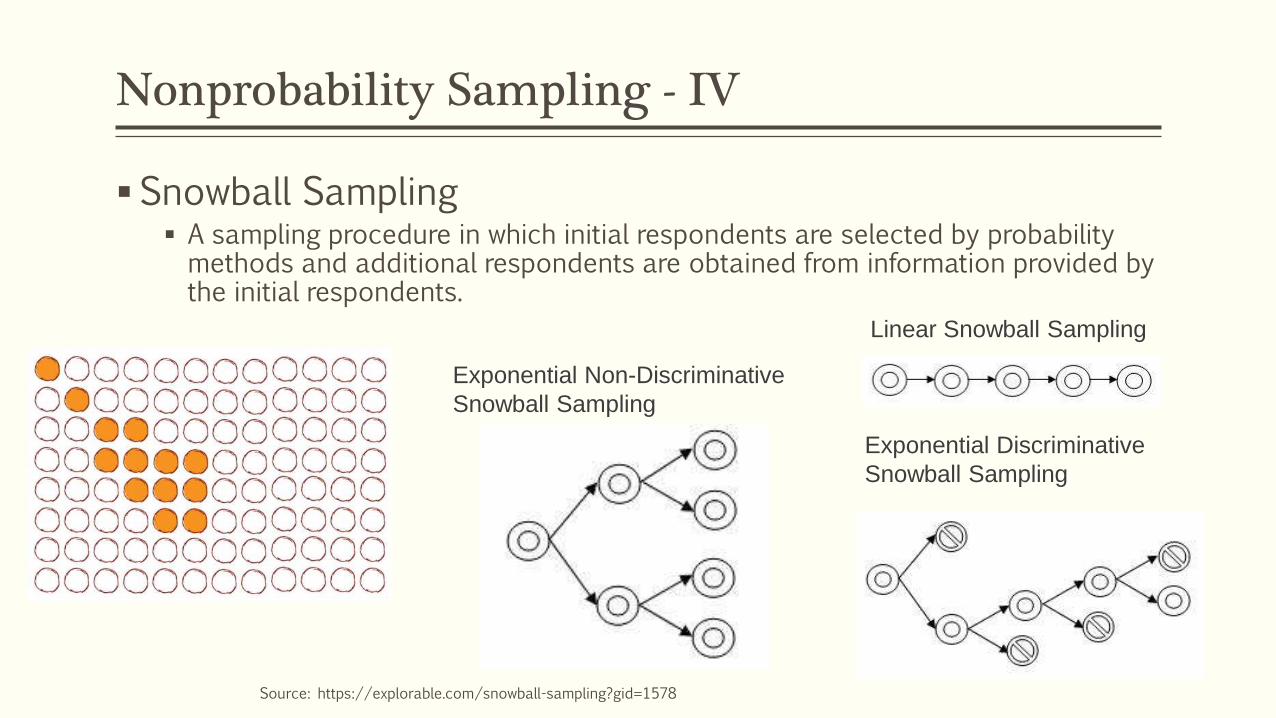
Nonprobability Sampling - IV
Snowball Sampling A sampling procedure in which initial respondents are selected by probability methods and additional respondents are obtained from information provided by the initial respondents.
Source: https://explorable.com/snowball-sampling?gid=1578
Linear Snowball Sampling
Exponential Non-Discriminative
Snowball Sampling
Exponential Discriminative
Snowball Sampling

Nonprobability Sampling - IVa
Advantages The chain referral process allows the researcher to reach populations that are difficult to sample when using other sampling methods.
The process is simple and cost-efficient.
This sampling technique needs little planning and fewer workforce compared to other sampling techniques.
Disadvantages The subjects that the researcher can obtain rely mainly on the previous subjects that were observed.
Representativeness of the sample is not guaranteed.
Initial subjects tend to nominate people that they know well. Because of this, it is highly possible that the subjects share the same traits and characteristics, thus, it is possible that the sample that the researcher will obtain is only a small subgroup of the entire population.
Snowball Samplin
g
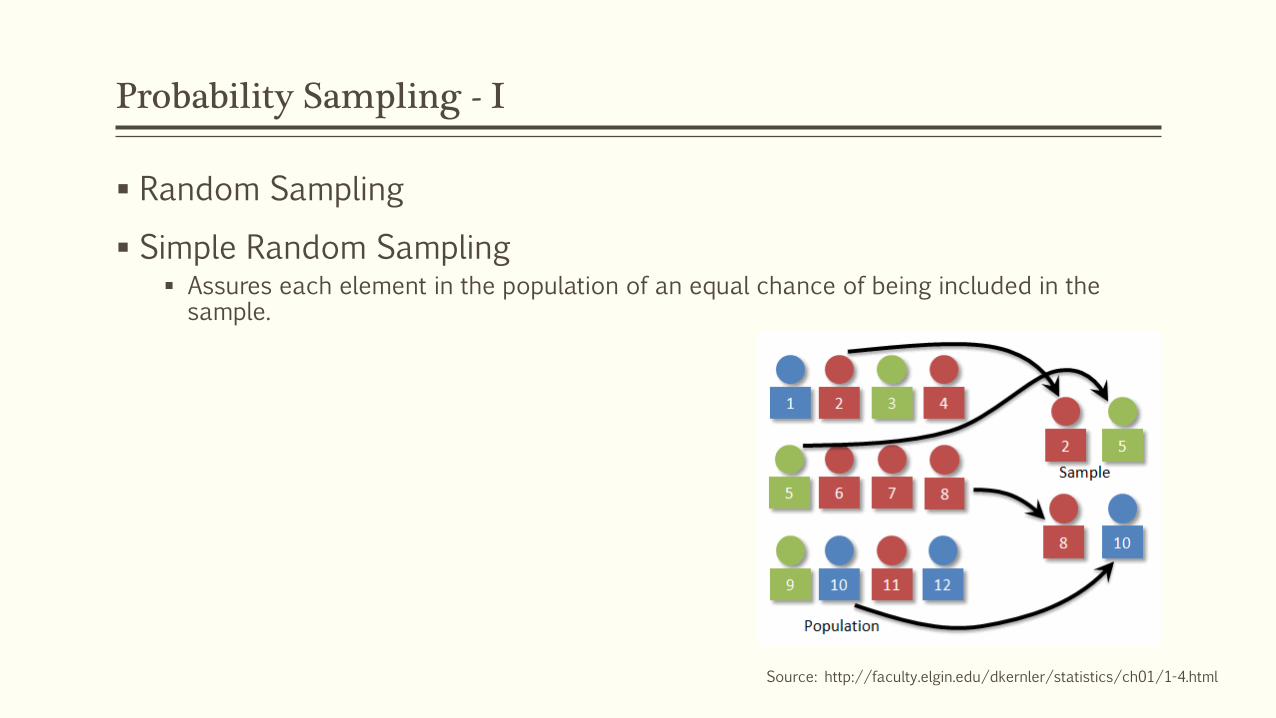
Probability Sampling - I
Random Sampling
Simple Random Sampling Assures each element in the population of an equal chance of being included in the sample.
Source: http://faculty.elgin.edu/dkernler/statistics/ch01/1-4.html

Probability Sampling - II
Random Sampling
Systematic Random Sampling A starting point is selected by a random process and then every nth number on the list is selected.
Source: http://faculty.elgin.edu/dkernler/statistics/ch01/1-4.html

Probability Sampling - III
Stratified Sampling Simple random subsamples that are more or less equal on some characteristic are drawn from within each stratum of the population.
Proportional Stratified Sample The number of sampling units drawn from each stratum is in proportion to the population size of that stratum.
Source: http://faculty.elgin.edu/dkernler/statistics/ch01/1-4.html
Source: https://explorable.com/snowball-sampling?gid=1578

Probability Sampling - IV
Stratified Sampling
Disproportional Stratified Sample The sample size for each stratum is allocated according to analytical considerations.
Source: http://www.formyschoolstuff.com/school/math/glossary/s.htm

Probability Sampling - V
Cluster Sampling An economically efficient sampling technique in which the primary sampling unit is not the individual element in the population but a large cluster of elements.
Clusters are selected randomly.
Source: http://faculty.elgin.edu/dkernler/statistics/ch01/1-4.html
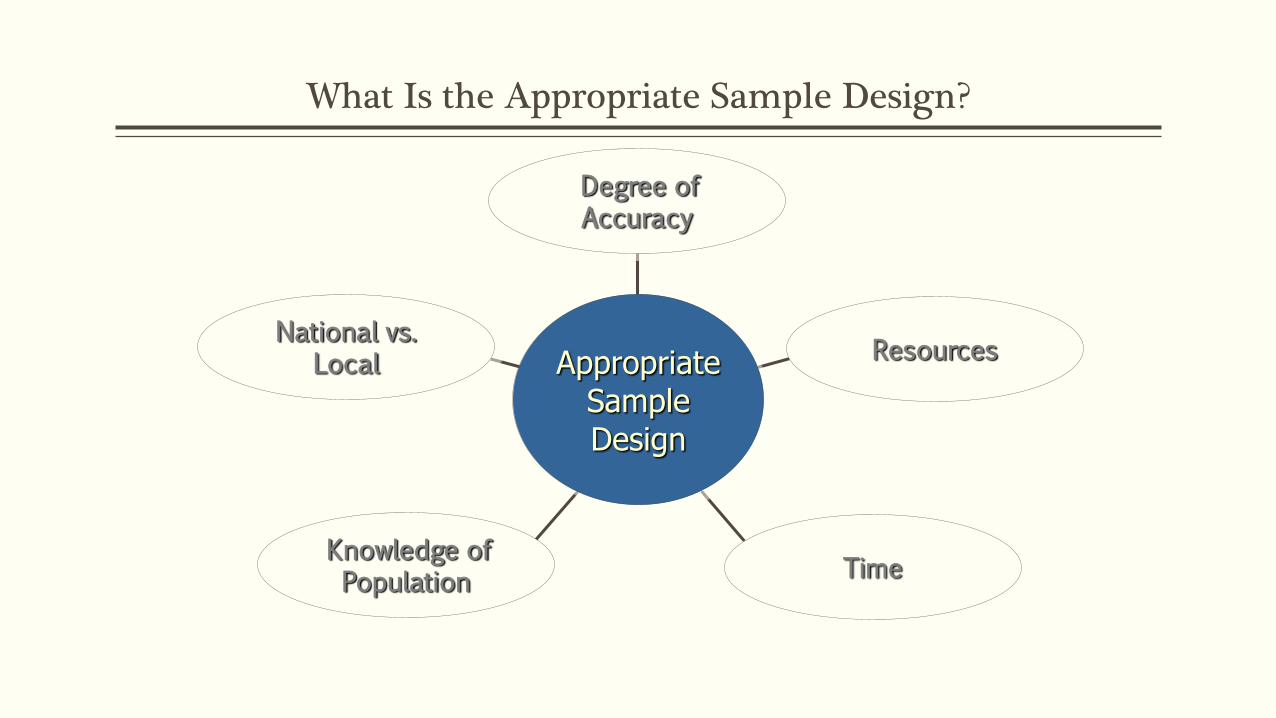
What Is the Appropriate Sample Design?
Appropriate Sample Design
National vs. Local
Knowledge of Population
Time
Resources
Degree of Accuracy

What should be the sample size?
The Level of Precision (Sampling Error)
The Confidence Level
Degree of Variability

Statistics: Introduction
Descriptive Statistics Describe characteristics of populations or samples.
Inferential Statistics Make inferences about whole populations from a sample.
Sample Statistics Variables in a sample or measures computed from sample data.
Population Parameters Variables in a population or measured characteristics of the population.

Making Data Usable - I
Frequency Distribution A set of data organized by summarizing the number of times a particular value of a variable occurs.
Percentage Distribution A frequency distribution organized into a table (or graph) that summarizes percentage values
associated with particular values of a variable.
Probability The long-run relative frequency with which an event will occur.

Frequency and Percentage Distribution and Probability of Deposits
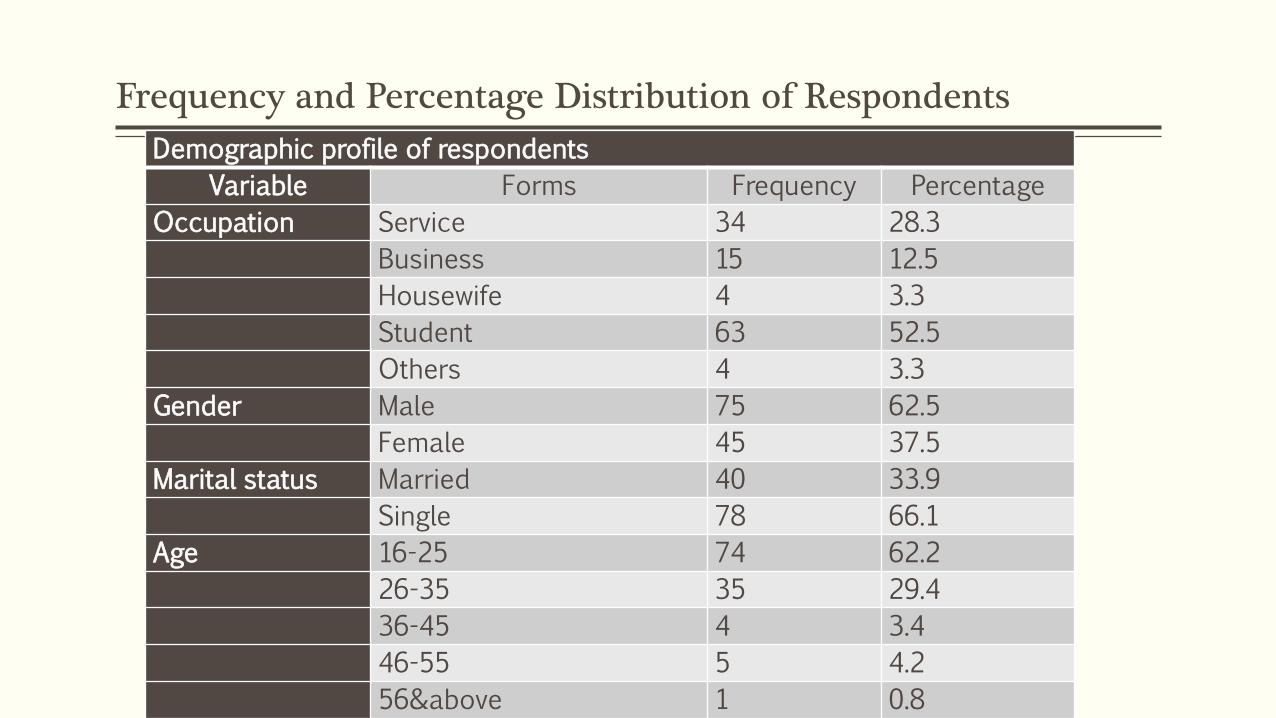
Frequency and Percentage Distribution of Respondents
Demographic profile of respondents
Variable Forms Frequency Percentage
Occupation Service 34 28.3
Business 15 12.5
Housewife 4 3.3
Student 63 52.5
Others 4 3.3
Gender Male 75 62.5
Female 45 37.5
Marital status Married 40 33.9
Single 78 66.1
Age 16-25 74 62.2
26-35 35 29.4
36-45 4 3.4
46-55 5 4.2
56&above 1 0.8

Population Mean
Making Data Usable - II
Proportion The percentage of elements that meet some criterion
Measures of Central Tendency Mean: the arithmetic average.
Median: the midpoint; the value below which half the values in a distribution fall.
Mode: the value that occurs most often.
Sample Mean
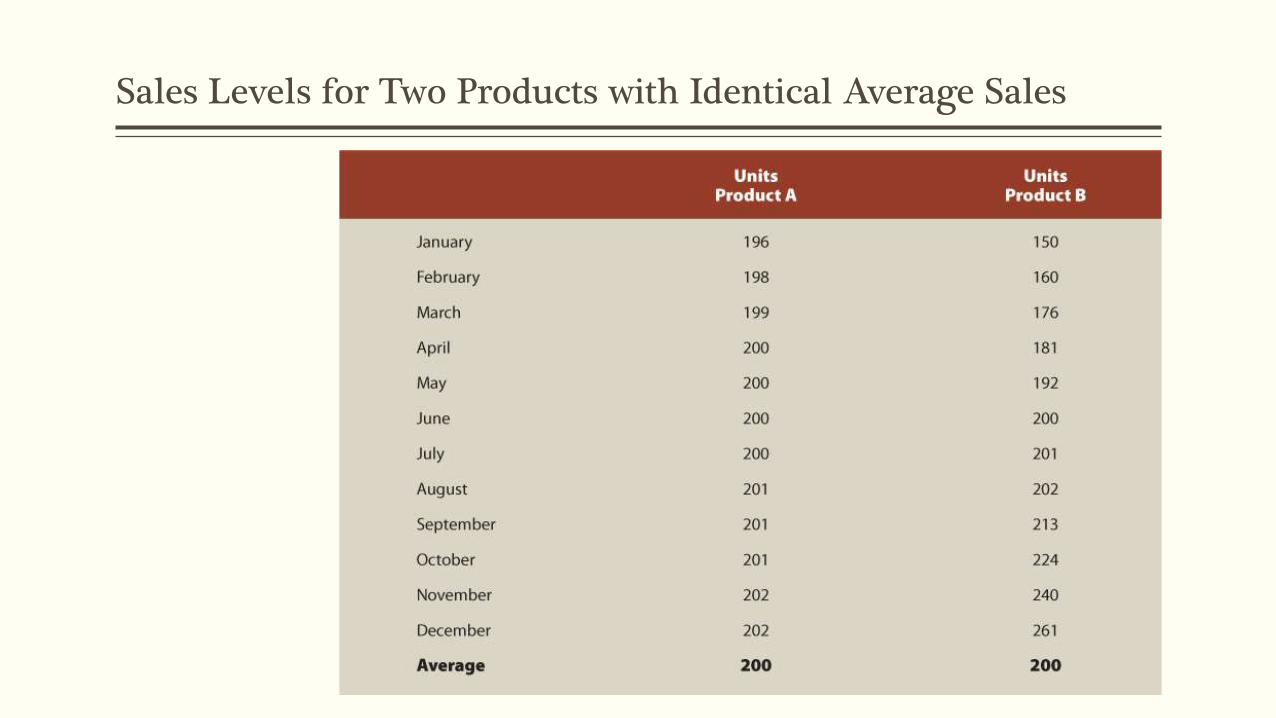
Sales Levels for Two Products with Identical Average Sales

Measures of Dispersion - I
The Range The distance between the smallest and the largest values of a frequency distribution.

Measures of Dispersion - II
Why Use the Standard Deviation? Variance
A measure of variability or dispersion.
Its square root is the standard deviation.
Standard deviation A quantitative index of a distribution’s spread, or variability; the square root of the variance for a distribution.
The average of the amount of variance for a distribution.
Used to calculate the likelihood (probability) of an event occurring.
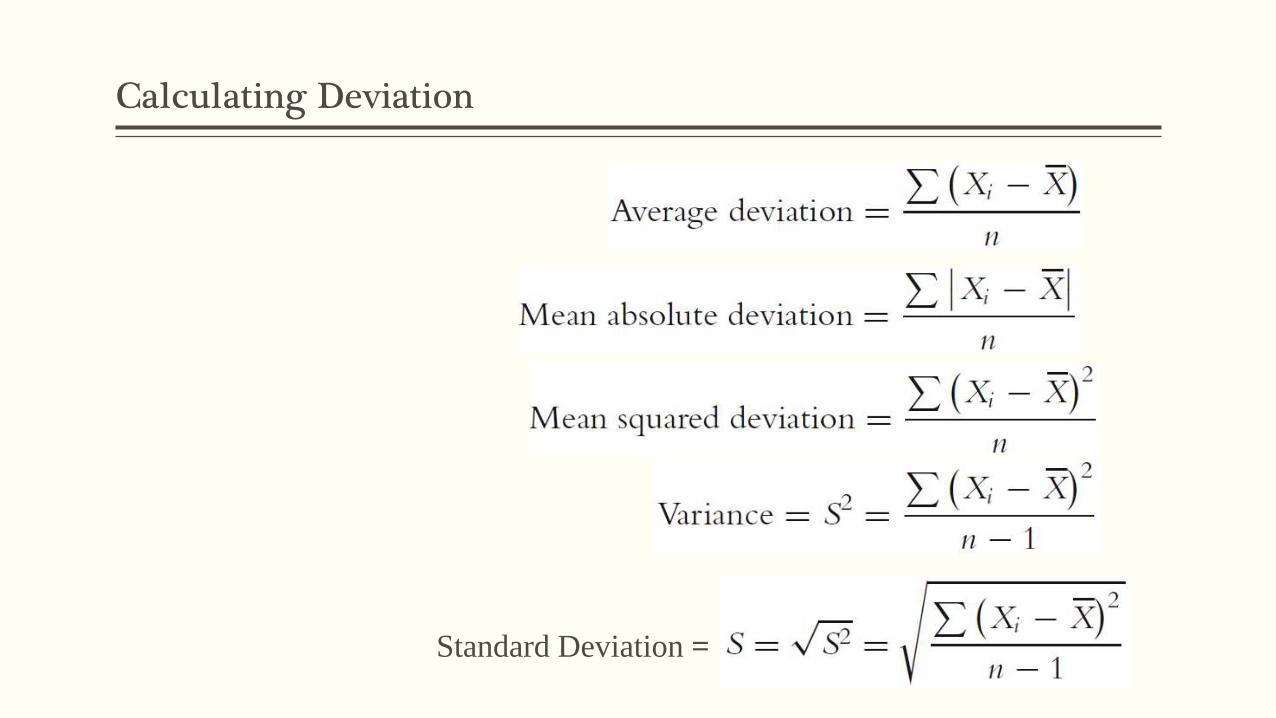
Calculating Deviation
Standard Deviation =

Calculating a Standard Deviation: Number of Sales Calls per Day for Eight Salespeople

The Normal Distribution - I
Normal Distribution A symmetrical, bell-shaped distribution (normal curve) that describes the expected probability distribution of many chance occurrences.
99% of its values are within ± 3 standard deviations from its mean.
Standardized Normal Distribution A purely theoretical probability distribution that reflects a specific normal curve for the standardized value, z.

Normal Distribution: Distribution of Intelligence Quotient (IQ) Scores

The Normal Distribution - II
Characteristics of a Standardized Normal Distribution1. It is symmetrical about its mean.
2. The mean identifies the normal curve’s highest point (the mode) and the vertical line about which this normal curve is symmetrical.
3. The normal curve has an infinite number of cases (it is a continuous distribution), and the area under the curve has a probability density equal to 1.0.
4. The standardized normal distribution has a mean of 0 and a standard deviation of 1.

Standardized Normal Distribution

Sample Size
Random Error and Sample Size
Random sampling error varies with samples of different sizes.
Increases in sample size reduce sampling error at a decreasing rate.
Diminishing returns - random sampling error is inversely proportional to the square root of n.
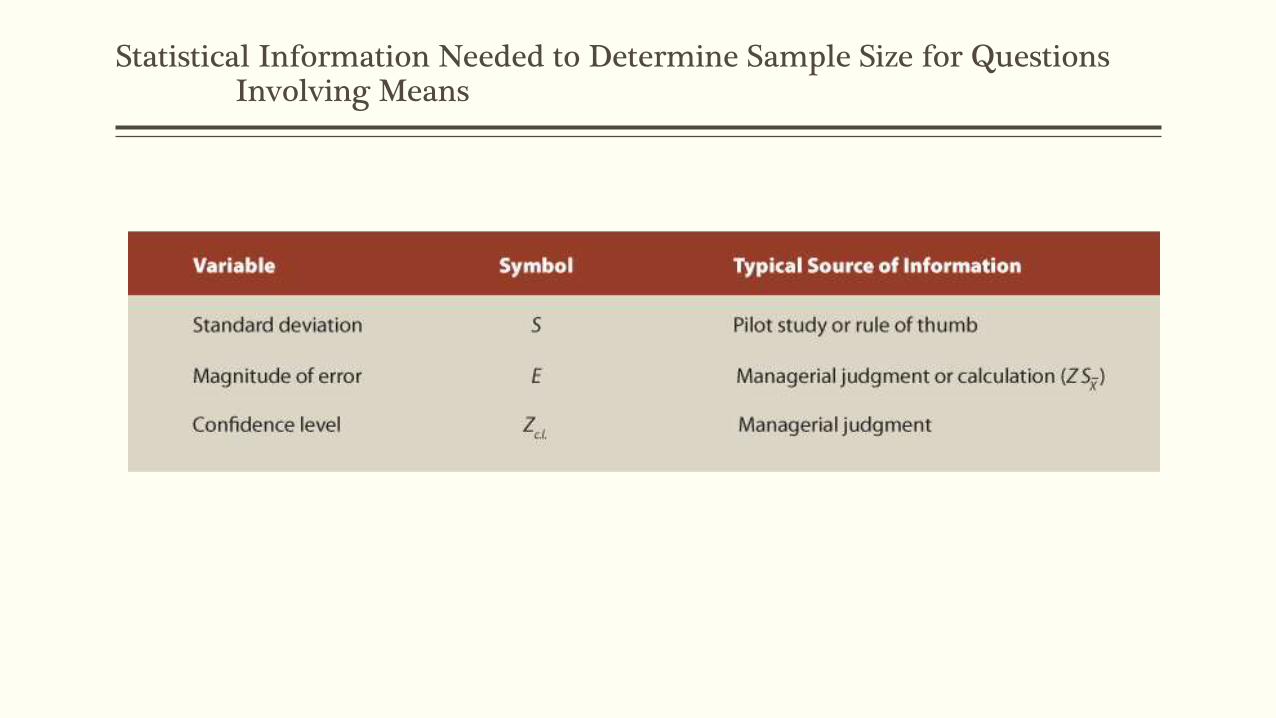
Statistical Information Needed to Determine Sample Size for Questions Involving Means

Factors of Concern in Choosing Sample Size
Variance (or Heterogeneity) A heterogeneous population has more variance (a larger standard deviation) which will require a larger sample.
A homogeneous population has less variance (a smaller standard deviation) which permits a smaller sample.
Magnitude of Error (Confidence Interval) How precise must the estimate be?
Confidence Level How much error will be tolerated?
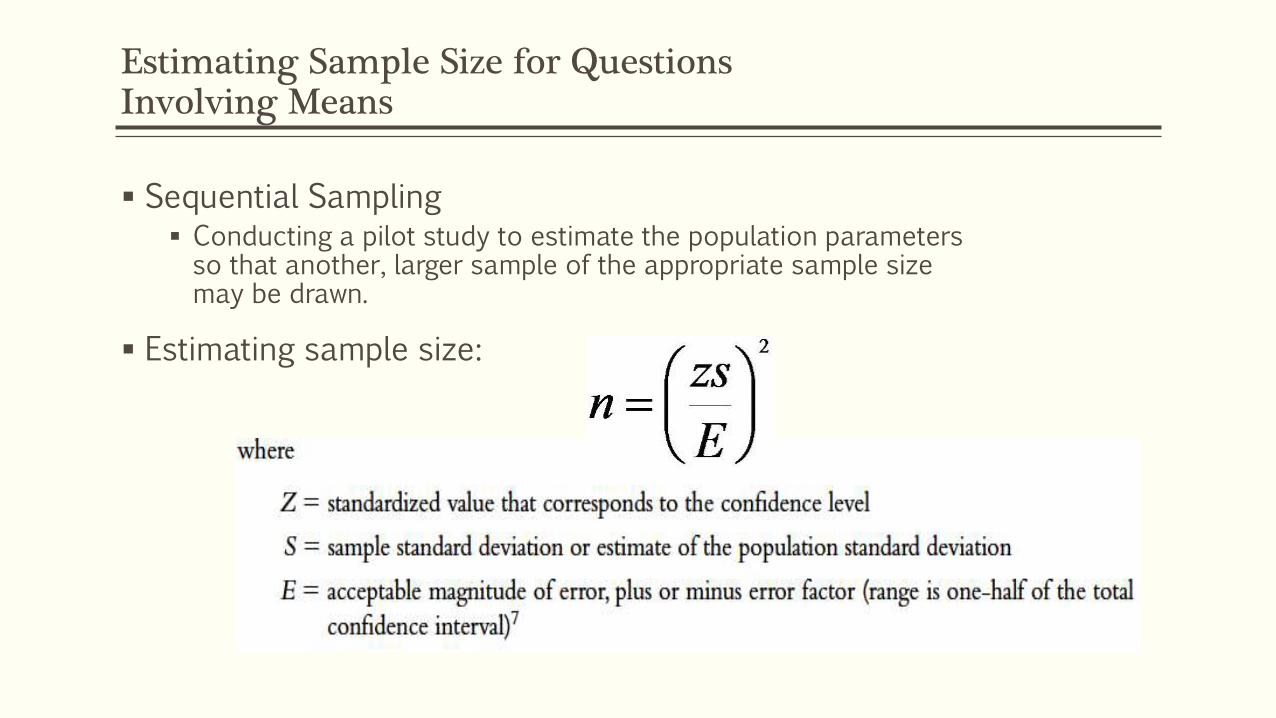
Estimating Sample Size for QuestionsInvolving Means
Sequential Sampling Conducting a pilot study to estimate the population parameters so that another, larger sample of the appropriate sample size may be drawn.
Estimating sample size:
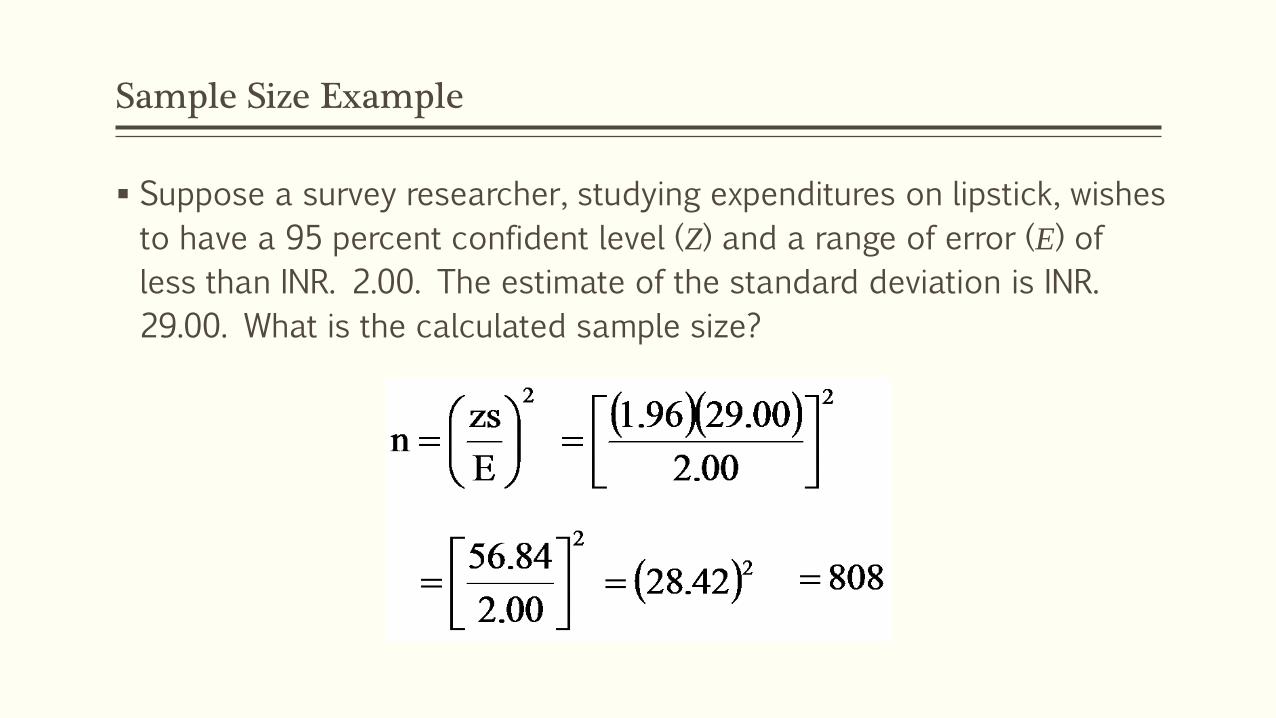
Sample Size Example
Suppose a survey researcher, studying expenditures on lipstick, wishes
to have a 95 percent confident level (Z) and a range of error (E) of
less than INR. 2.00. The estimate of the standard deviation is INR.
29.00. What is the calculated sample size?

Sample Size Example
Suppose, in the same example as the one before, the range of error (E) is acceptable at INR. 4.00. Sample size is reduced.

Calculating Sample Size at the 99 Percent Confidence Level
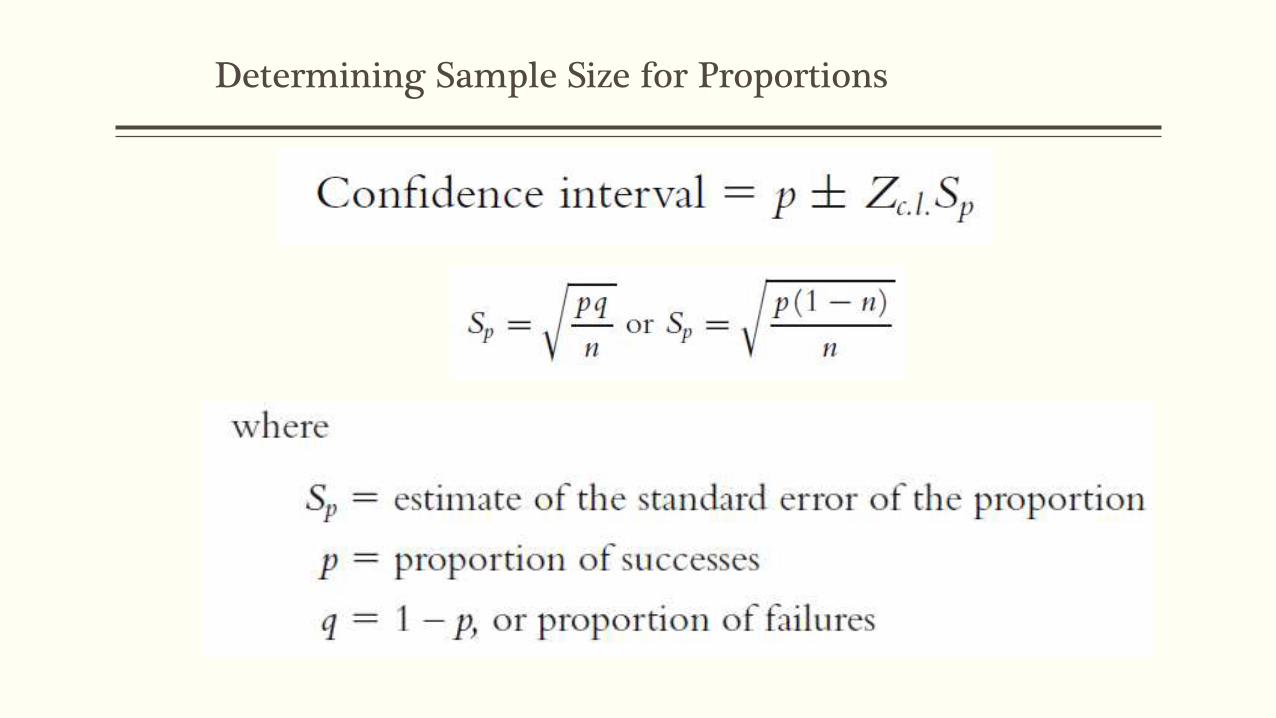
Determining Sample Size for Proportions

Determining Sample Size for Proportions (cont’d)
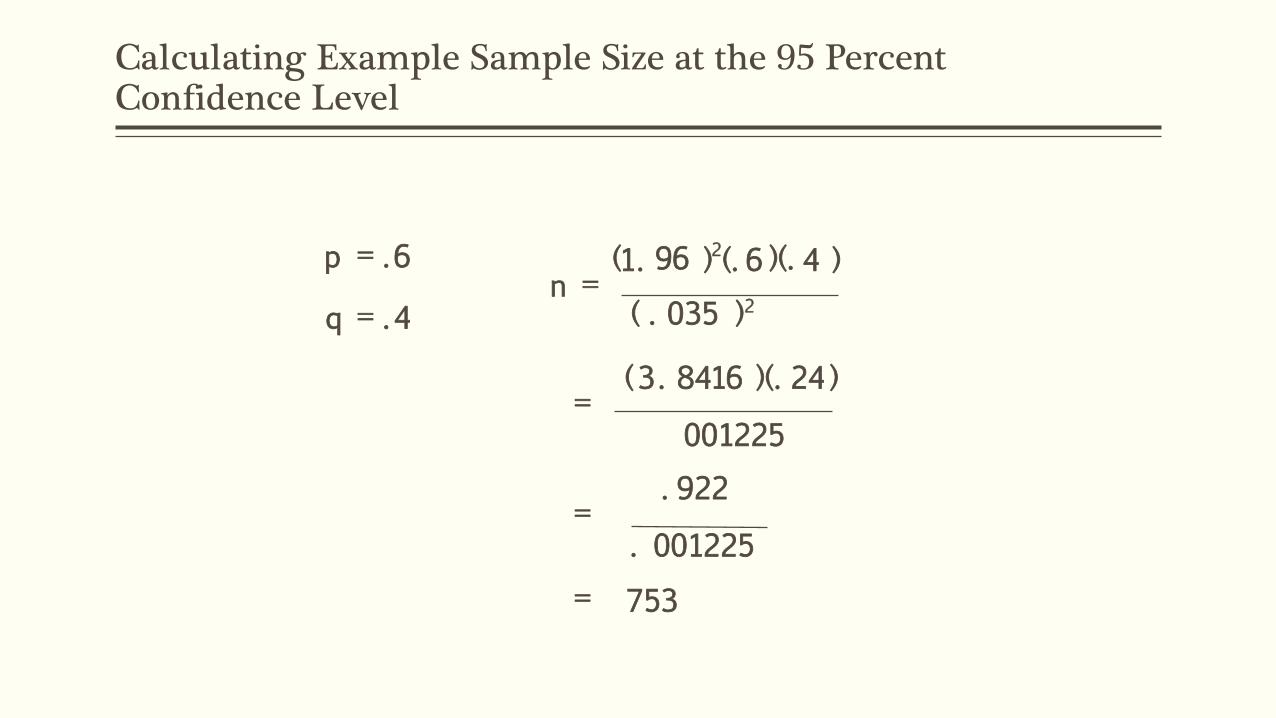
753=
001225.
922.=
001225
)24)(.8416.3(=
)035( .
)4)(.6(.)961. (n
4.q
6.p
2
2
==
=
Calculating Example Sample Size at the 95 Percent Confidence Level


![Election audits by sampling with probability proportional ...stark/Preprints/ppebwrwd08.pdf · unit sampling (MUS) or dollar unit sampling. See, e.g., [1, 3, 4, 8, 26].1 MUS is an](https://static.fdocuments.in/doc/165x107/5e5135898c65c218406a28fe/election-audits-by-sampling-with-probability-proportional-starkpreprintsppebwrwd08pdf.jpg)