Unit 2: Models, Censoring, and Likelihood for Failure-Time...
38
Unit 2: Models, Censoring, and Unit 2: Models, Censoring, and Likelihood for Failure Likelihood for Failure-Time Data Time Data Likelihood for Failure Likelihood for Failure-Time Data Time Data Notes largely based on “Statistical Methods for Reliability Data” by W.Q. Meeker and L. A. Escobar, Wiley, 1998 and on their class notes. Ramón V. León 8/21/2010 Stat 567: Unit 2 - Ramón V. León 1
Transcript of Unit 2: Models, Censoring, and Likelihood for Failure-Time...

Unit 2: Models, Censoring, and Unit 2: Models, Censoring, and Likelihood for FailureLikelihood for Failure--Time Data Time Data Likelihood for FailureLikelihood for Failure--Time Data Time Data
Notes largely based on “Statistical Methods for Reliability Data” by W.Q. y y QMeeker and L. A. Escobar, Wiley, 1998 and on their class notes.
Ramón V. León
8/21/2010 Stat 567: Unit 2 - Ramón V. León 1

Unit 2 ObjectivesUnit 2 ObjectivesUnit 2 ObjectivesUnit 2 Objectives Describe models for continuous
f il ti /di t ib tifailure-time processes/distributions◦ Time to failure
Describe models that we will use Describe models that we will use for the discrete data from these continuous failure-time processes/distributions◦ Data resulting primarily by interval
censoring i e failure times that one censoring, i.e. failure times that one knows that they felt in a interval Rounding
8/21/2010 Stat 567: Unit 2 - Ramón V. León 2

Unit 2 ObjectivesUnit 2 ObjectivesUnit 2 ObjectivesUnit 2 Objectives Describe common censoring mechanisms that
restrict our ability to observe all of the failure restrict our ability to observe all of the failure times that might occur in a reliability study◦ Right censoring: survival times, i.e., one only knows
h f il ld h d i l that a failure would have occurred past some survival (censoring) time.◦ Left censoring: one only knows that the failure
d b f ( i )tioccurred before some (censoring)time◦ Interval censoring: one only knows that the failure
occurred in an interval and not the exact time to failurefailure
8/21/2010 Stat 567: Unit 2 - Ramón V. León 3

Unit 2 ObjectivesUnit 2 ObjectivesD b h h Describe common censoring mechanisms that restrict our ability to observe all of the failure times that might occur in a reliability studyg y y
8/21/2010 Stat 567: Unit 2 - Ramón V. León 4

Typical FailureTypical Failure--Time Probability FunctionsTime Probability Functions
1.7( ) ( ) 1 exp( )F t P T t t
Cumulative Distribution FunctionT is a ( ) ( ) 1 exp( )
( )
F t P T t t
dF t
Probability Density Function
nonnegative, continuous random variable d ibi th.7 1.7( )( ) 1.7 exp( )dF tf t t t
dt
Survival Function
describing the failure-time process. The distribution for T
1.7( ) ( ) ( ) exp( )t
S t P T t f t dt t
Survival Function distribution for T
can be characterized by any of the
( ) ( )( ) f t f th t
Hazard Function
.71.7 t
any of the adjacent functions
8/21/2010 Stat 567: Unit 2 - Ramón V. León 5
( )( ) 1
h tS t F
1.7( )
tt
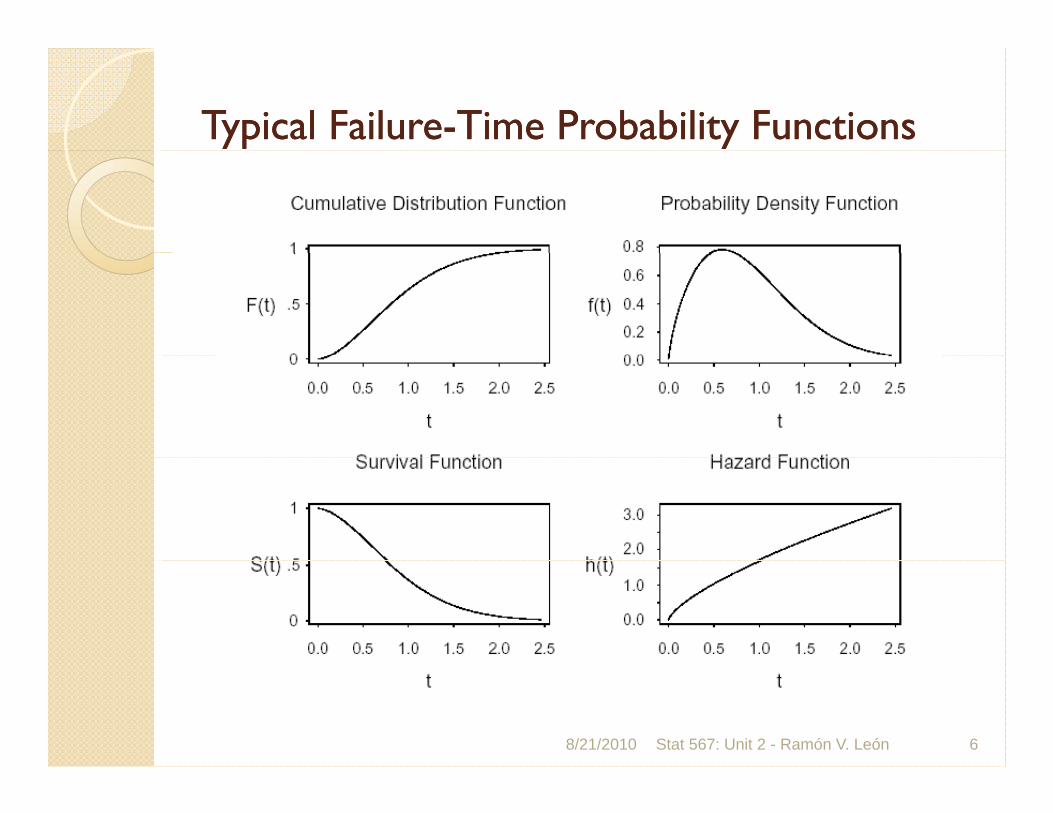
Typical FailureTypical Failure--Time Time Probability Probability FunctionsFunctions
8/21/2010 Stat 567: Unit 2 - Ramón V. León 6
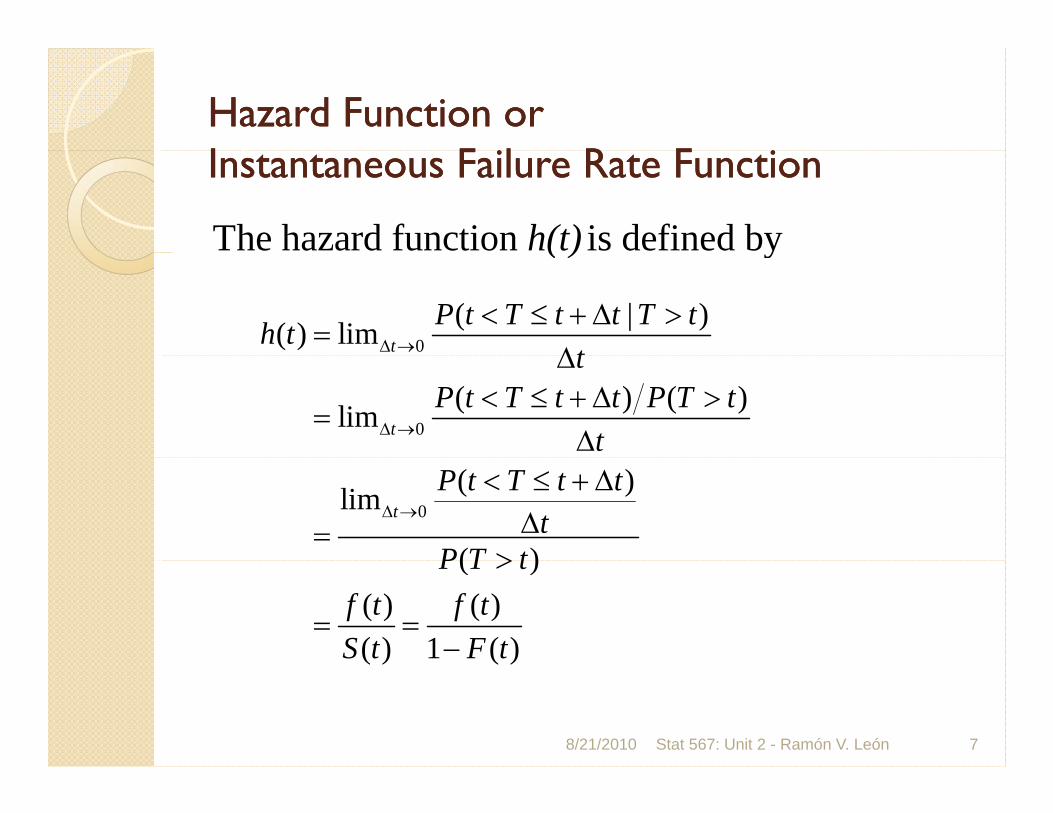
Hazard Function Hazard Function or or I I F il R F iF il R F iInstantaneous Instantaneous Failure Rate FunctionFailure Rate Function
The hazard function is defined byh(t) y( )
0( | )( ) lim t
P t T t t T th tt
0( ) ( )lim t
tP t T t t P T t
t
0( )lim
( )
tP t T t t
tP T t
( )
( ) ( )( ) 1 ( )
P T tf t f tS t F t
8/21/2010 Stat 567: Unit 2 - Ramón V. León 7
( ) ( )

CDF in Terms of the CDF in Terms of the Hazard Hazard Function Function
( )f0 0
( )( ) ( )1 ( )
Let ( ) ( ) so
t t f xH t h x dx dxF x
u F x du f x dx
( ) ( )
00
Let ( ) ( ) , so
( ) ln(1 ) ln 1 ( ) ln ( )1
F t F t
u F x du f x dxduH t u F t S t
u
0( ) 1 exp ( ) 1 exp ( )
tF t H t h x dx
0
8/21/2010 Stat 567: Unit 2 - Ramón V. León 8

Hazard Function Hazard Function or or Instantaneous Instantaneous Failure Rate FunctionFailure Rate Function
8/21/2010 Stat 567: Unit 2 - Ramón V. León 9

Engineers Interpretation of the Engineers Interpretation of the H d H d FFHazard Hazard FunctionFunction
The hazard function can be interpreted as a failure prate if there is a large number of items, say n(t), in operation at time t. Then
( ) ( ) Expected number of f il i ti ( )
n t h t t failures in time ( , )t t t
( ) Expected number of
failures per unit of time per unit at riskh t
8/21/2010 Stat 567: Unit 2 - Ramón V. León 10
failures per unit of time per unit at risk

FIT RateFIT RateFIT RateFIT Rate
A FIT rate is defined as the h d f f 1/h hazard function in units of 1/hours multiplied by 109multiplied by 10
8/21/2010 Stat 567: Unit 2 - Ramón V. León 11

Example 2 5 Example 2 5 Example 2.5 Example 2.5
165,000 copies of a componentp p Hazard rate constant over time at 15
FITs.s.◦ h(t)=15x10-9 failures per unit per hour for all
times t measured in units of hours.
A prediction for the number of failures from this component in 1 year (8760 from this component in 1 year (8760 hours) of operation is ◦ 15x10-9 x 165,000 x 8760 = 21 715x10 x 165,000 x 8760 21.7
8/21/2010 Stat 567: Unit 2 - Ramón V. León 12

Bathtub Curve Hazard FunctionBathtub Curve Hazard FunctionBathtub Curve Hazard FunctionBathtub Curve Hazard Function
8/21/2010 Stat 567: Unit 2 - Ramón V. León 13

Cumulative Hazard Function and Cumulative Hazard Function and A H d RA H d RAverage Hazard RateAverage Hazard Rate
8/21/2010 Stat 567: Unit 2 - Ramón V. León 14

Practical Interpretation of Average Practical Interpretation of Average H d RH d RHazard RateHazard Rate
2 1 1 2( ) ( ) ( )( ) F t F t P t T tAHR 2 1 1 21 2
2 1 2 1
( ) ( ) ( )( , )
if ( ) ( ) is small say less than 0 1
F t F t P t T tAHR t tt t t t
F t P T t
2 2if ( ) ( ) is small, say less than 0.1
I ti l
F t P T t
0
In particular,
( ) ( ) ( ) ( )th u du H t F t P T t0 ( ) ( ) ( ) ( )( ) = =
if ( ) ( ) is small say less than 0 1
H t F t P T tAHR tt t t t
F t P T t
8/21/2010 Stat 567: Unit 2 - Ramón V. León 15
if ( ) ( ) is small, say less than 0.1F t P T t
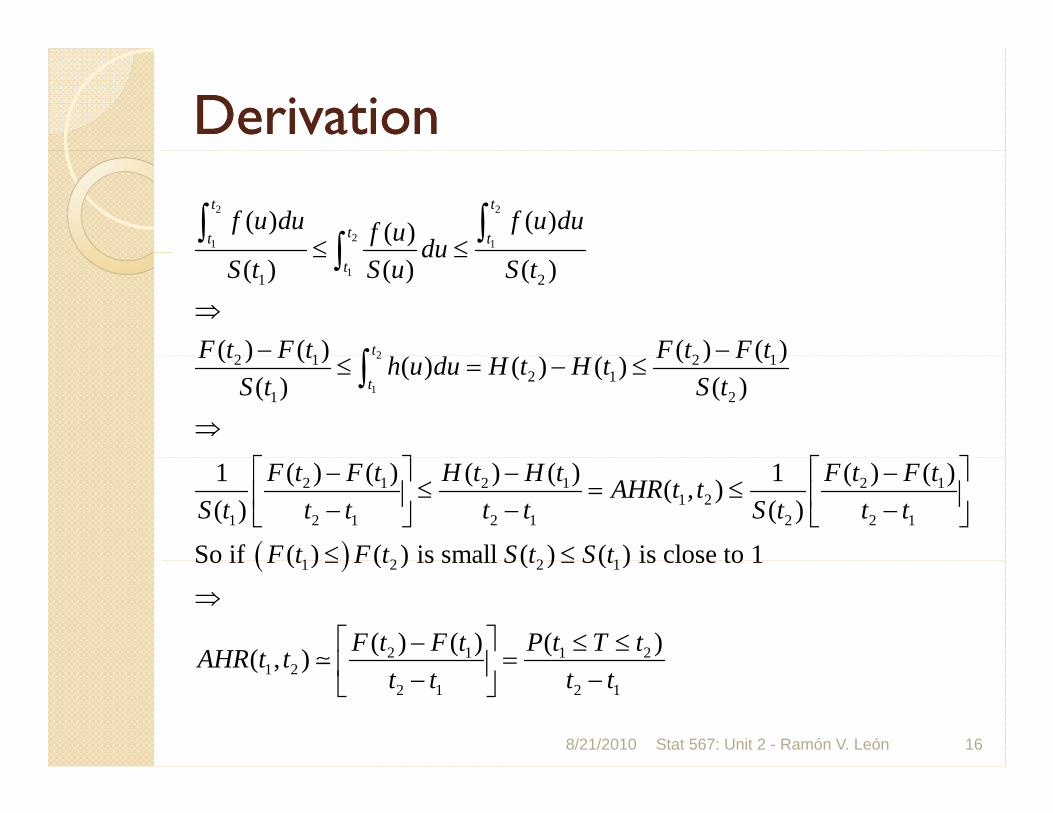
DerivationDerivation2 2
21 1
( ) ( )( )t t
tt tf u du f u duf u du
1
2
1 2
2 1 2 1
( ) ( ) ( )
( ) ( ) ( ) ( )
t
t
duS t S u S t
F t F t F t F t
2
1
2 1 2 12 1
1 2
( ) ( ) ( ) ( )( ) ( ) ( )( ) ( )t
F t F t F t F th u du H t H tS t S t
2 1 2 1 2 11 2
1 2 1 2 1 2 2 1
( ) ( ) ( ) ( ) ( ) ( )1 1( , )( ) ( )
So if
F t F t H t H t F t F tAHR t tS t t t t t S t t t
F
1 2 2 1( ) ( ) is small ( ) ( ) is close to 1t F t S t S t So if F 1 2 2 1
2 1 1 2
( ) ( ) is small ( ) ( ) is close to 1
( ) ( ) ( )( )
t F t S t S t
F t F t P t T tAHR t t
8/21/2010 Stat 567: Unit 2 - Ramón V. León 16
1 22 1 2 1
( , )AHR t tt t t t
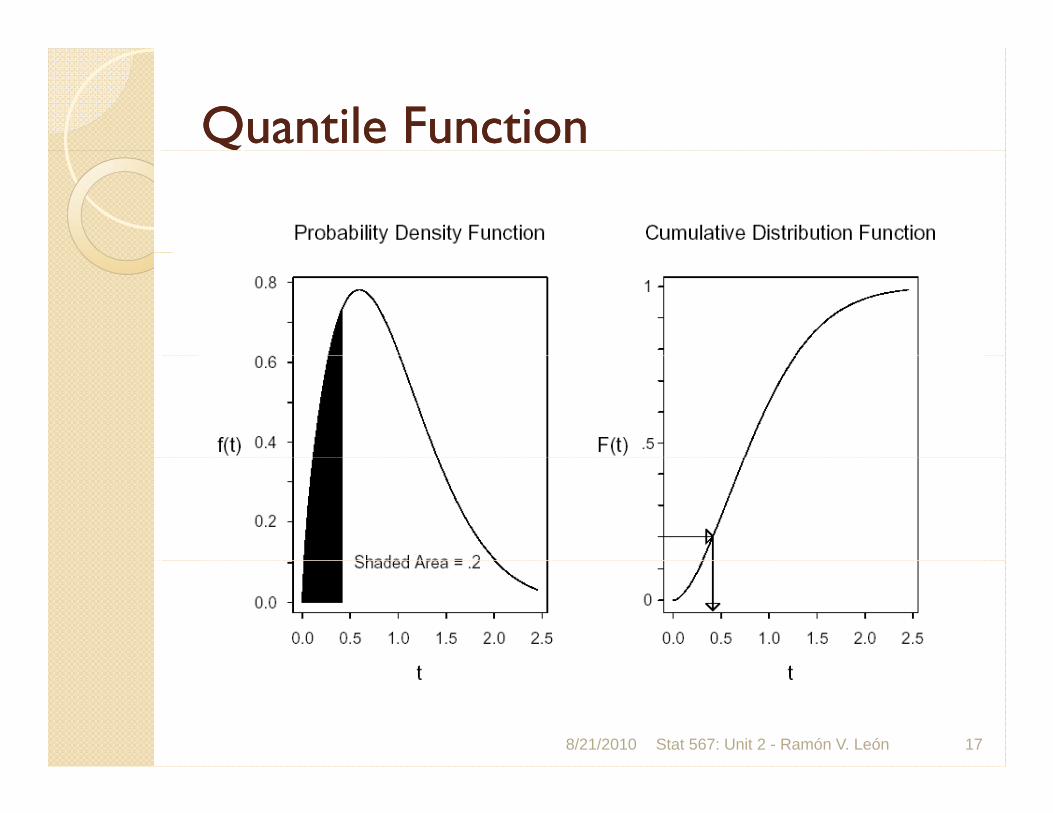
Quantile FunctionQuantile Function
8/21/2010 Stat 567: Unit 2 - Ramón V. León 17

Distribution QuantilesDistribution QuantilesDistribution QuantilesDistribution QuantilesThe quantile of is the smallest time such that pp F t
( ) ( ) , where 0 1p pP T t F t p p
p
tp
Stat 567: Unit 2 - Ramón V. León 18

Simple Quantile CalculationSimple Quantile CalculationSimple Quantile CalculationSimple Quantile Calculation
Example:
Terminology:Terminology:
8/21/2010 Stat 567: Unit 2 - Ramón V. León 19
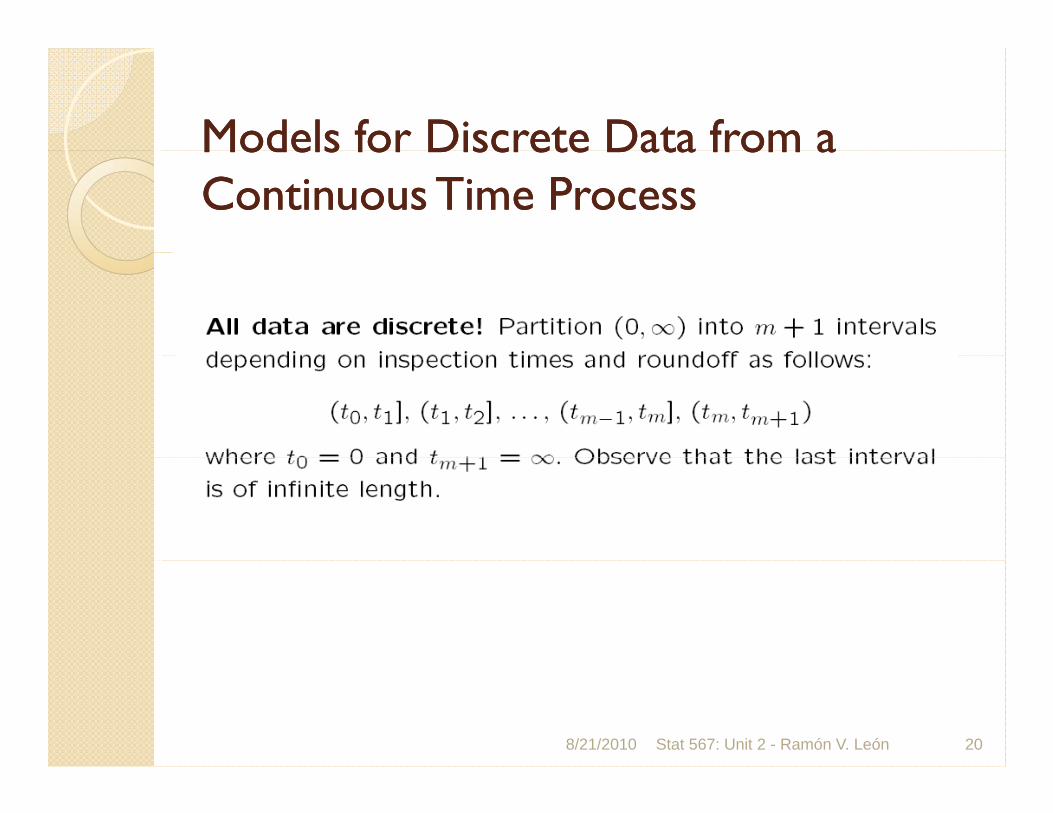
Models for Discrete Data from a Models for Discrete Data from a Models for Discrete Data from a Models for Discrete Data from a Continuous Time ProcessContinuous Time Process
8/21/2010 Stat 567: Unit 2 - Ramón V. León 20
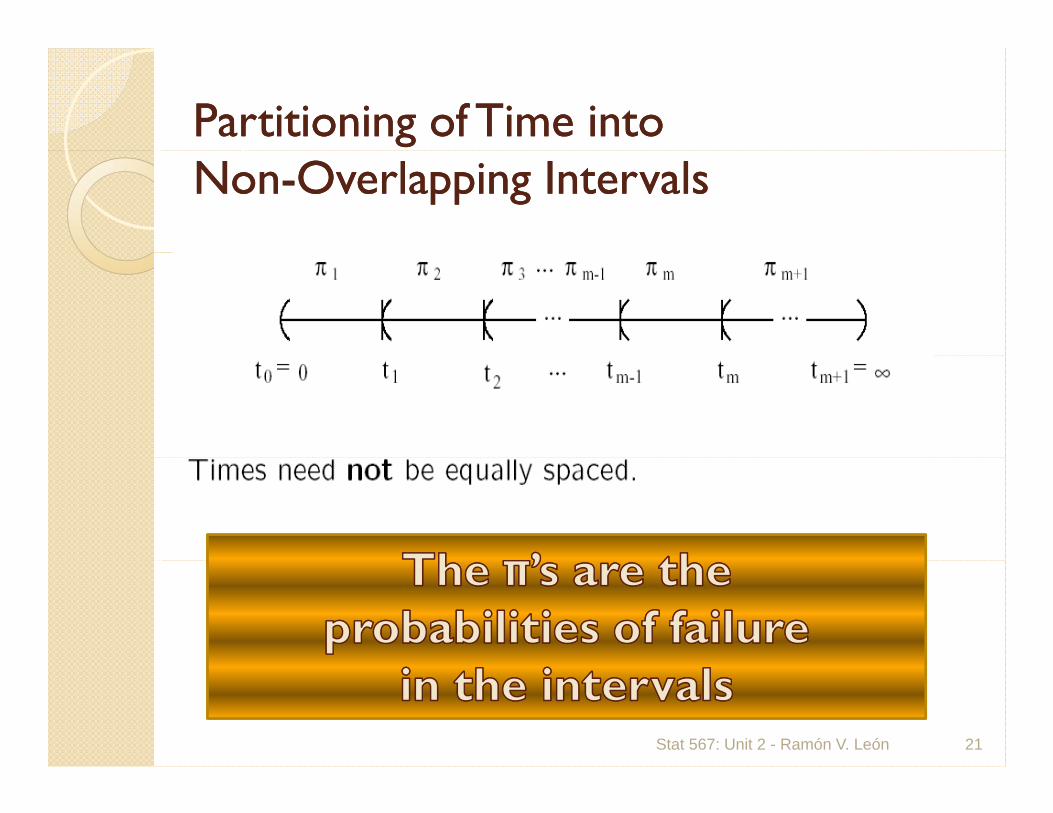
Partitioning of Time into Partitioning of Time into NonNon--Overlapping Overlapping IntervalsIntervals
Stat 567: Unit 2 - Ramón V. León 21
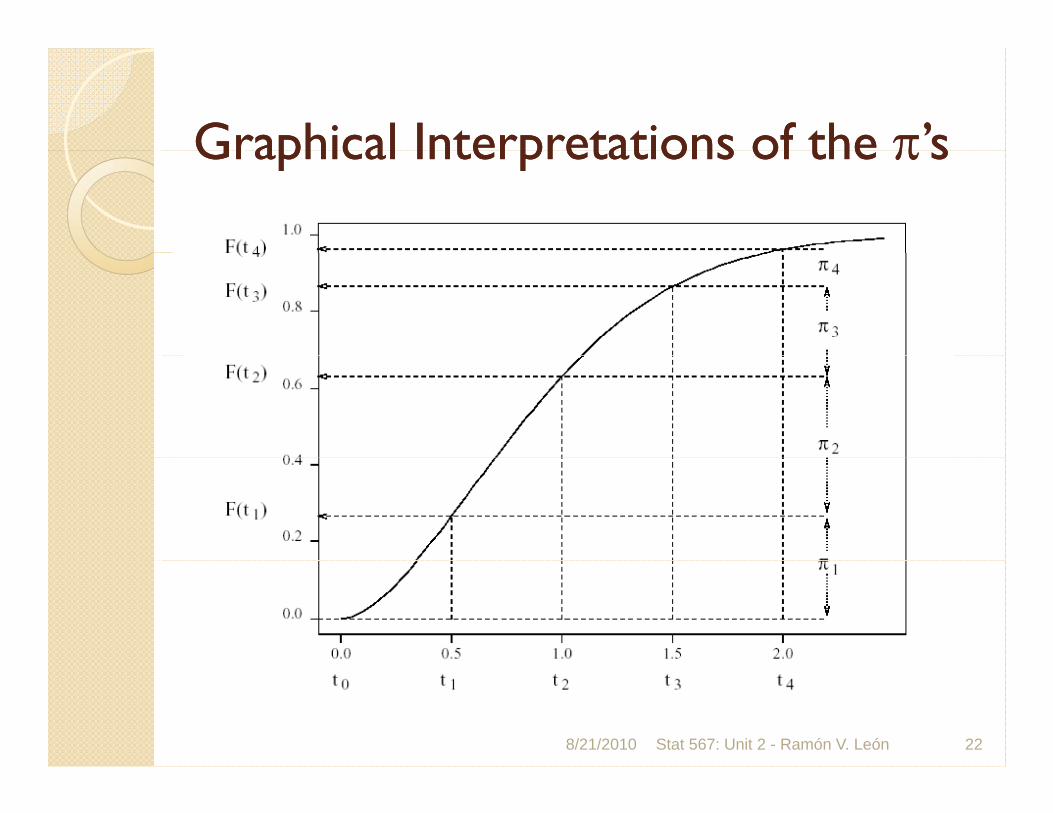
Graphical Interpretations of the Graphical Interpretations of the ’s’sGraphical Interpretations of the Graphical Interpretations of the ss
8/21/2010 Stat 567: Unit 2 - Ramón V. León 22
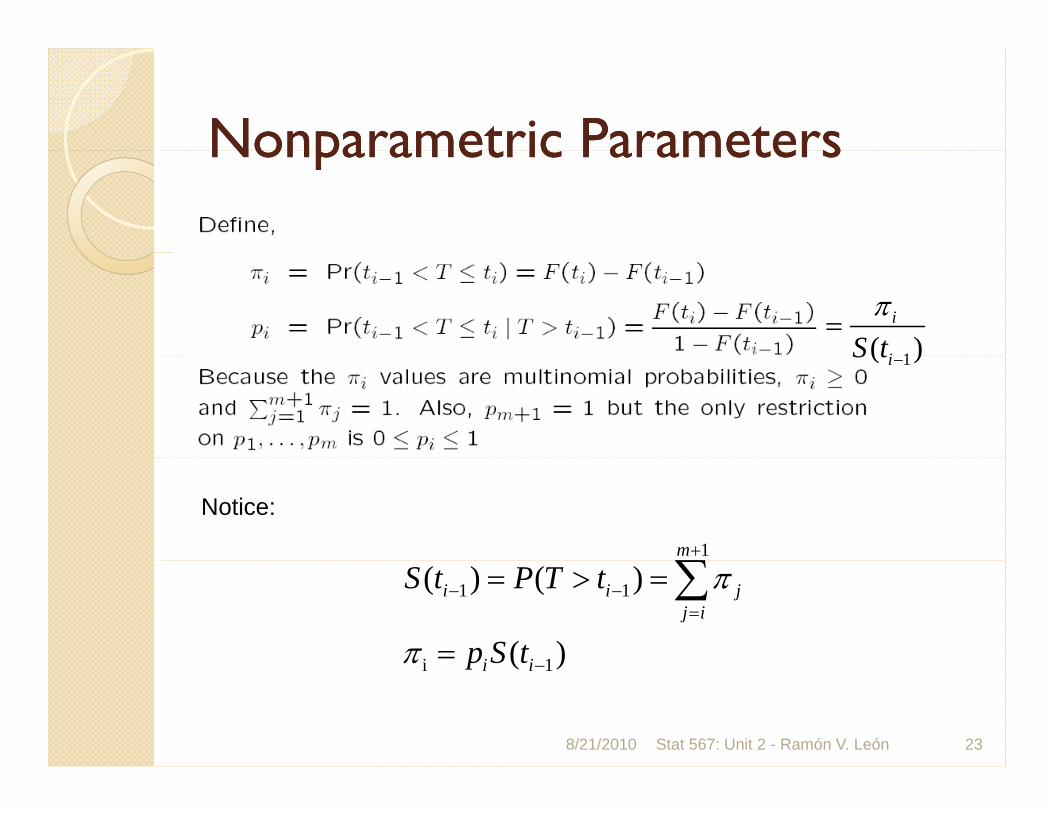
Nonparametric ParametersNonparametric ParametersNonparametric ParametersNonparametric Parameters
1( )i
iS t
1( )iS t
1m
Notice:
1 1
i 1
( ) ( )
( )
i i jj i
i i
S t P T t
p S t
8/21/2010 Stat 567: Unit 2 - Ramón V. León 23
i 1( )i ip S t

A Important DerivationA Important DerivationA Important DerivationA Important Derivation
( ) ( ) ( ) ( ) ( )S t S t F t F t p S t 1 1 1( ) ( ) ( ) ( ) ( )i i i i i i iS t S t F t F t p S t
1(1 ) ( ) ( )by induction
i i ip S t S t
( ) (1 ), 1,..., 1i
i jS t p i m 1j
8/21/2010 Stat 567: Unit 2 - Ramón V. León 24

Nonparametric ParametersNonparametric Parameters
Sincei
1
( ) 1 (1 ), 1,..., 1i
i jj
F t p i m
and
( )i
1
( ) , 1,..., 1
we view ( ) or ( )
i ij
F t i m
p p
p1 1 1 1we view ( ,..., ) or ( ,..., )
as the nonparametric parameters.m mp p p
Stat 567: Unit 2 - Ramón V. León 25

Example Calculation of the Example Calculation of the Nonparametric ParametersNonparametric ParametersNonparametric ParametersNonparametric Parameters
i
8/21/2010 Stat 567: Unit 2 - Ramón V. León 26
i
1( )ii
pS t

Examples of Censoring MechanismsExamples of Censoring Mechanismsp gp g
Censoring restricts our ability to observe T. Some sources of censoring are:
Fixed time to end test (lower bound on T for unfailed units)
Some sources of censoring are:
) Inspection times (upper and lower bounds on T) Staggered entry of units into service leads to multiple
censoringcensoring Multiple failure modes (also known as competing risks,
and resulting in multiple right censoring):◦ Independent failure modes (simple)Independent failure modes (simple)◦ Non independent failure modes (difficult)
Simple analysis requires i f ti i ti
8/21/2010 Stat 567: Unit 2 - Ramón V. León 27
non-informative censoring assumptions

Likelihood (Probability of the Data) as Likelihood (Probability of the Data) as Likelihood (Probability of the Data) as Likelihood (Probability of the Data) as a Unifying Concepta Unifying Concept
Likelihood provides a general and versatile method of estimation
Model/Parameters combinations with large likelihood are plausible
Allows for censored interval and truncated data Allows for censored, interval, and truncated data Theory is simple in regular models Theory more complicated in non-regular models (but
concepts are similar) Limitation: can be computationally intensive (still not
general software)g )
8/21/2010 Stat 567: Unit 2 - Ramón V. León 28

Determining the Likelihood Determining the Likelihood (P b b l f h D )(P b b l f h D )(Probability of the Data)(Probability of the Data)
The form of the likelihood will depend onThe form of the likelihood will depend on Question and focus of the study Assumed model Assumed model Measurement system (form of available data) Identifiability/parametrization Identifiability/parametrization
8/21/2010 Stat 567: Unit 2 - Ramón V. León 29

Likelihood Contributions for Different Likelihood Contributions for Different K d f CK d f CKinds of CensoringKinds of Censoring
8/21/2010 Stat 567: Unit 2 - Ramón V. León 30
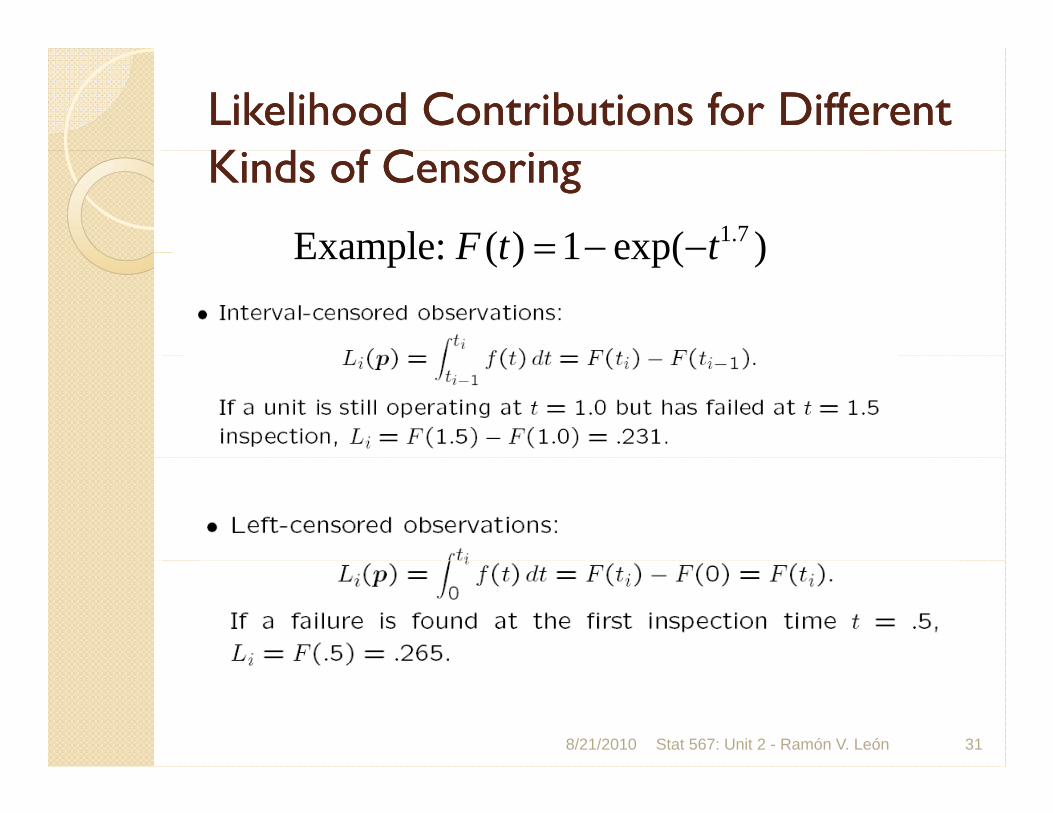
Likelihood Contributions for Different Likelihood Contributions for Different K d f CK d f CKinds of CensoringKinds of Censoring
1.7Example: ( ) 1 exp( )F t t Example: ( ) 1 exp( )F t t
8/21/2010 Stat 567: Unit 2 - Ramón V. León 31

Likelihood Contributions for Different Likelihood Contributions for Different K d f CK d f CKinds of CensoringKinds of Censoring
1.7Example: ( ) 1 exp( )F t tExample: ( ) 1 exp( )F t t
8/21/2010 Stat 567: Unit 2 - Ramón V. León 32
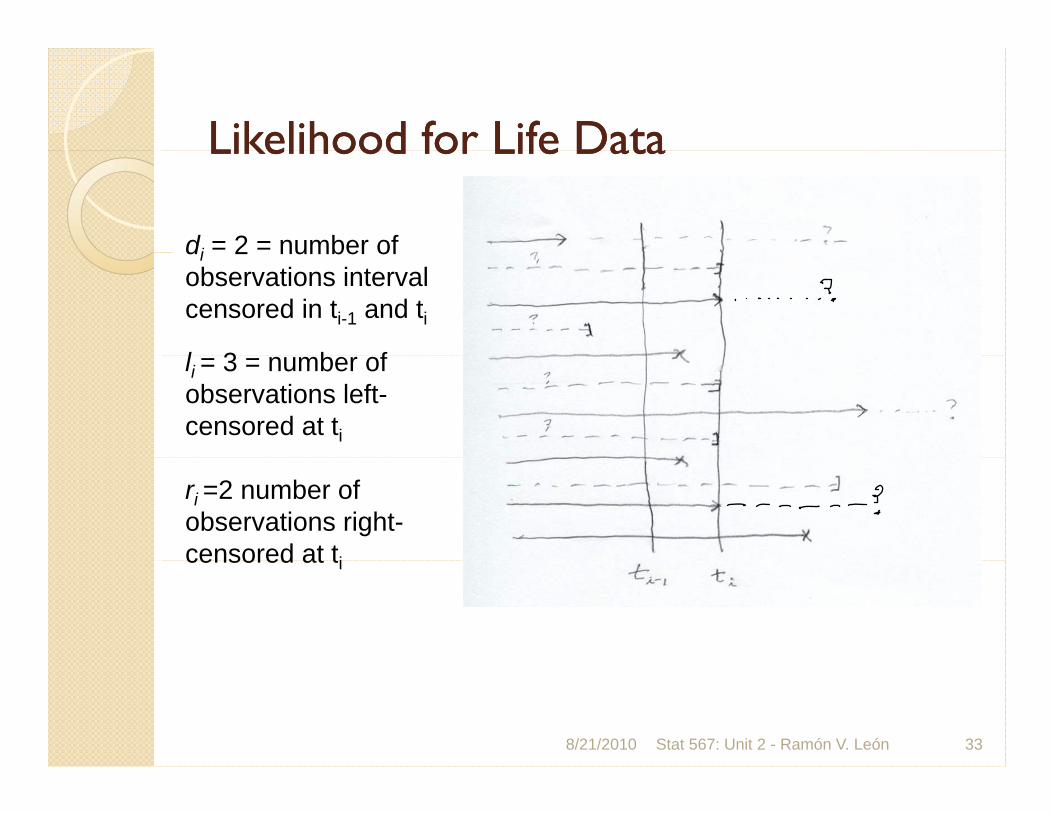
Likelihood for Life DataLikelihood for Life DataLikelihood for Life DataLikelihood for Life Data
di = 2 = number ofdi 2 number of observations interval censored in ti-1 and ti
l 3 b fli = 3 = number of observations left-censored at ti
ri =2 number of observations right-censored at ticensored at ti
8/21/2010 Stat 567: Unit 2 - Ramón V. León 33

Likelihood for Life Table DataLikelihood for Life Table Data
8/21/2010 Stat 567: Unit 2 - Ramón V. León 34

Likelihood: Probability of the DataLikelihood: Probability of the DataLikelihood: Probability of the DataLikelihood: Probability of the Data
8/21/2010 Stat 567: Unit 2 - Ramón V. León 35

Likelihood for Arbitrary Censored DataLikelihood for Arbitrary Censored Data
8/21/2010 Stat 567: Unit 2 - Ramón V. León 36

Likelihood for General Reliability DataLikelihood for General Reliability Datayy
8/21/2010 Stat 567: Unit 2 - Ramón V. León 37
Other Topics in Chapter 2Other Topics in Chapter 2Other Topics in Chapter 2Other Topics in Chapter 2
Random censoring Overlapping censoring intervals Likelihood with censoring in the intervals How to determine C How to determine C
8/21/2010 Stat 567: Unit 2 - Ramón V. León 38