Unit 1: Phenomenon – The Physics of Skydiving Lesson...
8
1 Unit 1: Phenomenon – The Physics of Skydiving Lesson 3b Newton’s Second Law of Motion California Standard Addressed PH1. Newton’s laws predict the motion of most objects. As a basis for understanding this concept: 1. c. Students know how to apply the law F = ma to solve one-dimensional motion problems that involve constant forces (Newton’s second law). Student Performance Outcomes Students will determine the acceleration of an object in an Atwood’s and Modified Atwood’s machine. Students will determine the net force exerted on an object in an Atwood’s and Modified Atwood’s machine. Students will graph and interpret the relationship between net force, mass and acceleration. DO NOT WRITE ON THIS HANDOUT Engage On an aircraft carrier, aircraft are attached to catapults, which give them the necessary acceleration to go from a standing position to 165 miles per hour (265.5 kph) in just two seconds. 1. What does the catapult exert on the plane? 2. Prepare a free body diagram for a plane accelerated by an aircraft carrier catapult. 3. Sketch the appearance of a position vs. time, velocity vs. time and acceleration vs. time graph for the jet (assume uniform acceleration). 4. If the mass of the plane were to be increased (ex. extra fuel tanks attached to wings), what affect do you think this would have on the acceleration of the plane? 5. If the catapult were to be given extra steam (increasing the force it exerts on the plane), what affect do you think this would have on the acceleration of the plane?
Transcript of Unit 1: Phenomenon – The Physics of Skydiving Lesson...
1
Unit 1: Phenomenon – The Physics of Skydiving Lesson 3b Newton’s Second Law of Motion California Standard Addressed PH1. Newton’s laws predict the motion of most objects. As a basis for understanding this concept:
1. c. Students know how to apply the law F = ma to solve one-dimensional motion problems that involve constant forces (Newton’s second law).
Student Performance Outcomes Students will determine the acceleration of an object in an Atwood’s and Modified Atwood’s machine. Students will determine the net force exerted on an object in an Atwood’s and Modified Atwood’s machine. Students will graph and interpret the relationship between net force, mass and acceleration.
DO NOT WRITE ON THIS HANDOUT
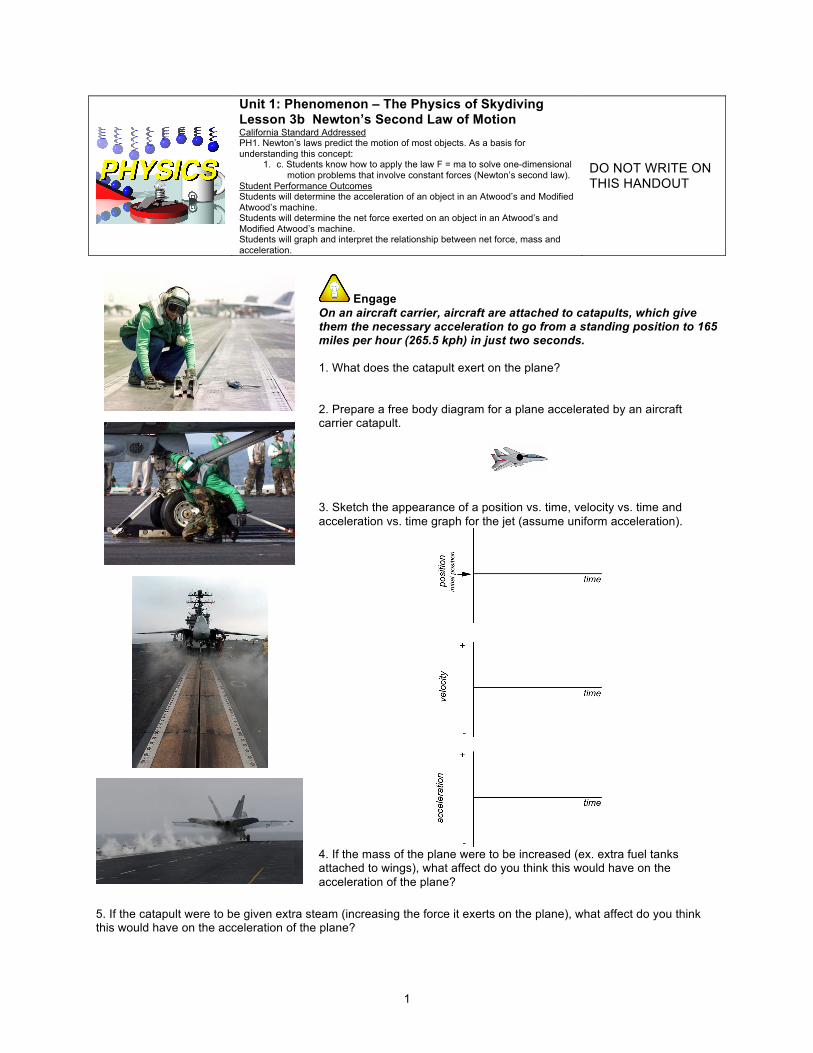
Engage On an aircraft carrier, aircraft are attached to catapults, which give them the necessary acceleration to go from a standing position to 165 miles per hour (265.5 kph) in just two seconds. 1. What does the catapult exert on the plane? 2. Prepare a free body diagram for a plane accelerated by an aircraft carrier catapult.
3. Sketch the appearance of a position vs. time, velocity vs. time and acceleration vs. time graph for the jet (assume uniform acceleration).
4. If the mass of the plane were to be increased (ex. extra fuel tanks attached to wings), what affect do you think this would have on the acceleration of the plane?
5. If the catapult were to be given extra steam (increasing the force it exerts on the plane), what affect do you think this would have on the acceleration of the plane?
2
Explore
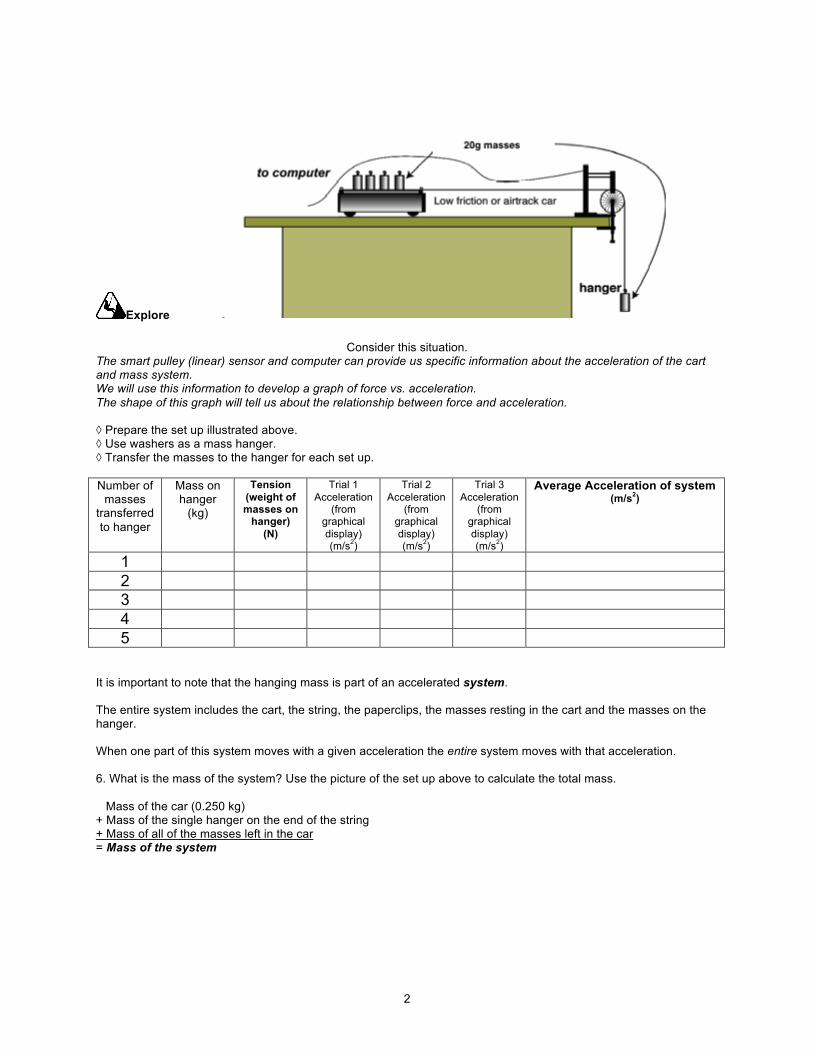
Consider this situation. The smart pulley (linear) sensor and computer can provide us specific information about the acceleration of the cart and mass system. We will use this information to develop a graph of force vs. acceleration. The shape of this graph will tell us about the relationship between force and acceleration. ◊ Prepare the set up illustrated above. ◊ Use washers as a mass hanger. ◊ Transfer the masses to the hanger for each set up. Number of
masses transferred to hanger
Mass on hanger
(kg)
Tension (weight of masses on
hanger) (N)
Trial 1 Acceleration
(from graphical display) (m/s2)
Trial 2 Acceleration
(from graphical display) (m/s2)
Trial 3 Acceleration
(from graphical display) (m/s2)
Average Acceleration of system (m/s2)
1 2 3 4 5
It is important to note that the hanging mass is part of an accelerated system. The entire system includes the cart, the string, the paperclips, the masses resting in the cart and the masses on the hanger. When one part of this system moves with a given acceleration the entire system moves with that acceleration. 6. What is the mass of the system? Use the picture of the set up above to calculate the total mass. Mass of the car (0.250 kg) + Mass of the single hanger on the end of the string + Mass of all of the masses left in the car = Mass of the system

3
Plot Acceleration (x axis) vs. Force (y axis) on the grid below. There is a reason for putting the force on the y-axis although it is the independent
variable. You will see in a minute.
7. On the grid above plot the points that represent the weight of the hanging masses (tension force) versus the acceleration of the system.
8. Draw a best-fit line that follows the trend of the resulting points on your graph.
9. Is the relationship between force (weight) and acceleration linear?
10. Describe the relationship between the force and the acceleration of the system. Is this a direct or an inverse proportion? Explain how you know.
11. Select two non-data points from the resulting best-fit line on your graph. Write these below in coordinate form [(x1, y1), (x2, y2)].
12. Calculate the slope of your best-fit line by using the two non-data points that you selected in number 11. Be sure to carry through with your units and to label your answer with the appropriate units.
€
slope = y2 - y1x2 - x1
=
13. What does the slope of your best-fit line correspond to? Hint: you just graphed the equation Fnet = ma and look at the units that you received for your answer to number 12.
4
14. Compare the slope of the line to the mass of the system. 15. If the force increases, what happens to the acceleration of the system?
Explore II Now it is your turn to design an experiment. In the previous set-up you explored the relationship between the net force acting on a system and the system’s acceleration. It is your task now to create an experiment to investigate the relationship between the mass of a system and its acceleration. Using the same equipment think of a set-up that will allow you to do that. Answer the following questions first.
16. a. Which variable will be your independent variable? b. Which variable will you measure (observe)? c. How will you take measurements? d. Which variables if any have to be kept constant? e. How often will you change the independent variable and how many trials will you perform? f. How will you present the data? g. How will you analyze your data?
17. Now state the specific question you are investigating.
18. Describe the set-up and write the instructions in your notebook.
19. Show any data tables.
20. Create any graphical representation appropriate to support your analysis of the data.
21. What is the relationship between the mass and the acceleration of a system?
Explain 22. Three students in your class have different ideas about the magnitude of forces and changes in velocity. Carefully read the student arguments and decide which statement is best supported by the evidence. Student A “ The size of an unbalanced force has no affect on the amount of acceleration experienced by an object. All that matters is that the force is unbalanced. If there is an unbalanced force, the object will experience acceleration.” Student B “ The bigger the pull or the push, the bigger the change in motion experienced by an object. There is a linear relationship between the size of the exerted force and the acceleration experienced by an object.” Student C “The amount of mass to be moved is also important. If the mass is increased and the force is kept steady, then the acceleration will decrease.”

5
Isaac Newton was the first to recognize that the acceleration of an object is directly proportional to the net force exerted on an object. This linear relationship, Newton’s Second Law of Motion, is defined in the following way:
Fnet = m • a Another way of stating this law is that the acceleration of an object is directly proportional to the net force exerted on it. This can also be stated in the following format.
From this way of writing Newton’s Second Law it becomes apparent that the mass and the acceleration of the system are inversely proportional if the net force is kept constant. A biography of Newton can be found at: http://www.maths.tcd.ie/pub/HistMath/People/Newton/RouseBall/RB_Newton.html
6
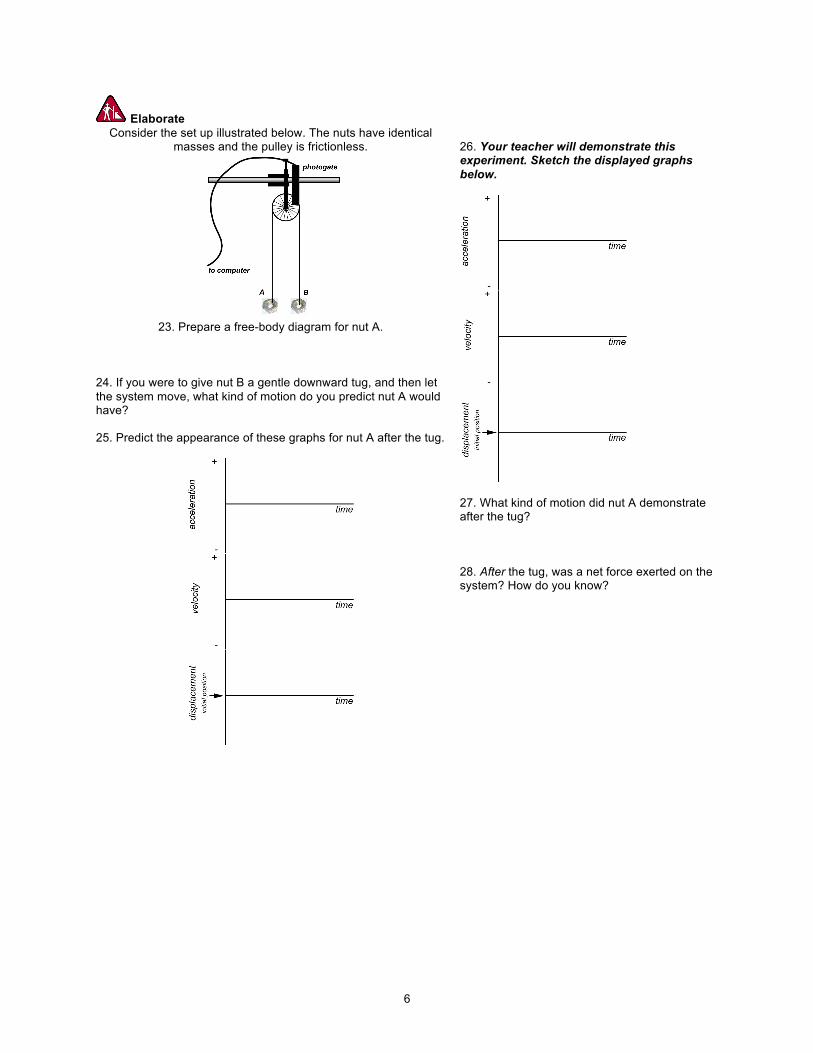
Elaborate
Consider the set up illustrated below. The nuts have identical masses and the pulley is frictionless.
23. Prepare a free-body diagram for nut A.
24. If you were to give nut B a gentle downward tug, and then let the system move, what kind of motion do you predict nut A would have? 25. Predict the appearance of these graphs for nut A after the tug.
26. Your teacher will demonstrate this experiment. Sketch the displayed graphs below.
27. What kind of motion did nut A demonstrate after the tug? 28. After the tug, was a net force exerted on the system? How do you know?

7
Consider the set up illustrated below. The nuts have identical
masses and the pulley is frictionless. The paperclip has a small, but significant mass.
28. Prepare a free-body diagram for nut A.
29. Suppose one of the masses was larger than the other, what kind of motion would you expect to see? Why? 30. If you were to release nut B, what kind of motion do you predict nut A would have? 31. Predict the appearance of these graphs for nut A after nut B is released.
32. Your teacher will demonstrate this experiment. Sketch the displayed graphs below.
33. What kind of motion did nut A have after nut B as released?

8
Evaluate 34. Summarize Newton’s Second Law. Answer the following questions. Include an explanation for your choices. Fe stands for “exerted force” and it refers to the applied force Fa. 35. This is a frictionless system. Select the best fee-body diagram for this situation.
a) b) c) d) e)
36. This is a frictionless system. What would an x vs.t graph look like for this system?
a) c) e)
b) d) 37. This is a frictionless system. Determine the acceleration rate for the block.
a) 0.5 m/s b) 0.5m/s2 c) 2.0 m/s d) 2.0m/s2
38. Select the best a free-body diagram for this situation.
a) b) c) d) e)
39. What would an x vs.t graph look like for this system?
a) c) e)
b) d) 40. Determine the acceleration rate for the block.
a) 0.5 m/s b) 0.5m/s2 c) 2.0 m/s d) 2.0m/s2
41. Select the best free-body diagram for the 3kg block.
a) b) c) d)