UNIQA Insurance Group AG Economic Capital and …€¦ · Economic Capital Ratio (ECR-ratio) stable...
26
UNIQA Insurance Group AG Economic Capital and Embedded Value 2017 12 April 2018 Kurt Svoboda, CFRO
Transcript of UNIQA Insurance Group AG Economic Capital and …€¦ · Economic Capital Ratio (ECR-ratio) stable...

UNIQA Insurance Group AG
Economic Capital and Embedded Value 2017
12 April 2018
Kurt Svoboda, CFRO

Executive Summary
Economic Capital position remains extraordinary strong
Economic Capital Ratio (ECR-ratio) stable at 210% (2016: 215%)
ECR allows for significant sovereign risk capital charge
Regulatory Capital Position significantly increased as at year-end 2017
Approval of Partial Internal Model Non-Life included in regulatory SCR-ratio
Regulatory Capital Ratio increased to 250% (2016: 202%)
Group Embedded Value (GEV) and New Business Value (NBV) further improved
GEV increased to EUR 5,140mn (+3%) driven by economic variance and
strong operating earnings, including an increased NBV to EUR 99mn
2

Economic Capital
Methodology
Results
Sensitivities and other analysis
Embedded Value
Methodology
Results
Sensitivities and other analysis
Appendix Assumptions
Glossary & Disclaimer
3

Group Economic Capital Figures Methodology
Disclosure of Economic Capital Model (ECM) results:
UNIQA discloses ECM results 2017 on the basis of the underlying and published methodology of
the Group Economic Capital Model
Economic capital is a key figure for steering the UNIQA Group
UNIQA discloses the own funds and Economic Capital Requirement (ECR) details by risk classes
All figures are disclosed after the risk absorbing effects of future discretionary benefits
Independent review of methodology, assumptions and calculations for economic capital calculation by
B&W Deloitte GmbH
Important valuation principles for the available own funds
Valuation of assets and liabilities based on EC Delegated Acts
Goodwill is set to zero according to EC specifications (EUR 296mn)
Market value of properties and loans replace the IFRS values
Participations are valued at market price as of 31.12.2017
Technical provisions and reinsurance recoverables are valued on a discounted best estimate basis
4

Group Economic Capital Figures Methodology
5
Based on SII standard
approach
Spread risk and concentration
risk are valued on the basis of
an internal approach
The underwriting risk of non-
life is valued on the basis of
UNIQA’s partial internal model
Correlation assumptions
equal to standard formula –
this does not apply to the
partial internal model where
internal coefficients are used
Underlying risk measure:
99.5% VaR (Value at Risk)
over a 1-year time horizon
UNIQA Group’s economic capital model Model details
Allowance for the risk absorbing effect of Future Discretionary Benefits (FDB)
Calculated with partial internal model
! Calculated according to UNIQA internal economic methodology
ECR
Basic ECR Operat. risk Adj (FDB und
DT)
Market Health Default Non-life Life Intang
= Basic ECR + Operat. risk – Adj.
Currency
Concentration
Revision
Mortality
Longevity
Disability
morbidity
Lapse
Expenses
CAT
Health CAT
Mortality
Longevity
Disability
morbidity
Lapse
Expenses
Revision
SLT Health Interest rate
Equity
Property
Spread
Premium &
Reserve
Lapse
NL CAT
Premium &
Reserve
Lapse
Non-SLT
Health
!
!

Economic Capital
Methodology
Results
Sensitivities and other analysis
Embedded Value
Methodology
Results
Sensitivities and other analysis
Appendix Assumptions
Glossary & Disclaimer
6

Group Capital Requirements Economic and Regulatory SII Capital Ratio
7
2016
2,699
2017
5,382
2,509
5,656
Own Funds Capital Requirement
EUR mn
ECR-ratio 215% 210%
Economic capital position
EUR mn
SCR-ratio 202% 250%
Preliminary Regulatory SII capital
position1
ECR SCR
Internal Model (Non-Life) Yes Yes2
Sovereign Risk Charge Yes (full loading) No
Volatility Adjustments Yes (static) Yes (static)
Transitionals3 No No
Matching Adjustment No No
Development of ECR-ratio
3 Applies to major transitionals on interest rate or technical provision
1 Audit on Solvency Financial Condition Report (SFCR) ongoing
161% 150%
182%
215% 210%
2012 2013 2014 2015 2016 2017
108% ECR-ratio
Measures used
2016
5,683
2017
5,241
2,589 2,274
2 Approved PIM NL applied for the first time as at 31.12. 2017

Group ECR Results Details on Economic Capital Ratio
43%
25%
32%
78%
8%
5%
7% 2%
69%
4%
10%
13%
4%
Non-Life
Health SLT
Life
CEE
WEM
AT
EEM
SEM
Health SLT / CAT
Non-Life underwriting
Life underwriting
Default risk
Market risk
8
Diversi-
fication
-796
Counter-
party
default
165
Health
CAT
& SLT
+110%
Own
funds
5.656
Tier 2
16,2%
Tier 3
0,1%
ECR
2.699
OpRisk
169
Tax Adj.
-496
Basic
ECR
3.026
161
Non-life
under-
writing
(PIM)
498
Life
under-
writing
384
Market
risk
2.613
274
-34 -93
60
217 191
8 9 28
-64
278
Moderate increase in ECR
Increase in market risk coming from
interest rate, spread and equity risk
(details slide 9)
Increase partially compensated by
reduction in counterparty risk (less
exposure, improved average rating)
and life underwriting risk (reduced
lapse risk)
Eligible own funds further increased
Strong operating earnings in Life and
Health alongside a positive economic
variance from increased interest rates
ECR split by LoB ECR split by Region1 ECR split by Risk Module
Change vs. 2016
1 Region WEM includes internal risk transfer to UNIQA Re and business in Liechtenstein
ECR development by Risk Module In EUR mn

Change vs. 2016
Group ECR Results UNIQA Group market risk profile
9
Property risk Interest
rate risk
Equity risk Currency risk Spread risk Conc. risk ECR market
risk total
Diversific.
495
481
589
1,357
394 117
2,613
-820
-8
132 90
-96
107 44
10
278
ECR market risk profile and development
ECR market risk increase was primarily driven by interest rate, spread and equity risk.
The rise in interest rate risk was caused by the increased (relative) interest rate shock as a consequence of higher EUR interest rates.
Additionally the use of a more advanced calibration of the volatility surface for changes in interest rates on the liability side (trad. life), which was
implemented in preparation for the PIM Market Risk.
The change in spread risk was a consequence of an increase of the spread sensitivity (increase of the modified duration).
Equity risk increased as a result of new investments in the UNIQA World Selection fund and an increase of the symmetric adjustment for equity
risk (counter-cyclical risk adjustment).
11% 12%
41% 40%
20% 17%
13% 14%
11% 14%
Spread risk
4%
2016
Interest rate risk
2017
3%
Equity risk
Property risk
Currency risk
Concentration risk
In EUR mn
% risk profile 64% 69%
EUR mn 2.335 2.613

Group ECR Results UNIQA Group underwriting risk profile
Key underwriting risks
Biometric risks still have minor relevance
Lapse risk remains a key issue for life
underwriting risk (mass lapse risk of losing
expected profits as relevant risk in contrast to
2016 with lapse decrease as relevant risk)
Measures
Ongoing In force management initiative
Further expense monitoring and cost
optimization
Key underwriting risks
Mass lapse scenario: lapses of highly
profitable business (higher expected profits
due to change to stochastic model and
refinement of profit sharing modelling)
Mortality: positive impact due to changed
management rules (premium adjustment)
Measures
Premium adjustments in case of negative
performance
Strict profitability monitoring of portfolio
Key underwriting risks
Property share increased because of
growing NatCat exposure
No relevant changes in other lines of
business
Measures
Optimization of pricing processes
Orientation on profitable lines of business
Life underwriting risk Health underwriting risk1 Non-life underwriting risk
58% 52%
24% 30%
8% 7%
5% 5%
3% 4%
1% 1%
Lapse risk
Expense risk
Longevity risk
Mortality risk
CAT risk
Disability risk
2017 2016
23% 24%
40%
48%
31%
24%
6%
Disability-Morbidity risk
Lapse risk
Mortality risk
Expense risk
2017
4%
2016
% risk profile 12% 10% 4% 4% 13% 13%
EUR mn 448 384 153 161 471 498
10
24%28%
23% 17%
14% 16%
10% 11%
9%10%
9%8%
4%
3%
4%
TP Liability
Motor TPL
Property
Other Insurance
Accident
Motor Hull
Transport
Legal Expenses
Technic
2017
3% 4%
2%
2016
1 ECR Health includes the ECR for Health SLT and Health CAT risk (Health NSLT is included in ECR-Non Life)

Economic Capital
Methodology
Results
Sensitivities and other analysis
Embedded Value
Methodology
Results
Sensitivities and other analysis
Appendix Assumptions
Glossary & Disclaimer
11

Group ECR Results Sensitivities
12
Impact of sensitivities on ECR-ratio
FX +10%
208%
206% FX -10%
173% Credit spread +100bps
Equity -30%
213%
198% UFR -100bps
Earthquake
210% 135%
No VA 207%
Interest rates +50 bps
210%
197%
Base Value
Interest rates -50 bps
225%
206%
Change in ECR-ratio
∆ to base value
+15%-p
-13%-p
-4%-p
+4%-p
-4%-p
-36%-p
-2%-p
-11%-p
-3%-p
Interest rate sensitivities: stress applied to non negative, liquid part of the curve only, extrapolation to UFR 4.2%
Equity sensitivity: a general decrease of 30% in the value of all equities.
Currency sensitivities: a rise/fall of exchange rates by 10% uniformly across all currencies.
Credit spread sensitivity: a widening of credit spreads by 100bps, no dynamic increase of volatility adjustment assumed.
Nat-CAT sensitivity: assumed earthquake with epicentre in Austria and return period of 250 years.
UFR sensitivity: UFR set to 3.2%. Estimated impact on ECR quota with UFR set to 4.05%: -2%-p and with UFR set to 3.9%: -3%-p.
No VA sensitivity: yield curve without volatility adjustment.

Group ECR Results IFRS reconciliation and economic value creation
IFRS reconciliation
Goodwill, value of business in force, deferred acquisition costs and intangible assets are valued at zero according to Solvency II.
Other revalued assets include property (appraisal value instead of amortized cost), participations (market value instead of IFRS book value) and loans.
Gross technical provisions and the reinsurer’s share of the technical provisions are revalued to discounted best estimate reserves.
Subordinated liabilities are subject to eligibility restrictions, depending on their quality (“Tiering”). All of UNIQA‘s subordinated liabilities are included in
eligible own funds.
Foreseeable dividends have to be subtracted from eligible own funds according to Solvency II.
13
Position 2017 2016
IFRS total equity 3.193 3.213
- Goodwill -296 -295
- Intangible assets and VBI -101 -62
- Deferred acquisition costs (DAC) -1.133 -1.135
+ Revaluation (after deferred taxes) 3.272 2.919
Revaluation of assets 1.095 1.266
Revaluation of technical provisions 2.177 1.653
+ Subordinated liabilities 915 929
- Foreseeable dividends -159 -151
- Capping of minority interests -36 -36
Economic own funds to cover ECR 5.656 5.382
IFRS reconciliation (EUR mn)

Economic Capital
Methodology
Results
Sensitivities and other analysis
Embedded Value
Methodology
Results
Sensitivities and other analysis
Appendix Assumptions
Glossary & Disclaimer
14

Group Embedded Value Methodology
15
Disclosure of Group Embedded Value (GEV) results:
UNIQA discloses GEV results 2017 on the basis of the Market Consistent Embedded Value
(MCEV) principles
Includes MCEV using bottom-up, market consistent methodology for main Life and Health
businesses
Split by the regions Austria and CEE*
Includes the further harmonization of methodologies under MCEV and Solvency II in 2017
Adjusted Net Asset Value (ANAV) for Property and Casualty, Life and Health businesses excluded from
scope of MCEV on the basis of adjusted IFRS equity
GEV allows for consolidation adjustments and minority interests and is defined as:
Adjusted net asset value for Property and Casualty, Life and Health businesses excluded from
scope of MCEV calculations
Plus MCEV
Independent review of methodology, assumptions and calculations for MCEV and calculations for GEV
by B&W Deloitte GmbH
* Defined as the following countries for MCEV purposes: Slovakia, Czech Republic, Hungary, Poland, Russia and Croatia

16
Economic Capital
Methodology
Results
Sensitivities and other analysis
Embedded Value
Methodology
Results
Sensitivities and other analysis
Appendix Assumptions
Glossary & Disclaimer

Group Embedded Value Results
17
Group Embedded Value 2017 In EUR mn
976
Group
Embedded
Value
5,140
P&C ANAV
1,792
Life & Health
MCEV
3,348
Value of
in-force
2,266
Adjusted Net
Asset Value
107
Change vs 2016 restated
246 289
-131
15943
GEV increased by +3.2% to EUR 5,140mn
2016 results are restated to reflect the inclusion of the Croatian Life operations in the covered business, the adoption of the Solvency II
risk margin, and a change to the minimum level of required capital
The increase in VIF is primarily due to a strong New Business Value, higher interest rates in the Eurozone and modelling changes
Return on GEV amounts to EUR 305mn or 6.3%
MCEV Performance
In EUR mn
441
128
305
90
Life&Health
Free Surplus Generation
Return on GEV
2017 2016 ** As % of adjusted opening GEV or opening L&H MCEV
as a %*
6.3%
3.0%
4.3%
9.6%
+3.2%

Group Embedded Value New Business Value
18
Positive development in CEE due to high sales for Russian personal loan product with strong margins
Improved profitability at Austria Life due to the sale of more profitable products and a lower commission strain for the traditional
business
New Business Value In EUR mn
99
84
2017
2016
NBV NBM
New Business Margin As a % of PVNBP
+3.9%
+4.5%
Split by region In EUR mn
2017 2016 restated
Austria CEE Total Austria CEE Total
NBV 76 24 99 69 15 84
PVNBP 1,777 421 2,199 1,834 339 2,173
% of
PVNBP 4.3% 5.7% 4.5% 3.8% 4.3% 3.9%
Present Value of NB Premiums In EUR mn
143
232
Recurring Premium Single Premium
2017 2,199 1,967
2016 2,173 2,031
** Restated
PVNBP split by LoB
42%
3% 16%
16%
22%
Health
Term
Unit linked
Capital efficient products
Guaranteed savings & annuities
* *

Group Embedded Value Life & Health Analysis of Change
19
Restatement and opening adjustments
include:
Inclusion of Croatian Life operations in
the covered business (EUR 66mn)
Adoption of the after-tax Solvency II risk
margin (EUR -82mn)
Capital and dividend flows (EUR
-48mn)
Foreign exchange variance (EUR 7mn)
Ongoing positive development of operating
earnings resulted in an increase of EUR
100mn
Positive modelling changes for the
Austrian Health business
Positive economic variance due to higher
interest rates in Eurozone
Free surplus 941 -63 878 -57 123 31 0 976
Required capital 27 87 114 0 -12 8 -4 107
Value of in-force business 2,107 -82 2,025 157 -11 97 -1 2,266
GEV / MCEV 3,075 -57 3,018 99 100 136 -5 3,348
99
136
Other non
operating variance
and closing
Adjustments
-57
MCEV as at
31-12-2017
MCEV as at
31-12-2016,
restated &
adjusted
3,018
69 Rollforward
MCEV as at
31-12-2016
reported
Restatement
& Adjustments
New Business
Value
31
Assumptions
and Variance
Other Operating
Earnings
Economic
Variance
3,075
100
-5
3,348

20
Economic Capital
Methodology
Results
Sensitivities and other analysis
Embedded Value
Methodology
Results
Sensitivities and other analysis
Appendix Assumptions
Glossary & Disclaimer
Group Embedded Value Life & Health Sensitivities
21
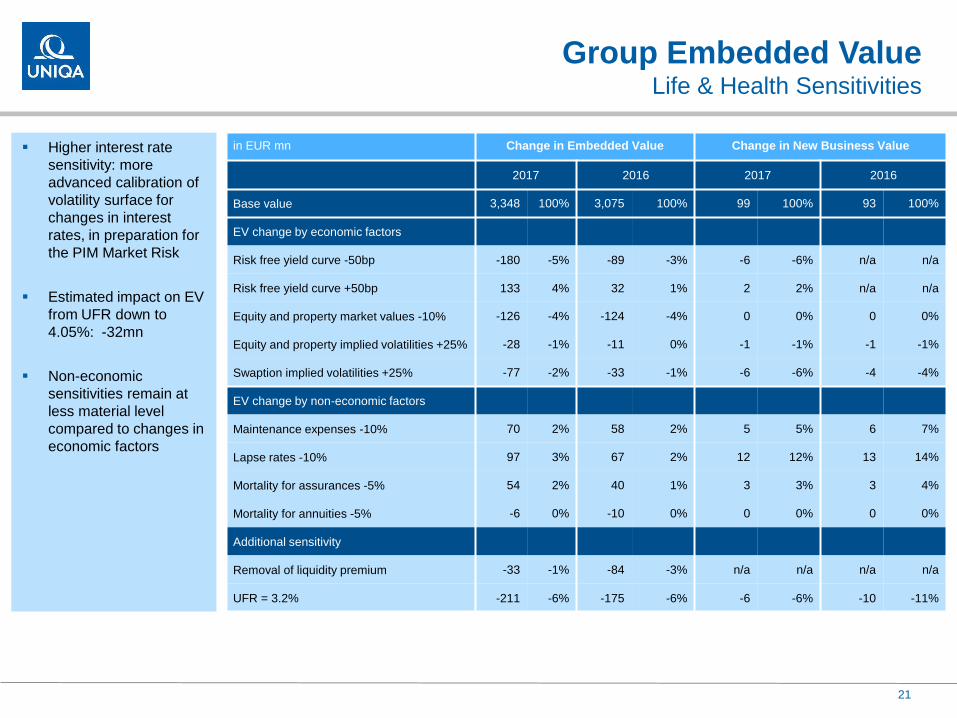
Higher interest rate
sensitivity: more
advanced calibration of
volatility surface for
changes in interest
rates, in preparation for
the PIM Market Risk
Estimated impact on EV
from UFR down to
4.05%: -32mn
Non-economic
sensitivities remain at
less material level
compared to changes in
economic factors
in EUR mn Change in Embedded Value Change in New Business Value
2017 2016 2017 2016
Base value 3,348 100% 3,075 100% 99 100% 93 100%
EV change by economic factors
Risk free yield curve -50bp -180 -5% -89 -3% -6 -6% n/a n/a
Risk free yield curve +50bp 133 4% 32 1% 2 2% n/a n/a
Equity and property market values -10% -126 -4% -124 -4% 0 0% 0 0%
Equity and property implied volatilities +25% -28 -1% -11 0% -1 -1% -1 -1%
Swaption implied volatilities +25% -77 -2% -33 -1% -6 -6% -4 -4%
EV change by non-economic factors
Maintenance expenses -10% 70 2% 58 2% 5 5% 6 7%
Lapse rates -10% 97 3% 67 2% 12 12% 13 14%
Mortality for assurances -5% 54 2% 40 1% 3 3% 3 4%
Mortality for annuities -5% -6 0% -10 0% 0 0% 0 0%
Additional sensitivity
Removal of liquidity premium -33 -1% -84 -3% n/a n/a n/a n/a
UFR = 3.2% -211 -6% -175 -6% -6 -6% -10 -11%

22
Economic Capital
Methodology
Results
Sensitivities and other analysis
Embedded Value
Methodology
Results
Sensitivities and other analysis
Appendix Assumptions
Glossary & Disclaimer

Economic Assumptions MCEV and ECR
23
Consistent assumptions for MCEV and ECR valuation
Reference rates based on swap rates as at 31 December 2017 including a liquidity premium (volatility
adjustment). The liquidity premium is derived from observable market data and based on the approach
used for internal risk capital calculations
The 2017 calibration of the economic scenarios is based on (normal) implied volatilities
Reference
rates(a)
EUR CZK HUF PLN RUB HRK
2017 2016 2017 2016 2017 2016 2017 2016 2017 2016 2017 2016
1 year -0.36% -0.30% 0.98% 0.06% 0.01% 0.26% 1.40% 1.48% 7.47% 10.12% 0.20% 0.74%
5 years 0.21% -0.02% 1.53% 0.41% 1.08% 1.69% 2.57% 2.84% 7.21% 8.74% 1.36% 2.37%
10 years 0.80% 0.57% 1.76% 0.77% 2.06% 3.03% 3.21% 3.55% 7.19% 8.22% 2.38% 2.97%
15 years 1.18% 0.96% 1.95% 1.01% 2.97% 3.74% 3.27% 3.79% 6.93% 7.70% 2.75% 3.17%
20 years 1.36% 1.12% 2.21% 1.33% 3.49% 4.09% 3.37% 3.90% 6.58% 7.19% 3.00% 3.33%
25 years 1.65% 1.42% 2.47% 1.71% 3.74% 4.22% 3.48% 3.97% 6.26% 6.76% 3.18% 3.45%
(a) Excluding liquidity premium
Liquidity premium in bp EUR CZ HU PL RUB HRK
Base premium – 100% 6 6 3 17 0 6
Participating life business – 65% 4 4 2 11 0 4
Unit and index linked business –
65% 4 4 2 11 4
Health business – 65% 4
Exchange rates and
tax rates
Exchange rate Tax rate
2017 2016 2017 2016
Austria - - 25.00% 25.00%
Czech Republic 25.54 27.02 19.00% 19.00%
Hungary 310.33 309.83 9.00% 9.00%
Slovakia - - 21.00% 22.00%
Poland 4.18 4.41 19.00% 19.00%
Russia 69.39 64.30 20.00% 20.00%
Croatia 7.44 n/a 18.00% n/a
Other economic assumptions (EUR) 2017 2016
Interest rate volatility(a)
- Black
- Normal
n/a
65 bp
45%
73 bp
Equity volatility(b) 21.50% 23.07%
Expense/medical inflation 2%/2% 2%/2%
(a) 10 to 10 implied swaption volatility
(b) 10 years

Economic Capital Methodology
Results
Embedded Value
Methodology
Results
Sensitivities and other analysis
Appendix Assumptions
Glossary & Disclaimer
24

Glossary
ABS Asset Backed Securities
ALM Asset Liability Management
ANAV Adjusted Net Asset Value
CAT Catastrophe Risk
CDR Counterparty Default Risk
EC European Commission
ECM Economic Capital Model: UNIQA‘s approach for calculating a SCR based on the standard
approach with deviation of the technical specifications in respect of the treatment of EU
government bonds and Asset Backed Securities and with inclusion of PIM
ECR Economic Capital Requirement: risk capital requirement resulting from the Economic Capital Model
EV, GEV Embedded Value, Group Embedded Value
FS Free Surplus
Health SLT Health Similar to Life Techniques (long term health business)
IFRS International Financial Reporting Standards: set of accounting standards, developed and
maintained by the International Financial Reporting Standards Board (IASB) with the intention of
assuring standardisation of financial statements across the market
IRR Internal Rate of Return
MAT Marine, Aviation, Transport
MCEV Market Consistent Embedded Value: measure of the consolidated value of shareholders’ interests in the covered
business
NB-RC New Business Required Capital
PIM Partial Internal Model (UNIQA‘s internal model for the calculation of the non-life and health NSLT underwriting risk)
Regions AT – Austrian Operating Companies,
WEM - Western European Markets (Liechtenstein, Italy, Switzerland),
CEE – Central Eastern Europe (Slovakia, Czech Republic, Hungary, Poland),
SEE – Southern Eastern Europe (Croatia, Serbia, Bosnia, Bulgaria),
EEM – Eastern Emerging Markets (Romania, Russia, Ukraine)
S&P Standard & Poor‘s Financial Services LLC, a part of McGraw Hill Financial
VaR Value at Risk: risk measure used within UNIQA‘s partial internal model for deriving the capital
requirement for the non-life and health NSLT underwriting risk
VIF Value of in-force business
VNB New Business Value
25

Disclaimer Cautionary statement regarding forward looking statements
This presentation contains forward-looking statements
Forward-looking statements involve inherent risks and uncertainties, and it might not be
possible to achieve the predictions, forecasts, projections and other outcomes described
or implied in forward-looking statements
A number of important factors could cause results to differ materially from the plans,
objectives, expectations, estimates and intentions expressed in these forward-looking
statements
These forward-looking statements will not be updated except as required by applicable
laws
26