Unions and Collective Bargaining in the Wake of the Great ...
35
UNIONS AND COLLECTIVE BARGAINING IN THE WAKE OF THE GREAT RECESSION Working Papers 2015 John T. Addison | Pedro Portugal | Hugo Vilares 6
Transcript of Unions and Collective Bargaining in the Wake of the Great ...

UNIONS AND COLLECTIVE BARGAINING IN THE WAKE OF THE GREAT RECESSION
Working Papers 2015John T. Addison | Pedro Portugal | Hugo Vilares
6


UNIONS AND COLLECTIVE BARGAINING IN THE WAKE OF THE GREAT RECESSION
Working Papers 2015
John T. Addison | Pedro Portugal | Hugo Vilares
Lisbon, 2015 • www.bportugal.pt
6
April 2015The analyses, opinions and findings of these papers represent the views of the authors, they are not necessarily those of the Banco de Portugal or the Eurosystem
Please address correspondence toBanco de Portugal, Economics and Research Department Av. Almirante Reis 71, 1150-012 Lisboa, PortugalT +351 213 130 000 | [email protected]

WORKING PAPERS | Lisbon 2015 • Banco de Portugal Av. Almirante Reis, 71 | 1150-012 Lisboa • www.bportugal.pt •
Edition Economics and Research Department • ISBN 978-989-678-341-9 (online) • ISSN 2182-0422 (online)

1
Unions and Collective Bargaining in the Wake of the Great Recession
John T. Addison,* Pedro Portugal,** and Hugo Vilares***
*Department of Economics and Finance, Durham University Business School, Department of Economics, Moore School of Business, University of South Carolina, and IZA Bonn **Banco de Portugal, Faculdade de Economia, Universidade Nova de Lisboa, and IZA Bonn ***Banco de Portugal
Abstract
This paper provides the first definitive estimates of union density in Portugal, 2010-2012, using a unique dataset. The determinants of union density at firm level are first modeled. Next, estimates of the union wage gap are provided for different ranges of union density. Since these estimates fully reflect the reality of an industrial relations system in which collective agreements are extended to nonunion workers and firms, the final issue examined is contract coverage. The pronounced reduction in the number of industry-wide agreements and extension ordinances in recent years has been uncritically equated with a fall in coverage. However, the authors show that the number of workers covered by new and existing agreements has remained largely unaffected by economic crisis. The reduced frequency of new agreements and extensions is instead attributed to downward nominal wage rigidity in deflationary times, rather than (as yet) the expression of a crisis in collective bargaining.
JEL Classification: J31, J52, J53 Keywords: collective bargaining, union density, union wage premium, collective agreement coverage, nominal wage rigidity, Portugal

2
Portugal is one of a large number of countries where there are no published statistics on union
density. The consequence is that prior estimates of union density for Portugal are little more than
informed guesstimates. Fortunately, a solution to this problem has recently become available
with the publication of the Relatório Único, or Single Report, conducted by the Office for
Strategy and Planning (GEP) in the Ministry of Solidarity, Employment and Social Security.
That is, we can now derive estimates of union density for the years 2010 through 2012. We
provide the first estimates for Portugal using these new data. Even if there has occurred a steady
erosion in union representation since 1980, we report broad stability over this three-year period
and an average density of somewhat less than 11 percent. For its part, collective agreement
coverage hovers either just above or below 90 percent over the same interval. The extension
phenomenon that helps explain this disparity is addressed throughout the paper.
Having used the new data to provide economy-wide statistics on density, our cet. par.
analysis then examines the determinants of density using all three years of data and a zero
inflated negative count model in which the dependent variable is the number of unionized
workers at firm level, given that some firms have no union employees. Among other things, we
report that union density is highest in sectors and activities sheltered from product market
competition.
The second part of our analysis presents a stylized version of a recent investigation into
the union premium (see AUTHOR A, 2014). That study explores a high-dimensional fixed
effects regression model and then offers a smoothed nonlinear function relating wages to union
density at firm level. Our modification simply collapses that nonlinear relationship into five
union density intervals.
As noted earlier, collective agreement coverage rates approximate 90 percent in Portugal
by virtue of extension arrangements, whereby at the request of the union or the employer side the
government has historically extended the terms of new agreements to the entire sector.
Familiarly, such arrangements buttress union power in the marketplace by placing a floor under
competition, and they also promote wage inflexibility/nominal wage rigidity through the setting
of around 30,000 wage floors (see Martins, 2014).
One aspect of European crisis management affecting Portugal has been the joint therapy
of fiscal consolidation and structural reforms geared to improving labor market competitiveness.

3
The driving force behind these developments has been the Troika (comprising the European
Commission, the European Central Bank, and the International Monetary Fund), which has
linked the granting of loans and purchase of government bonds to the implementation of
extensive structural reforms. The chief structural reforms sought by the Troika have included
greater decentralization of collective bargaining, derogations from industry agreements at
workplace level, close attention to what countries can afford in setting national minimum wages
(i.e. linking increases to broad competitiveness and efficiency audits), and cutting back on
extension agreements. In its dealings with the Troika in 2011, as we shall see, the Portuguese
government agreed to a number of such measures. Most notably from the perspective of the
present paper, extension agreements were initially frozen and the procedures for such extension
subsequently reset by the government. (Additionally, any increase in the nation-wide minimum
wage was meant to be made conditional on economic and labor market developments.)
At first sight, the data seem to suggest that the government measures on extension
agreements have had a distinct chilling effect on collective bargaining. Thus, the number of new
agreements has fallen dramatically and with them the number of extension agreements. (We
trace the trends in new agreements and new extensions from 2008 to 2012.) It is just a short step
to argue – as have a number of observers – that Portuguese collective bargaining is in crisis
mode, in part because the collective bargainers are unwilling to enter into new agreements that
will not be extended. But we choose instead to focus on the fact that, although new agreements
have stalled, coverage under existing agreements (and operational extensions) has remained
basically unchanged. Furthermore, since under law, new agreements cannot be less favorable to
employees than the agreements they succeed, the decline in new agreements is less to be
construed as a crisis in collective bargaining than of the difficulty in securing increases in
nominal wages (that are admittedly less likely to be extended) in a deflationary environment.
Real wages are not declining enough. In short, we can interpret fewer agreements and extensions
as associated with downward nominal wage rigidity rather than the “upward nominal wage
rigidity” experienced in more normal times. Upward nominal wage rigidity refers to the notion
that in normal times many firms are obliged to increase the wages of their workers either through
the extension of collective wage agreements or hikes in the minimum wage (see Martins,
Guimarães, and Portugal, 2014).
The three themes of the paper are, therefore, union density and its determinants, the

4
magnitude of the union wage gap, and collective bargaining coverage to include the implications
of the sharp reduction in the frequency of new collective agreements and their extension. The
plan of the paper is as follows. First, we provide a review of the Portuguese collective bargaining
framework. Second, we describe the main datasets used in this inquiry and the base elements of
the modeling strategy. Third, we present some introductory descriptives followed by the main
findings of the paper. A short summary concludes.
The Bargaining Framework Portuguese law makes provision for three types of collective bargaining at national, regional, and
local level, although as we shall see it is the case that contemporary wage setting has been
dominated by the widespread use of administrative instruments such as government extensions
of agreements entered into by the bargaining parties. First, there is a modicum of firm-level
bargaining signed by an individual company and one or more unions, resulting in so-called
Acordos de Empresa (or AEs) that are important in the oil sector and transport and
communications. Somewhat more important in terms of direct impact are collective agreements
signed by several employers that are not part of an employers’ association and one or more trade
unions, known as Acordos Colectivos de Trabalho (or ACTs), that are significant in the financial
sector and utilities. However, it is industry-level/branch or sectoral agreements, so-called
Contratos Colectivos de Trabalho (CCTs), negotiated between one of more employers’
associations and one or more unions, that predominate. As a result, CCTs in conjunction with
extension agreements that are very largely are based on them (the other option is to extend
ACTs) explain levels of collective bargaining coverage in the order of 90 percent of workers
despite a marked decline in union density that the literature suggests extends back over 30 years
(see Schnabel, 2013; Visser, 2013) and that we now estimate at around 11 percent. The vast
majority of agreements are signed by unions linked to the two major union confederations: the
CGPT-IN or General Confederation of Portuguese Workers, and the UGT or General Workers’
Union. The gaps in coverage are largely in personal and other services, and in public
administration where despite centralized negotiations between the government and the trade
unions wages are decided upon unilaterally by the government. The wages of employees in
publicly-controlled companies, such as public transportation and the postal service, are
collectively bargained in the normal way.
5
The industry-level or sectoral agreements may cover a range of industry-specific
occupations but as the system does not rule out parallelism or overlapping collective agreements
a single enterprise may be covered by two or more agreements depending on the union affiliation
of the workers (although as a practical matter the content of most of the agreements is similar,
the respective tables of wages tending to be the same). The situation may be further stratified if
the firm in question straddles more than one line of economic activity, thereby belonging to one
or more employer associations. As a result of fragmentation, therefore, several agreements may
coexist for the same region, occupation, and firm. Observe that horizontal or occupation-based
agreements are also possible, although they are infrequent largely because the law gives
precedence to vertical sectoral agreements many of which are signed by a large number of
primary unions that may include occupation-based unions.
Portuguese collective agreements are at once both extensive and general. They are
extensive insofar as they cover many categories of worker. They are general in that they set only
minimum conditions of which the most important is the base level monthly wage. (But they also
cover other terms and conditions, most frequently working time, night work, overtime shift rates,
and additional social benefits.) The focus is upon wage floors rather than anticipated wage
growth that in in some centralized bargaining regimes (e.g. Sweden) have been incorporated
directly into sectoral agreements. On average each agreement sets floors for around 100 job titles
or categoria profissional. In consequence, employers have freedom of maneuver to tailor
remuneration to their prevailing economic circumstances.1
Until recently, it has been the case that Portuguese collective agreements remain in place
until a new agreement is signed. Coupled with the favor laboris principle that new agreements
should yield more favorable conditions that those they are replacing, this has meant that
collective agreements have tended to be revised regularly only insofar as wages are concerned,
their other terms and conditions often being left untouched for many years. Recent changes in the
labor code mean that collective agreements can now expire if they are not renewed.2
1 On the determinants of the contractual wage and the ‘wage cushion,’ or difference between actual and the contractual wage set for each worker category, see Cardoso and Portugal (2005). 2 The status quo ante until late 2014 was as follows. Collective agreements expired five years after they had last been agreed, or five years after one of the parties had indicated its intention to renegotiate their terms and conditions. The said, the collective agreement would continue to apply for at least 18 months after this, to allow negotiations to take place. Indeed, either of the parties had a period of 12 months during which to request the

6
The most potent mechanism shaping the formation of wages has traditionally been the
systematic extension via so-called Portarias de Extensão of industry-wide agreements (and
occasionally ACTs) by the Ministry of Employment, following a request from either or both of
the parties to the agreement. (Voluntary extensions are also common, while employers who sign
an agreement with a trade union(s) usually extend its application to the entire workforce,
irrespective of the worker’s union status.) The upshot of this near automatic procedure is that
even those wage agreements reached by trade unions and employers’ associations with very low
representation have had a strong impact in setting wage floors. Roughly speaking between 70
and 80 percent of the labor force have benefitted from collective agreements without being
members of the organizations that signed them. Finally, in the absence of one of the
representatives, or in the presence of strategic delays in negotiations/refusals to negotiate, the
Ministry of Employment can regulate the sector directly through an Ordinance of Working
Conditions, or Portarias de Condições de Trabalho. (An arbitration process, either mandatory or
voluntary, may be set in motion to unfreeze ‘blockages.’) The extension mechanism in
conjunction with the large number of job titles set down in the typical sectoral agreement
together explain the 30,000 (informal) minimum wages identified in Martins’ (2014) analysis of
the employment and wage consequences of collective bargaining extensions referred to earlier.
In addition to the extension procedure, wage floors are also set under national minimum
wage machinery, set up in 1974. The minimum wage can exceed that set under sectoral
bargaining. This guaranteed monthly minimum wage (or RMMG) was virtually stagnant in real
terms between 2002 and 2006, leading to an agreement between the social partners (government,
the trade union confederations, and the employers’ confederation) in 2006 allowing for an
increase of almost 30 percent, to be phased in over five years and setting a medium-term target
value €500 by 2011. It has been estimated that the share of minimum wage earners among full-
time workers aged 18 to 61 years rose dramatically from 6.7 percent of total employment in 2006
to 16.6 percent in 2010 (Carneiro, Guimarães, and Portugal, 2012: 451).
appointment of an arbitrator to draw up new terms and conditions. New validity rules for expired collective agreements came into force on 1 September 2014. Specifically, the expiry period was reduced from five years to three years, and the period of continuation upon expiry reduced from 18 months to 12 months. In addition, whenever there is an interruption of negotiations, including conciliation, mediation or voluntary arbitration for more than 30 days, the period of ‘survival’ is suspended and the period of negotiation with suspension cannot exceed 18 months.
7
Both systems of minimum wages – nation-wide and collectively bargained/extended –
were disrupted by the economic crisis of 2011/12. As part of the Memorandum of
Understanding3 concluded between the Portuguese government and Troika in May 2011 it was
agreed among other things that the procedures for extending collective agreements would be
changed, even prior to which the government committed to restrict the extension of collective
agreements.4 In October 2012 the government announced new criteria for the administrative
extension of collective agreements taking into account the representativeness of the negotiating
organizations and the implication of such extension for non-affiliated firms. Most importantly,
agreements could only be extended if at least one union and one employers’ organization
requested it and the wider signatory organizations employed more than one-half of the
employees in the relevant industry. However, in June 2014 this Resolution was modified: the
criterion is now that the employers’ association represents at least 50 percent of employees in the
sector, or that its associates must include at least 30 percent of micro, small, and medium
companies (employing up to 250 employees). As far as the national minimum wage was
concerned, the Memorandum proposed to make any increase in the minimum wage conditional
on economic and labor market developments. The minimum wage was duly frozen and in 2012
and 2013 it stood at the level of 2011 (viz. €485). It was not uprated to €505 – a little above the
medium-term target – until October 2014.
The economic crisis and the response of the public authorities to it are credited with
some fairly dramatic changes in Portuguese collective bargaining. In particular, the decline in the
number of Portuguese collective agreements and worker coverage have been the subject of
several critical EurWORK (2013, 2014) reports, while the topic of so-called radical
decentralization affecting all crisis EU nations and leading to the “destruction of national
collective bargaining systems” has been identified as a key paradigm shift by Schulten (2013)
and Schulten and Müller (2013). That said, we note parenthetically that there has been little
evolution in atypical collective agreements, by which is meant the ability of works councils and
3 The terms of the Memorandum are available at http://economico.sapo.pt/public/uploads/memorandotroika_04‐05‐2011.pdf. 4 Other changes under the Memorandum were revisions to the unemployment insurance system in terms of the level and duration of benefits, a diminution in employment protection via a reduction in severance payments and the relaxation of protection against individual dismissals, a reduction in the payment for overtime working and an increase in hours by reducing compensatory time off per hour of overtime, and an expansion of flexible working time arrangements in the form of working time accounts at individual and plant level.
8
other representative bodies of workers at plant level to conclude collective agreements at the
workplace. The current legal position is that works councils can negotiate at this level in firms
with a minimum of 150 employees but only in circumstances where this is authorized by the
trade union. The latter provision reflects the constitutional provision that competence to conclude
collective agreements is the exclusive preserve of the trade unions. Reform proposals favoring
so-called Acordo Geral de Empresa that can be signed independently of the trade union had to be
abandoned in the face of strong union opposition in the Standing Council for Social Concertation
or Comissão Permanente da Concertação Social (CPCS).
Social concertation/social dialogue is the final aspect of the bargaining framework
identified here. Although the last pact establishing (a reference value for) nation-wide increases
was in 1996, a number of agreements have been reached in the tripartite CPCS since its
establishment in 1984. We earlier noted the 2006 accord on minimum wages.5 More
importantly, the great plurality of proposals contained in the Memorandum relied significantly on
a tripartite agreement of March 2011 on competitiveness and employment, while new reforms
facilitating the renewal of fixed-term labor contracts, the elimination of four national holidays,
and the excision of extra holiday time granted in compensation for to workers with no leave of
absence in the previous year were agreed under a separate agreement on commitment to growth,
competitiveness, and employment in January 2012.6 That said, the largest union confederation,
the CGTP-IN, refused to sign either agreement. Moreover, there has been little movement in the
area of atypical work, where the provisions on fixed-term contracts and temporary agency work
remain unusually stringent; measures to promote decentralized bargaining envisaged under the
Memorandum have only partially been implemented because of the need for union approval; and
the representativeness of the parties’ criterion as a condition for the extension of collective
agreements has subsequently been diluted.
The Data
5 See also the 2008 agreement on the Regulation of Labor Relations, Employment Policies and Social Protection. Available at: http://www.ugt.pt/Acordo_25_06_2008.pdf 6 The two accords are available at http://www.ces.pt/download/719/AcordoTripCompetEmprego.pdf and http://www.portugal.gov.pt/media/424132/compromisso_crescimento_competitividade_emprego.pdf. And for English language summaries of labor law, see Palma Ramalho (2013).

9
The main dataset used in the present inquiry is the Relatório Único for the three years 2010,
2011, and 2012. The data are collected through a mandatory questionnaire to every establishment
with at least one wage earner, and the survey is conducted by the Office for Strategy and
Planning in the Ministry of Solidarity, Employment and Social Security. The union question
contained in the survey and asked of the manager respondent is as follows: “Indicate the number
of workers for whom you have knowledge of their membership in a union (because they are
union officials, because you deduct membership dues from their salary, or because the worker
informed you about his/her membership so as to determine which particular collective regulation
is applicable to their case).” Responses to this question are used to calculate the firm density
rates.
Data are given on each establishment (its location, economic activity, employment,
number of temporary employees, legal structure, and sales) and for each of its employees (their
gender, age, education, skill, occupation, tenure, earnings, and work schedule). The earnings data
are both detailed and accurate. The information pertains to the gross wage for normal hours of
pay (or base wage) together with both regular and irregular benefits, overtime pay and hours, and
wage bargaining mechanism/type of contract. The full-wage, or total compensation, is the wage
variable used in estimating the union wage gap or premium. The accuracy of this information is
assured by its administrative nature and the fact that by law the wage and all other information in
the survey has to be made publicly available at the establishment.
The restrictions imposed on the raw dataset were as follows. First, we limited our
analysis to full-time workers in mainland Portugal. Second, we excluded workers from
agriculture and forestry, as well as those in public administration whose wages are not
collectively bargained. Third, individuals aged under 16 years and above 65 years at survey date
were excluded. Finally, to be included workers’ monthly wages had to be at least 80 percent of
the mandatory minimum wage which here corresponds to the lowest admissible wage for
apprentices. Our final sample for the density computations comprises some 612,336 year-firm
observations, which correspond to some 301,724 firms matched by identifying number,
representing 2,758,197 individuals matched by identifying number, gender, and year of birth,
and 48,913 jobs matched by code of the collective agreement occupational category.
The data contained in the Relatório Único replicate that provided in the Quadros de
Pessoal (Personnel Tables) but only became available in 2010. Computation of the union wage

10
premium, will also use data from the three waves of the Relatório Único, but for our analysis of
downward nominal wage rigidity in high and low inflation regimes, in which we effect a
comparison between the years 1984 and 2012, data for the earlier year will be taken from the
Quadros de Pessoal.
The third dataset used in this inquiry lists all new agreements and extensions of collective
agreements between January 2008 and December 2011 and is maintained by the Ministry of
Economics from the texts of both the individual collective agreements and extension orders. We
simply take Martins’ (2014) estimates based on these data as these are the most reliable
indicators of the flow of collective agreements and extension ordinances available.7 These will be
combined with stock data from the Relatório Único (and the Quadros de Pessoal) to examine the
validity of the assertion that profound changes in the numbers of extensions and new agreements
imply sharp falls in coverage.
Modeling
We address in turn the models used to estimate union density and the union wage gap – the final
two components of our analysis having a basis in tabulations of collective agreements and
extensions and investigation of the wage change distribution are not further discussed here. To
estimate the determinants of establishment unionism we deploy a count regression model and, in
recognition that many firms in the sample do not have any unionized workers (287,056 firms, or
95.14 percent of the total), a zero inflated count model. More specifically, since the non-zero
observations may be over-dispersed in relation to the Poisson distribution, we use a zero inflated
negative binomial model (ZINB) after Lee, Wang, and Yau (2001).
The zero negative inflated negative binomial model can be written:
Pr y|x1 e , fory 0
1, ,
!fory 1
,
7 The reader is also referred to EurWORK (2013, 2014) and Dias and Cerdeira (2011) who use published estimates by the Directorate‐General for Employment and Labor Relations (Direcção‐Geral do Emprego e das Relações de Trabalho, or DGERT). DGERT is a central office of state charged with the responsibility to assist in the development of policies regarding employment, training and professional certification, and occupational health and safety. It is also responsible for monitoring and promoting collective bargaining and the prevention of collective labor disputes.

11
where y denotes the count of the expected number of union workers at the establishment; x are
the covariates influencing unionization and u is an error term; and ∈ [0, 1] is a zero-inflated
parameter, obtained through a simple logit parametrization:
exp τ1 exp τ
.
Observed data often display empirical variances larger than their means, implying the
existence of an “overdispersion” problem. This may reflect the existence of firm unobserved
heterogeneity. The problem can be circumvented by adding the random variable u to the vector of
explanatory variables. This will allow for the expected value to differ from the variance. But
conditional on the error u, y follows a Poisson distribution. If we assume that u follows a gamma
distribution then the unconditional distribution of y is a negative binomial. In other words, λ (x, u) =
exp(x'β + log u), with u following a gamma distribution, and where E(u|x) = 1 and Var(u|x) = 1/δ.
Furthermore, we included an additional covariate, representing the size of the workforce as a
measure of the exposure to the “risk” of being unionized, and forced the regression coefficient to
be 1. That is, λ (x, u) = exp(x'β +log N+ log u), where N is number of workers in the firm.
Proceeding this way, the specification lends itself to a convenient interpretation as a fractional
regression model.
The dependent variable in the model is the number of unionized workers at the firm. The
independent variables in the model are (average) worker characteristics and firm characteristics.
The former comprise a continuous measure in age, and the proportions of females, foreign
nationals, and individuals in various educational categories. The firm characteristics are the share
of public equity, and dummies for establishment size (6) and industry (30). There are also two
time dummies because of our use of all three waves of the Relatório Único.
Our second model links union density to the union wage gap. It takes into account the
results given by AUTHOR A (2014) showing that it is unwise to assume that union density
impacts linearly on (log) wages. That paper seeks to decompose the union wage gap in terms of
the contribution of worker, firm, and job title heterogeneity via a high-dimensional fixed-effects
regression model. The main finding of the study is that the wage gap largely reflects the
allocation of workers to firms with distinct wage policies due to the heterogenous presence of
unions at firm/sector level rather than unobserved worker quality or differences among job titles,
and we will take this interpretation as the main driving force behind the union wage gap.

12
Observe that the union wage gap in this model – that is, prior to the decomposition exercise –
gives the cet. par. average difference in wages at a given firm resulting from the specific union
density rate of that firm via a two-stage estimation. Essentially the first step of the procedure is a
wage regression with standard controls but a separate fixed effect corresponding to each level of
union density in the database. That is, there is a different wage intercept capturing the constant
impact of the firm’s particular density rate on his or her compensation. In a second step, a kernel
regression is used to smooth these fixed effects. The outcome of this exercise shows that the
impact of union density is highly nonlinear. Specifically, it is miniscule up to 20 percent density
but increases steeply thereafter, reaching a maximum at around 70 percent density.
As an approximation to the flexible functional form of the full model, our worker
earnings function substitutes four union dummies (and the omitted category) for the 4,814
individual union fixed effects. Our estimating equation is thus specified as:
4
1
logk
iftkftkiftift udxw ,
where log wift is the log of monthly gross compensation for the individual worker i in firm f at
year t and, in addition to the union dummies, xift is a vector of explanatory variables and ift
denotes an idiosyncratic error term.
The four union density dummies ( udftk ) are as follows: greater than zero but less than or
equal to 25 percent, greater than 25 percent but less than or equal to 50 percent, greater than 50
percent but less than or equal to 75 percent; and greater than 75 percent. The base controls to be
used at the level of the worker are age, age squared, tenure, tenure squared and dummy variables
for gender, and education level; for the firm, they are industry and size dummies. In addition,
there are two time dummies reflecting our use of all three waves of the Relatório Único. We
shall also report separate summary results for an additional specification containing occupational
dummies, reflecting the ongoing controversy in the literature as to their use (cf. Hirsch, 2004;
Blanchflower and Bryson, 2003).
Finally, a caveat concerning needs to be entered in interpreting the union wage gap(s)
reported here. Unions may indeed shape the wage policies of firms. But union presence is not
random, so that the finding of a substantial premium may also reflect a union proclivity to
organize firms with more generous compensation policies to begin with. Causation thus remains

13
an issue in this study as in most others. That said, partial answers to the causation issue even in
the absence of information on individual union status are provided by the fuller model where the
wage gap is decomposed into its firm, job title and worker fixed effects.
Introductory Descriptives We preface our cet. par. findings with some background statistics on union density and worker
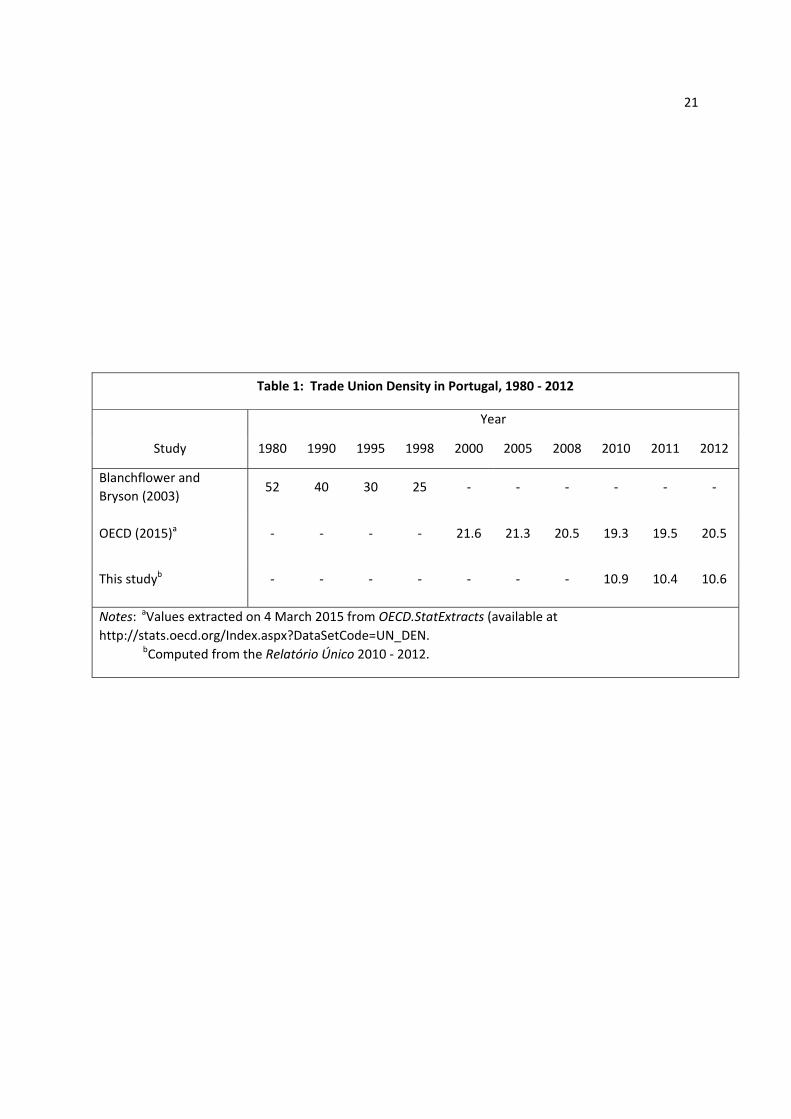
coverage by collective agreement. Table 1 provides three sets of estimates of trade union density
covering the period 1980 to 2012. The first are taken from Blanchflower and Bryson (2003) and
point to a sharp reduction (a little under 50 percent) in membership over the final two decades of
the last century. The next set of estimates are broadly comparable in construction and are taken
from the OECD (2015). They now show a much reduced rate of decline over the first decade of
the present century and even a slight uptick as of 2012. As noted earlier, our own estimates rely
on administrative data from the Relatório Único – rather than union sources – and exclude the
public sector if not public enterprises. Perhaps more important than the difference between our
data and those of the OECD, only partly by reason of this exclusion, is the broad stability in the
measures of union density over the last three years for which the data are available in the face on
economic crisis and retrenchment.
(Table 1 near here)
Table 2 plots the flow of collective agreements and their coverage from 2008 to 2012.
This is where the real drama unfolds. As can be seen, there has been a precipitous fall in the
numbers of new sectoral agreements (79.1 percent), multi-company agreements (66.7 percent),
and single-firm agreements (58.8 percent) over just four years. Equivalently, the number of
workers covered fell by 83.6 percent, 43.6 percent, and 85.7 percent, respectively. On aggregate,
the number of workers covered directly by collective agreements fell from 1,894,846 to 327,622
(or 82.7 percent). The last column of the table reveals an even more dramatic fall off in the
number of extension agreements of 92.7 percent. The table does not give the number of workers
affected by these extension agreements as the authorities do not collect information about the
number of affiliated workers in each signatory union and the universe of workers potentially
covered by a given bargained instrument of collective bargaining. As a result, the available
information simply reports the workers covered by each instrument independently of its origin,
either by affiliation or extension.

14
(Table 2 near here)
The latter data have been interpreted as indicating a major rupture of the industrial
relations system in Portugal that have excluded large numbers of workers from collective
agreements. But the notion that the Portuguese reforms have resulted in an overall reduction in
the coverage of collective agreements (see, for example, EurWORK, 2013, 2014; International
Labor Organization, 2014; Schulten, 2013; Schulten and Müller. 2013) is to confuse flows with
stocks, namely the number of workers covered by new agreements and extension orders and
those covered by existing agreements and ordinances. In short, Table 2, dealing with flows, will
have to be augmented with stock data in what follows, and to anticipate our findings we shall
report that the number of workers covered by collective agreements has, in common with union
density, evinced broad stability in recent years. We shall also argue that there is little evidence in
the flow data to herald the disappearance of collective bargaining.
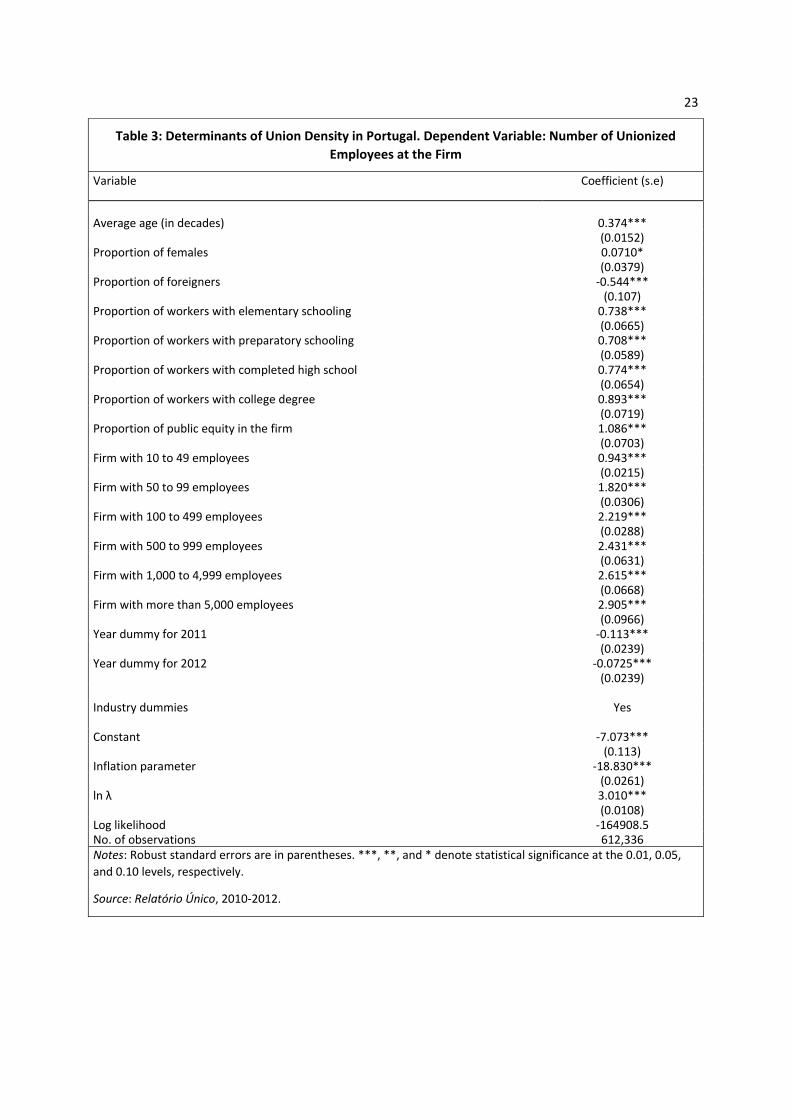
Main Findings on Union Density, the Wage Gap, and Stock Data on Coverage Table 3 presents the regression estimates from the negative binomial model discussed in section
IV.8 Observe firstly the positive relationship between average age and the number of unionized
workers in the firm, indicating the increased propensity on the part of the worker to become
unionized with age. The negative association between membership and nationality (here the
share of foreigners) is also familiar. Less anticipated is positive association between the share of
females in the firm and union density, although it is only marginally significant. (The coefficient
estimate of 0.0710 means that increasing the share of females by 10 percentage points increases
union density by 0.07 percent.) Evidently, traditional gender-based supply and demand have
become moot with the increased labor market exposure of females. For its part education is
strongly associated with union membership: the relationship is near monotonic, the omitted
category being those with no schooling.
(Table 3 near here)
8 In general, the coefficient estimates can be interpreted within the framework of a fractional regression model, where the fraction of integers is the number of unionized workers divided by the total number of workers within the firm. In other words, union membership is seen as the outcome of a Bernoulli trial with probability p which at the firm level corresponds to union density.

15
Perhaps the clearest association of all is the monotonic relation between firm size and
union membership, most likely reflecting scale economies to unions in the supply of union
services, as well as potential collective voice benefits. Note, too, the sharply higher membership
rates in companies with greater public equity. It is frequently argued that the ‘dispersed’ nature
of property rights in such circumstances together with implicit guidelines on collective
bargaining operating in public administration (not included in the sample), where government
assumes the position of employer, provides encouragement to higher union density in publicly
owned firms.
Finally, among the sectoral dummies, the cases of Finance and Insurance Services and
Transportation and Storage Services are important. The former sector is the sole private sector
industry where the labor unions offer a system of private healthcare benefits to workers, while
the latter is well known for its inelastic demand, small share of labor costs in total costs, and
pervasive featherbedding. Other important sectors are Oil Refined Products and Electricity and
Water, oligopolistic sectors with an historical prominence of public equity, which despite its
erosion under successive privatization schemes likely has legacy effects on collective bargaining
arrangements.
We turn next to the association between union density and the union wage gap, using the
modified (first-stage) procedure from AUTHOR A (2014), described earlier, in which four
density dummies substitute for individual union fixed effects in each worker’s wage equation.
Table 4 summarizes the model in presenting regression coefficients for the density dummies
(>0%, ≤25%; >25%, ≤50%; >50%, ≤75%; and >75%), the omitted dummy being union density =
0%. Summary results from four separate specifications are reported. The first contains just the
union density dummies; the second adds a set of worker controls; the third adds firm controls;
and the fourth adds a single control for occupation. It will be recalled that in addition to the
occupational control, the worker controls consist of age and age squared, tenure and tenure
squared, and dummy variables for gender and educational level while the firm arguments are
industry and size dummies
(Table 4 near here)
As can be seen from Table 4, after density climbs above one-quarter of the firm’s
workforce, the union premium is sizeable and survives the incorporation of worker, firm and
occupational controls. For example, absent controls, in those workplaces where more than 75

16
percent of the workforce is unionized the average value of the premium is 61.11 percent. With
the addition of worker and firm controls, the corresponding values are less at 34.0 and 14.95
percent, respectively, indicating that union workers are more highly educated and the importance
of a firm’s location and size. Finally, adding in occupation controls causes a no appreciable
change in the premium, indicating that for this dataset the controversy over the inclusion of the
occupational controls in the augmented Mincerian wage equations is perhaps overdrawn.
These estimates of the union premium are really rather substantial. If an analogy can
easily be drawn, they certainly exceed U.S. plant-based estimates based on material victories in
union representation elections (see Lee and Mas, 2012).
This returns us to the issue of coverage. In Table 2 we reported the dramatic fall-off in
new agreements and new extension ordinances after 2010, drawing on Martins (2014). Other
observers have misleadingly concluded from these data that the changes since 2008 have left a
little over 1.5 million workers without coverage and that the decline in collective bargaining has
reached crisis point (EurWORK, 2014). In Table 5, using data from the Relatório Único for
2010-2012 and from the Quadros de Pessoal for 2008-2009, we report that the number of
workers covered by an existing or new instrument of collective bargaining – either agreement or
extension ordinance – has declined only modestly from a peak of 91.5 percent of all workers to
89.2 percent of all workers in 2012. We supplement the material in Table 5 with information on
the component instruments in Figure 1 which also gives information on the total number of
workers affected. The most notable feature of the figure is the broad-based stability in the
coverage of the various types of agreements over the sample period. Clearly, the bulk of
extension agreements are assigned here to branch agreements or CCTs. Accordingly, the ‘other’
category picks up the other non-bargained instruments such as Regulations of Working
Conditions and arbitration where the Ministry of Employment, or an independent third party,
regulate the sector directly and not just orders that simply enlarge the franchise of a bargained
instrument.
(Table 5 and Figure 1 near here)
The bottom line with respect to coverage is that reports of the death of Portuguese
collective bargaining have greatly been exaggerated by outside observers. This interpretation is
underscored by the subsequent dilution of the restrictions on extension agreements. We next

17
proceed to offer a different explanation for the decline in new agreements and extension
ordinances.
Collective Bargaining Coverage Once More (or Downward Nominal Wage Rigidity in High and Low Inflation Regimes) The notable feature of wage setting in recent years, and in particular at end of our sample period,
is the evidence of extreme nominal wage rigidity. This outcome is the result of a conflation of
severe economic contraction and a low rate of inflation. In these circumstances, a revealing
exercise is to contrast the nominal wage change distribution in 2012 with that in 1984 when
another interval of economic recession was accompanied by high inflation. The respective wage
change distributions (of job stayers) are provided in panels (a) and (b) of Figure 2. We focus
here on the base wage since this measure is more closely related to the theoretical notion of a
negotiated wage rate.
Beginning with panel (a) of the figure, it can be seen that a tiny (2%) proportion of
workers faced nominal cuts and a discernible share of worker (5%) experienced a wage freeze.
However, the large majority of workers had nominal wage increases but real wage cuts. Only
18% of workers enjoyed real wage increases, namely those located in the wage change
distribution to the right of the inflation rate identified by the vertical dashed line. The share of
workers located between the two vertical lines (74%) provides a rough indication of real wage
contractual flexibility in the face of recession. On net, therefore one can speak of real wages
having declined by 7.4 percent in 1984, much more than the decline in real GDP (-1%).
Meantime, the unemployment rates increased very modestly from 8.2 to 8.5 percent (see also
Carneiro, Guimarães, and Portugal, 2012).
The drama of contemporary wage adjustment is illustrated in panel (b) of the figure. The
wage change distribution nearly collapses at zero percent nominal wage change. Fully 86 percent
of the workers experienced real wage decreases. Because the inflation rate was very low, the
margin of downward real wage adjustment that would not imply nominal wage cuts was highly
circumscribed. In these circumstances, a huge fraction of workers experienced nominal wage
freezes (76%), an outcome without parallel in other developed economies. Overall, real wages
fell by 1.3 percent in 2012 whereas GDP declined by 3 percent. Meantime, the unemployment

18
rate increased substantially from 12.7 to 15.5 percent. Some other reasons why nominal wage
were effectively frozen have already been discussed. They have to do with the mechanisms that
generate automatic nominal wage increases, in the form of a sharp decline in new collective
agreements, legal limits placed on the extension of such agreements, and a freeze on minimum
wage hikes. In short, 2012 was a time in which incipient downward nominal wage rigidity
became truly binding, the full consequences of which are to be felt in the future. These
consequences include job destruction (Carneiro, Portugal and Varejão, 2014), pent-up wage
deflation, and then and only then the crisis in industrial relations referred to by EurWORK, inter
al.
Conclusions
This inquiry has uncovered what to many will be some surprising facts about collective
bargaining in Portugal. This is largely the result of our being able to use a new dataset that
contains reliable data on union membership. We provide not merely the first accurate estimates
of union density in Portugal, 2010-2012, but also demonstrate evidence of a sizeable density-
related union premia in a regime of near-universal coverage. Causality remains an issue because
unions may locate in firms with more generous compensation policies or that are more
‘permeable’ to union wage demands. Finally, despite an unambiguous shift in bargaining
momentum that has led to far fewer collective agreements and extensions in the wake of the
economic crisis, we report that coverage by collective agreement is largely unaffected once one
accounts for the stock of existing contracts. Although the bargaining milieu has changed, we
argue that this is best seen as a consequence of a low inflation regime in conjunction with a
severe economic downturn. Whereas in the past the wage setting system was largely driven by
“upward nominal wage rigidity” the present environment is one in which downward nominal
wage rigidity has become truly binding. If not exactly a case of plus ça change, we have yet to
observe a sea-change in Portuguese collective bargaining practice. That said, our analysis
suggests that changes will be forced on the bargaining parties.

19
References
Blanchflower, David, and Alex Bryson. 2003. “Changes over Time in Union Relative Wage Effects in the U.K. and the U.S.A. revisited.” In John T. Addison and Claus Schnabel (eds.), International Handbook of Trade Unions. Cheltenham and Northampton: Edward Elgar, pp. 197-245.
Cardoso, Ana Rute, and Pedro Portugal. 2005. “Contractual Wages and the Wage Cushion under Different Bargaining Settings.” Journal of Labor Economics 23(4): 875-902.
Carneiro, Anabela, Paulo Guimarães, and Pedro Portugal. 2012. “Real Wages, and the Business Cycle: Accounting for Worker, Firm, and Job Heterogeneity.” American Economic Journal: Macroeconomics 4(2): 133-152.
Carneiro, Anabela, Pedro Portugal and José Varejão. 2014. “Catastrophic Job Destruction.” Journal of Macroeconomics 39(Part B): 444-457.
Dias, João, and Maria da Conceiçao Cerdeira. 2011. “Recent Trends in Wages and Collective Bargaining in Portugal.” Sociologia On Line 2: 345-367
Hirsch, Barry T. 2004. “Reconsidering Union Wage Effects: Surveying New Evidence on an Old Topic.” Journal of Labor Research 25(2): 233-266.
EurWORK. 2013. “Dramatic Decline in Collective Agreements and Worker Coverage.” Dublin: European Foundation for the Improvement of Living and Working Conditions. Available at: http://eurofound.europa.eu/observatories/eurwork/articles/industrial-relations/dramatic-decline-in-collective-agreements-and-worker-coverage.
EurWORK. 2014. “Portugal: Decline in Collective Bargaining Reaches Critical Point.” Dublin: European Foundation for the Improvement of Living and Working Conditions.” Available at: http://www.eurofound.europa.eu/observatories/eurwork/articles/working-conditions-industrial-relations/portugal-decline-in-collective-bargaining-reaches-critical-point.

20
International Labor Organization. 2014. “Tackling the Jobs Crisis in Portugal.” ILO Studies on Growth with Equity. Geneva: ILO.
Lee, David S., and Alexandre Mas. 2012. “Long-Run Impacts of Unions on Firms: New Evidence from Financial Markets, 1961-1999.” Quarterly Journal of Economics 127(1): 333-378.
Lee, Andy H., Kui Wang, and Kelvin K.W. Yau. 2002. Analysis of Zero-Inflated Poisson Incorporating Extent of Exposure.” Biometrical Journal 43(8): 963-975.
Martins, Fernando, Paulo Guimarães, and Pedro Portugal. 2014. “Upward Nominal Wage Rigidity.” Unpublished Paper, Banco de Portugal.
Martins, Pedro S. 2014. “30,000 Minimum Wages: The Economic Effects of Collective Bargaining Extensions.” IZA Discussion Paper No. 8540. Bonn: Institute for the Study of Labor.
OECD. 2015. “Trade Union Density,” OECD StatExtracts. Available at http://stats.oecd.org/Index.aspx?DataSetCode=UN_DEN.
Palma Ramalho, Maria do Rosário. 2013. “Portuguese Labor Law and Industrial Relations During the Crisis.” Working Paper No. 54.Geneva: International Labor Office.
Schnabel, Claus. 2013. “Union Membership and Density: Some (Not So) Stylized Facts and Challenges.” European Journal of Industrial Relations 19(3): 255-272.
Schulten, Thorsten. 2013. “The Troika and Multi-Employer Bargaining – How European Pressure is Destroying National Collective Bargaining Systems.” Available at: http://www.socialeurope.eu/2013/06/the-troika-and-multi-employer-bargaining/
Schulten, Thorsten, and Torsten Müller. 2013. “A New European Interventionism? The Impact of New Economic Governance on Wages and Collective Bargaining. In Social Developments in EU 2012, edited by David Natali and Bart Vanhercke, pp. 181-213. Brussels: European Trade Union Institute and the European Social Observatory.
Visser, Jelle. 2013. “Database on Institutional Characteristics of Trade Unions, Wage Setting, State Intervention and Social Pacts.” Version 4.0, http://www.uva-aias.net/207.
21
Table 1: Trade Union Density in Portugal, 1980 ‐ 2012
Study
Year
1980 1990 1995 1998 2000 2005 2008 2010 2011 2012
Blanchflower and
Bryson (2003) 52 40 30 25 ‐ ‐ ‐ ‐ ‐ ‐
OECD (2015)a ‐ ‐ ‐ ‐ 21.6 21.3 20.5 19.3 19.5 20.5
This studyb ‐ ‐ ‐ ‐ ‐ ‐ ‐ 10.9 10.4 10.6
Notes: aValues extracted on 4 March 2015 from OECD.StatExtracts (available at
http://stats.oecd.org/Index.aspx?DataSetCode=UN_DEN.
bComputed from the Relatório Único 2010 ‐ 2012.

22
Table 2: The Flow of Collective Agreements by Type, and Extensions,
2008 ‐ 2012
Year
Type of Collective Agreement Extension
(PEs)
Sectoral
(CCTs)
Multi‐
Employer
(ACTs)
Company
Agreements
(AEs)
2008 172
(1,778,216)
27
(47,232)
97
(69,398) 178
2009 142
(1,299,371)
22
(59,902)
87
(37,952) 128
2010 141
(1,309,267)
25
(64,455)
64
(33,344) 140
2011 93
(1,160,080)
22
(52,737)
55
(24,102) 24
2012 36
(291,068)
9
(26,645)
40
(9,909) 13
Source: Martins (2014, Table 2).
Notes: Numbers of collective agreements, and workers covered (in
parentheses). Earlier values are reported by Dias and Cerdeira (2011);
and for slightly different values, see EurWORK (2013, 2014).
23
Table 3: Determinants of Union Density in Portugal. Dependent Variable: Number of Unionized
Employees at the Firm
Variable Coefficient (s.e)
Average age (in decades) 0.374*** (0.0152) Proportion of females 0.0710* (0.0379) Proportion of foreigners ‐0.544*** (0.107) Proportion of workers with elementary schooling 0.738*** (0.0665) Proportion of workers with preparatory schooling 0.708*** (0.0589) Proportion of workers with completed high school 0.774*** (0.0654) Proportion of workers with college degree 0.893*** (0.0719) Proportion of public equity in the firm 1.086*** (0.0703) Firm with 10 to 49 employees 0.943*** (0.0215) Firm with 50 to 99 employees 1.820*** (0.0306) Firm with 100 to 499 employees 2.219*** (0.0288) Firm with 500 to 999 employees 2.431*** (0.0631) Firm with 1,000 to 4,999 employees 2.615*** (0.0668) Firm with more than 5,000 employees 2.905*** (0.0966) Year dummy for 2011 ‐0.113*** (0.0239) Year dummy for 2012 ‐0.0725*** (0.0239) Industry dummies Yes Constant ‐7.073*** (0.113) Inflation parameter ‐18.830*** (0.0261) ln λ 3.010*** (0.0108) Log likelihood ‐164908.5 No. of observations 612,336 Notes: Robust standard errors are in parentheses. ***, **, and * denote statistical significance at the 0.01, 0.05,
and 0.10 levels, respectively.
Source: Relatório Único, 2010‐2012.

24
Table 4: Estimated Union Wage Gap (%) for Different Levels of Unionization
Specification Firm density rate
1 ‐ 25% 25 ‐ 50% 50 ‐ 75% 75 ‐ 100%
Without controls 17.59 28.29 63.66 61.11
With controls for worker characteristics 12.31 16.34 38.00 34.00
With controls for worker and firm characteristics 4.41 6.66 20.27 14.95
With controls for worker and firm characteristics
and occupation 6.61 7.74 21.07 15.26
(Distribution of unionized workers per group) (61.67%) (15.84%) (9.97%) (12.53%)
Source: Relatório Único, 2010 ‐ 2012.
Table 5: Workers Covered by an Instrument of Collective Bargaining in Portugal
Year Union
coverage
2008 90.6 2009 90.5 2010 91.5 2011 91.0 2012 89.2
Sources: Quadros de Pessoal, 2008‐2009; Relatório Único, 2010‐2012

25
Figure 1: The Stock of Collective Agreements by Type, 2008‐2012
Notes: Percentage values indicate the employment coverage share of each respective instrument/all instruments. Figures in parentheses indicate the number of each respective instrument/all instruments. Figures at base of each column in brackets above year indicate the total numbers of workers covered. Sources: Quadros de Pessoal, 2008‐2009; Relatório Único, 2010‐2012.
AE’s
CCTs
ACTs
OTHER OTHER

26
Figure 2: Downward Nominal Wage Rigidity in High and Low Inflation Regimes
Sources: Quadros de Pessoal, 1984; Relatório Único, 2012.

I
01|13 Macroeconomic forecasting using low-frequency filters
João Valle e Azevedo | Ana Pereira
02|13 Everything you always wanted to know about sex discrimination
Ana Rute Cardoso | Paulo Guimarães | Pedro Portugal
03|13 Is there a role for domestic demand pres-sure on export performance?
Paulo Soares Esteves | António Rua
04|13 Ageing and fiscal sustainability in a small euro area economy
Gabriela Castro | José R. Maria | Ricardo Mourinho Félix | Cláudia Rodrigues Braz
05|13 Mind the gap! The relative wages of immi-grants in the Portuguese labour market
Sónia Cabral | Cláudia Duarte
06|13 Foreign direct investment and institu-tional reform: Evidence and an applica-tion to Portugal
Paulo Júlio | Ricardo Pinheiro-Alves | José Tavares
07|13 Monetary policy shocks: We got news!
Sandra Gomes | Nikolay Iskrev | Caterina Mendicino
08|13 Competition in the Portuguese Economy: Estimated price-cost margins under im-perfect labour markets
João Amador | Ana Cristina Soares
09|13 The sources of wage variation: a three-way high-dimensional fixed effects re-gression model
Sonia Torres | Pedro Portugal | John T. Addison | Paulo Guimarães
10|13 The output effects of (non-separable) government consumption at the zero lower bound
Valerio Ercolani | João Valle e Azevedo
11|13 Fiscal multipliers in a small euro area economy: How big can they get in crisis times?
Gabriela Castro | Ricardo M. Felix | Paulo Julio | Jose R. Maria
12|13 Survey evidence on price and wage rigidi-ties in Portugal
Fernando Martins
13|13 Characterizing economic growth paths based on new structural change tests
Nuno Sobreira | Luis C. Nunes | Paulo M. M. Rodrigues
14|13 Catastrophic job destruction
Anabela Carneiro | Pedro Portugal | José Varejão
15|13 Output effects of a measure of tax shocks based on changes in legislation for Portugal
Manuel Coutinho Pereira | Lara Wemans
16|13 Inside PESSOA - A detailed description of the model
Vanda Almeida | Gabriela Castro | Ricardo M. Félix | Paulo Júlio | José R. Maria
17|13 Macroprudential regulation and macro-economic activity
Sudipto Karmakar
18|13 Bank capital and lending: An analysis of commercial banks in the United States
Sudipto Karmakar | Junghwan Mok
WORKING PAPERS
2013
Working Papers | 2015

II Banco de Portugal • Working Papers
20141|14 Autoregressive augmentation of MIDAS
regressions
Cláudia Duarte
2|14 The risk-taking channel of monetary policy – exploring all avenues
Diana Bonfim | Carla Soares
3|14 Global value chains: Surveying drivers, measures and impacts
João Amador | Sónia Cabral
4|14 Has US household deleveraging ended? a model-based estimate of equilibrium debt
Bruno Albuquerque | Ursel Baumann | Georgi Krustev
5|14 The weather effect: estimating the effect of voter turnout on electoral outcomes in italy
Alessandro Sforza
6|14 Persistence in the banking industry: frac-tional integration and breaks in memory
Uwe Hassler | Paulo M.M. Rodrigues | Antonio Rubia
7|14 Financial integration and the great leveraging
Daniel Carvalho
8|14 Euro area structural reforms in times of a global crisis
Sandra Gomes
9|14 Labour demand research: towards a better match between better theory and better data
John T. Addison | Pedro Portugal | José Varejão
10|14 Capital inflows and euro area long-term interest rates
Daniel Carvalho | Michael Fidora
11|14 Misallocation and productivity in the lead up to the Eurozone crisis
Daniel A. Dias | Carlos Robalo Marquesz | Christine Richmond
12|14 Global value chains: a view from the euro area
João Amador | Rita Cappariello | Robert Stehrer
13|14 A dynamic quantitative macroeconomic model of bank runs
Elena Mattana | Ettore Panetti
14|14 Fiscal devaluation in the euro area: a model-based analysis
S. Gomes | P. Jacquinot | M. Pisani
15|14 Exports and domestic demand pressure: a dynamic panel data model for the euro area countries
Elena Bobeica | Paulo Soares Esteves | António Rua | Karsten Staehr
16|14 Real-time nowcasting the US output gap: singular spectrum analysis at work
Miguel de Carvalho | António Rua

III
2015
1|15 Unpleasant debt dynamics: can fiscal consolidations raise debt ratios?
Gabriela Castro | Ricardo M. Félix | Paulo Júlio | José R. Maria
2|15 Macroeconomic forecasting starting from survey nowcasts
João Valle e Azevedo | Inês Gonçalves
3|15 Capital regulation in a macroeconomic model with three layers of default
Laurent Clerc | Alexis Derviz | Caterina Mendicino | Stephane Moyen | Kalin Nikolov | Livio Stracca | Javier Suarez | Alexandros P. Vardoulakis
4|15 Expectation-driven cycles: time-varying effects
Antonello D’Agostino | Caterina Mendicino
5|15 Seriously strengthening the tax-benefit link
Pedro Portugal | Pedro S. Raposo
6|15 Unions and collective bargaining in the wake of the great recession
John T. Addison | Pedro Portugal | Hugo Vilares
Working Papers | 2015