UNIFIED MOTIVE SCALES 1 - LMU
47
UNIFIED MOTIVE SCALES 1 An IRT Analysis of Motive Questionnaires: e Unified Motive Scales Felix D. Schönbrodt a Ludwig-Maximilians-University Munich, Germany Friederike X. R. Gerstenberg b TU Munich, Germany Paper in press (Aug 2012) at the Journal of Research in Personality (http://www.sciencedirect.com/science/journal/00926566) a Department of Psychology, Ludwig-Maximilians-Universität, Leopoldstr. 13, 80802 München, Germany. Phone: +49 89 2180 5217. Fax: +49 89 2180 3000. Email: [email protected]. Correspondence concerning this article should be addressed to Felix Schönbrodt. b Department of Psychology, Technische Universität München, Lothstr. 17, 80335 München, Germany. Email: [email protected]. Achknowledgments: We would like to thank Martina David, Jaap Denissen, Michael Dufner, Stefan Engeser, Birk Hagemeyer, Tuulia Ortner, and Jane Zagorski for their valuable comments on an earlier version of this article.
Transcript of UNIFIED MOTIVE SCALES 1 - LMU

UNIFIED MOTIVE SCALES 1
An IRT Analysis of Motive Questionnaires: The Unified Motive Scales
Felix D. Schönbrodta
Ludwig-Maximilians-University Munich, Germany
Friederike X. R. Gerstenbergb
TU Munich, Germany
Paper in press (Aug 2012) at the Journal of Research in Personality
(http://www.sciencedirect.com/science/journal/00926566)
aDepartment of Psychology, Ludwig-Maximilians-Universität, Leopoldstr. 13, 80802 München, Germany.
Phone: +49 89 2180 5217. Fax: +49 89 2180 3000. Email: [email protected]. Correspondence
concerning this article should be addressed to Felix Schönbrodt.bDepartment of Psychology, Technische Universität München, Lothstr. 17, 80335 München, Germany.
Email: [email protected].
Achknowledgments: We would like to thank Martina David, Jaap Denissen, Michael Dufner, Stefan
Engeser, Birk Hagemeyer, Tuulia Ortner, and Jane Zagorski for their valuable comments on an earlier version of
this article.

UNIFIED MOTIVE SCALES 2
Abstract
Multiple inventories claiming to assess the same explicit motive (achievement, power, or affiliation) show only
mediocre convergent validity. In three studies (N = 1685) the structure, nomological net, and content coverage of
multiple existing motive scales was investigated with exploratory factor analyses. The analyses revealed four
approach factors (achievement, power, affiliation, and intimacy) and a general avoidance factor with a facet
structure. New scales (the Unified Motive Scales; UMS) were developed using IRT, reflecting these underlying
dimensions. In comparison to existing questionnaires, the UMS have the highest measurement precision and
provide short (6-item) and ultra-short (3-item) scales. In a fourth study (N = 96), the UMS demonstrated
incremental validity over existing motive scales with respect to several outcome criteria.
Keywords: structure of explicit motives, questionnaire, item response theory, short scales

UNIFIED MOTIVE SCALES 3
1. Introduction
The concept of convergent validity indicates that measures that are supposed to tap into the
same latent construct should show high correlations. If two measures of the same construct show only
a low or medium correlation, this can be due to various reasons: (a) one or both measures are
unreliable, (b) the measures may share the same label, but they measure diferent latent constructs, or
(c) the measures tap into diferent facets of a multifaceted latent construct. In any case, this situation
would be highly problematic for research in this field. It would be unclear whether results obtained
with one measure could be generalized to other (seemingly equivalent) measures, which would hinder
the substantive cumulation of findings.
What is the status of convergent validity amongst questionnaires for explicit motives,
specifically for the “big three”: the power, achievement, and affiliation motives? By and large, we do
not know. To the authors’ knowledge, there is only one study that systematically compared diferent
questionnaires measuring these constructs (Engeser & Langens, 2010). Using 587 participants, the big
three motives were assessed using three diferent scales for achievement and affiliation and two
diferent scales for power. The median convergent correlation for these scales was r = .57.
This only medium convergence has major efects on the replicability of the results produced
with these scales. Imagine a typical study with N = 80 participants and an observed correlation of r = .
30 between a motive questionnaire and a criterion variable. If an exact replication is carried out (i.e.,
using exactly the same measures and the same sample size, but a new random sample), the probability
of finding a significant correlation in the same direction is 71% (psrep; Killeen, 2005; Lecoutre, Lecoutre,
& Poitevineau, 2010). If the replication is done with a (seemingly) equivalent predictor measure with a
convergent correlation of .57, psrep drops to 38%. For a less powerful study with N = 50 and r = .25, psrep
even drops to 25%. That means only one in four replication attemps will yield a significant confirming
result.
Based on this initial situation of explicit motive mesurement, the current studies had five
major aims. First, the nomological network and convergent correlations amongst a larger set of
existing inventories for explicit motives were assessed in a large sample. Second, the common
underlying structure of these inventories was identified. Third, new motive scales were constructed
based on item response theory (IRT), called the Unifed Motive Scales (UMS), which reflect this
underlying structure. By simultaneously estimating latent trait scores for each participant and
response curves for each item, IRT is able to estimate measurement precision the test ofers across the
entire range of the latent trait being measured. Therefore, IRT is a powerful and modern tool for
directly comparing the precision of measurement of diferent scales. Fourth, convergent and divergent
correlations were evaluated compared to existing questionnaires. Fifh, the UMS were validated with
respect to diferent outcome criteria.

UNIFIED MOTIVE SCALES 4
In the investigation of motives, a fundamental distinction has to be made between implicit
and explicit motives (McClelland, Koestner, & Weinberger, 1989). Implicit motives refer to afective
preferences for certain classes of incentives and are thought to operate outside a person’s
consciousness. Therefore, these constructs are assessed indirectly, usually via picture story exercises in
the tradition of the Thematic Apperception Test (TAT; Schultheiss, 2008). By contrast, explicit motives
(also called self-attributed motives) represent a person’s self-concept about their goals, values,
personality attributes, and afective preferences and can be assessed via self-report questionnaires. In
our studies, we will focus only on explicit motives.
What are the major domains of motivating incentives? Bakan (1966) introduced communion
and agency as two fundamental modalities of human existence. Communion is described as a desire to
have a connection with others, to be part of a greater whole, and to experience openness and union.
Agency, by contrast, is about self-protection, self-assertion, and self-expansion. These two constructs
can be seen as higher order dimensions subsuming agentic needs such as power and achievement and
communal needs such as affiliation and intimacy (e.g., Brunstein, Schultheiss, & Grässmann, 1998).
For the current studies, we define the “big three” motives in line with existing literature (e.g.,
Heckhausen & Heckhausen, 2008). The achievement motive is defined as a recurrent concern with a
standard of excellence and the disposition to derive satisfaction from the mastery of challenging tasks.
The power motive consists of two components: (a) a concern about having impact on other people by
influencing their attitudes, emotions, or behaviors and (b) a concern about having status and prestige.
In coding systems for implicit motives in particular, another aspect is helping behavior (i.e., a
prosocial way of having an impact on others). Historically, the afliation motive was the main
construct for reflecting the communal side of social motives, defined as the desire ‘‘to establish and/or
maintain warm and friendly interpersonal relations’’ (French & Chadwick, 1956, p. 296). McAdams
(1980) then diferentiated the communal side of motives by introducing a TAT coding system for the
intimacy motive as “complementary but related” (p. 413) to the affiliation motive. Whereas the
affiliation motive is concerned with establishing relationships to rather unfamiliar people and
acquaintances (“getting along with others”), the intimacy motive focuses more on the goal state of
being close to others, having positive profound interactions, and practicing self-disclosure and warm
mutual exchange (Sokolowski, 2008). These kinds of interactions usually take place in a few close
relationships with significant others. Although some authors have seen affiliation and intimacy as two
facets of a general “communal” affiliation-intimacy motive (e.g., Winter, 1991), nowadays, many
authors regard these two motives as separate (though related) motives (e.g., Sokolowski, 2008), which
has also been found empirically (e.g., McAdams & Constantian, 1983; McAdams & Powers, 1981;
McClelland, 1987). For these reasons, we decided to provide separate scales for affiliation and intimacy
in the UMS. To summarize, in the remainder of this paper, we focus on the following fundamental

UNIFIED MOTIVE SCALES 5
motivational domains: power, achievement, affiliation, and intimacy.
Several authors hypothesize that the driving force of motives can be divided into two
directional components (e.g., Elliot & Thrash, 2002; McClelland, 1987; Schultheiss, 2008). The hope
(or approach) component leads to seeking a positive desired goal state, accompanied by positive
emotions in the case of a successful attainment of the goal. The fear (or avoidance) component, by
contrast, leads to the avoidance of undesired goal states, accompanied by a reduction in negative
emotions in the case of successful avoidance. Fear scales have been developed for the achievement
motive (fear of failure; e.g., Lang & Fries, 2006) and for the affiliation motive (fear of rejection; e.g.,
Mehrabian, 1994). For the power motive, two fear components are assumed, which reflect an
avoidance component of the respective hope facets: fear of losing control and fear of losing prestige.
Concerning the implicit affiliation motive, it has been theorized that affiliation more reflects
the “dark side” (i.e., clinging, fear of rejection, avoidance motivation in general), whereas the intimacy
motivation more reflects the “bright side” (i.e., positive contact, approach motivation) of the motive
(Weinberger, Cotler, & Fishman, 2010, p. 80). As argued above, however, from a theoretical point of
view the two motivational domains are not distinguished by their motivational direction, but rather by
the quality of interaction that is sought, and by the type of persons with whom the need can be
fulfilled (acquaintances vs. close significant others; Sokolowski, 2008). Therefore, we conceptualize the
two motives as distinct (though related) motives, each having a hope and a fear component. The fear
component of the affiliation motive is termed fear of rejection (by a stranger). We have termed the fear
component of the intimacy motive fear of losing emotional contact. This fear is captured by items such
as “When I lose emotional contact with my beloved, I get nervous” and conceptually has some
resemblance to the concept of attachment anxiety (Fraley, Waller, & Brennan, 2000).
An unresolved question remains with regard to whether there is a generalized motive for fear
reduction across motivational domains (as has been hypothesized by McClelland, 1987) or whether
there are domain-specific fear components. Several studies have shown that fear motives (in contrast
to their hope counterparts) tend to collapse on one factor (Engeser & Langens, 2010; Schmalt,
Sokolowski, & Langens, 2000), and that this factor is strongly related to neuroticism (Costa & McCrae,
1988). It is unclear, however, whether one single dimension sufficiently describes the fear components,
or whether domain-specific variance is substantial enough to warrant a distinction of the fear
components.
We conducted four studies to investigate the research goals stated above. Study 1 assessed 21
motive scales at once in a large sample (n = 1,030) to investigate the nomological network of motive
questionnaires, to reveal its underlying structure, and to construct the UMS. The scales of the new
UMS inventory were designed with five goals: (a) they should reflect the underlying dimensions of

UNIFIED MOTIVE SCALES 6
motives as precisely as possible, (b) they should substantially improve measurement precision and
measurement economy in comparison to existing questionnaires, (c) for theoretical reasons, they
should diferentiate between the affiliation and intimacy motives, (d) fear components for all motives
should be provided, and (e) as some research settings (e.g., round-robin group studies of personality
perception) require scales with very few items, short and ultra-short scales should be provided, and
these should measure the same latent dimensions as the full scales.
Study 2 was designed to replicate the results of Study 1 in a diferent sample and to expand the
nomological net to additional inventories. Study 3 was aimed at a revision of the UMS intimacy scale,
which showed some unfavorable properties in its original version. Study 4 was conducted to test the
predictive and incremental validity of the UMS above and beyond existing scales regarding diferent
outcome criteria.
2. Study 1: The Structure of Existing Motive Scales and the Construction of the Unified Motive
Scales (UMS)
Study 1 had two main goals: a comprehensive comparison of the content and the structure of
existing motive inventories and the construction of new scales based on item response theory. All
analyses were performed using open source packages in the R Environment for Statistical Computing (R
Development Core Team, 2008).
2.1. Method
2.1.1. Participants. A community sample of 1,041 participants was recruited on several
websites to participate in an online study. The announcement of the study required participants to be
at least 16 years old. Additionally, the Infrequency scale of the Personality Research Form (PRF;
Jackson, 1967; German version by Stumpf, Angleitner, Wieck, Jackson, & Beloch-Till, 1985),
consisting of 12 items to which virtually everybody responds with “yes” or “no,” was included to detect
random or inattentive responding. Afer removal of 11 participants who endorsed more than three of
these infrequent items, 1,030 participants remained in the final data set. The average age was 27.94
years (SD = 10.46; range: 16 to 70 years); 738 participants were female. As an incentive for
participation, participants received a personality profile based on their individual responses directly
afer the study.
2.1.2. Inventories. Fourteen scales from existing motive inventories were administered:
dominance, achievement, and affiliation from the PRF; power, achievement, affiliation, and intimacy
from the GOALS inventory (Pöhlmann & Brunstein, 1997); power, achievement, and affiliation from
the Personal Values Questionnaire (PVQ; McClelland, 1991; German version as used in Engeser &
Langens, 2010); fear of failure and hope of success from the Achievement Motive Scale (AMS; Lang &

UNIFIED MOTIVE SCALES 7
Fries, 2006); and Mehrabian’s scales for affiliation and sensitivity to rejection (MAFF, and MSR;
Mehrabian, 1994; German version as used in Engeser & Langens, 2010). These inventories were
chosen as they represent frequently used questionnaires for the assessment of these motives (Mayer,
Faber, & Xu, 2007). All of these inventories have repeatedly demonstrated their reliability (Cronbach’s
α usually > .75) and their validity in the prediction of such diverse life domains such as well-being
(e.g., Hofer, Busch, & Kärtner, 2011), team performance (e.g., O'Neill & Allen, 2011), individual job
performance (e.g., Tett, Steele, & Beauregard, 2003), cognitive task performance, task enjoyment, and
persistence (e.g., Lang & Fries, 2006), or emotional reactions to social interactions (Nikitin & Freund,
2009). We intentionally included only “omnibus” measures of the intended motives and lef out more
detailed measures such as the Achievement Motive Inventory (Schuler, Prochaska, & Frintrup, 2001).
This inventory, for example, has 17 achievement-related subscales and therefore clearly measures the
construct on a diferent level of abstraction.
Concerning the intimacy motive, to the authors’ knowledge, there is no published
questionnaire for the intimacy motive except the four items of the GOALS intimacy subscale.1
Likewise, to our knowledge, only one fear scale has been published so far for the power domain 2: fear
of losing face (Zhang, Cao, & Grigoriou, 2011). As this scale has been published afer our data
collection has been finished, it is not included in the presented studies. For a general extension of the
item pool, and to provide items for the intimacy, and lacking fear scales, 63 new items were created by
the authors (see Appendix A). New items were constructed as statements with the aim to reflect the
definitions of motives (as given above) as clearly as possible. Furthermore, we took care not to
duplicate already existing items. Overall, 217 items were administered.
Two diferent item formats were present in the current study3: items formulated as statements,
which require an agreement rating (PRF, AMS, MAFF, MSR, and the newly constructed items), and
goals, which require an importance rating (PVQ, and GOALS items). Regardless of the response
format of the original inventories, all items were answered on a 6-point Likert scale. Response options
ranged from 0 (does not ft at all) to 5 (fts perfectly) for statements and from 0 (not important) to 5
(extremely important) for goals. The presentation order of questionnaires was randomized between
participants to remove efects of order and test fatigue.
2.1.3. Data-analytic strategy. We took several analytical steps to investigate the content and
1 We found only an unvalidated ad hoc scale based on McAdams’ TAT coding system (Craig, Koestner, & Zurof, 1994). Beyond that, there are several measures that assess intimacy-related constructs, such as intimate interactions, intimate experiences, or intimacy status with regard to specific persons (for an overview, see Prager, 1995). None of them, however, assesses the general desire for intimacy.2 The multi-motive-grid (Sokolowski, Schmalt, Langens, & Puca, 2000) provides hope and fear components for all big three motives. But as this inventory is targeted to measure motives on a semi-implicit level, it is beyond the scope of our current analyses of explicit motives.3 There is empirical evidence that diferent response formats within one scale are no obstacle for measuring the same latent construct (Funk & Rogge, 2007; Hohensinn & Kubinger, 2011).

UNIFIED MOTIVE SCALES 8
the structure of the motive scales and to finally construct the UMS. First, to explore the nomological
network and the structure of existing motive questionnaires, we analyzed the content of the joint item
pool by clustering similar items together (2.1.4). Second, we explored the factorial structure of these
content clusters with an exploratory factor analysis (2.1.5.). Third, out of the completed item pool, we
selected items that best represented the latent motive factors (2.1.6.). These items, finally, were
submitted to a scale analysis based on item response theory to construct optimal scales (2.1.7. and
2.1.8.).
The psychometric properties of the final UMS inventory are then described in section 2.2. Due
to the large sample size, even negligible efects could be significant. Therefore, we based our statistical
inferences mainly on efect sizes (Cohen, 1992).
2.1.4. Content clusters of motive inventories. Several items of diferent inventories covered
the same content. To group similar items, items were clustered by the Partitioning Around Medoids
(PAM) clustering algorithm (Kaufman & Rousseeuw, 1990) from the cluster package (Maechler,
Rousseeuw, Struyf, & Hubert, 2005). Compared to the classical k-means approach, this algorithm is
more robust against noise and outliers. To explore the optimal number of clusters, all cluster solutions
from 20 to 100 clusters were computed. The average silhouette width, which is an index for the quality
of the cluster solution, was compared. A clear local maximum of cluster quality was found for the 45-
cluster solution. Each cluster represented a distinct cluster of item content, and clusters were labeled
according to their content (see Table 1). Thirteen clusters (most of them consisting of one or two
items) were removed, as their item content obviously did not fit into the realm of motives, or they had
multiple negations. For the final 32 clusters, cluster scores were calculated for each participant by
averaging the item scores for each cluster.
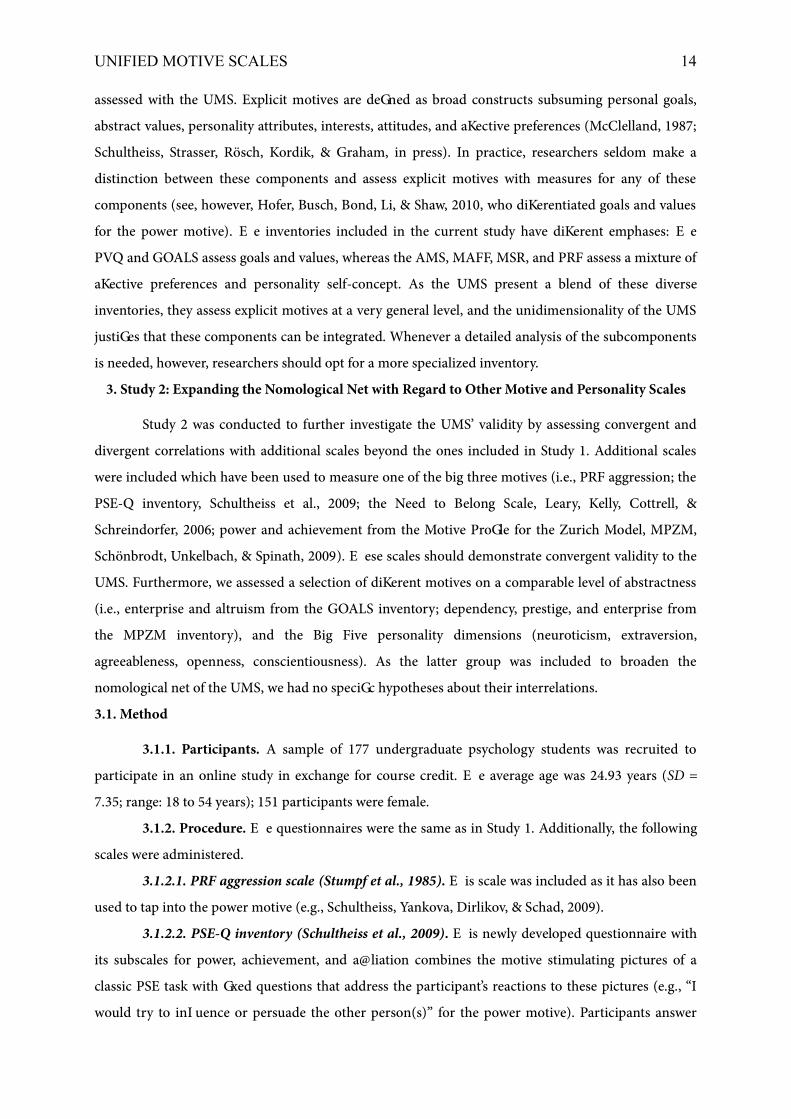
2.1.5. The structure of content clusters. To explore the structure of these 32 content clusters,
we performed an exploratory factor analysis. The 32 cluster scores were analyzed in an exploratory
principal axis factor analysis with a subsequent promax rotation. A parallel analysis (Horn, 1965)
suggested the extraction of five factors, which accounted for 55% of the overall variance. Factors could
easily be interpreted as the four hope components and one single fear factor (see Table 1).
Only three clusters did not load primarily on their intended factor. The cluster Power: Anger
upon losing control showed similar loadings on the fear factor (.55) and on the power factor (.48).
Likewise, the cluster Achievement: Perfectionism showed loadings on both the fear (.65) and the
achievement (.42) factors, illustrating the “dark side” of perfectionism (e.g., Stoeber, Otto, Pescheck,
Becker, & Stoll, 2007). Finally, the cluster Afliation: Curiosity (with items like “Sometimes I prefer
being with strangers than with familiar people”) had a uniqueness of .85 and did not load substantially
on any factor, which could point to a distinct curiosity motive beyond the five motives represented by
the factor solution (Gubler & Bischof, 1991; Kashdan et al., 2009; Schneider & Schmalt, 2000). By

UNIFIED MOTIVE SCALES 9
combining the strengths of all employed inventories, by employing a large number of items, and by
controlling for substantial secondary loadings on some scales, these factors were assumed to be good
indicators of the true latent dimensions of motives.
2.1.6. Candidate items for the UMS hope scales. Next, out of the complete item pool, we
selected candidate items that best represented the underlying hope dimensions. Therefore, for each
dimension, we selected items that showed a convergent correlation ≥ .40 with the target factor and
divergent correlations < .25 with all other factors. Theoretically, and based on previous empirical
findings, we expected an intercorrelation between the two agentic motives (power and achievement)
and between the two communal motives (affiliation and intimacy). Therefore, we relaxed the second
condition in such a way that higher secondary correlations were allowed between these pairs of
motives. In these cases, it was required only that the item correlated higher with the designated factor
than with the other factor.
To assess local item independence and to identify redundant items in this set of candidate
items, partial interitem correlations were calculated, controlling for the common factor. Items with a
partial r > .40 were treated as redundant; in this case, the item with the higher correlation with the
main factor was kept in the item set. This selection process resulted in 17, 18, 19, and 12 candidate
items for power, achievement, affiliation, and intimacy, respectively.
Unidimensionality of each item set was examined by comparing the eigenvalues of an EFA.
The ratio of eigenvalues from the first to the second factor was 12.71 for power, 8.06 for achievement,
12.81 for affiliation, and 7.27 for intimacy. These ratios were taken as evidence of unidimensionality.
2.1.7. Estimation of a graded response model for each hope scale. Next, we estimated a
graded response model (GRM; Samejima, 1969) with the complete item set of all inventories for each
motive. The ltm package was used for model estimation (Rizopoulos, 2006). Whereas the traditional
IRT approach represented by the Rasch model is applied to binary choice tasks, the GRM extends the
IRT framework to Likert-type ordinal answers. The GRM simultaneously estimates latent trait scores
for each participant and response curves for each item. By doing so, the probability of endorsing a
certain response option for a specific item is estimated as a function of the latent trait.4
The inclusion of all items allows the comparison of all existing scales with respect to their
properties on a common latent scale. For each dimension, UMS subscales with 10, 6, and 3 items were
built out of the selected candidate items, optimizing both measurement precision and content
coverage across content clusters.
2.1.8. Item selection for the UMS fear scales. As halve of the fear scales were newly
constructed, we took a slightly diferent approach toward the selection of fear items. Although all fear
4 For relatively nontechnical introductions and applications of the GRM to personality questionnaires, see for
example, Edwards (2009), Fraley, Waller, and Brennan (2000), or Scherbaum, Cohen-Charash, and Kern (2006).

UNIFIED MOTIVE SCALES 10
clusters collapsed on one factor in the cluster level EFA, we examined the fear items for a lower order
structure. Therefore, we partialed out the common fear factor (i.e., the first factor of the item-level
EFA) and ran a secondary EFA on the residuals. A parallel analysis suggested the extraction of seven
factors, which produced a relatively clear simple structure afer a promax rotation.5 The factors could
be identified as Power: Fear of losing control, Power: Fear of losing prestige, Afliation: Fear of rejection
(positively worded), Afliation: Fear of rejection (negatively worded), Intimacy: Fear of losing emotional
contact, Achievement: Fear of failure, and Afliation/Intimacy: Fear of loneliness. As the two fear of
rejection factors were correlated, we collapsed them into one scale for further analyses. The factor fear
of loneliness showed equally high correlations with fear of rejection and fear of losing emotional contact.
Item wordings of this factor were ambiguous with regard to whether loneliness refers to the loss of a
beloved person (which would relate to intimacy) or whether it refers to the mere state of not being
with any other people (which would relate to affiliation). Due to this ambiguity, this factor was
dropped from further analyses.
Subsequently, the three items with the highest loadings on each factor were selected for the
UMS fear scale (except fear of losing prestige, which had only two items), resulting in 14 items overall.
As the resulting fear scale is a multifaceted construct, it can be best described by a
multidimensional IRT model, namely, the bifactor GRM model (Gibbons et al., 2007; Wirth &
Edwards, 2007). This model assumes that item responses are determined by a general factor and by
subdomains, which are formed by item parcels. Using the BIFACTOR program (Gibbons et al., 2007),
we estimated a unidimensional model as the baseline model and a bifactor model with fear facets as
subdomains. The bifactor model showed a significant improvement in fit compared to the
unidimensional model, χ2(df = 14) = 1,497.00, p < .001, and an excellent absolute model fit as indicated
by a root mean square error (RMSE) of .005 between observed and expected proportions of responses
(Gibbons et al., 2007). However, we want to make clear that this bifactor model is a post-hoc
evaluation of the obtained data structure and should be rather treated as a starting point to stimulate
future research on the fear components of motives.
To summarize, fear items indeed loaded on one common factor, but they also showed a clear
secondary structure of facets related to each motivational domain. Consequently, the UMS provides a
full fear scale of 14 items, which also allows the computation of facet scores with two or three items
per facet. Additionally, we constructed 10-, 6- and 3-item versions of the fear scale, which were
designed to capture only the common fear component with maximum precision.
2.2. Results
In the following sections, we report the psychometric properties of the UMS inventory. For a
5 To save space, the complete set of tables of factor loadings and intercorrelations was not printed here, but can
be obtained from Felix Schönbrodt.

UNIFIED MOTIVE SCALES 11
complete list of the final UMS items, see Appendix A (Tables A1 and A2). Table 2 reports descriptive
statistics for all scales.
2.2.1. Reliability. Whereas in classical test theory measurement precision is expressed with
one single index (usually Cronbach’s α) for all persons and items (i.e., across the whole range of the
latent trait), the GRM model allows researchers to distinguish measurement precision across diferent
regions of the latent trait. For example, some scales may be particularly suited for diferentiating
respondents at the high end of the trait, but may fail to diferentiate respondents at the low end. Test
information curves (TICs) are a way of displaying measurement precision at diferent positions of the
latent trait. TICs for all hope scales except the intimacy motive are displayed in Figure 1 (Panels A -
C). TICs plot the combined information of the scale on the y-axis against the estimate of the latent
trait (called theta) on the x-axis. As theta can be equated with a standardized z-score, a reasonable
range of theta is from -3 to +3. The metric of the test information can be converted to a traditional
reliability metric expressed by a correlation coefficient (Thissen, 2000). As a rule of thumb, test
information of 3.5 (which corresponds to an α of .70) is sufficient for a research instrument; for
individual diagnostics, test information should be greater than 6.5 (corresponding to an α of .85).
Furthermore, the test information I at a certain theta level can be easily converted into the standard
error of measurement (SEM), by taking the square root of 1/I (Thissen, 2000).
For the scales displayed in Figure 1, the TIC for the 10-item UMS subscale is uniformly higher
than the TIC of any of the established scales for virtually all ranges of theta. The six-item UMS
subscales have an intermediate position, coming close to the longer scales of the PRF (16 items) and
the PVQ (10 items). The ultra-short three-item scales still show considerably high test information.
The TIC for the intimacy motive scale (see Figure 2), however, shows insufficient properties: The test
information has a sharp drop for participants with an above average theta value. Furthermore, overall
test information is unsatisfactory for the six- and three-item scales. For this reason, we revised the
intimacy motive scale in Study 3. TICs for the main fear scales are displayed in Figure 1 (Panel D). 6
(Although generally working in an IRT framework, Table 2 also reports Cronbach’s αs for all scales.)
2.2.2. Trait estimates. We compared Bayes’ estimates of the latent trait, derived from each IRT
model, with the simple item average of each scale. These diferent methods of trait estimation showed
a correlation >.95 for all scales, and correlations with other scales did not change significantly.
Therefore, we conclude that for the sake of simplicity, it was sufficient to calculate item averages for
further analyses (see also Embretson & Reise, 2000).
2.2.3. Content coverage of long and short scales. We correlated existing motive scales and the
6 In a supplementary study, we examined the test-retest reliability of the UMS in a sample of 48 undergraduate students over a period of 1 week. Test-retest correlations were .94 for power, .91 for achievement, .95 for affiliation, .91 for intimacy, and .86 for the main fear factor. Concerning the fear facets, test-retest correlations were .88 for fear of rejection, .83 for fear of losing emotional contact, .85 for fear of failure, .78 for fear of losing control, and .64 for fear of losing prestige.

UNIFIED MOTIVE SCALES 12
new UMS subscales with the cluster scores from the content clusters. The resulting table of
correlations (see Appendix B) reveals key aspects that are captured by the diferent scales. This table
provides a rich nomological network of the investigated scales and can serve as a guide for researchers
to select the most appropriate instrument with regard to the aspect that is investigated.
Critics of short scale development (Smith, McCarthy, & Anderson, 2000) caution that short
scales ofen are streamlined toward the main factor, which could therefore cause parts of the
construct’s domain to be systematically eliminated. This concern, however, is unfounded for the UMS
short scales. As can be seen in Table B1, even the three-item scales show correlations with the content
clusters that are comparable to the full scales. To judge the efect sizes of the diferences in content
coverage between the full scale and the reduced scales, we used q, an efect size measure for diferences
in correlations (Cohen, 1992). For the six-item hope scales, 20 out of 24 diferences were trivial (q < .
10) and four had small efect sizes (.10 ≤ q < .30). For the three-item hope scales, 12 diferences were
trivial, 10 had small efect sizes, and two had medium efect sizes: The content cluster Achievement
Goals was captured less by the three-item scale (r = .74) than by the 10-item scale (r = .89; q = .47), and
Afliation Contacting was captured less by the three-item scale (r = .72) than by the 10-item scale (r = .
86; q = .39). Concerning the main fear factor, it was more difficult to obtain broad content coverage
due to the multifaceted nature of the fear factor. For the six-item fear scale, four out of eight
correlation diferences from the full 14-item scale were trivial, and four were small. For the three-item
fear scale, five diferences were trivial, and three were small. It should be noted that items for the six-
and three-item fear scales were selected mainly with the goal of assessing the general fear factor with a
high precision (e.g., no fear of losing reputation item is in the six-item version). Capitalizing on the
main factor therefore could narrow the breadth of these scales.
2.2.4. Convergent and divergent validities of the hope scales. Table 3 displays the multitrait-
multimethod matrix for the hope scales (Campbell & Fiske, 1959)7. The median convergent
correlations amongst existing hope scales were .61 (Power), .52 (Achievement), and .67 (Affiliation).
The median convergent correlations between the respective UMS subscales and the existing scales
were .81, .66, and .84. Hence, on average, the UMS subscales showed higher correlations with all of the
existing questionnaires than these questionnaires did amongst each other.
To assess the divergent correlations of the hope scales within each inventory (i.e., the
selectivity to discriminate diferent motives), we computed the median correlation of the heterotrait-
monomethod triangle of each inventory consisting of more than two scales. The lowest values were
found for the UMS and PVQ (both .13), followed by the GOALS (.18) and the PRF (.19). To assess the
divergent correlation across all inventories, we computed the median correlation of all divergent
correlations for each inventory. The lowest values were found for the UMS (.12), closely followed by
7 A full correlation matrix including all fear scales can be downloaded from the online supplementary material.

UNIFIED MOTIVE SCALES 13
the PRF, PVQ, and GOALS (.14).
UMS fear of failure showed a high correlation with AMS fear of failure (r = .95; actually, the
UMS fear facet is a subset of the AMS fear of failure items), and UMS fear of rejection showed a
correlation of .66 with the MSR scale. UMS intimacy showed a correlation of .77 with GOALS
intimacy.
2.3. Discussion
A nomological network of motive questionnaires was laid out, showing that diferent
questionnaires highlight diferent aspects of the motives. Four new scales for the hope motives and a
multifaceted scale for the fear motive were constructed based on 154 existing and 63 newly developed
items. Based on the graded response model, the new scales were constructed to map onto the
underlying dimensions of explicit motives. The resulting scales have several advantageous properties.
First, in comparison to existing inventories, all UMS subscales have the highest information
overall and the highest information density per item. This means that the latent trait can be measured
with a higher precision, even with fewer items than previous scales. Second, short scales are provided.
These measure the same latent dimensions as the full scales. Predominantly trivial or small efect sizes
concerning diferences in content coverage were found for the six-item scales (100%) and for the
three-item scales (92%). Hence, these short scales can provide a good comparability between studies
employing either the full or the short scales. Third, on average, the UMS subscales show higher
convergent correlations with previous questionnaires than these questionnaires show amongst each
other, and they show the lowest divergent correlations of all inventories.
The study also reveals new insights about the structure of explicit motives. For the first time,
fear components of all big motives were assessed simultaneously. Preliminary evidence that a strong
common factor underlies all fear motives (Engeser & Langens, 2010; Costa & McCrae, 1988) has now
been affirmed for a larger set of fear motives. However, the fear facets do not measure all the same – a
bifactor model with a general fear factor and additional domain-specific factors provided the best fit
for the fear items. That means, despite the strong common factor, the fear facets showed quite diferent
correlations with other scales (see also the Results from Study 2, Table 4). Hence, we recommend
diferentiating among the fear facets even though they have a strong common source of variance.
Furthermore, affiliation and intimacy were distinguishable constructs. Content clusters of the
two motives loaded on separate factors, and the correlation between the scales (r = .37) was even
smaller than the correlation between the two agentic scales (r = .47). Concerning the power motive, a
potential limitation could be that prosocial aspects of the power motive (like helping others) were not
covered by the current item pool. This could lead to a partial mismatch of content coverage between
explicit and implicit motives.
Finally, we want to provide clarification regarding the theoretical status of the constructs
UNIFIED MOTIVE SCALES 14
assessed with the UMS. Explicit motives are defined as broad constructs subsuming personal goals,
abstract values, personality attributes, interests, attitudes, and afective preferences (McClelland, 1987;
Schultheiss, Strasser, Rösch, Kordik, & Graham, in press). In practice, researchers seldom make a
distinction between these components and assess explicit motives with measures for any of these
components (see, however, Hofer, Busch, Bond, Li, & Shaw, 2010, who diferentiated goals and values
for the power motive). The inventories included in the current study have diferent emphases: The
PVQ and GOALS assess goals and values, whereas the AMS, MAFF, MSR, and PRF assess a mixture of
afective preferences and personality self-concept. As the UMS present a blend of these diverse
inventories, they assess explicit motives at a very general level, and the unidimensionality of the UMS
justifies that these components can be integrated. Whenever a detailed analysis of the subcomponents
is needed, however, researchers should opt for a more specialized inventory.
3. Study 2: Expanding the Nomological Net with Regard to Other Motive and Personality Scales
Study 2 was conducted to further investigate the UMS’ validity by assessing convergent and
divergent correlations with additional scales beyond the ones included in Study 1. Additional scales
were included which have been used to measure one of the big three motives (i.e., PRF aggression; the
PSE-Q inventory, Schultheiss et al., 2009; the Need to Belong Scale, Leary, Kelly, Cottrell, &
Schreindorfer, 2006; power and achievement from the Motive Profile for the Zurich Model, MPZM,
Schönbrodt, Unkelbach, & Spinath, 2009). These scales should demonstrate convergent validity to the
UMS. Furthermore, we assessed a selection of diferent motives on a comparable level of abstractness
(i.e., enterprise and altruism from the GOALS inventory; dependency, prestige, and enterprise from
the MPZM inventory), and the Big Five personality dimensions (neuroticism, extraversion,
agreeableness, openness, conscientiousness). As the latter group was included to broaden the
nomological net of the UMS, we had no specific hypotheses about their interrelations.
3.1. Method
3.1.1. Participants. A sample of 177 undergraduate psychology students was recruited to
participate in an online study in exchange for course credit. The average age was 24.93 years (SD =
7.35; range: 18 to 54 years); 151 participants were female.
3.1.2. Procedure. The questionnaires were the same as in Study 1. Additionally, the following
scales were administered.
3.1.2.1. PRF aggression scale (Stumpf et al., 1985). This scale was included as it has also been
used to tap into the power motive (e.g., Schultheiss, Yankova, Dirlikov, & Schad, 2009).
3.1.2.2. PSE-Q inventory (Schultheiss et al., 2009). This newly developed questionnaire with
its subscales for power, achievement, and affiliation combines the motive stimulating pictures of a
classic PSE task with fixed questions that address the participant’s reactions to these pictures (e.g., “I
would try to influence or persuade the other person(s)” for the power motive). Participants answer

UNIFIED MOTIVE SCALES 15
with a binary choice (yes/no). The PSE-Q was developed to provide a measure of explicit motives that
is structurally as close as possible to the measurement of implicit motives using the Picture Story
Exercise (PSE; Winter, 1991).
3.1.2.3. Need to Belong Scale (Leary et al., 2006). The need to belong (NTB) is a prominent
construct in social psychology (Baumeister & Leary, 1995). Its definition closely resembles typical
definitions of the affiliation and intimacy motives: “a pervasive drive to form and maintain at least a
minimum quantity of lasting, positive, and significant interpersonal relationships” (Baumeister &
Leary, 1995, p. 497). This strand of theorizing usually focuses on the general tendency and the
fundamentality of the need to belong for any person. Interindividual diferences, specifically the
dissociation of the fundamental motivational tendencies of approach and avoidance, have rarely been
taken into consideration (cf. Macdonald & Gere, 2010). Some researchers, however, have used a
questionnaire to measure interindividual diferences in the need to belong (the Need to Belong Scale;
NTBS; Leary et al., 2006; German adaptation by Renner, 2006). This scale assesses the NTB on 10
items such as “My feelings are easily hurt when I feel that others do not accept me.”
3.1.2.4. GOALS inventory (Pöhlmann & Brunstein, 1997). In addition to the scales already
employed in Study 1, two additional scales were included: enterprise and altruism.
3.1.2.5. Motive Profle for the Zurich Model (MPZM; Schönbrodt et al., 2009). This inventory
provides five motive scales based on the Zurich model of social motivation (Gubler & Bischof, 1991):
dependency, enterprise, power, prestige, and achievement. Each scale consists of six items.
3.1.2.6. Big Five Inventory (BFI-10; Rammstedt, 2007). Finally, a short measure with two
items for each dimension of the Big Five personality factors was included.
3.2. Results and Discussion
Table 4 shows the bivariate correlations between the UMS subscales and the other motive and
personality scales, as well as internal consistencies, means, and standard deviations8. Study 2 supports
the findings of Study 1 by replicating the convergent validity of the UMS subscales and by establishing
convergent correlations with additional questionnaire scales.
The current study shows several secondary correlations of some of the other motive scales. For
example, due to its low convergent correlation with other measures of power, we would not
recommend using the PRF aggression scale for the assessment of the power motive. Other examples of
“impure” scales include the PVQ affiliation scale, which is a mixture of affiliation and intimacy, and
both the PRF dominance and achievement scales, which show considerable negative correlations with
the UMS fear scale.
The PSE-Q scales showed only moderate (power: .34; achievement: .40) to low (affiliation: .18)
convergent correlations with the UMS. Furthermore, they showed rather high intercorrelations of r = .
8 A data file with the full correlation matrix from Study 2 can be found in the online supplementary material.

UNIFIED MOTIVE SCALES 16
64 (power–achievement), .30 (power–affiliation), and .39 (achievement–affiliation).
The Need to Belong scale (NTBS) is a mixture of hope and fear components, equally
correlating with UMS affiliation, intimacy, and fear. A reanalysis of the NTBS items showed that the
two components could be dissociated to some extent: the NTBS hope subscale (items 4, 6, 7, and 8; α
= .75) and the NTBS fear subscale (items 1, 2, 3, 5, and 10; α = .81). Although these subscales still had
a considerable overlap of r = .47, they showed a more diferentiated pattern of correlations with the
UMS hope and fear scales (see Table 4). Therefore, we encourage researchers to reanalyze their NTBS
data with regard to the two proposed subscales to diferentiate between approach and avoidance
tendencies.
Concerning the Big Five personality scales, some typical correlational patterns were obtained
(cf. Engeser & Langens, 2010). Neuroticism showed a strong connection to the fear factor (r = .62),
extraversion to affiliation (r = .64), and conscientiousness to achievement (r = .34). In contrast to
Engeser and Langens (2010), agreeableness in our sample did not show a strong negative relation with
power (r = -.18), but rather showed positive relations with affiliation and intimacy (rs = .30 and .31).
To summarize, the convergent validity of the UMS inventory was replicated and extended to
additional personality scales. Taking together the results from Studies 1 and 2, a comprehensive
nomological net between motive questionnaires and related personality scales has been established.
4. Study 3: Revision of the Intimacy Scale
Test information curves of the intimacy scale were not optimal in Study 1. Whereas it
provided a sufficient precision of measurement for participants with a low intimacy motive, test
information showed a significant drop for participants scoring above average. Consequently, we
developed 13 theory-driven additional items with the aim of increasing measurement precision at the
high end of the intimacy motive scale (e.g., “Getting close to someone is the only thing that matters in
life” or “Sometimes I feel a deep connection and complete unity with another person.” For a complete
list of items, see the Appendix A). Additionally, as the intimacy motive scale is a rather new
development in contrast to the other three motives, we sought to establish convergent and divergent
validity with additional personality scales beyond the ones used in Studies 1 and 2.
A major area of life in which intimacy is expressed and experienced in Western cultures is in
close romantic relationships (Prager, 1995). We aimed to demonstrate that the UMS intimacy scale is
related to, without being redundant with, established personality constructs in the area of close
relationships. Therefore, we assessed five scales related to close relationships: two dimensions of
attachment style (attachment avoidance and attachment anxiety; Fraley et al., 2000), the desire for
closeness to the partner and the desire to be alone (Hagemeyer, Neyer, Neberich, & Asendorpf, 2012),
as well as a pictorial measure of closeness (Aron, Aron, & Smollan, 1992). Furthermore, we asked
participants who were currently involved in a romantic relationship about their relationship

UNIFIED MOTIVE SCALES 17
satisfaction.
We had specific hypotheses about the correlations between these scales. Attachment avoidance
is a certain style of coping with attachment-related threats (Mikulincer & Shaver, 2005). When such a
threat occurs, avoidant individuals engage in deactivating strategies with the goal of avoiding
frustration. This goal is attained by the denial of attachment needs, the avoidance of closeness and
dependence in close relationships, as well as eforts to maximize emotional and physical distance. The
desire to be alone has a goal that is similar to having distance from the partner (note, however, that in
the latter construct, this is not because of an avoidance of the partner, but because being alone is a
valued goal state in its own right; Hagemeyer et al., 2012). As these goals are quite contrary to the
definition of the intimacy motive, we expected intimacy to be negatively correlated with both scales.
On the other hand, we expected a positive correlation with the desire for closeness and the pictorial
measure of closeness. We did not expect a correlation between the intimacy motive scale and
attachment anxiety. The latter should rather be related to the UMS fear scale, specifically to its
communal facets fear of rejection and fear of losing emotional contact.
4.1. Method
4.1.1. Participants. Four hundred seventy-eight persons (341 female) participated in an
online study. The average age was 25.35 years (SD = 7.48, range: 16 - 61). Two hundred seventy-four
participants (215 female) were currently involved in a serious relationship, of which the average
relationship duration was 55 months (SD = 65 months, range: 1 month - 33 years).
4.1.2. Procedure. In addition to the UMS, including the newly developed items for the
intimacy motive, all participants completed the following scales.
4.1.2.1. Attachment Style (ECR-R; Fraley et al., 2000). A short version of the revised
Experiences in Close Relationships questionnaire was employed to assess generalized attachment
anxiety and avoidance. Each scale consists of 10 items on a 7-point Likert scale and showed good
internal consistencies in the current study (αs > .88).
4.1.2.2. Inclusion of other in the self scale (IOS; Aron et al., 1992). This single-item scale
displays seven pictures of two increasingly overlapping circles, which were labeled self and partner. All
participants were asked about the perceived interconnectedness between themselves and their ideal
(not their current) romantic partner.
4.1.2.3. Desire for closeness and desire for being alone (Hagemeyer et al., 2012) . These scales
measure the desire for closeness to one’s intimate partner and the desire to be alone with eight items
each on a Likert scale ranging from 1 (never) to 7 (always). Internal consistencies in the current study
were > .86.
4.1.2.4. Relationship satisfaction. Participants currently involved in a romantic relationship
(n = 303) additionally completed the Relationship Assessment Scale (RAS; Hendrick, Dicke, &

UNIFIED MOTIVE SCALES 18
Hendrick, 1998). This seven-item questionnaire measures satisfaction with one’s current relationship
on a 7-point Likert scale (α = .83).
4.2. Results
4.2.1. Item selection for the new intimacy motive scale. We conducted an IRT analysis of the
new set of intimacy motive items with the same procedure as described in Study 1. We selected
optimal items according to the IRT analyses, resulting in a new scale consisting of five items from the
original set and five of the newly constructed items. TICs for the full scale (10 items) as well as the
short scales (six and three items) are displayed in Figure 2, along with the TICs from the original
intimacy motive scale from Study 1 and the TIC of the GOALS intimacy subscale. A visual inspection
shows a clear improvement in measurement precision in all theta regions in contrast to the original
intimacy scale.
4.2.2. Convergent correlations. Bivariate correlations between the UMS subscales and other
inventories are presented in Table 5. As expected, the new UMS intimacy scale showed a negative
correlation both with attachment avoidance (r = -.54) and with the desire to be alone (r = -.45), and a
positive correlation with the pictorial IOS measure of desired closeness (r = .44) and the desire for
closeness with one’s partner (r = .48). As expected, attachment anxiety showed the highest correlation
with the main fear factor (r = .40), as well as with the facets fear of losing emotional contact (r = .29)
and fear of rejection (r = .36).
4.3. Discussion
The new items improved the measurement precision of the intimacy motive scale. Although
TICs still showed a drop for participants above average (starting from a theta value of about 0.3),
overall test performance of the 10-item scale became satisfactory up to a theta value of +2. The four-
item intimacy subscale from the GOALS inventory showed remarkable test information in the low
regions of the trait; for person high in intimacy motivation, however, precision dropped virtually to
zero.
Furthermore, the intimacy motive scale demonstrated convergent validity with established
measures related to close relationships. Study 3 further established the usefulness of the distinction
between the intimacy motive and the affiliation motive. Whereas the two communal motives had a
considerable overlap (r = .41 in Study 3), they clearly could be dissociated in the domain of close
relationships. For all relevant convergent coefficients, the affiliation motive scale showed significantly
lower correlations than the intimacy motive scale (attachment avoidance: -.21 vs. -.54; desire for
closeness: .17 vs. .48; IOS: .11 vs. .44; p < .001 for all diferences between correlations).
5. Study 4: Predictive and Incremental Validity of the UMS
To validate the UMS with regard to achievement-, power-, and affiliation-motivated behavior,

UNIFIED MOTIVE SCALES 19
a fourth study was conducted in which diferent typical indicators of these motives were assessed. In
line with research conducted by Lang and Fries (2006) concerning achievement-motivated behavior,
we expected that individuals with a high achievement motive should (a) perform better (Heckhausen
& Heckhausen, 2008; Spangler, 1992), (b) have more task enjoyment while working on achievement-
related tasks (Puca & Schmalt, 1999), and (c) evaluate themselves more positively afer working on
achievement-related tasks (Heckhausen & Heckhausen, 2008).
Kahnemann, Knetsch, and Thaler (1986) proposed an experiment known as the dictator
game. In this game, two players are randomly assigned to the role of the dictator or of the receiver. The
dictator gets a fictitious amount of money (in this study, 100 Eurocents) and can give as much or as
little to the receiver as he or she wishes, and the receiver cannot reject it. Dictator and recipient are
anonymous in the sense that neither knows the identity of the other. The standard economic analysis
of the dictator game pivots on the assumption that individuals prefer having more money to having
less: as a rational actor, the dictator should take all the money for him- or herself, leaving nothing for
the recipient. Laboratory studies of the dictator game, however, report a wide dispersion of givings in
the dictator game. Some dictators give nothing, but others give away as much as 50% of the money.
Economists as well as psychologists have studied this surprising outcome by taking several variables
into account, such as experimenter observation or social distance (for an overview, see Engel, 2011).
To our knowledge, no study has investigated relations between underlying power and affiliation
motives and behavior in dictator games. We expected that individuals with high power motives should
be more dominant in dictator games (i.e., should give less money), whereas individuals with high
affiliation motives should be more cooperative (i.e., should give more money). Furthermore, as the
dictator game is about anonymous strangers, the intimacy motive should be unrelated to the dictator’s
allocations.
5.1. Method
5.1.1. Participants. A sample of 96 students was recruited at a German university. The average
age was 23.50 years (SD = 4.55); 55 participants were female. Students received course credit in
exchange for their participation. The study was conducted in the laboratory in group sessions of up to
six individuals. Upon arrival, participants were seated at individual computer stations where they
completed the UMS, the PRF achievement, dominance, and affiliation scales, and the AMS hope for
success scale. Afer that, they worked on three Sudoku puzzles of medium difficulty, rated their
enjoyment aferwards, and evaluated their performance. They then had to play a dictator game.
Finally, they were fully debriefed and thanked.
5.1.2. Procedure
5.1.2.1. Sudoku puzzles. Three Sudoku puzzles of medium difficulty were chosen due to the
achievement character and its reliance on logical reasoning (e.g., Barber, Grawitch, & Munz, 2012).

UNIFIED MOTIVE SCALES 20
Participants were instructed on how to complete a Sudoku puzzle, emphasizing strategies for logical
solving rather than a trial and error strategy. Participants were then given 5 min to complete the
Sudoku puzzles. Task progress was measured by number of cells completed.
5.1.2.2. Task enjoyment. To assess task enjoyment, we used three items afer participants
completed the Sudoku puzzles (see Lang & Fries, 2006). Participants responded on a 5-point scale.
5.1.2.3. Positive self-evaluation. Afer completion of the Sudoku puzzles, we assessed positive
self-evaluation with two items (“How happy do you feel about your performance on the task?” and
“How proud of your test performance are you afer working on these tasks?”; see also Lang & Fries,
2006). Participants answered on 5-point scales.
5.1.2.4. Dictator game. In the dictator game, we assigned the role of the dictator to all of the
participants. Afer being introduced into the game, participants could allocate 0-100 Cents to their
fictitious partner in another room.
5.2. Results
Table 6 summarizes the descriptive statistics, internal consistencies (Cronbach’s α), and
intercorrelations of all variables. All achievement scales correlated significantly with the Sudoku-
related variables to varying degrees (r = .26 to .50). Unexpectedly, also the power scales showed a
considerable correlation to the Sudoku-related variables (r = .21 to .40). Concerning the dictator game
allocation, both power scales were significantly correlated with the allocated amount of money (PRF
dominance: r = -.31, UMS power: r = -.37). UMS affiliation turned out to be a significant predictor (r
= .21), in contrast to PRF affiliation (r = -.01). As expected, UMS intimacy was unrelated to dictator
game allocations (r = .05).
As an additional analysis, game variables were regressed onto all relevant predictor scales.
Using these multiple regressions, commonality analyses (CAs; Nimon, Lewis, Kane, & Haynes, 2008;
Seibold & McPhee, 1979; see Tables 7 and 8) were performed. CAs are especially useful in the presence
of multicollinearity (Kraha, Turner, Nimon, Zientek, & Henson, 2012), as they provide information
about how much of the explained variance in the criterion can be uniquely attributed to a single
predictor or to the shared variance of any combination of predictors. In the prediction of the
achievement-related criteria, we entered all achievement scales and the power scales into the
commonality analysis. Table 7 summarizes the results by splitting the predictive power of each scale
into unique parts (i.e., the proportion of R² that is uniquely predicted by this scale) and common parts
(i.e., the proportion of R² that is predicted by the common variance that this scale shares with at least
one other scale). For each criterion, UMS achievement has the highest share of unique, incremental
predictive power and the highest predictive power overall (unique + common). Grouping all
achievement scales and all power scales together, explanatory power can be decomposed into three
sources of predictor variance: 52.2% of R² (averaged across the three criteria) can be uniquely

UNIFIED MOTIVE SCALES 21
attributed to the group of achievement scales, 9.4% uniquely to the group of power scales. The rest,
38.4%, is due to the common variance between achievement and power scales (the "agentic core").
Regarding the prediction of dictator game allocations, Table 8 shows that UMS affiliation
uniquely contributed to 24%, and UMS power uniquely contributed to 22% of overall explained
variance, whereas the unique contribution of the PRF scales was below 5%.
5.3. Discussion
As a first validation, we were able to show that UMS achievement predicted performance on a
Sudoku puzzle, task enjoyment, and positive self-evaluation above and beyond existing achievement
motive scales (AMS hope for success and PRF achievement). Furthermore, behavior in a dictator game
was significantly predicted by the UMS power and affiliation scales above and beyond existing motive
scales (PRF dominance, PRF affiliation). The UMS captured most of the explanatory variance of the
other scales, and additionally contributed the highest share of unique explanatory power.
Furthermore, the diferential predictive power of the UMS affiliation and intimacy scales provides
further support for the distinction of the two communal constructs. Study 4 provided a first test of the
incremental validity of the UMS subscales for the big three motives. Nonetheless additional studies are
needed to further address the predictive validity of the UMS intimacy and fear scales.
6. General Discussion
The present research provided an extensive nomological network for existing questionnaire
scales of explicit motives, as well as the construction and validation of a new inventory, the Unified
Motive Scales. In the first and second study, large samples were used to identify the common
underlying structure of the hope and fear motives. We investigated several existing scales used in
current research, each of them having demonstrated its validity multiple times. By combining the
strengths of these established scales, we built upon the assumption that we can estimate the true value
of the latent variables with much more precision than with any single scale. Based on this estimation
of the true value, we were able to select appropriate items from a very large item pool. These items
were selected and modeled afer the graded response model and have been shown to provide a higher
precision of measurement with fewer items than existing questionnaires.
6.1. The structure of motives
As proposed by other researchers, our results suggest a diferentiation between the
achievement, power, and affiliation motives. Furthermore, our data point towards a diferentiation of
the affiliation and intimacy motive, leading to an ensemble of two agentic (power and achievement)
and two communal motives (affiliation and intimacy). The notion that affiliation reflects the avoidance
component and intimacy the approach component of a general communal motive, as hypothesized for
the implicit affiliation/intimacy motive by Weinberger and colleagues (2010), could not be confirmed

UNIFIED MOTIVE SCALES 22
for explicit motives. Contrarily, in comparison to all other motives the intimacy approach motive
showed consistently the highest correlation with its fear component (fear of losing emotional contact).
This indicates that for most people a high approach motivation in intimacy goes together with fear
aspects.
Concerning the structure of fear components, a bifactor model had the best fit to the data: A
general fear factor influenced all fear items, and specific domain factors influenced items from each
motivational domain. Despite the strong common factor, the current studies show that the fear facets
show a rather distinct correlational pattern with other scales. Hence, concerning the question whether
there is one single motive for fear reduction (irrespective of specific domains), or domain-specific fear
components for each motive, the results of the current studies corroborate an intermediate position:
There is a strong underlying factor for all fear components, which is strongly related to neuroticism.
Still, the facets contain sufficient unique variance so that they can be treated and measured as distinct
domain-specific constructs. Therefore, we recommend that the full fear scale including the fear facets
be assessed whenever possible.
In an influential paper, Elliot and Thrash (2002) linked domain-general, dispositional
approach and avoidance temperaments, conceptualized as the behavioral activation system (BAS) and
behavioral inhibition system (BIS; Gray, 1982), to approach and avoidance goals in the achievement
domain (a similar result has been found for the affiliation motive; Gable, 2006). Although these
authors only argued within the achievement domain, their line of reasoning suggests that a
fundamental BIS sensitivity is a temperamental base for all avoidance motives. Hence, a strong general
BIS factor would induce correlations between fear components across all motivational domains, which
is what we have found. However, the same does not seem to apply to the approach motives: at least
both agentic and both communal motives are independent of each other, and if a fundamental BAS
sensitivity powers a general approach tendency, this is probably individually directed into diferent
domains.
The pattern of a strong common negativity factor partly corresponds to findings from another
area of research. Malle and Horowitz (1995) found that elements of negative self-schemas are more
tightly interconnected than elements of their corresponding positive schemas – when one element of
such a negative schema is activated, all others are activated more readily. These findings, however, are
only partly in line with the current results, as in these studies the spreading activation in negative
schemas was constrained within domains. A consistent negative self-view in one domain (e.g.,
introversion) did not correspond with a more consistent view in another domain (e.g., dependency).
Our results, in contrast, point to a spill-over across domains.
To summarize, several studies have shown a high interconnectivity of negative aspects.
Concerning the domain-generality of this spreading negativity, however, results are less consistent. For

UNIFIED MOTIVE SCALES 23
the motivational domain, our results point to a strong domain-general avoidance factor.
6.2. Practical aspects
Researchers have used many diferent questionnaires to assess explicit motives. Seldomly,
however, has a rationale for their choice been given. With our current results about content coverage
and measurement precision in diferent ranges of the latent trait, researchers can make an informed
choice about their instruments. For example, researchers mainly interested in the growth aspect of the
achievement motive could opt for the GOALS questionnaire; researchers interested in achievement
goals could opt for the PVQ or the UMS. Continuity with existing research is ensured as the UMS on
average show higher correlations with existing questionnaires than these questionnaires show amongst
each other. Beyond that, the new scales can measure the same constructs with improved accuracy,
precision, and economy. Therefore, greater statistical power and thus a greater chance for the
replicability of research is given, which is probably a step toward a greater convergence of
measurement and theory building in research on human motives. Given these properties of the UMS,
researchers can safely adopt the UMS for future research if their goal is to assess explicit motives on a
very general level. If a more detailed analysis of components of explicit motives is needed (e.g., goals
vs. values; cf. Hofer et al., 2010), more specialized inventories can be employed.
7. Conclusion
To summarize, we proposed an integrated inventory for explicit motives that (a) clearly
distinguishes between the affiliation and intimacy motives, (b) provides fear components for all
motives, and (c) provides short (six-item) and ultra-short (three-item) scales that measure the same
latent dimensions as the full scales. The present work contributes to a further understanding of the
structure of explicit motives and their hope and fear components. In addition, the current
measurement approach—assessing explicit motives and analyzing them via IRT—provides, in our
view, a better starting point for further theory building in the domain of explicit motives.

UNIFIED MOTIVE SCALES 24
ReferencesAron, A., Aron, E. N., & Smollan, D. (1992). Inclusion of Other in the Self Scale and the structure of
interpersonal closeness. Journal of Personality and Social Psychology, 63, 596-612. doi:10.1037//0022-3514.63.4.596
Bakan, D. (1966). The duality of human existence: an essay on psychology and religion. Chicago: Rand McNally.Barber, L. K., Grawitch, M. J., & Munz, D. C. (2012). Disengaging from a task – Lower self-control or adaptive
self-regulation. Journal of Individual Differences, 33, 76-82. doi:10.1027/1614-0001/a000064Baumeister, R. F., & Leary, M. R. (1995). The need to belong: Desire for interpersonal attachments as a
fundamental human motivation. Psychological Bulletin, 117, 497-529. doi:10.1037/0033-2909.117.3.497Brunstein, J. C., Schultheiss, O. C., & Grässmann, R. (1998). Personal goals and emotional well-being: The
moderating role of motive dispositions. Journal of Personality and Social Psychology, 75, 494-508. doi:10.1037//0022-3514.75.2.494
Campbell, D. T., & Fiske, D. W. (1959). Convergent and discriminant validation by the multitrait-multimethod matrix. Psychological Bulletin, 56, 81-105. doi:10.1037/h0046016
Cohen, J. (1992). A power primer. Psychological Bulletin, 112, 155-159. doi:10.1037//0033-2909.112.1.155Costa, P. T. J., & McCrae, R. R. (1988). From catalog to classification: Murray’s needs and the five-factor model.
Journal of Personality and Social Psychology, 55, 258–265. doi:10.1037/0022-3514.55.2.258Craig, J. A., Koestner, R., & Zurof, D. C. (1994). Implicit and self-attributed intimacy motivation. Journal of
Social and Personal Relationships, 11, 491-507. doi:10.1177/0265407594114001Edwards, M. C. (2009). An introduction to item response theory using the need for cognition scale. Social and
Personality Psychology Compass, 3, 507–529. doi:10.1111/j.1751-9004.2009.00194.xElliot, A. J., & Thrash, T. M. (2002). Approach-avoidance motivation in personality: Approach and avoidance
temperaments and goals. Journal of Personality and Social Psychology, 82, 804-818. doi:10.1037/0022-3514.82.5.804
Embretson, S. E., & Reise, S. P. (2000). Item response theory for psychologists. Mahwah, New Jersey: Routledge.Engel, C. (2011). Dictator games: A meta study. Experimental Economics, 14, 583-610. doi:10.1007/s10683-011-
9283-7.Engeser, S., & Langens, T. A. (2010). Mapping explicit social motives of achievement, power, and affiliation onto
the five-factor model of personality. Scandinavian Journal of Psychology, 51, 309-318. doi:10.1111/j.1467-9450.2009.00773.x
Fraley, R. C., Waller, N. G., & Brennan, K. A. (2000). An item response theory analysis of self-report measures of adult attachment. Journal of Personality and Social Psychology, 78, 350-365. doi:10.1037//0022-3514.78.2.350
French, E. G., & Chadwick, I. (1956). Some characteristics in affiliation motivation. The Journal of Abnormal and Social Psychology, 52, 296-300. doi:10.1037/h0045251
Funk, J. L., & Rogge, R. D. (2007). Testing the ruler with item response theory: Increasing precision of measurement for relationship satisfaction with the Couples Satisfaction Index. Journal of Family Psychology, 21, 572-583. doi:10.1037/0893-3200.21.4.572
Gable, S. L. (2006). Approach and avoidance social motives and goals. Journal of Personality, 74, 175–222. doi:10.1111/j.1467-6494.2005.00373.x
Gibbons, R. D., Bock, R. D., Hedeker, D., Weiss, D. J., Segawa, E., Bhaumik, D. K., Kupfer, D. J., et al. (2007). Full-Information item bifactor analysis of graded response data. Applied Psychological Measurement, 31, 4–19. doi:10.1177/0146621606289485
Gray, J. A. (1982). The neuropsychology of anxiety: An enquiry into the function of the septo-hippocampal system. New York: Oxford University Press.
Gubler, H., & Bischof, N. (1991). Infant development: Perspectives from German-speaking countries. A systems theory perspective (Vol. Infant development: Perspectives from German-speaking countries Hillsdale, NJ, England, pp. 35-66). Lawrence Erlbaum Associates, Inc.
Hagemeyer, B., Neyer, F. J., Neberich, W., & Asendorpf, J. B. (2012). The ABC of social desires:Affiliation, being alone, and closeness to partner. European Journal of Personality. doi:10.1002/per.1857
Heckhausen, J., & Heckhausen, H. (2008). Motivation and action (2nd ed.). Cambridge University Press.Hendrick, S. S., Dicke, A., & Hendrick, C. (1998). The Relationship Assessment Scale. Journal of Social and
Personal Relationships, 15, 137-142. doi:10.1177/0265407598151009Hofer, J., Busch, H., Bond, M. H., Li, M., & Law, R. (2010). Efects of motive-goal congruence on well-being in
the power domain: Considering goals and values in a German and two Chinese samples. Journal of Research in Personality, 44, 610–620. doi:10.1016/j.jrp.2010.08.001
Hofer, J., Busch, H., & Kärtner, J. (2011). Self‐regulation and well‐being: The influence of identity and motives.

UNIFIED MOTIVE SCALES 25
European Journal of Personality, 25, 211–224. doi:10.1002/per.789Hohensinn, C., & Kubinger, K. D. (2011). Applying item response theory methods to examine the impact of
diferent response formats. Educational and Psychological Measurement, 71, 732 -746. doi:10.1177/0013164410390032
Horn, J. L. (1965). A rationale and test for the number of factors in factor-analysis. Psychometrika, 30, 179-185. doi:10.1007/BF02289447
Jackson, D. N. (1967). Manual for the Personality Research Form. Goshen: Research Psychologist Press.Kahnemann, D., Knetsch, J. L., & Thaler, R. (1986). Fairness and the assumptions of economics. Journal of
Business, 59, 285-300.Kashdan, T. B., Gallagher, M. W., Silvia, P. J., Winterstein, B. P., Breen, W. E., Terhar, D., & Steger, M. F. (2009).
The curiosity and exploration inventory-II: Development, factor structure, and psychometrics. Journal of Research in Personality, 43, 987-998. doi:10.1016/j.jrp.2009.04.011
Kaufman, L., & Rousseeuw, P. J. (1990). Finding groups in data: an introduction to cluster analysis. John Wiley & Sons.
Kraha, A., Turner, H., Nimon, K., Zientek, L. R., & Henson, R. K. (2012). Tools to support interpreting multiple regression in the face of multicollinearity. Frontiers in Psychology, 3. doi:10.3389/fpsyg.2012.00044
Killeen, P. R. (2005). An alternative to null-hypothesis significance tests. Psychological Science, 16, 345-353. doi:10.1111/j.0956-7976.2005.01538.x
Lang, J. W., & Fries, S. (2006). A revised 10-item version of the Achievement Motives Scale. European Journal of Psychological Assessment, 22, 216–224. doi:10.1027/1015-5759.22.3.216
Leary, M. R., Kelly, K. M., Cottrell, C. A., & Schreindorfer, L. S. (2006). Individual differences in the need to belong: Mapping the nomological network. Unpublished manuscript, Duke University.
Lecoutre, B., Lecoutre, M. P., & Poitevineau, J. (2010). Killeen’s probability of replication and predictive probabilities: How to compute, use, and interpret them. Psychological Methods, 15, 158-171. doi:10.1037/a0015915
Macdonald, G., & Gere, J. (2010). An update of the empirical case for the need to belong. The Journal of Individual Psychology, 66, 93-115.
Maechler, M., Rousseeuw, P. J., Struyf, A., & Hubert, M. (2005). Cluster Analysis: Basics and Extensions. R package version 1.14.1. http://CRAN.R-project.org/package=cluster
Malle, B. F., & Horowitz, L. M. (1995). The puzzle of negative self-views: An exploration using the schema concept. Journal of Personality and Social Psychology, 68, 470–484. doi:10.1037/0022-3514.68.3.470
Mayer, J. D., Faber, M. A., & Xu, X. (2007). Seventy-five years of motivation measures (1930–2005): A descriptive analysis. Motivation and Emotion, 31, 83–103. doi:10.1007/s11031-007-9060-2
McAdams, D. P. (1980). A thematic coding system for the intimacy motive. Journal of Research in Personality, 14, 413-432. doi:10.1016/0092-6566(80)90001-X
McAdams, D. P., & Constantian, C. A. (1983). Intimacy and affiliation motives in daily living: An experience sampling analysis. Journal of Personality and Social Psychology, 45, 851-861. doi:10.1037/0022-3514.45.4.851
McAdams, D. P., & Powers, J. (1981). Themes of intimacy in behavior and thought. Journal of Personality and Social Psychology, 40, 573-587. doi:10.1037/0022-3514.40.3.573
McClelland, D. C. (1987). Human motivation. New York: Cambridge University Press.McClelland, D. C. (1991). The Personal Value Questionnaire. Boston: McBer & Co.McClelland, D. C., Koestner, R., & Weinberger, J. (1989). How do self-attributed and implicit motives difer?
Psychological Review, 96, 690–702. doi:10.1037//0033-295X.96.4.690Mehrabian, A. (1994). Evidence bearing on the affiliative tendency (MAFF) and sensitivity to rejection (MSR)
scales. Current Psychology, 13, 97–116. doi:10.1007/BF02686794Mikulincer, M., & Shaver, P. R. (2005). Attachment theory and emotions in close relationships: Exploring the
attachment-related dynamics of emotional reactions to relational events. Personal Relationships, 12, 149-168. doi:10.1111/j.1350-4126.2005.00108.x
Murray, H. A. (1938). Explorations in personality. New York: Oxford University Press.Nikitin, J., & Freund, A. M. (2010). When wanting and fearing go together: The efect of co-occurring social
approach and avoidance motivation on behavior, afect, and cognition. European Journal of Social Psychology, 40, 783–804.
Nimon, K., Lewis, M., Kane, R., & Haynes, R. (2008). An R package to compute commonality coefficients in the multiple regression case: An introduction to the package and a practical example. Behavior Research Methods, 40, 457–466. doi:10.3758/BRM.40.2.457
O’Neill, T. A., & Allen, N. J. (2011). Personality and the prediction of team performance. European Journal of Personality, 25, 31–42. doi:10.1002/per.769

UNIFIED MOTIVE SCALES 26
Pöhlmann, K., & Brunstein, J. C. (1997). Goals: Ein Fragebogen zur Erfassung von Lebenszielen. Diagnostica, 43, 63-79.
Prager, K. J. (1995). The psychology of intimacy. New York: Guilford Press.Puca, R. M., & Schmalt, H.-D. (1999). Task enjoyment: A mediator between achievement motives and
performance. Motivation and Emotion, 23, 15-29. doi:10.1023/A:1021327300925R Development Core Team. (2008). R: A Language and Environment for Statistical Computing. Vienna, Austria:
Basic Books.Rammstedt, B. (2007). The 10-Item Big Five Inventory: Norm values and investigation of sociodemographic
efects based on a german population representative sample. European Journal of Psychological Assessment, 23, 193-201. doi:10.1027/1015-5759.23.3.193
Renner, B. (2006). Need to belong scale (German version). Unpublished manuscript, University of Konstanz. Retrieved from http://www.uni-konstanz.de/diagnostik/research_measures.htm
Rizopoulos, D. (2006). ltm: An R package for latent variable modelling and item response theory analyses. Journal of Statistical Software, 17, 1–25.
Samejima, F. (1969). Estimation of latent ability using a response pattern of graded scores. Psychometrika Monograph Supplement, 34.
Scherbaum, C. A., Cohen-Charash, Y., & Kern, M. J. (2006). Measuring general self-efficacy: A comparison of three measures using item response theory. Educational and Psychological Measurement, 66, 1047-1063. doi:10.1177/0013164406288171
Schmalt, H.D., Sokolowski, K., & Langens, T. (2000). Das Multi-Motiv-Gitter für Anschluß, Leistung und Macht: Manual [The multi-motive grid for afliation, achievement, and power: Manual]. Frankfurt am Main: Swets & Zeitlinger.
Schneider, K., & Schmalt, H. D. (2000). Motivation, 3. Auflage. Stuttgart: Kohlhammer.Schönbrodt, F. D., Unkelbach, S., & Spinath, F. M. (2009). Broad motives in short scales: a questionnaire for the
Zurich Model of social motivation. European Journal of Psychological Assessment, 25, 141-149. doi:10.1027/1015-5759.25.3.141
Schuler, H., Prochaska, M., & Frintrup, A. (2001). Leistungsmotivationsinventar. Hogrefe.Schultheiss, O. C. (2008). Implicit motives. In O. P. John, R. W. Robins, & L. A. Pervin (Eds.), Handbook of
personality psychology: Theory and research (3rd ed.). (pp. 603-633). New York: Guilford Press.Schultheiss, O. C., Strasser, A., Rösch, A. G., Kordik, A., & Graham, S. C. C. (in press). Motivation. In V. S.
Ramachandran (Ed.), Encyclopedia of Human Behavior (2nd ed.). Oxford, GB: Elsevier.Schultheiss, O. C., Yankova, D., Dirlikov, B., & Schad, D. J. (2009). Are implicit and explicit motive measures
statistically independent? A fair and balanced test using the Picture Story Exercise and a cue-and response-matched questionnaire measure. Journal of Personality Assessment, 91, 72–81. doi:10.1080/00223890802484456
Seibold, D. R., & McPhee, R. D. (1979). Commonality analysis: A method for decomposing. Human Communication Research, 5, 355–365. doi:10.1111/j.1468-2958.1979.tb00649.x
Smith, G. T., McCarthy, D. M., & Anderson, K. G. (2000). On the sins of short-form development. Psychological Assessment, 12, 102–111. doi:10.1037//1040-3590.12.1.102
Sokolowski, K. (2008). Social bonding: Affiliation motivation and intimacy motivation. In J. Heckhausen & H. Heckhausen (Eds.), Motivation and action (2nd ed.). (pp. 184-201). New York, NY US: Cambridge University Press.
Sokolowski, K., Schmalt, H. D., Langens, T. A., & Puca, R. M. (2000). Assessing achievement, affiliation, and power motives all at once: The Multi-Motive Grid (MMG). Journal of Personality Assessment, 74, 126-145. doi:10.1207/S15327752JPA740109
Spangler, W. D. (1992). Validity of questionnaire and TAT measures of need for achievement: Two meta-analyses. Psychological Bulletin, 112, 140-154. doi:10.1037//0033-2909.112.1.140
Stoeber, J., Otto, K., Pescheck, E., Becker, C., & Stoll, O. (2007). Perfectionism and competitive anxiety in athletes: Diferentiating striving for perfection and negative reactions to imperfection. Personality and Individual Differences, 42, 959-969. doi:10.1016/j.paid.2006.09.006
Stumpf, H., Angleitner, A., Wieck, T., Jackson, D. N., & Beloch-Till, H. (1985). Deutsche Personality Research Form (PRF): Handanweisung. Göttingen: Hogrefe.
Tett, R. P., Steele, J. R., & Beauregard, R. S. (2003). Broad and narrow measures on both sides of the personality-job performance relationship. Journal of Organizational Behavior, 24, 335–356. doi:10.1002/job.191
Thissen, D. (2000). Reliability and measurement precision. In H. Wainer (Ed.), Computerized adaptive testing: A primer (2nd ed.) (pp. 159 - 184). Lawrence Erlbaum Associates Publishers.
Weinberger, J., Cotler, T., & Fishman, D. (2010). The duality of affiliative motivation. In O. C. Schultheiss & J. C. Brunstein (Eds.), Implicit Motives (Vol. 1, pp. 71-89).

UNIFIED MOTIVE SCALES 27
Winter, D. G. (1991). Manual for scoring motive imagery in running text (4th edition). Ann Arbor: University of Michigan.
Wirth, R. J., & Edwards, M. C. (2007). Item factor analysis: Current approaches and future directions. Psychological Methods, 12, 58–79. doi:10.1037/1082-989X.12.1.58
Zhang, X., Cao, Q., & Grigoriou, N. (2011). Consciousness of social face: The development and validation of a scale measuring desire to gain face versus fear of losing face. The Journal of Social Psychology, 151, 129–149. doi:10.1080/00224540903366669
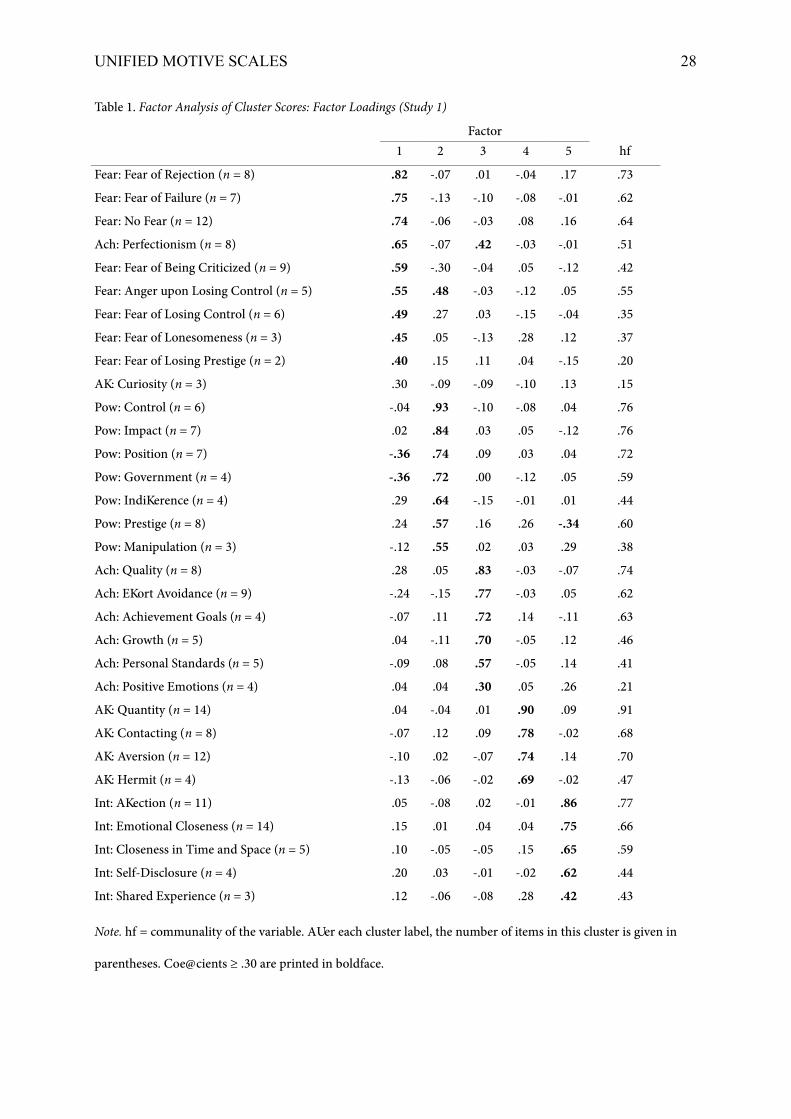
UNIFIED MOTIVE SCALES 28
Table 1. Factor Analysis of Cluster Scores: Factor Loadings (Study 1)
Factor 1 2 3 4 5 h²
Fear: Fear of Rejection (n = 8) .82 -.07 .01 -.04 .17 .73
Fear: Fear of Failure (n = 7) .75 -.13 -.10 -.08 -.01 .62
Fear: No Fear (n = 12) .74 -.06 -.03 .08 .16 .64
Ach: Perfectionism (n = 8) .65 -.07 .42 -.03 -.01 .51
Fear: Fear of Being Criticized (n = 9) .59 -.30 -.04 .05 -.12 .42
Fear: Anger upon Losing Control (n = 5) .55 .48 -.03 -.12 .05 .55
Fear: Fear of Losing Control (n = 6) .49 .27 .03 -.15 -.04 .35
Fear: Fear of Lonesomeness (n = 3) .45 .05 -.13 .28 .12 .37
Fear: Fear of Losing Prestige (n = 2) .40 .15 .11 .04 -.15 .20
Af: Curiosity (n = 3) .30 -.09 -.09 -.10 .13 .15
Pow: Control (n = 6) -.04 .93 -.10 -.08 .04 .76
Pow: Impact (n = 7) .02 .84 .03 .05 -.12 .76
Pow: Position (n = 7) -.36 .74 .09 .03 .04 .72
Pow: Government (n = 4) -.36 .72 .00 -.12 .05 .59
Pow: Indiference (n = 4) .29 .64 -.15 -.01 .01 .44
Pow: Prestige (n = 8) .24 .57 .16 .26 -.34 .60
Pow: Manipulation (n = 3) -.12 .55 .02 .03 .29 .38
Ach: Quality (n = 8) .28 .05 .83 -.03 -.07 .74
Ach: Efort Avoidance (n = 9) -.24 -.15 .77 -.03 .05 .62
Ach: Achievement Goals (n = 4) -.07 .11 .72 .14 -.11 .63
Ach: Growth (n = 5) .04 -.11 .70 -.05 .12 .46
Ach: Personal Standards (n = 5) -.09 .08 .57 -.05 .14 .41
Ach: Positive Emotions (n = 4) .04 .04 .30 .05 .26 .21
Af: Quantity (n = 14) .04 -.04 .01 .90 .09 .91
Af: Contacting (n = 8) -.07 .12 .09 .78 -.02 .68
Af: Aversion (n = 12) -.10 .02 -.07 .74 .14 .70
Af: Hermit (n = 4) -.13 -.06 -.02 .69 -.02 .47
Int: Afection (n = 11) .05 -.08 .02 -.01 .86 .77
Int: Emotional Closeness (n = 14) .15 .01 .04 .04 .75 .66
Int: Closeness in Time and Space (n = 5) .10 -.05 -.05 .15 .65 .59
Int: Self-Disclosure (n = 4) .20 .03 -.01 -.02 .62 .44
Int: Shared Experience (n = 3) .12 -.06 -.08 .28 .42 .43
Note. h² = communality of the variable. Afer each cluster label, the number of items in this cluster is given in
parentheses. Coefficients ≥ .30 are printed in boldface.

UNIFIED MOTIVE SCALES 29

UNIFIED MOTIVE SCALES 30
Table 2. Descriptive Statistics for Questionnaires (Study 1)
α Mean SDPower
UMS 10 .92 2.12 1.01UMS 6 .89 2.11 1.08UMS 3 .80 2.12 1.13PRF .90 2.48 0.84PVQ .90 1.92 0.97GOALS .87 2.30 1.18
AchievementUMS 10 .86 3.18 0.80UMS 6 .82 3.18 0.87UMS 3 .72 3.16 0.96PRF .83 2.97 0.68PVQ .84 3.22 0.75GOALS .81 4.08 0.73AMS (HS) .84 3.73 0.78
AffiliationUMS 10 .90 2.73 0.91UMS 6 .87 2.90 0.95UMS 3 .80 3.11 0.99PRF .88 2.89 0.75PVQ .85 3.42 0.78GOALS .90 2.90 1.13MAFF .85 2.78 0.62
IntimacyUMS 10 .82 3.74 0.72UMS 6 .78 3.97 0.73UMS 3 .64 4.11 0.75GOALS .87 4.33 0.82
FearUMS 14 .85 2.93 0.76UMS 10 .84 2.83 0.84UMS 6 .78 2.81 0.93UMS 3 .61 2.72 1.04AMS (FF) .85 2.51 1.02MSR .81 2.65 0.54
Abbreviations: UMS = Unified Motive Scales; PRF = Personality Research Form; PVQ = Personal Values Questionnaire; AMS = Achievement Motive Scale, HS = hope for success, FF = fear of failure; MAFF = Mehrabian Affiliation Scale; MSR = Sensitivity to Rejection.

UNIFIED MOTIVE SCALES 31
Table 3. Multitrait-Multimethod Matrix of Hope Scales (Study 1)
1 2 3 4 5 6 7 8 9 10 11 12 13 14 15 16Power
1 UMS .92 .45 .25 .45 .16 .28 .11 .03 -.07 .12 .05 -.13 -.13
2 PRF .81 .90 .44 .35 .41 .16 .35 .20 .19 -.07 .14 .23 -.06 -.06
3 PVQ .88 .61 .90 .46 .20 .50 .16 .23 .11 -.02 -.02 .13 -.00 -.12 -.15
4 GOALS .76 .52 .78 .87 .39 .20 .40 .17 .18 .19 .07 .02 .27 .07 -.11 -.07Achievement
5 UMS .45 .44 .46 .39 .86 .12 .10 .08 .11 .05 .07 .02
6 PRF .25 .35 .20 .20 .70 .83 .04 .12 -.04 .01 .05 .04 .03
7 PVQ .45 .41 .50 .40 .95 .64 .84 .12 .09 .13 .12 .05 .07 .04
8 GOALS .16 .16 .16 .17 .62 .50 .59 .81 .08 .06 .10 .14 .03 .18 .20
9 AMS .28 .35 .23 .18 .60 .48 .54 .38 .84 .12 .13 .05 .07 .12 .12 .06Affiliation
10 UMS .11 .20 .11 .19 .12 .04 .12 .08 .12 .90 .37 .34
11 PRF .03 .19 -.02 .07 .10 .12 .09 .06 .13 .88 .88 .45 .42
12 PVQ -.07 -.07 -.02 .02 .08 -.04 .13 .10 .05 .65 .65 .85 .64 .61
13 GOALS .12 .14 .13 .27 .11 .01 .12 .14 .07 .87 .71 .65 .90 .34 .37
14 MAFF .05 .23 -.00 .07 .05 .05 .05 .03 .12 .82 .85 .64 .69 .85 .51 .44Intimacy
15 UMS -.13 -.06 -.12 -.11 .07 .04 .07 .18 .12 .37 .45 .64 .34 .51 .82
16 GOALS -.13 -.06 -.15 -.07 .02 .03 .04 .20 .06 .34 .42 .61 .37 .44 .77 .87
Note. Diagonals show internal consistencies (α) of the scales.

UNIFIED MOTIVE SCALES 32
Table 4. Bivariate Correlations between Established Motive Scales and the 10 Unifed Motive Scales (Study 2)
Powe
r
Achi
evem
ent
Affi
liatio
n
Intim
acy
Fear
(mai
n fa
ctor
)
fear
of l
osin
g co
ntro
l
fear
of l
osin
g pr
estig
e
fear
of f
ailu
re
fear
of r
ejec
tion
fear
of l
osin
g em
otio
nal c
onta
ct
α
PowerPRF .85 .49 .21 -.27 .24 -.38 -.26 .90
PVQ .91 .59 .21 .43 -.15 .91
GOALS .81 .44 .23 .37 -.15 .90
MPZM .82 .50 .23 .34 -.26 .69
PSEQ .34 .19 .17 .21 .81
AchievementPRF .34 .69 -.26 -.19 -.29 -.22 .83
PVQ .55 .96 .19 .16 -.20 .86
GOALS .66 .18 .86
MPZM .37 .68 .26 .20 .82
PSEQ .31 .40 .16 .86
AMS (HS) .34 .60 -.20 .32 -.24 .86
AffiliationPRF .16 .16 .88 .64 -.21 -.19 .35 .89
PVQ .20 .71 .74 .37 .28 .56 .86
GOALS .17 .20 .89 .43 .20 .19 .35 .90
PSEQ .18 .18 .18 .15 .15 .82
MAFF .20 .84 .62 -.19 -.16 .36 .88
NTBS .42 .49 .50 .34 .32 .42 .49 .84
NTBS hope .15 .52 .46 .24 .17 .18 .28 .75
NTBS fear .23 .38 .60 .19 .46 .35 .53 .53 .81
GOALS Intimacy .17 .47 .70 .30 .26 .42 .87
Fear scalesMSR -.18 -.20 .55 .25 .42 .48 .52 .27 .81
AMS (FF) -.34 -.25 .74 .45 .94 .53 .29 .84
Other scalesPRF Aggression .35 -.19 .15 .76
GOALS altruism .28 .38 .42 .23 .90
GOALS enterprise .30 .38 .60 .87
MPZM enterprise .42 .56 .49 -.24 -.16 -.32 -.25 .86
MPZM dependency .45 .62 .45 .23 .32 .16 .34 .54 .81

UNIFIED MOTIVE SCALES 33
Powe
r
Achi
evem
ent
Affi
liatio
n
Intim
acy
Fear
(mai
n fa
ctor
)
fear
of l
osin
g co
ntro
l
fear
of l
osin
g pr
estig
e
fear
of f
ailu
re
fear
of r
ejec
tion
fear
of l
osin
g em
otio
nal c
onta
ct
α
MPZM prestige .47 .15 .21 .21 .30 .50 .31 .23 .75
Neuroticism -.15 .62 .45 .71 .46 .26 .72
Extraversion .29 .20 .64 .33 -.20 -.28 -.28 -.28 .16 .81
Openness .25 .32 .28 .24 .15 .63
Agreeableness -.18 .30 .31 -.22 .22 .37
Conscientiousness .15 .34 .22 .50
α of UMS .92 .86 .91 .80 .82 .82 .85 .80 .73 .77
Mean of UMS 2.27 3.22 3.12 3.94 3.07 3.22 2.84 2.55 3.07 3.61
SD of UMS 0.95 0.73 0.89 0.61 0.67 0.82 0.95 0.96 0.91 0.91
Note. Nonsignificant correlations < .15 are suppressed. Theoretically convergent cells are shaded. n = 177.
Abbreviations: PRF = Personality Research Form; PVQ = Personal Values Questionnaire; MPZM = Motive
Profile Zurich Model; AMS = Achievement Motive Scale, HS = hope for success, FF = fear of failure; MAFF =
Mehrabian Affiliation Scale; MSR = Mehrabian Sensitivity to Rejection; NTBS = need to belong scale.

UNIFIED MOTIVE SCALES 34
Table 5. Bivariate Correlations between Unifed Motive Scales and Scales Related to Close Relationships (Study 3)
UMS intimacy scale
10 it
ems
6 ite
ms
3 ite
ms
Intim
acy
(stu
dy 1
)
atta
chm
ent a
nxie
ty
atta
chm
ent a
void
ance
desir
e for
clos
enes
s
desir
e for
bei
ng a
lone
Inclu
sion
of o
ther
into
self
rela
tions
hip
satis
fact
ion
α Mean SD
Intimacy
10 items 1.00 .94 .88 .87 .17 -.54 .48 -.45 .44 .25 .84 3.19 0.78
6 items .94 1.00 .94 .82 .20 -.53 .49 -.45 .43 .21 .82 3.51 0.82
3 items .88 .94 1.00 .79 .19 -.49 .46 -.43 .43 .16 .74 3.62 0.94
Intimacy (study 1) .87 .82 .79 1.00 .10 -.56 .45 -.34 .34 .20 .82 3.63 0.69
Power -.01 .01 .02 -.05 .06 .03 -.01 -.01 -.04 -.06 .91 2.37 0.93
Achievement .07 .09 .11 .08 -.01 -.02 -.03 .08 -.05 -.09 .89 3.12 0.85
Affiliation .41 .41 .40 .47 .07 -.21 .17 -.35 .11 -.03 .89 2.75 0.85
Fear (main factor) .33 .34 .32 .29 .40 .03 -.08 -.24 .07 -.12 .86 3.03 0.71
Fear of losing emotional
contact .51 .49 .44 .52 .29 -.21 .13 -.33 .12 -.07 .63 3.43 0.88
Fear of rejection .21 .26 .27 .22 .36 .04 -.06 -.17 .03 -.19 .78 3.08 1.06
Fear of failure .15 .14 .13 .10 .32 .13 -.11 -.15 .02 -.05 .74 2.69 1.01
Fear of losing control .11 .10 .08 .04 .26 .09 -.13 -.09 -.01 -.08 .82 3.08 0.95
Fear of losing prestige .21 .23 .24 .16 .17 .04 -.10 -.10 .11 -.02 .83 2.80 1.08
Note. n = 478 except for the RAS scale (n = 274). |r|'s ≥ .09 are significant, except for relationship satisfaction
where |r|'s ≥ .12 are significant.

UNIFIED MOTIVE SCALES 35
Table 6. Cronbach’s Alphas, Descriptive Statistics, and Correlations (Study 4)
Possible range α M SD UMS
pow UMS af UMS int PRF ach PRF dom PRF af
AMS HS
Sudoku perf
Task enj.
Pos. self-ev.
DG alloc.
UMS ach 0-5 .87 2.90 .72 .44** .01 -.04 .71** .36** .04 .69** .50** .50** .49** -.15
UMS pow 0-5 .89 2.49 .70 - -.04 .00 .27** .65** .05 .35** .40** .35** .40** -.37**
UMS af 0-5 .85 3.15 .75 - .38** .04 -.01 .42** .09 -.05 .01 -.10 .21*
UMS int 0-5 .86 3.23 .76 - -.04 .14 .34** .04 .02 -.01 -.03 .05
PRF ach 1-16 .88 9.71 3.34 - .28** .07 .55** .26* .37** .30** -.12
PRF dom 1-16 .87 10.34 2.84 - .01 .24* .27** .21* .27** -.31**
PRF af 1-16 .83 12.16 2.71 - .11 .08 .01 .08 -.01
AMS HS 1-4 .85 2.53 .50 - .44** .43** .43** -.12
Sudoku perf. 0-100 .72 43.75 19.93 - .66** .79** -.19
Task enj. 1-5 .79 3.17 1.18 - .75** -.09
Pos. self-ev. 1-5 .77 3.07 1.13 - -.14
DG alloc. 0-100 n.a. 54.30 26.63 -
Note. UMS ach = UMS achievement; UMS pow = UMS power; UMS af = UMS affiliation; UMS int = UMS intimacy; PRF ach = PRF achievement; PRF dom = PRF
dominance; PRF af = PRF affiliation; AMS HS = AMS hope of success; Sudoku perf = Sudoku puzzle performance; Task enj. = Sudoku task enjoyment; Pos. self-ev. = Sudoku
positive self-evaluation; DG alloc. = Dictator game allocation.
*p < .05. **p < .01.

UNIFIED MOTIVE SCALES 36Table 7. Commonality Analysis of Achievement Scales Predicting Sudoku Performance
Achievement and power scales Sudoku performance Task enjoyment Positive self-evaluation
Overall R² 32.33 % 28.41 % 30.61 %
Percentage of explained variance attributable to: Unique Common Unique Common Unique Common
PRF achievement 6 % 14 % 0 % 48 % 2 % 27 %
AMS hope for success 5 % 54 % 4 % 63 % 6 % 58 %
UMS achievement 20 % 58 % 11 % 76 % 14 % 66 %
PRF dominance 0 % 23 % 1 % 15 % 0 % 24 %
UMS power 6 % 43 % 7 % 35 % 8 % 45 %
Note. Column "Unique" shows the unique contribution of each scale, column "Common" shows the contribution
that this scale shares with at least one other scale. For example, 20 % of R² (Sudoku performance) can be
uniquely attributed to UMS achievement and 78 % (20 % + 58 %) of R² can be attributed to UMS achievement
overall.

UNIFIED MOTIVE SCALES 37
Table 8. Commonality Analysis of Power and Afliation Scales Predicting Dictator Game Allocations
Power and affiliation scales Dictator game allocations
Overall R² 19.08 %
Percentage of explained variance attributable to: Unique Common
PRF dominance 5 % 45 %
PRF affiliation 4 % -4 %
UMS power 22 % 49 %
UMS affiliation 24 % -1 %
Note. Column "Unique" shows the unique contribution of each scale, column "Common" shows the contribution
that this scale shares with at least one other scale. For example, 22 % of R² can be uniquely attributed to UMS
power and 71 % (22 % + 49 %) of R² can be attributed to UMS power overall. Negative variances can occur due
to suppression efects.

UNIFIED MOTIVE SCALES 38
Figure 1. Test information curves for power, achievement, affiliation, and the main fear factor.

UNIFIED MOTIVE SCALES 39
Figure 2. Test information curves for intimacy scales from Study 1 (“Old”) and Study 3 (“New”).

UNIFIED MOTIVE SCALES 40
Appendix A: Item wordings and Item Response Theory Parameter Estimates for the Unified Motive Scales
Two diferent item formats are present in the UMS: classical items formulated as statements, which require an agreement rating, and goals, which require an importance
rating. Statements are rated on a 6-point Likert scale where each response option is labeled (0 = trifft überhaupt nicht zu, 1 = trifft nicht zu, 2 = trifft eher nicht zu, 3 = trifft eher
zu, 4 = trifft ziemlich zu, 5 = trifft vollkommen zu [0 = strongly disagree, 1 = disagree, 2 = rather disagree, 3 = rather agree, 4 = agree, 5 = strongly agree]). Goals as well are rated on
a 6-point Likert scale where each response option is labeled (0 = nicht wichtig, 1 = ein wenig wichtig, 2 = etwas wichtig, 3 = wichtig, 4 = sehr wichtig, 5 = außerordentlich wichtig
[0 = not important to me, 1 = of little importance to me, 2 = of some importance to me, 3 = important to me, 4 = very important to me, 5 = extremely important to me.]). Items
from the PRF, AMS, MAFF, and new items need the statement rating, items taken from the PVQ and GOALS need the importance rating. We recommend first presenting all
statement items as a block and then presenting all goals as a second block. Similar items should not be presented consecutively.
Newly developed items were constructed in German language. For Table A1, they have been translated into English by the consensus of two experienced translators.
Table A1. Item wordings and Item Response Theory Parameter Estimates for the UMS Hope Scales
Item parameter estimatesOriginal inventor
y Original German item English version α β1 β2 β3 β4 β5
UMS 6
UMS 3
PowerPVQ Über eine Gruppe oder eine Organisation
Kontrolle ausüben zu können.The opportunity to exercise control over an organization or group.
2.33 -1.32 0.43 2.24 4.02 6.06 * *
GOALS Einfluss ausüben können Be able to exert influence. 2.33 -3.83 -1.71 0.07 2.20 4.72 * *
New Ich habe gern das Sagen. I like to have the final say. 2.30 -4.54 -2.24 -0.47 2.37 4.67 * *
PRF Ich strebe nach Positionen, in denen ich Autorität habe.
I would like to be an executive with power over others.
2.28 -3.56 -1.68 0.27 2.76 5.14 *
PVQ In einer Führungsposition zu sein, wo andere für mich arbeiten und von mir Anweisungen erhalten.
To be in a leadership position in which others work for me or look to me for direction.
2.21 -1.29 0.29 1.88 3.47 5.47 *

UNIFIED MOTIVE SCALES 41
Item parameter estimatesPRF Ich habe nur wenig Interesse daran, andere zu
führen.#I have little interest in leading others.# 2.01 -4.27 -1.97 -0.14 2.06 4.42 *
PRF Ich fühle mich in meinem Element, wenn es darum geht, die Tätigkeiten anderer zu leiten.
I feel confident when directing the activities of others.
1.94 -3.68 -1.6 0.59 2.68 4.60
PVQ Andere Menschen beeinflussen zu können. Opportunities to influence others. 1.80 -2.70 -0.91 0.82 2.51 4.25
PRF Ich versuche, andere unter meinen Einfluss zu bekommen, anstatt zuzulassen, dass sie mich kontrollieren.
I try to control others rather than permit them to control me.
1.66 -3.32 -1.75 0.03 2.35 4.22
PVQ Eine Stellung mit Prestige und Ansehen. A position with prestige. 1.65 -1.78 -0.35 1.07 2.60 4.41AchievementPVQ Meine Leistung stets auf einem hohen Niveau zu
halten.Maintaining high standards for the quality of my work.
2.27 -6.67 -4.58 -2.80 -0.34 2.45 * *
PVQ Arbeit von hoher Qualität zu leisten. Personally producing work of high quality. 1.83 -7.14 -5.06 -3.48 -1.13 1.44 * *
PVQ Projekte, die mich bis an die Grenze meiner Leistungsfähigkeit bringen.
Projects that challenge me to the limits of my ability.
1.71 -2.33 -0.95 0.34 2.16 4.01 * *
GOALS Mich ständig verbessern Continuously improve myself. 1.59 -7.04 -4.48 -2.80 -0.67 1.23 *
PVQ Ständig neue, interessante und herausfordernde Ziele und Projekte.
Continuously engage in new, exciting, and challenging goals and projects.
1.57 -4.27 -2.69 -1.13 0.58 2.52 *
PVQ Verantwortung für schwierige und herausfordernde Aufgaben und Ziele zu übernehmen.
Opportunities to take on more difficult and challenging goals and responsibilities.
1.54 -3.66 -2.40 -0.93 1.29 3.22 *
PVQ Eigenverantwortlich etwas besser machen zu können als es bisher gemacht wurde.
Personally doing things better than they have been done before.
1.49 -4.84 -3.13 -1.65 0.39 2.50
AMS Ich fühle mich zu Arbeiten hingezogen, in denen ich die Möglichkeit habe, meine Fähigkeiten zu prüfen.
I am attracted to situations that allow me to test my abilities.
1.32 -5.22 -4.16 -2.09 -0.02 2.10
PRF Ich habe mir vorgenommen, wenigstens etwas mehr zu leisten als irgend jemand vor mir.
My goal is to do at least a little bit more than anyone else has done before.
1.30 -3.32 -2.06 -0.77 1.13 2.95
PVQ Etwas Neues schafen zu können. Opportunities to create new things. 1.29 -4.33 -2.82 -1.35 0.43 2.37AffiliationPRF Ich versuche, so of wie möglich in der I try to be in the company of friends as much as 2.41 -5.94 -3.01 -0.57 1.89 4.34 * *

UNIFIED MOTIVE SCALES 42
Item parameter estimatesGesellschaf von Freunden zu sein. possible.
GOALS Viel mit anderen Menschen zusammen unternehmen
Engage in a lot of activities with other people. 2.20 -5.85 -3.76 -1.77 0.47 2.63 * *
PRF Ich verbringe viel Zeit damit, Freunde zu besuchen.
I spend a lot of time visiting friends. 2.09 -3.83 -1.68 0.54 2.48 4.60 *
New Zusammentrefen mit anderen Menschen machen mich glücklich.
Encounters with other people make me happy. 2.07 -6.36 -4.93 -2.65 0.37 3.06 * *
PRF Of wäre ich lieber allein als mit einer Gruppe von Freunden zusammen.#
Ofen I would rather be alone than with a group of friends.#
1.87 -4.62 -3.13 -1.25 1.10 3.20 *
PRF Ich bemühe mich, andere Leute kennen zu lernen.
I go out of my way to meet people. 1.86 -4.20 -2.45 -0.64 1.45 3.59 *
PRF Ich entscheide mich meist für Freizeitbeschäfigungen, die ich zusammen mit anderen Leuten ausüben kann.
I choose hobbies that I can share with other people.
1.86 -4.26 -2.24 -0.27 1.59 3.65
MAFF Ich schließe gern soviel Freundschafen wie ich kann.
I like to make as many friends as I can. 1.77 -2.98 -1.00 0.85 2.68 4.33
GOALS Einen großen Bekanntenkreis haben Have a wide circle of friends. 1.64 -3.30 -1.41 0.19 1.86 3.82
New Wenn ich neue Leute kennenlernen kann, fühle ich mich voller Energie.
I feel a rush of energy when I get to know new people.
1.60 -4.19 -2.39 -0.72 1.27 3.21
Intimacy
GOALS Eine tiefgehende Beziehung haben. Have a close, intimate relationship with someone.
2.52 -6.82 -5.74 -3.61 -1.69 0.96 * *
GOALS Zuneigung und Liebe geben. Give sympathy and love to other people. 2.46 -7.38 -6.17 -4.60 -2.17 0.48 * *
New In einer Partnerschaf wünsche ich mir vollständig im anderen aufzugehen.
I like to fully immerse myself in a relationship. 1.67 -3.85 -2.39 -0.74 1.13 3.11 * *
New In einer Partnerschaf wünsche ich mir alle positiven und negativen Gefühle teilen zu können.
I want to be able to share all the good and negative emotions in a relationship.
1.55 -6.75 -4.45 -2.98 -1.29 0.93 *
PVQ Nicht von den Menschen getrennt zu sein, die mir wirklich wichtig sind.
Not being separated from the people I really care about.
1.54 -6.00 -4.05 -2.52 -0.83 1.29 *

UNIFIED MOTIVE SCALES 43
Item parameter estimatesNew Sich nahezukommen ist das einzige was zählt im
Leben.Getting close to someone is the only thing that matters in life.
1.46 -3.71 -1.80 -0.32 1.98 4.89 *
New Ich bin in Gedanken ständig bei meinen Liebsten.
My thoughts permanently revolve around my loved ones.
1.41 -4.58 -2.23 -0.32 1.61 3.88
New Seelenverwandtschaf ist mir wichtig. Finding a soul mate is important for me. 1.18 -3.19 -2.06 -1.18 0.64 2.45
New Manchmal fühle ich mich "ganz eins" mit einer anderen Person.
Sometimes I feel a deep connection and complete unity with another person.
1.16 -3.49 -1.91 -0.23 1.18 2.72
New Ich habe keinerlei Geheimnisse vor den Menschen, die ich liebe.
I don’t keep any secrets from the people I love. 0.93 -2.89 -1.08 0.05 1.13 3.01
Note. PVQ = Personal Values Questionnaire, PRF = Personality Research Form, AMS = Achievement Motive Scale, MAFF = Mehrabian Affiliation Scale. New = items newly
constructed for the present study. Reverse coded items are marked with a #.
Table A2. Item wordings and Item Response Theory Parameter Estimates for the UMS Fear Scales
Item parameter estimatesOriginal inventor
yFear facet Original German item English version α β1 β2 β3 β4 β5
UMS 10
UMS 6
UMS 3
AMS failure In etwas schwierigen Situationen, in denen viel von mir selbst abhängt, habe ich Angst zu versagen.
I am afraid of failing in somewhat difficult situations when a lot depends on me.
1.88 -4.75 -2.51 -0.94 1.22 3.07 * * *
AMS failure Es beunruhigt mich, etwas zu tun, wenn ich nicht sicher bin, dass ich es kann.
I feel uneasy doing something if I am not sure of succeeding.
1.67 -4.69 -2.73 -1.20 0.99 3.10 * *
New rejection Wenn ich jemanden neu kennenlerne, habe ich of Angst, abgelehnt zu werden.
When I get to know new people, I ofen fear being rejected by them.
1.64 -3.40 -1.53 0.06 1.53 3.21 * * *
New losing control
Ich bekomme Angst, wenn sich Dinge meiner Kontrolle entziehen.
I become scared when I lose control over things.
1.54 -5.15 -2.97 -0.96 1.06 3.04 * * *
New rejection Wenn ich Kontakt zu Fremden aufnehme und die zeigen mir die kalte Schulter, dann fühle ich
Being given the cold shoulder when approaching strangers makes me feel
1.52 -4.36 -2.53 -1.25 0.73 2.92 * *

UNIFIED MOTIVE SCALES 44
mich unsicher. insecure.
AMS failure Wenn ich ein Problem nicht sofort verstehe, werde ich ängstlich.
If I do not understand a problem immediately, I start feeling anxious.
1.52 -2.77 -0.61 1.17 2.78 4.88 *
New losing control
Wenn ich merke, dass ich auf manche Dinge keinen Einfluss habe, dann bin ich schnell beunruhigt.
I start worrying instantly when I notice that I don’t have an impact on some things.
1.49 -5.03 -2.29 -0.30 1.63 3.58 * *
New rejection Ich habe kein Problem damit von anderen Personen zurückgewiesen zu werden.#
Being rejected is no big deal for me.# 1.49 -5.67 -3.18 -1.17 0.90 2.89 *
New losing control
Die Vorstellung in einer Situation machtlos zu sein macht mir Angst.
The idea of not having any control in a situation frightens me.
1.33 -4.86 -3.30 -1.71 0.07 1.91 *
New losing emotional contact
Wenn sich eine mir nahestehende Person verschließt bekomme ich Angst um unsere Beziehung.
If a close friend blocks me of, I become anxious about our relationship.
1.18 -4.11 -2.77 -1.37 0.44 2.13 *
New losing emotional contact
Wenn ein guter Freund den Kontakt zu mir abbricht macht mich das ganz fertig.
I am absolutely devastated if a good friend breaks of contact with me.
0.98 -4.33 -2.86 -1.46 0.02 1.58
New losing reputation
Ich achte sehr darauf, dass mein Ansehen nicht beschädigt wird.
I'm very keen on an undamaged reputation.
0.90 -4.22 -2.25 -0.84 1.00 2.81
New losing reputation
Ich würde mir große Sorgen machen, wenn mein "guter Ruf " bedroht ist.
I would be very worried if my good reputation was in danger.
0.87 -3.53 -1.80 -0.54 0.99 2.94
New losing emotional contact
Wenn der emotionale Kontakt zu meinen Lieben abreißt werde ich nervös.
I become agitated when I lose emotional contact with my loved ones.
0.81 -4.13 -2.58 -1.55 -0.01 1.78
Note. AMS = Achievement Motive Scale, New = items newly constructed for the present study. Reverse coded items are marked with a #.
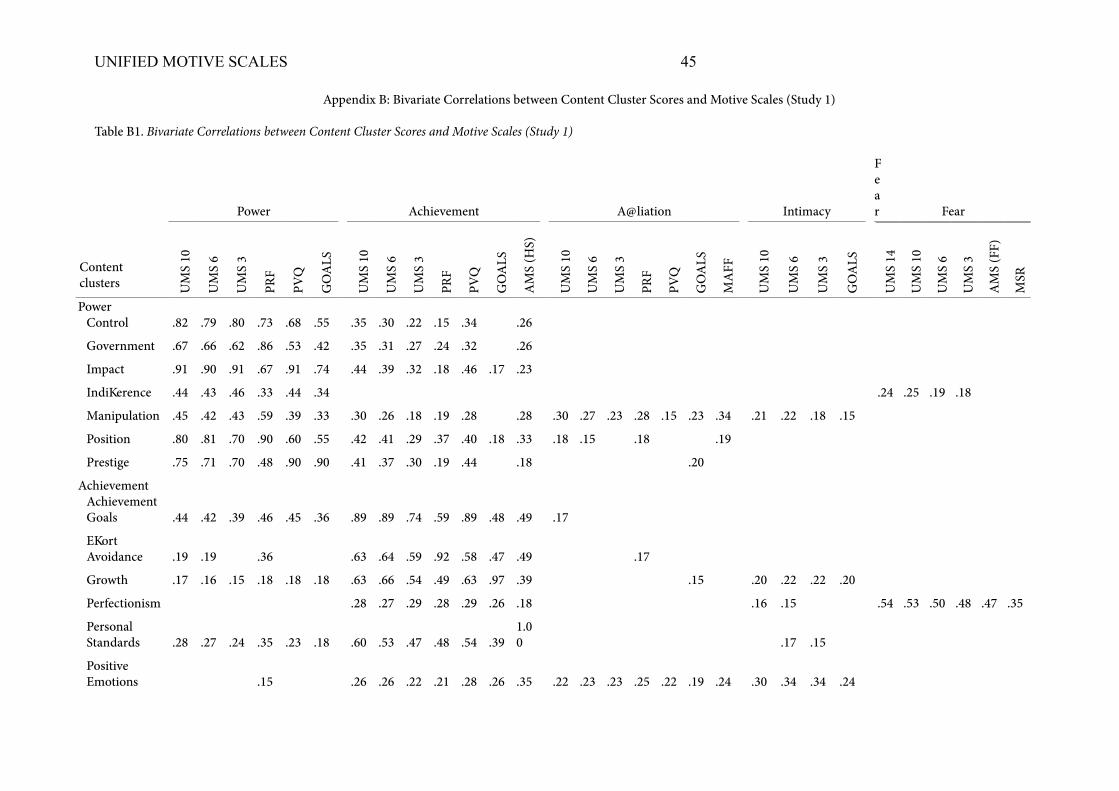
UNIFIED MOTIVE SCALES 45
Appendix B: Bivariate Correlations between Content Cluster Scores and Motive Scales (Study 1)
Table B1. Bivariate Correlations between Content Cluster Scores and Motive Scales (Study 1)
Power Achievement Affiliation Intimacy
Fear Fear
Content clusters U
MS
10
UM
S 6
UM
S 3
PRF
PVQ
GO
ALS
UM
S 10
UM
S 6
UM
S 3
PRF
PVQ
GO
ALS
AM
S (H
S)
UM
S 10
UM
S 6
UM
S 3
PRF
PVQ
GO
ALS
MA
FF
UM
S 10
UM
S 6
UM
S 3
GO
ALS
UM
S 14
UM
S 10
UM
S 6
UM
S 3
AM
S (F
F)
MSR
PowerControl .82 .79 .80 .73 .68 .55 .35 .30 .22 .15 .34 .26
Government .67 .66 .62 .86 .53 .42 .35 .31 .27 .24 .32 .26
Impact .91 .90 .91 .67 .91 .74 .44 .39 .32 .18 .46 .17 .23
Indiference .44 .43 .46 .33 .44 .34 .24 .25 .19 .18
Manipulation .45 .42 .43 .59 .39 .33 .30 .26 .18 .19 .28 .28 .30 .27 .23 .28 .15 .23 .34 .21 .22 .18 .15
Position .80 .81 .70 .90 .60 .55 .42 .41 .29 .37 .40 .18 .33 .18 .15 .18 .19
Prestige .75 .71 .70 .48 .90 .90 .41 .37 .30 .19 .44 .18 .20
AchievementAchievement Goals .44 .42 .39 .46 .45 .36 .89 .89 .74 .59 .89 .48 .49 .17
Efort Avoidance .19 .19 .36 .63 .64 .59 .92 .58 .47 .49 .17
Growth .17 .16 .15 .18 .18 .18 .63 .66 .54 .49 .63 .97 .39 .15 .20 .22 .22 .20
Perfectionism .28 .27 .29 .28 .29 .26 .18 .16 .15 .54 .53 .50 .48 .47 .35
Personal Standards .28 .27 .24 .35 .23 .18 .60 .53 .47 .48 .54 .39
1.00 .17 .15
Positive Emotions .15 .26 .26 .22 .21 .28 .26 .35 .22 .23 .23 .25 .22 .19 .24 .30 .34 .34 .24

UNIFIED MOTIVE SCALES 46
Quality .40 .37 .35 .31 .47 .38 .84 .78 .80 .67 .86 .53 .48
AffiliationAversion .16 .79 .81 .77 .85 .58 .66 .86 .39 .37 .35 .38
Contacting .22 .22 .18 .34 .19 .24 .20 .23 .16 .20 .17 .86 .80 .72 .77 .55 .72 .78 .31 .31 .29 .29
Curiosity .30 .31 .32 .32 .30 .46
Hermit .15 .65 .64 .57 .72 .42 .58 .65 .23 .21 .19 .22
Quantity .92 .93 .93 .84 .77 .90 .82 .47 .45 .43 .44
IntimacyAfection .16 .43 .48 .49 .55 .70 .42 .58 .83 .82 .78 .91 .27 .19
Closeness in Time and Space .45 .50 .52 .49 .84 .44 .50 .68 .63 .61 .65 .27 .19
Emotional Closeness .16 .44 .50 .50 .50 .58 .37 .54 .82 .76 .70 .58 .33 .24 .17
Self Disclosure .30 .34 .35 .36 .47 .26 .36 .75 .73 .71 .47 .30 .27 .21 .19 .18 .18
Shared Experience .45 .47 .49 .51 .56 .38 .57 .50 .45 .45 .43 .22 .18
FearAnger upon Losing Control .32 .28 .34 .39 .30 .17 .19 .50 .50 .46 .43 .37 .21
Fear of Losing Control .20 .17 .21 .27 .18 .54 .55 .54 .51 .37 .27
Fear of Losing Prestige .20 .17 .17 .28 .26 .42 .30 .29 .27 .18 .29
Fear of Failure .78 .83 .82 .79 .97 .60
Fear of Being Criticized .51 .51 .50 .48 .47 .85
Fear of .29 .30 .28 .28 .28 .81 .81 .76 .73 .63 .70

UNIFIED MOTIVE SCALES 47
Rejection
No Fear .15 .30 .17 .34 .29 .28 .29 .74 .72 .65 .58 .51 .65
Fear of Lonesomeness .31 .32 .35 .26 .35 .29 .27 .29 .25 .21 .28 .44 .43 .39 .37 .32 .27
Note. Coefficients < .15 are suppressed. n = 1,030.
Abbreviations: UMS = Unified Motive Scales; PRF = Personality Research Form; PVQ = Personal Values Questionnaire; AMS = Achievement Motive Scale, HS = hope for success, FF
= fear of failure; MAFF = Mehrabian Affiliation Scale; MSR = Mehrabian Sensitivity to Rejection.