unicipal Municipal Revenues - Lincoln Institute of Land Policy · municipal REVEnuEs and land...
39
MUNICIPAL REVENUES AND LAND POLICIES MUNICIPAL REVENUES AND LAND POLICIES Proceedings of the 2009 Land Policy Conference Edited by Gregory K. Ingram and Yu-Hung Hong
Transcript of unicipal Municipal Revenues - Lincoln Institute of Land Policy · municipal REVEnuEs and land...
municipal REVEnuEs and land policiEsEdited by Gregory K. ingram and Yu-Hung Hong
T he financial sector meltdown that began in 2008 was the worst economic crisis since the Great Depression. While the financial ills hampered private investment and employment growth, they devastated state and local government finances.
In light of the current need for fiscal resourcefulness, the Lincoln Institute of Land Policy’s fourth annual land policy conference in June 2009 focused on various instruments of municipal revenue in the face of fiscal stress. The contributors of these conference proceedings provide detailed analyses of municipal revenue and examine the viability of selected local tax and nontax instruments as potential solutions to municipal fiscal shortfalls. The chapters are grouped in six sections:
— The importance of municipal finance— Intergovernmental transfers and municipal fiscal structures— Broad-based local taxes and development impact fees— Financing submunicipal services— Capital financing of infrastructure— Comparisons of the property tax with other revenue instruments
It is clear there is no quick fix in the face of fiscal uncertainty, but solutions must not undermine the city’s economic base; tax hikes should be tied to service improvements; cities should encourage private provision of club goods to complement local public services; and a strong city government coalition is needed to work with higher-level governments.
Chapter authors:J. Edwin Benton • Leah Brooks • Gregory S. Burge • Jeffrey I. Chapman •Ron Cheung • Robert J. Eger III • Richard C. Feiock • José A. Gómez-Ibáñez •Tracy M. Gordon • Robert P. Inman • Rachel Meltzer • David F. Merriman •John L. Mikesell • Michael A. Pagano • Kim Rueben • Paulo Sandroni •David L. Sjoquist • Andrew V. Stephenson • David E. Wildasin
Gregory K. Ingram is president and CEO of the Lincoln Institute of Land Policy and cochair of the Department of International Studies.
Yu-Hung Hong is senior fellow at the Lincoln Institute of Land Policy and a visiting assistant professor at Massachusetts Institute of Technology.
inGRam
HonGmunicipal REVEnuEs and land policiEs
Municipal Revenuesand land policiEs
Municipal Revenuesand land policiEs
proceedings of the 2009 land policy conference
Edited by Gregory K. ingram and Yu-Hung Hong

Municipal Revenues and
Land Policies
Edited by
Gregory K. Ingram and Yu-Hung Hong
© 2010 by the Lincoln Institute of Land Policy
All rights reserved.
Library of Congress Cataloging-in-Publication Data
Municipal revenues and land policies / edited by Gregory K. Ingram and Yu-Hung Hong.
p. cm.Includes bibliographical references and index.
ISBN 978-1-55844-208-5 (alk. paper)1. Municipal finance—United States. 2. Land use—Government policy—United States.
I. Ingram, Gregory K. II. Hong, Yu-Hung. III. Lincoln Institute of Land Policy.HJ9141.M86 2010
336.2'014—dc22 2010006976
Designed by Vern Associates
Composed in Sabon by Achorn International in Bolton, Massachusetts. Printed and bound by Puritan Press Inc., in Hollis, New Hampshire.
The paper is Rolland Enviro100, an acid-free, 100 percent PCW recycled sheet.
m a n u f a c t u r e d i n t h e u n i t e d s t a t e s o f a m e r i c a
CONTENTS
List of Illustrations ix
Preface xiii
The Importance of Municipal Finance 1
1. Municipal Revenue Options in a Time of Financial Crisis 3
Gregory K. Ingram and Yu-Hung Hong
2. Financing Cities 26
Robert P. Inman
Intergovernmental Transfers and Municipal Fiscal Structures 45
3. Intergovernmental Transfers to Local Governments 47
David E. Wildasin
commentary 77
Michael Smart
4. Trends in Local Government Revenues: The Old, the New, and the Future 81
J. Edwin Benton
commentary 113
Jocelyn M. Johnston
5. Creative Designs of the Patchwork Quilt of Municipal Finance 116
Michael A. Pagano
commentary 141
Carol O’Cleireacain

vi Contents
Broad-Based Local Taxes and Development Impact Fees 145
6. The Contribution of Local Sales and Income Taxes to Fiscal Autonomy 147
John L. Mikesell
commentary 179
Cynthia L. Rogers
7. The Effects of Development Impact Fees on Local Fiscal Conditions 182
Gregory S. Burge
commentary 213
Albert Saiz
8. A New Financial Instrument of Value Capture in São Paulo: Certificates of Additional Construction Potential 218
Paulo Sandroni
commentary 237
Margaret Walls
Financing Submunicipal Services 241
9. Governance Structures and Financial Authority in Submunicipal Districts: Implications for Fiscal Performance 243
Robert J. Eger III and Richard C. Feiock
commentary 268
Richard Briffault
10. Does a Rising Tide Compensate for the Secession of the Successful? Illustrating the Effects of Business Improvement Districts on Municipal Coffers 271
Leah Brooks and Rachel Meltzer
commentary 303
Lynne B. Sagalyn

Contents vii
11. Does TIF Make It More Difficult to Manage Municipal Budgets? A Simulation Model and Directions for Future Research 306
David F. Merriman
commentary 334
Mark Skidmore
12. Homeowners Associations and Their Impact on the Local Public Budget 338
Ron Cheung
commentary 367
John E. Anderson
Capital Financing of Infrastructure 371
13. Complex Debt for Financing Infrastructure 373
Jeffrey I. Chapman
commentary 395
Mark D. Robbins and William Simonsen
14. Prospects for Private Infrastructure in the United States: The Case of Toll Roads 399
José A. Gómez-Ibáñez
commentary 428
José C. Carbajo
Comparisons of the Property Tax with Other Revenue Instruments 431
15. An Analysis of Alternative Revenue Sources for Local Governments 433
David L. Sjoquist and Andrew V. Stephenson
commentary 474
William F. Fox

viii Contents
16. The Best of Times or the Worst of Times? How Alternative Revenue Structures Are Changing Local Government 476
Tracy M. Gordon and Kim Rueben
commentary 497
Michael J. Wasylenko
Contributors 507
Index 511
About the Lincoln Institute of Land Policy 536
81
4Trends in Local Government Revenues: The Old, the New,
and the Future
J. Edwin Benton
Local governments are by far the most numerous, pervasive, and relied upon of the family of governments in the United States. This is due in large measure to Americans’ preference for a decentralized structure of
government in which a greater portion of political authority and responsibility for service provision resides with local rather than national or regional govern-ments. While there are one national government and 50 state governments, there are 89,476 local governments comprising 3,033 counties, 19,492 municipalities, 16,519 towns and townships, 37,381 special districts, and 13,051 school districts (U.S. Census Bureau 2009). This means that there is one unit of local government for about every 3,100 persons. Given the pervasiveness and overlapping nature of local governments in the United States, it is not unusual for the typical Ameri-can to live within the jurisdiction of multiple local governments and receive one or more services from each of them. For instance, it is possible for an individual to live within a county, a school district, some type of municipality (city, town, borough, or village), several special districts or legislative authorities, and pos-sibly a township, and therefore to depend on each government for the provision of a variety of services. By contrast, Europeans, who for the most part live under a centralized structural arrangement, are much more dependent on either their national (central) or regional government for the delivery of basic services.
Given the decentralized nature of governmental organization in the United States, it is not surprising that Americans have developed significant and broad-ranging expectations for their local governments and historically have relied on them to provide a myriad of staple services. Perhaps in no other country except
82 J.EdwinBenton
Canada are local governments expected to do more (Morgan, England, and Pelissero 2007). Scholars of local government often group the services into three basic categories: traditional, municipal-type, and urban-type or regional (see Benton 2002). Traditional services include welfare, health care, the court system and related judicial functions, supervision of elections, tax assessment and col-lection, and education. They are usually some of the oldest local government services, are most likely provided by counties (the exception being education, where school districts predominate), and are often mandated by the state. They also can include animal control, agricultural extension services, road and bridge construction and repair, 911 dispatch, emergency medical services, and correc-tional facilities. Municipal-type services include fire protection, water and gas supply, solid waste and sewage collection, storm-water management, traffic con-trol, libraries, and health, safety, and building inspections. As the name implies, they are typically provided by municipalities and townships, although counties and special districts are increasingly adding these services to their repertoire of responsibilities. Finally, urban-type or regional services include parks and recrea-tion, cultural amenities, parking facilities, solid waste and sewage disposal, mass transit, planning and zoning, water transportation and terminals, and conserva-tion and environmental protection. They are the fastest growing of the services provided by all local governments.
Paying for the provision of these services costs lots of money. In 2002, for example, total spending by counties, municipalities, townships, special districts, and school districts amounted to $1.14 trillion, or $3,959 on a per capita ba-sis. By comparison, states spent $1.28 trillion, or $4,455 per capita. In spite of spending less money, local governments had larger workforces than did the states (13.3 million local employees compared to 5.1 million state employees). In testa-ment to the public’s growing appetite for new services and desire for the expan-sion of older services over the last 20 years, total local spending doubled, and the local government workforce increased by 45 percent. Local governments are constantly under pressure to raise more revenue to keep pace with rising service demands. According to local government officials, there are few problems that could not be solved, or at least made much easier to handle, if more money were available. No other issue dominates the agenda of local government as much as money does.
To date, a fairly extensive body of scholarly literature devoted to the expen-diture activities of local governments has informed our understanding of the fac-tors that account for variations in their spending behavior. In contrast, scholars have paid somewhat less attention to the factors that impact revenue-raising poli-cies of local governments and changes in revenue patterns. The purpose of this chapter is to expand our understanding of how local governments go about the business of raising sufficient money to finance a larger and more expensive menu of services. Specific attention is devoted to the variability among local government sources of revenue. To that end, the chapter examines revenue patterns of coun-ties, municipalities, townships, special districts, and school districts from 1962

trends in local government revenues 83
(the earliest available reliable data) to 2002 in an effort to not only highlight variability but also offer explanations for these differences. Finally, the chapter speculates about future revenue trends, given the constraints of downturns in the economy, antitax sentiments of the public, and the effects of globalization.
Local Governments: Creatures of Their States
Perhaps one of the oldest axioms of government organization and structure in the United States is that local governments exist in a unitary relationship to their states, meaning that they are created by their states for the explicit purpose of assisting the states in the provision of sundry services at the local level. While the national government and the states were recognized as sovereign, independent governments and the recipients of either enumerated or reserved powers under the terms of the U.S. Constitution, local governments possessed no independent right of existence and, when established, depended on their states for general and specific grants of power. To ensure that state services and programs were made available to citizens at the local level, states established counties that function like branch or satellite offices of the state and that legally are referred to as adminis-trative arms or political subdivisions.1 In addition, counties in New England and the Midwest were subdivided into townships to assist their county governments in the delivery of specific services, such as snow removal, libraries, law enforce-ment, and parks. It is not unusual for New England townships to raise and spend more money than counties and sometimes municipalities do and to function in ways similar to counties. States authorized the creation of municipalities to fa-cilitate the provision of municipal-type services—such as solid waste collection and disposal, fire and police protection, street lighting, and utilities—unavailable from either the county or the state government. In addition, states have estab-lished special districts to fill the service void left by counties, municipalities, and townships, and have created school districts with the sole function of providing a comprehensive education program for students from kindergarten through high school.
Like parents and their children, state governments and local governments have nearly always had love-hate relationships because local governments have been considered legally inferior to their states in all matters, with states retaining the right to abridge and control any powers granted to local governments. This view was given additional force as a result of the 1868 decision of an Iowa state judge that upheld total state sovereignty. Known as Dillon’s rule, the decision in effect says that local governments owe their origin to and derive their powers solely from the state. Under this rule, local governments have only those powers
1. Rhode Island abolished its counties in 1842, while Connecticut did the same in 1958. To date, Massachusetts has abolished around half of its 12 counties.

84 J.EdwinBenton
expressly granted to them by the state constitution or legislature or any other powers that can be fairly implied from those specific grants of authority.
This legal backdrop does not bode well for local governments that appear to be engaged in a never-ending quest to raise enough money to the pay for the public’s seemingly insatiable appetite for more and better services. Simply put, state constitutional and statutory restrictions create severe constraints on local governments’ revenue-raising capacity. Conflict inevitably ensues as local gov-ernments seek more state aid (especially for education, corrections, health care, and social services) and shared revenue from gasoline, tobacco, and other taxes; independent authority to raise additional revenues through local option sales, income, and gas taxes and impact fees; and greater control over how to spend their money. In addition, friction occurs when local governments seek relief from costly unfunded mandates or onerous restrictions and exemptions pertinent to the property tax.
Prolonged battles over financial issues (which some observers have even com-pared to a tug-of-war) between local governments, their officials, and concerned citizens, on one hand, and state legislators and governors, on the other hand, have become a fixture of state-local relations and are certain to continue into the decades ahead. The situation seems comparable to a teenager’s desire to assert a modicum of independence from protective and distrustful parents and to be per-mitted to make important decisions and choices like a grown-up. Have local gov-ernments been able to obtain greater fiscal independence from their states and to convince states to give them more state aid and shared revenue? Have they been able to secure more federal grants-in-aid? Tracking revenue patterns over several decades should permit some generalizations about the degree to which local gov-ernments have been able to determine the mix of revenue sources they can draw upon and to what extent. This information is important for scholars seeking to develop and test theories about factors influencing local government revenue be-havior, and equally important for local public officials who want to learn more about what other jurisdictions in their states or in other states are doing.
Analysis of Revenue Trends
The analysis that follows focuses on general revenues of local governments. It excludes funds generated by self-sustaining enterprise operations and the sale of short- or long-term general obligation, revenue, mortgage, and industrial and economic development bonds, as well as insurance trust revenues and liquor store revenues. In short, the analysis is limited to revenues that fall into the two broad categories that comprise the general revenue fund: revenues derived from local governments’ own sources and intergovernmental revenue. The 40-year time frame of the analysis (1962–2002) should facilitate the identification of dis-tinct revenue patterns for counties, municipalities, townships, special districts, and school districts and thereby assist both scholars and practitioners in gain-
trends in local government revenues 85
ing a better understanding of the revenue-generating activities of modern local governments.
Global View of local GoVernment reVenuesIn 1962 local governments amassed slightly more than $38.3 billion in general revenue (GR), or $206 on a per capita basis. State governments were raising somewhat smaller sums of GR—$31.2 billion, or $168 per capita. Over the next 20 years, GR collections of state governments increased at a faster pace than those of local governments, and by the mid-1980s state governments were gener-ating more GR than local governments. Nonetheless, by 2002 local government GR had increased to almost $1 trillion ($995.9 billion) or $3,458 per capita. In other words, local government GR collections had increased on average by about $24 billion or $81 per capita per year during this 40-year period. When measured in constant dollars, the GR of local governments increased by almost 700 percent between 1962 and 2002.
As noted above, the money needed to pay for the cost of services funded by the typical local government operating budget appears under two general cat-egories located on the revenue side of the budget document: own-source revenue (OSR) and intergovernmental revenue (IR). While all local governments derive a significantly larger proportion of their GR from OSR, there is considerable variability in the degree to which each source is used (see figure 4.1). Townships and municipalities have always been the most reliant on OSR, and in 1962 OSR accounted for 80 percent of these two governments’ GR monies. Dependence on OSR declined noticeably for municipal governments and townships during the late 1960s and most of the 1970s, dropping to 65 percent for municipalities and 70 percent for townships, as a result of the availability of huge amounts of federal aid. Nevertheless, with a cutback in federal funds beginning in 1982, reli-ance on OSR began to steadily rise again. By 2002 OSR accounted for 77 percent of the GR funds of townships, about where it was in 1962, while OSR revenue composed 70 percent of GR funds available to municipalities, 10 percent less than in 1962.
Figure 4.1 shows that special districts initially were also almost as dependent on OSR as were townships and municipal governments. That is, OSR accounted for 79 percent of all GR of townships in 1962. Again, receipt of large sums of federal aid in the late 1960s and throughout the 1970s seemed to have led to a lessened dependence of special districts on OSR, with its proportion of GR declining to the 65 to 70 percent range during this period. By 2002 around 66 percent of all GR of special districts was coming from OSR.
Counties, while depending on OSR for the largest part of GR, historically have relied on this source less than municipalities, townships, and special dis-tricts. In 1962, 61 percent of county governments’ GR was derived from OSR collections, and OSR continued to account for the same percentage in 2002. The infusion of considerable sums of federal aid money during the latter half of the

86 J.EdwinBenton
1960s and for the entire decade of the 1970s did result in a small decline in coun-ties’ dependence on OSR.
School districts have been the least dependent on OSR. In 1962 OSR ac-counted for 59 percent of school district GR. Over the next 40 years, school district reliance on OSR steadily declined, and OSR now makes up 43 percent of GR. This proportion is much lower than the proportion for the other four types of local government.
Figure 4.2 illustrates that intergovernmental revenue, while usually an im-portant component of local government GR, makes up a smaller proportion of the GR of four of these governments than does OSR. The exception is school dis-tricts. State governments historically have contributed substantially to the costs of operating local schools, and by 2002 school districts depended on IR for 57 per-cent of their GR. The figure also indicates that counties, while relying less on IR than school districts, receive a significantly larger percentage of their GR from IR than do municipalities, townships, and special districts. The greater reliance of county governments on IR is the result of the fact that counties traditionally have been the targeted recipients of large amounts of shared revenue and aid from the states. For the most part, IR has been accountable for close to 40 percent of the
Figure 4.1Own-Source Revenue as a Percentage of General Revenue, 1962–2002
90
80
70
60
50
40
30
20
10
01962 1967 1972 1977 1982 1987 1992 1997 2002
TownshipsMunicipalities
Special districtsCounties
School districts
Figure 4.1Lincoln_Hong_Municipal Revenues
Perce
ntag
e
Source: This figure is based on calculations derived from data found in U.S. Census Bureau, Compendium of Government Finances, 1962, 1967, 1972, 1977, 1982, 1992, 1997, 2002, table 3.

trends in local government revenues 87
GR of counties, with the percentage climbing as high as 45 percent during the heyday of federal grant-in-aid funding.
Reliance on IR by special districts and municipalities is similar. Their de-pendence on IR was much lower than that of school districts and counties at the beginning of the 40-year period examined here, but the proportion increased steadily, as did federal aid money, until the early 1980s. From that point, their IR component of GR tapered off until around 1992, when the IR part of special district and municipal GR started rising to 30 and 34 percent, respectively. This means that the IR component of special district and municipal GR is approxi-mately 10 percent greater today than it was 40 years ago. In short, the gap be-tween municipal dependence on IR, on one hand, and county dependence, on the other hand, shrank to about 10 percent between 1962 and 2002, while the gap between special districts and counties declined to around 4 percent. However, the gap between all three of these types of governments and school districts is large.
Lastly, the proportion of township GR attributable to IR was about the same in 2002 as it was in 1962. IR accounted for slightly less than 23 percent of GR in 1962, while it made up just over 23 percent of GR in 2002. As was the case with counties, special districts, and municipalities, the IR proportion of township GR did increase somewhat during the late 1960s and the decade of the 1970s (but not to the same degree as for special districts and municipalities), thus coinciding with a period marked by the greater availability of federal grant-in-aid monies.
Figure 4.2Intergovernmental Revenue as a Percentage of General Revenue, 1962–2002
60
50
40
30
20
10
01962 1967 1972 1977 1982 1987 1992 1997 2002
TownshipsMunicipalities
Special districtsCounties
School districts
Figure 4.2Lincoln_Hong_Municipal Revenues
Perce
ntag
e
Source: This figure is based on calculations derived from data found in U.S. Census Bureau, Compendium of Government Finances, 1962, 1967, 1972, 1977, 1982, 1992, 1997, 2002, table 3.

88 J.EdwinBenton
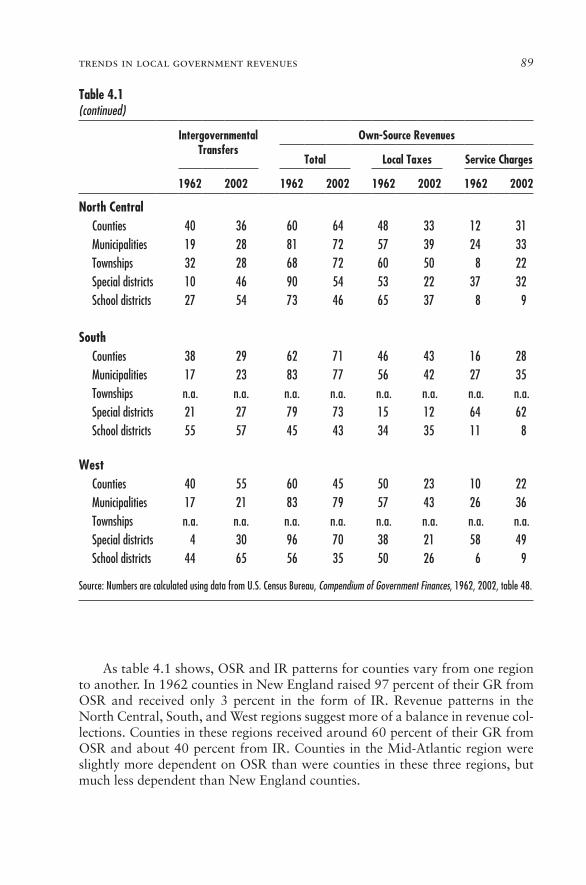
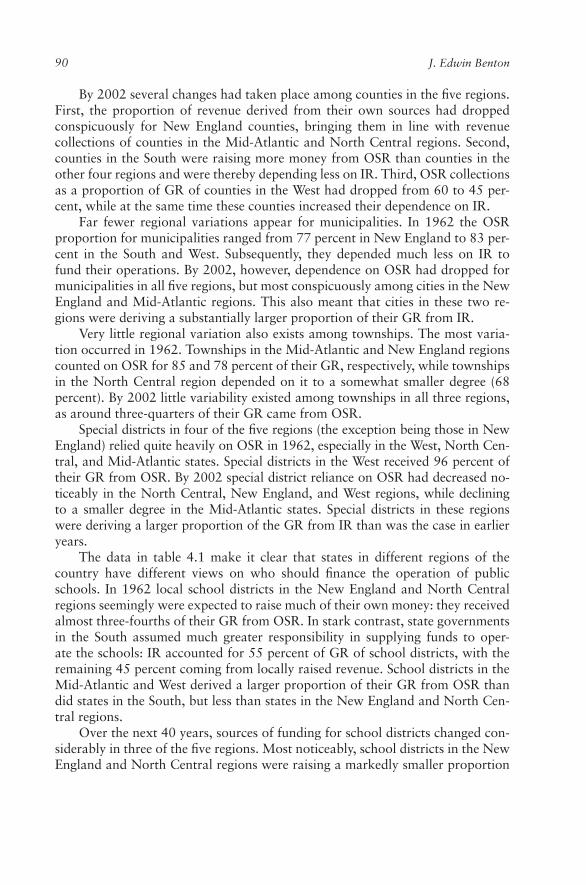
Table 4.1Intergovernmental Transfers and Own-Source Revenues by Region, 1962 and 2002 (%)
Intergovernmental Transfers
Own-Source Revenues
Total Local Taxes Service Charges
1962 2002 1962 2002 1962 2002 1962 2002
New England Counties 3 37 97 63 76 42 21 21 Municipalities 23 44 77 56 69 43 8 13 Townships 22 24 78 76 73 66 5 10 Special districts 38 69 62 31 9 9 53 22 School districts 27 63 73 27 67 23 6 4
Mid-Atlantic Counties 29 35 71 65 61 42 10 23 Municipalities 20 42 80 58 67 42 13 16 Townships 15 21 85 79 73 57 12 22 Special districts 11 26 89 74 5 8 84 66 School districts 40 45 60 55 54 51 6 4
Regional Differences In addition to variability in OSR and IR, significant regional differences exist among the nation’s counties, municipalities, town-ships, special districts, and school districts. To the extent that they exist, such variations could be suggestive of differing cultural views about meth-ods of financing local governments and their expected roles (e.g., see Elazar 1966). For instance, greater reliance on OSR may be indicative of the be-lief that a local government should be largely self-sustaining, while greater dependence on IR may suggest that the state will exercise more control and supervision over a local government. Previous studies of local govern-ments have often identified five distinct regions—New England, Mid-Atlantic, North Central, South, and West.2 Those same regional breakdowns are used in table 4.1.
2. The states in the five regions are as follows: New England: Connecticut, Maine, Massachu-setts, New Hampshire, Rhode Island, and Vermont; Mid-Atlantic: New Jersey, New York, and Pennsylvania; North Central: Illinois, Indiana, Iowa, Kansas, Michigan, Minnesota, Missouri, Nebraska, North Dakota, Ohio, South Dakota, and Wisconsin; South: Alabama, Arkansas, Delaware, Florida, Georgia, Kentucky, Louisiana, Maryland, Mississippi, North Carolina, Oklahoma, South Carolina, Tennessee, Texas, Virginia, and West Virginia; West: Alaska, Ari-zona, California, Colorado, Hawaii, Idaho, Montana, Nevada, New Mexico, Oregon, Utah, Washington, and Wyoming.
trends in local government revenues 89
As table 4.1 shows, OSR and IR patterns for counties vary from one region to another. In 1962 counties in New England raised 97 percent of their GR from OSR and received only 3 percent in the form of IR. Revenue patterns in the North Central, South, and West regions suggest more of a balance in revenue col-lections. Counties in these regions received around 60 percent of their GR from OSR and about 40 percent from IR. Counties in the Mid-Atlantic region were slightly more dependent on OSR than were counties in these three regions, but much less dependent than New England counties.
Table 4.1(continued)
Intergovernmental Transfers
Own-Source Revenues
Total Local Taxes Service Charges
1962 2002 1962 2002 1962 2002 1962 2002
North Central Counties 40 36 60 64 48 33 12 31 Municipalities 19 28 81 72 57 39 24 33 Townships 32 28 68 72 60 50 8 22 Special districts 10 46 90 54 53 22 37 32 School districts 27 54 73 46 65 37 8 9
South Counties 38 29 62 71 46 43 16 28 Municipalities 17 23 83 77 56 42 27 35 Townships n.a. n.a. n.a. n.a. n.a. n.a. n.a. n.a. Special districts 21 27 79 73 15 12 64 62 School districts 55 57 45 43 34 35 11 8
West Counties 40 55 60 45 50 23 10 22 Municipalities 17 21 83 79 57 43 26 36 Townships n.a. n.a. n.a. n.a. n.a. n.a. n.a. n.a. Special districts 4 30 96 70 38 21 58 49 School districts 44 65 56 35 50 26 6 9
Source: Numbers are calculated using data from U.S. Census Bureau, Compendium of Government Finances, 1962, 2002, table 48.
90 J.EdwinBenton
By 2002 several changes had taken place among counties in the five regions. First, the proportion of revenue derived from their own sources had dropped conspicuously for New England counties, bringing them in line with revenue collections of counties in the Mid-Atlantic and North Central regions. Second, counties in the South were raising more money from OSR than counties in the other four regions and were thereby depending less on IR. Third, OSR collections as a proportion of GR of counties in the West had dropped from 60 to 45 per-cent, while at the same time these counties increased their dependence on IR.
Far fewer regional variations appear for municipalities. In 1962 the OSR proportion for municipalities ranged from 77 percent in New England to 83 per-cent in the South and West. Subsequently, they depended much less on IR to fund their operations. By 2002, however, dependence on OSR had dropped for municipalities in all five regions, but most conspicuously among cities in the New England and Mid-Atlantic regions. This also meant that cities in these two re-gions were deriving a substantially larger proportion of their GR from IR.
Very little regional variation also exists among townships. The most varia-tion occurred in 1962. Townships in the Mid-Atlantic and New England regions counted on OSR for 85 and 78 percent of their GR, respectively, while townships in the North Central region depended on it to a somewhat smaller degree (68 percent). By 2002 little variability existed among townships in all three regions, as around three-quarters of their GR came from OSR.
Special districts in four of the five regions (the exception being those in New England) relied quite heavily on OSR in 1962, especially in the West, North Cen-tral, and Mid-Atlantic states. Special districts in the West received 96 percent of their GR from OSR. By 2002 special district reliance on OSR had decreased no-ticeably in the North Central, New England, and West regions, while declining to a smaller degree in the Mid-Atlantic states. Special districts in these regions were deriving a larger proportion of the GR from IR than was the case in earlier years.
The data in table 4.1 make it clear that states in different regions of the country have different views on who should finance the operation of public schools. In 1962 local school districts in the New England and North Central regions seemingly were expected to raise much of their own money: they received almost three-fourths of their GR from OSR. In stark contrast, state governments in the South assumed much greater responsibility in supplying funds to oper-ate the schools: IR accounted for 55 percent of GR of school districts, with the remaining 45 percent coming from locally raised revenue. School districts in the Mid-Atlantic and West derived a larger proportion of their GR from OSR than did states in the South, but less than states in the New England and North Cen-tral regions.
Over the next 40 years, sources of funding for school districts changed con-siderably in three of the five regions. Most noticeably, school districts in the New England and North Central regions were raising a markedly smaller proportion
trends in local government revenues 91
of their GR from OSR in 2002, while receiving a substantially larger proportion from IR. School districts in the West region were receiving more of their GR from IR sources, thus relying less on locally raised revenue.
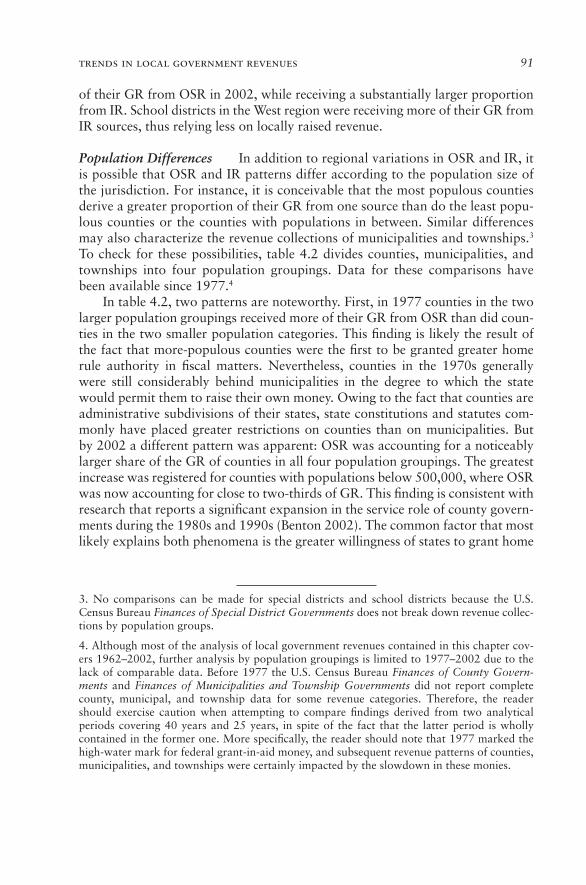
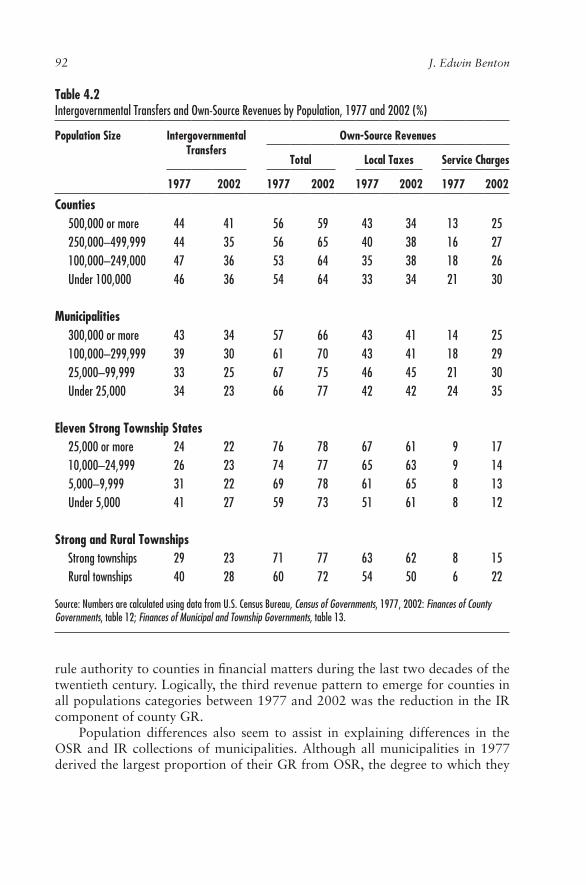
Population Differences In addition to regional variations in OSR and IR, it is possible that OSR and IR patterns differ according to the population size of the jurisdiction. For instance, it is conceivable that the most populous counties derive a greater proportion of their GR from one source than do the least popu-lous counties or the counties with populations in between. Similar differences may also characterize the revenue collections of municipalities and townships.3 To check for these possibilities, table 4.2 divides counties, municipalities, and townships into four population groupings. Data for these comparisons have been available since 1977.4
In table 4.2, two patterns are noteworthy. First, in 1977 counties in the two larger population groupings received more of their GR from OSR than did coun-ties in the two smaller population categories. This finding is likely the result of the fact that more-populous counties were the first to be granted greater home rule authority in fiscal matters. Nevertheless, counties in the 1970s generally were still considerably behind municipalities in the degree to which the state would permit them to raise their own money. Owing to the fact that counties are administrative subdivisions of their states, state constitutions and statutes com-monly have placed greater restrictions on counties than on municipalities. But by 2002 a different pattern was apparent: OSR was accounting for a noticeably larger share of the GR of counties in all four population groupings. The greatest increase was registered for counties with populations below 500,000, where OSR was now accounting for close to two-thirds of GR. This finding is consistent with research that reports a significant expansion in the service role of county govern-ments during the 1980s and 1990s (Benton 2002). The common factor that most likely explains both phenomena is the greater willingness of states to grant home
3. No comparisons can be made for special districts and school districts because the U.S. Census Bureau FinancesofSpecialDistrictGovernments does not break down revenue collec-tions by population groups.
4. Although most of the analysis of local government revenues contained in this chapter cov-ers 1962–2002, further analysis by population groupings is limited to 1977–2002 due to the lack of comparable data. Before 1977 the U.S. Census Bureau FinancesofCountyGovernments and FinancesofMunicipalitiesandTownshipGovernments did not report complete county, municipal, and township data for some revenue categories. Therefore, the reader should exercise caution when attempting to compare findings derived from two analytical periods covering 40 years and 25 years, in spite of the fact that the latter period is wholly contained in the former one. More specifically, the reader should note that 1977 marked the high-water mark for federal grant-in-aid money, and subsequent revenue patterns of counties, municipalities, and townships were certainly impacted by the slowdown in these monies.
92 J.EdwinBenton
rule authority to counties in financial matters during the last two decades of the twentieth century. Logically, the third revenue pattern to emerge for counties in all populations categories between 1977 and 2002 was the reduction in the IR component of county GR.
Population differences also seem to assist in explaining differences in the OSR and IR collections of municipalities. Although all municipalities in 1977 derived the largest proportion of their GR from OSR, the degree to which they
Table 4.2Intergovernmental Transfers and Own-Source Revenues by Population, 1977 and 2002 (%)
Population Size Intergovernmental Transfers
Own-Source Revenues
Total Local Taxes Service Charges
1977 2002 1977 2002 1977 2002 1977 2002
Counties 500,000 or more 44 41 56 59 43 34 13 25 250,000–499,999 44 35 56 65 40 38 16 27 100,000–249,000 47 36 53 64 35 38 18 26 Under 100,000 46 36 54 64 33 34 21 30
Municipalities 300,000 or more 43 34 57 66 43 41 14 25 100,000–299,999 39 30 61 70 43 41 18 29 25,000–99,999 33 25 67 75 46 45 21 30 Under 25,000 34 23 66 77 42 42 24 35
Eleven Strong Township States 25,000 or more 24 22 76 78 67 61 9 17 10,000–24,999 26 23 74 77 65 63 9 14 5,000–9,999 31 22 69 78 61 65 8 13 Under 5,000 41 27 59 73 51 61 8 12
Strong and Rural Townships Strong townships 29 23 71 77 63 62 8 15 Rural townships 40 28 60 72 54 50 6 22
Source: Numbers are calculated using data from U.S. Census Bureau, Census of Governments, 1977, 2002: Finances of County Governments, table 12; Finances of Municipal and Township Governments, table 13.

trends in local government revenues 93
did so appears to be a function of their population. More specifically, reliance on OSR increased as municipality size decreased, while reliance on IR increased as a jurisdiction’s population increased. These patterns may have been caused by one common external source: the federal government. The 1960s and 1970s were a period of phenomenal and unprecedented growth in federal grants-in-aid. An overwhelming proportion of the aid that went to local governments was allocated to large cities that were coping with decaying infrastructure, crime, welfare, education, and environmental concerns. Inspection of other data indi-cates that the OSR of larger municipalities grew at a faster pace in the 1960s and 1970s than did the OSR of smaller municipalities. By 2002 municipalities of all sizes were obtaining a significantly larger percentage of their GR from OSR. Mu-nicipalities with populations less than 250,000 led the way, as OSR constituted approximately three-fourths of their GR. Even municipalities in the 250,000 to 499,999 range and those over 500,000 were reporting that OSR made up 70 and 66 percent, respectively, of their GR.
Although townships usually contain fewer people and provide a smaller range of services than do either counties or municipalities, they historically have been much more reliant on OSR, receiving around three-fourths of their GR from this source. Nonetheless, the degree to which townships depend on OSR to finance the provision of services varies according to population size. As the data arrayed in table 4.2 for townships in 11 strong township states show, depen-dence on OSR decreases with size. In 1977 townships in the two largest popula-tion groupings received 76 and 74 percent, respectively, from OSR; townships in the two smallest categories received 69 and 59 percent, respectively. Over the next 25 years, townships—like counties and municipalities—were the benefi-ciaries of state legislation that enhanced the revenue-generating powers of local governments. Therefore, it is not surprising to see that by 2002 townships in all population categories, but particularly those with populations below 10,000, were able to obtain a larger part of their monetary needs from expanded OSR opportunities.
Another way to view the dependence of townships on both OSR and IR is to compare the revenue proportions for strong townships and rural townships.5 As shown in table 4.2, the differences in 1977 are quite pronounced; strong town-ships were much more likely to collect a greater proportion of their GR from OSR than were rural townships. However, the OSR gap between the two types of townships was narrowing by 2002. The enhanced reliance of townships on OSR is probably a reflection of the fact that states with townships were giving
5. The strong townships are in Connecticut, Maine, Massachusetts, Michigan, New Hamp-shire, New Jersey, New York, Pennsylvania, Rhode Island, Vermont, and Wisconsin. The rural townships are in Illinois, Indiana, Kansas, Minnesota, Missouri, Nebraska, North Dakota, Ohio, and South Dakota.

94 J.EdwinBenton
them more latitude in raising their own revenue and were subsequently reducing the amount of state aid and revenue-sharing. However, the fact that townships classified as rural collected a somewhat smaller proportion of their GR from OSR seems to suggest that constitutions and statutes in those nine states were more restrictive in granting authority to raise revenue from own sources than was the case in states with strong townships.
micro-View of own-source reVenue—taxes and charGes for serVicesBy far, own-source revenue, which consists of taxes and charges for services, makes up the largest proportion of county, municipal, township, special district, and school district general revenue. As seen in the analysis above, the OSR com-ponent ranged from a high of around 80 percent for municipalities, townships, and special districts in 1962 to a low of around 60 percent for counties and school districts. By 2002 county and township reliance on OSR remained virtu-ally unchanged, while municipal and special district dependence on OSR declined to 70 and 66 percent, respectively. In stark contrast, school districts historically have been much less reliant on OSR. Although OSR accounted for about the same proportion of GR for school districts as for counties in 1962 (59 percent), this proportion dropped over the next 40 years and now stands at 43 percent.
At this point in the analysis of local government revenues, it is worthwhile to examine the contribution that various taxes (property, sales, income, etc.) and charges for services make to the OSR component of GR. Do counties, municipal-ities, townships, special districts, and school districts exhibit different patterns of reliance on taxes or charges for services, and do these patterns change over time? Figure 4.3 presents data that depict the degree of dependence on taxes.
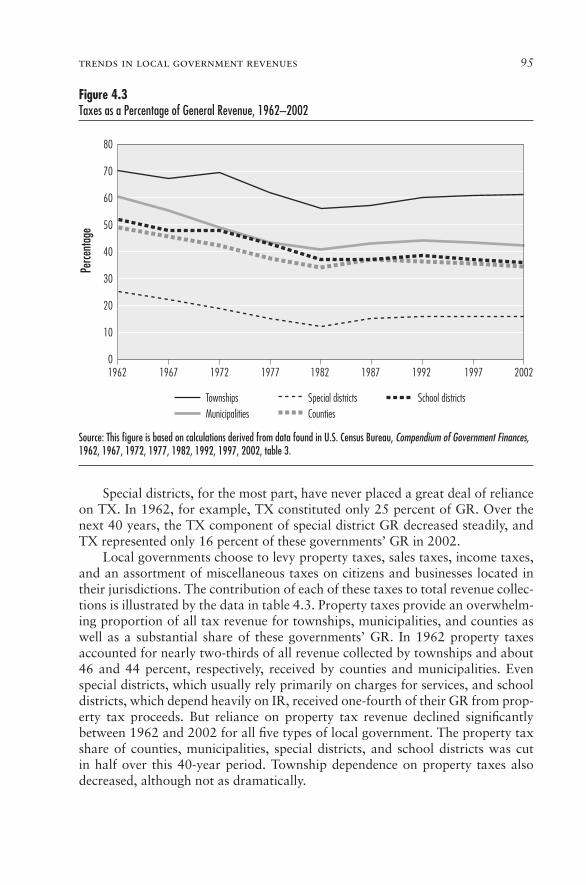
An examination of the figure reveals that townships, municipalities, counties, and school districts have derived the larger proportion of their GR from taxes (TX). Among these four governments, townships traditionally have attached the greatest importance to TX. In 1962 TX constituted 70 percent of township GR; some 40 years later, tax revenue collections still made up 61 percent of GR. His-torically, municipalities, school districts, and counties, although receiving a ma-jority of their OSR from TX, have not relied on them as much as have townships. In 1962 TX made up 60, 52, and 49 percent, respectively, of GR collections of municipalities, school districts, and counties. By 2002 municipal dependence on TX had declined to 42 percent, while school district and county reliance had declined to 36 and 35 percent, respectively. The common trend noted here bears repeating: these four types of government were depending on various taxes for a considerably smaller part of their GR by the end of the 40-year period. The trend is consistent with the well-documented efforts of the local governments to reduce their reliance on a form of revenue that has always enjoyed the least support among citizens. In particular, taxes are routinely criticized for being more regressive than other revenue options. In short, most citizens prefer that their governments identify specific users and charge them accordingly.
trends in local government revenues 95
Special districts, for the most part, have never placed a great deal of reliance on TX. In 1962, for example, TX constituted only 25 percent of GR. Over the next 40 years, the TX component of special district GR decreased steadily, and TX represented only 16 percent of these governments’ GR in 2002.
Local governments choose to levy property taxes, sales taxes, income taxes, and an assortment of miscellaneous taxes on citizens and businesses located in their jurisdictions. The contribution of each of these taxes to total revenue collec-tions is illustrated by the data in table 4.3. Property taxes provide an overwhelm-ing proportion of all tax revenue for townships, municipalities, and counties as well as a substantial share of these governments’ GR. In 1962 property taxes accounted for nearly two-thirds of all revenue collected by townships and about 46 and 44 percent, respectively, received by counties and municipalities. Even special districts, which usually rely primarily on charges for services, and school districts, which depend heavily on IR, received one-fourth of their GR from prop-erty tax proceeds. But reliance on property tax revenue declined significantly between 1962 and 2002 for all five types of local government. The property tax share of counties, municipalities, special districts, and school districts was cut in half over this 40-year period. Township dependence on property taxes also decreased, although not as dramatically.
Figure 4.3Taxes as a Percentage of General Revenue, 1962–2002
80
70
60
50
40
30
20
10
01962 1967 1972 1977 1982 1987 1992 1997 2002
TownshipsMunicipalities
Special districtsCounties
School districts
Figure 4.3Lincoln_Hong_Municipal Revenues
Perce
ntag
e
Source: This figure is based on calculations derived from data found in U.S. Census Bureau, Compendium of Government Finances, 1962, 1967, 1972, 1977, 1982, 1992, 1997, 2002, table 3.

96 J.EdwinBenton
The declining importance of property taxes did not necessarily mean that property tax revenues were being replaced by revenue generated from other types of taxes. Closer inspection of table 4.3 indicates only modest increases in county, municipal, township, school district, and special district revenue derived from sales, income, and several other minor taxes. Taxes on gross receipts (sales tax) produced the largest amount of revenue, but it constituted only about 8 and 12 per-cent of the GR for counties and municipalities, respectively.
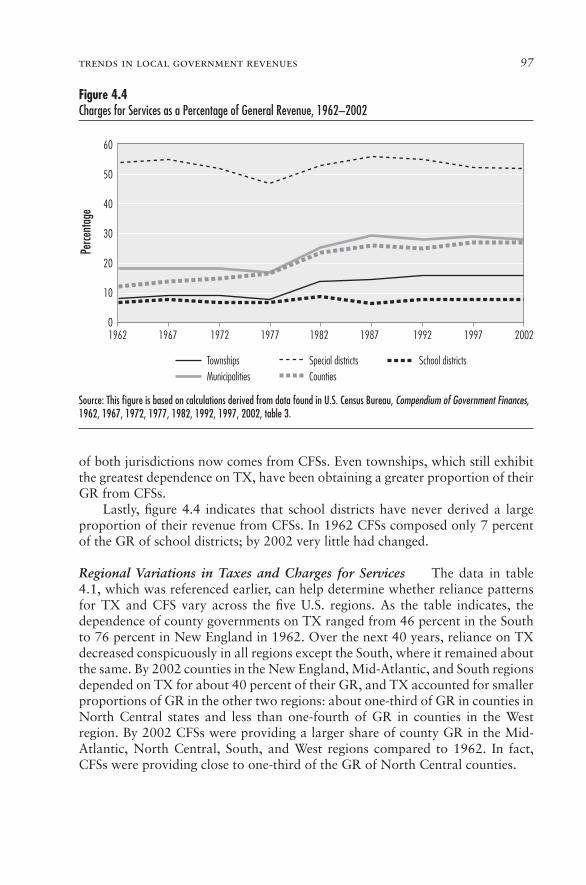
Charges for services (CFSs) make up the other part of OSR, and their part in the overall GR picture for special districts, counties, municipalities, townships, and school districts can be seen from the data displayed in figure 4.4. CFSs con-stitute a substantial part of the GR of special districts, accounting for 54 percent of their OSR in 1962. By 2002 the CFS component of special district GR had changed very little. Special districts traditionally have been created to provide services that counties or municipalities are unwilling or financially or legally un-able to provide to their residents. Therefore, most special districts provide a single service (sewage, water supply, fire protection), and they typically take a busi-ness approach to their operations. That is, they usually devise a fee, assessment, or charge schedule that generates enough revenue to cover the costs of service provision. A tax system is a less preferred method for special districts, but it is more practical for a county or a municipality that provides a package of services, thus making it difficult to determine the cost of specific services per resident or household.
Reacting to the public’s long-standing dissatisfaction with taxes, municipali-ties, counties, and townships have also attempted to raise a larger proportion of their GR from CFSs, thereby reducing their dependence on tax revenue. Their success can be seen in the trends for these governments depicted in figure 4.4. For instance, the proportion of municipal GR received from CFSs increased from 19 to 28 percent between 1962 and 2002, while the county proportion more than doubled from 12 to 27 percent, meaning that over one-quarter of the GR
Table 4.3Revenue from Various Taxes as a Percentage of General Revenue, 1962 and 2002
Counties Municipalities Townships Special Districts School Districts
1962 2002 1962 2002 1962 2002 1962 2002 1962 2002
Property 45.7 24.2 44.2 20.4 65.3 55.8 25.5 11.0 51.0 34.2Sales 1.5 7.7 9.9 12.4 1.5 0.4 0.0 3.9 0.1 0.8Income 0.1 1.3 2.0 5.3 0.2 1.7 0.0 0.0 0.2 0.3Other 1.0 1.6 3.8 3.9 3.1 3.0 0.0 0.9 0.4 0.1
Source: Numbers are calculated using data from U.S. Census Bureau, Compendium of Government Finances, 1962, 2002, table 48.
trends in local government revenues 97
of both jurisdictions now comes from CFSs. Even townships, which still exhibit the greatest dependence on TX, have been obtaining a greater proportion of their GR from CFSs.
Lastly, figure 4.4 indicates that school districts have never derived a large proportion of their revenue from CFSs. In 1962 CFSs composed only 7 percent of the GR of school districts; by 2002 very little had changed.
Regional Variations in Taxes and Charges for Services The data in table 4.1, which was referenced earlier, can help determine whether reliance patterns for TX and CFS vary across the five U.S. regions. As the table indicates, the dependence of county governments on TX ranged from 46 percent in the South to 76 percent in New England in 1962. Over the next 40 years, reliance on TX decreased conspicuously in all regions except the South, where it remained about the same. By 2002 counties in the New England, Mid-Atlantic, and South regions depended on TX for about 40 percent of their GR, and TX accounted for smaller proportions of GR in the other two regions: about one-third of GR in counties in North Central states and less than one-fourth of GR in counties in the West region. By 2002 CFSs were providing a larger share of county GR in the Mid- Atlantic, North Central, South, and West regions compared to 1962. In fact, CFSs were providing close to one-third of the GR of North Central counties.
Figure 4.4Charges for Services as a Percentage of General Revenue, 1962–2002
60
50
40
30
20
10
01962 1967 1972 1977 1982 1987 1992 1997 2002
TownshipsMunicipalities
Special districtsCounties
School districts
Figure 4.4Lincoln_Hong_Municipal Revenues
Perce
ntag
e
Source: This figure is based on calculations derived from data found in U.S. Census Bureau, Compendium of Government Finances, 1962, 1967, 1972, 1977, 1982, 1992, 1997, 2002, table 3.
98 J.EdwinBenton
While there was a fair amount of variability among municipalities with re-gard to reliance on TX in 1962, these differences had virtually disappeared by 2002, when municipalities in all regions obtained roughly four out of ten GR dollars from this source. The 40 years between 1962 and 2002 was also a time in which municipalities in the North Central, South, and West regions began to count on CFSs for a larger proportion of their GR: CFS was accounting for approximately one-third of the GR of municipalities in these three regions. CFS made up a considerably smaller proportion of the GR of municipalities in the New England and Mid-Atlantic states.
Between 1962 and 2002, townships in the North Central, New England, and Mid-Atlantic regions began to depend less on TX and obtain more of their GR from CFS sources. Nevertheless, townships in the New England and Mid-Atlantic regions continued to be the most dependent on TX. That is, TX accounted for two-thirds of the GR of New England townships and 57 percent of the GR of townships in the Mid-Atlantic region. Nevertheless, it is noteworthy that town-ships in the North Central states reduced their reliance on TX from 60 to 50 percent.
Variations in TX and CFS dependency patterns are also detected for spe-cial districts. Generally speaking, special districts in the New England and Mid- Atlantic regions have never relied on TX to supply a large proportion of their GR needs, while special districts in the South have shown a modest dependency on TX. In 1962 special districts in the North Central region received 53 percent of their GR from TX, but by 2002 this proportion had slipped to 22 percent. Like-wise, in the West, the proportion of special district GR funds derived from TX decreased from 38 to 21 percent over the 1962–2002 time span.
Looking at table 4.1 again, one is struck by the fact that the proportion of special district GR accounted for by CFSs declined in all five regions between 1962 and 2002, rather sharply in the New England and Mid-Atlantic states. Nonetheless, special districts in all five regions continue to obtain most of their funding from fees charged to service users. One has to wonder how special dis-tricts in the New England and North Central regions are paying the bills, as TX and CFS accounted for only 31 and 54 percent, respectively, of their GR. Were they relying more on federal and state grants? We return to this question later in the chapter.
School districts in different regions of the country, while never depending heavily on CFSs to finance their operations, exhibit different TX reliance pat-terns. In 1962 school districts in the New England and North Central regions raised about two-thirds of their GR from TX, with districts in the Mid-Atlantic and West regions collecting about one-half of their GR from this one source. School districts in the South were much less dependent on TX and raised ap-proximately a third of their funds through some form of taxation. Although TX dependence patterns among school districts in the Mid-Atlantic and South regions remained basically unchanged over the next 40 years, significant changes occurred in the New England, North Central, and West regions, where reliance

trends in local government revenues 99
on TX plummeted. TX constituted only about a quarter of district GR in the New England and West regions by 2002.
Population Variations for Taxes and Charges for Services The degree to which counties, municipalities, and townships rely on TX and CFS can also be a function of population, as shown in table 4.2. In 1977 reliance on TX de-clined with the size of the county, with the most populous counties showing the greatest dependence. Forty-three percent of the GR of counties with populations over 500,000 was obtained through TX, while counties with populations under 100,000 counted on TX for only 33 percent of GR. Over the next 25 years, the reliance on TX of counties with fewer than 250,000 people changed very little, and TX continued to account for about one-third of their GR. Between 1977 and 2002, counties with populations in excess of 500,000 were able to reduce their dependence on TX, with roughly a third of their GR coming from this source, as compared to 43 percent in 1977. In 2002 counties with populations in the 250,000 to 499,999 range displayed the greatest dependence on TX: 38 per-cent of their GR was obtained from this source.
Table 4.2 also points to the growing importance of CFS as a reliable source of revenue for counties since 1977, thereby relieving these governments of greater dependence on TX. Counties in all four population categories were receiving a considerably larger proportion of their GR from CFSs by 2002 than in 1977. Of particular note were counties with populations over 500,000 and those with pop-ulations under 100,000, which were obtaining 25 and 30 percent of their GR, respectively, from CFSs in 2002. Counties in the other two population groupings could count on CFS to supply roughly a fourth of their GR. This is a significant change in the revenue pattern of governments that have historically relied mainly on TX.
With regard to reliance on TX by municipalities, there is very little variability across the four population groupings or over time, with the proportion of GR accounted for by TX ranging from 41 to 45 percent. Nevertheless, the revenue collected from CFSs grew noticeably for municipalities of all sizes between 1977 and 2002, and cities in each of the four categories were obtaining a larger part of their GR from CFSs. By 2002 greater reliance was being placed on CFS by cities with populations under 100,000, while the least dependence was found among the nation’s largest municipalities.
Contrary to what was seen with counties and municipalities, no major vari-ations are detected for strong townships when they are divided into four popula-tion groupings. Size of township did not seem to matter in either 1977 or 2002, and taxes typically account for around 60 percent of their GR, with the exception being townships with populations below 5,000 in 1977. By 2002 CFS consti-tuted a moderately larger proportion of GR for townships of all sizes, but it was more apparent for larger than for smaller jurisdictions.
A somewhat different picture emerges when townships are divided into strong and rural categories. As shown in table 4.2, rural townships were less

100 J.EdwinBenton
reliant on TX than were strong townships in both 1977 and 2002. By 2002 rural townships were deriving a greater proportion of their GR from CFSs—22 percent compared to 15 percent.
Property Versus Other Taxes: Regional and Population Size Differences Does the degree to which local governments rely on property taxes compared to other types of taxes (OT), such as sales and income taxes, vary across the five regions? Do different-size counties, municipalities, and townships exhibit different de-pendency patterns for property, sales, income, and a variety of other taxes? Since 1982 the U.S. Bureau of the Census has reported revenue data for property and other taxes by region and population groupings only, so the findings are rela-tively limited. Data on regional comparisons are displayed in table 4.4, while breakdowns by population groups are found in table 4.5.
Property taxes (PT), although continuing to be the tax of choice among coun-ties in all five regions, accounted for a much smaller proportion of GR funds in 2002 than in 1962 (see table 4.4). Counties in New England still demonstrate the greatest dependence on PT, and counties in the West are recognized as the least reliant on the ad valorem tax. At the same time that PT was decreasing generally as a percentage of GR, counties appeared to be diversifying their tax revenue collections. As the data in the table suggest, an assortment of other taxes were beginning to account for a larger part of overall county revenues, particularly in the Mid-Atlantic and South regions.
Like counties, municipalities in all five regions decreased their dependency on PT between 1962 and 2002. As were counties, municipalities in the New England region were the most reliant on PT, collecting about two times as much revenue from PTs as did municipalities in the other four regions. Revenue col-lections from OT increased slightly for municipalities in all regions except New England, where other taxes accounted for a negligible proportion of GR.
Similar patterns are also observed for townships. Townships in the New En-gland region led the way with the greatest reliance on PTs in both 1962 and 2002, although the proportion of revenue derived from PTs declined for townships in all three regions over this 40-year period. Nonetheless, townships in each of the three regions remained more reliant on PT than did either counties or munici-palities. Moreover, the data show that, although townships obtain only a small proportion of their GR from other taxes, townships in the Mid-Atlantic region are the most likely to levy taxes on such things as income, sales, and other items.
To the extent that special districts rely on tax revenue to fund their activities, they are most likely to obtain it from the ad valorem tax rather than from OT. Yet, table 4.4 shows that special districts in states that most counted on PTs in 1962 (in the North Central and West regions) had reduced their dependency on them significantly by 2002. Special districts in the West were the most likely to derive even a modest proportion of their GR from OT.
A review of the data for PT and OT for school districts in table 4.4 indicates that, while OTs constitute only a minuscule percentage of districts’ GR, PTs still

trends in local government revenues 101
Table 4.4Property Taxes, Other Taxes, and Federal and State Transfers by Region, 1962 and 2002 (%)
Property Taxes Other Taxes Federal Transfers State Transfers
1962 2002 1962 2002 1962 2002 1962 2002
New England Counties 75 39 0 3 0 2 3 33 Municipalities 68 42 1 0 2 2 21 40 Townships 72 65 1 2 1 1 21 23 Special districts 8 8 0 1 13 31 25 31 School districts 67 23 0 0 9 0 18 54
Mid-Atlantic Counties 56 26 4 16 0 2 29 32 Municipalities 47 20 20 22 1 6 18 35 Townships 60 46 14 11 0 5 14 15 Special districts 5 7 0 0 9 16 2 9 School districts 50 48 4 3 1 1 39 44
North Central Counties 47 24 1 8 0 5 39 31 Municipalities 44 20 12 19 2 5 17 21 Townships 57 46 4 4 0 2 32 24 Special districts 53 19 0 3 8 28 2 17 School districts 65 36 0 1 1 1 27 53
South Counties 42 29 4 14 1 2 36 25 Municipalities 40 21 16 21 3 5 14 17 Townships n.a. n.a. n.a. n.a. n.a. n.a. n.a. n.a. Special districts 15 8 0 4 17 15 5 11 School districts 35 33 0 3 2 1 53 55
(continued)

102 J.EdwinBenton
constitute a sizable proportion of the resources needed to finance public schools in all five regions. However, it is especially important to mention the significant reduction in reliance on PTs in the New England, North Central, and West re-gions; the PT proportion of GR in New England and the West is the lowest among all regions. Also noteworthy is the fact that the PT proportion of school district GR in the Mid-Atlantic and South regions changed very little from 1962 to 2002.
Table 4.5 reveals the heavy reliance placed on property taxes by all three types of local governments regardless of the size of the jurisdiction. For the most part, the proportion of the GR made up of PT is overwhelming and overshadows the contribution attributable to sales, income, and other miscellaneous taxes. However, there are some notable patterns for different categories of counties, municipalities, and townships.
Counties’ dependence on PT is positively related to county population. That is, dependence on PT is the greatest for more populous counties and the least for the least populous counties. In addition, counties of all sizes decreased their dependence on PT after 1977. In 2002 OT made up a larger part of county GR than was the case in 1977.
Like counties, all population groupings of municipalities showed signs of lessened reliance on PT by 2002. Nevertheless, municipalities with populations below 300,000 maintained a greater dependence on PT. While all categories of municipalities were deriving a larger proportion of their GR from OT by 2002, this was particularly the case for counties in the 300,000 and more and 25,000–99,999 ranges.
Table 4.4(continued)
Property Taxes Other Taxes Federal Transfers State Transfers
1962 2002 1962 2002 1962 2002 1962 2002
West Counties 46 17 4 6 0 5 40 48 Municipalities 35 16 22 27 2 5 15 14 Townships n.a. n.a. n.a. n.a. n.a. n.a. n.a. n.a. Special districts 38 11 0 9 3 15 1 14 School districts 50 26 0 0 3 1 41 62
Source: Numbers are calculated using data from U.S. Census Bureau, Compendium of Government Finances, 1962, 2002, table 48.

trends in local government revenues 103
In states where strong townships exist, reliance on PT decreased slightly for those with populations over 10,000, while it increased moderately for townships with populations in the 5,000 to 9,999 range. Dependence on PT increased sig-nificantly for townships with populations below 5,000. However, in contrast to counties and municipalities, there is no evidence to suggest that OTs are playing a more important part in the overall revenue picture for any of the four categories of townships. Nevertheless, when townships are divided into strong and rural
Table 4.5Property Taxes, Other Taxes, and Federal and State Transfers by Population, 1977 and 2002 (%)
Population Size Property Taxes Other Taxes Federal Transfers State Transfers
1977 2002 1977 2002 1977 2002 1977 2002
Counties 500,000 or more 35 23 8 11 8 3 34 36 250,000–499,999 32 27 8 11 9 3 33 31 100,000–249,000 29 23 6 11 12 2 33 29 Under 100,000 27 24 6 11 9 2 36 32
Municipalities 300,000 or more 23 17 20 25 15 8 27 25 100,000–299,999 29 22 14 19 17 5 20 23 25,000–99,999 32 25 13 24 13 3 19 19 Under 25,000 26 23 15 19 13 2 18 16
Eleven Strong Township States 25,000 or more 63 57 5 5 n.a. n.a. n.a. n.a. 10,000–24,999 60 58 5 5 n.a. n.a. n.a. n.a. 5,000–9,999 55 59 6 6 n.a. n.a. n.a. n.a. Under 5,000 43 56 8 8 n.a. n.a. n.a. n.a.
Strong and Rural Townships Strong townships 57 57 5 5 n.a. n.a. n.a. n.a. Rural townships 52 46 2 4 n.a. n.a. n.a. n.a.
Source: Numbers are calculated using data from U.S. Census Bureau, Finances of County Governments, 1977, 2002, table 12; Finances of Municipal and Township Governments, 1977, 2002, table 13.

104 J.EdwinBenton
types, two salient patterns can be discerned. First, rural townships were less reli-ant on PT in both 1977 and 2002. Second, their reliance on PT declined some-what between 1962 and 2002.
micro-View of interGoVernmental reVenue: federal and state fundsAs noted at the outset of this chapter, intergovernmental revenue (IR) has always been an important component of local government GR. In some instances, the proportion of GR derived from IR was the same in 2002 as it was in 1962. This was the case for counties and townships. In 1962 counties depended on IR for 38 percent of their GR, and in 2002 IR still made up 38 percent of counties’ GR. Likewise, townships obtained 23 percent of their GR from IR in 2002, the same proportion as in 1962. This was not the pattern for municipalities, special dis-tricts, and school districts. The importance of IR increased for all three of these types of government between 1962 and 2002. Whereas IR constituted 20 percent of the GR of municipalities in 1962, it increased to 30 percent by 2002. In a similar fashion, the IR proportion of township GR rose from 21 to 34 percent between 1962 and 2002. The most dramatic increase was recorded for school districts—from 41 to 57 percent.
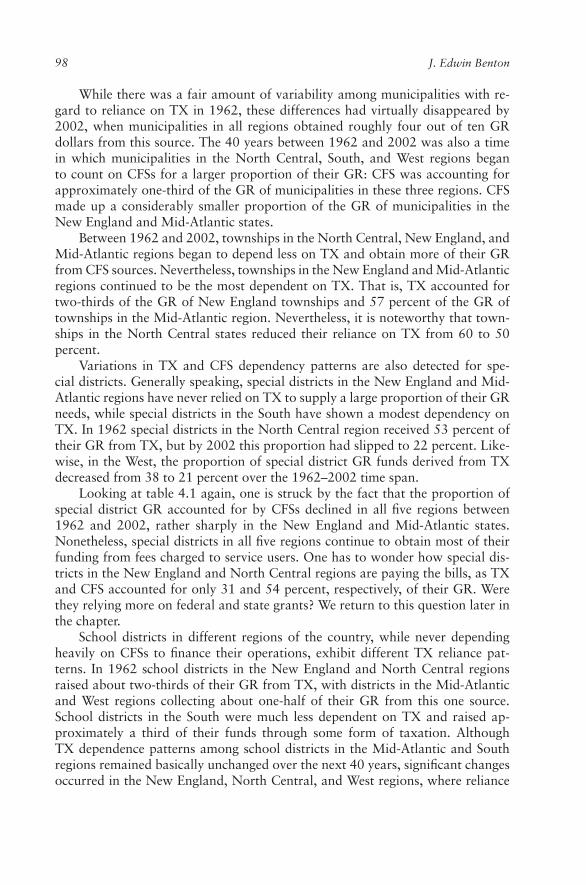
To gain a better understanding of the IR component of the GR of counties, municipalities, townships, special districts, and school districts, it is necessary to break down this source of revenue into its two basic parts.6 Figure 4.5 displays the IR proportion of local governments’ GR that was obtained from the federal government and from state governments. One distinct pattern is that revenue from the state (ST) historically has made up a much larger proportion of the GR of four of the five types of local government than has revenue from the federal government (FED). Only special districts derive a larger part of their revenue from FED than from ST. Not long ago, revenue from the state along with some small amounts of revenue from other local governments was the sum total of IR. Much of the ST revenue is in the form of shared revenues, the idea being that states need to provide money to local governments when the local governments are assisting in the provision of state services at the local level. In this sense, these creatures of the state are serving as administrative subdivisions or arms of their state government. Revenue from the federal government (typically referred to as federal aid) is money given to local or state governments to facilitate efforts of the federal government to further some national agenda or, as is often the case, to assist individuals. Thus, federal and state aid have been prompted by differ-ent rationales, philosophies, and politics, and receipt has come with divergent expectations.
6. IR is technically composed of federal, state, and interlocal revenues. However, given the small amount of money received from other local governments, this part of IR is excluded from the analysis.

trends in local government revenues 105
Figure 4.5 indicates that little has changed in ST reliance patterns of counties and townships. In 1962 ST made up 36 percent of the GR of counties, and by 2002 ST made up 34 percent of county GR. A similar pattern is seen for townships, although these governments traditionally have relied on ST for a smaller pro-portion of GR than have counties (21 percent in 1962 and 20 percent in 2002).
A different pattern of dependence on ST, however, is indicated for school dis-tricts and municipalities. In 1962 school districts received 37 percent of their GR from their state governments (comparable to counties), but that proportion had skyrocketed to 55 percent by 2002. This dramatic increase is probably the result of state efforts to equalize funding for school districts in the wake of federal and state court rulings that criticized funding inequities between poor and affluent districts and suggested that they could be violations of the equal protection clause of the Fourteenth Amendment to the U.S. Constitution. Municipalities were also obtaining a larger proportion of their GR from ST over this 40-year period—22
Figure 4.5Revenue from the Federal (FED) and State (ST) Governments as a Percentage of General Revenue, 1962–2002
60
50
40
30
20
10
01962 1967 1972 1977 1982 1987 1992 1997 2002
School districts—STCounties—STTownships—STMunicipalities—STSpecial districts—ST
Special districts—FEDMunicipalities—FEDTownships—FEDCounties—FEDSchool districts—FED
Figure 4.5Lincoln_Hong_Municipal Revenues
Perce
ntag
e
Source: This figure is based on calculations derived from data found in U.S. Census Bureau, Compendium of Government Finances, 1962, 1967, 1972, 1977, 1982, 1992, 1997, 2002, table 3.
106 J.EdwinBenton
percent in 2002 compared to 16 percent in 1962. This may be indicative of the fact that state governments are using municipalities as well as counties to deliver state programs at the local level.
Finally, special districts have never relied on ST for a significant proportion of their GR. In 1962 ST made up only 3 percent of their GR, and this proportion had increased to only 9 percent by 2002.
Other patterns are evident from figure 4.5. For instance, there has been a very clear up-and-down FED dependence pattern for four of the five local gov-ernments. Specifically, FED as a proportion of the GR of counties, municipalities, townships, and special districts climbed steadily from the mid-1960s until 1982, thus coinciding with the boom and bust period of federal grant-in-aid funding. Some would say that FED has been an unreliable friend to both local and state governments. The states and their local governments, therefore, have been wary of placing too much confidence in money from the federal government, especially in the wake of the overall cuts in grants-in-aid that occurred in 1982. Research on the impact of federal aid cutbacks has shown that state and local governments proceed with more caution when tempted to build federal aid into their long-term budget plans (Benton 1986, 1992).
A different pattern, however, is obvious for school districts. They have con-sistently counted on FED for around 1 percent of their GR throughout the 40-year period of this study.
FED, according to Dye (1966), permits state and local governments to pro-vide programs that they otherwise lack resources to provide. Therefore, it is not surprising that during the 1960s and 1970s, counties, municipalities, town-ships, and special districts succumbed to the lure of increasingly available federal money. Nevertheless, by 2002 three of these four local governments had signifi-cantly reduced their dependence on FED. The FED proportion of municipal GR held at 5 percent, while the county and township proportions had fallen to 3 and 1 percent, respectively. Special districts display greater reliance on FED, with 17 percent of their GR coming from this source. Although the present analysis does not extend beyond 2002, recent empirical evidence suggests that both state and local governments increased their dependence on FED during the George W. Bush administration (Benton 2007).
state Versus federal aid: reGional and PoPulation size differencesThe final aspect of this examination of local government dependence on ST and FED looks at patterns across the five regions for all five local government types, as well as for counties and municipalities of different sizes.7 According to the data
7. This analysis did not include townships because Finances of County Governments and FinancesofMunicipalitiesandTownshipGovernments did not separate out the federal and state components of intergovernmental revenue until 1997.
displayed in table 4.4, two patterns are evident for counties. First, FED made up
trends in local government revenues 107
a small fraction of GR in every region in 1962 and 2002. Second, variations in the ST proportion were fairly small across regions, with a high of 40 percent in the West region and a low of 29 percent in counties in the Mid-Atlantic region. Some changes were noted in 2002, as the ST proportion declined somewhat for counties in the North Central and South regions, but increased in the West.
Regional patterns among municipalities for ST and FED were similar, as illustrated in table 4.4. For instance, there were minimal differences in 1962 in ST dependency patterns among municipalities across regions, with the greatest reliance indicated for municipalities in New England (21 percent) and the least for municipalities in the South (14 percent). By 2002, little had changed in three regions (North Central, South, and West), while municipalities in the New En-gland and Mid-Atlantic regions were reporting a much higher proportion of their GR was being obtained from ST (that is, 40 and 34 percent, respectively). Fur-thermore, receipt of FED comprised only a tiny proportion of GR in all regions in both 1962 and 2002 and did not exceed 5 percent of GR.
ST also makes up a fair amount of the GR of townships, but more so for those located in the North Central region. However, the ST proportion dropped from 32 percent in 1962 to 24 percent in 2002. The ST proportion in the other two re-gions changed very little over the same period. The data in the table also indicate that FED is a very small component of township GR in each of the regions.
While dependence on intergovernmental funding has remained fairly stable for special districts in the Mid-Atlantic and South regions, reliance patterns have vacillated for districts in the New England, North Central, and West regions over the 1962–2002 period. Dependence on both FED and ST was the highest for spe-cial districts in the New England region and increased over the 40-year period, particularly for FED. Significant increases in dependency were also posted with respect to FED in the North Central and West regions between 1962 and 2002, while a notable increase in reliance on ST was evident for special districts in these same two regions.
School districts in all five regions receive a much greater proportion of their GR from ST than from FED. In fact, FED is a very small fraction of the GR of school districts. This is the case in all five regions. ST is an important source of revenue for all school districts, accounting for over half of the 2002 GR in four of five regions. School districts in the Mid-Atlantic region are the least reliant on this revenue source (44 percent of GR in 2002), while districts in the West region are the most dependent (62 percent). Over the last 40 years, significant gains were posted for school districts in three regions—New England, North Central, and West.
Population breakdowns reveal few differences in ST and FED dependency patterns. For instance, the county data in table 4.5 indicate that there were no distinguishing differences between the four population groupings. One pat-tern, however, does emerge from inspection of the data for municipalities in the same table: dependency on ST tends to be lower as the size of the municipality decreases.

108 J.EdwinBenton
Future Revenue Patterns: Charting a New Course, More of the Same, or a Little of Both?
Over the last 40 years, generating sufficient revenues to keep pace with the rising costs associated with escalating service demands became an overriding concern for local government officials. They needed to raise larger sums of money in a fair, equitable, and, if possible, painless manner. Raising revenue (like budgeting, in general) is not a value-free exercise; there is certain to be some person or group that will not be satisfied with the outcome. There were some discernible shifts in how local governments were raising money in 2002 compared to the way they did in 1962. Yet, one is struck by the extent to which some revenue patterns have basically remained unchanged over the last 40 years.
Looking to the future, decisions about the part that own-source revenue ver-sus intergovernmental revenue (or by extension, taxes versus charges for services, which types of taxes, or federal versus state revenue) should play in the overall revenue schemes of local governments will continue to be impacted by some long-standing factors or constraints. First, revenue collections of local govern-ments (like those of the states) will always be subject to the influence of socio-economic forces.8 In reporting the results of policymaking in 87 cities in the San Francisco Bay region in the mid-1960s, Eulau and Prewitt summarized it best: “Seldom can policymakers stray away from the socio-economic constraints of their environment” (1973, 143). In short, more-affluent communities will be able to raise more money than less-affluent communities. Second, own-source revenue collections still vary depending on the latitude that state constitutions and stat-utes grant local governments in raising money. Greater fiscal home rule authority, while never guaranteeing that local governments will take advantage of it, at least gives counties, municipalities, townships, special districts, and school districts the ability to raise more of their own revenue.9 To date, there is some evidence that a number of states have shown a greater willingness to grant more leeway to local government in fiscal matters. Currently, the sales tax is permitted in 33 states, and the income tax, while allowed in 15 states, is used widely in only Kentucky, Ohio, and Pennsylvania (Berman 2005).10 A third factor influencing local gov-
8. Several prominent studies published in the 1960s document the importance of socioeconomic factors in explaining variations in revenue and expenditure patterns of both state and local governments. Some of the more notable ones include Cnudde and McCrone (1969); Dawson and Robinson (1966); Dye (1966); Hofferbert (1966); and Sharkansky and Hofferbert (1969).
9. Recent research (Benton 2003a, 2003b) suggests that county governments that have adopted a reformed structure of government raise and spend more money than those with an unreformed structure. This is opposite of what was found for cities by Lineberry and Fowler (1967).
10. Over 3,500 local jurisdictions have adopted an income tax. Of these, fewer than 900 are outside the state of Pennsylvania. Several of the largest U.S. cities—including New York, De-troit, Cincinnati, Cleveland, Columbus, Philadelphia, and Toledo—collect local income taxes. In Los Angeles, San Francisco, and Newark, taxes are levied on an employer’s total payroll.

trends in local government revenues 109
ernment revenue collections relates to differences in political culture across and within the states. The United States is characterized by a mosaic of philosophi-cal and ideological orientations toward the appropriate role for government as service provider, and these views set parameters for the operations and revenue- raising capabilities of all levels of governments.
Other factors that are more likely to vacillate will influence the revenue- generating ability of local governments generally, although their effects could vary from region to region, state to state, and even community to community within the same state. Fluctuations in the economy are certain to influence the revenue policies of local governments in the years ahead. Local governments in less-affluent settings and already suffering from fiscal stress are always more likely to encounter greater difficulty raising adequate revenues than those in good fiscal health and serving more-affluent residents. Unlike previous downturns in the economy, the present recession may have longer-lasting repercussions for the revenue-raising capabilities of local governments. For instance, unprecedented home foreclosure rates and plummeting real estate values have already resulted in significant reductions in property tax collections. Mounting business and bank failures, declining consumer confidence, high unemployment, and the loss of jobs overseas are taking their toll on sales, income, and other taxes as well as on busi-ness licenses, special assessments, and charges for services (see Benton 2009a). With declining revenue collections, state governments may no longer be able and/or willing to provide the same level of assistance to their local governments. Looking on the bright side, local officials have long indicated that they would be willing to forgo larger amounts of revenue from their state governments in return for greater authority to raise more money from their own sources and for fewer restrictions on such things as the property tax. Data from 1962 to 2002 reveal that local governments have been receiving a larger proportion of their general revenue from their own sources at the same time that their dependency on fund-ing from their states has been decreasing.
Another factor that will continue to shape the local government revenue pic-ture is the lingering uncertainty of federal aid. Local governments that depended on federal aid for approximately one-sixth of their revenue during the 1970s are still reeling from the overall cut in federal grant-in-aid money in 1982 and have since learned that it is unwise to count on such funding. Despite a noticeable increase in the percentage of federal aid being allocated to local governments during the early part of the twenty-first century (Benton 2007), local officials are expected to continue to be extremely cautious about increasing their reliance on federal dollars. Furthermore, local officials are expected to maintain a skeptical attitude toward the use of federal funds even in the wake of the federal stimulus money that they began receiving in 2009.
Local governments, for the most part, have been the beneficiaries of larger amounts of state aid and revenue-sharing monies. Consequently, revenue from the state, on balance, now constitutes a larger proportion of local governments’ general revenue. At the same time, state governments are more amenable to

110 J.EdwinBenton
permitting local governments to expand their revenue collections into areas that were either prohibited or extremely limited 40 or 50 years ago.
In spite of these gains in the revenue-raising capacities of local governments, the effort to continue to grow local government revenues will continue to be im-pacted by the antitax climate in an increasing number of states. While most op-position has been directed at the property tax, residents are beginning to balk at attempts to collect more revenue from sales and income taxes. Reports by the U.S. Advisory Commission on Intergovernmental Relations (ACIR 1991), which reg-ularly surveyed governments and citizens about taxes, indicated that the property tax was considered the “worst” or “least fair” of all types of taxes. More recent research (e.g., Berman 2005, 52; Cole and Kincaid 2000) continues to suggest that the property tax is widely disliked as a form of local revenue: “Public opin-ion polls reflect citizens’ discontent with the property tax, as do ballot initiatives and campaigns in many parts of the country . . . to cap property tax increases” (Berman 2005, 52). Early assaults on the property tax began in California and Massachusetts and have spread to other states, most recently Florida. The latest attacks in that state have taken the form of mandating a rollback in millage rates and doubling the homestead exemption from $25,000 to $50,000. Coupled with the declining value of real estate (recently estimated at around 19 percent [Benton 2009a, 49]), property tax revenues will continue to drop for some years. Early indications from data reported by the Florida Department of Financial Services11 and from a survey of cities and counties in the state (see Benton, Aikins, and Miller 2009) are that these governments are already experiencing conspicuous declines in property tax collections. More importantly, the most recent restric-tions in Florida will result in permanent—not temporary—decreases in property tax collections.
Globalization will also influence local government revenues in the future. On the negative side, the increased mobility of businesses and capital due to techno-logical advances has resulted in the shifting of jobs and companies overseas (Ross and Levine 2006). This has meant a loss of revenue from sales, corporate, and individual income taxes; business licenses; property taxes; and a host of charges for services (utilities; franchise fees; building, zoning, and other permits). On the positive side, some U.S. cities have experienced an economic rebound as the headquarter sites of international, national, and regional firms (Ross and Levine 2006). In addition, technological changes and globalization also have allowed corporations to establish back offices in cheaper and more efficient sites in small cities (“edge cities,” technoburbs, and exurbs), thus increasing the potential for local governments to reap higher yields from traditional revenue sources and to even tap new revenues.
11. Florida Department of Financial Services: https://apps.fldfs.com/LocalGov/Reports.
Given the relative importance of each of these factors and our understanding of revenue decision making, several patterns appear to be the most likely in the years ahead:

trends in local government revenues 111
Greater reliance on and innovations in charges for services, assessments, and fees, while capitalizing on the benefits of globalization;Renewed efforts to obtain more state aid (particularly equalization mon-ies) and shared revenue from states;Greater utilization of other types of taxes (sales, gasoline, and income) and decreasing reliance on the property tax; andContinued skepticism about and avoidance of dependency on federal funds.
However, if the economy continues to falter for an extended period of time and the antigovernment and antitax moods spread, real growth in local govern-ment revenues may not materialize. Under that scenario, local governments may be forced to increase efforts to
contract out to other governments and/or to private and nonprofit vendors;seek the transference of costly and inefficient services to other governments;explore more efficient ways to operate while increasing worker productivity;enter into the coproduction of services; andutilize more volunteer labor.
In summary, it is probably safe to say that the revenue patterns of counties, municipalities, townships, special districts, and school districts in 10, 20, 30, or more years will be depicted neither by the old axiom that “the more things change the more they stay the same” nor by the view that “all things are destined to change, and change radically.” As Aaron Wildavsky (1964) and Charles Lind-blom (1959) concluded, revenue patterns (like those for expenditures) change in-crementally. No matter what revenue sources are tapped in the future, they must be sufficient to meet the growing costs of the services expected and demanded by the consuming public.
referencesACIR. 1991. Changingpublicattitudesongovernmentsandtaxes,1991. Washington,
DC: U.S. Government Printing Office.Benton, J. Edwin. 1986. Federal grant-in-aid cut-backs and state and local government
spending policies. In Intergovernmentalrelationsandpublicpolicy, ed. J. Edwin Benton and David R. Morgan, 1–34. Westport, CT: Greenwood Press.
———. 1992. The effect of federal aid on state-local expenditures. Publius:TheJournalofFederalism 22(Winter):71–82.
———. 2002. Countiesasservicedeliveryagents:Changingexpectationsandroles. New York: Greenwood Press.
———. 2003a. County government structure and county revenue policy: What’s the connection? StateandLocalGovernmentReview 35(Spring):78–89.
———. 2003b. The impact of structural reform on county government service provi-sion. SocialScienceQuarterly 84(December):858–874.
•
•
•
•
•••••

112 J.EdwinBenton
———. 2007. George W. Bush’s federal aid legacy. Publius:TheJournalofFederalism 37(Summer):371–389.
———. 2009. Coping with foreclosures. In Navigatingthefiscalcrisis:Testedstrategiesforlocalleaders, ed. Gerald J. Miller and James S. Svara. White paper prepared for the International City/County Management Association by the Alliance for Innova-tion. 26 January.
Benton, J. Edwin, Stephen Aikins, and Michael J. Miller. 2009. Making ends meet: The painful budgetary dilemma facing cities and counties in Florida. Paper presented at the Conference for the American Society for Public Administration, Miami, Florida, 20–24 March.
Berman, David R. 2005. State-local relations: Partnerships, conflict, and autonomy. In 2005municipalyearbook. Washington, DC: International City/County Manage-ment Association.
Cnudde, Charles, and Donald J. McCrone. 1969. Party competition and welfare policies in the American states. AmericanPoliticalScienceReview 58(September):858–866.
Cole, Richard, and John Kincaid. 2000. Public opinion and American federalism: Per-spectives on taxes, spending and trust—An ACIR update. Publius:TheJournalofFederalism 30(Winter):189–201.
Dawson, Richard E., and James A. Robinson. 1966. Interparty competition, eco-nomic variables, and welfare politics in the American states. JournalofPolitics 25(May):265–289.
Dye, Thomas R. 1966. Politics,economicsandthepublic. Chicago: Rand McNally.Elazar, Daniel J. 1966. Americanfederalism:Aviewfromthestates. New York:
Thomas Y. Crowell.Eulau, Heinz, and Kenneth Prewitt. 1973. Thelabyrinthsofdemocracy.Indianapolis:
Bobbs-Merrill Co. Hofferbert, Richard I. 1966. The relationship between public policy and some struc-
tural and environmental variables in the American states. AmericanPoliticalScienceReview 60(March):78–82.
Lindblom, Charles E. 1959. The science of muddling through. PublicAdministrationReview 19(Spring):79–88.
Lineberry, Robert L., and Edmund P. Fowler. 1967. Reformism and public policy in American cities. AmericanPoliticalScienceReview 61(September):701–716.
Morgan, David R., Robert E. England, and John P. Pelissero. 2007. ManagingurbanAmerica. 6th ed. Washington, DC: Congressional Quarterly Press.
Ross, Bernard H., and Myron A. Levine. 2006. Urbanpolitics:PowerinmetropolitanAmerica. 7th ed. Belmont, CA: Thomson-Wadsworth.
Sharkansky, Ira, and Richard I. Hofferbert. 1969. Dimensions of state politics, econom-ics and policy. AmericanPoliticalScienceReview 63(September):867–879.
U.S. Census Bureau. 1962, 1967, 1972, 1977, 1982, 1987, 1992, 1997, 2002. Compendiumofgovernmentfinances. Washington, DC: U.S. Government Printing Office.
———. 1977, 2002. Financesofcountygovernments. Washington, DC: U.S. Govern-ment Printing Office.
———. 1977, 2002. Financesofmunicipalandtownshipgovernments. Washington, DC: U.S. Government Printing Office.
———. 2009. 2007 Governmentorganization. Washington, DC: U.S. Government Printing Office.
Wildavsky, Aaron. 1964. Thepoliticsofthebudgetaryprocess. Boston: Little, Brown.