
Ungani Oil Field, Canning Basin Evaluation of a Dolomite ......The Ungani field was discovered in...
8
1 Ungani Oil Field, Canning Basin – Evaluation of a Dolomite Reservoir Amy Millar* David Long Stuart Weston Buru Energy Buru Energy Weston Petroleum Consulting 16 Ord Street, West Perth 6005 16 Ord Street, West Perth 6005 Address [email protected] [email protected] [email protected] Lionel Esteban Anne Forbes Martin Kennedy CSIRO-Energy Chemostrat MSK Scientific Pty Ltd 26 Dick Perry Av, Kensington 6152 1131 Hay St, West Perth 6005 85 Aristride Avenue, Kallaroo 6025 [email protected] [email protected] [email protected] SUMMARY Core supported study of the heterogeneous Ungani dolomite reservoir architecture is driving development drilling and upgrades to field resource estimates. Vuggy connected and macro non-connected pore space was directly measured over a 70m continuous core using 3D structural analysis of CT-scans. Plug density measurements indicate non-connected or sub-140 micron resolution contribution of around 1% to 2.5% (pu) for the tight matrix, but all remaining porosity potentially contributes to oil production. The high resolution core porosity data is vertically repositioned and upscaled to calibrate neutron-density and sonic petrophysically derived porosities which are inadequate to resolve productive zones using conventional reservoir cut-offs. Conditioned resistivity image data correlated exceptionally with directly measured connected porosities. Reservoir properties were extrapolated to all wells across the Ungani field giving field net/gross estimates of up to 63% and porosities over 30% pu in some vuggy and brecciaed zones. The heterogeneity and prolific nature of the uppermost 17m of reservoir had not been previously recognised due to poor log data coverage and access at the casing points. Recent re-analysis of this section at Ungani-3 with Chemostrat ICP-OES-MS analysis of ditch cuttings was instrumental in proposing additional drilling to re-target this zone. Mineralogy analysis is used to calculate rock grain densities and help calibrate neutron-density derived porosity logs over the Ungani field. Up-scaled core porosity correlates well with density and sonic porosity logs. Resistivity logs adjusted for minerology can also be used to predict porosity and support the use of resistivity image logs to identify vuggy zones and estimate porosity at a higher resolution than conventional logging tools. A field static model was populated with three facies distributed over vertical zones according to the distribution encountered in the core porosity analysis and well logs, and iteratively matched to the dynamic pressure data and field production history which exhibits field scale multi-Darcy horizontal permeability and protection from vertical water cut. Further drilling and downhole artificial lift is planned to extend field production rates to 3000 bbls/day. Increased confidence in this regionally developed reservoir is supporting further exploration of undrilled prospects in this immature and under-explored trend Key words: Ungani, Dolomite, Core, CT-scan, Connected Porosity INTRODUCTION The Ungani field was discovered in the Canning Basin in 2011, 100km east of Broome. 37°API oil was recovered from Tournasian aged (Lower Laurel) dolomite reservoirs (Edwards and Streitberg 2013) developed on the crest of a Devonian compressional anticline and located within an under-explored 200km wide play fairway on the southwest flank of the Fitzroy Trough (Figure 1). The Ungani structure comprises a number of fault blocks with oil recovered from each of the four existing wells, and further development wells due to be drilled in late 2017 (Figure 2). Despite inter-well interference demonstrating multi Darcy permeability and well initial rates over 1500bopd, petrophysical estimates of total porosity were only 6% to 9%, while limited core and rock data indicated a tight matrix with porosity of only 1% to 2%. The image log data indicate a heterogeneous pore system and the existence of vug and macro porosity zones. Resource estimates were compromised by a poor understanding of the static data, specifically where to apply petrophysical cut-offs and the relative contribution of connected versus low permeability or non-connected pore space. Dynamic modelling and production wells interference data were consistent with much larger recoverable volumes. Figure 1: Early wells were shallow or were located on the Broome Platform and terraces. Discovery of oil in dolomites at Ungani 150km east of Broome in 2011 has opened a 200km long oil exploration fairway on the flanks of the Fitzroy Trough with only a handful of wells, all of which have recovered light oil.
Transcript of Ungani Oil Field, Canning Basin Evaluation of a Dolomite ......The Ungani field was discovered in...
1
Ungani Oil Field, Canning Basin – Evaluation of a Dolomite Reservoir Amy Millar* David Long Stuart Weston Buru Energy Buru Energy Weston Petroleum Consulting 16 Ord Street, West Perth 6005 16 Ord Street, West Perth 6005 Address [email protected] [email protected] [email protected]
Lionel Esteban Anne Forbes Martin Kennedy CSIRO-Energy Chemostrat MSK Scientific Pty Ltd 26 Dick Perry Av, Kensington 6152 1131 Hay St, West Perth 6005 85 Aristride Avenue, Kallaroo 6025 [email protected] [email protected] [email protected]
SUMMARY
Core supported study of the heterogeneous Ungani dolomite reservoir architecture is driving development drilling and upgrades to field
resource estimates. Vuggy connected and macro non-connected pore space was directly measured over a 70m continuous core using
3D structural analysis of CT-scans. Plug density measurements indicate non-connected or sub-140 micron resolution contribution of
around 1% to 2.5% (pu) for the tight matrix, but all remaining porosity potentially contributes to oil production. The high resolution
core porosity data is vertically repositioned and upscaled to calibrate neutron-density and sonic petrophysically derived porosities
which are inadequate to resolve productive zones using conventional reservoir cut-offs. Conditioned resistivity image data correlated
exceptionally with directly measured connected porosities. Reservoir properties were extrapolated to all wells across the Ungani field
giving field net/gross estimates of up to 63% and porosities over 30% pu in some vuggy and brecciaed zones. The heterogeneity and
prolific nature of the uppermost 17m of reservoir had not been previously recognised due to poor log data coverage and access at the
casing points. Recent re-analysis of this section at Ungani-3 with Chemostrat ICP-OES-MS analysis of ditch cuttings was instrumental
in proposing additional drilling to re-target this zone. Mineralogy analysis is used to calculate rock grain densities and help calibrate
neutron-density derived porosity logs over the Ungani field. Up-scaled core porosity correlates well with density and sonic porosity
logs. Resistivity logs adjusted for minerology can also be used to predict porosity and support the use of resistivity image logs to
identify vuggy zones and estimate porosity at a higher resolution than conventional logging tools. A field static model was populated
with three facies distributed over vertical zones according to the distribution encountered in the core porosity analysis and well logs,
and iteratively matched to the dynamic pressure data and field production history which exhibits field scale multi-Darcy horizontal
permeability and protection from vertical water cut. Further drilling and downhole artificial lift is planned to extend field production
rates to 3000 bbls/day. Increased confidence in this regionally developed reservoir is supporting further exploration of undrilled
prospects in this immature and under-explored trend
Key words: Ungani, Dolomite, Core, CT-scan, Connected Porosity
INTRODUCTION
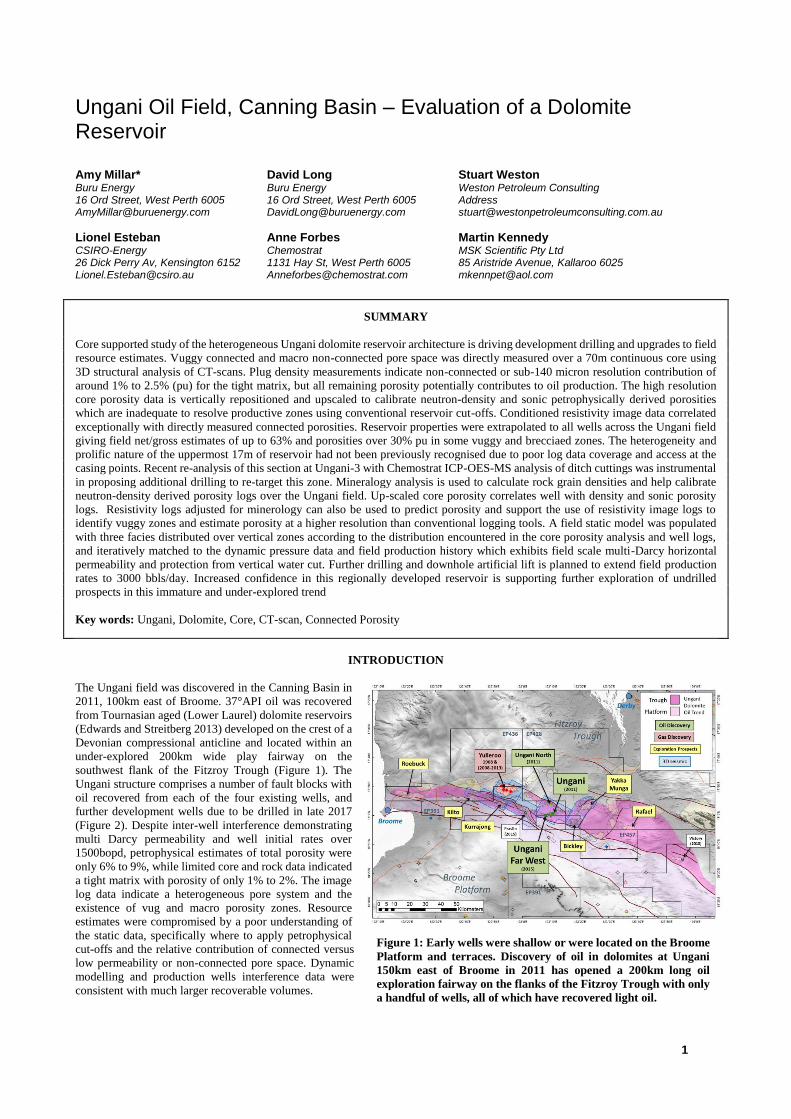
The Ungani field was discovered in the Canning Basin in
2011, 100km east of Broome. 37°API oil was recovered
from Tournasian aged (Lower Laurel) dolomite reservoirs
(Edwards and Streitberg 2013) developed on the crest of a
Devonian compressional anticline and located within an
under-explored 200km wide play fairway on the
southwest flank of the Fitzroy Trough (Figure 1). The
Ungani structure comprises a number of fault blocks with
oil recovered from each of the four existing wells, and
further development wells due to be drilled in late 2017
(Figure 2). Despite inter-well interference demonstrating
multi Darcy permeability and well initial rates over
1500bopd, petrophysical estimates of total porosity were
only 6% to 9%, while limited core and rock data indicated
a tight matrix with porosity of only 1% to 2%. The image
log data indicate a heterogeneous pore system and the
existence of vug and macro porosity zones. Resource
estimates were compromised by a poor understanding of
the static data, specifically where to apply petrophysical
cut-offs and the relative contribution of connected versus
low permeability or non-connected pore space. Dynamic
modelling and production wells interference data were
consistent with much larger recoverable volumes.
Figure 1: Early wells were shallow or were located on the Broome
Platform and terraces. Discovery of oil in dolomites at Ungani
150km east of Broome in 2011 has opened a 200km long oil
exploration fairway on the flanks of the Fitzroy Trough with only
a handful of wells, all of which have recovered light oil.
2
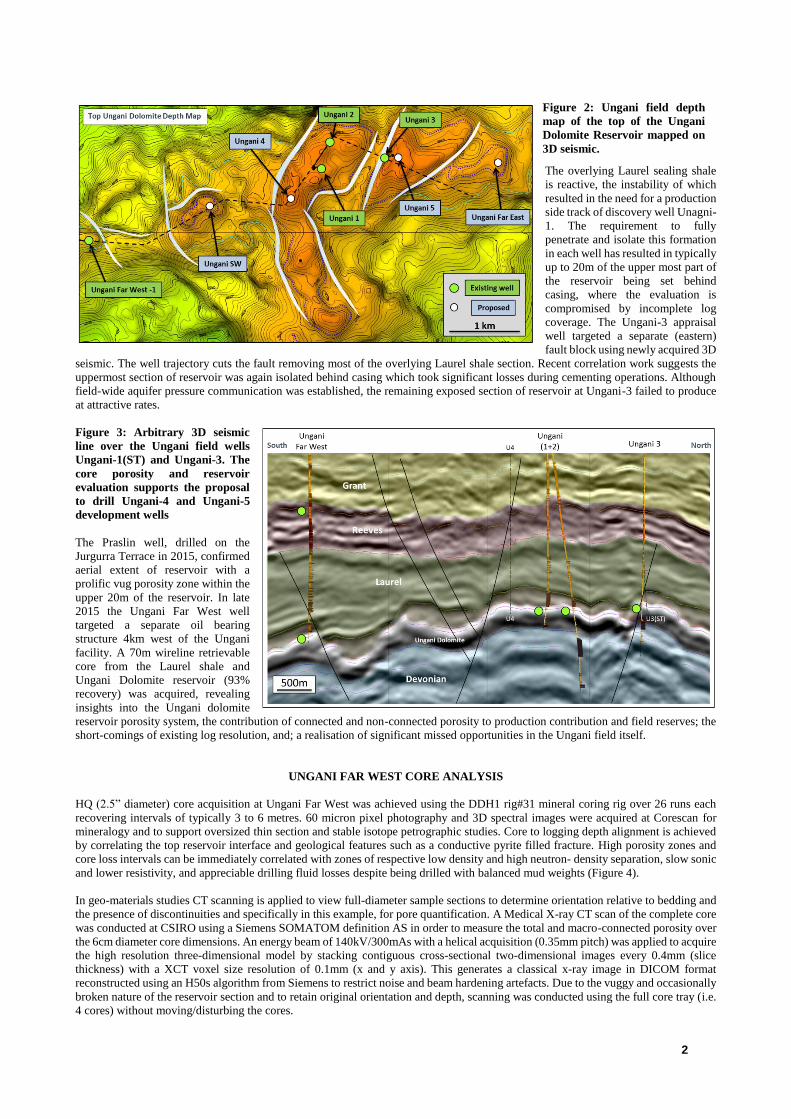
The overlying Laurel sealing shale
is reactive, the instability of which
resulted in the need for a production
side track of discovery well Unagni-
1. The requirement to fully
penetrate and isolate this formation
in each well has resulted in typically
up to 20m of the upper most part of
the reservoir being set behind
casing, where the evaluation is
compromised by incomplete log
coverage. The Ungani-3 appraisal
well targeted a separate (eastern)
fault block using newly acquired 3D
seismic. The well trajectory cuts the fault removing most of the overlying Laurel shale section. Recent correlation work suggests the
uppermost section of reservoir was again isolated behind casing which took significant losses during cementing operations. Although
field-wide aquifer pressure communication was established, the remaining exposed section of reservoir at Ungani-3 failed to produce
at attractive rates.
Figure 3: Arbitrary 3D seismic
line over the Ungani field wells
Ungani-1(ST) and Ungani-3. The
core porosity and reservoir
evaluation supports the proposal
to drill Ungani-4 and Ungani-5
development wells
The Praslin well, drilled on the
Jurgurra Terrace in 2015, confirmed
aerial extent of reservoir with a
prolific vug porosity zone within the
upper 20m of the reservoir. In late
2015 the Ungani Far West well
targeted a separate oil bearing
structure 4km west of the Ungani
facility. A 70m wireline retrievable
core from the Laurel shale and
Ungani Dolomite reservoir (93%
recovery) was acquired, revealing
insights into the Ungani dolomite
reservoir porosity system, the contribution of connected and non-connected porosity to production contribution and field reserves; the
short-comings of existing log resolution, and; a realisation of significant missed opportunities in the Ungani field itself.
UNGANI FAR WEST CORE ANALYSIS
HQ (2.5” diameter) core acquisition at Ungani Far West was achieved using the DDH1 rig#31 mineral coring rig over 26 runs each
recovering intervals of typically 3 to 6 metres. 60 micron pixel photography and 3D spectral images were acquired at Corescan for
mineralogy and to support oversized thin section and stable isotope petrographic studies. Core to logging depth alignment is achieved
by correlating the top reservoir interface and geological features such as a conductive pyrite filled fracture. High porosity zones and
core loss intervals can be immediately correlated with zones of respective low density and high neutron- density separation, slow sonic
and lower resistivity, and appreciable drilling fluid losses despite being drilled with balanced mud weights (Figure 4).
In geo-materials studies CT scanning is applied to view full-diameter sample sections to determine orientation relative to bedding and
the presence of discontinuities and specifically in this example, for pore quantification. A Medical X-ray CT scan of the complete core
was conducted at CSIRO using a Siemens SOMATOM definition AS in order to measure the total and macro-connected porosity over
the 6cm diameter core dimensions. An energy beam of 140kV/300mAs with a helical acquisition (0.35mm pitch) was applied to acquire
the high resolution three-dimensional model by stacking contiguous cross-sectional two-dimensional images every 0.4mm (slice
thickness) with a XCT voxel size resolution of 0.1mm (x and y axis). This generates a classical x-ray image in DICOM format
reconstructed using an H50s algorithm from Siemens to restrict noise and beam hardening artefacts. Due to the vuggy and occasionally
broken nature of the reservoir section and to retain original orientation and depth, scanning was conducted using the full core tray (i.e.
4 cores) without moving/disturbing the cores.
Figure 2: Ungani field depth
map of the top of the Ungani
Dolomite Reservoir mapped on
3D seismic.
3
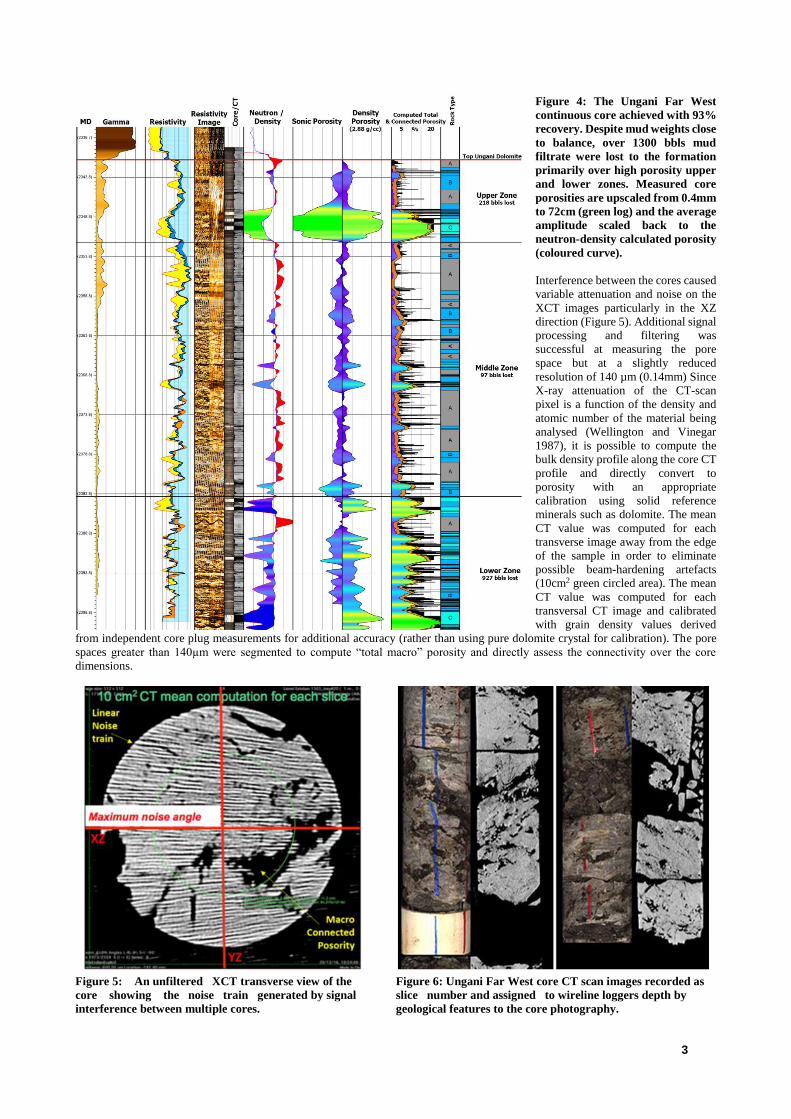
Figure 4: The Ungani Far West
continuous core achieved with 93%
recovery. Despite mud weights close
to balance, over 1300 bbls mud
filtrate were lost to the formation
primarily over high porosity upper
and lower zones. Measured core
porosities are upscaled from 0.4mm
to 72cm (green log) and the average
amplitude scaled back to the
neutron-density calculated porosity
(coloured curve).
Interference between the cores caused
variable attenuation and noise on the
XCT images particularly in the XZ
direction (Figure 5). Additional signal
processing and filtering was
successful at measuring the pore
space but at a slightly reduced
resolution of 140 µm (0.14mm) Since
X-ray attenuation of the CT-scan
pixel is a function of the density and
atomic number of the material being
analysed (Wellington and Vinegar
1987), it is possible to compute the
bulk density profile along the core CT
profile and directly convert to
porosity with an appropriate
calibration using solid reference
minerals such as dolomite. The mean
CT value was computed for each
transverse image away from the edge
of the sample in order to eliminate
possible beam-hardening artefacts
(10cm2 green circled area). The mean
CT value was computed for each
transversal CT image and calibrated
with grain density values derived
from independent core plug measurements for additional accuracy (rather than using pure dolomite crystal for calibration). The pore
spaces greater than 140µm were segmented to compute “total macro” porosity and directly assess the connectivity over the core
dimensions.
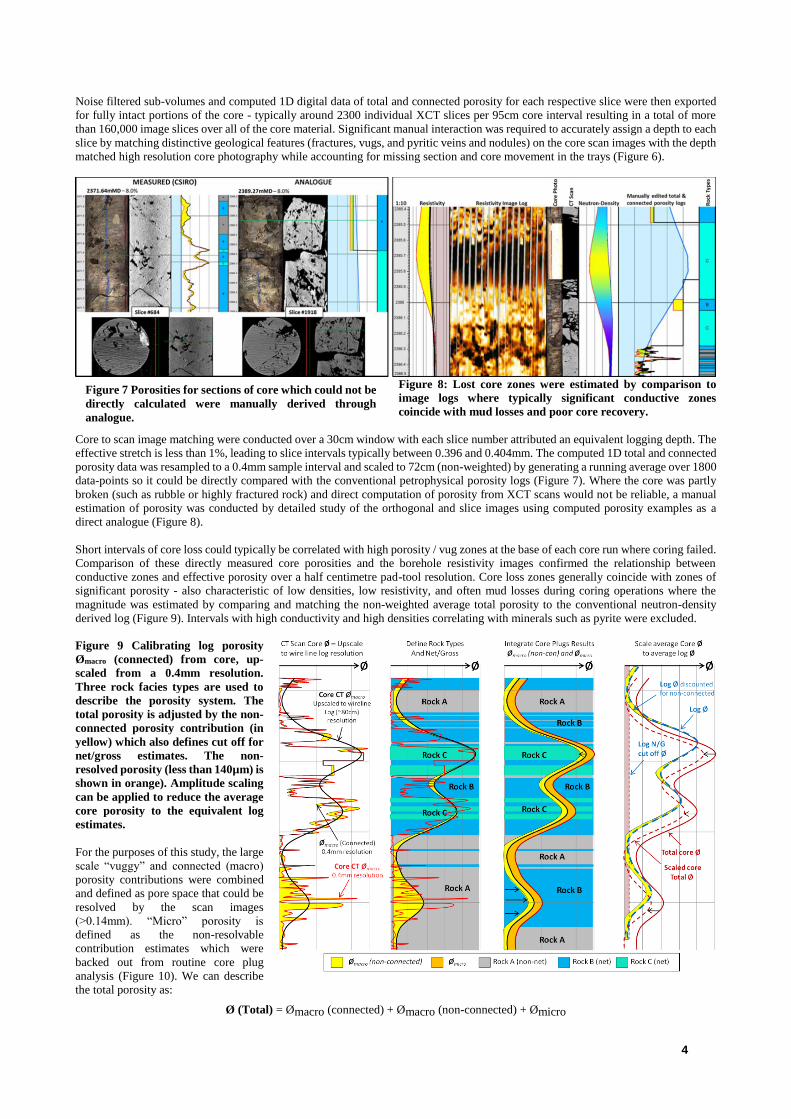
Figure 5: An unfiltered XCT transverse view of the Figure 6: Ungani Far West core CT scan images recorded as
core showing the noise train generated by signal slice number and assigned to wireline loggers depth by
interference between multiple cores. geological features to the core photography.
4
Noise filtered sub-volumes and computed 1D digital data of total and connected porosity for each respective slice were then exported
for fully intact portions of the core - typically around 2300 individual XCT slices per 95cm core interval resulting in a total of more
than 160,000 image slices over all of the core material. Significant manual interaction was required to accurately assign a depth to each
slice by matching distinctive geological features (fractures, vugs, and pyritic veins and nodules) on the core scan images with the depth
matched high resolution core photography while accounting for missing section and core movement in the trays (Figure 6).
Figure 8: Lost core zones were estimated by comparison to
image logs where typically significant conductive zones
coincide with mud losses and poor core recovery.
Core to scan image matching were conducted over a 30cm window with each slice number attributed an equivalent logging depth. The
effective stretch is less than 1%, leading to slice intervals typically between 0.396 and 0.404mm. The computed 1D total and connected
porosity data was resampled to a 0.4mm sample interval and scaled to 72cm (non-weighted) by generating a running average over 1800
data-points so it could be directly compared with the conventional petrophysical porosity logs (Figure 7). Where the core was partly
broken (such as rubble or highly fractured rock) and direct computation of porosity from XCT scans would not be reliable, a manual
estimation of porosity was conducted by detailed study of the orthogonal and slice images using computed porosity examples as a
direct analogue (Figure 8).
Short intervals of core loss could typically be correlated with high porosity / vug zones at the base of each core run where coring failed.
Comparison of these directly measured core porosities and the borehole resistivity images confirmed the relationship between
conductive zones and effective porosity over a half centimetre pad-tool resolution. Core loss zones generally coincide with zones of
significant porosity - also characteristic of low densities, low resistivity, and often mud losses during coring operations where the
magnitude was estimated by comparing and matching the non-weighted average total porosity to the conventional neutron-density
derived log (Figure 9). Intervals with high conductivity and high densities correlating with minerals such as pyrite were excluded.
Figure 9 Calibrating log porosity
Ømacro (connected) from core, up-
scaled from a 0.4mm resolution.
Three rock facies types are used to
describe the porosity system. The
total porosity is adjusted by the non-
connected porosity contribution (in
yellow) which also defines cut off for
net/gross estimates. The non-
resolved porosity (less than 140µm) is
shown in orange). Amplitude scaling
can be applied to reduce the average
core porosity to the equivalent log
estimates.
For the purposes of this study, the large
scale “vuggy” and connected (macro)
porosity contributions were combined
and defined as pore space that could be
resolved by the scan images
(>0.14mm). “Micro” porosity is
defined as the non-resolvable
contribution estimates which were
backed out from routine core plug
analysis (Figure 10). We can describe
the total porosity as:
Ø (Total) = Ømacro (connected) + Ømacro (non-connected) + Ømicro
Figure 7 Porosities for sections of core which could not be
directly calculated were manually derived through
analogue.

5
Although it is quite possible that the micro porosity (Ømicro) may also be
connected (as routine plug analysis suggest), this is difficult to quantify and
is assumed to be zero. To best represent the heterogeneity, the reservoir is
classified into three rock facies types: A) Poor, B) Moderate, and C)
Excellent and for which net/gross, and an effective porosity and
permeability distribution could be derived. Type A Rock is defined as
having little or no connected porosity (0 to 1%), with any greater porosity
calculated to be isolated. With plug measured permeability below 1mD, and
with negligible shale content across the reservoir section, rock type A
represents the non-net section. Type B rock has some connected macro
porosity (3% to 10% p.u.) and permeability from 1-420mD, with no
significant vugs. Rock C has significant connected porosity comprising a
network of vugs or open fractures with estimated porosities locally in
excess of 20% and permeability in the range 250-7000mD. This type
dominates well flow rates. Regular core plug measurements of grain density
enabled calibration of the XCT scan analysis and the wireline neutron-
density log calculations of porosity. Background tight rock densities of 2.90
g/cc were observed due to the presence of dispersed heavy minerals but
were as low as 2.80 g/cc in vuggy zones (type C rock) possibly influenced
by the presence of oil or local changes in mineral composition and rock
diagenesis. Nitrogen gas bulk porosity-permeability
measurements under confining pressures from 500 to
4000 psi were greater than suggested by both the CT
scan and density log evaluation, and also highlighted
sections where the core analysis had incorrectly defined
porosity (with up to 10% p.u.) as non-connected (Figure
11).
Figure 11: Pore space distribution.in the Ungani
Dolomite has both vug, macro and sub-resolvable
(micro) contributions. The section was redesignated
as “C-type” rock and assigned a core average non-
connected porosity contribution of 2.4% (coloured in
orange). The core plug CT scan image is shown as a
comparison to the core CT transverse slice.
The core plug total non-connected porosity from the
difference in the plug grain and bulk densities is calculated
to average 2.4% p.u. which compares with only 0.6% p.u.
estimated from the CT scan. The remaining 1.8% p.u. can
be attributed to the unresolved (non-connected) micro
porosity (Ømicro) as shown in Table 1.
Table 1: Core derived rock type ratio, N/G of 61% and
total porosity of 11.1% which is discounted 1.8% to
give non-connected pore space.
Well chemostratigraphy correlation (Ratcliffe et al 2010)
was performed using ditch cuttings and core chips samples using high precision elemental data collected for 50 elements by Inductively
Coupled Plasma – Optical Emission Spectroscopy – Mass Spectrometry (ICP-OES-MS, Jarvis and Jarvis 1992a & b). Elemental data
was also used for a chemostratigraphic correlation giving information on bulk lithology and a fingerprint of clastic provenance (e.g.
Ti/Nb) as well as changes in diagenesis (e.g. Ca/Sr and S) to distinguish between the Ungani dolomite reservoir and the overlying
Upper Laurel carbonates (Figure 12). The reservoir is correlated from the Ungani Far West core to the Ungani-1 and Ungani-2 wells
using a 3 layer reservoir model comprising a 17m thick upper zone of mostly vuggy excellent porosity, a 35m thick middle zone of
generally poor or modest porosity, and a thick lower zone with modest to good porosities. The correlation to Ungani-3 had previously
been uncertain due to the apparent absence of both the Laurel sealing shale and the upper vuggy zone. Evaluation of reprocessed
Ungani 3D seismic suggests the Ungani-3 well trajectory crosses the footwall bounding fault in the Laurel (Figure 3). The lowermost
20m 12-¼” hole section cemented behind the 9-5/8” casing (where 110bbls cement losses were reported) has a chemostratigraphic
fingerprint of the Ungani Dolomite, and the interval just 5m shallower can be correlated to an equivalent interval 90m shallower in the
Upper Laurel Carbonates at Ungani-2. A re-examination of the pulsed neutron through casing logs indicate we have found the missing
vuggy reservoir section with estimates of over 10% porosity. Mineralogy analysis confirm average grain densities of 2.85g/cc in
Ungani-1, 2 and 3 and 2.88g/cc in Ungani Far West and correlate with the MgO concentration which suggests dolomite vs siliciclastic
mineralogy is a controlling factor. The ICP calculated densities are consistent with those measured on ditch cuttings in Ungani-2, and
were used to recalibrate the Ungani wells neutron-density estimated porosities.
Figure 10: Scan porosity was attributed to non-
connected (coloured yellow), were re-attributed as
plug measurements measured over 10%
connected porosity with 1D permeability
Rock
TypeNet Rock Total Ø Total Connected
non-
connected
C 20% 21.2% 18.9% 10.0% 2.3% 21.2%
B 41% 6.0% 4.5% 3.6% 0.9% 1.5%
A 39% 2.5% 60.0% 10.0% 50.0% 1.9%
B+C 61% 11.1% 9.3% 8.7% 0.6% 1.8%
TOTAL 100% 7.7% 5.9% 5.3% 0.6% 1.8%
Micro Ø =
2.4% minus
Macro Ø(non
connected)
Total Average Average Macro Ø
6
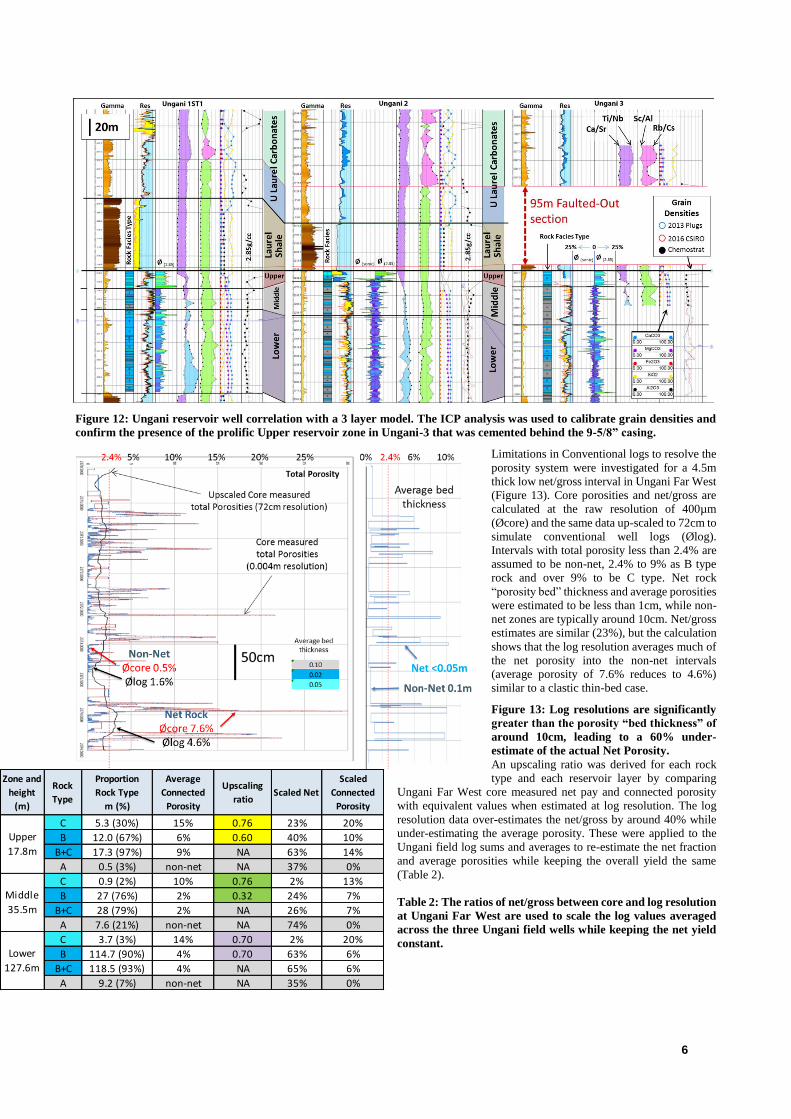
Figure 12: Ungani reservoir well correlation with a 3 layer model. The ICP analysis was used to calibrate grain densities and
confirm the presence of the prolific Upper reservoir zone in Ungani-3 that was cemented behind the 9-5/8” casing.
Limitations in Conventional logs to resolve the
porosity system were investigated for a 4.5m
thick low net/gross interval in Ungani Far West
(Figure 13). Core porosities and net/gross are
calculated at the raw resolution of 400µm
(Øcore) and the same data up-scaled to 72cm to
simulate conventional well logs (Ølog).
Intervals with total porosity less than 2.4% are
assumed to be non-net, 2.4% to 9% as B type
rock and over 9% to be C type. Net rock
“porosity bed” thickness and average porosities
were estimated to be less than 1cm, while non-
net zones are typically around 10cm. Net/gross
estimates are similar (23%), but the calculation
shows that the log resolution averages much of
the net porosity into the non-net intervals
(average porosity of 7.6% reduces to 4.6%)
similar to a clastic thin-bed case.
Figure 13: Log resolutions are significantly
greater than the porosity “bed thickness” of
around 10cm, leading to a 60% under-
estimate of the actual Net Porosity.
An upscaling ratio was derived for each rock
type and each reservoir layer by comparing
Ungani Far West core measured net pay and connected porosity
with equivalent values when estimated at log resolution. The log
resolution data over-estimates the net/gross by around 40% while
under-estimating the average porosity. These were applied to the
Ungani field log sums and averages to re-estimate the net fraction
and average porosities while keeping the overall yield the same
(Table 2).
Table 2: The ratios of net/gross between core and log resolution
at Ungani Far West are used to scale the log values averaged
across the three Ungani field wells while keeping the net yield
constant.
Zone and
height
(m)
Rock
Type
Proportion
Rock Type
m (%)
Average
Connected
Porosity
Upscaling
ratioScaled Net
Scaled
Connected
Porosity
C 5.3 (30%) 15% 0.76 23% 20%
B 12.0 (67%) 6% 0.60 40% 10%
B+C 17.3 (97%) 9% NA 63% 14%
A 0.5 (3%) non-net NA 37% 0%
C 0.9 (2%) 10% 0.76 2% 13%
B 27 (76%) 2% 0.32 24% 7%
B+C 28 (79%) 2% NA 26% 7%
A 7.6 (21%) non-net NA 74% 0%
C 3.7 (3%) 14% 0.70 2% 20%
B 114.7 (90%) 4% 0.70 63% 6%
B+C 118.5 (93%) 4% NA 65% 6%
A 9.2 (7%) non-net NA 35% 0%
Upper
17.8m
Middle
35.5m
Lower
127.6m
7
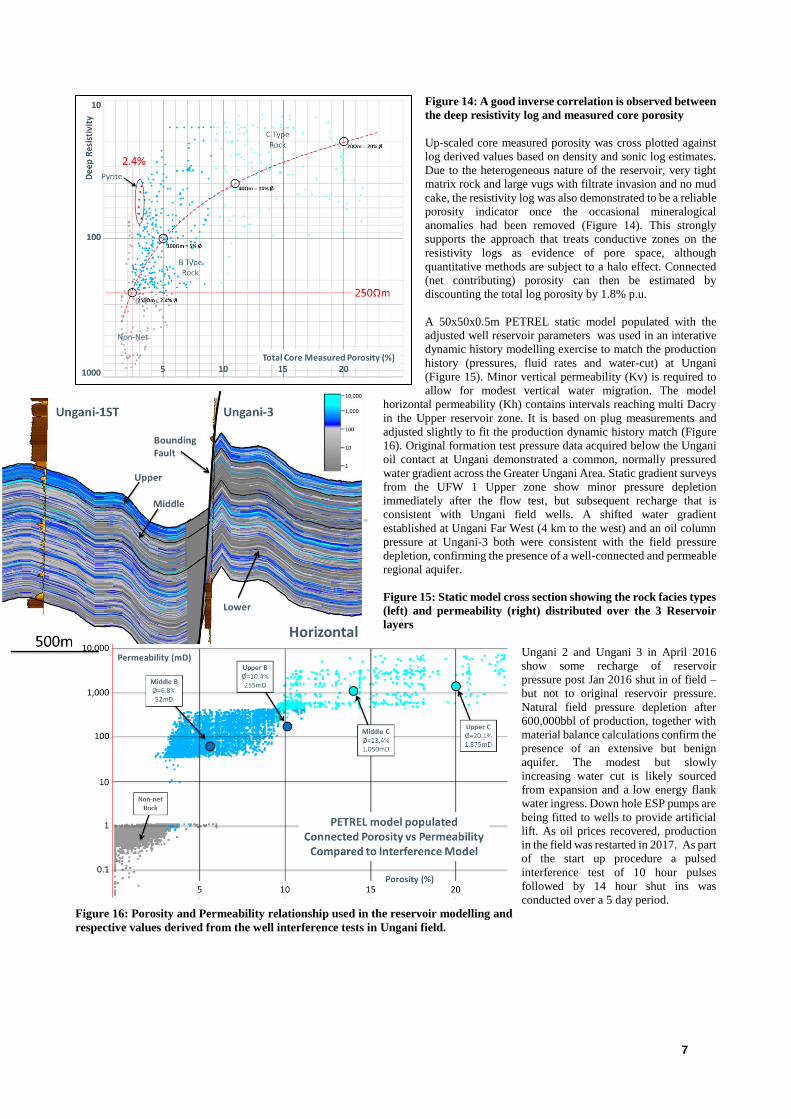
Figure 14: A good inverse correlation is observed between
the deep resistivity log and measured core porosity
Up-scaled core measured porosity was cross plotted against
log derived values based on density and sonic log estimates.
Due to the heterogeneous nature of the reservoir, very tight
matrix rock and large vugs with filtrate invasion and no mud
cake, the resistivity log was also demonstrated to be a reliable
porosity indicator once the occasional mineralogical
anomalies had been removed (Figure 14). This strongly
supports the approach that treats conductive zones on the
resistivity logs as evidence of pore space, although
quantitative methods are subject to a halo effect. Connected
(net contributing) porosity can then be estimated by
discounting the total log porosity by 1.8% p.u.
A 50x50x0.5m PETREL static model populated with the
adjusted well reservoir parameters was used in an interative
dynamic history modelling exercise to match the production
history (pressures, fluid rates and water-cut) at Ungani
(Figure 15). Minor vertical permeability (Kv) is required to
allow for modest vertical water migration. The model
horizontal permeability (Kh) contains intervals reaching multi Dacry
in the Upper reservoir zone. It is based on plug measurements and
adjusted slightly to fit the production dynamic history match (Figure
16). Original formation test pressure data acquired below the Ungani
oil contact at Ungani demonstrated a common, normally pressured
water gradient across the Greater Ungani Area. Static gradient surveys
from the UFW 1 Upper zone show minor pressure depletion
immediately after the flow test, but subsequent recharge that is
consistent with Ungani field wells. A shifted water gradient
established at Ungani Far West (4 km to the west) and an oil column
pressure at Ungani-3 both were consistent with the field pressure
depletion, confirming the presence of a well-connected and permeable
regional aquifer.
Figure 15: Static model cross section showing the rock facies types
(left) and permeability (right) distributed over the 3 Reservoir
layers
Ungani 2 and Ungani 3 in April 2016
show some recharge of reservoir
pressure post Jan 2016 shut in of field –
but not to original reservoir pressure.
Natural field pressure depletion after
600,000bbl of production, together with
material balance calculations confirm the
presence of an extensive but benign
aquifer. The modest but slowly
increasing water cut is likely sourced
from expansion and a low energy flank
water ingress. Down hole ESP pumps are
being fitted to wells to provide artificial
lift. As oil prices recovered, production
in the field was restarted in 2017. As part
of the start up procedure a pulsed
interference test of 10 hour pulses
followed by 14 hour shut ins was
conducted over a 5 day period.
Figure 16: Porosity and Permeability relationship used in the reservoir modelling and
respective values derived from the well interference tests in Ungani field.
8
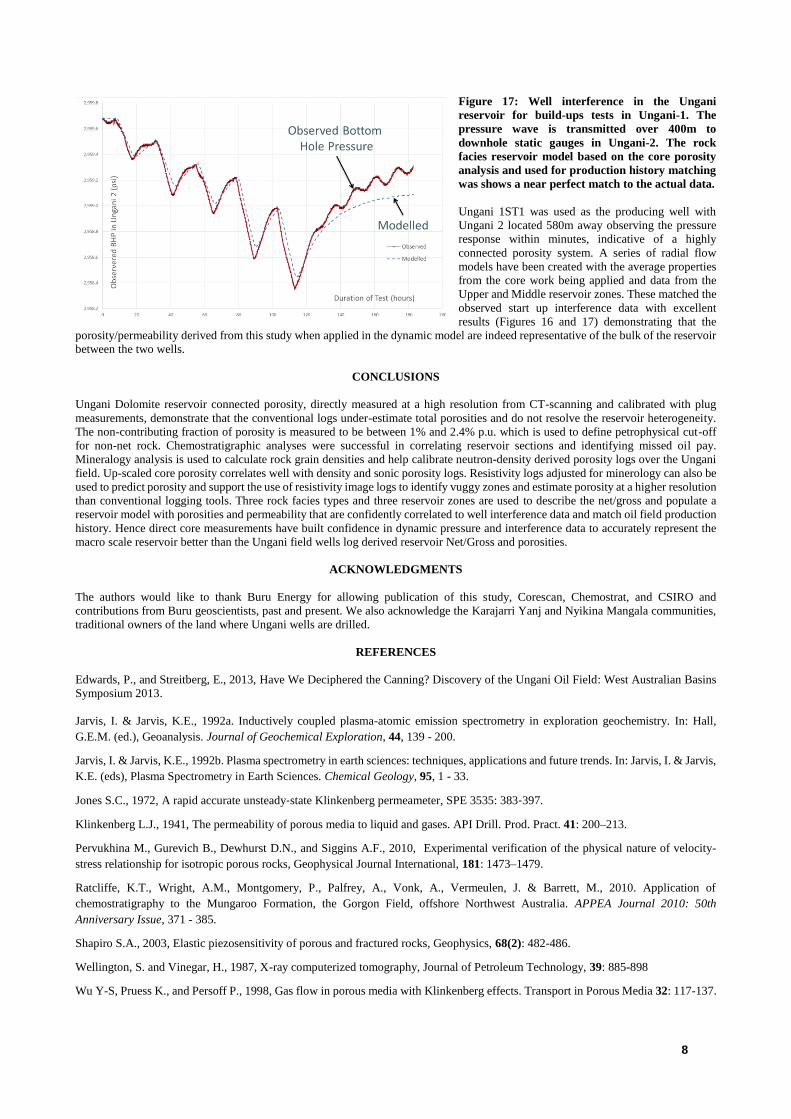
Figure 17: Well interference in the Ungani
reservoir for build-ups tests in Ungani-1. The
pressure wave is transmitted over 400m to
downhole static gauges in Ungani-2. The rock
facies reservoir model based on the core porosity
analysis and used for production history matching
was shows a near perfect match to the actual data.
Ungani 1ST1 was used as the producing well with
Ungani 2 located 580m away observing the pressure
response within minutes, indicative of a highly
connected porosity system. A series of radial flow
models have been created with the average properties
from the core work being applied and data from the
Upper and Middle reservoir zones. These matched the
observed start up interference data with excellent
results (Figures 16 and 17) demonstrating that the
porosity/permeability derived from this study when applied in the dynamic model are indeed representative of the bulk of the reservoir
between the two wells.
CONCLUSIONS
Ungani Dolomite reservoir connected porosity, directly measured at a high resolution from CT-scanning and calibrated with plug
measurements, demonstrate that the conventional logs under-estimate total porosities and do not resolve the reservoir heterogeneity.
The non-contributing fraction of porosity is measured to be between 1% and 2.4% p.u. which is used to define petrophysical cut-off
for non-net rock. Chemostratigraphic analyses were successful in correlating reservoir sections and identifying missed oil pay.
Mineralogy analysis is used to calculate rock grain densities and help calibrate neutron-density derived porosity logs over the Ungani
field. Up-scaled core porosity correlates well with density and sonic porosity logs. Resistivity logs adjusted for minerology can also be
used to predict porosity and support the use of resistivity image logs to identify vuggy zones and estimate porosity at a higher resolution
than conventional logging tools. Three rock facies types and three reservoir zones are used to describe the net/gross and populate a
reservoir model with porosities and permeability that are confidently correlated to well interference data and match oil field production
history. Hence direct core measurements have built confidence in dynamic pressure and interference data to accurately represent the
macro scale reservoir better than the Ungani field wells log derived reservoir Net/Gross and porosities.
ACKNOWLEDGMENTS
The authors would like to thank Buru Energy for allowing publication of this study, Corescan, Chemostrat, and CSIRO and
contributions from Buru geoscientists, past and present. We also acknowledge the Karajarri Yanj and Nyikina Mangala communities,
traditional owners of the land where Ungani wells are drilled.
REFERENCES
Edwards, P., and Streitberg, E., 2013, Have We Deciphered the Canning? Discovery of the Ungani Oil Field: West Australian Basins
Symposium 2013.
Jarvis, I. & Jarvis, K.E., 1992a. Inductively coupled plasma-atomic emission spectrometry in exploration geochemistry. In: Hall,
G.E.M. (ed.), Geoanalysis. Journal of Geochemical Exploration, 44, 139 - 200.
Jarvis, I. & Jarvis, K.E., 1992b. Plasma spectrometry in earth sciences: techniques, applications and future trends. In: Jarvis, I. & Jarvis,
K.E. (eds), Plasma Spectrometry in Earth Sciences. Chemical Geology, 95, 1 - 33.
Jones S.C., 1972, A rapid accurate unsteady‐state Klinkenberg permeameter, SPE 3535: 383‐397.
Klinkenberg L.J., 1941, The permeability of porous media to liquid and gases. API Drill. Prod. Pract. 41: 200–213.
Pervukhina M., Gurevich B., Dewhurst D.N., and Siggins A.F., 2010, Experimental verification of the physical nature of velocity-
stress relationship for isotropic porous rocks, Geophysical Journal International, 181: 1473–1479.
Ratcliffe, K.T., Wright, A.M., Montgomery, P., Palfrey, A., Vonk, A., Vermeulen, J. & Barrett, M., 2010. Application of
chemostratigraphy to the Mungaroo Formation, the Gorgon Field, offshore Northwest Australia. APPEA Journal 2010: 50th
Anniversary Issue, 371 - 385.
Shapiro S.A., 2003, Elastic piezosensitivity of porous and fractured rocks, Geophysics, 68(2): 482-486.
Wellington, S. and Vinegar, H., 1987, X-ray computerized tomography, Journal of Petroleum Technology, 39: 885-898
Wu Y-S, Pruess K., and Persoff P., 1998, Gas flow in porous media with Klinkenberg effects. Transport in Porous Media 32: 117-137.