Unfit for Service: The Implications of Rising Obesity for ...repec.iza.org/dp5822.pdf · zur...
44
DISCUSSION PAPER SERIES Forschungsinstitut zur Zukunft der Arbeit Institute for the Study of Labor Unfit for Service: The Implications of Rising Obesity for U.S. Military Recruitment IZA DP No. 5822 June 2011 John Cawley Johanna Catherine Maclean
Transcript of Unfit for Service: The Implications of Rising Obesity for ...repec.iza.org/dp5822.pdf · zur...

DI
SC
US
SI
ON
P
AP
ER
S
ER
IE
S
Forschungsinstitut zur Zukunft der ArbeitInstitute for the Study of Labor
Unfi t for Service: The Implications of Rising Obesity for U.S. Military Recruitment
IZA DP No. 5822
June 2011
John CawleyJohanna Catherine Maclean

Unfit for Service:
The Implications of Rising Obesity for U.S. Military Recruitment
John Cawley Cornell University
and IZA
Johanna Catherine Maclean Cornell University
Discussion Paper No. 5822 June 2011
IZA
P.O. Box 7240 53072 Bonn
Germany
Phone: +49-228-3894-0 Fax: +49-228-3894-180
E-mail: [email protected]
Any opinions expressed here are those of the author(s) and not those of IZA. Research published in this series may include views on policy, but the institute itself takes no institutional policy positions. The Institute for the Study of Labor (IZA) in Bonn is a local and virtual international research center and a place of communication between science, politics and business. IZA is an independent nonprofit organization supported by Deutsche Post Foundation. The center is associated with the University of Bonn and offers a stimulating research environment through its international network, workshops and conferences, data service, project support, research visits and doctoral program. IZA engages in (i) original and internationally competitive research in all fields of labor economics, (ii) development of policy concepts, and (iii) dissemination of research results and concepts to the interested public. IZA Discussion Papers often represent preliminary work and are circulated to encourage discussion. Citation of such a paper should account for its provisional character. A revised version may be available directly from the author.

IZA Discussion Paper No. 5822 June 2011
ABSTRACT
Unfit for Service: The Implications of Rising Obesity for U.S. Military Recruitment This paper contributes to the literature on the labor market consequences of unhealthy behaviors and poor health by examining a previously underappreciated consequence of the rise in obesity in the United States: challenges for military recruitment. Specifically, this paper estimates the percent of the U.S. military-age population that meets, and does not meet, current active duty enlistment standards for weight-for-height and percent body fat for the U.S. Army, using data from the series of National Health and Nutrition Examination Surveys that spans 1959-2008. We calculate that the percentage of military-age adults ineligible for enlistment because they are overweight and overfat doubled for men and tripled for women during that time. We document disparities across race, education, and age in meeting the standards, and finds that a further rise of just 1% in weight and body fat would further reduce eligibility for military service by over 600,000 men and 1 million women of military age. The paper concludes with a discussion of the implications for military recruitment and military policy. JEL Classification: I1, H56, J11, J18, J2, J45, N32 Keywords: obesity, military, labor Corresponding author: John Cawley Department of Policy Analysis and Management Cornell University 124 MVR Hall Ithaca NY 14853 USA E-mail: [email protected]

2
Introduction
A substantial literature in economics studies the labor market and public health policy
consequences of obesity. For example, several studies conclude that obesity lowers the
probability of employment (e.g. Rooth, 2009; Morris, 2007) and lowers wages among the
employed (e.g. Kline and Tobias, 2008; Cawley, 2004; Averett and Korenman, 1996). Other
studies calculate the impact of obesity on U.S. health care costs, recent estimates of which are in
the range of $147-$168 billion per year (Finkelstein et al., 2009; Cawley and Meyerhoefer,
2010). This paper focuses on a previously underappreciated labor market and public policy
consequence of the obesity epidemic in the United States: substantial reductions in eligibility for
military service.
Between 1959-62 and 2007-08, the age-adjusted prevalence of overweight (defined as a
body mass index1, or BMI, of 25 or higher) among adult males in the U.S. rose from 47.4% to
68.3%. Over that same period, the prevalence of obesity (defined as a BMI of 30 or higher)
among adult males in the U.S. tripled from 10.7% to 32.2% (Flegal et al., 1998; Flegal et al.,
2002; Flegal et al., 2010). The prevalence of obesity defined using percent body fat (instead of
BMI) has also increased dramatically in the past five decades (Burkhauser et al., 2009).
This paper examines the consequences of this rise in obesity for the largest employer in
the United States: the Department of Defense or DoD (NRC, 2006). In 2009 there were over 1.4
million men and women on active duty and 1.1 million men and women in the military reserves
(U.S. Census Bureau, 2011). Currently, the DoD must recruit approximately 184,000 new
military personnel every year to replace those who leave the service because of retirement or
other reasons (U.S. Bureau Labor Statistics, 2009). In the past decade, recruitment has become
more challenging for the U.S. military, which has been strained by two major overseas 1 Body mass index (BMI) is calculated as weight in kilograms divided by height in meters squared.

3
operations: Operation Iraqi Freedom (March 20, 2003 – September 1, 2010), which transitioned
into Operation New Dawn (September 1, 2010 – present), and Operation Enduring Freedom –
Afghanistan (October 7, 2001 – present). These operations, which increased the military’s
demand for recruits (in particular, by the Army and Marine Corps) have also decreased the
supply of applicants because they raise the risk of injury and death (Asch et al., 2010; Simon and
Warner, 2007). In order to meet its recruiting targets, the U.S. Army was forced to substantially
expand the availability and size of enlistment bonuses between 2004 and 2008 (Asch et al.,
2010).
Physical fitness in general, and body weight and body fat in particular, are highly relevant
to military occupations (Institute of Medicine (IOM), 1990, 2004; Naghii, 2006). Militaries
worldwide have long valued a physically fit appearance as an important signal of strength,
discipline, and professionalism, and consider it important for morale and pride and thus
effectiveness (IOM 2004; Yamane, 2007; McLaughlin and Wittert, 2009). Moreover, military
service often requires muscular and cardio-respiratory endurance, which can be hampered when
body fat is excessive (U.S. DoD, 2004). Several studies have found that heavier individuals,
especially women, are more likely to fail basic training than healthy weight individuals (Jones et
al., 1988; Knapik et al., 2001; Poston et al., 2002). Among Navy personnel, men and women
with high weight-for-height are more likely to fail their semi-annual Physical Readiness Test
(Bohnker et al., 2005). It is estimated that, among U.S. active duty military, overweight and
obesity are responsible for 658,000 missed work days (absenteeism) and the equivalent of 17,000
missed work days due to lower productivity while at work (presenteeism), for a total productivity
cost of $105.6 million per year (Dall et al., 2007). TRICARE, the military health insurance
program, spends $1.1 billion annually treating obesity-related illness (Dall et al., 2007). For

4
comparison, that is more than TRICARE spends annually treating illnesses related to tobacco
($564 million) and alcohol consumption ($425 million) combined (Dall et al., 2007). The IOM
has warned that obesity “threaten[s] the long-term welfare and readiness of U.S. military forces”
(IOM, 2004, p.1) and an association of retired generals and admirals has declared that rising
youth obesity threatens the future strength of the U.S. military and thus U.S. national security
(Mission: Readiness, 2010).
Because of the importance of healthy body weight and composition for military readiness
and effectiveness, the military imposes weight-for-height and percent body fat standards for
enlistment. The high and rising prevalence of obesity in the civilian population makes it more
difficult for the military to find acceptable numbers of quality recruits (Yamane, 2007;
McLaughlin and Wittert, 2009). Excessive weight and/or body fat is now the most common
reason for medical disqualification, leading to rejection of 23.3% of all applicants to the military
(NRC, 2006). For comparison, the second most common reason is smoking marijuana, which
leads to rejection of 12.6% of applicants (NRC, 2006). Roughly 15,000 applicants to the
military are rejected each year for exceeding the standards for weight and body fat (Mission:
Readiness, 2010).
The purpose of this paper is not simply to check whether rising obesity has reduced
eligibility for military service (that there should be some impact is predictable and thus not
particularly interesting). Instead, our objective is to estimate more accurately than ever before
the number and percentage of military-age civilians that satisfy active duty enlistment standards
for weight-for-height and percent body fat. Moreover, we document both current levels and
trends over the period of rising obesity: 1959-2008. We also examine the personal
characteristics (age, race, ethnicity, education, and marital status) associated with failing to meet

5
those enlistment standards. Finally, we simulate how future changes in weight and percent body
fat may further affect eligibility for military service. We focus on the results for the U.S. Army;
results for the Navy, Air Force, and Marine Corps are consistent and available upon request.
As of 2011, military service is less common than it was when the U.S. was engaged in
large-scale wars.2 Although in historical terms the U.S. military is currently small (as a percent
of the U.S. population), that is misleading as to the potential threat that obesity-related
disqualifications represent to future national security. The reason is that militaries must be able
to expand greatly and rapidly to meet emerging national security threats. This is evident in
Figure 1, which graphs the size of the active-duty U.S. military as a percentage of the resident
U.S. population.3 It shows that the U.S. has commonly had to rapidly and dramatically increase
the size of its military, most notably for the World War II (1941-45) and the Civil War4 (1861-
65) but large percentage increases in the size of the military occurred for every U.S. war,
including the War of 1812, the Mexican-American War, World War I, Korea, and Vietnam. For
example, the number of active-duty U.S. military personnel rose over 8,400% between 1859 and
1860, rose over 1,515% between 1916 and 1918, rose over 740% between 1940 and 1942 (by
1945 the U.S. military was over 2,500% larger than in 1940), and more than doubled between
1950 and 1951. The U.S. has routinely found it necessary to multiply the size of its armed forces
in times of crisis. As a result, one should not be misled by the size of the current military into
underestimating the possible future implications for national security of large numbers of
military-age civilians being ineligible for military service. Confirming evidence of this comes
2 For example, Figure 1 in Card and Lemieux (2001) illustrates the decline in the U.S. male veteran rate that began with birth cohorts in the early 1930s. 3 The data in Figure 1 are taken from Historical Statistics of the United States (Carter, 2006), series Ed26 (military personnel on active duty) and Aa7 (resident population of the US) for years 1795-1995, and from the Statistical Abstract of the United States (U.S. Census Bureau, various years) for years 1995-present. For the Civil War (1861-65), only Union forces are included. 4 For the Civil War, the graph includes only Union forces.

6
from an organization of retired senior military leaders, who have described youth obesity as “an
epidemic that threatens national security” and are calling for public health policies to reduce
youth obesity (Mission: Readiness, 2010, p. 2).
This paper relates to several previous studies. The first is the aforementioned report by
retired generals and admirals, titled “Too Fat to Fight,” which expressed concern that the
increase in youth obesity may compromise current and future military readiness and national
security (Mission: Readiness, 2010). That report listed the percentage of 18-24 year old
Americans who were overweight or obese in 2006-2008, but did not calculate what fraction met
military enlistment standards for both weight-for-height and percent body fat. Moreover, the
estimates of the prevalence of overweight and obese were based on self-reported weight and
height, which tend to be substantially underreported (e.g. Rowland, 1974; Cawley and
Burkhauser, 2006), potentially resulting in severe and systematic misclassification error (Nieto-
Garcia et al., 1990). Other studies have used a subset of the data examined in this paper to
calculate the percent of Americans meeting military weight-for-height standards in a narrow span
of years; e.g. Nolte et al. (2002) examines 1988-94 and Yamane (2007) examines 2001-04.
Those papers did not examine whether subjects also met the military standards for percent body
fat.
This paper offers six improvements over the previous literature. First, we examine levels
and trends over a much longer period: 1959-2008. Second, we examine not only whether
civilians satisfy the military enlistment standards for weight-for-height but also those for percent
body fat. Third, weight and height are measured by medical professionals rather than self-
reported. Fourth, we investigate which personal characteristics predict meeting the standards.
Fifth, we examine four sets of historic weight-for-height standards of the U.S. Army to

7
determine how eligibility would differ if historic standards remained in place. Sixth, we simulate
how future changes in weight and body fat would affect future eligibility for enlistment.
This paper relates to several economic literatures. First, it contributes to the literature on
the economics of obesity, as it documents a previously underappreciated labor market
consequence of rising obesity. Second, the paper relates to the larger literature on the labor
market consequences of risky health behaviors (e.g. Auld, 2005; vanOurs, 2004; Mullahy and
Sindelar, 1993, 1996), some of which is published in this journal (e.g. Norton and Han, 2008;
Renna, 2007; Johansson et al., 2007; McDonald and Shields 2004). Third, the paper relates to
the literature on defense economics. Defense economists have noted that there has been
relatively little research on the economics of military manpower and human resource issues in
the military (Sandler and Hartley, 1995).5 This paper makes an important and timely
contribution to defense economics, as “There is scant literature covering civilian obesity levels
and military recruitment” (Yamane, 2007, p. 1160).
Military Standards for Weight-For-Height and Percent Body Fat
General physical standards for enlistment in the American military can be traced back to
1775, when Congress called for “able bodied” men to be formed into militia (Johnson, 1997).
Weight-for-height standards for enlistment were first issued in 1887 for men and in the 1940s for
women; initially their primary function was to exclude those who were underweight (Johnson,
1997), but in recent decades far more applicants are excluded for being overweight (NRC,
5 Reviews of the research on the economics of military manpower are provided by Sandler and Hartley (1995), Warner and Asch (1995), and Asch et al. (2007).

8
2006).6 The exact standards for weight have evolved continuously since they were first
implemented (Johnson, 1997).
Today, the DoD mandates that each military service enforce standards for recruiting that
include weight-for-height limits and maximum percent body fat (U.S. DoD, 2004).7 Initially, the
Army assessed only weight-for-height, not percent body fat. Weight-for-height has the
advantage of being quick and easy to measure, but as a measure of fatness it is flawed because it
ignores body composition; depending on where it is drawn, the maximum weight-for-height may
exclude those who are muscular as well as those who are fat (see, e.g. Burkhauser and Cawley,
2008). This became more of a limitation over time, as American men became more muscular.
One way of measuring muscularity is to calculate the percentage of Americans who are obese by
the standard of BMI (BMI>=30) but not obese by the standard of percent body fat (PBF>25% for
men, PBF>30% for women). The trend in this proxy for muscularity is depicted in Figure 2,
using data from the National Health and Nutrition Examination Surveys (which are explained in
more detail in the Data section below). Figure 2 indicates that muscularity rose dramatically for
men; the percentage of men who are obese by BMI but not by PBF nearly tripled between 1960
and 2008 (rising from 4.0 to 11.2 percent). In contrast, muscularity among women remained
relatively constant between 1960 and 2008.
Although the DoD provides general guidance, each service can determine its own
minimum and maximum weight-for-height and percent body fat standards for enlistment (NRC,
2006; Yamane, 2007). The U.S. Army’s current weight-for-height and percent body fat
standards for active duty enlistment are listed in Tables 1 (men) and 2 (women). The weight-for-
6 Economic historians have extensively studied the historic data on weight and height of conscripts and recruits, for example using them to track long-term trends in standards of living and health; see e.g. Komlos (1987, 2008) and Costa (1993, 2004). 7 All military services also have a set of weight standards for those already in the service that are as strict as, or stricter than, those applied to new recruits (IOM, 2004).

9
height standards of the Army vary with age (permitting older recruits to be heavier). Likewise,
the maximum allowable percent body fat increases with age, from 26% to 30% for men and 32%
to 36% for women.
The standards in Table 1 and 2 apply to the Army. The Navy, Air Force, and Marines
have their own weight-for-height and body fat requirements. Despite the substantial differences
in standards across services, the National Research Council notes that “There is no rationale
given for this variability” (NRC, 2006, p. 117).
Applicants to the military receive medical examinations at military entrance processing
stations (MEPS). A two-stage process is used to screen weight and body composition (NRC,
2006). The first stage is to measure weight and height; if the applicant is in the range of
acceptable weight-for-height, then no further screening is required. If the applicant exceeds the
maximum weight-for-height, then percent body fat is assessed using height and the
circumferences of some combination of the abdomen, waist, hip, and neck (the measurement
sites vary by service). If the applicant’s percent body fat is in the acceptable range, then the
maximum weight-for-height requirement is waived and the applicant is classified as meeting the
requirements. Applicants who exceed both the weight-for-height and percent body fat thresholds
are disqualified from enlisting and are encouraged to lose weight and then return to the MEPS
for another assessment; under current regulations they must wait four days for every pound of
weight to be lost (NRC, 2006). Disqualified applicants have the option of applying for a waiver;
each service has its own policy on granting such waivers; see NRC (2006).
Data: the NHES and NHANES Series (1959-2008)
10
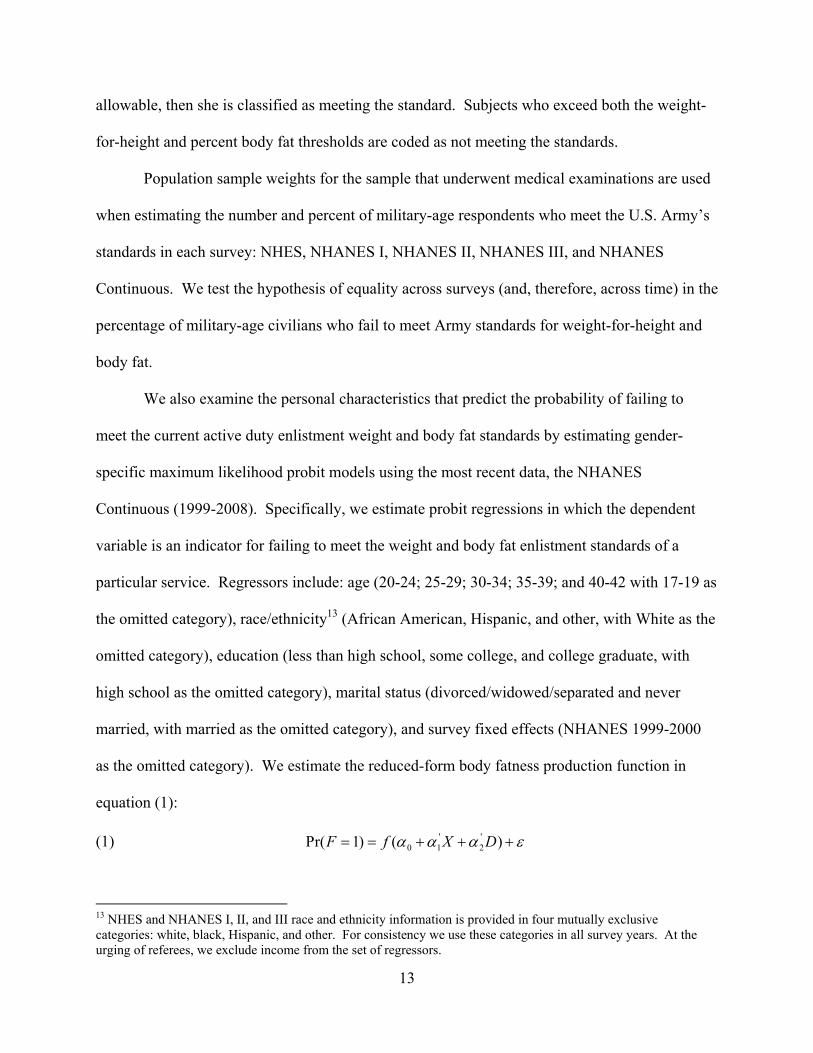
This study utilizes the full series of nationally representative, cross-sectional health
surveys sponsored by the National Center for Health Statistics of the Centers for Disease Control
and Prevention. The National Health Examination Survey, Cycle I (NHES) was conducted
during 1959-1962. The National Health and Nutrition Examination Surveys (NHANES)
program began with NHANES I, which was conducted 1971-1975, and was followed by
NHANES II (1976-1980), NHANES III (1988-1994), and NHANES Continuous (1999-2000,
2001-02, 2003-04, 2005-06, and 2007-08). For information on the sampling frame and methods
of data collection in these surveys, see National Center for Health Statistics (1965; 1977; 1994;
2000) and McDowell et al. (1981). In each of these surveys, a nationally representative sample
of the U.S. civilian non-institutionalized population was selected using a complex, stratified,
multistage probability cluster sampling design. These are the best available data for estimating
trends in the number and percent of U.S. military-age civilians who meet the current weight-for-
height and percent body fat requirements of the military, as the data are nationally representative,
frequently collected over the past five decades, include demographic information such as age and
gender, and, most importantly, contain measurements of weight, height, and other
anthropometrics that can be used to calculate percent body fat.
Each NHES and NHANES survey included physical examinations conducted in a
specially-designed and equipped mobile examination center where a scientific team including a
physician and medical and health technicians measured weight, height, and skinfold thickness at
the tricep and subscapular region (which is below the shoulder blade). Additional measures of
fatness were recorded in certain surveys, but the only fatness measures that were collected
consistently from NHES until NHANES 2007-08 are weight, height, and the two measures of
skinfold thickness.

11
The maximum weight that could be measured was not binding in NHES, and was 400
pounds (182 kg) in NHANES I and II. In NHANES III it was again not binding and in
NHANES Continuous it was 440 kg (968 pounds). The top-coding of weight does not affect our
classification of individuals, as everyone with the maximum weight -- regardless of height -- is
not weight eligible for enlistment in the military.8
Skinfold thickness at the tricep and subscapular region were assessed using calipers. The
NHES and NHANES medical technicians were trained in measuring skinfold thicknesses to
ensure accuracy and reliability (National Center for Health Statistics, 2000). The NHANES III
and NHANES Continuous noted when a skinfold exceeded the capacity of the calipers. We
recode the skinfold size of such individuals to the maximum caliper size, but this top-coding
does not affect estimates of eligibility for enlistment in the military because such individuals are
not eligible whether their skinfold is set equal to the maximum caliper size or an even larger
number.9 In addition to recording whether the skinfold exceeded the maximum caliper size, the
NHANES III and NHANES Continuous indicated if the examiner could not obtain a
measurement (presumably for reasons other than the skinfold exceeding the maximum caliper
size). When the skinfold could not be obtained, we impute it separately by sex using the other
skinfold thickness (either tricep or subscapular), measured height and weight, age, age squared,
race, and ethnicity; this prediction equation is based on respondents with complete information.10
8 The tallest height listed in any of the military standards is 86 inches and the maximum allowable weight for that height is 263 pounds, which is well below the top-coding of weight in the NHES or NHANES. 9 The percentage of our analysis sample with tricep skinfolds larger than the maximum caliper size is as follows: 1.78% in NHANES III and from 3.08% to 4.91% in each of the five surveys in NHANES Continuous. The percentage of our analysis sample with subscapular skinfolds larger than the maximum caliper size is as follows: 2.46% in NHANES III, 4.26% in NHANES 1999-2000, 1.41% in NHANES 2001-02, 1.7% in NHANES 2003-04, 1.85% in NHANES 2005-06, and 2.26% in NHANES 2007-08. 10 The percentage of our analysis sample for whom tricep skinfold thickness could not be obtained was 0.58% in NHANES III, 0.42% in NHANES 1999-2000, 1.18% in NHANES 2001-02, 1.15% in NHANES 2003-04, 1.18% in NHANES 2005-06, and 0.71% in NHANES 2007-08. The percentage of our analysis sample for which subscapular skinfold thickness could not be obtained was 3.12% in NHANES III, 9.57% in NHANES 1999-2000, 11.68% in

12
These regression models explain between 54.87% and 78.54% of the variance in skinfolds,
implying that the imputation procedure provides reasonable predictions for missing skinfolds.
Skinfold thicknesses at the tricep and subscapular region are used to calculate body
density using the equations in Durnin and Womersley (1974). Body density is then used to
calculate percent body fat (Siri, 1956; Durnin and Womersley, 1974).
All analyses exclude pregnant women and (for the surveys that provide such information)
women who were pregnant in the past year.11 We examine only those civilians who are age-
eligible to enlist in the Army: those aged 17-42 years. After excluding respondents that did not
provide valid responses to all survey items of interest the final combined sample size is 34,994.12
Methods
In order to estimate the number and percent of military-age Americans who meet the U.S
Army’s enlistment standards for weight-for-height and percent body fat, we use the military’s
two-stage process. First, we compare the subject’s measured weight and height to the active
duty enlistment standards of the Army. A subject who is shorter than the minimum height or
taller than the maximum height is coded as not meeting the standard. If the subject is in the
range of acceptable weight-for-height, then the subject is classified as meeting the standard. A
subject whose weight is below the minimum weight-for-height is coded as not meeting the
standard; percent body fat is not relevant if the subject is underweight. If the subject’s weight-
for-height exceeds the maximum, then the subject’s percent body fat is compared to the
maximum threshold for that service. If the subject’s percent body fat is less than the maximum NHANES 2001-02, 10.95% in NHANES 2003-04, 13.81% in NHANES 2005-06, and 11.94% in NHANES 2007-08. 11 We exclude from the sample women who are currently pregnant (for each survey) and, when known, women who were pregnant in the past two years (NHANES III) or one year (NHANES I and II). 12 Final analysis sizes in each survey are: 3,414 for NHES; 6,545 for NHANES I; 5,464 for NHANES II; 7,233 for NHANES III; 2,393 for NHANES 1999-2000; 2,628 for NHANES 2001-02; 2,446 for NHANES 2003-04; 2,484 for NHANES 2005-06; and 2,387 for NHANES 2007-08.
13
allowable, then she is classified as meeting the standard. Subjects who exceed both the weight-
for-height and percent body fat thresholds are coded as not meeting the standards.
Population sample weights for the sample that underwent medical examinations are used
when estimating the number and percent of military-age respondents who meet the U.S. Army’s
standards in each survey: NHES, NHANES I, NHANES II, NHANES III, and NHANES
Continuous. We test the hypothesis of equality across surveys (and, therefore, across time) in the
percentage of military-age civilians who fail to meet Army standards for weight-for-height and
body fat.
We also examine the personal characteristics that predict the probability of failing to
meet the current active duty enlistment weight and body fat standards by estimating gender-
specific maximum likelihood probit models using the most recent data, the NHANES
Continuous (1999-2008). Specifically, we estimate probit regressions in which the dependent
variable is an indicator for failing to meet the weight and body fat enlistment standards of a
particular service. Regressors include: age (20-24; 25-29; 30-34; 35-39; and 40-42 with 17-19 as
the omitted category), race/ethnicity13 (African American, Hispanic, and other, with White as the
omitted category), education (less than high school, some college, and college graduate, with
high school as the omitted category), marital status (divorced/widowed/separated and never
married, with married as the omitted category), and survey fixed effects (NHANES 1999-2000
as the omitted category). We estimate the reduced-form body fatness production function in
equation (1):
(1) ' '0 1 2Pr( 1) ( )F f X Dα α α ε= = + + +
13 NHES and NHANES I, II, and III race and ethnicity information is provided in four mutually exclusive categories: white, black, Hispanic, and other. For consistency we use these categories in all survey years. At the urging of referees, we exclude income from the set of regressors.

14
Where F is an indicator variable for an individual failing to meet current active duty Army
enlistment standards for weight and body fat, X is a vector of personal characteristics, D is a
vector of survey fixed effects, ε is a mean zero normally distributed error term, and the α’s are
the parameters to be estimated. . In all regressions, we use the sampling weights for those who
underwent medical examinations. As recommended by the NHES and NHANES, standard
errors are clustered around the primary sampling unit. For ease of interpretation, we calculate
the marginal effect for each individual and report the average of those marginal effects.14 We
also report the probit coefficients and their standard errors. We estimate two specifications of
the baseline model: 1) one that includes only exogenous variables (age, race, ethnicity); and 2)
one that includes the full set of regressors (age, race, ethnicity, education, marital status).
Statistical analyses are conducted using Stata for Windows software version 11 (StataCorp,
2009).
Results
The percent of age-eligible U.S. civilians who satisfy the U.S. Army’s active duty
enlistment requirements for weight and body fat, over time, are listed in Tables 3 (men) and 4
(women). Each row of these tables corresponds to a specific survey conducted in certain years:
NHES (conducted 1959-62), NHANES I (1971-75), NHANES II (1976-80), NHANES III
(1988-94), and the various NHANES Continuous surveys (1999-2000, 2001-02, 2003-04, 2005-
06, and 2007-08). Graphs of the percent satisfying enlistment standards for weight and fat, over
time, are provided in Figure 3.15
14 We also calculated marginal effects for a hypothetical person with the average values of the regressors and found very similar results. 15 In all Figures, data points are placed at the median year of the survey for NHES I and NHANES I, II, and III, and at the first of the two years of the survey for NHANES Continuous.

15
For both men and women, the percent of military-age civilians who meet the Army’s
weight and body fat requirements dropped significantly between the earliest (1959-62) and the
most recent (2007-08) surveys. For example, Table 3, column 5, shows that the percentage of
age-eligible (i.e. 17-42 years) male civilians who are exceed the Army’s weight and body fat
limits rose from 5.55% in 1959-62 to 11.70% in 2007-08. This rise of 6.15 percentage points, or
110.91%, is statistically significant at less than a 1% level. In the most recent data (2007-08),
more than three times as many males fail the Army’s enlistment standards for being both
overweight and overfat (11.70%) than fail them for being underweight (3.13%).
The percentage of the population that satisfies the Army enlistment standards for weight-
for-height and percent body fat has declined more for women than men. Table 4, column 5,
shows that the percentage of age-eligible (i.e. 17-42 years) female civilians who exceed the
Army’s weight-for-height and percent body fat requirements rose from from 11.46% in 1959-62
to 34.65% in 2007-08. This rise of 23.18 percentage points, or 202.21%, is statistically
significant at less than a 1% level. In the most recent data (2007-08), more than six times as
many females fail the Army’s enlistment standards for being both overweight and overfat
(34.65%) than fail them for being underweight (5.14%). Figure 3 illustrates the decline over
time in the percent of military-age civilian men and women who satisfy the Army’s enlistment
requirements for weight-for-height and percent body fat.
We also calculate the total number (as opposed to percent) of military-age men and
women who would be disqualified from enlisting in the Army for failing to satisfy current
weight and fat enlistment standards; results are listed in Table 5 for men and Table 6 for women.
In the most recent data (2007-08), 5.7 million age-eligible civilian men and 16.5 million age-

16
eligible civilian women exceed both the weight-for-height and percent body fat enlistment
standards of the Army.
We also investigate the correlates of failing to meet current active duty enlistment
standards for weight and body fat. Table 7 reports the results of probit regressions of failing to
meet the enlistment standards for weight-for-height and percent body fat. Models are estimated
using data from the NHANES Continuous (1999-2008) for those who are age-eligible to enlist in
the Army.16 Averages of individual marginal effects are reported in square brackets.
For each gender, the first column of Table 7 presents the results of a parsimonious model
that includes only the exogenous regressors age and race/ethnicity. These results indicate that
African-Americans are more likely to fail the weight and fat standards of the Army. Specifically,
African-American males are 3.2 percentage points more likely than white males to exceed the
standards, and African American females are 17.7 percentage points more likely than white
females to exceed the standards. In addition, Hispanic females are 5.9 percentage points more
likely than white females to exceed the standards (the difference for Hispanic men is not
statistically significant and of the opposite sign). The probability of exceeding the standards
varies with age, although differently for males and females. Males aged 25-29, 30-34, and 35-39
are at least 4 percentage points less likely than men aged 17-19 to exceed the standards. In
contrast, females aged 25-29, 30-34, 35-39, and 40-42 are at least 6 percentage points more
likely than females aged 17-19 to exceed the standards.
For each gender, the second column of Table 7 presents the results of a model that adds
education and marital status to the set of regressors. The addition of these regressors reduces the
marginal effects of age for men, but increases the marginal effects of age for women. African-
16 Observations with missing information on education, and marital status are dropped from the analysis sample; this sample is slightly smaller than the sample used in the estimation of percent and number eligible for military service.

17
Americans remain significantly and substantially more likely than whites to exceed the
standards: 2.7 percentage points more likely for men and 15.6 percentage points more likely for
women. Of the new regressors, only education has a significant correlation with exceeding the
standards; specifically, the college-educated are significantly less likely to exceed the standards
(5.3 percentage points less likely for men, and 15.9 percentage points less likely for women).
Extension: Historic Army Standards
As an extension, we examine several historic sets of weight standards for the Army. We
have located four historic sets of Army active duty enlistment standards for weight and body fat:
those issued in 1961, 1968, 1976, and 1991 as well as the current standards issued in 2007 that
are used earlier in the paper. The 1991 regulations were the first of which (we are aware) to
include a percent body fat maximum; earlier regulations relied solely on weight-for-height.
Figures 4 (men) and 5 (women) compare the percent of military-age civilians who meet Army
weight and (if applicable) body fat standards, and reveal that weight-for-height standards became
much more lenient in 1991, then slightly more stringent in 2007. Figure 4 shows that, in 2007-
08, roughly 85-87% of military-age American males met the 2007 (current) and 1991 Army
standards, but that percentage would be roughly 79-80% if the 1976, 1968, or 1961 weight-for-
height standards had been in place. Likewise, Figure 5 shows that, in 2007-08, roughly 60% of
military-age females met the 2007 (current) and 1991 Army standards, but that percentage would
be roughly 40-43% if the 1968 or 1976 standards were still in place. In brief, the decrease over
time in eligibility documented in this paper would have been even greater had the military not
relaxed its standards in 1991.17
17 Interestingly, the 1991 regulations are both more lenient, in the sense that they allow an applicant to exceed the maximum weight-for-height as long as he is below the maximum percent body fat, and stricter, in that the maximum

18
Simulation of Future Changes in Weight and Body Fat
As an additional extension, we estimate how future changes in weight and body fat would
affect eligibility for military service. In Tables 8 (males) and 9 (females), we estimate the impact
of changes in weight and body fat of 1%, 2%, and 3%, on the number and percent of Americans
who would meet Army standards for weight and body fat. The impact of both gains and losses
are examined; the answers will not necessarily be symmetric, as the additional people pushed
over the threshold by a given gain is not necessarily equal to the additional people pushed under
the threshold by a given loss (i.e. the mass around the threshold may not be symmetric). To
estimate these effects, we examine respondents to the Continuous NHANES (1999-2008), and
add or subtract a given percentage (1%, 2%, or 3%) to their weight and percent body fat, then
recalculate the number and percentage that would fail the Army’s eligibility standards.
Table 8 presents results for men. A gain of 1%, 2% or 3% to both weight and body fat
would raise the number of military-age men who fail the Army’s standards by 0.67 million
(1.4%), 1.25 million (2.5%) and 1.98 million (4.01). Losses of 1%, 2%, and 3% have less of an
impact than the gains: a reduction in the number who fail the standards of 0.29 million (0.6%),
0.78 million (1.6%) and 1.25 million (2.5%).
For women (Table 9), the asymmetry is even greater. A gain of 1%, 2% or 3% to both
weight and body fat would raise the number of military-age women who fail the Army’s
standards by 1.01 million (2.2%), 1.73 million (3.7%) and 2.52 million (5.46%). Losses of 1%,
2%, and 3% have far less of an impact than the gains. In fact, a loss of 1% of weight and body
weight in pounds for each height was reduced. On net, however, they are more lenient: a substantially higher percentage of Americans satisfy the 1991 regulations than the preceding 1976 regulations. The 1991 regulations are also arguably more accurate or appropriate than preceding regulations, in that the 1991 regulations permit more muscular individuals and reject fatter individuals at each height.
19
fat would actually raise the number of women who fail the standards, because the additional
women who fell below the minimum exceeds the additional women who fall below the
maximum. Losses of 2% and 3% of weight and body fat would increase the number who meet
the standards of 0.28 million (0.6%) and 0.75 million (1.6%).
In summary, even small additional increases in weight and fat have the potential to
greatly increase the number of military-age civilians who fail the military’s weight-for-height
and body fat standards. Unfortunately, equivalent reductions in weight and body fat have
smaller beneficial impacts, because (as one would expect with a normal distribution) the number
of men and women just below the maximum weight threshold (who could be pushed over the
maximum by a small gain) is greater than the number just above the threshold (who could be
pushed below the maximum by a small loss).
Limitations
The limitations of this paper include the following. A recruit who fails to pass the
weight-for-height and percent body fat standards can petition to be re-measured at a later date.
We are unable to determine which rejected subjects in our sample might have been able to “make
weight” at a later date. We estimate body fat using skinfold thicknesses at the tricep and
subscapular regions, whereas the services measure it at a variety of other sites such as abdomen,
waist, hip and neck (NRC, 2006); however, each is considered an accurate measure of body fat
(Heymsfield et al., 2004). We examine only the standards regarding weight-for-height and
percent body fat, whereas many other factors, such as standardized test scores and performance
on tests of physical fitness determine whether a recruit is eligible for enlistment. Thus, our
estimates of the number of civilians that meet the standards for weight-for-height and percent

20
body fat are greater than the number that would pass all military enlistment standards. However,
the purpose of this paper is not to estimate the number of civilians who pass all of the military
enlistment standards, but to document how rising obesity disqualifies increasing numbers of
civilians from military enlistment.
Discussion
The high and rising prevalence of obesity represents a substantial challenge for military
recruitment. The percentage of civilian military-age men and women who satisfy military
enlistment standards for weight-for-height and percent body fat has fallen considerably since
1959. For example, between 1959-62 and 2007-08, the percentage of civilians aged 17-42 years
who exceed the Army’s enlistment standards for weight and body fat has doubled for men and
tripled for women. As of 2007-08, there were 5.7 million men and 16.5 million women between
the ages of 17 and 42 who exceeded the Army’s enlistment standards for weight and body fat.
As a result, the rise in obesity among the civilian population “may pose significant problems for
national defense” (Yamane, 2007, p. 1163).
The implications of the rise in obesity for military recruitment depend in part on the
number of military recruits needed. If the U.S. completes Operation New Dawn in Iraq and
Operation Enduring Freedom in Afghanistan, downsizes its military, and avoids large-scale wars,
the impact will be less than if an additional major threat or conflict arises that requires a
substantial expansion of the military, in which case rising obesity will represent a substantial
obstacle to recruiting a sufficient number of high quality candidates, particularly among females.
The problem would be particularly acute if the U.S. was forced by wartime demands to
return to a system of conscription or draft that sought to enlist a high percentage of civilians.
21
Under conscription, military enlistment standards and exemptions can have the unintended
consequence of incentivizing certain behaviors in order to avoid military service. For example,
the Vietnam-era draft, by exempting those who were attending college, increased college
attendance by 4 to 6 percentage points (Card and Lemieux, 2001). Also during the Vietnam
draft, a removal of the exemption for married childless men but retention of the exemption for
married men with children led to a spike in fertility (Kutinova, 2009). Johnson (1997) contends
that, historically, some potential draftees sought to gain weight to disqualify themselves from
military service. Yamane (2007) argues that the rise in weight in the civilian population implies
that there is a large number of potential draftees for whom it would be relatively easy to
intentionally gain a sufficient amount of weight to avoid military service.
The percentage of military-age civilians who meet weight-for-height and body fat
standards decreased considerably more for women than men. Although women constitute the
minority of each U.S. armed service, the percentages are nontrivial; women represent 6.2% of
the Marine Corps, 13.4% of the Army, 14.8% of the Navy, and 19.4% of the Air Force (U.S.
Census Bureau, 2010). However, that is subject to change. When engaged in wars that are
intense or long in duration, nations tend to enlist individuals previously thought less suited to
service. For example, prior to 1860, the enlistment of large numbers of African Americans in the
U.S. armed forces was never seriously considered, but that changed with the demands of the
Civil War (McPherson, 1988). Several nations, including Israel, require mandatory military
service of women (Poast, 2006). Future threats or conflicts could lead the U.S. to enlist large
numbers of women in its armed forces. Thus, rising obesity among women, not just that among
men, represents a concern for national security.

22
A simplistic response is to relax the enlistment standards to allow heavier and fatter
recruits into the military. However, high weight and body fat have been linked to worse job
performance in military occupations (IOM 1990, 2004; Naghii, 2006), and cost the military over
$1.2 billion annually in higher health care spending and lower productivity (Dall et al., 2007).
The IOM reports that, of the recruits who exceeded the weight-for-height standards but
subsequently entered the military because they passed the standards later or received a waiver,
80% left the military before completing their first term of enlistment but after the expenditure of
training costs (IOM, 2004). Thus, relaxing the standards could entail substantial costs. It is
beyond the scope of this study to calculate the optimal weight standards from a cost-benefit
perspective, but that is an important direction for future research.
Our probit results indicate that in recent years (1999-2008), African American females
are between 15.6 and 17.7 percentage points less likely than white females to meet the weight
and body fat standards of the military services. Likewise, African American males are 5.6 to 5.7
percentage points less likely than white males to satisfy the weight and body fat standards of the
Army. These disparities represent a substantial challenge for the U.S. military, which actively
seeks to recruit a labor force that is representative of the nation but has recently experienced
declining enlistments by minorities, especially African-Americans (Asch et al., 2009).
Collectively, the findings of this paper, and their implications for military recruitment,
represent an underappreciated cost of the obesity epidemic, and thus represent an additional
reason for the U.S. government to invest in prevention of obesity. Cost-effective school-based
interventions to prevent childhood obesity have been identified (Wang et al., 2003; Brown et al.,
2007; Cawley, 2007, 2010). In addition, both the Federal and state governments can mandate
that private health insurance plans cover cost-effective methods of preventing and treating youth

23
obesity (Homer and Simpson, 2007; Cawley 2010) and can cover such treatments in their
Medicaid programs. There is a precedent for concerns about military readiness leading to
government policies to reduce obesity. Singapore, which has universal male conscription,
became concerned about rising obesity among military conscripts and in response implemented
in 1992 a broad campaign to reduce youth obesity (Walsh, 2004). Even in the U.S. there is
precedent for the military advocating policies to ensure healthy weight among youths; the
Mission: Readiness (2010) report notes that, after World War II, General Lewis Hershey, the
Director of the Selective Service, convinced Congress to pass the National School Lunch Act
“…as a way to improve the nutrition of America’s children, increase their height and weight, and
ensure America’s national security” (Mission: Readiness, 2010, p. 1). Ironically, the modern
school lunch program has been identified as a contributing factor to childhood obesity (e.g.,
Schanzenbach, 2009). As a result, retired generals and admirals are now calling for the removal
of high-calorie, low-nutrient foods from schools and for improving the quality of the school
lunch program (Mission: Readiness, 2010). The need for effective obesity prevention is urgent,
as our estimates indicate that just an additional 1% gain in weight and percent body fat would
disqualify an additional 671,000 men and 1.01 million women from military service.
The trends documented in this paper suggest that retaining already-fit members of the
military may be increasingly cost-effective relative to finding and recruiting civilians who meet
military weight and body fat requirements. A direction for future research is to examine whether
cost effectiveness considerations justify shifting resources away from recruitment and toward
retention.
The trends documented in this paper also suggest that the military may need to
increasingly engage in factor substitution. As obesity raises the cost of recruiting an additional

24
soldier who meets military weight requirements (and as excess fatness lowers the marginal
product of labor), it may be cost-saving to substitute capital for labor. The military has recently
engaged in such factor substitution, e.g. moving from manned to unmanned aerial vehicles (e.g.
Predator drones); additional substitution of capital for labor could help the military deal with a
shrinking pool of high-quality recruits.
Another possibility is to substitute one type of labor to another. During the War on
Terror, the U.S. military has increasingly outsourced activities to private military companies,
which can recruit from a broader, international, labor pool (Singer, 2003). Though perhaps
repugnant to some (Roth, 2007), such outsourcing of military functions could alleviate the
burden on the U.S. military to find a large number of fit military recruits.
An ongoing challenge for the military is how to accurately measure fitness for service.
Initially the military used weight-for-height, in part because it is easy to assess, but it is a noisy
measure of fatness (Burkhauser and Cawley, 2008), and had the undesirable consequence of
excluding men with high muscle mass, so the military now admits applicants who exceed the
weight-for-height standard as long as their percent body fat is under a certain threshold (Johnson,
1997). Moreover, the services have varying standards of weight-for-height and body fat with no
clearly articulated rationale based on difference of needs (NRC, 2006). An important direction
for future research is to determine the measure of fatness, and the enlistment standards based on
that measure of fatness, that are optimal for each service.
25
Works Cited
Asch, Beth J., Paul Heaton, James Hosek, Francisco Martorell, Curtis Simon, John T. Warner. 2010. “Cash Incentives and Military Enlistment, Attrition, and Reenlistment.” RAND National Defense Research Institute.
Asch, Beth J., James R. Hosek, and John T. Warner. 2007. “New economics of manpower in the post-cold war era.” in: Keith Hartley and Todd Sandler (eds.) Handbook of Defense Economics, Volume 2. (New York: Elsevier/North Holland).
Asch, Beth J., Paul Heaton, and Bogdan Savych. 2009. Recruiting Minorities: What Explains Recent Trends in the Army and Navy? RAND National Defense Research Institute.
Auld, M. Christopher. 2005. Smoking, drinking, and income. The Journal of Human Resources 15: 504–518.
Averett, S., Korenman, S., 1996. The economic reality of the beauty myth. J. Hum. Resour. 31 (2), 304330.
Bohnker BK, Bohnker BK, Sack DM, Wedierhold L, Malakooti M. 2005. “Navy physical readiness test scores and body mass index (spring 2002 cycle).” Military Medicine, 170: 851–854.
Brown III HS, Pérez A, Li Y-P, Hoelscher DM, Kelder SH, Rivera R. 2007. “The cost-effectiveness of a school-based overweight program.” International Journal of Behavioral Nutrition and Physical Activity, 4:47.
Burkhauser, Richard V. and John Cawley. 2008. “Beyond BMI: The Value of More Accurate Measures of Obesity in Social Science Research”, Journal of Health Economics, 27(2), March, 519-529.
Burkhauser, Richard V., John Cawley, and Maximilian D. Schmeiser. 2009. “The Timing of the Rise in U.S. Obesity Varies With Measure of Fatness.” Economics and Human Biology, 7(3): 307-318.
Card, David and Thomas Lemieux. 2001. “Going to College to Avoid the Draft: The Unintended Legacy of the Vietnam War.” American Economic Review, 91(2): 97-102.
Carter, Susan B. (editor). 2006. Historical Statistics of the United States, Milennial Edition. Cambridge University Press.
Cawley, John. 2004. “The Impact of Obesity on Wages.” Journal of Human Resources, 39(2): 451-474.
Cawley, John. 2007. “The Cost Effectiveness of Programs to Prevent or Reduce Obesity: The State of the Literature and a Future Research Agenda.” Archives of Pediatrics & Adolescent Medicine, 161(6): 611-614.
Cawley, John. 2010. “The Economics of Childhood Obesity.” Health Affairs, 29(3): 364-371. Cawley, John, and Richard V. Burkhauser. 2006. “Beyond BMI: The Value of More Accurate
Measures of Fatness and Obesity in Social Science Research.” National Bureau of Economic Research Working Paper #12291.
Cawley, John and Chad Meyerhoefer. 2010. “The Medical Care Costs of Obesity: An Instrumental Variables Approach.” NBER Working Paper #16467.
Costa, Dora L. 1993. “Height, Weight, Wartime Stress, and Older Age Mortality: Evidence from the Union Army Records.” Explorations in Economic History 30(4): 424-49.
Costa, Dora L. 2004. “The Measure of Man and Older Age Mortality: Evidence from the Gould Sample,” Journal of Economic History, 64(1): 1-23.
Dall, Timothy M., Yiduo Zhang, Yaozhu J. Chen, Rachel C. Askarinam Wagner, Paul F. Hogan, Nancy K. Fagan, Samuel T. Olaiya, David N. Tornberg. 2007. “Cost Associated With

26
Being Overweight and With Obesity, High Alcohol Consumption, and Tobacco Use Within the Military Health System’s TRICARE Prime–Enrolled Population.” American Journal of Health Promotion, 22(2):120–139.
Durnin JV, Womersley J. 1974. “Body fat assessed from total body density and its estimation from skinfold thickness: measurements on 481 men and women aged from 16 to 72 years.” British Journal of Nutrition. 32:77-97.
Finkelstein, Eric A., Trogdon JG, Cohen JW, Dietz W. Annual medical spending attributable to obesity: payer- and service-specific estimates, Health Affair Web Exclusive. July 27 2009.
Flegal, KM, MD Carroll, RJ Kuczmarski and CL Johnson. 1998. “Overweight and obesity in the United States: prevalence and trends, 1960-1994.” International Journal of Obesity, 22: 39-47.
Flegal K., Carroll, M., Ogden, C., Curtin, L. 2010. “Prevalence and trends in obesity among US adults: 1999-2008.” Journal of the American Medical Association. 303(3):235-241.
Flegal KM, MD Carroll, CL Ogden, and CL Johnson. 2002. “Prevalence and trends in obesity among US adults: 1999-2000.” Journal of the American Medical Association, 288(14): 1723-1727.
Heymsfield, S.B., et al. 2004. “Evaluation of total and regional adiposity.” In: Bray, G.A., Bouchard, C. (Eds.), Handbook of Obesity: Etiology and Pathophysiology. 2nd ed. Marcel Dekker, New York.
Homer C, Simpson LA. 2007. “Childhood Obesity: What’s Health Care Policy Got To Do With It?” Health Affairs. 26(2):441-444.
Institute of Medicine. 1990. Body Composition and Physical Performance: Applications for the Military Services. Washington, DC: The National Academies Press.
Institute of Medicine. 2004. Weight Management: State of the Science and Opportunities for Military Programs Subcommittee on Military Weight Management, Committee on Military Nutrition Research. Washington, DC: The National Academies Press.
Johansson, E, Alho H, Kiiskinen U, Poikolainen K. 2007. The association of alcohol dependency with employment probability: evidence from the population survey ‘Health 2000 in Finland.’ Health Economics 16: 739–754.
Johnson NA. 1997. “The history of the Army weight standards.” Military Medicine, 162(8):564-70.
Jones BB, Manikowski R, Harris JR, et al. 1988. Incidence of and Risk Factors for Injury and Illness among Male and Female Army Basic Trainees. Technical report T19/88. Natick, MA, Army Research Institute of Environmental Medicine.
Kline, Brendan and Justin L. Tobias. 2008. “The wages of BMI: Bayesian analysis of a skewed treatment-response model with nonparametric endogeneity.” Journal of Applied Econometrics, 23: 767-793.
Knapik JJ, Canham-Chervak M, Hauret K, Hoedebecke E, Laurin MJ, Cuthie J. 2001. “Discharges during U.S. Army basic training: injury rates and risk factors.” Military Medicine, 166(7): 641-7.
Komlos, John. 1987. “The Height and Weight of West Point Cadets: Dietary Change in Antebellum America.” Journal of Economic History, 47(4): 897-927.
Komlos, John. 2008. “Stagnation of Heights Among Second-Generation U.S.-Born Army Personnel.” Social Science Quarterly, 89(2): 445-455.
27
Kutinova, Andrea. 2009. “Paternity Deferments and the Timing of Births: U.S. Natality During the Vietnam War.” Economic Inquiry, 47(2): 351-365.
MacDonald, Ziggy and Michael A. Shields. 2004. “Does problem drinking affect employment? Evidence from England,” Health Economics, 13(2): 139-155.
McDowell A, Engel A, Massey JT, Maurer K. 1981. “Plan and operation of the second national health and nutrition examination survey, 1976–1980.” Vital Health Statistics 1(15): 1-144.
McLaren, Lindsay. Forthcoming. “Socioeconomic Status and Obesity.” Chapter 16 in: John Cawley (ed.), The Handbook of the Social Science of Obesity. New York: Oxford University Press.
McLaughlin, R. and G. Wittert. 2009. “The obesity epidemic: implications for recruitment and retention of defence force personnel.” Obesity Reviews, 10: 693-699.
McPherson, James. 1988. Battle Cry of Freedom: The Civil War Era. Oxford University Press: New York.
Mission: Readiness. 2010. Too Fat to Fight. Mission: Readiness: Washington, D.C. Morris, Stephen. 2007. “The impact of obesity on employment.” Labour Economics 14 (2007)
413–433. Mullahy J, Sindelar JL. 1993. “Alcoholism, Work and Income.” Journal Labor Economics,
11(3): 494-520. Mullahy J, Sindelar J. 1996. Employment, unemployment, and problem drinking. Journal of
Health Economics 15: 409–434. Naghii, Mohammad Reza. 2006. “The importance of body weight and weight management for
military personnel.” Military Medicine, 171(6): 550-555. National Center for Health Statistics. 1965. “Plan and initial program of the health examination
survey.” Vital Health Statistics 1(4): 1-43. National Center for Health Statistics. 1977. “Plan and operation of the health and nutrition
examination survey, 1971-73.” Vital Health Statistics 1(10b): 1-120. National Center for Health Statistics. 1994. “Plan and operation of the third national health and
nutrition examination survey, 1988-94.” Vital Health Statistics 32: 1-407. National Center for Health Statistics. 2000. “National health and nutrition examination survey
Anthropometry Procedures Manual.” http://www.cdc.gov/nchs/data/nhanes/bm.pdf Accessed May 23, 2007.
National Research Council. 2006. Assessing Fitness for Military Enlistment: Physical, Medical, and Mental Health Standards. Committee on the Youth Population and Military Recruitment: Physical, Medical, and Mental Health Standards, Paul R. Sackett and Anne S. Mavor, editors. Board on Behavioral, Cognitive, and Sensory Sciences, Division of Behavioral and Social Sciences and Education. Washington, DC: The National Academies Press.
Nieto-Garcia, F. J., Bush, T. L. and Keyl, P. M. 1990. “Body Mass Definitions of Obesity: Sensitivity and Specificity Using Self-Reported Weight and Height.” Epidemiology, 1(2), 146-152.
Nolte, Rochelle, Shawn C. Franckowiak, Carlos J. Crespo, and Ross E. Andersen. 2002. “U.S. Military Weight Standards: What Percentage of U.S. Young Adults Meet the Current Standards?” Am J Med. 113:486–490.
Norton, Edward C. and Euna Han. 2008. “Genetic Information, Obesity, and Labor Market Outcomes”, Health Economics 17(9), September, 1089-1104.

28
Poast, Paul. 2006. The Economics of War. McGraw-Hill/Irwin: New York. Poston WS, Haddock CK, Talcott GW, Klesges RC, Lando HA, Peterson A. 2002. “Are
overweight and obese airmen at greater risk of discharge from the United States Air Force?” Military Medicine, 167(7):585-8.
Renna F. 2007. The economic cost of teen drinking: late graduation and lowered earnings. Health Economics 16: 407–419.
Rooth, Dan-Olof. 2009. “Obesity, Attractiveness, and Differential Treatment in Hiring: A Field Experiment.” Journal of Human Resources, 44(3): 710-735.
Roth, Alvin E. 2007. “Repugnance as a Constraint on Markets.” Journal of Economic Perspectives, 21(3): 37–58.
Rowland M. 1974. “Self-reported weight and height.” American Journal of Clinical Nutrition. 32:77-97.
Sandler, Todd and Keith Hartley. 1995. “Military Manpower.” Chapter 6 in The Economics of Defense, (New York: Cambridge University Press).
Schanzenbach, Diane W. 2009. “Do School Lunches Contribute to Childhood Obesity?” Journal of Human Resources. 44(3):684-709.
Simon, Curtis J. and John T. Warner. 2007. “Managing the all-volunteer force in a time of war.” The Economics of Peace and Security Journal, 2(1): 20-29.
Singer, P.W.. 2003. Corporate Warriors: The Rise of the Privatized Military Industry. (Cornell University Press: Ithaca NY).
Siri WE. 1956. “Gross composition of the body.” In: Lawrence JH, Tobias CA, eds. Advances in Biological and Medical Physics. Vol. 4. New York: Academic Press; pp. 239-280.
StataCorp. 2009. Stata Statistical Software: Release 11. College Station, TX: StataCorp LP. U.S. Bureau of Labor Statistics. 2009. “Job Opportunities in the Armed Forces.” Occupational
Outlook Handbook, 2010-11 Edition. BLS: Washington DC. U.S. Census Bureau. Various years. Statistical Abstract of the United States. Section 10:
National Security and Veterans’ Affairs. U.S. Department of Defense. 2004. “DoD Physical Fitness and Body Fat Program.” Number
1308.1. June 30. Van Ours JC. 2004. A pint a day raises a man’s pay; but smoking blows that gain away. Journal
of Health Economics 23: 863–886. Walsh, Bryan. 2004. “Singapore Shapes Up.” Time Asia, November 1. Wang LY, Yang Q, Lowry R, Wechsler H. 2003. “Economic analysis of a school-based obesity
prevention program.” Obesity Research, 11:1313-24. Warner, John T. and Beth J. Asch. 1995. “The Economics of Military Manpower.” Chapter 13
in: Keith Hartley and Todd Sandler (eds.) Handbook of Defense Economics, Volume 1. (New York: Elsevier/North Holland).
Yamane, Grover K. 2007. “Obesity in Civilian Adults: Potential Impact on Eligibility for U.S. Military Enlistment.” Military Medicine, 172(11): 1160-1165.

Table 1 Current U.S. Army Active Duty Enlistment Standards
for Body Weight and Percent Body Fat, Men
Minimum Weight (lbs)
Maximum Weight (lbs) by Age
Height (inches)
All 17-20 21-27 28-39 40+
60 97 139 141 143 146 61 100 144 146 148 151 62 104 148 150 153 156 63 107 153 155 158 161 64 110 158 160 163 166 65 114 163 165 168 171 66 117 168 170 173 177 67 121 174 176 179 182 68 125 179 181 184 187 69 128 184 186 189 193 70 132 189 192 195 199 71 136 194 197 201 204 72 140 200 203 206 210 73 144 205 208 212 216 74 148 211 214 218 222 75 152 217 220 224 228 76 156 223 226 230 234 77 160 229 232 236 240 78 164 235 238 242 247 79 168 241 244 248 253 80 173 247 250 255 259
Maximum
% Body Fat
26 26 28 30 Notes: Source is Army Regulation 40-501 Table 2-1 and Table 2-2 (December, 2007). Eligible age range is 17-42 years.

Table 2 Current U.S. Army Active Duty Enlistment Standards
for Body Weight and Percent Body Fat, Women
Minimum Weight (lbs)
Maximum Weight (lbs) by Age
Height (inches)
All 17-20 21-27 28-39 40+
58 91 122 124 126 127 59 94 127 128 130 131 60 97 132 134 135 136 61 100 136 137 139 141 62 104 140 141 144 145 63 107 145 147 148 149 64 110 149 151 153 154 65 114 154 156 158 160 66 117 160 160 162 165 67 121 163 166 168 169 68 125 168 171 173 174 69 128 173 176 178 180 70 132 178 181 183 185 71 136 183 186 188 191 72 140 189 191 194 196 73 144 194 196 200 202 74 148 199 203 204 206 75 152 205 208 210 212 76 156 210 213 215 216 77 160 216 219 221 223 78 164 222 224 227 229 79 168 227 230 234 236 80 173 233 236 240 241
Maximum
% Body Fat
32 32 34 36 Notes: Source is Army Regulation 40-501 Table 2-1 and Table 2-2 (December, 2007). Eligible age range is 17-42 years.

Table 3 Percent of Military-Age Male Civilians who do not Meet Army Active Duty Enlistment
Standards for Weight and Percent Body Fat, by Survey
1 2 3 4 5
Survey and Survey Years Unweighted
N
Do not meet
standards Underweight Overweight and overfat
NHES I: 1959-1962 1637 7.98 (0.98)
2.43 (0.48)
5.55 (0.92)
NHANES I: 1971-1975 2280 8.38 (0.90)
4.00 (0.57)
4.38 (0.59)
NHANES II: 1976-1980 2828 10.27 (0.73)
3.98 (0.42)
6.16 (0.49)
NHANES III: 1988-1994 3871 10.18 (0.77)
2.73 (0.50)
7.27 (0.74)
NHANES 1999-2000 1230 15.33 (1.33)
3.63 (0.73)
11.70 (1.36)
NHANES 2001-2002 1380 14.37 (0.54)
3.65 (0.48)
10.72 (0.64)
NHANES 2003-2004 1295 14.02 (0.93)
3.61 (0.65)
10.40 (1.21)
NHANES 2005-2006 1305 14.15 (1.56)
3.25 (0.78)
10.85 (1.36)
NHANES 2007-2008 1219 14.83 (1.49)
3.13 (0.63)
11.70 (1.31)
Percentage Point Change Between NHES I and NHANES 07-08
-- 6.85
0.70
6.15
Percent Change Between NHES I and NHANES 07-08
-- 85.92
28.82
110.91
p-value2 -- 0.00 0.04 0.00 Notes: Percent ineligible is calculated by applying current Army weight standards to historical data. See Table for current Army enlistment weight standards for men. Sampling weights with adjustment for strata are used. Standard errors clustered by primary sampling unit are reported in parentheses. 2t-test for difference in means between NHES I and NHANES 07.

Table 4 Percent of Military-Age Female Civilians who do not Meet Army Active Duty
Enlistment Standards for Weight and Percent Body Fat, by Survey
1 2 3 4 5
Survey and Survey Years Unweighted
N
Do not meet
standards Underweight Overweight and overfat
NHES I: 1959-1962 1777 21.86 (0.92)
9.84 (0.73)
11.46 (0.92)
NHANES I: 1971-1975 4265 28.27 (0.84)
11.80 (0.57)
15.91 (0.64)
NHANES II: 1976-1980 2636 29.08 (0.94)
9.95 (0.58)
18.59 (0.89)
NHANES III: 1988-1994 3362 35.73 (1.47)
8.14 (0.70)
27.12 (1.38)
NHANES 1999-2000 1163 38.62 (2.75)
6.86 (1.25)
31.51 (2.29)
NHANES 2001-2002 1248 35.65 (1.58)
6.27 (0.76)
28.52 (1.92)
NHANES 2003-2004 1151 39.17 (2.30)
5.88 (0.93)
32.96 (2.51)
NHANES 2005-2006 1179 35.83 (2.00)
6.45 (1.02)
28.83 (1.87)
NHANES 2007-2008 1168 40.46 (1.94)
5.14 (0.66)
34.65 (2.11)
Percentage Point Change Between NHES I and NHANES 07-08
-- 18.59
-4.71
23.18
Percent Change Between NHES I and NHANES 07-08
-- 85.05
-47.81
202.21
p-value2 -- 0.00 0.00 0.00 Notes: Percent ineligible is calculated by applying current Army weight standards to historical data. See Table 2 for current Army enlistment weight standards for women. Sampling weights with adjustment for strata are used. Standard errors clustered by primary sampling unit are reported in parentheses. Pregnant women excluded from the analysis sample. 2t-test for difference in means between NHES I and NHANES 07.
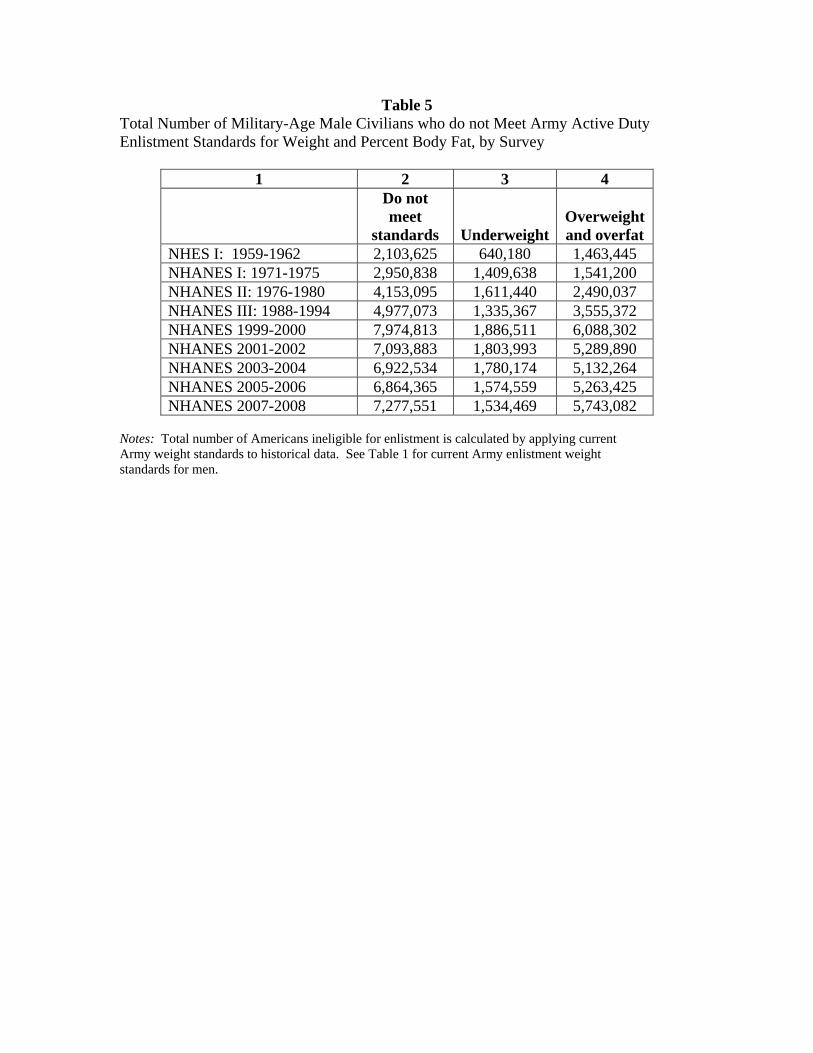
Table 5 Total Number of Military-Age Male Civilians who do not Meet Army Active Duty Enlistment Standards for Weight and Percent Body Fat, by Survey
1 2 3 4
Do not meet
standards UnderweightOverweight and overfat
NHES I: 1959-1962 2,103,625 640,180 1,463,445 NHANES I: 1971-1975 2,950,838 1,409,638 1,541,200 NHANES II: 1976-1980 4,153,095 1,611,440 2,490,037 NHANES III: 1988-1994 4,977,073 1,335,367 3,555,372 NHANES 1999-2000 7,974,813 1,886,511 6,088,302 NHANES 2001-2002 7,093,883 1,803,993 5,289,890 NHANES 2003-2004 6,922,534 1,780,174 5,132,264 NHANES 2005-2006 6,864,365 1,574,559 5,263,425 NHANES 2007-2008 7,277,551 1,534,469 5,743,082
Notes: Total number of Americans ineligible for enlistment is calculated by applying current Army weight standards to historical data. See Table 1 for current Army enlistment weight standards for men.

Table 6
Total Number of Military-Age Female Civilians who do not Meet Army Active Duty Enlistment Standards for Weight and Percent Body Fat, by Survey
1 2 3 4
Do not meet
standards UnderweightOverweight and overfat
NHES I: 1959-1962 6,026,555 2,713,580 3,159,992 NHANES I: 1971-1975 9,358,338 3,908,039 5,266,731 NHANES II: 1976-1980 10,746,195 3,678,170 6,869,053 NHANES III: 1988-1994 13,719,726 3,126,280 10,413,214 NHANES 1999-2000 18,607,608 3,306,581 15,182,625 NHANES 2001-2002 16,597,408 2,919,012 13,281,802 NHANES 2003-2004 18,406,747 2,764,276 15,485,703 NHANES 2005-2006 16,145,557 2,905,312 12,992,811 NHANES 2007-2008 19,226,566 2,441,738 16,464,419 Notes: Total number of Americans eligible for enlistment is calculated by applying current Army weight standards to historical data. See Table 2 for current Army enlistment weight standards for women. Pregnant women excluded from the analysis sample.

Table 7 Correlates of Not Meeting Active Duty Army Enlistment Standards
for Weight and Body Fat Men Women Model (1) Model (2) Model (1) Model (2) Age 20-24 years -0.0964 -0.1066 0.1129 0.1940** (0.0794)
[-0.0217] (0.0814) [-0.0239]
(0.0771) [0.0424]
(0.0847) [0.0721]
25-29 years -0.1842* -0.1718* 0.2440*** 0.4097*** (0.0926)
[-0.0416] (0.1008) [-0.0385]
(0.0674) [0.0916]
(0.0777) [0.1523]
30-34 years -0.2620*** -0.2298** 0.1914*** 0.3523*** (0.0843)
[-0.0591] (0.0987) [-0.0515]
(0.0637) [0.0719]
(0.0806) [0.1309]
35-39 years -0.2172*** -0.1797** 0.1815** 0.3283*** (0.0662)
[-0.0490] (0.0846) [-0.0403]
(0.0733) [0.0681]
(0.0885) [0.1220]
40-42 years -0.1069 -0.0751 0.2120*** 0.3705*** (0.0869)
[-0.0241] (0.1006) [-0.0168]
(0.0627) [0.0796]
(0.0854) [0.1377]
Race/ethnicity African American 0.1422** 0.1221** 0.4722*** 0.4199*** (0.0560)
[0.0321] (0.0569) [0.0274]
(0.0529) [0.1773]
(0.0535) [0.1561]
Hispanic -0.1090 -0.1307* 0.1581*** 0.0867 (0.0696)
[-0.0246] (0.0719) [-0.0293]
(0.0573) [0.0594]
(0.0586) [0.0322]
Other race 0.0428 0.0633 -0.0299 -0.0007 (0.1098)
[0.0097] (0.1082) [0.0142]
(0.0850) [-0.0112]
(0.0843) [-0.0003]
Education Less than high school -- -0.0325 -- 0.0182 (0.0641)
[-0.0073] (0.0575)
[0.0068] Some college -- 0.0319 -- -0.0530 (0.0650)
[0.0072] (0.0581)
[-0.0197] College graduate -- -0.2372** -- -0.4268*** (0.0902)
[-0.0531] (0.0640)
[-0.1586] Marital status Divorced -- -0.0854 -- -0.0285 (0.1290)
[-0.0191] (0.0739)
[-0.0106] Never married -- -0.0169 -- 0.0191 (0.0596)
[-0.0038] (0.0574)
[0.0071] Un-weighted N 5792 5792 5376 5376 Notes: Data: Continuous NHANES (1999-2008). See Tables 1 and 2 for current Army enlistment weight standards. “Not meeting” the standards could be due to being overweight and overfat, underweight, or outside the height range, although the majority of disqualifications are due to being overweight and overfat. Sampling weights with adjustment for strata are used. Standard errors clustered by primary

sampling unit are reported in parentheses. Observations with missing information and pregnant women excluded from the analysis sample. Average marginal effects reported in square brackets. All regressions include year fixed effects and an intercept. Reference categories are age 17-20 years, white, high school education, and married. ***;**;*=statistically different from zero at 1%; 5%;10% confidence level.

Table 8 Simulated Changes in the Number and Percent of Civilian Men Not Meeting Current Army Standards for Weight and Body Fat
N not
eligible % not eligible N change % change
Gain 1% weight & PBF 7,822,900 15.87 671,428 1.36 Lose 1% weight & PBF 6,858,130 13.91 -293,342 -0.60 Gain 2% weight & PBF 8,398,784 17.04 1,247,312 2.53 Lose 2% weight & PBF 6,375,935 12.94 -775,537 -1.57 Gain 3% weight & PBF 9,130,369 18.52 1,978,897 4.01 Lose 3% weight & PBF 5,902,253 11.97 -1,249,219 -2.54 Notes: Data: Continuous NHANES (1999-2008). See Table 1 for current Army enlistment weight standards for men.
Table 9 Simulated Changes in the Number and Percent of Civilian Women
Not Meeting Current Army Standards for Weight and Body Fat
N not eligible
% not eligible N change % change
Gain 1% weight & PBF 18,489,463 40.07 1,011,317 2.19 Lose 1% weight & PBF 17,567,072 38.07 88,926 0.19 Gain 2% weight & PBF 19,204,942 41.62 1,726,796 3.74 Lose 2% weight & PBF 17,194,120 37.26 -284,026 -0.62 Gain 3% weight & PBF 19,997,740 43.34 2,519,594 5.46 Lose 3% weight & PBF 16,723,902 36.24 -754,244 -1.64 Notes: Data: Continuous NHANES (1999-2008). See Table 2 for current Army enlistment weight standards for women.

Figure 1 Percent of U.S. Population in Active Duty Military, 1801-2009
0
1
2
3
4
5
6
7
8
9
10
1800
1810
1820
1830
1840
1850
1860
1870
1880
1890
1900
1910
1920
1930
1940
1950
1960
1970
1980
1990
2000
2010
Notes: Data: Historical Statistics of the United States (Carter, 2006), series Ed26 (military personnel on active duty) and Aa7 (resident population of the US) for years 1795-1995, and from the Statistical Abstract of the United States (U.S. Census Bureau, various years) for years 1995-present. For the Civil War (1861-65), only Union forces are included.

Figure 2
Percent of U.S. Population Obese by BMI but not by Percent Body Fat
1
2
3
4
5
6
7
8
9
10
11
12
13
1960 1965 1970 1975 1980 1985 1990 1995 2000 2005 2010
Men Women
Notes: Data: NHES (1959-62), NHANES I (1971-75), NHANES II (1976-80), NHANES III (1988-94), and NHANES Continuous (1999-2000, 2001-02, 2003-04, 2005-06, and 2007-08). For NHES I and NHANES I, II, and III, points are located at the median year of the survey. For NHANES Continuous, points are placed at the first of the two years of the survey. Obesity definitions are: BMI>=30, percent body fat greater than 25% for men, greater than 30% for women.
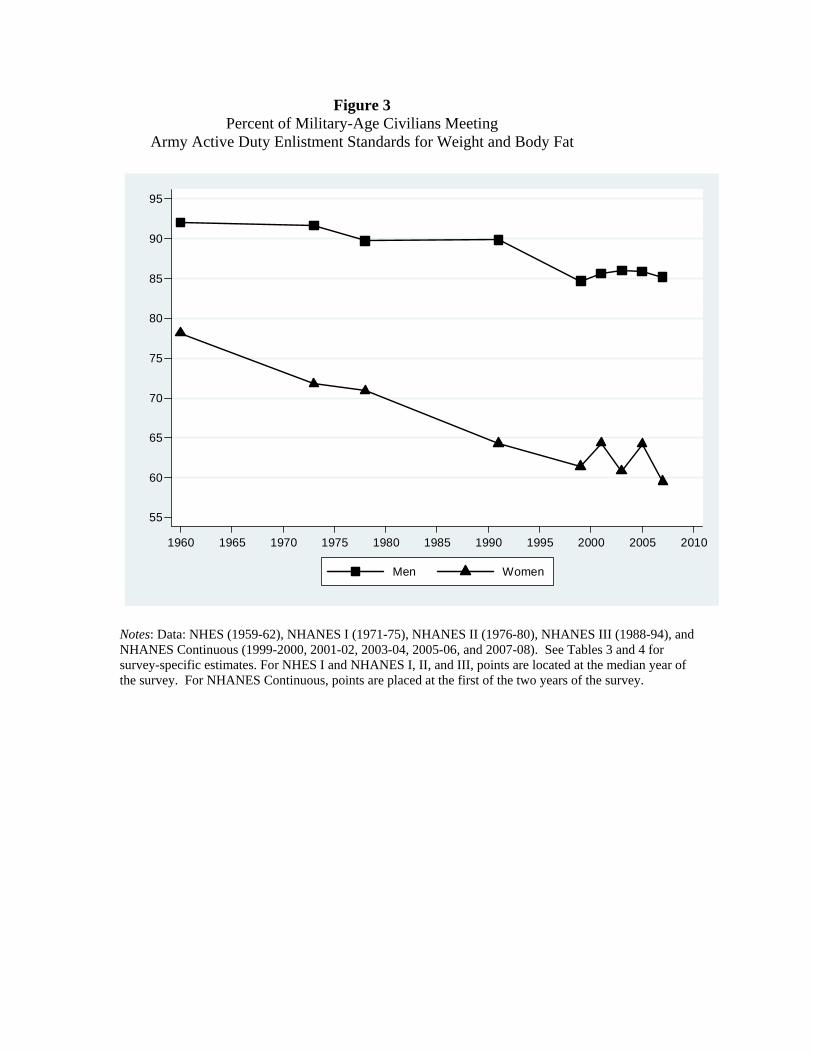
Figure 3 Percent of Military-Age Civilians Meeting
Army Active Duty Enlistment Standards for Weight and Body Fat
55
60
65
70
75
80
85
90
95
1960 1965 1970 1975 1980 1985 1990 1995 2000 2005 2010
Men Women
Notes: Data: NHES (1959-62), NHANES I (1971-75), NHANES II (1976-80), NHANES III (1988-94), and NHANES Continuous (1999-2000, 2001-02, 2003-04, 2005-06, and 2007-08). See Tables 3 and 4 for survey-specific estimates. For NHES I and NHANES I, II, and III, points are located at the median year of the survey. For NHANES Continuous, points are placed at the first of the two years of the survey.
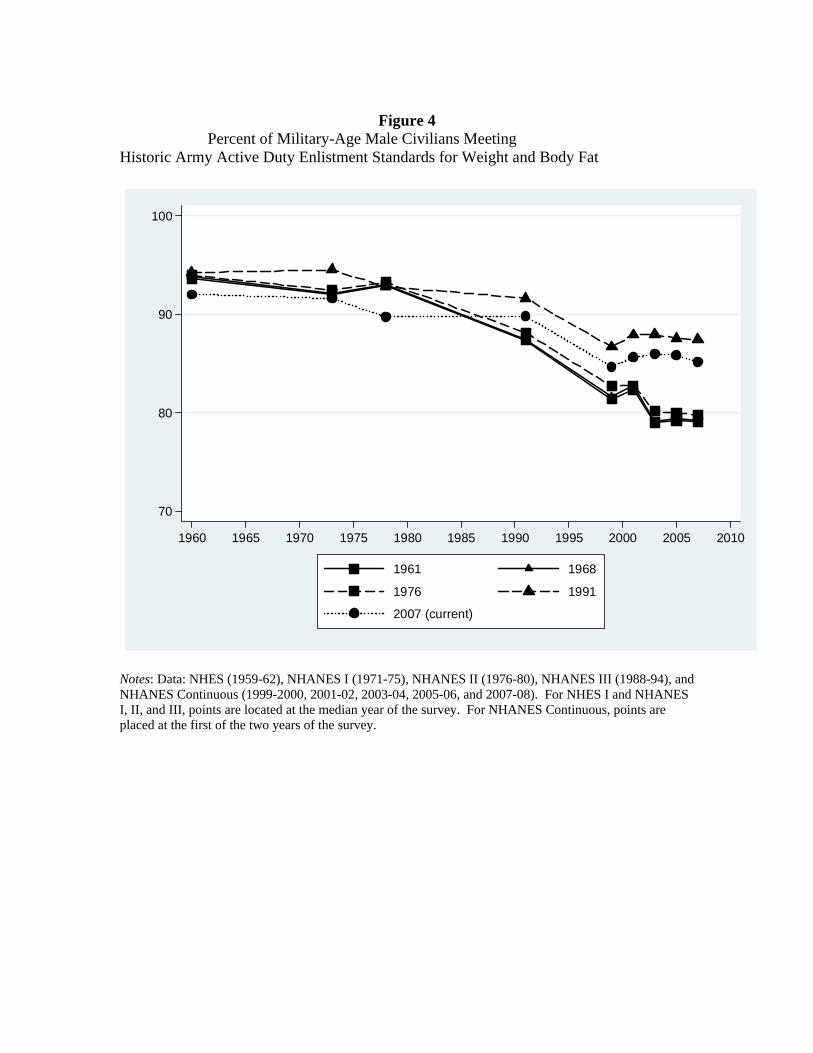
Figure 4
Percent of Military-Age Male Civilians Meeting Historic Army Active Duty Enlistment Standards for Weight and Body Fat
70
80
90
100
1960 1965 1970 1975 1980 1985 1990 1995 2000 2005 2010
1961 1968
1976 1991
2007 (current)
Notes: Data: NHES (1959-62), NHANES I (1971-75), NHANES II (1976-80), NHANES III (1988-94), and NHANES Continuous (1999-2000, 2001-02, 2003-04, 2005-06, and 2007-08). For NHES I and NHANES I, II, and III, points are located at the median year of the survey. For NHANES Continuous, points are placed at the first of the two years of the survey.

Figure 5 Percent of Military-Age Female Civilians Meeting
Historic Army Active Duty Enlistment Standards for Weight and Body Fat
40
50
60
70
80
90
100
1960 1965 1970 1975 1980 1985 1990 1995 2000 2005 2010
1961 1968
1976 1991
2007 (current)
Notes: Data: NHES (1959-62), NHANES I (1971-75), NHANES II (1976-80), NHANES III (1988-94), and NHANES Continuous (1999-2000, 2001-02, 2003-04, 2005-06, and 2007-08). For NHES I and NHANES I, II, and III, points are located at the median year of the survey. For NHANES Continuous, points are placed at the first of the two years of the survey.