Understanding the potential of crop insurance in India: A ...
90
Understanding the potential of crop insurance in India: A study of the Pradhan Mantri Fasal Bima Yojana (Prime Minister’s Crop Insurance Scheme) Padmaja Pancharatnam, Research Advisor, Centre for Budget and Policy Studies, Bengaluru [[email protected] * corresponding author] Shreekanth Mahendiran, Research Advisor, Centre for Budget and Policy Studies, Bengaluru Madhusudhan B.V. Rao, Research Advisor, Centre for Budget and Policy Studies, Bengaluru Sridhar R Prasad, Research Advisor, Centre for Budget and Policy Studies, Bengaluru Bhavani Seetharaman, Research Assistant, Centre for Budget and Policy Studies, Bengaluru Jyotsna Jha, Principal Investigator, Director, Centre for Budget and Policy Studies, Bengaluru With inputs from Sowmya, Research Assistant, Centre for Budget and Policy Studies, Bengaluru Thyagarajan R, Research Associate, Centre for Budget and Policy Studies, Bengaluru
Transcript of Understanding the potential of crop insurance in India: A ...

Understanding the potential of crop insurance in India: A study of the Pradhan Mantri Fasal Bima Yojana (Prime Minister’s Crop Insurance Scheme)
Padmaja Pancharatnam, Research Advisor, Centre for Budget and Policy Studies,
Bengaluru [[email protected] * corresponding author]
Shreekanth Mahendiran, Research Advisor, Centre for Budget and Policy Studies,
Bengaluru
Madhusudhan B.V. Rao, Research Advisor, Centre for Budget and Policy Studies,
Bengaluru
Sridhar R Prasad, Research Advisor, Centre for Budget and Policy Studies, Bengaluru
Bhavani Seetharaman, Research Assistant, Centre for Budget and Policy Studies,
Bengaluru
Jyotsna Jha, Principal Investigator, Director, Centre for Budget and Policy Studies,
Bengaluru
With inputs from
Sowmya, Research Assistant, Centre for Budget and Policy Studies, Bengaluru
Thyagarajan R, Research Associate, Centre for Budget and Policy Studies, Bengaluru

Acknowledgements We would like to acknowledge the financial and technical support provided by 3ie which
allowed us to conduct a process evaluation of the Pradhan Mantri Fasal Bima Yojana (the
Prime minister's Crop Insurance Scheme) in Karnataka.
We would also like to acknowledge and thank the Department of Agriculture, Government of
Karnataka, for supporting our study especially the Crop Insurance Department. Without their
support, this study would not have been possible. The Department of Horticulture,
Government of Karnataka, has also been very generous in sharing their expertise and
knowledge. We would like to acknowledge their contributions.
Finally, we would like to thank our advisory committee members: Prof. Vinod Vyasulu, Prof.
R S Deshpande, Prof. Sukhpal Singh, Prof. M S Sriram, and Prof. Arnab Mukherjee for
providing us with feedback that helped design and implement the study.

Summary
The Pradhan Mantri Fasal Bima Yojana (PMFBY) is a crop insurance scheme introduced in
Kharif 2016. It is a successor to schemes such as National Agriculture Insurance Scheme
(NAIS), Modified National Agriculture Insurance Scheme (MNAIS), and is a multiple-peril,
yield-based insurance scheme. PMFBY constitutes of new features/innovations, to improve
the demand for crop insurance which has historically been low in India, such as:
a. capping the premium rate paid by farmers
b. employing mobile phone technology for faster estimation of yields
c. integrating enrolment information under one portal
d. greater integration of weather and yield data to better assess losses faced by farmers
In this study, we tried to gain an understanding of how the scheme is implemented, the role
of stakeholders in the implementation process and how farmers view PMFBY. We adopted a
mixed method approach where we employed qualitative instruments such as participant
observation and semi-structured interviews of stakeholders to understand the process in
detail; we analysed scheme-related official data to examine the pattern of enrolment/uptake
of crop insurance and undertook a primary survey and focus group discussions with farmers
in four taluks (sub-district level) in Karnataka to understand their experience of PMFBY.
The study site, Karnataka, a southern Indian state, presents an interesting case because of
its diversity in terms of agro-climatic conditions (10 different zones), number of crops
covered by the scheme (about 40 food and other crops) and also the perils faced.1 In
addition, the state is well-known as reform-oriented and planning to introduce a number of
interventions to improve various components of the scheme to make it viable for the
insurance providers and beneficial to the farmer. One such example is the development of a
portal named Samrakshane which is interfaced with the land records database to facilitate
the identification of famers thereby improving the enrolment and claim settlement process.
On the demand side, farmers were aware that crop insurance existed but not of the various
features of this scheme. The delay in the results of the crop cutting experiments (CCEs) led
to delay in disbursal of claims. This was due to the fact that a large number of CCEs were to
be conducted in the shortest possible time and few results were contested by the insurance
companies. However, enrolment in PMFBY has increased in 2017 over the previous year.
Analysis of primary survey data from farmers indicated that lower premium rates, wide
coverage of crops and faster settlement of claims make this scheme attractive and, if
implemented properly, it has the potential to improve the trust and knowledge about crop
insurance, in addition to resulting in the regular uptake of the crop insurance scheme.
Our findings also suggest that the Department of Agriculture (DoA) has taken a number of
initiatives to improve the implementation of the scheme. The share has a high number of
crops under coverage, has adopted mobile-based technologies and is testing new
approaches to improve the implementation process. However, there are still a few gaps,
1As one of the Government official commented "If a crop insurance scheme can be implemented successfully in
Karnataka, it can be implemented anywhere else in India and also perhaps in the rest of the word" (comment by an official at Department of Agriculture, Government of Karnataka, during Second Advisory Committee Meeting on September 23rd 2017).

such as the reliance on CCEs for yield estimates that involve lengthy processes, lack of
awareness campaigns, high basis risk, and delay in disbursal of claims – all this hinders the
demand for crop insurance. Enhancing the insured area coverage is the key for a sustained
implementation of the scheme. Because of diverse agro-climatic zones and crops covered,
the number of CCEs required is very high and the use of satellite imagery for direct
estimation of crop yields could help reducing CCEs thereby enabling quicker yield estimation
which in turn could help in the faster settlement of claims. Similarly, the improvement of
awareness and a better understanding of its features among the farming community has
potential to enhance the uptake of PMFBY. This intervention has increased the need for the
greater accuracy of various forms of data like the crop sown area or crop productivity; this
improvement of data quality has wider implications for agricultural policy.

Table of Contents
SL. No
Description Page No.
1 Introduction 1
2 Context 6
3 Intervention, description and theory of change 12
4 Monitoring plan 23
5 Evaluation questions 25
6 Evaluation design and data 26
7 Study timeline 32
8 Analysis and findings from the evaluation 34
9 Implication of study findings 72
10 Major challenges and lessons learnt 77
11 Appendices 78

List of Tables
Sl. No
Name of Tables Page No
1.1 Crop Insurance in India - 1979 to 2016 2
2.1 Comparison of India and Karnataka 6
2.2 Monsoon trends over the last five years in Karnataka 7
2.3 Number of taluks declared as drought-affected out of the total 176 taluks in Karnataka
7
2.4 Distribution of farmers who had enrolled for crop insurance by land ownership category
11
3.1 Enrolment in crop insurance across last three seasons (2015-16, 2016-17 and 2017-18), Karnataka state
13
3.2 Number of CCEs to be conducted at different levels 15
3.3 Roles and responsibilities of key stake holders 19
6.1 Distribution of enrolled and non-enrolled farmers in population and sample 31
7.1 Study timeline 32
8.1 Different stages in acceptance of proposal by insurance companies 40
8.2 Average land size by taluks (in hectares) 42
8.3 Percentage distribution of farmers by the number of plots owned 43
8.4 Crops grown 43
8.5 Summary descriptive of outstanding loans per household (in INR) 44
8.6 Risks faced by farmers in study taluks 47
8.7 Adoption of risk management strategies 49
8.8 Source of information about PMFBY 52
8.9 Regression estimates of determinants of enrolment in PMFBY 57
8.10 Regression estimates of willingness to enrol with PMFBY in the next season 59
8.11 Instrumental variable regression estimates of determinants of enrolment in PMFBY
61
8.12 Instrumental variable regression estimates of willingness to enrol with PMFBY in the next season
62

8.13 Motivations to enrol for the PMFBY in the next season 63
8.14 Threshold and average yields and basis error in Haliyal 64
8.15 Threshold and average yields and basis error in Sindhanur 65
8.16 Subsidies, loan waivers and drought relief provided by GoK 69
8.17 Expenditure of DoA, Departments of Horticulture and Sericulture (INR in lakhs)
70

List of Figures
Sl. No
Name of Figures Page No
2.1 Changes in the acreage of agricultural and horticultural crops in Karnataka 8
2.2 NAIS coverage between Kharif and Rabi in Karnataka 10
3.1 Institutions and stakeholders 18
3.2 Theory of change 21
4.1 Methods used to understand the different stages of PMFBY 23
6.1 Sampling strategy 29
8.1 Average years of farming experience 42
8.2 Source of loans 45
8.3 Status of general awareness about PMFBY 53
8.4 Top five crops and top five districts under PMFBY (based on insured crop area)
66
Abbreviations
AIC Agricultural Insurance Company
APL Above Poverty Line
APR Actuarial Premium Rate
AY Actual Yield
BPL Below Poverty Line
CAG Comptroller and Auditor General of India
CCE Crop Cutting Experiments/ Exercises
CCIS Comprehensive Crop Insurance Scheme
DCC District Cooperative Central Bank
DES Directorate of Economic and Statistics
DLMC District Level Monitoring Committee
DLTC District Level Technical Committees
DoA Department of Agriculture

FGD Focus Group Discussions
GIC General Insurance Corporation
GoI Government of India
GoK Government of Karnataka
GIS Geographical Information Systems
GPs Gram Panchayat
ICAR Indian Council of Agricultural Research
ICT Information and Communication Technology
ICV Insured Crop Verification Exercises
IU Insurance Units
KCC Kissan Credit Card
KSNDMC Karnataka State Natural Disaster Monitoring Centre
MFP Minimum Floor Price
MNAIS Modified National Agricultural Insurance Scheme
NAIS National Agricultural Insurance Scheme
NIK North Interior Karnataka
NFSM National Food Security Mission
NHM Non Hindu Minority
NMOOP National Mission on Oilseeds and Oilpalm
NSSO National Sample Survey Organisation
NMSA National Mission for Sustainable Agriculture
OBC Other Backward Caste
OECD Organization for Economic Co-Operation and Development
PACS Primary Agricultural Co-operative Societies
PCIS Pilot Crop Insurance Scheme
PMFBY Pradhan Mantri Fasal Bima Yojana
PMKSY Pradhan Mantri Krishi Sinchai Yojana
RKVY Rashtriya Krishi Vikas Yojana

RRBs Regional Rural Banks
RST Remote Sensing Technology
RTC Records of Rights Tenancy and Crops
SAOL Seasonal Agricultural Operations Loans
SC Scheduled Caste
SIK South Interior Karnataka
SLCCCI State Level Coordination Committee on Crop Insurance
SSI Semi Structured Interviews
ST Scheduled Tribes
TY Threshold Yield
WBCIS Weather Based Crop Insurance Scheme

1
1 Introduction
In India, more than half the population continues to be dependent on agriculture, and about
67% of the all cultivators are small or marginal farmers who own less than one hectare of
land. Further, as in many developing countries, agriculture is highly susceptible to
fluctuations in weather, especially rainfall, which predominantly occurs during the months of
June to September (i.e. Kharif season). Nearly, two-thirds of the cultivated area is dependent
on rainfall; and those under irrigated areas do not have adequate water to undertake
cropping activities during both Kharif and Rabi season continuously (Planning Commission,
2008). The recent years have also recorded lower mean rainfall and higher variability which
has led to natural disasters such as floods, droughts and cyclones (Planning Commission,
2013). The impacts of variations in rainfall are not confined to the Kharif; the amount of
precipitation also has an effect on soil moisture, which in turn has a significant impact on the
growing of the Rabi crops (winter crop). In addition to weather risks, crops are also subject to
other risks such as pests and diseases. These variations in weather and attacks by pests
and diseases can cause considerable crop loss and uncertainty over decisions around
agricultural production which in turn has a direct impact on the lives and livelihoods of a
majority of the country's population.
Historically, crop insurance was largely confined to covering damages due to a single peril
such as hail, offered by private insurance companies and taken mostly by large farmers for
covering non-systemic risks. However, purely commercial insurance of this nature may not
be viable in providing coverage against systemic risks for small or marginal farmers (Mahul
and Stutley, 2010). Multiple-peril insurance programmes, therefore, arose out of the need to
provide coverage against agricultural risks to subsistence, marginal and small farmers in the
1930s. It has since gained popularity across the world, especially in countries across Asia
and Latin America, where a majority of cultivators own less than five hectares (Mahul and
Stutley, 2010)
In India, crop insurance began with coverage of cotton by the General Insurance Corporation
(GIC) on a very small scale during 1972-73. Since then, several crop insurance schemes
have been introduced with significant changes in their features, as provided briefly in Table
1.1, with an objective to increase uptake of crop insurance, stabilise income and provide
security to farmers' livelihoods.

2
Table 1.1: Crop Insurance in India - 1979 to 2016
Insurance Schemes PCIS CCIS NAIS MNAIS WBCIS/RWBCIS PMFBY
Year of Introduction Kharif 1979 Kharif1985 Rabi 1999-2000 Rabi 2010-11 Kharif 2003 (WBCIS)
Kharif 2016 (RWBCIS)
Kharif 2016
Targeted Crops Cereals,
Millets,
Cotton,
potato, and
Oilseeds
Cereals,
Millets, Pulses
and Oilseeds
Food crops, Oilseeds,
Annual
Commercial/Horticulture
crops
Notified
crops, which
will have
CCEs
Major Food crops,
Oilseeds,
Horticulture/commercial
crops
In Karnataka, mainly
horticultural crops are
covered
Notified Major Food
Crops, Oilseeds,
Annual
Horticulture/commercial
crops
Approach Yield-based
Index
Yield-based
Index
Yield-based Index Yield-based
Index and
Rainfall Data
Weather-based Index Yield-based Index and
rainfall data, Also uses
satellite imagery
Target Group Voluntary for
Loanee
farmers
Compulsory
for Loanee
Farmers
Compulsory for Loanee farmers and voluntary for non-loanee farmers
Insurance Company General
Insurance
Corporation
(GIC)
GIC Agriculture Insurance
Company of India
Limited (AIC)
AIC and
empanelled
private sector
insurance
companies
Empanelled companies
by the DoA,
Government of India
(GoI) and selected by
concerned state
government / union
territory (UT).
Empanelled companies
by the DoA, GoI and
selected by concerned
state government / UT.

3
Premium rates 0.80 claim premium ratio
2 percent cereals and millets, 1 percent pulses and oilseeds
Kharif 3.5% for oilseed crops and bajra, 2.5% for other food crops inclusive of pulses, Rabi 1.5% for wheat, 2% for other crops inclusive of pulses and oilseeds
Actuarial premium rates and net premium rates for each notified crop
Actuarial premium Actuarial premium for notified crops: 2% of sum assured for Kharif crops and 1.5 % for Rabi crops. Same rates are applicable for oilseeds. For commercial crops like cotton and other horticulture crops, it will be 5% of the sum assured
Insurance unit (IU) Homogeneous area
Homogeneous area
Scheme provided for reduction of unit to village/gram panchayat (GP)
Unit to be reduced to village / village panchayat (VP) or other equivalent unit for all crops
IU depends on availability of weather stations
GP for Major crops and hobli for minor crops
Note: PCIS - Pilot Crop Insurance Scheme; CCIS - Comprehensive Crop Insurance Scheme; NAIS - National Agriculture Insurance Scheme; MNAIS - Modified National
Agriculture Insurance Scheme; WBCIS - Weather Based Crop Insurance Scheme; RWBCIS - Restructure Weather Based Crop Insurance Scheme; and PMFBY - Pradhan
Mantri Fasal Bima Yojana

4
The PMFBY, introduced in 2016, is a successor to multiple-peril crop insurance schemes
provided in India such as NAIS and MNAIS. These crop insurance schemes are usually
subsidised by the government, providing coverage against production risk during various
stages of the crop cycle.
The PMFBY is operational in 22 out of the 30 Indian states. Like the previous schemes, it
employs an area approach for the calculation of losses due to certain risks. Losses are
assessed on the basis of a yield-based index. The PMFBY tries to overcome some of the
problems faced by previous schemes by:
a. capping the premium rate paid by farmers
b. employing mobile phone technology for faster estimation of yields
c. integrating enrolment information under one portal
d. greater integration of weather and yield data to better assess losses faced by farmers
Karnataka, a southern Indian state implementing the scheme, presents an interesting case
because of the diversity that it has in terms of agro-climatic conditions (10 different zones),
the number of crops covered (about 40 food and other crops)and also the perils faced.
Administratively, Karnataka is also known to be a reform-oriented state and is planning to
introduce a number of interventions to improve various components of the programme to
make the scheme viable for the insurance providers and useful for the farmers. Therefore,
an evaluation of PMFBY in Karnataka has the potential to inform not only this programme
elsewhere but also other large schemes meant for providing security to a large number of
small and marginal farmers dependent on monsoons.
At the moment, both PMFBY and WBCIS offer crop insurance to farmers in Karnataka.
However, both schemes provide insurance for different crops - WBCIS is offered for
horticultural crops (14 crops- Kharif 2017), whereas PMFBY is offered for about 40 crops -
primarily food crops but also covers some horticultural and other crops not covered by
WBCIS. Since the crops covered under WBCIS are horticultural, the scheme is administered
by the Horticultural Department, GoK. On the other hand, the implementation of PMFBY is
largely in the hands of the DoA, GoK.
Further, a cursory examination of the policy-decision on division of crop coverage by PMFBY
or WBCIS suggests that WBCIS generally covers crops for which yield estimation is difficult.
But then it is not always true as it includes some crops for which yield can be measured.
The WBCIS policy was revised in 2016, when PMFBY was launched and is now known as
RWBCIS. Crops such as potato, previously covered under WBCIS, is now under PMFBY.
However, the policy rationale for switching the coverage from WBCIS to PMFBY is not
clearly laid down and needs to be explored further.
This report presents the contexts and findings of a process evaluation aimed at
understanding the operation of the scheme as it exists in Karnataka. Unlike most other
studies on crop insurance, which are either theoretical in nature or examine the impact of a
certain scheme on farmers’ lives, this field-based study employs qualitative and quantitative
methods to understand the processes of the scheme through the experiences and roles of
various stakeholders. It attempts to provide an overview of how the scheme functions, the
challenges, the evolution that has taken place in responding to these challenges and also
the experiences of various stakeholders, especially farmers, who are the primary
beneficiaries of the scheme.

5
The overarching research questions that the study attempts to answer are the following
a. What are the vulnerabilities faced by farmers and the need and rationale for crop
insurance?
b. How does the PMFBY function? What are the operational processes? what are the
design and operational needs of this scheme in particular?
c. What is the socio-demographic profile of enrolled farmers vis-à-vis non- enrolled
farmers?
d. What are the farmers’ expectations from and experience of PMFBY and other crop
insurance schemes?
e. What is the budget allocation made towards this scheme? What does it reveal in
terms of the budgetary priorities of the state?

6
2 Context
Karnataka state is situated in the west central part of peninsular India between 110 31’ and
180 45’ north latitudes and 74012’ and 78040’ east longitudes. It has a geographical area of
191791 sq kms which is about six per cent of the area of the country. The state has 30
districts and 176 taluks (blocks/sub-district level) (Annexure Figure 13.1).
Table 2.1: Comparison of India and Karnataka
Description Karnataka India
Area (lakhs sq km) 1.92 32.87
Population (2011 census) 61,095,000 1,210,570,000
Rural population (%) (2011 census) 61.3 68.8
Literacy rate (%) (2011 census) 75.4 73.0
Cultivators (%) (2011 census) 23.6 24.6
Agricultural labourers (%) (2011 census) 25.70 30.00
Gross irrigated area as % of gross cropped area 34.11 47.62
Per-capita income 2016-17 per annum (constant
prices) in INR. 1,22,306 82,112
Source: Economic Survey of Karnataka 2016-17
Note: Cultivators and Agricultural labourers are calculated as a percentage of total workers.
2.1 Area and Land Holdings
Of the total geographical area of 19.05 million hectares, 16% is under forest, 14% is the land
not available for cultivation (which includes land for non-agriculture usage, barren and
uncultivable land and cultivable waste), six per cent is under permanent pastures and tree
crops. Of the remaining 64% of geographical area, about 10.1 million hectares is under
cultivation and 2.06 million hectares is under fallow land as of 2010-2011. Majority are small
and marginal farmers (76%) who operate around 40% of the total cultivable area. The
average size of the holding has reduced from 3.20 hectares during 1970-71 to 1.55 hectares
during 2010-11(Annexure Table 13.5).The gross cropped area was around 12.2 million
hectares and the cropping intensity was 122.47% during 2014-15.
2.2 Rainfall and Irrigation
Karnataka is highly dependent on the south-west monsoon for agriculture as only 34 percent
of the gross cropped area is irrigated. As mentioned earlier, the state is divided into 10 agro-
climatic zones based on rainfall. A significant proportion of area lies in a dry zone, with a
rainfall range of 450 mm to 890 mm. The northern dry zone covers the largest cultivable
area (25%) followed by the hilly zone (13%), the central dry zone (10%), the eastern dry
zone (9%) and the southern dry zone (9%) (Annexure Figure 13.2). The annual average
rainfall has been experiencing a declining trend. The long-term annual average rainfall
declined from 1399 mm during 1901 to 1970 to 1217 mm for the period 1941-1990 and to
1147 mm for the period 1961-2010. In the recent past, the rainfall has been more erratic
(deviation from the normal) in northern interior Karnataka than in other regions (Table 2.2)
and more than 70 percent of taluks were declared as drought-affected since 2011 (with the
exception of 2014-15 - Table 2.3). The deviation in rainfall recorded in the four prominent
regions of the state is presented in Annexure Figure 13.3.

7
Table 2.2: Monsoon trends over the last five years in Karnataka
Region/State Normal
(mm)
2011 2012 2013 2014 2015
Act
(in
mm)
%
Dev
Act
(in
mm)
%
Dev
Act
(in
mm)
%
Dev
Act
(in
mm)
%
Dev
Act
(in
mm)
%
Dev
SIK2 719 653 -9 538 -25 675 -6 752 5 922 28
NIK3 728 594 -18 519 -29 723 -1 741 2 520 -29
Malnad4 1914 1820 -5 1453 -24 2112 10 1989 4 1620 -15
Coastal5 3451 3464 0 2726 -21 3612 5 3322 -4 2713 -21
State 1155 1061 -8 869 -25 1182 2 1168 1 1008 -13
Source: KSNMDC Annual Report 2015. SIK: South Interior Karnataka, NIK: North Interior Karnataka
Note: Act represents the Actual Rainfall (in mm) and % Dev represents the deviation from the normal rainfall (in percent - rounded to zero decimals)
Table 2.3: Number of taluks declared as drought-affected out of the total 176 taluks in
Karnataka
No of taluks declared
as drought-affected
2011-12 2012-13 2013-14 2014-15 2015-16 2016-17
123 157 125 35 137 139
Source: Economic Survey of Karnataka 2016-17
Note: GoK declares the sub-districts/taluks as drought-affected only if the rainfall deficit is greater than 19 percent of the normal monsoon.
Karnataka has invested around INR 900 billion during the last decade and a half for utilising
the available irrigation potential under the Krishna, Cauvery and Tungabhadra river basins.
The gross irrigated area as a percent of gross cropped area has increased from 16% in 1981
to 34% during 2014-15. The gross irrigated area increased from 1.7 million hectares to 4.2
million hectares during the same period. Canal irrigation accounts for about 33 percent of the
irrigated area while the tube/bore well irrigation accounts for about 40 percent of the irrigated
area. Wells, tanks and other sources constitute the remaining 27 percent (Annexure: Tables
13.7 and 13.8).
2.3 Crops and cropping patterns
Paddy, jowar (sorghum), maize and ragi (finger millets) are the important cereal crops grown
in the state. While the acreage of bajra (pearl millets) and minor millets has been
decreasing, the area under maize has increased over the years. The acreage of cereals
which was 6.27 million ha during 1960-61 has reduced to 5.42 million ha during 1990-91and
then to4.48million ha during 2014-15. Minor millets have paved way for coarse cereals and
the diversity among the cereal crops has reduced (Annexure: Table 13.9). Similar trends
exist for pulses as well. The area under pulses has increased from 1.31 million ha to 3.04
2South Interior Karnataka districts include Bengaluru Rural, Bengaluru Urban, Chamarajanagara,
Chikkaballapura, Chitradurga, Kolar, Mandya, Ramanagara, Tumakuru, Davanagere and Mysuru. 3 North interior Karnataka districts include Ballari, Koppala, Bagalkote, Belagavi, Bidar, Dharwad, Gadag, Haveri,
Kalaburagi, Raichur, Vijayapura and Yadgir. 4Malnad districts include Chikkamagaluru, Hassan Kodagu and Shivamogga.
5Coastal districts include Dakshina Kannada, Udupi and Uttara Kannada.

8
million ha during the period 1960-61 to 2014-15. The area under major pulses such as tur
(red gram) and bengal gram has increased while that under horse gram, green gram, black
gram and cow pea has decreased. Oil seeds acreage has been hovering around 1.3 million
ha and growth has largely been due to greater area under soya bean while areas under
other oilseeds have seen reductions in acreage. Commercial crops such as cotton and
sugarcane have experienced expansion. Of the horticultural crops, fruit and vegetables
acreages have been on the rise while the acreages on plantation and spices have almost
remained constant for the period 2010-11 to 2014-15. Overall, the acreage and diversity of
the cereals has reduced and that under pulses have increased. The share of agricultural
crops during the period has reduced while the share of horticultural crops has increased by
approximately six percent (Figure 2.1).
Figure 2.1: Changes in the acreage of agricultural and horticultural crops in Karnataka
Source: Economic Survey of Karnataka 2016-17
2.4 Crop loans/seasonal agricultural operations loans (SAOL) and agricultural credit
The Kisan Credit Card (KCC), introduced in 1998-99, has been the main instrument for the
disbursement of crop loans in the state. A total of 3.67 million KCCs have been issued with a
credit limit of INR 291.54 million by the end of March 2016. Primary agricultural co-operative
societies (PACS) have issued 60% of the KCCs while the commercial banks and regional
rural banks together have issued the rest. In terms of credit, 34 percent of credit under KCC
is through PACs while the rest is through commercial banks and RRBs (Economic Survey of
Karnataka 2016-17). The cooperatives provides loans up to a ceiling of Rs 3,00,000 without
charging any interest while commercial banks charge 3% interest per annum (after an
interest subvention of 3% by GoI and 1% by GoK for payment within due date) (Economic
Survey of Karnataka 2016-17).
2.5 Risks and vulnerabilities
Studies by the Karnataka Agricultural Price Commission have indicated that about 2.1 million
hectares (21% of the cultivable area) have been kept fallow in the last five years and nearly
61% of these lands belong to small and marginal farmers. Failure of monsoons and lower
productivity are the prominent causes for the land being fallow. Studies also pointed out that
9.6 10.5 10.7 11.2
10.2
1.1 1.3 1.6
1.9 2.0
0
2
4
6
8
10
12
14
1980-81 1990-91 2000-01 2010-11 2014-15
M
i
l
l
i
o
n
H
a
Agricultural crops Horticultural crops

9
returns from the crops become negative for majority of crops if the costs of family labour and
management costs are included (Various reports of Karnataka Agricultural Price
Commission).
In the last decade, there has been an increased investment in irrigation as farmers have
switched to cultivation of commercial crops from subsistence crops. This has resulted in
cultivation of a single crop through different seasons (for example: cultivation of jowar during
Kharif and Rabi continuously) which in turn has led to reduced availability of forage and
fodder for livestock. The latest livestock census in 2012 indicates reductions in the
population of cattle, buffaloes, goats and sheep as well as other livestock since 2007.
Further, this practice has also impacted food security by way of lesser availability of millets
and pulses. Increased access to irrigation, mechanisation and fertilisers have improved
efficiency but also increased risks. In the event of crop failure, the farmers in irrigated areas
are more vulnerable than others because of the higher investments by way of off-farm inputs
used in the production process (like improved seeds, fertilisers, plant protection chemicals
etc).
Rama Rao et al. (2016) assessed the vulnerability of agriculture due to climate change
across the country at the district level using 38 indicators. The results show that the out of
the 115 highly vulnerable districts with low adaptive capacities in the country, Karnataka has
14 districts. These districts are located in the dry zones of the state6 (northern, eastern and
southern). Karnataka is considered the second driest state in India after Rajasthan
(Kalavakonda and Mahul, 2005), with more than seventy-five percent of arable land in
rainfed regions.
2.6 Evolution of crop insurance in Karnataka
Karnataka has been implementing area and yield-based crop insurance schemes since the
1970s. The Comprehensive Crop Insurance Scheme (CCIS) was introduced in 1986.
However, the claim reimbursement ratios have risen after the implementation of the NAIS in
2000. During the early years, crop insurance was not considered effective in smoothing
fluctuations in income, as the optimal conditions to be met for the insurance to create
measurable risk-benefits did not exist in the semi-arid tropics in India (Walker and Singh,
1986 ). This poses further problems for Karnataka with two thirds arid or semi-arid land, 18
out of 27 districts being drought-prone and the fact that even in good rainfall years, 25
percent of all taluks affected by uneven rainfall (Kalavakonda and Mahul, 2005). In general,
the government was unable to settle claims for all the losses reported by farmers, especially
in the Kharif season. Loss ratios have also been higher in the Kharif seasons (Kalavakonda
and Mahul, 2005) (Annexure: Figure 13.4a and 13.4b).
2.6.1. National Agriculture Insurance Scheme (NAIS)
The NAIS, introduced in 2000, was considered to be the world’s largest area yield index
insurance programme at that time (Rao, 2010). The major difference is the fact that NAIS
provided greater coverage than the CCIS which had only included farmers who borrowed
from financial institutions. A perusal of trends in both Kharif and Rabi seasons show very
erratic trends of claims (Figures 2.2).
6 Gulbarga,Raichur, Bijapur,Koppal, Ballari, Gadag, Bagalkot, Chitradurga, Tumkuru,Kolar,Chickballpur, and
Bangalore rural districts.

10
Figure 2.2: NAIS coverage between Kharif and Rabi in Karnataka
Source: NSSO 59th
Round
Note: The two y-axes show cases two different measures, the left-hand axis represents the number of farmers
(000s) covered and who benefitted from NAIS, while the right axis represents the percentage of farmers that
benefitted through the insurance.
What emerges from the analysis of this data is that in certain drought years, the NAIS did
benefit a higher percentage of enrolled farmers, especially in 2003. However, the trends are
not consistent and Rabi coverage especially has been fluctuating from one year to another.
It also seemed surprising that certain years of heavy drought did not show a high number of
farmer coverage and claims ratios (2011, 2012 and 2013 for the Kharif seasons, and 2001
and 2002 in Rabi seasons). Overall, the uptake was low with only six percent of farmers in
Karnataka having ensured their crops as against 12 percent of farmers at the national level.It
is a matter of concern for Karnataka that lesser number of small or marginal farmers have
been willing to use the crop insurance (Kalavakonda and Mahul, 2005). Even among the
large farmers, only four percent of large farmers had their crops insured in Karnataka, which
is much lower than 12 percent observed at the national level (Table 2.4).
0.00%
20.00%
40.00%
60.00%
80.00%
100.00%
120.00%
0
200
400
600
800
1000
1200
1400
NAIS Rabi
Farmers Covered Farmers Benefited Percentage of Farmers Benefitted
0.00%
20.00%
40.00%
60.00%
80.00%
100.00%
120.00%
0
200
400
600
800
1000
1200
NAIS Kharif
Farmers Covered ('000s) Farmers Benefitted ('000s)
Percentage of Farmers Benefitted

11
Table 2.4: Distribution of farmers who had enrolled for crop insurance by land
ownership category
Type of farmer % of farmers that insured their crops (India)
% of farmers that insured their crops (Karnataka)
Small and Marginal 10 5
Medium 18 10
Large 22 4
Total 12 6
Source: NSSO 59th
Round
2.6.2 Weather Based Crop Insurance Scheme (WBCIS)
In 2005, the GoI implemented Varsha Bima (Rainfall Insurance) using rainfall deficits for the
prediction of shortfalls in crop yields, based on notified crops (Singh, 2010). Using rainfall
indicators, the scheme estimates variability in crop yields. This is also more flexible in terms
of timelines and also allowed for faster settlement of claims (Singh, 2010). It is also the first
insurance scheme that allowed for private insurance companies to compete with the
Agricultural Insurance Company (AIC)7 in offering subsidized products. However, the largest
problem facing WBCIS8 is the large level of basis risk due to the areas on which the weather
indicators are based and infrastructural issues such as weather stations which could only
predict rain loss in the areas in which it operates. This meant that if smaller patches of land
are affected by hailstorms or sudden rainfall patterns, it would not be able to avail the
compensation if the rest of the area showcased different weather patterns (Clarke et al,
2012).
2.6.3 Modified National Agricultural Insurance Scheme (MNAIS)
The government modified NAIS so as to increase access to farmers and provide claims
taking localised risks into account by making the IU smaller than that of NAIS. The scheme
began from the Rabi season of 2010-2011.The uptake of the scheme was much higher in
Kharif seasons than in Rabi seasons. This might be a response to the fact that most farmers
in the state are more dependent on the Kharif crop for their major agricultural output in the
year due to better weather conditions. Even with this, large parts of the state have seen
drought during the period of its functioning (2011, 2012, 2013) with 24, 26 and 22 districts
reporting droughts respectively (GoI, 2016) (Annexure Figure 13.5).
7The AIC was formed in the financial year 2002-03 for the improvement of farmers’ needs in the insurance
process. It began taking over from its predecessor GIC post-CCIS and took over the NAIS from 2002-03. It has a more focussed approach towards crop insurance schemes. 8It was implemented in Karnataka in 2006.

12
3. Intervention description and the theory of change
The PMFBY scheme was launched by the GoI on January 13, 2016 and was subsequently
implemented in the Kharif season of 2016. The PMFBY scheme has replaced the NIAS and
MNIAS schemes and currently operates along with the WBCIS scheme9but one does not
cover crops covered by the other. The intervention is similar to NAIS in that it is a national,
multiple-peril insurance programme following a mixture of area and individual approaches.
The main objectives of this programme as stated in the guidelines10 are:
providing financial support to farmers suffering crop loss/damage arising out of
unforeseen events
stabilising the income of farmers to ensure their continuance in farming
encouraging farmers to adopt innovative and modern agricultural practices
ensuring flow of credit to the agriculture sector which will contribute to food security,
crop diversification and enhancing growth and competitiveness of the agricultural
sector besides protecting farmers from production risks.
There has been an increase in the number of farmers enrolled and areas for both seasons
(Table 3.1). First, there has been almost a 40% increase in the number of farmers enrolled
between the 2 successive Kharif seasons under PMFBY (2016-17 and 2017-18). This
increase could have been driven by the prevailing drought conditions especially in North
Karnataka. The drought-like situation may have prompted non-loanee farmers to opt for
insurance in Kharif 2017-18. Second, there is a fourfold increase in farmer’s enrolment in
Rabi 2016-17 (PMFBY scheme) when compared with the previous Rabi season in 2015-16
(NAIS scheme). This is largely because of the PMFBY scheme bringing in additional crops
and areas within the insurance coverage. The higher enrolment in the Rabi season in 2016-
17, relative to the Kharif 2016-17, could be due to the increased level of enrolment drives
undertaken by the DoA to ensure that the farmers enrol, especially after the hardships faced
because of demonetisation. The DoA and local officials collected application forms,
submitted them and extended the cut-off date to ensure that farmers are included under the
scheme. It would be interesting to observe whether a similar pattern emerges for the period
2017-18 as well.
9In Karnataka state, food grains such as paddy, jowar and maize are covered under PMFBY whereas
horticultural / plantation crops such as grapes, pomegranate, arecanut and pepper are covered under WBCIS. 10
http://agri-insurance.gov.in/Pmfby.aspx

13
Table 3.1: Enrolment in crop insurance across last three seasons (2015-16, 2016-17
and 2017-18), Karnataka state
Year Farmers
enrolled
Loanee
farmers
Non-loanee
farmers
Insured
crop area
coverage
Total
amount
insured
% of crop
sown
area
insured* /Scheme (000') (000') (000') (in million
hectares)
INR
million
Kharif season
2017-18/ 1333 572 761 1.80 82210 26.00
2016-17/ 944 744 200 1.20 56090 17.40
2015-16 872 380 492 1.23 30000 17.80
Rabi season
2016-17 / 1168 146 1022 1.68 43030 55.30
2015-16 322 23 299 0.49 6580 16.30
Source: Samarakshane Crop Insurance Portal and Profile of Agriculture Statistics, 2015
Note: The percentage of crop sown area insured is derived by dividing the insured crop area coverage
with the total crop sown area. (2010-15 average total crop sown area for Kharif is 6.92 million
hectares and Rabi is 3.03 million hectares)
The entire implementation of the scheme can be broken up into three stages: pre-notification
and notification, enrolment and claims. The key design features of the PMFBY scheme
based on the PMFBY Operational Guidelines, GoI, Ministry of Agriculture and Farmer’s
Welfare, 2016, at the various stages are as follows:
3.1 Pre- Notification and Notification
PMFBY covers crops grown across Kharif, Rabi and summer seasons. The coverage
includes food crops (cereals, millets and pulses), oil seeds as well as annual commercial
and horticultural crops. The scheme can potentially cover any crop for which past yield data
is available, grown during the notified season in a notified area and for which the yield
estimation based on the required number of CCEs at the notified area level is available. In
Karnataka, a large number of crops have been covered under this scheme. During the Kharif
season of 2016, 40 crops were notified, which was the highest in the country.
PMFBY employs a mixture of an area approach basis and individual approach for the
assessment of crop damage. An area or unit of insurance is a geographical region in which
farmers are assumed to face similar risks. The unit of insurance is a gram panchayat for
major crops and a hobli (cluster of gram panchayats) for minor crops. The unit of insurance
decided by the government for a crop during a season is referred to as notified area. In order
to diversify the risk and cover high/medium/low risk district areas equally, the government
clusters the districts in such a way that each cluster contains a mix of districts with different
risk profiles. The clusters are not necessarily geographically contiguous.
The government calls for bids from empanelled insurance companies (both public and
private) for pre-defined clusters. For each cluster, the insurance companies are required to
quote actuarial premium rates for all district-crop combinations. Then, the company with the

14
lowest actuarial rates of premium wins the bid for that cluster. The L1 bidder is then selected
to act as the ‘implementing insurance agency’ for that particular cluster. For the Kharif
season of 2017, along with the public sector company - AIC, 15 private insurance companies
were invited for bids.
Once the bidding process is completed with the identification of L1 bidder, the notification of
IU-wise crops is issued by the DoA, GoK to enable enrolment. The cut-off dates and the
premium payable by the farmer for each of the notified crops are mentioned in the
notification. District and taluk-level offices issue similar notifications providing the details of
IU-wise crops along with the cut-off dates, invoking dates of prevented sowing and the
premium payable by farmer per acre. Simultaneously, the Directorate of Economics and
Statistics (DES), plans for the CCEs to be conducted for all the crops across different IUs.
3.2 Enrolment of farmers
Once the areas and crops have been notified, the process of enrolment begins. The farmers
usually enrol through banks or PACS. All farmers growing notified crops in notified areas
during the respective seasons are eligible. For farmers availing SAOLs from financial
institutions (known as loanee farmers), the insurance coverage is compulsory for notified
crops whereas the scheme is optional for non-loanee farmers. The feature is similar to
previous insurance schemes such as the NIAS and MNIAS. Sharecroppers or farmers who
cultivate others’ lands are not covered under PMFBY, as the scheme requires submission of
Record of Rights, Tenancy and Crops (RTC) in the farmers' name to be eligible for
insurance coverage and subsequently claim settlements. The bank or insurance official has
to enter all the information pertaining to the loanee/non-loanee farmer enrolled with PMFBY
on the crop insurance portal Samarakshne.
The farmers pay a premium rate based on the sum insured which is decided based on the
scale of finance11for each crop. The estimation of scale of finance is provided in Annexure
Note 12.1. The sum insured for an individual farmer is equal to the scale of finance multiplied
by area of the notified crop proposed by the farmer for insurance. Under this scheme, the
sum insured per hectare is the same for both loanee and non-loanee farmers. The Actuarial
Premium Rate (APR) is charged by the implementing agency. However, the maximum
insurance charges payable by farmers are as follows:
2.0% of sum insured or APR whichever is less for Kharif season and applied to all
food grain and oilseed crops (all cereals, millets, pulses and oilseed crops)
1.5 % of sum insured or APR whichever is less for Rabi season and applied to all
food grain and oilseed crops (all cereals, millets, pulses and oilseed crops)
5% of sum insured or APR whichever is less for Kharif and Rabi season and applied
to annual commercial/ annual horticultural crops.
The difference between the APR and the premium rate payable by farmer as defined above
is treated as rate of normal premium subsidy and is shared equally between the GoI and
respective state governments.
11
Scale of finance is the finance required for raising a crop per unit cultivated area, i.e. acre or hectare

15
3.3 Claims and processes of assessing crop damage
PMFBY covers four types of risks during various stages of the crop cycle:
I. Prevented sowing/ planting risk: no sowing/planting has taken place in the insured
unit due to deficit rainfall or adverse seasonal conditions
II. Standing crop (sowing to harvesting): Comprehensive risk insurance is provided to
cover yield losses due to a variety of both weather and other, non-preventable, risks:
drought, dry spells, flood, inundation, landslides, natural fire and lightening, storm,
hailstorm, cyclone, typhoon, tempest, hurricane and tornado, and pests and diseases
III. Post-harvest losses: Coverage is available only up to a maximum period of two
weeks from harvesting, against specific weather perils of cyclone, cyclonic rains and
unseasonal rains. Coverage is only available for crops allowed to dry in what is
known as cut-and-spread conditions in the field after harvesting
IV. Localised calamities: Loss/damage resulting from identified localised risks of
hailstorm, landslide, and inundation affecting isolated farms in the notified area.
An area approach is employed to assess the first two forms of risks whereas an individual
approach is employed to assess post-harvest losses and localised calamities. However,
certain types of risks are not covered namely war, nuclear risks, malicious damage and other
preventable risks. The threshold yield (TY) or benchmark yield level, is the average yield of
the last seven years, excluding two years of declared calamity, if any, multiplied by the level
of indemnity for that notified crop. The threshold yield in previous schemes such as the NAIS
and MNAIS was based on averages for a shorter period of five years. In Karnataka, only 80
and 90 percent indemnity levels are applicable for rainfed and irrigated crops respectively.
(Government of Karnataka 28/02/2017). In the case of losses due to mid-season adversities,
claims are based on an index which measures the difference between the threshold yield
and the actual yield. The DES conducts the requisite number of CCEs for all notified crops in
all notified IUs in order to assess the actual crop yield for that season.
Table 3.2: Number of CCEs to be conducted at different levels
Serial
No
Unit of Insurance Minimum number of CCEs required
1 District 24
2 Taluk / Tehsil / Block 16
3 Mandal/Hobli/Phirka/Revenue Circle 10
4 Village / Gram Panchayat 4 for major crops, 8 for minor crops
Source: PMFBY guidelines
An area approach is used to assess losses due to prevented sowing. More than 75% of the
notified IU should be unsown for individuals enrolled to be eligible for insurance. An
individual in a prevented sowing IU can receive up to 25% of the sum insured, post which
insurance cover is terminated. In case of adverse seasonal conditions during crop season,
the state government based on meteorological data or satellite imagery or any other proxy
indicators would decide on notified crops/areas which are eligible for a payment. The DoA
and DES regularly monitor the sowing coverage to estimate all crop-related statistics such
as area coverage, crop-wise sown area, production, and others. This data is corroborated
with the data from the Metrological Department to identify the IUs for which prevented
sowing can be invoked. Since the data from DoA and DES is used for official crop area

16
estimation, the insurance companies do not necessarily contest the base statistics used to
determine payout for the prevented sowing cases.
Further, the payments made cannot exceed 25% of the likely claims. The argument is that
farmers incur costs of land preparation, seeds and initial dose of fertiliser application which
may be in the range of 20-40% of the costs depending upon the moisture level in the soil
(rainfall/irrigation). While the payout of 25% of sum insured may not be realistic, given that
farmers would go for some other short-duration crop in the same field (with additional tillage
activity), this may not be very far from reality.
Comprehensive risk insurance is provided to cover yield losses. If the actual yield (AY) per
hectare of insured crop for the IU (calculated on basis of requisite number of CCEs) in an
insured season falls short of the specified threshold yield (TY), all insured farmers growing
that crop in the defined area are deemed to have suffered shortfall and the claims payout is
calculated as per the following formula:
Post-harvest losses and localised risks on an individual farm basis is applicable only if the
farmer informs the insurance company/concerned bank/local agricultural department/district
officials within 48 hours after the insured peril has occurred. When the affected area is
limited up to 25% of the total insured area, the losses of eligible farmers are assessed on an
individual farm basis by loss assessors appointed by the insurance company.The
appointment of loss assessors should be within 48 hours from receipt of information and the
loss assessment is to be completed within the next ten days. On the other hand, when the
affected area under a notified crop is more than 25% of the total insured area, all enrolled
farmers are eligible for claim settlements. In both cases, the loss is jointly assessed by a
team comprising of a loss assessor appointed by the insurance company, a block level
agriculture officer and the concerned farmer.
The percentage of post-harvest loss is estimated by the insurance company conducting a
sample survey of the affected area. Subsequently, if the claim related to shortfall in yield
(based on CCEs) is more than the claims of post-harvest losses, only the difference in
claims would be payable to affected farmers.
Use of technology for better estimation of crop yields
Mobile phone technology has been used to record and upload CCE data. This is one of the
important innovations of this scheme. An android-based mobile application has been
developed for recording and transmitting CCE data using smart phones. This allows for
improved data quality (geo-tagging, time stamping, photos and videos), immediate data
transfer to the central crop insurance portal and hence availability of real time CCE data to
both government officials and insurance companies. The geo-tagging/recording of plot
coordinates ensures that the plot chosen for conducting the CCE by the primary worker
matches with DES’s CCE plan. The mobile application has been designed in such a way that
it works in both online and offline modes. The data transmitted by the smart phone includes
crop area, probable harvest date, net weight of the produce obtained, photos and videos of
whole field / selected plot, harvesting and weighing of wet yield.12
This information, when transmitted to a centralised server, is expected to lead to faster
compilation of data and quicker verification and settlement of claims. There is also an
12
Detailed methodology is available at - http://des.kar.nic.in/ (crop insurance scheme/CCE Methodology)

17
increased emphasis on the need for adoption of innovative technologies such as remote
sensing technology (RST), drones and geographic information system (GIS). It has been
reasonably proven that satellite imagery can help in demarcating the cropped areas into
clusters on the basis of crop health in areas with low cloud cover and other similar
impediments. The Mahalanobis National Crop Forecast Centre (MNCFC) is currently
working on the KISAN project13. The objective of this research project was to use high
resolution remote sensing imagery for planning of CCEs and improving yield estimation,
especially for a few long-standing crops (such as paddy, jowar and cotton) and in selected
areas/districts with low cloud cover. A study from MNCFC reported successful use of remote
sensing-based crop stratification in selection of the CCE plots for rice grown in the Kharif
season in Seoni district, Madhya Pradesh. One of the findings from this study was a high
correlation between remote sensing-based indices and yield values at the block level.14
Similarly, district-level yield estimation models using remote sensing-based indices have
also been developed for sugarcane and cotton15.
PMFBY also favours an increased applicability of information and communications
technology (ICT) tools for farmer enrolment, database management of historical crop yield
and integration with land records, loss assessment and claims settlements. According to the
guidelines, the emphasis on ICT is to make these mechanisms more efficient, transparent
and farmer-friendly. These, in turn, could improve the trust in the insurance product, thereby
increasing its demand from farmers.
Having said that, the use of technology also led to certain issues such as (i) primary workers
choosing the “single-picking” option in the CCE mobile app for a multi-picking crop which
resulted in insurance companies contesting the CCE data; (ii) Primary workers erroneously
entering incorrect plot size option-for example a 10*5 plot was chosen instead of 5*5 for
crops such as cotton, castor, sunflower and tur; and (iii) lack of a standard protocol requiring
insurance companies to authenticate the CCE data within a fixed time period which resulted
in insurance companies contesting the CCE data at the time of claims settlement. Lack of
appropriate training and procedural challenges led to CCEs being contested by insurance
companies and subsequent delays in disbursement of claims.
13
Crop Insurance using Space technology and geo informatics - http://www.ncfc.gov.in/kisan.html 14
http://www.ncfc.gov.in/download.html – Use of remote sensing for CCE Planning by Sunil Kumar Dubey 15
http://www.ncfc.gov.in/download.html – Role of Technology in PMFBY by Shibhendu S Ray

18
Institutions and stakeholders
Figure 3.1 provides a snapshot of stakeholders at various levels and Table 3.3 provides the
details of their responsibilities.
Figure 3.1: Institutions and Stakeholders

19
Table 3.3: Roles and responsibilities of key stake holders
Stakeholders
Phases
Department of Agriculture Directorate of Economics and Statistics (DES)
Insurance Companies Banks/Primary Agricultural Cooperative Societies
(PACS)
Pre-Notification 1. Acts as Secretariat to the SLCCCI
2. Finalising the calendar for implementation of
PMFBY
3. Formation of clusters (based on risk levels and
coverage)
4. Identification of IUs across the state for
different crops and seasons
5. Finalising the crop-wise indemnity levels and
sum insured
6. Estimation of targets for crop-wise coverage
across seasons
7. Tendering process - invitation of bids,
evaluation of bids, finalising important clauses
(term sheets) and selection of insurance
agencies across different clusters
1. Finalisation of crop wise acreage
estimates (enumeration) across IUs –
for previous year and sharing it with
DoA
1. Submitting bids(
actuarial premiums for
different crops/clusters)
2. Negotiation of term
sheets/clauses relating
to implementation of
PMFBY
1. The District Central co-
operative banks provide
the scale of finance for
different crops based on
the advice of DLTC16
which is in turn used to
arrive at sum insured (
and premium) for different
crops
Notification 1. Issuing of notification containing IU-wise crops,
indemnity levels, actuarial premium rates, sum
insured, premium to be paid by farmers and the cut
off dates for enrolment
2. Instructions to DLMC for publicity and
facilitation of enrolment
3. Ensure the uploading of notification details on to
the Samrakshane portal
1. Prepare plan for conducting CCEs
2. Finalisation and training of primary
workers and supervisors
1. Plan to witness the
CCEs
16
District Level Technical Committees (DLTCs) comprise DCC bank officials, experts from agricultural department and universities and farmer representatives who decide on the scale of finance for different crops in the district.

20
Stakeholders
Phases
Department of Agriculture Directorate of Economics and
Statistics (DES)
Insurance Companies Banks/Primary Agricultural
Cooperative Societies
(PACS)
Enrollment 1. Publicity campaign (banners, pamphlets,
announcements etc)
2. Monitoring of enrolment through SLCCCI and
DLMC
3. To invoke the prevented sowing notification
based on proxy indicators from KSNDMC
1. Distribution of application
forms for facilitating
enrolment
1. Facilitate enrolment17
through registration on the
Samrakshane portal.
2. Maintain hard copies of
the application
3. Verify application-related
documents
Claims (post
enrolment phase)
1. To invoke the prevented sowing notification
based on proxy indicators from KSNDMC
2. Generate IU-wise , crop-wise shortfall in yield
based on CCE data
3. Initiate claims payable based on shortfall in
yield and share it with insurance companies for
further processing of claims
4. Mediating claims/CCE related disputes and
resolving the same (through SLCCCI)
5. Monitoring the claims settlement and reporting
to government
1. Conduct the CCEs as planned
2. Enumeration and reconciliation of crop
wise sown area statistics
3. Sharing results of 1&2 with Dept of
Agriculture
4. Provide additional data on CCEs /
sown area to support resolution of
claims disputes
5. Overseeing the Insured Crop
Verification (ICV) exercise in case of
insured area for a notified crop
exceeding the estimated crop sown
area.
1. Acknowledge the
applications/insurance
proposals received by
banks/other sources
along with the receipt of
premium paid by the
farmers
2. Witness CCEs and
contest the same in case
of discrepancies being
observed.
3. Verify the claims payable
and settle the claims
( directly to the farmer)
1. Intervene in case of
discrepancies related to
bank accounts and online
transfers ( if needed)
17
In few places, GPs were also involved in enrolment. From 2017-18, citizen service centers are also entrusted to serve as enrolment centers.

21
3.4 The Theory of change
The theory of change as envisioned by the programme is similar to that of any crop insurance
programme targeted at small and marginal farmers. The goal is to ensure sustainable
livelihoods and lives for individual farmers and also the agricultural sector as a whole. Any crop
insurance scheme tries to mitigate the uncertainty faced by farmers. The immediate outcomes
of a decrease in uncertainty are a decrease in production risk, increase in greater savings and
increased efficiency in the estimation of yields. On the financial side, greater savings are said to
lead to moving away from informal sources of credit, greater financial inclusion and hence
income stability and a decrease in indebtedness. This in turn should lead to higher investments
in education and health and a higher resilience against shocks. On the production side, the
decrease in production risk is assumed to lead to an increased investment in agriculture and
more sustainable cropping patterns. The final outcomes should be a decrease in agricultural
distress, increased competiveness and sustained growth of the agricultural sector.
Figure 3.2 Theory of Change
Increased uptake of insurance
Reduces production risk
Stabilizes
income/decreases
indebtedness
Increased
Investment
Greater resilience
against shocks
Investment on Health
and Education
Greater savings
Sustainability
Cropping
patterns
Better data
Faster disbursal
Number of crops
Notified
IU ( basis risk)
Income
Source: Adapted from The effectiveness of index-based micro-insurance in helping smallholders manage weather related risks, Cole et al. 2012
The PMFBY attempts to increase insurance uptake among farmers by decreasing the cost of
insurance by capping the premium rate. Technology is being employed for faster and better
estimation of yields. Online enrolment attempts to integrate data on farmers enrolled and land
records, and also provide greater accessibility. Previously, it was possible to enrol the same plot
of land for insurance at different PAC's or banks. Financial institutions could not check whether
a plot of land had been previously insured. The integration of land records and information
under one portal (Samarakshne) has enabled prevention of the same farmer with the same RTC
enrolling more than once. This has reduced the problem of duplicity of enrolment where the
insurer could not identify if a plot/land was already insured or not.

22
Faster and greater accuracy of the estimation of yields should hasten the disbursal of funds; this
in turn should stabilise farmers’ income. We postulate that stabilising farmers’ income has
intergenerational impacts. For example: farmers in Haliyal (one of the four taluks studied)
suggested that crop failures often lead to family migration to urban areas, which could result in
the discontinuation of their children's education (Deshingkar and Akter, 2009; and Dyer, 2012),
often even leading to their engagement in child labour.

23
4 Monitoring plan
The PMFBY process was broken up into different stages, as mentioned before. The likely
outcomes for each stage and methods employed to understand those are illustrated below.
Figure 4.1: Methods used to understand the different stages of PMFBY
The sources of information used to examine respective outcomes have been mentioned next to
the outcome of interest at each stage of the process. It is clear that the use of multiple methods
has helped in covering feedback from diverse stakeholders.
Outcomes and the theory of change:
budget outlay, policy (Budget data GoK, SLCCCI guidelines)- sustainability of the
intervention and overall likely impact on the agricultural sector
implementation fidelity (PMFBY guidelines, Participant observation) - likely impact on the
uptake of insurance
crops notified and clusters formed- risks covered- potential for stabilising incomes
problems and resolution of these in previous seasons (Participant observation) (SSI) -
sustainably of the intervention
Post-Enrolment Claims
Outcomes examined
Actual experience of
different stakeholders
(SSI)
Estimations of yields
Basis risks (GOK
information)
Speed of claims
disbursed (FGD,
Survey of farmers)
Problems faced
in the
implementation(SSI)cla
ims ratio (GoK
document review)
Enrolment
Outcomes examined
Awareness drives
(SSI, Participant
Observation)
Enrolment across
districts
(Samraskhane)
Problems faced in
the implementation
(SSI, Participant
observation)
Notification and Pre-notification
Outcomes examined
Budget outlay, Policy
(Budget data, GoK,
SLCCCI guidelines)
Implementation fidelity
(Guidelines PMFBY-
Participant observation)
Crops notified and clusters
formed,
(GOK notifications,
Samrakshane website)
(SSI)
Problems and resolution of
these in previous seasons
(Participant observation)
(SSI)

24
Awareness drives (SSI, Participant Observation)
Enrolment across districts (Samrakshane)- Number of people impacted, patterns across
the state, risk profiles across the states
Problems faced in the implementation - data requirements - potential for the programme
(SSI, Participant observation)
Post-enrolment claims
Actual experience of different stakeholders (SSI) - ease in implementation - perceptions
of trust and impact on farmers lives
Yield estimation
Basis risks (GOK information)
Speed of claims disbursed (FGDs, Farmer surveys)
Problems faced in the implementation (SSI) and claims ratio (GoK document review)

25
5 Evaluation Questions
This report presents the findings of the process evaluation of the PMFBY implemented in
Karnataka. Our primary objective was to understand the role and responsibilities of
stakeholders, processes of implementation and challenges faced uptake of insurance, farmers’
experience of PMFBY and the ability of the scheme to reduce vulnerabilities associated with
crop loss. The primary questions examined were as follows:
a. What are the design, rationale and operational details of this particular scheme?
b. What are the roles and responsibilities of different stakeholders, including government
officials, banks and other financial agencies such as the insurance companies?
c. What are the profiles of enrolled and non-enrolled farmers (profiles of farmers covered in
terms of socio-demographic and other household characteristics; size of holdings, household
income, dependence on agriculture as livelihood, previous use and experience of
agricultural/crop insurance)?
d. What are farmer perceptions regarding the need for crop insurance, their expectations and
experiences of this programme?
e. What are the implementation challenges and how different are these compared to previous
insurance schemes?
f. In what ways might the design and operational barriers be addressed to enhance the uptake
of the scheme by the most vulnerable? Has the scheme helped in enhancing the security and
reducing vulnerabilities associated with crop failure?
g. What is the size of public expenditure for this scheme and how different it is from earlier
schemes? How does it relate to the total public expenditure on agriculture and how has it
impacted the budget for agriculture in Karnataka?

26
6. Evaluation design and data
A mixed method approach was undertaken for a comprehensive evaluation of the PMFBY
scheme. The scheme involves several stakeholders with varying levels of roles and
responsibilities. To understand the processes at the state, district and local administrative
levels, we adopted qualitative methods such as participant observation and semi-structured
interviews with key stakeholders. To undertake participant observation, a researcher was
assigned to work at the DoA, GoK, to focus on understanding the implementation process,
negotiation of rules (or guidelines) provided in the scheme, interactions with different
stakeholders and the processes adopted to realise the actual objectives of the scheme. This
also facilitated in developing stronger relationships with government officials at various levels.
Next, we developed semi-structured interviews for officials from insurance companies, nodal
banks (commercial or rural regional banks), officials from the DoA, the Horticulture Department
and the SLCCCI to understand approaches/measures adopted and challenges faced in
implementing the scheme.
To understand farmers' experiences, we undertook a primary survey in four taluks namely
Haliyal, Sindhanur, Shirahatti and Naragund. In addition, we conducted focus group discussions
(FGDs) with farmers to understand the experiences of crop loss and its consequences, risk
management strategies, implementation processes, challenges faced during the entire process
and perception of benefits derived from PMFBY. In each taluk, FGDs with a minimum of ten
participants were conducted, translating to 16 FGDs in all. The following sub-sections provide
details of the sampling frame, sampling strategy and weighting strategy adopted by us. Details
of monitoring mechanisms adopted are provided under Annexure Note 12.2.
In addition, we used datasets such as Samrakshane containing enrolment and claim details,
Bhoomi data containing details of land ownership, Agriculture Census (2011) to understand the
distribution of farming households at the gram panchayat level and Status of Agricultural Farmer
surveys from National Sample Survey Organization (NSSO) to understand the level of
enrolment in previous schemes at the state and national levels.
6.1. Sample Selection
Sampling Frame
In this section, we begin by discussing the relevance of ensuring variation by season (Kharif /
Rabi), choice of crops and water source (irrigation/rainfed) in cultivation to develop the sampling
frame for our primary survey. In terms of season, the percentage of area cultivated and
production in Kharif was about 60 and 70 per cent respectively for the year 2012-2013.18 Our
analysis indicated that maize, rice, jowar and gram were the top four crops in terms of area
under production in Karnataka in 2013-2014 (Refer Annexure Table 13.10).19 These crops are
predominantly cultivated during the Kharif season. Further, there is significant enrolment in
PMFBY scheme in both Kharif and Rabi 2016 where 1.6 million and 1.7 million respectively
18
Source: http://raitamitra.kar.nic.in/Karnataka%20State%20Profile%202013.pdf (accessed on May 20th 2017). Similar patterns were observed for 2010-2011 and 2011-2012 during which time period the area cultivated and production in Kharif accounted for 65 and 75 per cent (approximately) of the total area cultivated and production in
Karnataka. 19
Similar patterns were observed for the time period 2011-2012 and 2012-2013.

27
(Annexure Table 13.11). We decided to cover one Kharif season and one Rabi season for our
primary survey to capture the variation in crops grown, risk exposure, expenditure, and crop
insurance by season.
In terms of enrolment in PMFBY, paddy accounts for 18.09 per cent of total enrolled farmers
during Kharif 2016; and jowar accounts for 43.46 per cent of total enrolled farmers during Rabi
2016 (Annexure Tables 13.12-13.14). Hence, we identified paddy and jowar crops for the Kharif
and Rabi seasons respectively for our primary survey. Both these crops have high levels of
enrolment in PMFBY in both irrigated and rainfed farms. But about 82 per cent of enrolled
farmers belong to those dependent on rains and 13 per cent of enrolled farmers are dependent
on irrigation.20 Similar patterns are observable for insured areas. This is understandable as the
probability of crop failure is expected to be higher for farmers dependent on rains, especially
given the severe drought in recent years in Karnataka. On the other hand, irrigation can by itself
serve as a risk-mitigating strategy adopted by farmers, with different type of risk exposure,
expenditure and reasons for taking up PMFBY. It was then important to cover both irrigated and
rainfed farmers.
We made use of agro-climatic zones to demarcate taluks (sub-district level) where farmers were
dependent on rainfed and irrigation water sources. Using the enrolment data, we were able to
identify taluks where the enrolled farmers were dependent on irrigation to cultivate a crop, say
jowar, falling under an agro-climatic zone; and similarly, another set of taluks where the enrolled
farmers were dependent on rain to cultivate the same crop but falling under a different agro-
climatic zone. This ensured that we were not faced with farmer-specific unobservable factors
such as risk-taking ability, motivation, and other factors which can render interpretation of our
estimation results difficult.
In addition to this, we ensured that the potential taluk list had at least 15 farmers enrolled in a
minimum of 14 gram panchayats, which was the IU, to be able to interview 10 enrolled farmers
and five non-enrolled farmers. Once the potential taluks were identified, we then ensured
through agriculture experts that the selected taluks were predominantly either rainfed or
irrigated.
Sample determination:
Our calculations indicated that we required a sample of 405 farming households to be able
estimate the uptake with a desired margin of error of five per cent and confidence interval of 95
per cent. The analysis of enrolment data for both Kharif and Rabi in 2016 indicated that the
probability of uptake of crop insurance was approximately 20 per cent in Karnataka.21 Given
this, we assumed a design effect of 1.5 per cent with an intra-class correlation of four per cent
and a response rate of 91 per cent which meant 405 farming households to be interviewed for
20
Note that the type of irrigation for 4.43 per cent of enrolled farmers was not available. 21
During Kharif in 2016, 1606710 farmers enrolled for the PMFBY scheme, approximately 20.51 per cent of farmers in Karnataka. During Rabi in 2016, 1731952 farmers enrolled, approximately 22.11 per cent of farmers in Karnataka. The total number of farmers was sourced from the Agriculture Census (2010-11).

28
each crop.22 We multiplied this by two to arrive at the final sample of 810 since we wanted to
cover paddy and jowar crops. The steps used in the calculation of sample are given below:
Step 1: Input the relevant figures to arrive at the required sample ("n") in Equation 1
--------------------------------- (Equation-1)
n = 246
Step 2: Assuming a design effect of 1.5 per cent with 15 respondents per gram panchayat, and
a response rate of 91 per cent
Sample size (N) per crop = (DEFF *n)/(Response rate) --------------- (Equation-2)
N = 405
Step 3: Multiplying by three to arrive at the final sample size for paddy and jowar.
Final Sample size (FS) = N*2----------------------------------------------- (Equation-3)
FS = 810
Sampling strategy:
The sample requirement of 405 farmers per crop, where 10 enrolled farmers and five non-
enrolled farmers are to be interviewed per GP, translated into the need for the survey to be
conducted in 27 GPs for each crop. The 27 GPs were stratified into 14 where farmers were
dependent on rains and 13 where they were dependent on irrigated sources, each with at least
15 enrolled farmers to allow identification of ten.
We examined the enrolment data for paddy for Kharif in 2016 and jowar for Rabi in 2016 to
identify the taluks for our survey (Annexure Table 13.15 and 13.16 respectively). Within a taluk,
we randomly selected the required number of gram panchayats (14 for rainfed and 13 for
irrigated). Within a GP, we randomly selected the 10 enrolled farmers using the Samrakshane
dataset23 and five non-enrolled farmers through a listing exercise. Figure 6.1 presents the
sampling strategy.24
22
We scanned the extant literature, especially research conducted in Karnataka, on the intra-cluster correlation but did not find any relevant studies. Also, our experience from the dipstick study was suggestive of high similarity in responses, especially related to experiences about PMFBY, among farmers in a village. Given this, we decided that a high ICC of 4 percent, even though conservative, would provide us with enough sample population to facilitate the estimation process. 23
The dataset maintained by the DoA, GoK, provides information at the individual farmer-level on economic status, area insured and so on. 24
In our selection of taluks, we ensured that the exclusion of GP due to the condition of minimum 15 farmers enrolled for crop insurance is kept to the minimal, so as to not bias the sample. Fortunately, we did not have to exclude more than three GPs by selecting the taluks - Haliyal and Sindhanur for paddy, and Shirahatti and Naragund for jowar.

29
Figure 6.1: Sampling Strategy
Note: NET - North eastern transition zone; NED - Northern dry zone; ND - Northern dry zone; and NT - Northern
transition zone.
Challenges faced in the field
The fieldwork was planned on the basis of geographical proximity of taluks, weather conditions
and availability of farmers. For selection of the sample respondents, we made use of the farmer
name, survey number (unique to each plot and assigned at the time of registration), and name
of the farmer's father (or husband in the case of female land owner). These set of variables
facilitated in the unique identification of pool of enrolled farmers, which was then randomised to
arrive at the sample list of enrolled farmers.
The major challenge was identification of non-enrolled farmers. Here, we explored the definition
of enrolled farmers - do we consider farmers who had submitted their application as enrolled or
only those whose proposal has been successfully approved by the insurance company? As
explained earlier, enrolled farmers were selected from the Samrakshane dataset, which
contains names of farmers whose insurance proposals have been accepted by insurance
companies. In addition, information about whether or not they are enrolled in insurance is not
communicated to all the applicants. These two factors led to the applicants claiming that they
were enrolled, even though their names were not actually in the list. Second, farmers had
entrusted their relative/friend/trusted village member to enrol them in the insurance but did not
2 Crops = 810 farmers (405 farmers per crops)
Kharif
Paddy
Haliyal Taluk (Rainfed / Hilly
zone)
14 Gram Panchayats
Sindhanur Taluk (Irrigated
/ ND Zone)
13 Gram Pancahayts
Rabi
Jowar
Shirahatti Taluk (Rainfed
/ NT Zone)
14 Gram Panchayats
Naragund Taluk (Irrigated
/ ND Zone)
13 Gram Panchayats
15 Farmers stratified by enrolment status
(10 Enrolled: 5 Non Enrolled) per Gram
Panchayat

30
have any proof such as an acknowledgement slip to validate that their application had actually
been submitted online. Our interaction with a few entrusted parties indicated that they had in
turn submitted the proposal to the intermediaries such as Primary Agriculture Cooperative
Societies (PACS), gram panchayat (GP) and bank officials. Since bulk of the applications were
submitted to the intermediaries during the last week of enrolment, the lack of human and
physical resources at the local level25 resulted in critical details such as survey number, name,
bank account, and crop insured being entered inaccurately and, at times, proposals being
overlooked/missed completely. Another case included applications being submitted after the
enrolment deadline, leading to rejection by the insurance company. In sum, these set of farmers
were not enrolled under PMFBY. Finally, there was also the possibility of farmers claiming to
have enrolled hoping that then they would also be eligible for insurance benefits.
Given these observations, we concluded that it would be difficult for the survey team to identify
the non-enrolled on the basis of self-reporting during the listing exercise. To resolve this
problem, we undertook several steps starting with defining enrolled farmers as those who have
grown the notified crops and had their proposals accepted by the insurance company and
reflected in the Samrakshane dataset; and non-enrolled as who have grown the notified crops
but either did not apply for crop insurance or their proposal was not accepted by the insurance
company and not reflected in the Samrakshane dataset. Using this definition, we identified non-
enrolled farmers by comparing the survey numbers in the Samrakshane with those in Bhoomi
(digitised land records) dataset. The survey numbers which did not appear in the Samrakshane
dataset and also of not the same name as the enrolled farmer were identified and collated for
the list of non-enrolled farmers. This list was then used to randomly select non-enrolled farmers
for the survey. The survey team still faced difficulty as the selected respondents were not
necessarily concentrated in one location and many of these farmers had grown crops other than
the notified crops. Given the project deadline, the sampling strategy was revised and we
sampled 10 enrolled farmers in all the selected gram panchayats and 14 non-enrolled farmers in
five of the selected gram panchayats.
6.2. Final sample dataset and weighting strategy
Our response rate was about 96 percent, where 781 respondents had completed of the survey
out of the total 810 farming households. However, an initial examination of the data showed that
about 11 percent of the respondents had claimed that they had grown crops during the listing
process but had not grown crops at all in the desired season. We had to remove these
observations from our dataset thereby bringing down our response rate to 85 percent. The
sample distribution is close to our desired ratio of 2:1 of enrolled and non-enrolled farmers and
similar to the distribution observed in taluks where farmers are dependent on rains (Haliyal and
Shirahatti); whereas this distribution is swapped with majority being non-enrolled in taluks where
farmers are dependent on irrigation sources (Sindhanur and Naragund) (Table 6.1).
25
In all the GPs, only one person was responsible for entering all the applications as there was only one computer system available. There were also other infrastructural challenges such as internet availability, processing time of the Samrakshane website where the applications are to be submitted and loss of power supply.

31
Table 6.1: Distribution of enrolled and non-enrolled farmers in population and sample
Taluk
Population in GPs
selected for survey
Sample
[Unweighted] Sample [Weighted]
Enrolled Non-
enrolled Enrolled
Non-
enrolled Enrolled
Non-
enrolled
In absolute numbers
Paddy - Kharif
Hailyal 5,544 3,108 140 38 3708 3708
Sindhanur 2,406 13,814 107 60 13101 13101
Jowar - Rabi
Shirahatti 8,509 2,901 118 61 5868 5868
Naragund 6,745 5,810 110 56 3766 3767
Total 23,204 25,633 475 215 26,443 26,444
In [row] proportion
Paddy - Kharif
Hailyal 0.64 0.36 0.79 0.21 0.50 0.50
Sindhanur 0.15 0.85 0.64 0.36 0.50 0.50
Jowar - Rabi
Shirahatti 0.75 0.25 0.66 0.34 0.50 0.50
Naragund 0.54 0.46 0.66 0.34 0.50 0.50
Source: Primary Survey Data
We then devised a weighting strategy such that the responses from enrolled and non-enrolled
farmers in each taluk lend themselves to statistical tests, incorporating adjustments for the over-
sampling (under-sampling) of enrolled (non-enrolled) farmers to be able to yield reliable
inferences about our population of interest. In addition, we accounted for the probability of
selection of GPs, probability of selection of enrolled/non-enrolled farmers and correct for the
response rate to arrive at the final weights. The formula to arrive at the probability weights is
given below:
j represents the gram panchayat, first component constitutes the probability of selection of GPs
with `g' representing the number of GPs selected for the survey and `G' the total number of
GPs. The second component constitutes the probability of selection of enrolled/non-enrolled
farmers where `n' represents the total number of enrolled/non-enrolled surveyed to total number
of enrolled/non-enrolled in the population. The third component is the correction factor for non-
response rate, arrived by dividing the desired number of respondents (`dn') by completed
number of households. The final component is the adjustment factor26where responses from
enrolled farmers are weighted by a factor of 0.33 and non-enrolled farmers by a factor of 0.67.
26
The adjustment factor weights the responses from enrolled farmers by a factor of 0.33 and non-enrolled farmers by a factor of 0.67. This was undertaken to ensure that the over-sampling of the enrolled farmers and their responses do

32
7 Timeline
Table 7.1: Study timeline
Activities February March April May June July August September October
Finalization of tools
Literature review
Primary survey (includes development of tools and selection of GPs)
Farmers meetings
Meeting with implementation agency personnel
Scheme data analysis
Secondary data analysis
Semi structured interviews
Primary data analysis
Budget analysis
Consolidation of report
Proposal for phase II
Submission of report and proposal for phase II
While there have been no real adverse events, the process of winning the trust of various
stakeholders involved in implementing the scheme has been a drawn out process. The
suggestion of the Agricultural Commissioner to have a research assistant working in the Crop
not bias the overall findings and interpretation. To explain, the adjustment factor ensures equivalence between the enrolled and non-enrolled sample farmers to enable tests such as t-tests to understand whether or not the enrolled and non-enrolled farmers land ownership (in hectares) is statistically different. Without the adjustment factor, the estimation of responses may be biased purely because of the over-sampling of the enrolled farmers.

33
Insurance Department was useful, both in understanding the day-to-day functioning of the
scheme as well as evolution of the policy guidelines that govern the programme. However, the
research assistant was placed in the Department only in May 2017.This helped in providing us
with daily observation of the implementation process. In addition, it also played a major role in
allowing us to access various forms of data that were critical in understanding not just the
scheme but also in planning the study design for the primary survey. However, this delayed our
primary survey by a month or two.
In the field, contrary to our expectations, it became difficult to identify non-enrolled farmers in an
insured unit. We therefore had to look for other forms of data to help us validate the fact that a
farmer is indeed not enrolled. Obtaining this data again took time and led to further delays in the
time line. However, this entire process allowed us to build the links that are necessary for
obtaining data that helped us in refining the design. Another problem that we faced in our
dipstick study was the presence of multiple schemes for input subsidy and drought relief which
were also paid to farmers directly through their bank accounts, leading to farmers being
confused about which scheme the surveyors are talking about.Therefore, we spent long hours
in training field investigators before the primary survey to accurately establish that they were
actually obtaining information about the right scheme.

34
8 Analysis and findings from the evaluation
8.1 Sample characteristics
The majority of the respondents in every taluk were male and Hindus (Annexure Table 13.17
and 13.18). In Haliyal, Shirahatti and Naragund, the minority community (including Jains and
Muslims) constitute about 10 percent of the non-enrolled population. An examination of the
distribution of respondents by caste (Annexure Table 13.19) indicates that about 20 percent of
the non-enrolled belong to SC/ST/non-Hindu minority in Haliyal, Shirahatti and Naragund. Only
in Sindhanur, the proportion of enrolled farmers belonging to these marginalised communities
was the same for both enrolled and non-enrolled (about 23 per cent) farmers. Though BPL
ration cards were the most-used cards for both groups, enrolled households generally had a
higher proportion of users in almost all taluks except Haliyal. Universally, Antyodaya (the
poorest) cards were used marginally more by non-enrolled households which show that often
non-enrolled households belonged to either minority or economically vulnerable groups
(Annexure Table 13.20). This could be a product of their social circumstances, fear to move
outside their caste networks and the need to stay within the protection of the aids from it
(Munshi and Rosenzweig, 2009). Third, in terms of education and dependency, except for the
case of Haliyal, where about 80 percent of non-enrolled are illiterate, the distribution of educated
farmers among enrolled and non-enrolled primary respondents is similar. (Annexure Table
13.22)27.
Enrolled primary respondents were also more likely to be involved in paid or compensated
labour in Haliyal as compared to non-enrolled farmers who are more likely to be working in
unpaid labour (Annexure Table13.24). Further, about 90 per cent of spouses are engaged with
uncompensated work across all the four taluks (Annexure Table 13.25). The dependency of
children, parents and siblings on compensated labour varied widely from taluk to taluk.
However, such participation showed that in most cases, irrespective of being enrolled or non-
enrolled in PMFBY, households have created their own method of risk management either
through consumption or external insurance policies where more members are engaged with
other work and providing secondary incomes (Rosenzweig, 1988). Enrolled households were
more likely to depend on the sale of crops for income in Shirahatti and Naragund, while the
opposite was true of Haliyal and Sindhanur. Although, it should be noted that about 88 and 98
percent of enrolled and non-enrolled farmers in Sindhanur earned income through sale of crops
which is very different from the other three taluks (Annexure Table 13.27) during 2016-201728.
Majority of households received drought relief during 2016-2017 except in Sindhanur
(Annexure: Table 13.32). About 62 per cent of farmers received drought relief whereas only 3
per cent of non-enrolled farmers in Haliyal. The difference in receipt of drought relief between
enrolled and non-enrolled in Shirahatti and Naragund is not as stark as one observed in Haliyal.
27
Similar picture emerges when on examines the educational qualification of the spouse of primary respondents (Annexure Table 13.23) 28
More than 95 per cent of households have not earned income through sale of livestock (Annexure Table 13.28), sale of agricultural equipment (Annexure Table 13.29), rent of agricultural land (Annexure Table 13.30), and rent of agricultural equipments (Annexure Table 13.31) during the period of 2016-2017.

35
8.2 Process of implementation of PMFBY in Karnataka
While following the standard guidelines prescribed by GoI, the state also has introduced
measures to increase the insured cropped area and the number of farmers covered. The state
pioneered use of technology in computerising land records29 and this has come in handy for
implementing crop insurance through the portal. The findings in this subsection are analysed to
gauge the implementation processes during the Kharif and Rabi seasons in 2016 as well as
following the process of implementation through Kharif in 2017.
Pre-notification stage (features and modifications):
a. The criteria for inclusion of a crop at GP and hobli/sub-taluk level as IU was lowered from 75
and 150 hectares to 50 and 125 hectares respectively, though the number of crops notified in
2017 remained the same as in 2016 (27 food and oilseed crops and 13 commercial/horticultural
crops). This resulted in an increase in the number of IUs as well as the number of crops in an
IU.
b. The process of clustering and bidding also witnessed modifications reflecting the evolving
nature of the scheme in the state. The district-wise scale of finance for each of the notified crops
was used to arrive at the sum insured and thereby the premium calculation. The state had
decided to complete the bidding process in Kharif before March 2017 in order to ensure that
adequate time for the notification and awareness campaign. With every passing day, the
information regarding the monsoon forecast and pre-monsoon showers affect the enrolment
which in turn impacts the APR quoted by insurance companies. For each cluster, the insurance
companies are required to quote APRs for all district crop combinations for their bids to be
evaluated. Any insurance company not quoting even for one of the total district-crop
combinations within a particular cluster is disqualified for the bidding period. The call for bids
were provided by the DoA to all the empanelled insurance companies which includes details
such as: (i) IU-wise and crop-wise yield data for the last 10 years (from 2007 to 2016 Kharif
season), (ii) IU-wise and crop-wise sown area for last four years, (iii) expected sown area and
expected insurance sum 2017, (iv) list of calamity-declared taluks, and (v) crop-wise sum
insured, indemnity levels, sowing and harvesting windows, staggered dates of enrolment and
cut-off date for invoking prevented sowing.
c. The penalty clause for not reaching the target of 50 per cent of crop sown area was
introduced. However, this was later removed as most insurance companies felt that the target
was challenging given that insurance is voluntary for non-loanee farmers, which may depend on
factors beyond the control of insurance companies. (Department of Agriculture, Government of
Karnataka 07/03/2017)
d. A mandatory 20 per cent verification of insured crop was introduced. Verification of insured
crop was meant to crosscheck whether the insured crop was actually grown in the field. This
was critical especially when the insured crop area exceeded the estimated sown area for a crop
in a particular district/cluster. However, this was reduced to five percent because of the shortage
29
http://web.worldbank.org/archive/website00819C/WEB/PDF/INDIA_BH.PDF

36
in human resources required to undertake this task. (Department of Agriculture, Government of
Karnataka 07/04/2017)
e. Cropped area estimates play a critical role in the clustering and bidding processes as they
form the basis for all calculations. Errors in these estimations would result in the area
discrepancy factor. In the event of the crop-insured area being more than the crop-sown area
(owing to discrepancies in enumeration) an area correction factor is applied which affects the
insurance payout for the entire crop/IU (Annexure: Note 12.3).
f. While the process of re-clustering and re-bidding resulted in insurance companies quoting
lower actuarial premium rates (APR’s)30, it is also true that the process is time-consuming for
insurance companies considering the number of crops notified. The L1 bidders are to be paid
50% of the premium subsidy upfront by the state government. Overall, the first round of bidding
estimated subsidy premium subsidy outgo of INR 5500 crores and this was eventually brought
down to around INR 880 crore by re-grouping the districts from only four clusters to ten clusters
(refer to Annexure: Note 12.4 for a detailed account on the clustering and bidding process).
(Government of Karnataka 22/05/2017)
Notification stage:
a. DoA issues a notification to enable the enrolment on completion of the bidding process which
constitutes of the cut-off dates and premium payable by the farmer for each notified crop.
District and taluk level offices issue similar notifications providing the details of IU-wise crops
notified along with the cut-off dates, dates for invoking of prevented sowing and the premium
payable by farmer per acre.
b. The DES plans for the CCEs to be conducted for all the crops across different IUs. CCEs are
randomised and implemented through the use of the mobile app which also helps in
coordinating with the insurance companies to allow them to witness the CCE.
c. The CCE consists of two stages. The first stage involves a random selection of any two
villages within the IU followed by a random selection of two survey numbers within each of the
two villages. After confirming that the notified crop is being grown on these two survey numbers,
another four adjacent survey numbers that also grow the same notified crop is listed for each of
the original two randomly selected survey numbers/village along with their probable harvest
dates (It is called “1+4” survey number selection). The second stage involves the actual CCE
being conducted on any randomly selected two survey numbers per village from the above pool
of survey numbers. This random selection of plots where CCE is eventually conducted
addresses the moral hazard issue to a large extent. Also, there should be a minimum of a seven
day gap between these two stages as it is possible that the farmer decide to change the date of
harvest. The frontline worker who is in contact with the farmer can accordingly change the
probable date of harvest provided it’s done within a minimum of 48 hours from the original date.
According to DES, conducting and finalising of 85,000 CCEs in Kharif and about 1.5 lakh CCEs
in a year is challenging due to the shortage of skilled manpower. .
30
One of the aims of the bidding process is to ensure that the APRs quoted by the insurance companies eventually result in a premium subsidy outgo that is close to Karnataka’s budget allocation for PMFBY implementation. This was achieved during the Kharif 2017 bidding.

37
Enrolment stage
a. In Karnataka, the practice of unified and single enrolment cut-off date for Kharif (i.e., July 31,
as per the PMFBY guidelines) is modified to a staggered approach to accommodate the
observed cropping patterns. The cut-off dates for Kharif 2017 are: 30June, 15 July, 31st July and
14 August for very early, early, normal and late crops. (Government of Karnataka 19/04/2017)
This has reduced the problem of the last-minute rush for enrolment (both handling of physical
application as well as server traffic). The staggering of cut-off dates also helped in avoiding
adverse selection since the window for enrolment aligned with a specific crop’s sowing period.
At the local level, the officials are aware of these specific crop windows and can right away
notice if the farmer is indulging in any high risk practices or not.
b. The State Level Coordination Committee for Crop Insurance (SLCCCI) fixed the last date for
invoking prevented sowing/planting risk to be 15 days after the end of the sowing period,
irrespective of the cut-off date for enrolment. The empanelled insurance companies again raised
the possibility of adverse selection but finally it was agreed that the 75% of sown area criteria
can only be ascertained after the completion of the sowing period. In situations wherein
prevented sowing is invoked, new enrolment of farmers for the affected crop and areas would
not be allowed after the date of invocation. For the 2017 Kharif season, prevented sowing has
already been invoked in Belagavi, Haveri, and Tumakuru districts of Karnataka pertaining to a
few crops such as soya bean (rainfed), groundnut (rainfed) and maize (rainfed and irrigated)31.
c. Initially, a clause was included in the bid document mandating insurance companies to set up
centres, Raitha Samparka Kendras (RSKs), specifically for the enrolment of non-loanee
farmers. The physical space was to be provided by the DoA but all other IT infrastructure like
laptops, printers, internet dongles, UPS along with ground staff was to be provided by the
insurance companies. Subsequently, this clause was dropped from the bid document since it
would result in high operational costs for the insurance companies which in turn would result in
higher APRs. The Common Service Centres (CSC’s) operating in the area are roped in to
facilitate enrolment during 2017 and they are being paid @ INR 30/ per insurance proposal for
registering it on to the portal.
d. Insurance companies have been found not to be playing any role except for providing
application forms for enrolment. Given this, other stakeholders have taken up the responsibility
to enrol farmers with varying levels of responsibility and incentives. In Haliyal, PACS played a
major role in the enrolment of farmers, even though they are not officially contracted by either
bank officials or insurance companies to undertake this activity. The data entry-related cost of
the PACS was borne by the respective DCC banks from the service charges (four per cent of
the premium) that they receive from the insurance companies. In the past decade, PACS have
been the primary driver of farmer welfare schemes especially of crop insurance in Haliyal. In the
case of PMFBY, PACS had collected the necessary documents, filled forms, entered the
information online, and even allocated some of its own funds in advance to pay the premium
amount ensuring that financial constraints of farmers during the sowing stage do not hinder the
prospect of enrolment. Farmers who did not prefer to avail the SAOLs were advised to enrol at
31
As an example: For maize (rainfed and irrigated) grown in Tumakuru district the cut-off date for enrolment was 31st July 2017 whereas the cut-off date to invoke prevented sowing was 14 August, 2017.

38
the bank as a non-loanee farmer. There were a few cases of farmers who had SAOLs from
PACS for growing sugarcane, but had also taken insurance for a notified crop as a non-loanee
farmer from a commercial bank (since sugarcane was not a notified crop).
In the other three taluks, the GP office and banks were the primary units where information was
disseminated to farmers. Our interactions with farmers revealed that the proposal forms for the
crop insurance were made available at the GP office, so that the farmers did not have to stand
in long queues.32 The local GP had assigned one of its own staffs with the task of collection of
all the mandatory documents for submission.
e. The state government has made it compulsory for all insurance companies to pay INR 5 as
service charges to the GP for every enrolment during 2017. In general, farmers submitted the
documents to either a PACS or GP or bank officials with information about crops to be grown
and loanee status. The officials entered information such as sum and area insured to complete
the submission process. At the end of this process, the farmers were given an
acknowledgement slip marking successful submission of the proposal. There are three
additional steps consisting of (i) verification of the proposal by bank manager, (ii) acceptance
and forwarding of the proposal by the bank manager to the insurance company and (iii)
acknowledgement of the proposal by the insurance company. The farmers are informed at each
stage and the receipt of acknowledgement message by the insurance company is considered
as acceptance and actual enrolment under PMFBY.33 In reality, the farmers are unaware of
these processes and assume that they are enrolled when they receive the acknowledgement
slip at the time of the proposal submission.
f. We tracked the number of days it takes for a proposal to be submitted and to be finally
accepted by the insurance company for a random subset of the sample chosen for our survey.
From Table 8.1, it is evident that it takes about 30 days, on average, for the proposal to be
acknowledged by the insurance company from the date of submission. In this entire process,
the last stage takes the longest. The insurance companies take more than 15 days on average
to acknowledge the proposal. In Sindhanur, it was even longer at 28 days. The proposal can be
rejected at any point during these stages. The confusion or lack of awareness among farmers
about the actual enrolment under PMFBY combined with the fact that the proposals are
submitted at the last moment and a process that takes more than a month for farmers to
actually know whether or not the proposal is accepted does not allow any time at all for them to
re-submit in case of rejection within the stipulated submission date. This increases the likelihood
of farmers not being enrolled despite the fact that they had incurred expenses in submitting the
proposal. In the case of rejection, it can even result in dissatisfaction and loss of trust in crop
32
This was not consistently followed across all the GPs. There were cases where farmers had to invest a lot of time and energy just to get the forms. One farmer in Shirahatti taluk reported that he had to wait in a long queue to meet the bank officials to get the required details about PMFBY. Farmers also reported that they had to a make at least two-three day visits to the bank office over a period of three weeks to complete the application process. It should be noted that this entire process involves activities such as attainment and submission of the proposal form. The farmers have to rely upon DoA officials, GP officials or friends to understand and fill the proposal forms. 33
We are not certain whether the farmers are informed about the rejection of their proposal as we did not come across any mobile messages. However, few enrolled farmers showed us messages starting from the submission of the proposal to the acknowledgement of it by the insurance company.

39
insurance when they find out about their actual status during the claim stage.34 Also, because of
the mandatory enrolment of loanee farmers, the banks may enrol them under a notified crop for
the area while the farmer may not actually grow that crop.
34
Another point to be noted is the return of the premium payment in case of rejection. The DoA has instituted a clause that the insurance companies ought to pay the premium within 15 days in case of rejection. If not, the premium has to be repaid along with interest rate.

40
Table 8.1: Different stages in acceptance of proposal by insurance companies
Stages of acceptance of
proposal
N(subset
of
sample
farmers)
Range(in
days)
Min(in
days)
Max(in
days)
Mean(in
days) SD
Haliyal
From submission to verification by
bank manager 75 29 0 29 11 8
From verification by bank manager
to forwarding to insurance company 75 24 0 24 11 6
From forwarding to insurance
company to acknowledgement by
insurance company
75 18 0 18 16 3
Sindhanur
From submission to verification by
bank manager 68 29 0 29 4 6
From verification by bank manager
to forwarding to insurance company 69 36 0 36 8 9
From forwarding to insurance
company to acknowledgement by
insurance company
69 62 0 62 28 13
Shirahatti
From submission to verification by
bank manager 82 19 0 19 7 5
From verification by bank manager
to forwarding to insurance company 82 16 0 16 5 4
From forwarding to insurance
company to acknowledgement by
insurance company
82 68 0 68 19 13
Naragund
From submission to verification by
bank manager 120 19 0 19 6 4
From verification by bank manager
to forwarding to insurance company 120 15 0 15 3 3
From forwarding to insurance
company to acknowledgement by
insurance company
117 95 0 95 18 19
Source: Samrakshane portal
Note: N reports the number of subset of sample farmers who were randomly selected. The information about the days taken to pass through each of the stage was then manually collected from Samrakshne portal for these set of farmers.

41
Claims Stage:
a. The government has declared that the claims must be paid before the sowing for the next
season begins. However, it was found that the Kharif season 2016 claims were not fully settled
as of October 2017.They should have been ideally settled before the Rabi season’s sowing.
Two major reasons explain the delay in claim settlements: (i) insurance companies contesting
the yield estimates based on the CCE results and estimating the insurance payout accordingly,
(ii) enrolment errors. The number of CCEs per crop at the GP level is four and per crop at hobli
level is 10 across crop and agricultural zones. This is based on the NSSO sampling strategy,
and translates itself into conducting more than 10,000 CCEs per year. Both agricultural
insurance companies and government officials feel the need to revisit the CCEs and make them
more representative of the IU, especially in case of certain multi-picking crops like cotton
(Annexure: Note 12.5).
b. The absence of the proper account number with Indian Financial System Code (IFSC) and
mismatch of name between the application and the land record/bank account have also resulted
in delay with respect to claims settlement.
c. Farmers are not informed once the enrolment process is completed. The farmers are neither
informed about whether their application is accepted by the insurance company in a timely
manner nor about their eligibility for claims. This complete absence of information has resulted
in lot of unrest among the farmers who had paid for the insurance and have not yet received
claim settlement. In many cases, farmers were found to be visiting the DoA, banks and PACS to
seek information about the claim settlement.
8.2. Cropping, loan and risk profiles of farmers:
Land holdings
All the farmers surveyed across the four taluks cultivated their own land except less than 1 per
cent who cultivated leased land. Haliyal taluk is an exception where non-enrolled farmers
cultivated land was still owned by the government, as per the RTC records. The average years
of farming experience for all farmers across all four taluks is more than 20 years. Based on the
‘t’ test for equality of means, the differences in the average years of farming experience
between enrolled and non-enrolled farmers is insignificant across the taluks (Figure 8.1).

42
Figure 8.1: Average years of farming experience
Source: Primary Survey Data
The weighted average land size by enrolled and non-enrolled is presented in Table 8.2 along
with the weighted distribution of farmers across the taluks. The average land sizes in Haliyal
and Sindhanur taluks is smaller compared to those in Naragund and Shirahatti taluks. The
difference in land sizes between those enrolled and non-enrolled is insignificant, except in
Haliyal taluk. In this region, non-enrolled farmers live on the margins of the reserve forest and
their land belongs to the state, according to the RTC. Therefore they cannot enrol. The F
statistic indicates that the weighted distribution of land sizes is significantly different in Haliyal.
However, the value of this statistic is insignificant for those from other taluks. Most of the
farmers across the taluks are marginal, small or medium farmers owning less than four hectares
of land.
Table 8.2: Average land size by taluks (in hectares)
Taluk Enrolled Non- enrolled
Haliyal 1.70 (11.79) 0.86(6.24)
Sindhanur 1.93 (18.45) 1.73(11.47)
Naragund 2.18(15.99) 2.54(28.71)
Sirahatti 2.21(18.97) 1.82 (12.45_)
Source: Primary Survey Data
Note: Standard deviation in parentheses.
Although most farmers own only one plot of land across taluks, a considerable number of
enrolled farmers in Shirahatti and Naragund taluks own more than two plots of land. Non-
enrolled farmers rarely own more than two plots of land. The average proportion of current
fallow land is the lowest for Kharif and then for Rabi seasons. In summer, across the four taluks,
the land is not cultivated and is left fallow.
0
5
10
15
20
25
30
35
Enro
lled
No
n-e
nro
lled
Enro
lled
No
n-e
nro
lled
Enro
lled
No
n-e
nro
lled
Enro
lled
No
n-e
nro
lled
Haliyal Sindhanur Shirahatti Naragund
Ave
rage
far
min
g e
xpe
rie
nce
(in
ye
ars
)
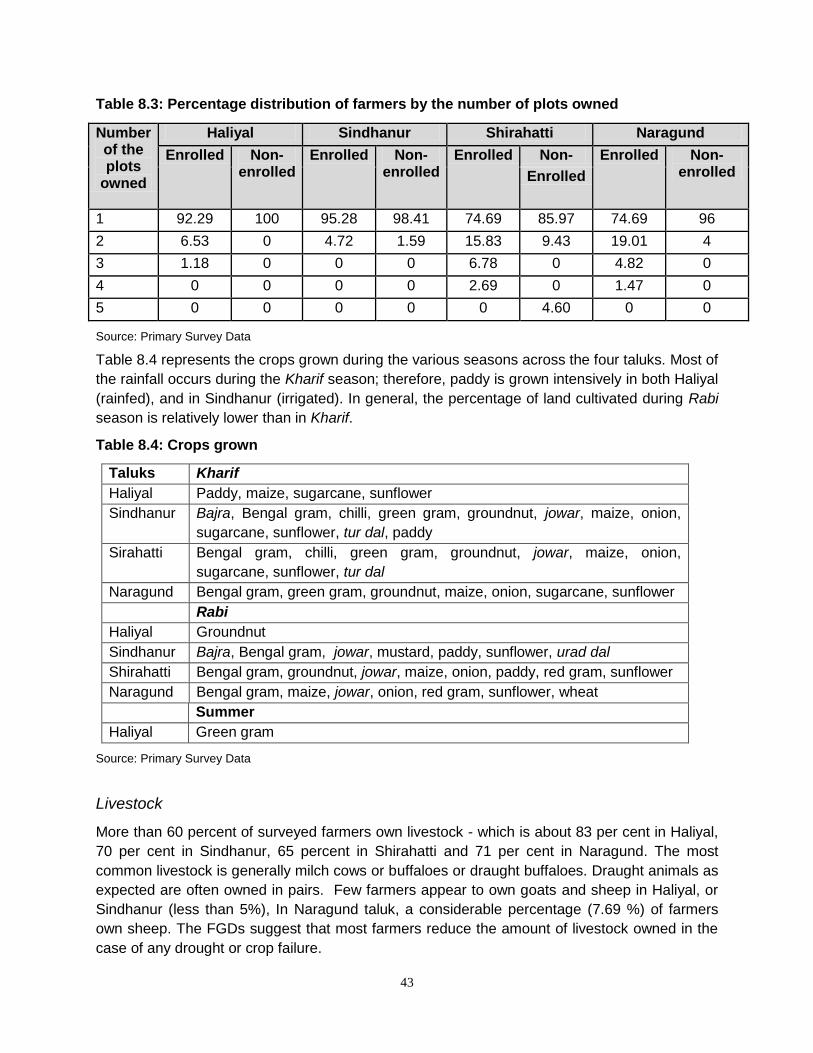
43
Table 8.3: Percentage distribution of farmers by the number of plots owned
Number of the plots
owned
Haliyal Sindhanur Shirahatti Naragund
Enrolled Non-enrolled
Enrolled Non-enrolled
Enrolled Non- Enrolled Non-enrolled Enrolled
1 92.29 100 95.28 98.41 74.69 85.97 74.69 96
2 6.53 0 4.72 1.59 15.83 9.43 19.01 4
3 1.18 0 0 0 6.78 0 4.82 0
4 0 0 0 0 2.69 0 1.47 0
5 0 0 0 0 0 4.60 0 0
Source: Primary Survey Data
Table 8.4 represents the crops grown during the various seasons across the four taluks. Most of
the rainfall occurs during the Kharif season; therefore, paddy is grown intensively in both Haliyal
(rainfed), and in Sindhanur (irrigated). In general, the percentage of land cultivated during Rabi
season is relatively lower than in Kharif.
Table 8.4: Crops grown
Taluks Kharif
Haliyal Paddy, maize, sugarcane, sunflower
Sindhanur Bajra, Bengal gram, chilli, green gram, groundnut, jowar, maize, onion,
sugarcane, sunflower, tur dal, paddy
Sirahatti Bengal gram, chilli, green gram, groundnut, jowar, maize, onion,
sugarcane, sunflower, tur dal
Naragund Bengal gram, green gram, groundnut, maize, onion, sugarcane, sunflower
Rabi
Haliyal Groundnut
Sindhanur Bajra, Bengal gram, jowar, mustard, paddy, sunflower, urad dal
Shirahatti Bengal gram, groundnut, jowar, maize, onion, paddy, red gram, sunflower
Naragund Bengal gram, maize, jowar, onion, red gram, sunflower, wheat
Summer
Haliyal Green gram
Source: Primary Survey Data
Livestock
More than 60 percent of surveyed farmers own livestock - which is about 83 per cent in Haliyal,
70 per cent in Sindhanur, 65 percent in Shirahatti and 71 per cent in Naragund. The most
common livestock is generally milch cows or buffaloes or draught buffaloes. Draught animals as
expected are often owned in pairs. Few farmers appear to own goats and sheep in Haliyal, or
Sindhanur (less than 5%), In Naragund taluk, a considerable percentage (7.69 %) of farmers
own sheep. The FGDs suggest that most farmers reduce the amount of livestock owned in the
case of any drought or crop failure.

44
Access to irrigation, ownership of agricultural implements and expenditure on crops
The proportion of farmers who have access to irrigation generally varied between three and
twenty per cent, except in Sindhanur, where the major crop is irrigated paddy and therefore the
access to irrigation is as high as 80-90%. The difference in access to irrigation is significant for
the enrolled and non-enrolled only in Haliyal taluk. While all farmers owned some equipment or
the other, nearly 13 to 30% reported owning a tractor followed by hiring of the two forms of
labour (human and animal), hiring machinery and other expenses.
Yields
In our survey, we collected self-reported yield estimates which are in terms of the total quantity
of a crop produced in terms of bags or baskets. We used the lower estimate of self-reported
values as there was no single, uniform conversion rate was available for bags or baskets. The
threshold, as well as the actual yield as per the CCEs in these taluks, is presented in Annexure:
Table 13.33, alongside the self-reported estimates. These values should be interpreted with
caution. Rather than serving as representative estimates, they represent the possible variations
within a GP.
Loan behaviour
A 2017 report on the performance of crop insurance schemes reported that 97 percent of
enrolled farmers under NAIS opted for sum insured equivalent to loan amount indicating either
that banks issued loans only to that extent or farmers take up insurance to ensure that the loan
amount can be repaid (Ministry of Agriculture and Farmers Welfare, 2017). Thus it is important
to understand the loan behaviour of farmers. Most farmers were more inclined to take up a cash
loan; loans in kind were observed to be a distant second option (Annexure Table 13.34 and
13.35). From Table 8.5, it is interesting to note that Haliyal has the least average amount,
though the PACS in the region are very proactive. It is also one of the areas that receive better
rainfall than others, though they are dependent on rainfall alone. The highest average of
outstanding loan amount is reported from Sindhanur and Naragund, which though notified for
irrigated paddy and jowar respectively, does not have irrigation facilities for all the hoblis, as
some of the villages are very far from the canal.
Table 8.5: Summary descriptive of outstanding loans per household (in INR)
Taluks Average SD 50th
percentile 10th
percentile 90th
percentile
Haliyal 79,134 128787 40,000 0 1,71,000
Sindhanur 2,33,133 290511 1,50,000 37,000 5,00,000
Shirahatti 2,21,466 273536 1,40,000 30,000 5,05,000
Naragund 2,48,132 295739 1,80,000 25,000 5,50,000 Source: Primary Survey Data
Majority of the loans were taken from either government banks or government cooperative
societies across the four taluks (Figure 8.2). Money lenders still constitute a significant source
for loans among both enrolled and non-enrolled farmers in Sindhanur, Shirahatti and Naragund.
In Haliyal, about 36 per cent of non-enrolled farmers had taken loan from money lenders
whereas it was only seven per cent of the enrolled farmers.

45
Figure 8.2: Source of Loans
0.05
0.73
0.07
0.15 0.13
0.22
0.36 0.29
0.00
0.10
0.20
0.30
0.40
0.50
0.60
0.70
0.80
Government Bank Government Cooperative Society
Money Lender Others
Haliyal
Enrolled
Non-Enrolled
0.47
0.24
0.18
0.11
0.38
0.33
0.21
0.07
0.00
0.05
0.10
0.15
0.20
0.25
0.30
0.35
0.40
0.45
0.50
Government Bank Government Cooperative
Society
Money Lender Others
Sindhanur Enrolled
Non-Enrolled
0.51
0.16 0.15 0.18
0.55
0.16 0.16 0.13
0.00
0.10
0.20
0.30
0.40
0.50
0.60
Government Bank Government Cooperative Society
Money Lender Other
Shirahatti Enrolled
Non-Enrolled

46
Source: Primary Survey Data
Note: Government cooperative societies are those that are funded by the government for non-profit purposes; others include cooperative societies run by private institutions/individuals, NGOs/SHGs, employers, friends/relatives, private bank and others.
The most common reason to opt for a loan was the improvement of the farm, which included a)
the bunding of the land to improve the soil, b) irrigation infrastructure, such as bore wells, and c)
the growth of horticulture crops (Annexure Table 13.36 and 13.37). From these, it makes sense
that farmers would extensively take loans for irrigation facilities in Karnataka, one of the driest
states in the country, where drought is common (Kalavakonda and Mahul, 2005). It is also
known that investing in certain types of irrigation, such as tube wells provides security to
farmers from such drought-prone states (Dhawan, 1985).
Risks experienced by farmers
Majority of farmers reported drought to be the top-most risk faced not only in relation to
Kharif/Rabi 2016, but in general as well, in Haliyal, Shirahatti and Naragund. In Sindhanur
taluks, where the major crop is paddy, deficit rainfall - and not drought - is reported as the
topmost risk. Surprisingly, majority of respondents (except in Haliyal) reported that they are not
worried about crop loss due to weather-related changes such as rainfall timing, precipitation,
etc. In other words, though droughts and deficit rainfall are the most-experienced risks, these
are not viewed as the main reasons for crop loss35.
Second, small and marginal farmers face similar risks as medium and large farmers such as
non-availability of labour force and agricultural inputs (seeds, fertilisers and equipment), lack of
information and low sale prices fixed by local traders. Overall, our findings indicate that farmers
experience mostly production risks and price risks to a lesser extent, as defined by Moschini
and Hennessy (2011)
35
Here, we have to take this interpretation with a bit of caution for the following reasons: (a) we have to think about the contextual use of the words "weather changes" and "crop loss" versus "drought" and "crop loss" in a sentence. The relationship between the words in the latter ("drought" and "crop loss") is more commonly used and the relationship well established. However, the same cannot be said of the former as "weather changes" could have been used in a broader context; and (b) it may also be important to enquire whether "drought" was perceived to be an immediate/short-run problem (especially given the recent years of drought in Karnataka) whereas "weather changes" perceived as an "long-term" issue. These could have played a role in the famers' perception and weather-related changes resulting in crop loss.
0.47
0.26
0.18
0.09
0.37
0.29
0.16 0.19
0.00
0.10
0.20
0.30
0.40
0.50
Government Bank Government Cooperative Society
Money Lender Other
Naragund
Enrolled
Non-Enrolled

47
Table 8.6: Risks faced by farmers in study taluks
Crop /
Season
Taluk Production risk Price risk Risks
covered
under
PMFBY
Stages
at
which
risks
are
faced
Pa
dd
y (
Kh
ari
f)
Haliyal 1. High wage rate
(6%) [Enrolled (5%)
and non- enrolled
(7%)]
2. Lack of information
about new seed
varieties [non-
enrolled (7%)].
3. Non-availability of
seeds, fertilisers,
manure and other
related inputs at the
right time [Enrolled
(3%)]
1.
Drought
(80%)
Du
ring
so
win
g a
nd
sta
nd
ing
cro
p s
tag
e
Sindhanur 1. High wage rate
(23%);
2. Non-availability of
labour force (16%)
[Enrolled (21%) and
non- enrolled (11%)];
3. Lack of
information about
new seed varieties
and techniques (19%)
[Enrolled - (12%) and
non- enrolled (25%)];
1. Low
Sale
Price of
the
produce
fixed by
local
traders
(Non
Enrolled-
11%);
1. Pests*
(15%)
[Enrolled
(17%)
and non-
enrolled
(13%)];
2. Deficit
rainfall*
(12%)

48
Jo
wa
r(R
ab
i)
Shirahatti 1. High wage rate*
(15%) [Enrolled - 18%
and non- enrolled -
12%];
2. Concern about soil
quality* (11%)
[Enrolled (7%) and
non-enrolled (11%)]
1.
Drought
(98%);
Naragund 1. High wage rate *
(17%) [Enrolled - 13%
and non- enrolled -
22%];
2. Lack of information
about new seed
varieties and
techniques** (10%)
[Enrolled (7%) and
non-enrolled (12%)]
Drought
(93%);
Source: Primary Survey Data
Note: * - includes all risks faced by farmers in cultivating the crop in general; and ** - includes all risks faced by farmers in cultivating the crop during Kharif/Rabi in 2016. Second, the table reports only the top-ranked responses to questions on risk faced by farmers while cultivating the notified crop. Refer to Annexure Tables 13.38-13.41 for item-wise responses on risk experienced by enrolled/non-enrolled farmers.
Risk management strategies adopted by farmers:
Following OECD (2009), we categorise the different risk management strategies adopted by
farmers in our survey into three groups, namely: risk prevention, risk mitigation and risk coping.
OECD (2009) defined risk prevention as strategies adopted to reduce the probability of an
adverse event; risk mitigation as strategies adopted to reduce the potential impact of an adverse
impact; and risk coping as strategies adopted to relieve the impact of an adverse event. The
different categories of risk management strategies as reported by farmers are given in Table
8.7.

49
Table 8.7: Adoption of risk management strategies
Crop /
season
Taluk Use of risk management strategies
Risk prevention Risk mitigation Risk coping
Pa
dd
y (
Kh
ari
f)
Haliyal 1. Avoiding
experimentation with new
seeds/fertilisers/techniques
(17%) [Enrolled (18%) and
non-enrolled (16%)]
1. Investment/adoption
of better pest
management (11%)
[Enrolled (2%) and non-
enrolled (20%)]
2. Crop diversification
(21%) [Enrolled (17%)
and non-enrolled (26%)]
3. Intercropping (14%)
[Enrolled (24%) and non-
enrolled (5%)]
4. Investment in farm
improvements (13%)
[Enrolled (7%) and non-
enrolled (20%)]
1. Crop
Insurance (3%)
[Enrolled (7%)
and non-
enrolled (0%)]
2. Disaster
relief*
3. Migration to
engage in non-
farm income*
Sindhanur 1. Participating in activities
to improve dams and
irrigation systems (16%)
[Enrolled (16%) and non-
enrolled (15%)]
2. Avoiding
experimentation with new
seeds/fertilisers/techniques
(11%) [both enrolled and
non-enrolled)
1. Investment/adoption of
better pest management
(12%) [Enrolled (9%) and
Non Enrolled (16%)]
2. Crop diversification
(18%) [Enrolled (19%)
and non-enrolled (17%)]
3. Sharing of agricultural
equipment and irrigation
sources (5%) [Enrolled
(7%) and non-enrolled
(4%)]
1. Crop
Insurance (3%)
[Enrolled (4%)
and non-
enrolled (3%)]
2. Buffer stock
accumulation of
crop produce
(8%) [Enrolled
(9%) and non-
enrolled (7%)]
3. Migration to
engage in non-
farm income*

50
Jo
wa
r (R
ab
i)
Shirahatti 1. Crop diversification
(37%) [Enrolled (32%)
and non-enrolled (42%)]
2. Inter cropping (20%)
[Enrolled (14%) and non-
enrolled (27%)]
3. Plot diversification
(6%) [Enrolled (7%) and
non-enrolled (6%)]
4. Mixed farming (6%)
[Enrolled (9%) and non-
enrolled (3%)]
1. Crop
Insurance (12%)
[both enrolled
and non-
enrolled]
2. Migration to
engage in non-
farm income*
Naragund 1. Crop diversification
(43%) [Enrolled (46%)
and non-enrolled (39%)]
2. Intercropping (30%)
[Enrolled (14%) and non-
enrolled (46%)]
3. Investment in farm
improvements (10%)
[Enrolled (16%) and non-
enrolled (4%)]
1. Crop
Insurance (4%)
[Enrolled (9%)
and non-
enrolled (0%)]
2. Migration to
engage in non-
farm income*
Source: Primary Survey Data
Note: 1. Table 8.7 reports the first response from the farmers to the question ‘What were the risk mitigation strategies
adopted by you to protect against crop failure?"’ The percentage represent the number of respondents who had
reported adopting a particular risk management strategy of the total number of farmers in the sample. The complete
list of risk management instruments adopted by farmers in Haliyal, Sindhnur, Shirahatti and Naragund are given in
Annexure: Table 13.43-13.46.
2.GoK released INR 5,000 per farmer as disaster relief during 2016.
3. *Migration could be categorised under any of the three types of risk management instruments.
Under risk prevention strategies, it was a bit surprising to note that farmers who primarily
engage only in Kharif season [Haliyal and Sindhanur taluk] adopt any measures to prevent the
probability of an adverse event. The common risk prevention strategies adopted by farmers
include avoiding experimentation with new seeds/fertilisers/techniques. This response could be
manifestation of the adverse events experienced by farmers in Karnataka in recent years (since
2011 - except for 2014-15), including poorer yield productivity due to drought, deficit rainfall,
deteriorating groundwater and soil quality in addition to lower income due to market forces. The
risk averse mindset of farmers means that they may not be willing to explore and adopt newer
techniques/inputs. Both enrolled and non-enrolled farmers have reported participating in
activities aimed at improving dams and irrigation systems in Sindhanur. These activities are

51
generally undertaken by the community and not by individual farmers, engaging with local
administrative and political establishments to implement distributary canals or release water
from the reservoir to meet requirements for growing paddy.36
Under risk mitigation strategies, crop diversification which improves the farmers’ crop portfolio
and reduces dependency on a single crop is the most common strategy adopted across the four
taluks. Strategies of a similar nature include intercropping - where enrolled farmers constitute
higher percentages compared to non-enrolled farmers in Haliyal and the reverse is true in
Shirahatti and Naragund. In both Shirahatti and Naragund, a smaller percentage of farmers
have also adopted plot diversification and mixed farming to reduce their risk exposure to a
single crop. Other risk-mitigating strategies common in all four taluks include
investment/adoption of better pest management, mixed farming and sharing of agricultural
equipment.
Only about seven percent of enrolled farmers consider crop insurance as the top priority
measure of relief from the impact of crop loss in Haliyal. In Sindhanur and Naragund, this is
considered by only a small percentage of farmers [about three to four per cent]. About 12
percent of farmers in Shirahatti reported crop insurance as their first response to mitigate crop
loss. Small and medium farmers often engage in non-farm activities to sustain their livelihoods.
These activities were not reported as a risk mitigation strategy in our survey, thereby hindering
in estimating the percentage of households engaging in such activities. We still categorise these
non-farm activities, specifically migration to other states or cities to meet the shortfall in income
through agriculture, as a risk management strategy, following the extant literature. In Haliyal, the
majority of small and medium farmers with more than one male child send the adult male child
to the neighbouring state, Goa, to engage in non-farm employment during off season. In
Sindhanur, small and medium farmers migrate to another neighbouring state, Andhra Pradesh,
to engage in road construction and other non-farm activities. The small and medium farmers
from Shirahatti and Naragund migrate within Karnataka for construction work.
In sum, these findings indicate that farmers rely upon informal measures at the household or
community levels as measures to mitigate agricultural risks. The farmers do not necessarily
possess knowledge and access risk management instruments that may be available to them to
mitigate crop loss/shortfall in income through agricultural activities. Third, imperfect knowledge
about the relationship between agricultural risks faced by farmers and household decision-
making on employment, education, asset ownership induces more reliance upon informal
measures.
36
In line with this, farmers from Sindhnur, Manvi and Deodurg demanded implementation of the proposed 5A Pamanakallur Distributary Canal Project in September 2016 [http://www.thehindu.com/todays-paper/tp-national/tp-karnataka/Farmers-in-Raichur-march-on-foot-seeking-5A-canal/article14627517.ece - Accessed as on October 1st 2017].

52
8.3 Farmers' experience of PMFBY:
Source of information about PMFBY:
About 44 percent of respondents reported that PACs and banks in Haliyal were their main
sources of information. Banks and GP officials were the sources of information in Sindhanur,
Shirahatti and Naragund. In addition, about 14 percent of enrolled, medium and large farmers
had sourced information from DoA officials compared to only three percent of enrolled small
farmers in Haliyal. In Sindhanur, about 38 percent of enrolled large farmers had accessed
information through the newspaper/radio/internet. Unexpectedly, neighbours/relatives/other
friends have been a major source of information across all taluks, especially for enrolled, non-
loanee farmers.
Table 8.8: Source of information about PMFBY
Haliyal Sindhanur Shirahatti Naragund
1. Neighbours/other
farmers (29%);
2. PACs (22%);
3. Bank agents (20%);
4. Relatives/other
friends (13%)
1. Bank agents
(69%);
2. Panchayat/taluk
officials (13%)
3. Neighbour/other
farmers (10%)
1.
Panchayat/taluk/district
official (30%);
2. Bank agents (25%),
3. Neighbour/other
farmers (22%)
1. Bank agents (46%);
2.
Panchayat/taluk/district
official (30%)
Source: Primary Survey Data
Note: The percentage represents multiple responses from those respondents who had reported to have enrolled in PMFBY in our survey, irrespective of our definition of enrolment status. In the above table, the percentages will not add up to 100 as only the significant items are reported. Refer to Annexure: Table 13.47-13.58 for greater detail.
As reported earlier, our findings indicate that majority of farmers avail seasonal agricultural loan
during the Kharif season. The insurance acts not only as a safety mechanism for the farmer
against crop loss, but also to bank/PAC officials as they can be assured of loan repayment. A
recent CAG report found that the sum insured actually equalled the loan amount borrowed in
the states it studied (Andhra Pradesh, Gujarat, Tamil Nadu). Our interactions with officials do
suggest indicative evidence where bank officials have submitted proposals with higher sums
insured to match the loan amounts disbursed to farmers, even if it meant by submitting the
proposal with a crop not grown by the farmer.37
Finally, the complete lack of engagement from insurance companies results in vacuum of
information not only at the enrolment stage but also at the claims stage. Our researcher
positioned at the DoA noted that a significant number of farmers travel from distant and rural
villages to Bengaluru (where the state’s DoA is located) just to get information on whether or not
they are eligible for claim settlements. This not only leads to increased out-of-pocket
expenditure for farmers but also result in negative perceptions of the scheme itself. Secondly,
37
Furthermore, farmers do not avail seasonal agricultural loan during the Rabi season. Therefore, incentives for banks to undertake enrolment activity may be characteristically different here. A plausible motivating factor can be the significant role played by DoA officials in issuing instructions to take up insurance which increases during the Rabi season. One example would be the several measures including acceptance of demand drafts, delay of submission dates for some major crops, acceptance of mass submission of proposals adopted by the DoA during the Rabi season of 2016 to accommodate the financial constraints experienced due to demonetisation.

53
farmers are not aware of the accountability structure and assume that the DoA is responsible for
the entire scheme.
Awareness of PMFBY:
Figure 8.3 reports the status of general awareness of PMFBY scheme among the respondents.
Almost all enrolled farmers have reported that they are aware of the scheme, except for those in
Haliyal where only 88 percent of enrolled farmers are aware of it. Among non-enrolled farmers,
about 50 percent, 75 percent and 88 percent in Sindhanur, Shirahatti and Naragund
respectively are aware of the PMFBY. It should be noted that we observed that PACS work
closely with farmers to get them enrolled in the PMFBY, such that they had taken measures to
pay the premium amount from their own accounts to prevent non-enrolment of farmers due to
financial constraints in the enrolment period. An important observation is that the farmers are
aware of crop insurance but not necessarily the specific name of the scheme. The question put
forth to the respondents was ‘Are you aware of the Pradhan Mantri Fasal Bima Yojana?’ which
could have led them to answer ‘No’ in this instance.
Figure 8.3: Status of general awareness about PMFBY
Source: Primary Survey Data
Note: the proportion for the enrolled farmers is derived by taking the number of enrolled farmer who reported to be aware of PMFBY and divided by the total number of enrolled farmers in a particular taluk.
Similar to awareness of other schemes in India, the higher percentage of general awareness of
the PMFBY does not translate to awareness of the specific features of the scheme. Only 49 and
23 percent of the enrolled farmers in Haliyal and Sindhanur respectively were able to answer
the correct premium rate of 2 and 1.5 percent charged to farmers in the Kharif and Rabi
seasons. None of the enrolled and non-enrolled farmers were able to answer the correct
premium rate in Shirahatti and Naragund (Annexure Table 13.64). Only 46 percent of enrolled
farmers in Haliyal were able to report the correct last date for applications to be submitted to be
covered under the PMFBY for the kharif season. In Sindhanur, only about eight and three
percent of enrolled and non-enrolled farmers and in Shirahatti, about 49 and 18 percent of
enrolled and non-enrolled farmers reported the correct date of submission respectively.

54
Interesting, a higher number of non-enrolled farmers (29 percent) compared to enrolled farmers
(17 percent) reported the correct date of submission in Naragund.
Nevertheless, most farmers reported correctly that only notified crops would be covered under
the PMFBY scheme in all four taluks (Annexure: Figure 13.6). In terms of risk coverage faced by
farmers, the responses of farmers observed were predominantly about weather-related risks,
such as drought, deficit rainfall, dry spells, pests, unseasonal rains, and floods. While about 95
percent of farmers have reported at least one risk covered under the PMFBY in Shirahatti and
Naragund, more than 50 percent of the responses include drought as one of the risks covered.
It is possible that farmers’ responses are influenced by their own experiences, especially given
the drought situation in recent years. The farmers are, however, aware of the stages during
which, should they face agriculture risks, they are covered under PMFBY, but that does not
translate into utilisation of the entire coverage offered under PMFBY. If the farmers are not
aware of stages of post-harvest and local calamities, then they may not follow the required
procedures to be eligible for claim settlement when they experience losses during these stages.
In essence, the lack of awareness of crucial aspects of the scheme such as submission date,
premium rate, types of risks and different stages of cultivation covered under the PMFBY may
have a negative correlation with the perception of the value and trust in the scheme itself.
Place of enrolment, document submission and verification:
Following the source of information, the place of enrolment is entirely at PACS and banks for
farmers in Haliyal and Naragund, whereas in Sindhanur and Shirahatti farmers submitted the
documents at the local bank branch. The proposal form which is expected to be filled duly by
the farmer was submitted by only eight percent of respondents in Haliyal, less than one percent
in Sindhanur and zero percent in Shirahatti and Naragund taluks. The duly filled proposal form
is the primary document where inaccurate information can be grounds for rejection. The fact
that only less than ten percent of farmers at best had filled and submitted it raises questions
about the awareness/understanding of farmers of the fine print of the crop insurance scheme for
which that they are paying premiums.
With respect to document verification, about 75 percent of the enrolled farmers in all the four
taluks trust that the insurance/bank officials would verify the document or are not entirely certain
of any verification process. Only in Shirahatti and Naragund, about less than seven percent of
farmers had reported visits by government/insurance officials to the farm to verify the crop
grown and other details. In essence, there exists information asymmetry about the steps
involved in the verification process and its impact on acceptance or rejection of the proposal
submitted. Unless this is resolved, the probability of rejection remains high.38 In addition, this
can lead to an increase in adverse selection or moral hazard problems as the farmers can
interpret it as the absence of monitoring mechanisms.
38
Refer to Annexure Table 13.69 for more details on document submission and verification.

55
Understanding the determinants of enrolment and willingness to enrol in the next
season:
In this section, we discuss the estimation strategy to be adopted to (a) understand the factors
associated with the observed adoption of crop insurance for paddy and jowar crops by farmers
during Kharif and Rabi 2016 respectively; and (b) estimate the willingness to adopt crop
insurance for the following season. To begin with, we make certain assumptions about the
farmers’ risk preferences and decision-making to either take or not to take crop insurance. We
assume that all farmers in our study state are risk averse in general. While the theory on
decision-making under uncertainty postulates that risk preferences varies by individual, the
experiments on risk preferences of farmers with regards to agricultural decisions undertaken by
Binswager (1980) and continued by others establish that farmers are risk averse in general. The
only matter of debate is then the degree of risk aversion of farmers. In Karnataka, farmers have
been experiencing drought situations for the last three years. As a seventy-year old farmer put it
"Last year (2016) was the worst drought situation that I have experienced in my lifetime". This
could have heightened the production uncertainty for farmers resulting in extreme (or moderate,
at any rate) levels of risk aversion, evidenced in our analysis of risks faced by farmers. We
assume that farmers are similar in their risk preference and will make similar decisions related
to their agricultural activity. Assuming that farmers’ risk preferences are similar, we postulate
that the decision to take up crop insurance will be explained by observable factors such as
gender, education status, number of working household members, indebtedness and access to
formal credit institutions.
Further, the access to the insurance product can vary by individual even though the scheme is
implemented across all districts in Karnataka. To elaborate, a farmer who wants to avail the
insurance product has to submit a proposal document to the nearest bank branch, commercial
or regional rural bank, or authorised channel partner or insurance intermediaries who then
submit the required documents to the insurance company. In addition, all financial transactions
such as premium payment and receipt of claims, in case of crop loss, are to be done through
bank transactions. Thus, the submission of proposals and uptake of the insurance product
varies by the presence of bank branches or insurance intermediaries.
Given this, We estimate the following equation:
Where Yi,j is the outcome variable indicating uptake of insurance/willingness to enrol for crop
insurance during next season (a binary choice variable); PBi,j represents the distance to banks
and PCi,j represents the distance to PACS, controlling farm-related characteristics, Xi,j is
irrigation, number of milch and drought animals, and ownership of agricultural equipment and
household-related characteristics; Hi,j is caste and gender of land owners, land ownership
category, type of housing, fuel sources, farmers experience and level of indebtedness; and ei,j is
the error term. In all regressions, the standard errors are clustered at the GP level.
Table 8.9 and 8.10 provide the estimation results of selected explanatory variables to
understand the factors determining the enrolment in the PMFBY and willingness to enrol in the
next season. In interpreting the results, it is important to recognise that Haliyal and Sindhanur

56
covers farmers growing crops during the Kharif season and Shirahatti and Naragund covers
farmers growing during the Rabi season. Second, the implementation of the PMFBY also varies
considerably across the four taluks. Third, our descriptive analyses show that farmers across
the four taluks are characteristically different. The a priori expectation is that a single factor or
set of factors may not consistently and significantly influence enrolment in the PMFBY.
It is evident from Table 8.9 that disadvantaged groups (Other Backward Castes, Scheduled
Castes, Scheduled Tribes and other minority groups) are less likely to enrol for the PMFBY in
Haliyal and Naragund when compared with the farmers belonging to general castes. In Haliyal,
farmers with secondary education and above are 23 percent more likely to enrol for PMFBY,
relative to illiterates. Even those with primary education are 17 percent more likely to enrol
(albeit significant only at ten percent level). The same is not true for the other three taluks, as
the estimates are insignificant for Sindhanur and Naragund; and surprisingly negatively
associated (about 26 percent) with enrolment for the sample in Shirahatti. Next, the Haliyal and
Sindhanur sample reveals that farmers owning more than 5 hectares of land are less likely
(about 30 or more percent) to enrol for PMFBY; but a positive relationship is observed for the
Naragund sample. Finally, increase in loan indebtedness at the rate of 3.2 percent leads to
positive likelihood of enrolment in the PMFBY. This positive relationship with level of
indebtedness is also observed in the estimates for Haliyal, Sindhanur and Naragund, where the
rate is about 3.2, 15.2 and 6.4 percent respectively.

57
Table 8.9: Regression estimates of determinants of enrolment in PMFBY
Selected Explanatory
Paddy (Kharif - Rainfed)
Paddy (Kharif - Irrigated)
Jowar (Rabi - Rainfed)
Jowar (Rabi - Irrigated)
Haliyal Sindhanur Shirahatti Naragund
Average distance to bank
-0.010
(0.033)
-0.038
(0.032)
0.101**
(0.039)
-0.139
(0.102)
Average distance to PACs
-0.039
(0.029)
0.140**
(0.063)
-0.150***
(0.039)
0.226
(0.170)
OBC -0.384***
(0.081)
0.154
(0.373)
0.393
(0.298)
-0.369**
(0.131)
SCs/STs/Other Backward castes
-0.381***
(0.065)
0.098
(0.496)
0.248
(0.528)
-0.168
(0.157)
Female land owners
0.080
(0.070)
0.087
(0.124)
-0.008
(0.122)
-0.060
(0.099)
Farmers owning land (2-5 hectares)
-0.384***
(0.081)
-0.019
(0.053)
0.057
(0.055)
0.018
(0.076)
Farmers owning land (more than 5 hectares)
-0.382***
(0.065)
-0.312*
(0.160)
-0.0048
(0.092)
0.409**
(0.183)
Primary education
0.169*
(0.083)
0.106
(0.123)
-0.118*
(0.069)
-0.016
(0.109)
Secondary and above
0.229**
(0.100)
0.020
(0.108)
-0.262**
(0.090)
-0.144
(0.111)
Number of years of farming
0.004
(0.003)
0.001
(0.004)
-0.007
(0.005)
-0.003
(0.005)
Log of indebtedness
0.032**
(0.016)
0.152**
(0.059)
-0.059
(0.036)
0.064**
(0.029)
Equipment [Harvest - Index]
0.032*
(0.016)
-0.033**
(0.014)
0.004
(0.034)
-0.001
(0.028)
Equipment [sowing - Index]
0.031
(0.042)
-0.021
(0.014)
-0.027
(0.041)
-0.052***
(0.017)
Observations 5,814 25,550 11,021 7,127
Note: Other explanatory variables include type of housing, fuel sources, and number of milch and draught animals where the coefficients' are not statistically significant. Standard errors are given in the parentheses.
* p <0.10; ** p < 0.05 and *** p < 0.01.

58
Next, we present the estimation results of willingness to enrol in the next season in Table 8.10.
The results reveal that currently enrolled farmers are more likely to enrol for the PMFBY in the
next season as well, except for enrolled farmers in Naragund, (56, 45 and 18 percent in Haliyal,
Sindhanur and Shirahatti respectively). This indicates that there is higher probability for
sustained enrolment in the PMFBY. In Haliyal, farmers in closer proximity to PACs are more
likely to enrol for the PMFBY whereas the probability of enrolment increases by 5 percent with a
kilometre increase in distance to banks. This negative relationship between distance to banks
and willingness to enrolment in the next season may be in contrast to the evidence that higher
level of inclusion with formal financial institutions can lead to higher demand for insurance
(Bryan, 2010). But this effect could be either due to (a) accessibility to banks improving
accessibility to loans which in turn potentially act as a substitute to crop insurance schemes or
(b) qualitative observations suggest that bank officials do facilitate processing loans without
invoking the mandatory component of enrolment in the PMFBY. The loans disbursed by banks
in general can be of higher amount relative to the three lakh (3,00,000) limit at PACs. The same
factors do not appear to be significant in other three taluks. Further, other factors such as
education, caste, gender and farming experience do not appear to be significant at either one or
five percent level.

59
Table 8.10: Regression estimates of willingness to enrol with PMFBY in the next season
Selected
Explanatory
Paddy (Kharif -
Rainfed)
Paddy (Kharif -
Irrigated)
Jowar (Rabi -
Rainfed)
Jowar (Rabi -
Irrigated)
Haliyal Sindhanur Shirahatti Naragund
Enrolled farmer
[2016]
0.558***
(0.073)
0.453***
(0.104)
0.185***
(0.055)
0.093
(0.109)
Average distance
to bank
0.046***
(0.014)
0.004
(0.012)
-0.018
(0.019)
0.059
(0.054)
Average distance
to PACs
-0.36**
(0.017)
-0.044
(0.032)
0.008
(0.016)
-0.113
(0.098)
Female land
owner
0.011
(0.081)
-0.034
(0.054)
0.067
(0.063)
-0.091
(0.071)
Farmers owning
land (2-5
hectares)
-0.069
(0.078)
-0.040
(0.057)
-0.083
(0.0600)
-0.059
(0.050)
Farmers owning
land (more than 5
hectares)
-0.312
(0.094)
-0.068
(0.064)
0.064
(0.098)
0.162
(0.139)
Primary education -0.121*
(0.065)
-0.040
(0.057)
-0.005
(0.090)
0.134
(0.109)
Secondary and
above
-0.099
(0.072)
-0.067
(0.064)
-0.056
(0.096)
-0.065
(0.076)
Number of years
of farming
0.004
(0.003)
0.004
(0.002)
0.005*
(0.003)
0.001
(0.002)
Log of
indebtedness
0.010
(0.017)
0.033
(0.040)
-0.004
(0.018)
0.019
(0.024)
Equipment
[Harvest - Index]
-0.042
(0.049)
-0.003
(0.018)
-0.024
(0.027)
-0.036
(0.031)
Equipment[sowing
- Index]
-0.123
(0.085)
0.036
(0.019)
-0.011
(0.023)
0.020
(0.015)
Observations 6,502 25,550 10,328 7,127
Note: Other explanatory variables include type of housing, fuel sources, and number of milch and draught animals where the coefficients' are not statistically significant. Standard Errors are given in the parentheses.
* p <0.10; ** p < 0.05 and *** p < 0.01.

60
Additionally, we estimated both the models assuming that similar risk preferences do not hold.
This is because a farmer who is more risk averse may choose to visit the bank branches or
insurance intermediary, irrespective of the distance.39 This may introduce the problem of
endogeneity as we do not explicitly control for this in our estimation model. Given that, we
instrument the bank branches or insurance intermediary with the rainfall departure at the sub-
taluk level as exogenous in nature to avoid the problem of endogeneity due to omitted variable
bias. It is assumed that the bank branch coverage/PACS (Primary Agriculture Cooperative) in a
particular area depends on the level of economic activity, which is to say that the density of
bank branches will be higher in geographical areas with higher level of economic activity. In our
case, agriculture is the primary occupation of the population thus agricultural productivity
determines the level of economic activity. Agricultural productivity in turn is dependent on
rainfall, especially given the successive droughts in recent years in Karnataka. Thus, it was
assumed that areas with good rainfall will have higher bank branch/PACs coverage (more
branches and also shorter distances to a bank branch or intermediary) to increase access to
financial products.
The first stage regression estimates reveal a negative association between rainfall departure
and average distance to financial intermediary overall (Annexure Table 13:74). Given that actual
rainfall is lower than the expected, this translates to higher negative departure in rainfall
associated with greater distance to the insurance intermediary and vice versa. This is as
expected, indicating that the intuition behind our identification strategy is valid. Now, the
association is statistically significant for Sindhanur and Shirahatti at one percent level (and
significant at 14 percent for the Haliyal sample). Under the conventional rule of statistical
significance at 1 and 5 percent, the instrument (rainfall departure) does not explain the distance
to the insurance intermediary for the Haliyal and Naragund samples. Therefore, the instrumental
variable estimates for Haliyal and Naragund should be interpreted with caution as they may be
biased.40
The estimation results (Table 8.11) indicate that none of the factors such as caste, education,
years of farming experience, type of farmers (in terms of land ownership), indebtedness, formal
agriculture training and others have significant influence over the enrolment of farmers in the
PMFBY. In Haliyal, the average distance to insurance intermediaries is inversely associated
with the enrolment suggesting that higher proximity of these PACs leads to higher probability of
adopting insurance. In Sindhanur, a unit increase in the index score of harvest-related
agricultural equipment (thresher, harvester, and other machinery in general) reduces the
probability of enrolment by 11.2 percent.
39
It should be noted that this has to be considered with caution as our primary results indicate that majority of sample farmers only visit banks / PACs when necessary. 40
With respect to validity of the instrument, we have not undertaken a test in our instrumental - probit setup, as the current literature is developed only to test the strength of the instruments for linear models.

61
Table 8.11: Instrumental variable regression estimates of determinants of
enrolment in PMFBY
Selected explanatory
Paddy (Kharif - rainfed)
Paddy (Kharif - irrigated)
Jowar (Rabi - rainfed)
Jowar (Rabi - irrigated)
Haliyal Sindhanur Shirahatti Naragund
Average distance to insurance intermediaries
-0.425*** (0.047)
-0.007 (0.130)
-0.000 (0.087)
-0.403 (0.303)
Female land owners
0.152 (0.299)
0.021 (0.412)
0.154 (0.378)
-0.257 (0.386)
Farmers owning land (2-5 hectares)
0.382 (0.528)
0.196 (0.299)
0.119 (0.197)
-0.186 (0.331)
Farmers owning land (more than 5 hectares)
-0.480 (0.776)
-0.095 (0.351)
1.100 (1.321)
Primary education 0.196 (0.318)
0.110 (0.421)
-0.204 (0.271)
0.146 (0.415)
Secondary and above
0.424 (0.672)
-0.079 (0.316)
-0.531 (0.433)
-0.232 (0.610)
Number of years of farming
0.017* (0.010)
-0.000 (0.013)
-0.014 (0.016)
-0.012 (0.008)
Log of indebtedness
-0.003 (0.149)
0.276 (0.278)
-0.161 (0.102)
0.164 (0.262)
Equipment [Harvest - Index]
-0.042 (0.117)
-0.112*** (0.030)
0.001 (0.105)
-0.009 (0.064)
Equipment[sowing - Index]
0.181 (0.146)
-0.089* (0.045)
-0.156 (0.114)
-0.102 (0.197)
Observations 5,814 25,550 11,021 7,127
Source: Primary Survey Data
Note: * p <0.10; ** p < 0.05 and *** p < 0.01. Other explanatory variables include type of housing, fuel sources, and number of milch and draught animals where the coefficients' are not statistically significant. Standard Errors are given in the parentheses.
With respect to regression on willingness to enrol in the next season41(Table 8.12), currently
enrolled farmers are more likely to enrol for the PMFBY in the next season as well, except for
enrolled farmers in Naragund, (282, 174 and 106 percent in Haliyal, Sindhanur and Shirahatti
respectively). This indicates that there is higher probability for sustained enrolment in the
PMFBY. In Haliyal and Sindhanur, the number of years of farming also positively influences the
41
The first stage regression (Annexure Table 13.75) results indicate that a negative association between rainfall departure and average distance to financial intermediary overall. Given that actual rainfall is lower than the expected, this translates to higher negative departure in rainfall associated with greater distance to the insurance intermediary and vice versa. This is as expected thereby indicating that the intuition behind our identification strategy is valid. Now, the association is statistically significant for Sindhanur and Shirahatti at one percent level (and significant at 20 percent for the Haliyal sample). Under the conventional rule of statistical significance of 1 and 5 percent, the instrument (rainfall departure) does not explain the distance to the insurance intermediary for the Haliyal and Naragund samples. Therefore, the instrumental variable estimates for Haliyal and Naragund should be interpreted with caution as it may be biased, if one holds that there exists omitted variable bias since risk-taking nature of farmers have not been controlled for in the regressions. With respect to validity of the instrument, we have not undertaken a test in our instrumental - probit setup, as the current literature is developed only to test the strength of the instruments for linear models.

62
willingness to enrol in the next season although the magnitude is about 3.5 percent (at ten
percent) and 1.7 percent (at five percent) respectively.
Table 8.12: Instrumental variable regression estimates of willingness to enrol with
PMFBY in the next season
Selected Explanatory
Paddy (Kharif - rainfed)
Paddy (Kharif - irrigated)
Jowar (Rabi - rainfed)
Jowar (Rabi - irrigated)
Haliyal Sindhanur Shirahatti Naragund
Enrolled farmer [2016]
2.829* (1.490)
1.738** (0.754)
1.06*** (0.302)
0.160 (0.507)
Average distance to insurance intermediaries
-0.129 (0.225)
-0.081 (0.083)
-0.065 (0.043)
0.402* (0.197)
Female land owners
0.528 (0.575)
-0.031 (0.277)
0.388 (0.364)
0.102 (0.341)
Farmers owning land (2-5 hectares)
-0.425 (0.438)
-0.462 (0.346)
-0.498 (0.330)
0.158 (0.378)
Farmers owning land (more than 5 hectares)
-1.514 (0.730)
-0.066 (0.575)
0.395 (0.541)
-0.480 (1.064)
Primary education
-0.734 (0.432)
-0.093 (0.232)
-0.075 (0.495)
-0.040 (0.759)
Secondary and above
-0.586 (0.397)
-0.221 (0.253)
-0.364 (0.541)
0.016 (0.347)
Number of years of farming
0.035* (0.018)
0.017** (0.008)
0.029 (0.017)
0.010 (0.006)
Log of indebtedness
-0.059 (0.119)
0.201 (0.187)
-0.036 (0.103)
-0.060 (0.146)
Equipment [Harvest - Index]
-0.060 (0.616)
0.159* (0.090)
-0.146 (0.167)
-0.010 (0.080)
Equipment [Sowing - Index]
0.158 (0.304)
-0.005 (0.079)
-0.064 (0.130)
0.057 (0.034)
Observations 6,502 25,550 10,328 7,127
Source: Primary Survey Data
Note: * p <0.10; ** p < 0.05 and *** p < 0.01. Other explanatory variables include type of housing, fuel sources, and number of milch and draught animals where the coefficients' are not statistically significant. Standard Errors are given in the parentheses.
Motivation to enrol for PMFBY in the next season
The primary reasons behind enrolled farmers’ willingness to enrol for the PMFBY in the next
season include crop failure due to weather changes and coverage of risks at multiple stages.
The coverage of risks during sowing and standing crop were specifically reported as attractive
features of the PMFBY in Sindhanur, Shirahatti and Naragund. Another feature that was
considered attractive, especially by small and medium farmers, is the lower premium rate which
is set at two per cent during Kharif season in Haliyal. Surprisingly, critical aspects identified in
the extant literature such as trust in intermediaries, adoption of technology, flexibility in terms of

63
document required or submission date, transparency in estimation of yield, calculation of claims
and duration of claim settlement were not identified by farmers as primary motivations. The
farmers' responses are in alignment with the risks they face thereby offering insights into what
features of the scheme are assimilated by them and what features need more emphasis and
follow up to enhance their experience, trust and value of the product.
Table 8.13: Motivations to enrol for the PMFBY in the next season
Haliyal Sindhanur Shirahatti Naragund
Lower premium
(29%), coverage of
crop failure due to
weather-based
factors (19%),
coverage of risk at
multiple stages
(11%)
Coverage of risk at
multiple stages (17%),
clarity of sum insured
(16%); coverage of
risk at standing crop
stage (10%); more
coverage of crops
(8%)
Coverage of crop
failure due to
weather-based factors
(27%); Coverage of
risk at multiple stages
(17%), Coverage of
risk at sowing stage
(16%),
Coverage of risk at
multiple stages
(24%); Coverage of
crop failure due to
weather-based
factors (18%),
Coverage of risk at
sowing stage (13%);
Coverage of risk at
standing crop stage
(9%), Coverage of
risk due to local
calamity (9%)
Source: Primary Survey Data
Note: The percentages were derived by dividing the total responses (including multiple responses) by farmers.
Understanding Basis Risk:
We make use of threshold yield and average yield of paddy (in kilograms per hectare) provided
by the DoA, GoK. The average yield estimated through CCE is available only for the Kharif
season. Therefore, the analysis is limited to the GPs selected for survey in Haliyal and
Sindhanur taluks. Following Jensen et al (2014), we define covariate risk as the average losses
reported by the farmer at a particular IU level (gram panchayat) during Kharif 201642; and the
remainder of the average losses is defined as idiosyncratic loss specific to each farmer in that
IU during Kharif 2016. The basis error is defined as the difference between the losses in yield
reported by the farmer and by the index value (threshold - average yield). The positive value of
basis error indicates that the losses experienced by the farmer are more than the losses
covered by the insurance scheme - false negatives. The negative value indicates that the loss
experienced by farmers is less than the losses covered by the insurance scheme - false
positives. The variance of basis error is often defined as basis risk.
42
It should be noted that we make use of losses reported by the farmers themselves for estimating the covariate and idiosyncratic risk. These self-reported values may contain an upward bias as farmers may have reported a higher value to avail claim settlements.

64
In Haliyal, the average difference between threshold and average yield is about 70.25 percent
which translates to estimated loss of 1,828 kg per hectare. The deviation is more than 50
percent in all the 13 GPs, even reaching about 90 percent in two GPs. While the severe drought
during Kharif 2016 can be attributed to the low average yield, the huge deviation still raises
questions about the reliability of threshold and average yields in predicting losses at the IU level.
In this case, the high threshold yield increases the probability of false positives where individual
losses are lesser than estimated area losses. This can have a perverse effect on resource
allocation at the household level. An examination of the basis error reveals that the insurance
doesn't identically cover all the losses experienced by farmers. This loss not covered by the
crop insurance scheme is higher for farmers in GPs, namely Badakanashirada, Chibbalgeri,
Janaga, Kesarolli, Tatwanagi, and Yadoga in Haliyal. The higher uncovered component, or the
basis error, reduces the incentive for farmers residing in these GPs to enrol for the PMFBY.
Table 8.14: Threshold and average yields and basis error in Haliyal
Gram panchayat
Threshold
yield (in
kgs per
hectare)
Average
yield (in
kgs per
hectare)
Difference
between
threshold and
average yield
Difference
(%)
Average
basis
error
Alur 2,693 560 2,133 79.20 205
Ambikanagar 2,551 272 2,279 89.33 458
Arlawada 2,895 1,049 1,846 63.77 980
Badakanashirada 2,429 1,208 1,221 50.26 1,362
Bhagavati 2,348 732 1,617 68.83 643
Chibbalageri 2,520 1,102 1,418 56.27 1,419
Janaga 2,417 808 1,609 66.55 1,169
kesarolli 2,705 791 1,913 70.74 948
Nagashettikoppa 2,862 232 2,630 91.89 113
Sambrani 2,982 902 2,081 69.77 550
Tattigeri 2,551 843 1,709 66.98 695
Tatwanagi 2,257 425 1,832 81.16 1,137
Yadoga 2,526 1,047 1,479 58.56 1,090
Average 1,828 70.25 828
Source: Department of Agriculture, Government of Karnataka
Note: The data was not available for Ambewadi GP, therefore not included.
In Sindhanur, the average difference between threshold and average yields indicate that there
are no losses and therefore no claim settlements, except for enrolled farmers in the
Pagadaddinni and Virupapur GPs. But examination of basis error reveals a significantly higher
amount of losses experienced by farmers not covered by the crop insurance scheme. The
average basis error for these 12 GPs is about 2,388 kgs per hectare, indicative of the higher
uncovered component which farmers have to bear despite enrolling with the PMFBY. This false
negative has greater implications for the uptake of the PMFBY and as it is not clear whether the
individual farmer is actually reducing risk by paying premiums for crop insurance. In sum, the

65
analysis suggests that it is important to reduce the magnitude of basis error to ensure that the
farmers are able to cope with the crop loss resulting due to risks covered under the PMFBY.
Table 8.15: Threshold and average yields and basis error in Sindhanur
Gram Panchayat
Threshold
yield (in
kgs per
hectare)
Average
yield (in
kgs per
hectare)
Difference
between
threshold
and
average
yield
Difference
(%)
Average
basis
error
Badarli 5,571 7,052 -1,481 -26.58 1,491
Bappur 5,224 7,307 -2,083 -39.87 1,545
Chennalli 6,186 7,202 -1,016 -16.43 2,779
Gunjalli 5,505 6,826 -1,321 -24.00 3,349
Madasirwar 4,629 5,451 -822 -17.76 2,991
Pagadadinni 6,031 5,924 107 1.78 939
Somlapur 5,305 6,684 -1,379 -25.99 2,608
Tidigol 5,829 6,816 -988 -16.94 2,823
Udabal 5,649 8,556 -2,907 -51.46 4,118
Valaballary 6,155 8,079 -1,924 -31.26 1,506
Virupapur 5,803 4,884 919 15.84 2,168
Yelekudlagi 5,435 7,027 -1,591 -29.28 2,341
Average -1,207 -21.83 2,388
Source: Threshold and average yields provided by the DoA, GoK
Note: The data was not available for Gonwar GP which is not included in the analysis here.
.
8.4 Current Status of the PMFBY and measures adopted by the DoA
The chart below provides a high-level snapshot of both crop-wise and district-wise coverage of
the PMFBY for the current Kharif 2017 season. Maize, tur dal, green gram, groundnut and
paddy continue to be the most insured crops in the Kharif season. Only five northern districts of
Karnataka (comprising 30 districts) account for close to 50% of the total insured crop area in the
Kharif season. This is a reflection of the anticipation of harsher drought conditions in the
northern districts of Karnataka.

66
Figure 8.4: Top five crops and top five districts under PMFBY (based on insured crop
area)
Source: Samrakshane Crop Insurance Portal
However, our survey findings reveal that there are serious gaps in implementation of the
PMFBY, especially lack of information at the IU level (Annexure: Table 13.93-13.96) and basis
risk. The DoA, GoK, has already undertaken several measures for improving the
implementation of the PMFBY. These measures are discussed below:
Crop area estimation:
Currently, there is a mechanism of reconciliation of crop sown area statistics done at the taluk
and district levels. However, updating the crop sown statistics by using a mobile app (RTC App)
that enables the village accountant to go to each field and update the crop statistics is planned.
This in turn would enable automatic enumeration of crop-wise sown statistics and the estimation
of production statistics and this reconciliation exercise could be done away with. This would also
help in the improving the randomisation of CCEs for each of the crop based on the area under
cultivation. Currently, random numbers are generated and the plots are visited to check whether
or not the notified crop is being grown. In case it is not being grown, another plot is randomly
16%
8%
8%
8%
11%
49%
KHARIF 2016
Bidar Haveri Dharwad
Gadag Kalaburgi Others
11%
11%
9%
8%
7%
54%
KHARIF 2017
Bidar Haveri Dharwad
Gadag Vijayapura Others
22%
16%
11% 10% 10%
31%
KHARIF 2017
Maize Pigeon pea (tur) Green Gram
Groundnut Paddy Others
12%
22%
11% 9%
14%
32%
KHARIF 2016
Maize Pigeon pea (tur) Green Gram
Cotton Paddy Others

67
selected. In the event of the accurate crop sown area estimation through RTC app, the
randomisation would happen within the cropped areas of a particular crop.
Smart sampling of CCEs:
Currently, the CCEs for every crop are same and the two plots adjacent to each other (and
homogenous in many ways) but belonging to different GPs may have chances of getting
different compensations or one may get compensation while the other may be denied it for crop
loss. The adoption and usage of innovative technologies (such as RST, drones, GIS and smart
phones) is an important feature of the PMFBY. It has been reasonably proven that satellite
imagery can help in demarcating the cropped areas into clusters on the basis of crop health.
This can help in the ‘smart sampling’ of CCEs. This minimises the total CCEs needed by about
30-40%. In some instances, when the area insured is much more than the total sown area of the
crop resulting in reduction of sum insured and consequently reduction in claims of farmers.
RST/satellite imagery can also be used to minimise these sorts of area discrepancies. Research
is also ongoing to establish a strong correlation between yield estimates predicted by
RST/satellite image-based computational models and actual yield estimates through CCEs. In
the long term, state governments and insurance companies may use these models to directly
estimate crop yields at the IU level, subject to both parties being satisfied with the prediction
accuracy to service the claims.
Sorting out the glitches in implementation:
While the first year of implementation had issues, many of them are being addressed and
changes have been made in the bidding process, notification, enrolment, and claims settlement.
One of the important issues was the delay in the settlement of claims. The steps like use of
mobile app to conduct all the CCEs (Kharif 2016 CCEs were 60% manual and 40% app based)
has hastened the process of the estimation of crop yields. Similarly, clear deadlines have been
imposed on insurance companies for contesting the yield or CCE data (three days if the CCEs
were witnessed by insurance companies and seven days if the insurance companies have not
witnessed the CCEs). The mobile app is modified to record the CCEs of multi-picking crops like
cotton. The CCE calendar is shared with the insurance companies through the mobile app.
8.5 Budget analysis of the Government of Karnataka
This helps to understand the extent of public expenditure incurred for providing crop insurance
cover to the farmers. It will also serve as a backgrounder by providing an overview of different
public expenditures targeted towards the welfare of farmers critical in understanding the uptake
of the PMFBY in the state. It is necessary to be clear that the PMFBY is operating in an
environment where farmers are impacted by various types of input subsides, support price
mechanisms and schemes promoting improved packages of practices for crop cultivation.
Therefore, the perception and assessment of risk by the farmers and their assumption of the
role of the government is also influenced by these factors.
The state through its DoA, Departments of Horticulture, Sericulture, Co-operation and the
Agricultural Marketing Board, has been incurring various forms of expenditure that are targeted
towards the farmers. These expenditures include:
subsidies towards different inputs to agricultural production (seeds, fertilisers etc.)

68
schemes aimed at improving the production and productivity which carry subsidies for
adopting improved practices (use of improved agriculture machinery, micro irrigation)
provision of credit at lower interest rates, incentive for milk production and ex-gratia for
death of farm animals in case they are not insured
indirect subsidies such as power, food and housing, minimum floor price procurement
and loan waivers (if any)
Provision of inputs like seeds and fertilisers:
While the breeder seeds are produced by the Indian Council of Agricultural Research (ICAR)
institutes and agricultural universities, the certified seeds are produced by National Seeds
Corporation, Karnataka State Seeds Corporation, Karnataka Co-operative Oilseeds Growers
Federation and private agencies using the breeder seeds. Certified seeds were produced for 14
crops43 in Kharif (1.72 lakh quintals) and sold at subsidised rates for 15 lakh farmers. Similarly,
during the Rabi season, certified seeds were produced 12 crops (1.72 lakh quintals) and were
sold at subsidised rates for 3.59 lakh farmers. The amount of subsidy spent during 2016-17
was Rs 7909 lakh and Rs 4210 lakh in the Kharif and Rabi seasons respectively. Fertiliser is
also supplied by the government at subsidised rates. The requirement of different grades of
fertilisers (nitrogenous, phosphorus and potash) for the year 2016-17 for the Kharif and Rabi
seasons was estimated at 21.75 lakh tons and 15.5 lakh tons respectively. The Karnataka State
Co-operative Marketing Federation ensures timely supply and availability at district and taluk
levels by maintaining buffer stock of these fertilisers. Around 17.5 lakh tons of NPK fertilisers
are utilised in farm production annually in the last four years.
Schemes:
While certain schemes are universal, others are applicable to certain geographical areas. The
farmer has to apply to avail the benefit of the schemes. The National Food Security Mission
(NFSM), the National Mission on Oilseeds and Oil palm (NMOOP), the National Mission for
Sustainable Agriculture (NMSA) and Krishi Bhagya are some of the schemes specific to certain
areas. Schemes like Rashtriya Krishi Vikas Yojana (RKVY) and the micro irrigation scheme are
universal throughout the state.
Krishi Bhagya: This scheme, started in 2014-15, is aimed at improving the production and
productivity in the dry zones of Karnataka. A total of 105 taluks in 23 districts have been
covered under this scheme. Construction of farm ponds, diesel generators for lifting of the water
from farm ponds, micro-irrigation facilities (drip/sprinkler set up), farm machinery are offered for
rent at subsidised rates, construction of poly houses are encouraged. Blocks/taluks with the
lowest rainfall are selected and preference is given for small, marginal farmers belonging to SC
and ST categories. The subsidy for SC and ST is 90% while for others, it is 80%. The scheme
is tied to ensure adoption of improved agricultural practices such as soil testing, use of improved
seeds and varieties, judicial use of fertilisers and water resources. This scheme also has
components for improving animal husbandry and horticulture as well.
43
Paddy, ragi, jowar, maize, bajra, navane, cowpea, green gram, black gram, red gram, groundnut, sunflower, soyabean and cotton.

69
GoI-sponsored schemes such as RKVY, the Pradhan Mantri Krishi Sinchai Yojana (PMKSY),
the Micro Irrigation scheme and the Soil Health Management scheme have been implemented
by GoK. RKVY has multiple objectives and offers flexibility for states to tailor schemes to their
requirements. Bhoochetana, the soil health card, which involves soil testing and recommending
crops and fertiliser doses is part of it. Similarly, the micro irrigation scheme and farm
mechanisation are also part of the RKVY. An amount of INR 234 crore has been allocated for
year 2016-17. NFSM focuses on farm-level demonstration by subsidising the entire package of
practices. New farming techniques, application of inputs, post-harvesting techniques are
introduced. About 100 hectares in each of the sub taluk/hobli is targeted in the core production
areas. Rice, pulses and coarse cereals are covered in this scheme. An amount of INR 222 crore
has been allocated for the year 2016-17. The National Mission on Sustainable Agriculture
focuses on use of micro irrigation, rainfed area development and organic farming technologies.
Similarly, the mission on oilseeds and micro irrigation focuses on the improving the production
of oilseeds and water productivity respectively. GoK has been effectively using the technology
to implement most schemes. Geo-tagging of the farm interventions and transfer of monies to
accounts of farmers directly (according to the stage-wise progress of the implementation of
scheme) are followed stringently.
Apart from these schemes through which farmers become beneficiaries and farm land gets
improved, incentives like provision of credit at lower rates is critical and universally available for
all farmers. GoI (through commercial and regional, rural banks) provides SAOLs or crop loans at
7% per annum. This is further subsidised for farmers who pay it back in time to an extent of
three per cent thus making it four per cent effective interest. GoK has been providing an
additional 1% interest rate subvention and thus making it three per cent effective interest rate for
crop loans from commercial banks and RRBs. GoK also provide crop loans at 0% (up to INR 3
lakhs) and term loans up to INR 10 lakhs at 3% interest through farmer co-operatives (PACs).
GoK also provides incentive for milk production at INR four a litre. Subsidies are provided to
farmers for formation of cattle units, sheep and goat units, as well as poultry units. The subsidy
is 25% for non SC/ST and 75% for SC/ST farmers. An ex-gratia for death of animals which are
not insured is also provided.
Table 8.16: Subsidies, loan waivers and drought relief provided by GoK
Description 2013-14
AE
2014-15
AE
2015-16
AE
2016-17
RE
2017-18
BE
Subsidies (power, food and housing)
INR in crores 16329 15334 19164 18616
Loan waiver (INR in crores)
8165
Drought relief (INR in crores)
1540.244 79545
Source: Government of Karnataka
44
http://www.thehindu.com/todays-paper/tp-national/tp-karnataka/rs-1540-crore-drought-relief-for-belagavi/article8333758.ece 45
http://timesofindia.indiatimes.com/business/india-business/centre-approves-rs-795-cr-drought-assistance-to-ktaka/articleshow/59367394.cms

70
Farmers enjoy free power supply (though it is erratic, with unscheduled power cuts) for irrigation
purposes and this is subsidised by the government and the subsidy goes to power supply
companies. Similarly, the subsidy on supply of free ration (Anna Bhagya) for BPL families and
subsidy for housing also reach the farming community in significant manner. Farmers also
benefit from loan waivers and drought relief at times of severe distress (Table 8.16).
The Minimum Floor Price (MFP) is the price at which the government steps in to the market to
avoid further price fall and procures the farm produce to ensure returns to the farmer. A
revolving fund is set up which is administered by the Karnataka State Agricultural Marketing
Board for which the government and the Agriculture Produce Cooperative Marketing
Committees across the state contribute regularly. The Board enters the market and procures the
produce in the event of prices falling below the MFP indicated every year. During 2016-17,
paddy, ragi, jowar, coconut and onion were procured by the Board by entering into the market.
An amount of INR 637 crores was spent in procuring 36.86 quintals of produce.
Budget analysis:
The Demand for Grants (01 Demand) presented before the legislature for the DoA and the
Departments of Horticulture and Sericulture is analysed for the last five years. About 720 line
items of budget were scanned and are classified into broad categories.
Table 8.17: Expenditure of DoA, Departments of Horticulture and Sericulture (INR in
lakhs)
Description 2013-14
AE 2014-15
AE 2015-16
AE 2016-17
RE 2017-18 BE
Crop Insurance
NIAS/MNAIS/WBCIS PMFBY/WBCIS
13974 8434 9880 67538 84511
Department costs (Salary+ maintenance + transport + office expenses) 133228 167238 179905 170541 160687
Financial assistance/relief 1884 1526 511 7400 7676
Input subsidies 45978 30782 21149 160355 182051
Misc( Departmental transfers) 0 -537 -947 -2228 -5151
Scheme ( RKVY, MI, Krishi Bhagya,etc) 151770 242386 268467 159940 220733
Total 346835 449828 478966 563547 650507
State budget 11064870 12862497 14250821 16447859 18656109
CI as % of agricultural budget 4.03 1.87 2.06 11.98 12.99
Agricultural budget as % of total budget 3.13 3.50 3.36 3.43 3.49
Source: Government of Karnataka
Note: AE= Actual Expenditure RE: Revised Estimates BE: Budget Estimates
The crop insurance expenditure till 2015-16 was on actual basis or the claims settlement paid
through the AIC, the public sector undertaking of the GoI. From 2016-17, because of the upfront
payment of premium, the expenditure has shot up and the proportion of crop insurance
expenditure has also increased to 12 percent and to 13 percent in 2017-18. The input subsidies

71
under micro irrigation and Krishi Bhagya have increased significantly and this has resulted in
higher input subsidies to farmers.

72
9 Implications of study findings
9.1Implications for the intervention
Although the uptake of the PMFBY is greater than earlier crop insurance schemes of similar
nature in Karnataka, it still remains much lower than the all-India average. Considering that the
farmers in the state face widespread uncertainties, the potential for enhancing the uptake
remains high. The GoK is highly responsive and deeply interested in improving the processes to
make the scheme better suited to the needs of small and marginal farmers while also making it
economically viable for insurance companies. Towards that, in consultation with the
implementing department, we have identified two major interventions that could make a
difference in terms of increasing the uptake and enhance the efficiency of loss estimates as well
as time taken for settling the claims.
The pilot study has clearly shown the need for greater awareness of the scheme and its
features among marginal and small farmers and also among the PACs and local government
functionaries as they play a critical role in informing farmers and influencing the uptake.
Currently, the understanding of the enrolment process, features of the area approach, their
implications for eligibility for claims and other related aspects remain weak among farmers. Any
intervention that improves this awareness in a systematic and cost-effective manner is likely to
have a positive influence not only on the uptake but also on the process of claims and their
settlement.
Another intervention that could improve the efficiency of the CCE exercise could influence the
efficiency and delivery of the scheme immensely. The high level of diversity in the number of
agro-climatic zones and the number and types of crops grown coupled with high percentage of
small and marginal farmers in Karnataka pose a serious challenge in terms of the reliability of
CCEs for providing yield estimates which are fair to farmers and acceptable to insurance
companies. The high number of CCEs due to diversity causes high levels of stress on
government machinery to complete the process in a timely and reliable fashion. Any intervention
that helps in reducing the number of CCEs while improving the reliability and fairness of yield
estimates would indeed have a very positive impact on the claim settlement process and time
taken and in turn on improving the livelihood security of small and marginal farmers. In this
context, the government is open to ideas and adept in the use of technology. This provides an
opportunity for trying out technology-based appropriate solutions.
An improvement in the CCE exercise would benefit not only the PMFBY but also other schemes
in operation, as the CCE is conducted for the purposes of estimating yields even in absence of
this scheme. It could be especially helpful in the rationalisation of subsidy-based schemes in
agriculture, something in which the GoK is interested.
The following includes more specific recommendations to the policy and product related to crop
insurance:

73
Policy-related recommendations:
a. Given the complexity and enormity of tasks involved, it is believed that the local GPs can
be given a central role in creating awareness, enrolment drives and providing regular
information/communication about the claim application and settlement process. At the
moment, there are no insurance agents at the GP level which has caused much distrust and
dissatisfaction about the scheme itself. This would be prevented if the local gram panchayat
is given the responsibility of implementation with the DoA and district authorities play a
central role in establishing directives and goals.
b. Considering the lower participation of female landowners in PMFBY, despite the fact that
operational guidelines mention the need for ‘special efforts to promote their participation’, it
is recommended that the insurance company and its intermediaries take specific measures
to step up improving their access to insurance schemes. One measure could be to work with
women self-help groups such as Mahila Samakhya and Stree Sakthi in Karnataka to
educate, link insurance with banking and other economic activities, and promote uptake of
PMFBY.
c. For a state like Karnataka where multiple crops are grown in different seasons, it is
recommended that a single approach of yield estimation either through area-based or
weather-based or satellite images should not be adopted. In order to achieve scale in the
short-run, it is best that a combination of approaches is used where the choice of a
particular approach is determined by the trade-off between basis risk and increased
coverage through trust in the insurance product. In the long run, once the necessary
infrastructure is built, a slow transition to adopting a single approach across all crops during
different seasons could be adopted.
d. Building infrastructure includes investing in both enhancing the technical expertise and
physical infrastructure. From our discussion, we are aware that the DoAi s interested in
making use of satellite imagery to (i) identify areas/plots where a notified crop is cultivated
thereby transition to smart sampling process is possible and (ii) improve the accuracy of the
yield estimation. It is recommended that investments be made in (i) upgrading human
capital, (ii) identification of new techniques of estimation and (iii) investment in physical
infrastructure (such as data management systems, better equipment and so on) to achieve
both these objectives. In the short run, the DoA should invest towards operationalizing smart
sampling. This will help in easy identification of areas and more accurate randomisation of
plots thereby making the CCE process more efficient and robust.
e. The incorporation of smart sampling can then lead to identification of crops for which
satellite imagery could be used or further developed to be able to estimate yield accurately.
This in a way will facilitate in separating the crops for better-suitability to weather-based or
yield-based methods. Given the evidence from literature, it is recommended that the
government invests in weather stations and move towards weather-based index. In the long
run, a move towards adopting satellite imagery is recommended as the weather may vary
frequently and drastically due to climate change with implications for weather-based index.

74
f. It is recommended that not only awareness is created about the insurance product, but the
rationale, modus operandi and benefits of the crop insurance is also imparted to the
farmers. The objective should be to ensure that the farmers take up crop insurance in an
informed manner rather than investing only in efforts to increase enrolment rates without
improving the knowledge about the product. One particular method is the use of videos
through mobile technology (especially social media applications) and regular/frequent
screening at the GP/village level. The use of mobile technology ensures maximum reach to
both the farmers and officials. However, the success of this strategy to impart knowledge
needs to be better understood.
g. One of the impediments towards faster insurance payout to the farmer is the CCE results
being contested by insurance companies at the time of claims settlement. To address this
issue, Karnataka is piloting an initiative where they allow an insurance company
representative to witness the CCE process. The primary worker records the actual yield data
in the mobile app, and before transferring the data to the central server the yield data,
he/she is required to authenticate the data by the representative using an OTP. In case of
any dispute the representative needs to raise an objection through the mobile app itself.
However, if the representative hasn’t witnessed the CCE, the objection could still be raised
on the portal within certain time period post the completion of CCE. If not, the CCE data is
considered accepted by the insurance company. It is recommended that the Government of
India considers this approach for implementation at the national level.
h. Currently, the plots for conducting CCEs are randomly assigned by the crop insurance
portal database and executed through a mobile app. The primary worker (PW) responsible
for conducting the CCE receives a random plot/survey number on his mobile phone and
then needs to ascertain if the notified crop has been sown in that plot. If the notified crop is
not sown on the randomly assigned plot, the PW needs to go to the next plot/survey number
and if the notified crop hasn't been sown on that plot also, the PW needs to go to the next
and this continues till the PW finds a plot that has sown the notified crop. This is a highly
inefficient and cumbersome part of the process of conducting CCEs. Instead, satellite
imagery/remote sensing technology can be leveraged, especially for a few selected long-
standing crops (such as paddy, jowar and cotton) and selected areas/districts with low cloud
cover to first arrive at a pool of plots/survey numbers that have actually sown the notified
crop within a specified IU. From within this pool, plots/survey numbers can then be randomly
assigned for conducting the CCEs. This would help in randomisation within only those
plots/survey numbers which have actually grown the notified crop during that season,
optimising the process. The usage of satellite imagery/remote sensing technology can also
be further extended to intelligently sample the plots/survey numbers for conducting CCEs
within an IU based on crop density [high/medium/low] to ensure that they accurately
represent the crop yield within that IU. This would help in reducing the basis risk. To
eventually move away from CCEs, direct crop yield estimation models (For a few major
crops such as paddy, cotton and jowar in Rabi in a few selected areas) after thorough
validation using manual CCE data can be developed. These models have the potential for

75
reducing the effort and overall time taken for crop loss assessment, thereby enhancing eh
efficiency.
i. Currently, PMFBY covers only those crops for which the past yield data is available. This
limits not only the coverage of crops under PMFBY but also has the potential to discourage
farmers from cultivating a new crop or a new variety for which the data may not be available.
It is recommended that PMFBY offers coverage, may be slightly at a higher premium -say 3
% - for new crops. This will ensure that the farmers continue to enjoy the flexibility to decide
rationally about the choice of crops they want to cultivate in a particular season.
j. A timeline needs to be defined by which insurance companies are to return the premium
amount to farmers whose applications have been rejected. This could be before the start
date of claims settlement after which the insurance companies should be made liable to
settle the claims of all such farmers whose premium amounts have not been returned.
Product-related recommendations
a. One option could be to introduce a “no-claim bonus” feature under PMFBY. A 10% no-
claim bonus waiver on the farmer’s share of the premium amount for every consecutive
claim-free year insured, up to a maximum of 50% could be considered. This could serve as
an incentive for farmers to sustain enrolment in the scheme.
b. Currently in PMFBY, for all major crops the defined IU is a GP and CCEs are conducted
in four randomly selected plots/survey number (two per village) to estimate the actual yield
for that particular IU. The claims payout to all farmers within this IU/GP is based on the
shortfall in yield (threshold yield – actual yield). This results in a higher basis risk since the
four randomly selected plots/survey numbers may not accurately represent the actual yield
across that GP. Instead rainfall data, soil health reports, historical yield data and satellite
images could be used to define more homogeneous yield clusters as IUs instead of GPs.
However, this definition of IUs needs to be finalised well before the cropping season.
c. It is recommended that the time line for notifying the insurance companies for localised
risks and post-harvest losses is increased from 48 hours to 96 hours. The relaxation of the
48 hour time limit will provide enough time for the farmer to be able to collate all the required
documents for claim applications. Second, it would also ensure that the window is not
missed due to factors such as weekends/festivals/other local holidays. Finally, it is
recommended that further relaxation should be reviewed and allowed in the case of extreme
events.
Implications for further research
There is indeed a lot of value in carrying out a full-fledged, long-term evaluation of the scheme,
especially on the basis of some specific, well-designed interventions with the potential for
improving the processes of enrolment and claim settlements, which in turn will increase the
uptake.

76
The state also offers opportunities for carrying out official data-based analysis on a regular basis
and matching those with field-based evaluations because of the presence of a highly informative
and interactive web-based portal, Samrakshane, and digitised land records in Bhoomi helps in
understanding targeting patterns over a period of time as it allows analyses of trends in land-
size, crops grown and crop insurance uptake.
The state is also trying out several institutional models in terms of involving GPs, PACs and
banks to improve delivery. An exploratory study of the institutions and stakeholders, their
capacities, interests and potential could help the government in carrying out the desired
restructuring and reforms at various levels.

77
10 Major challenges and lessons learnt
The process evaluation presented a number of challenges and the experience has prepared us
for carrying out the full evaluation at the next stage. The challenges faced and solutions found
are listed here:
10.1 Obtaining ethical approvals from institutional review boards:
Due to time constraints, we did not obtain ethical approval from review boards. Instead, we
constituted an Advisory Committee with representation from noted academics in the areas of
economics, agricultural economics, quantitative research and the implementing agency. They
met periodically and provided inputs not only on the research design but also discussed ethical
aspects of the evaluation. For the second phase, we intend to submit the proposal for ethical
review to the Board that exists at the Indian Institute of Management, Bangalore (IIMB) soon
after submitting it for review and approval. This would help in obtaining the ethical approval
simultaneously with funding approval.
10.2 Obtaining approvals from the relevant government departments to run the
implementation and/or evaluation:
With some efforts in the initial phase, we obtained approvals and support from the GoK primarily
due to our existing relationships and credibility. One team member was located in the
implementing unit of the government and she would continue to be placed there for the next
phase of evaluation as well. Another colleague also spent substantial time in both
understanding and also supporting the implementing agency.
10.3 Engaging with key stakeholders at various stages of the study and data
collection:
Given the support received from the implementing agency, it was not difficult to consult and
engage with different stakeholders. The DoA had issued a letter of introduction and support for
consultations and survey.
10.4 Monitoring and understanding the fidelity of the programme roll-out:
Positioning a colleague within the implementing agency helped in understanding the role of
various stakeholders, including different departments and agencies such as insurance
companies. Also, our own experience and credibility played a role in establishing relationships
that in turn helped in monitoring the processes.
10.5 During data analysis and adhering to the planned timeline:
A planned timeline for this phase proved to be too tight but we could complete the analysis of
the primary survey as well as of the data collected from other sources primarily because of the
effective planning and collaborations with the survey agency, implementing agency and the
advisory committee members.

78
11 Appendices
11.1 References
Binswanger, H. (1980). Attitudes toward risk: Experimental measurement in rural India.
American Journal of Agricultural Economics 62 (3), 395‐407.
Bryan, G. (2010). Ambiguity and insurance. Unpublished manuscript.
Clarke, D.J., Clarke, D., Mahul, O., Rao, K.N. and Verma, N., 2012. Weather based crop
insurance in India.
Decron, S, 1996, Risk, Crop choice and Savings: Evidence from Tanzania, Journal of
Development Economics, vol 55:1-42
Department of Agriculture, Cooperation and Farmers Welfare. (2016). Operational Guidelines:
Pradhan Mantri Fasal Bima Yojana. Ministry of Agriculture and Farmers Welfare, Department of
Agriculture, Cooperation and Farmers Welfare. New Delhi : Ministry of Agriculture and Farmers
Welfare.
Department of Agriculture, Government of Karnataka, KRS-PMFBY/R-WBCIS Bid Document,
7/3/2017
Department of Agriculture, Government of Karnataka, KRS-PMFBY/R-WBCIS Bid Document,
7/4/2017
Deshingkar, P. and Akter, S., 2009. Migration and human development in India
Dhawan, B. (1985 ). Irrigation Performance during Drought . Economic and Pollitical Weekly ,
20 (28 ), 1191-1196.
Dyer, C., 2012. Formal education and pastoralism in western India: inclusion, or adverse
incorporation?. Compare: A Journal of Comparative and International Education, 42(2), pp.259-
281.
Economic and Political Weekly . (1969). Farm Credit in Kind . Economic and Political Weekly , 4
(37), 1466.
Fafchamps, M., & Pender, J. (1997). Precautionary saving, credit constraints, and irreversible
investment: Theory and evidence from serniarid India. Journal of Business and Economic
Statistics, 15(2), 180-194.
Foster, A., and Rosenzweigh, M. (2011). Are Indian farms too small? Mechanization, agency
costs and farm efficiency.Economic Growth Center.
Government of Karnataka, Economic Survey of Karnataka 2016-17.
Government of Karnataka, SLCCCI Proceedings, 16/5/2017
Government of Karnataka, SLCCCI Proceedings, 19/4/2017
Government of Karnataka, SLCCCI Proceedings, 19/5/2017
Government of Karnataka, SLCCCI Proceedings, 22/5/2017

79
Government of Karnataka, SLCCCI Proceedings, 28/2/2017
Government of Karnataka, SLCCCI Proceedings, 30/5/2017
Government of Karnataka, SLCCCI Proceedings, 4/5/2017
Government of Karnataka, SLCCCI Proceedings, 5/6/2017
Hazell, P. (2001). Potential Role for Insurance in Managing Catastrophic Risk in Developing
Countries. International Food Policy Research Institute.
Kalavakonda, V., and Mahul, O. (2005). Crop Insurance in Karnataka . World Bank Publications
, 3654.
Karnataka Agricultural Price Commission. (2016, july) Retrieved July 27, 2017, from karnataka
agricultural price commission website: http://kapricom.org/downloads/reports/decadal-shift-
cropping-pattern-karnataka-july2016.pdf
Mahendra Dev, S. (2000). Economic Reforms, Poverty, Income Distributions and Employment .
The Economic and Political Weekly , 35 (10), 823-835.
Mahul, O., &Stutley, C. J. (2010). Government support to agricultural insurance: challenges and
options for developing countries. World Bank Publications.
Ministry of Agriculture and Farmers Welfare, (2017), Report of the Comptroller and Auditor
General of India on Performance Audit of Agriculture Crop Insurance Schemes, No 7, Union
Government (Civil).
Morduch, Jonathan, 1991, Poverty and Vulnerability, TheAmercian Economic Review, Vol 84,
No.2, Papers and Proceedings of the Hundred and Sixth Annual Meeting of the American
Economic Association (May, 1994), 221-225
Moschini G., Hennessy D. A. (2001). Uncertainty, Risk Aversion and RiskManagement for
Agricultural Producers, Handbook of Agricultural Economics,Volume 1.
Munshi, K., and Rosenzweig, M. (2009). Why is mobility in India so low? Social insurance,
inequality, and growth. National Bureau of Economic Research , w14850.
OECD. Publishing. (2009). Managing Risk in Agriculture: A Holistic Approach. Organisation for
Economic Co-operation and Development.
Pankaj, A. (2016). Shift in MGNREGS from UPA to NDA . EPW Engage.
Planning Commission (2013). Twelfth Five Year Plan (2012-2017) Volume || Economic Sectors
Planning Commission. (2008). Eleventh Five Year Plan (2007-2012) Volume III Agriculture,
Rural Development, Industry, Services, and Physical Infrastructure
Punit, A., and Attar, U. (1986). Karnataka-Farmers Agitation Opposing Loan Recovery .
Economic and Political Weekly , 21 (2), 63-64.
Rama Rao, C.A. et al,(2016) A district level assessment of vulnerability of Indian agriculture to
climate change, Current Science, Vol 110, (10), 1939-1946

80
Ramachandran, S. (1989). Banking Regulations and Islamic Finance . The Economic and
Political Weekly , 2835- 2840.
Rosenzweig, M. (1988). Risk, Implicit Contracts and the Family in Rural Areas of Low-Income
Countries. The Economic Journal , 393 (98 ), 1148-1170.
Rosenzweig, Mark and Binswanger, Hans, 1993, Wealth, Weather Risk and the Composition
and Profitability of Agricultural Investments, Economic Journal, 1993, vol 103, issue 416, 56-78
Saldhana, A., and Salve, P. (2017 , June 17 ). India faces Rs 3 lakh cr farm loan waivers -16
times 2017 rural roads budget. Business Standard.
Singh, S. K. (n.d.). De-ploughing the "Rural". Economic and Political Weekly.
Walker, T. S., & Ryan, J. G. (1990). Village and household economics in India's semi-arid
tropics. Johns Hopkins University Press.