Understanding Sprawl
27
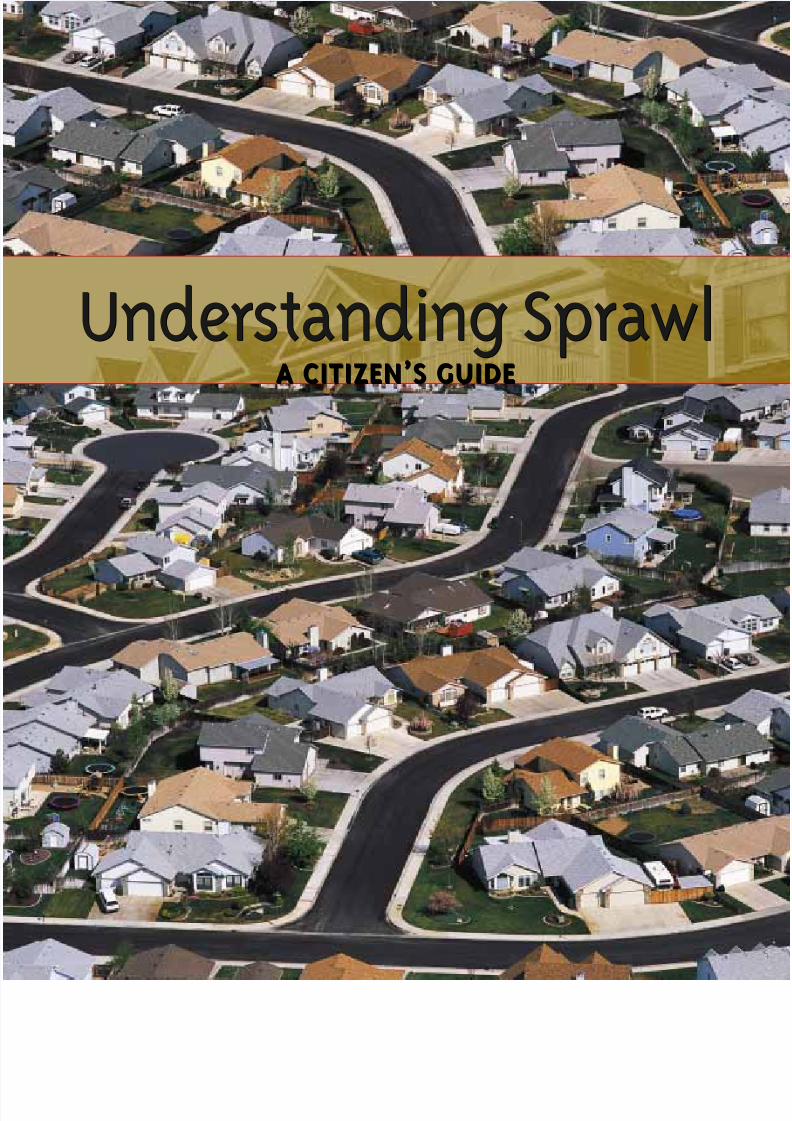
Understanding Sprawl Understanding Sprawl A CITIZEN’S GUIDE A CITIZEN’S GUIDE
Transcript of Understanding Sprawl
8/7/2019 Understanding Sprawl
http://slidepdf.com/reader/full/understanding-sprawl 1/27
Understanding SprawlUnderstanding SprawlA CITIZEN’S GUIDEA CITIZEN’S GUIDE
8/7/2019 Understanding Sprawl
http://slidepdf.com/reader/full/understanding-sprawl 2/27
Understanding SprawlA CITIZEN’S GUIDE
Understanding SprawlA CITIZEN’S GUIDE
8/7/2019 Understanding Sprawl
http://slidepdf.com/reader/full/understanding-sprawl 3/27
8/7/2019 Understanding Sprawl
http://slidepdf.com/reader/full/understanding-sprawl 4/27
Introduction 1
From Compact City to Sprawling Suburb 3
1 Cities and suburbs 3
2 Urbanization and sprawl 43 How transportation determines the way we use land 5
4 Is sprawl the consumer’s choice? 7
The Costs of Sprawl 9
1 Low-density means high cost 9
2 Household costs of sprawl 10
3 Consuming precious land 11
4 Public health 12
5 Climate change 15
6 Energy 16
7 Water 168 Wildlife 17
9 Aesthetics and quality of life 17
Conclusion 19
Other resources 20
Notes 21
Contents
8/7/2019 Understanding Sprawl
http://slidepdf.com/reader/full/understanding-sprawl 5/27
v
Key Recommendations
Citizen participation in decisions concerning your community is key to stopping
sprawl. The best place to start is by establishing a set of community goals.
This will help catalyze citizens.
The following set of goals and recommendations can form a part of every
community plan:
• Protect the environment by preserving parks, ravines, natural areas
and watercourses
• Intensify town centres by enhancing economic activity and promotingmixed use development
• Reinvest along empty corridors and brownfields and redevelop strip mall
type roads
• Promote regional planning
• Promote alternative transportation
• Increase housing and jobs
• Protect the downtown
• Protect existing compact residential neighbourhoods
• Protect agricultural and rural areas by establishing a legislated urban
growth boundary
In addition, each and every citizen can do their part to reduce their personal
ecological footprint by taking the David Suzuki Nature Challenge. Sprawl is not
inevitable.
8/7/2019 Understanding Sprawl
http://slidepdf.com/reader/full/understanding-sprawl 6/27
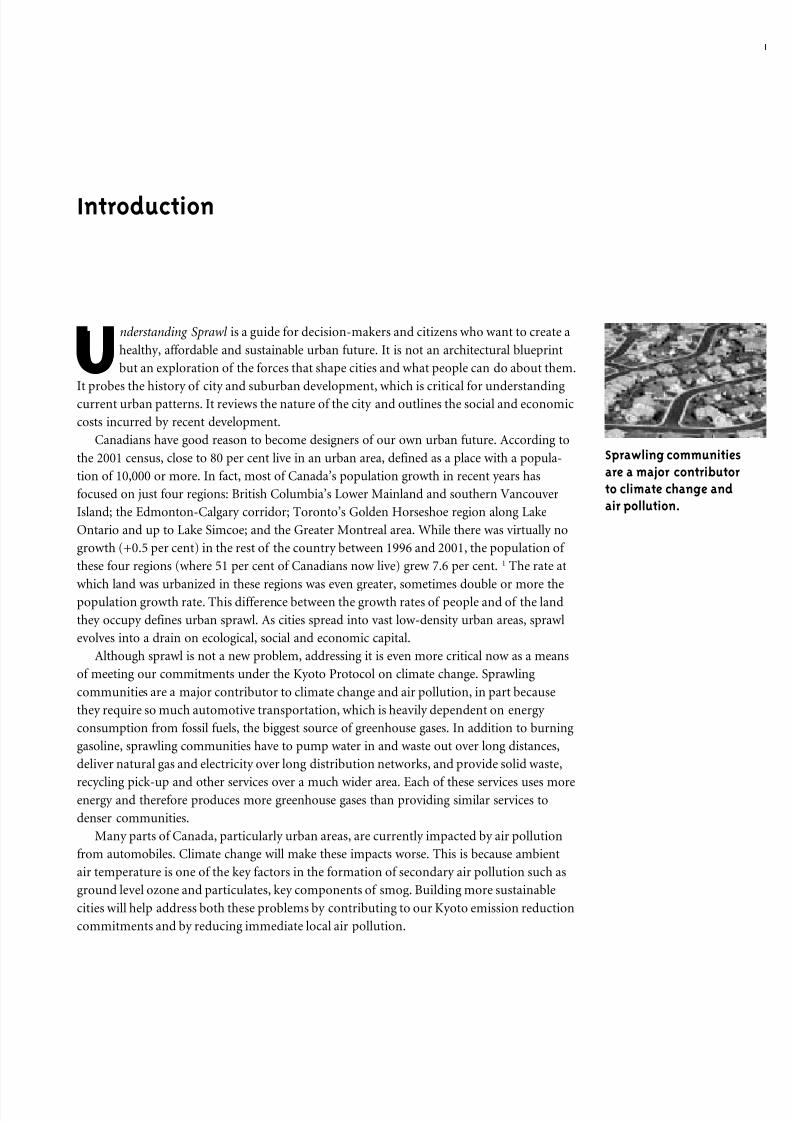
Sprawling communities
are a major contributor
to climate change and
air pollution.
Introduction
Understanding Sprawl is a guide for decision-makers and citizens who want to create a
healthy, affordable and sustainable urban future. It is not an architectural blueprint
but an exploration of the forces that shape cities and what people can do about them.
It probes the history of city and suburban development, which is critical for understandingcurrent urban patterns. It reviews the nature of the city and outlines the social and economic
costs incurred by recent development.
Canadians have good reason to become designers of our own urban future. According to
the 2001 census, close to 80 per cent live in an urban area, defined as a place with a popula-
tion of 10,000 or more. In fact, most of Canada’s population growth in recent years has
focused on just four regions: British Columbia’s Lower Mainland and southern Vancouver
Island; the Edmonton-Calgary corridor; Toronto’s Golden Horseshoe region along Lake
Ontario and up to Lake Simcoe; and the Greater Montreal area. While there was virtually no
growth (+0.5 per cent) in the rest of the country between 1996 and 2001, the population of
these four regions (where 51 per cent of Canadians now live) grew 7.6 per cent. 1 The rate at
which land was urbanized in these regions was even greater, sometimes double or more thepopulation growth rate. This difference between the growth rates of people and of the land
they occupy defines urban sprawl. As cities spread into vast low-density urban areas, sprawl
evolves into a drain on ecological, social and economic capital.
Although sprawl is not a new problem, addressing it is even more critical now as a means
of meeting our commitments under the Kyoto Protocol on climate change. Sprawling
communities are a major contributor to climate change and air pollution, in part because
they require so much automotive transportation, which is heavily dependent on energy
consumption from fossil fuels, the biggest source of greenhouse gases. In addition to burning
gasoline, sprawling communities have to pump water in and waste out over long distances,
deliver natural gas and electricity over long distribution networks, and provide solid waste,
recycling pick-up and other services over a much wider area. Each of these services uses moreenergy and therefore produces more greenhouse gases than providing similar services to
denser communities.
Many parts of Canada, particularly urban areas, are currently impacted by air pollution
from automobiles. Climate change will make these impacts worse. This is because ambient
air temperature is one of the key factors in the formation of secondary air pollution such as
ground level ozone and particulates, key components of smog. Building more sustainable
cities will help address both these problems by contributing to our Kyoto emission reduction
commitments and by reducing immediate local air pollution.
U
8/7/2019 Understanding Sprawl
http://slidepdf.com/reader/full/understanding-sprawl 7/27
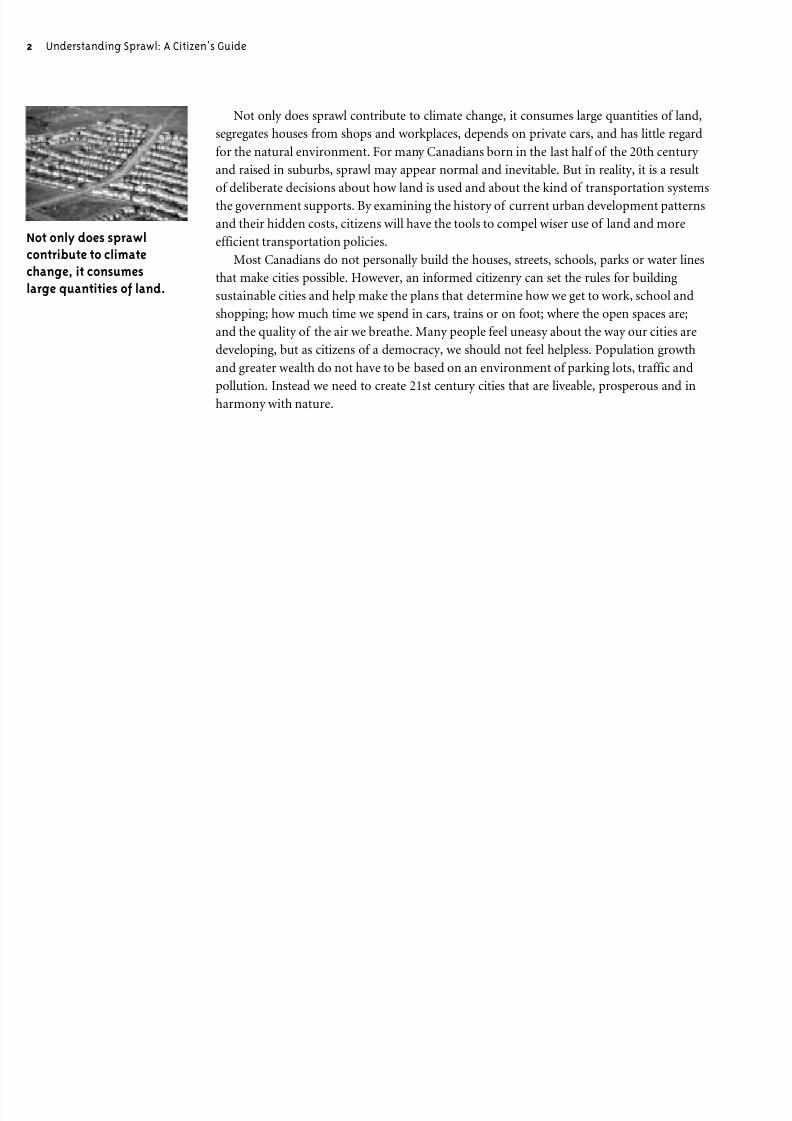
Not only does sprawl contribute to climate change, it consumes large quantities of land,
segregates houses from shops and workplaces, depends on private cars, and has little regard
for the natural environment. For many Canadians born in the last half of the 20th century
and raised in suburbs, sprawl may appear normal and inevitable. But in reality, it is a result
of deliberate decisions about how land is used and about the kind of transportation systems
the government supports. By examining the history of current urban development patterns
and their hidden costs, citizens will have the tools to compel wiser use of land and more
efficient transportation policies.
Most Canadians do not personally build the houses, streets, schools, parks or water lines
that make cities possible. However, an informed citizenry can set the rules for building
sustainable cities and help make the plans that determine how we get to work, school and
shopping; how much time we spend in cars, trains or on foot; where the open spaces are;
and the quality of the air we breathe. Many people feel uneasy about the way our cities are
developing, but as citizens of a democracy, we should not feel helpless. Population growth
and greater wealth do not have to be based on an environment of parking lots, traffic and
pollution. Instead we need to create 21st century cities that are liveable, prosperous and inharmony with nature.
Not only does sprawl
ontribute to climate
hange, it consumes
arge quantities of land.
Understanding Sprawl: A Citizen’s Guide
8/7/2019 Understanding Sprawl
http://slidepdf.com/reader/full/understanding-sprawl 8/27
From compact city to sprawling suburb
Interurbans were
streetcars that started o
city streets but then ran
to the countryside on th
own tracks.
1. Cities and suburbs
Cities have stood out from the surrounding countryside as places of intense human settle-
ment since ancient times. Density defines the city, as does industry – work for people to do –
and markets where people spend their earnings. Historically the spaces in most cities wherepeople lived, worked, shopped, went to school and entertained themselves formed a patch-
work quilt. Downtown may have held a preponderance of office jobs but other workplaces
were scattered through the city, and shopping streets threaded the city’s residential neigh-
bourhoods. Cities were densely populated and diverse. Ironically, while undergoing enor-
mous growth in recent years, North American cities have become less dense and less diverse
in their physical layout.
Canadian cities have changed dramatically in the past half-century. The obvious change is
enlargement: taller buildings, wider highways, expanding boundaries. The more profound
change is in the urban fabric: people live further apart from their neighbours; houses, shops
and workplaces once co-mingled are now segregated; trips once made on foot or by bus or
streetcar are now made by private car. Garage doors rather than front porches dominate
many streets; the shopping mall has replaced downtown; airports rather than railway stations
are the travel hubs.
However, the history of suburbs was not always the history of sprawl. In the first half of
the 20th century, suburbs grew along the tracks of railways and streetcars. This pattern of
growth produced some dignified suburbs that had clearly defined centres at the stations,
surrounded by shops. Suburban residential neighbourhoods were less dense than the central
cities but much more dense than current sprawl. Some suburbs that grew around railway
stations, such as Oakville, outside Toronto, still maintain their suburban status, and good rail
service still connects them to the central city. As cities grew, most of the “streetcar suburbs,”
were absorbed. Mimico, New Toronto, West Hill, and The Beach are Toronto neighbour-
hoods that were originally streetcar suburbs. Outremont, Mount Royal, Dorval and Lachine
in Montreal have similar histories.
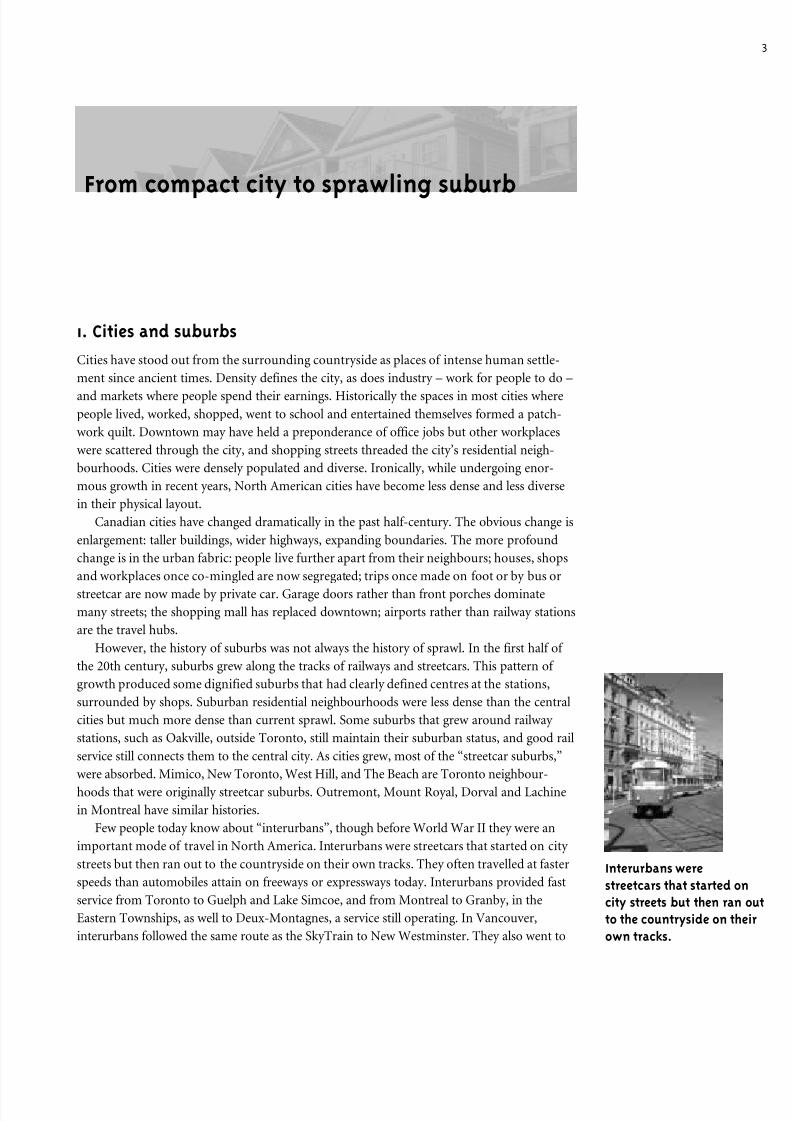
Few people today know about “interurbans”, though before World War II they were an
important mode of travel in North America. Interurbans were streetcars that started on city
streets but then ran out to the countryside on their own tracks. They often travelled at faster
speeds than automobiles attain on freeways or expressways today. Interurbans provided fast
service from Toronto to Guelph and Lake Simcoe, and from Montreal to Granby, in the
Eastern Townships, as well to Deux-Montagnes, a service still operating. In Vancouver,
interurbans followed the same route as the SkyTrain to New Westminster. They also went to
8/7/2019 Understanding Sprawl
http://slidepdf.com/reader/full/understanding-sprawl 9/27
eople who live in
prawling cities and
uburbs today often
xpress uneasiness
bout the immediate
nvironment and
rustration with getting
rom place to place.
Steveston, Langley and Chilliwack. In that era, families were able to choose suburban
living without the sprawl since rails rather than highways were the dominant mode of
transportation.
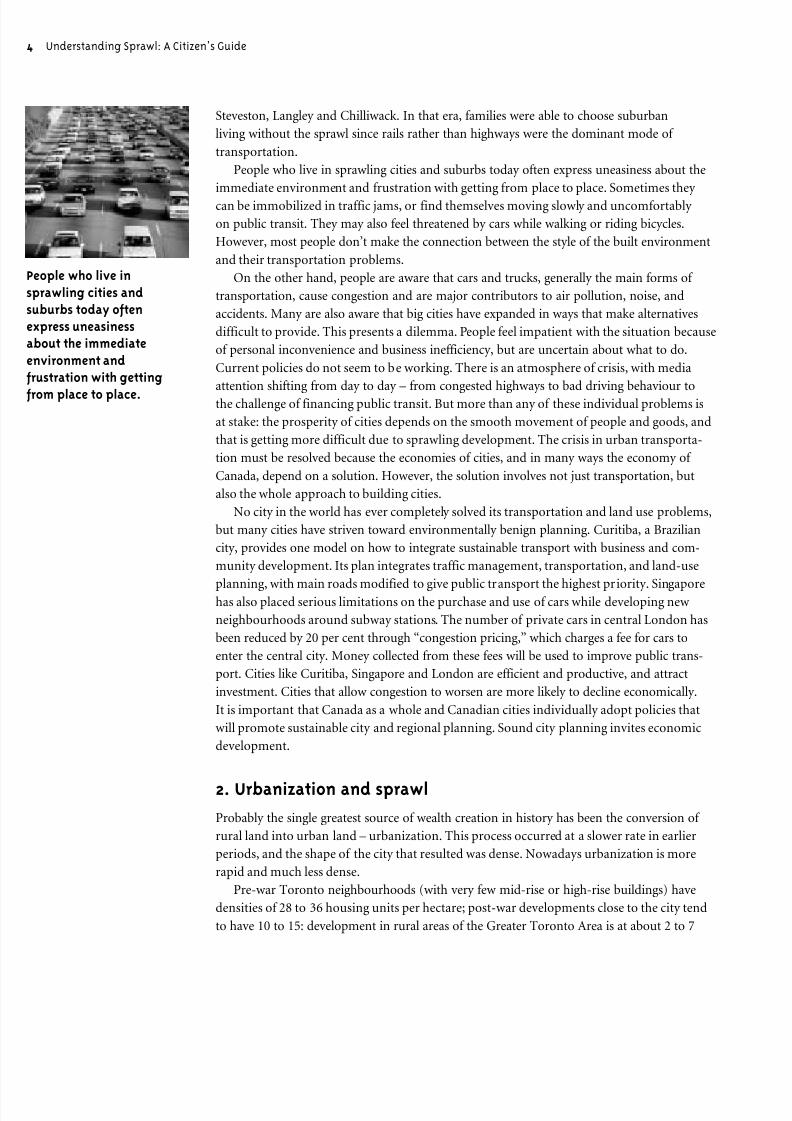
People who live in sprawling cities and suburbs today often express uneasiness about the
immediate environment and frustration with getting from place to place. Sometimes they
can be immobilized in traffic jams, or find themselves moving slowly and uncomfortably
on public transit. They may also feel threatened by cars while walking or riding bicycles.
However, most people don’t make the connection between the style of the built environment
and their transportation problems.
On the other hand, people are aware that cars and trucks, generally the main forms of
transportation, cause congestion and are major contributors to air pollution, noise, and
accidents. Many are also aware that big cities have expanded in ways that make alternatives
difficult to provide. This presents a dilemma. People feel impatient with the situation because
of personal inconvenience and business inefficiency, but are uncertain about what to do.
Current policies do not seem to be working. There is an atmosphere of crisis, with media
attention shifting from day to day – from congested highways to bad driving behaviour tothe challenge of financing public transit. But more than any of these individual problems is
at stake: the prosperity of cities depends on the smooth movement of people and goods, and
that is getting more difficult due to sprawling development. The crisis in urban transporta-
tion must be resolved because the economies of cities, and in many ways the economy of
Canada, depend on a solution. However, the solution involves not just transportation, but
also the whole approach to building cities.
No city in the world has ever completely solved its transportation and land use problems,
but many cities have striven toward environmentally benign planning. Curitiba, a Brazilian
city, provides one model on how to integrate sustainable transport with business and com-
munity development. Its plan integrates traffic management, transportation, and land-use
planning, with main roads modified to give public transport the highest priority. Singaporehas also placed serious limitations on the purchase and use of cars while developing new
neighbourhoods around subway stations. The number of private cars in central London has
been reduced by 20 per cent through “congestion pricing,” which charges a fee for cars to
enter the central city. Money collected from these fees will be used to improve public trans-
port. Cities like Curitiba, Singapore and London are efficient and productive, and attract
investment. Cities that allow congestion to worsen are more likely to decline economically.
It is important that Canada as a whole and Canadian cities individually adopt policies that
will promote sustainable city and regional planning. Sound city planning invites economic
development.
2. Urbanization and sprawl
Probably the single greatest source of wealth creation in history has been the conversion of
rural land into urban land – urbanization. This process occurred at a slower rate in earlier
periods, and the shape of the city that resulted was dense. Nowadays urbanization is more
rapid and much less dense.
Pre-war Toronto neighbourhoods (with very few mid-rise or high-rise buildings) have
densities of 28 to 36 housing units per hectare; post-war developments close to the city tend
to have 10 to 15: development in rural areas of the Greater Toronto Area is at about 2 to 7
Understanding Sprawl: A Citizen’s Guide
8/7/2019 Understanding Sprawl
http://slidepdf.com/reader/full/understanding-sprawl 10/27
A COMPARISON OFNEIGHBOURHOOD DENSITY
(units/hectare)
Toronto, rural outskirts2 to 7
Toronto, built post WWII10 to 15
Toronto, built pre-WWII28 to 36
Montreal, Plateau Mont-Roya75
Vancouver, West Endover 133
units per hectare. The densities of pre-war neighbourhoods are “in the range of two to three
times the level of recent fringe development.”2 This range of comparative densities is also
found in other Canadian cities and their suburbs.
By contrast, medium density developments can have a range of 30 to 90 units per hectare.
Central city high-densities can be much higher. For example, in the West End of downtown
Vancouver, a very desirable neighbourhood, there are over 133 units per hectare.
Many of the houses in the old city neighbourhoods have front and back yards. Some
houses are attached, some semi-attached and some are rows. There are generally just a small
number of high-rise apartment buildings scattered among them. Families live comfortably in
these neighbourhoods and the houses are valued highly on the real estate market. Why, then,
are new suburban neighbourhoods built at much lower densities?
A number of factors contribute to the prevalence of sprawling low-density suburbs. The
growing number of personal automobiles provides a perceived convenient means of trans-
portation to city centres and other workplaces. The willingness of governments to subsidize
infrastructure for automobiles and for water, sewage, and electric and gas utilities also biases
development choices towards low density. Another factor is the enormous private profit inbuilding and servicing sprawling development. The profit is not only in the escalating price
of land as demand for it increases but also in the marketing of automobiles.
Canada is building new houses at a rapid rate: housing starts are expected to exceed
205,000 in 2003.3 In recent years the planning rules in some suburbs closer to big cities have
required new houses to be built closer to one another, but not as close as in cities. In the
more rural suburbs on the metropolitan fringes, densities remain quite low. As housing
density decreases, more land is consumed and infrastructure per unit is more expensive –
sewer and water pipes, roads, and electric and gas services have to be longer and spread over
greater areas. Providing public transit services becomes extremely expensive and is therefore
less frequent. As a result, suburbanites are compelled to live with distances and expenses that
are both unnecessary and avoidable.
3. How transportation determines the way we use land
There is little awareness today about the history of urban development in North America.
Most city dwellers once walked to main streets to shop. Children walked to schools, libraries,
and playing fields. Workers took streetcars to factories and offices. In the 1930s, electric
streetcar companies perfected superb streetcars. They accelerated more quickly than buses
and rode quietly and without fumes on smooth welded track. These cars were spacious and
comfortable with wide double doors close to the ground, allowing passengers to get on and
off quickly.
With streetcars in cities, interurbans reaching out into the countryside, and railroadsbetween cities, there was a great deal of mobility available at reasonable cost. However,
automobile and gasoline companies saw all this as an obstacle. They worried that average
people in cities would not desert the streetcars in order to buy automobiles. To remedy this
perceived marketing problem in the United States, these corporations set about purchasing
the streetcar systems that dominated American cities and converting the lines from streetcars
to buses, which the automobile companies manufactured.4 They were able to do this with the
help of local public officials, who thought the streetcars old fashioned but saw buses as new
and streamlined. However, the larger objective for these companies was not the sale of
From compact city to sprawling subur
8/7/2019 Understanding Sprawl
http://slidepdf.com/reader/full/understanding-sprawl 11/27
t was not until the late960s and early 1970s that
arge numbers of citizens
nd members of municipal
ouncils recognized that
utomobiles were not only
dominating transportation
but also dominating cities
hemselves.
Understanding Sprawl: A Citizen’s Guide
buses but rather clearing the centres of the streets of tracks and big lumbering electric
vehicles that got in the way of private cars. Cars had to stop behind stopped streetcars – as
they still do in Toronto – to allow passengers safe boarding and disembarking, while buses
pulled deferentially to the curb. In Canada, most of the streetcar lines were in public owner-
ship and not for sale to private companies, but there was still pressure to remove tracks and
bring in buses, which happened in most cities
Most people believe that the urban centres emptied and walking and streetcar riding
became less popular because car ownership increased. But that is only one facet of the story.
New transportation technology, in the form of the automobile did not change the city by
itself – government policy was the major catalyst.
After World War II, transportation planning in North America focused primarily on
accommodating the ever-increasing number of cars pouring onto country roads and city
streets. Since the narrow streets of old cities and towns did not have enough room for cars to
circulate or park, traffic engineers were assigned the task of finding ways to move and store
the flood of new vehicles. In response, they recommended that city councils enact techniques
and policies for expanding the car-carrying capacity of local streets. Examples include:enlarging the roadway portion of streets at the expense of sidewalks, creating one-way pairs
of streets, introducing regulations that add travel lanes by prohibiting parking during peak
hours or all day, and building municipal parking facilities. Large and small cities in Canada
used these measures to help move automobile traffic.
To speed traffic between cities and towns, in the 1950s, traffic engineers recommended
limited-access highways, such as Ontario’s 401. There were also plans for new highways and
enlarged arterial roadways within cities and beyond them to connect to the growing subur-
ban areas. Most of these new residential suburbs were planned almost entirely without public
transportation. There were often no sidewalks, and curvilinear streets ending in cul-de-sacs
replaced the grid pattern of the old cities. Retail shops that used to flourish along sidewalks
on downtown streets moved to roadside commercial strips and shopping centres. Officeparks were planned that were accessible only by car and there were no rail freight connec-
tions in some of the new industrial parks. As a result, transportation planning became mostly
a matter of providing additional road capacity. Canada’s transportation system became, in
large measure, an automotive system, rather than a balanced system that integrates the use of
cars, buses, streetcars, and railroads, with allowance for safe walking and bicycle riding.
Ironically, despite wider roads, the automotive system often results in longer trips, as people
live and work in more widely dispersed homes and workplaces.
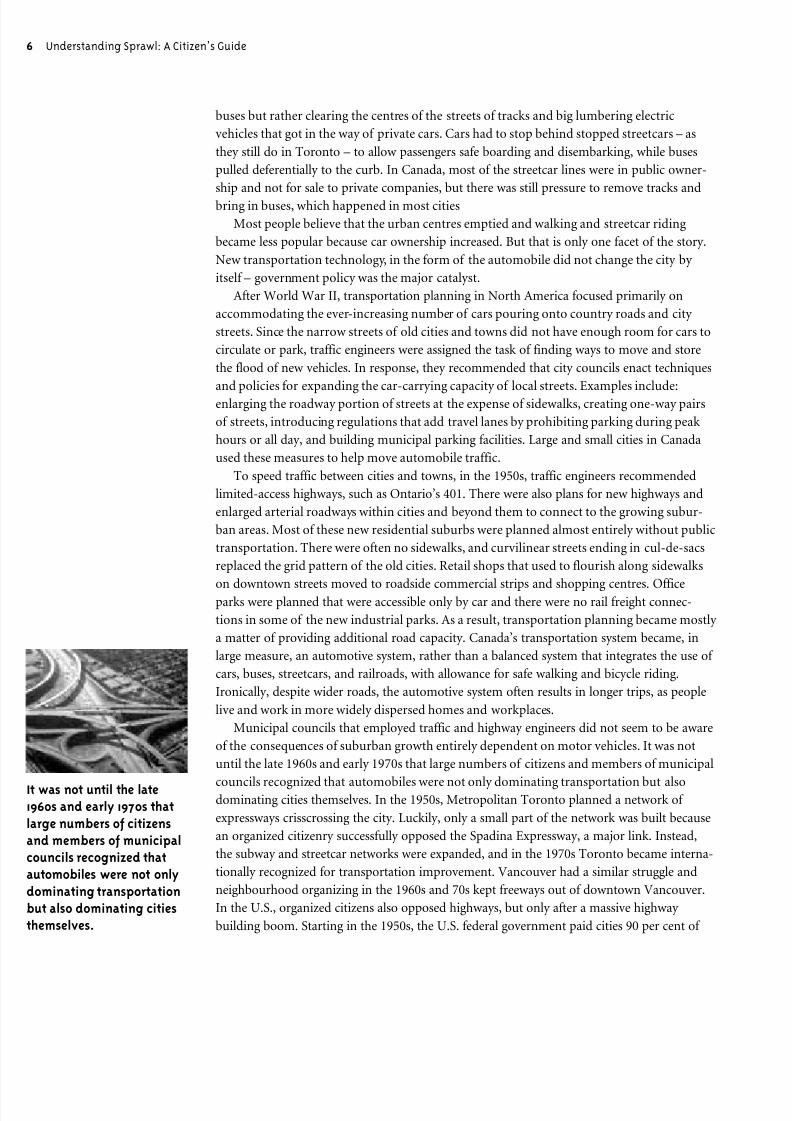
Municipal councils that employed traffic and highway engineers did not seem to be aware
of the consequences of suburban growth entirely dependent on motor vehicles. It was not
until the late 1960s and early 1970s that large numbers of citizens and members of municipal
councils recognized that automobiles were not only dominating transportation but alsodominating cities themselves. In the 1950s, Metropolitan Toronto planned a network of
expressways crisscrossing the city. Luckily, only a small part of the network was built because
an organized citizenry successfully opposed the Spadina Expressway, a major link. Instead,
the subway and streetcar networks were expanded, and in the 1970s Toronto became interna-
tionally recognized for transportation improvement. Vancouver had a similar struggle and
neighbourhood organizing in the 1960s and 70s kept freeways out of downtown Vancouver.
In the U.S., organized citizens also opposed highways, but only after a massive highway
building boom. Starting in the 1950s, the U.S. federal government paid cities 90 per cent of
8/7/2019 Understanding Sprawl
http://slidepdf.com/reader/full/understanding-sprawl 12/27
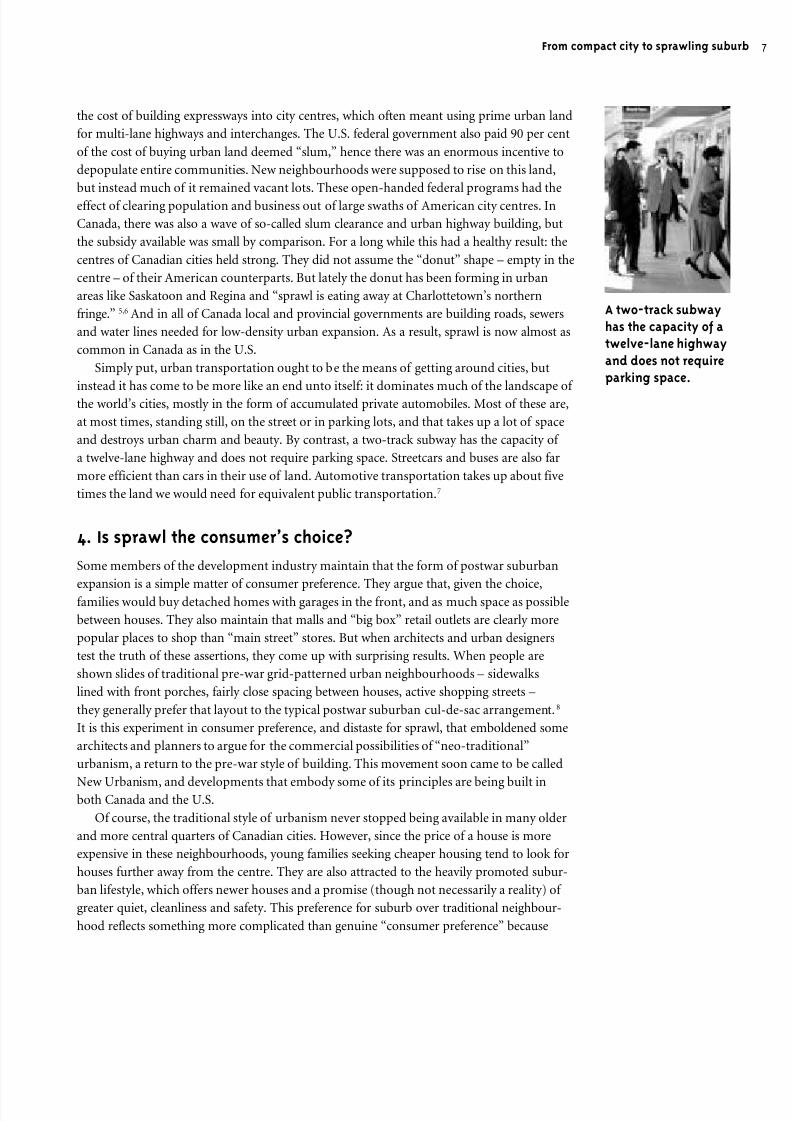
A two-track subway
has the capacity of a
twelve-lane highway
and does not require
parking space.
the cost of building expressways into city centres, which often meant using prime urban land
for multi-lane highways and interchanges. The U.S. federal government also paid 90 per cent
of the cost of buying urban land deemed “slum,” hence there was an enormous incentive to
depopulate entire communities. New neighbourhoods were supposed to rise on this land,
but instead much of it remained vacant lots. These open-handed federal programs had the
effect of clearing population and business out of large swaths of American city centres. In
Canada, there was also a wave of so-called slum clearance and urban highway building, but
the subsidy available was small by comparison. For a long while this had a healthy result: the
centres of Canadian cities held strong. They did not assume the “donut” shape – empty in the
centre – of their American counterparts. But lately the donut has been forming in urban
areas like Saskatoon and Regina and “sprawl is eating away at Charlottetown’s northern
fringe.” 5,6 And in all of Canada local and provincial governments are building roads, sewers
and water lines needed for low-density urban expansion. As a result, sprawl is now almost as
common in Canada as in the U.S.
Simply put, urban transportation ought to be the means of getting around cities, but
instead it has come to be more like an end unto itself: it dominates much of the landscape of the world’s cities, mostly in the form of accumulated private automobiles. Most of these are,
at most times, standing still, on the street or in parking lots, and that takes up a lot of space
and destroys urban charm and beauty. By contrast, a two-track subway has the capacity of
a twelve-lane highway and does not require parking space. Streetcars and buses are also far
more efficient than cars in their use of land. Automotive transportation takes up about five
times the land we would need for equivalent public transportation.7
4. Is sprawl the consumer’s choice?
Some members of the development industry maintain that the form of postwar suburban
expansion is a simple matter of consumer preference. They argue that, given the choice,families would buy detached homes with garages in the front, and as much space as possible
between houses. They also maintain that malls and “big box” retail outlets are clearly more
popular places to shop than “main street” stores. But when architects and urban designers
test the truth of these assertions, they come up with surprising results. When people are
shown slides of traditional pre-war grid-patterned urban neighbourhoods – sidewalks
lined with front porches, fairly close spacing between houses, active shopping streets –
they generally prefer that layout to the typical postwar suburban cul-de-sac arrangement.8
It is this experiment in consumer preference, and distaste for sprawl, that emboldened some
architects and planners to argue for the commercial possibilities of “neo-traditional”
urbanism, a return to the pre-war style of building. This movement soon came to be called
New Urbanism, and developments that embody some of its principles are being built inboth Canada and the U.S.
Of course, the traditional style of urbanism never stopped being available in many older
and more central quarters of Canadian cities. However, since the price of a house is more
expensive in these neighbourhoods, young families seeking cheaper housing tend to look for
houses further away from the centre. They are also attracted to the heavily promoted subur-
ban lifestyle, which offers newer houses and a promise (though not necessarily a reality) of
greater quiet, cleanliness and safety. This preference for suburb over traditional neighbour-
hood reflects something more complicated than genuine “consumer preference” because
From compact city to sprawling subur
8/7/2019 Understanding Sprawl
http://slidepdf.com/reader/full/understanding-sprawl 13/27
the suburban house price is artificially lower as a result of significant government subsidies.
Provincial and local funds (including some raised by “development charges” levied on
builders and passed on to homebuyers) pay for the infrastructure of roads, water and sewage
lines and new schools. If these costs and the costs of environmental impacts were included,
then suburban housing loses some of its price advantage over traditional neighbourhoods.
In essence, sprawl stems more from hidden subsidy and sophisticated marketing campaigns
than from the virtues of raising families outside the city.
5. Why change the current pattern?
Sustainable development, according to the United Nations World Commission on Environ-
ment and Development, “meets the needs of the present without compromising the ability
of future generations to meet their own needs.” Suburban sprawl is not sustainable. It neither
conserves resources, nor creates efficient infrastructure, nor protects nature. It relies on
transportation that consumes fossil fuel at wasteful rates, diminishes scarce agricultural land
and assaults natural habitat on a massive scale. Unchecked suburban encroachment on theland will leave an unsustainable environment to future generations. In Canada, this is
especially true around the bigger cities.
A detailed study of the Toronto area’s future gives an example of what will happen in the
country’s largest urban agglomeration with continued low-density single-use development
served largely by private automobiles. 9 The study extrapolates current trends to 2031 to
forecast urbanization of an additional 1070 square kilometres of land (almost double the
area of the current City of Toronto), requiring massive expenditures for water, sewer and
road investment. Despite the road investment, the hours of delay for drivers each weekday
will increase from about 300,000 to 1.2 million. Average commuting time by car will increase
by about 25 per cent. Emissions of greenhouse gases will increase by about 42 per cent from
2000 to 2031. The Toronto study called its report the “business as usual” scenario. If there’sno change in the way cities and suburbs are planned and the future is simply business-
asusual, the consequence will be an urban Canada that is out of touch with the natural
environment, unhealthy for its inhabitants, and a serious contributor to the process of
global climate change.
By ratifying the Kyoto Protocol on climate change in 2002, Canada committed to reduc-
ing greenhouse gas emissions. Road transportation is one of the biggest sources of these
emissions, producing 134 million tonnes in 2001. Since sprawling communities are decen-
tralized, people often have no option but to use an automobile. Steering cities away from
sprawl will go a long way towards reducing greenhouse gas emissions in Canada. To address
climate change over the long term, changes in the pattern of urban development are neces-
sary. With sensible planning they are achievable.
teering cities away
rom sprawl will go a long
way toward reducing
greenhouse gas emissions
n Canada.
Understanding Sprawl: A Citizen’s Guide
8/7/2019 Understanding Sprawl
http://slidepdf.com/reader/full/understanding-sprawl 14/27
1. Low-density means high cost
Suburban jurisdictions sometimes compete for development. Local councils believe that new
development will pay for itself through development charges (levied for specifically needed
new facilities) and an increased property assessment base. Growth in the assessment baseseems to open the possibility of lower tax rates, but apparently tax rates are not lower in
faster growing municipalities.10 And even if a locality derives more tax income from a highly
assessed commercial development, that development may be constructed on land that ought
to be preserved for another use or as open space. Competition for development between
suburban jurisdictions often distorts regional plans for the distribution of land uses.
Another problem with this race for development is that neither the development charges
nor the property taxes actually pay for all the new infrastructure costs. As a result, Canada
will have to fill an enormous infrastructure gap of inadequate sewer and water works and
insufficient public transit, among other needs. That will cost billions of dollars to close.
According to the Federation of Canadian Municipalities, municipalities currently require
up to $60 billion to address infrastructure needs.11
Despite evidence to the contrary, local councils tend to believe all growth pays for itself.
In reality, the cost of a new school or the extension of sewer or water mains may only partly
be paid by new residents; the rest will fall on those who were there before the new develop-
ment. For example, all electric and gas utility customers usually end up paying for the
extension of services to a new development thereby subsidizing the new customers.
The prevailing urban development pattern around the towns and cities of Canada is
supported by very costly investments in infrastructure. Canada Mortgage and Housing
Corporation (CMHC) closely examined the prevailing pattern and found that building
according to alternative standards could reduce costs. The CMHC study compared conven-
tional suburban development with a mixed use, more compact development in accordance
with the principles of New Urbanism.12
The conventional pattern featured a curvilinearstreet pattern, relatively low residential densities, separation of land uses and dependence on
private cars. Standards required wide local rights-of-way and generous single-family lot
frontages, depths, front yard and rear yard setbacks. Compared with conventional develop-
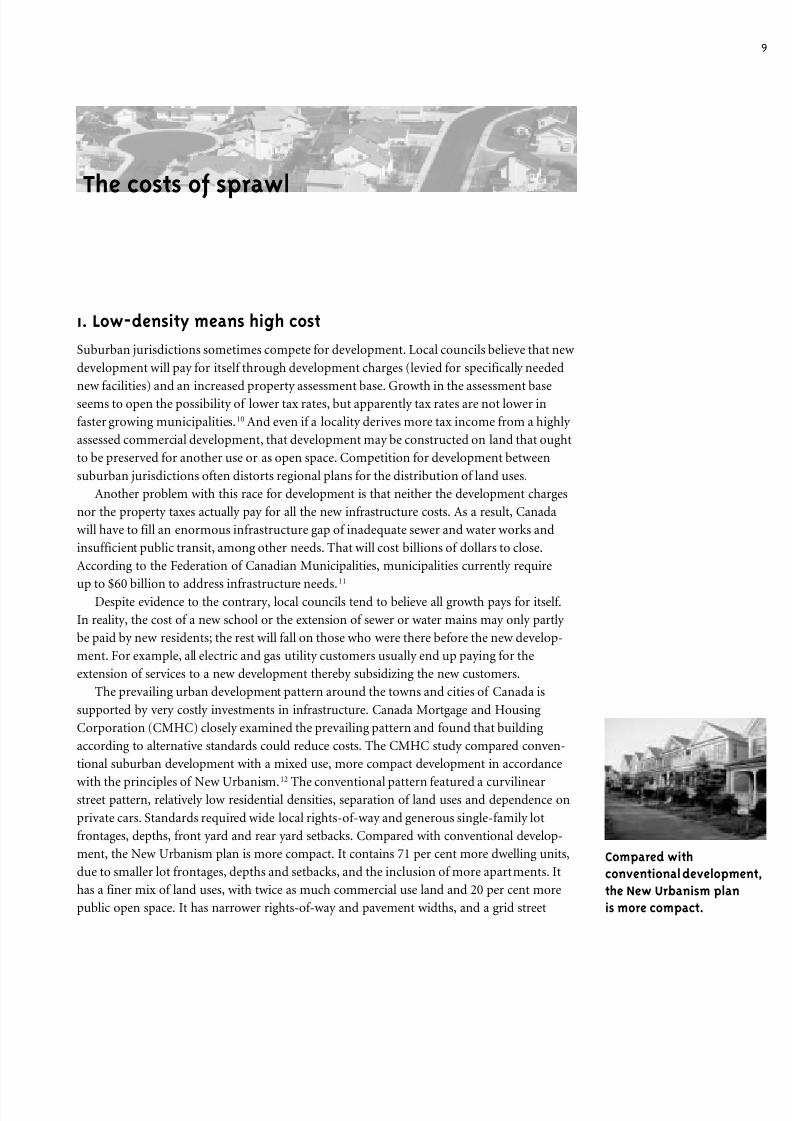
ment, the New Urbanism plan is more compact. It contains 71 per cent more dwelling units,
due to smaller lot frontages, depths and setbacks, and the inclusion of more apartments. It
has a finer mix of land uses, with twice as much commercial use land and 20 per cent more
public open space. It has narrower rights-of-way and pavement widths, and a grid street
The costs of sprawl
Compared with
conventional developm
the New Urbanism plan
is more compact.
8/7/2019 Understanding Sprawl
http://slidepdf.com/reader/full/understanding-sprawl 15/27
system. Within a five minute walk residents can get to a central green space surrounded by
a mix of commercial and office buildings.
The CMHC study found that using such alternative standards lowers public and private
capital costs of infrastructure by 16 per cent, or approximately $5,300 (1995 dollars) per unit.
Infrastructure replacement, and operating and maintenance costs are cheaper by almost
9 per cent or almost $11,000 per unit over a 75-year period. In a community of 7,000 dwell-
ings, CMHC estimated a life-cycle savings of $77 million or over $1 million annually. At the
recent rate of about 200,000 housing starts a year in Canada, alternative standards would
allow combined infrastructure, replacement, operating, and maintenance savings of about
$1.1 billion annually.
It is obviously more expensive to lay sewer, water and gas pipes, and build roads and
electric grids over longer distances than shorter ones. It is also more expensive to provide
police, fire, sanitation, snow removal and transit services to large low-density areas. The
cost of providing services increases with distance and decreases with density. A 1995 study
concluded that more compact and efficient urbanization in the Greater Toronto Area would
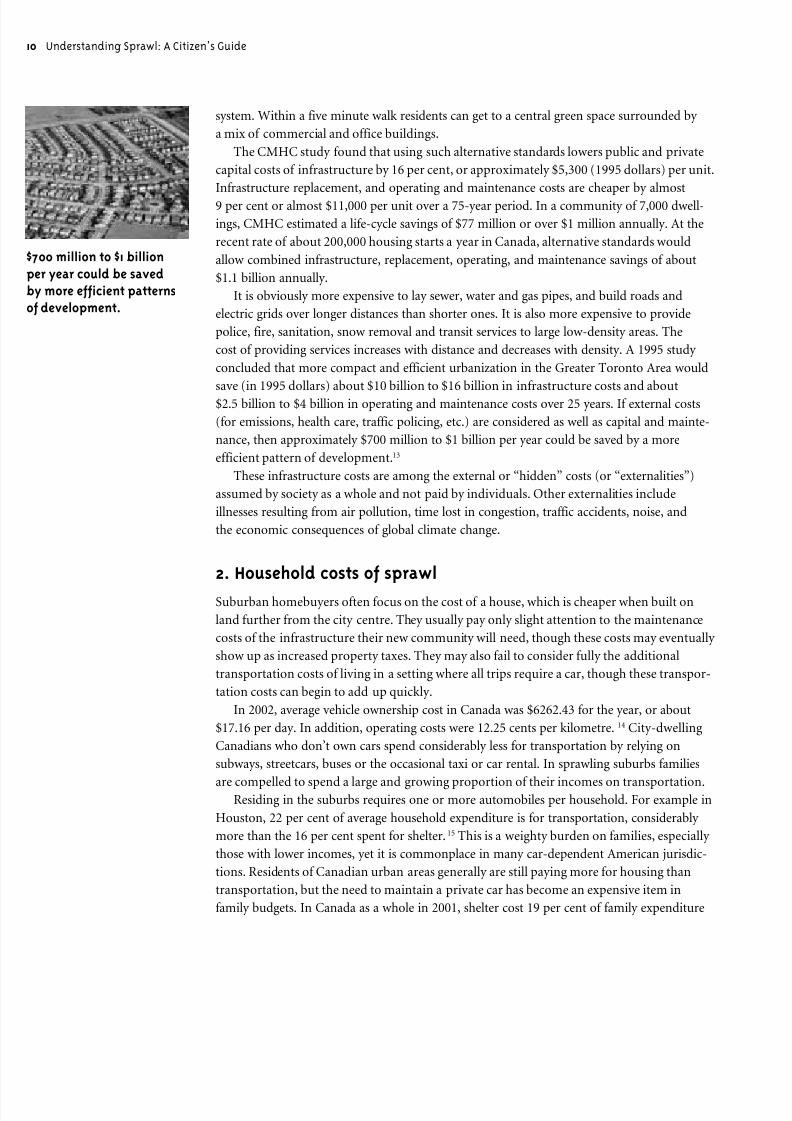
save (in 1995 dollars) about $10 billion to $16 billion in infrastructure costs and about$2.5 billion to $4 billion in operating and maintenance costs over 25 years. If external costs
(for emissions, health care, traffic policing, etc.) are considered as well as capital and mainte-
nance, then approximately $700 million to $1 billion per year could be saved by a more
efficient pattern of development.13
These infrastructure costs are among the external or “hidden” costs (or “externalities”)
assumed by society as a whole and not paid by individuals. Other externalities include
illnesses resulting from air pollution, time lost in congestion, traffic accidents, noise, and
the economic consequences of global climate change.
2. Household costs of sprawl
Suburban homebuyers often focus on the cost of a house, which is cheaper when built on
land further from the city centre. They usually pay only slight attention to the maintenance
costs of the infrastructure their new community will need, though these costs may eventually
show up as increased property taxes. They may also fail to consider fully the additional
transportation costs of living in a setting where all trips require a car, though these transpor-
tation costs can begin to add up quickly.
In 2002, average vehicle ownership cost in Canada was $6262.43 for the year, or about
$17.16 per day. In addition, operating costs were 12.25 cents per kilometre. 14 City-dwelling
Canadians who don’t own cars spend considerably less for transportation by relying on
subways, streetcars, buses or the occasional taxi or car rental. In sprawling suburbs families
are compelled to spend a large and growing proportion of their incomes on transportation.Residing in the suburbs requires one or more automobiles per household. For example in
Houston, 22 per cent of average household expenditure is for transportation, considerably
more than the 16 per cent spent for shelter.15 This is a weighty burden on families, especially
those with lower incomes, yet it is commonplace in many car-dependent American jurisdic-
tions. Residents of Canadian urban areas generally are still paying more for housing than
transportation, but the need to maintain a private car has become an expensive item in
family budgets. In Canada as a whole in 2001, shelter cost 19 per cent of family expenditure
0 Understanding Sprawl: A Citizen’s Guide
700 million to $1 billion
per year could be saved
by more efficient patterns
f development.
8/7/2019 Understanding Sprawl
http://slidepdf.com/reader/full/understanding-sprawl 16/27
and transportation 13 per cent.16 Households in lower-density settlements spend more
on transportation; households with good access to public transportation spend less.
It is noteworthy that, in Canada, buying, maintaining and fuelling individual vehicles
cost more than food consumption, which accounts for only 11 per cent of family spending.
Moreover, the transportation percentage of expenditures rose from the 1996 to the
2001 census.
Money isn’t the only transportation expense. Time spent driving is also a cost. In
Canada’s larger urban areas a half hour journey to work is typical.17 Many more hours are
spent on other trips. A person who drives just an average of an hour every day spends the
equivalent of nine working weeks a year in the car. Even when highways are widened and
improved, the commute to work remains constant because bigger highways allow faster
speeds, which allow further sprawl, with people driving longer distances. Canadians spend
more time in their cars than Europeans do but less time than Americans.18
As previously noted, early stages of suburban development focussed on central cities,
and as a result commuting into them was possible either on transit lines or on existing roads
leading to the city centre. Congestion on these roads and the high cost of parking downtownwas a further incentive to use transit.
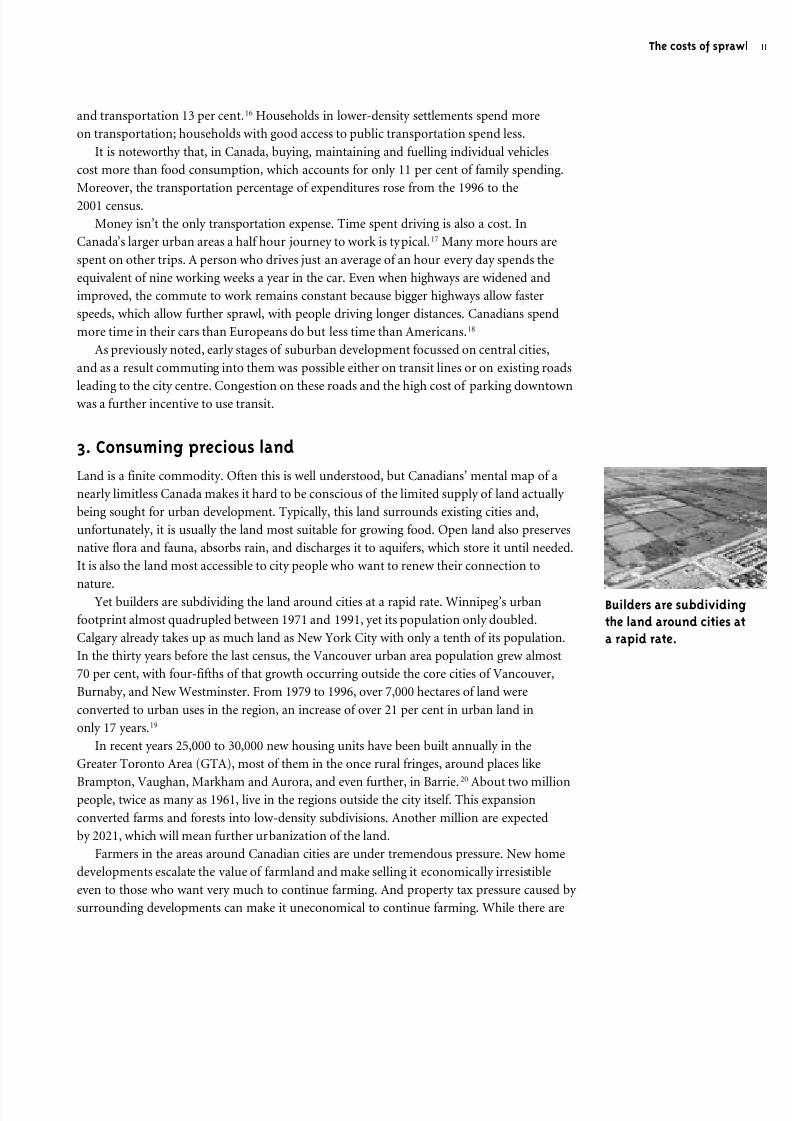
3. Consuming precious land
Land is a finite commodity. Often this is well understood, but Canadians’ mental map of a
nearly limitless Canada makes it hard to be conscious of the limited supply of land actually
being sought for urban development. Typically, this land surrounds existing cities and,
unfortunately, it is usually the land most suitable for growing food. Open land also preserves
native flora and fauna, absorbs rain, and discharges it to aquifers, which store it until needed.
It is also the land most accessible to city people who want to renew their connection to
nature.Yet builders are subdividing the land around cities at a rapid rate. Winnipeg’s urban
footprint almost quadrupled between 1971 and 1991, yet its population only doubled.
Calgary already takes up as much land as New York City with only a tenth of its population.
In the thirty years before the last census, the Vancouver urban area population grew almost
70 per cent, with four-fifths of that growth occurring outside the core cities of Vancouver,
Burnaby, and New Westminster. From 1979 to 1996, over 7,000 hectares of land were
converted to urban uses in the region, an increase of over 21 per cent in urban land in
only 17 years.19
In recent years 25,000 to 30,000 new housing units have been built annually in the
Greater Toronto Area (GTA), most of them in the once rural fringes, around places like
Brampton, Vaughan, Markham and Aurora, and even further, in Barrie.20
About two millionpeople, twice as many as 1961, live in the regions outside the city itself. This expansion
converted farms and forests into low-density subdivisions. Another million are expected
by 2021, which will mean further urbanization of the land.
Farmers in the areas around Canadian cities are under tremendous pressure. New home
developments escalate the value of farmland and make selling it economically irresistible
even to those who want very much to continue farming. And property tax pressure caused by
surrounding developments can make it uneconomical to continue farming. While there are
The costs of spraw
Builders are subdividing
the land around cities a
a rapid rate.
8/7/2019 Understanding Sprawl
http://slidepdf.com/reader/full/understanding-sprawl 17/27
2 Understanding Sprawl: A Citizen’s Guide
numerous planning rules for cities there are far fewer for the countryside, which is often seen
as “undeveloped” land waiting for “higher and better land use.”21 This tendency is mitigated
in British Columbia by the province’s Land Commission, which sets boundaries all over the
province for zones – the Agricultural Land Reserve (ALR) – where agriculture has first
priority.22 But even the ALR is under threat from development, especially since the provin-
cial government has devolved authority to local commissioners who can allow non-farm uses
or delegate authority to other parties.
In Ontario, about two thirds of the GTA is rural; of this, about 42 per cent is classified as
farmland. More than 60,000 hectares were lost to urbanization between 1976 and 1996 and
an equal amount could be lost over the next 20 to 30 years if these trends continue. This is an
area roughly equivalent to the City of Toronto. Only 5 per cent of the Canadian landmass is
classified as prime agricultural land, yet in the GTA “virtually all of
the urban expansion that has taken place in the last decades has been on prime agricultural
land…. A significant portion is included in the even more limited 0.5 per cent of the
Canadian landmass that qualifies as Class 1 land under the Canada Land Inventory.” 23
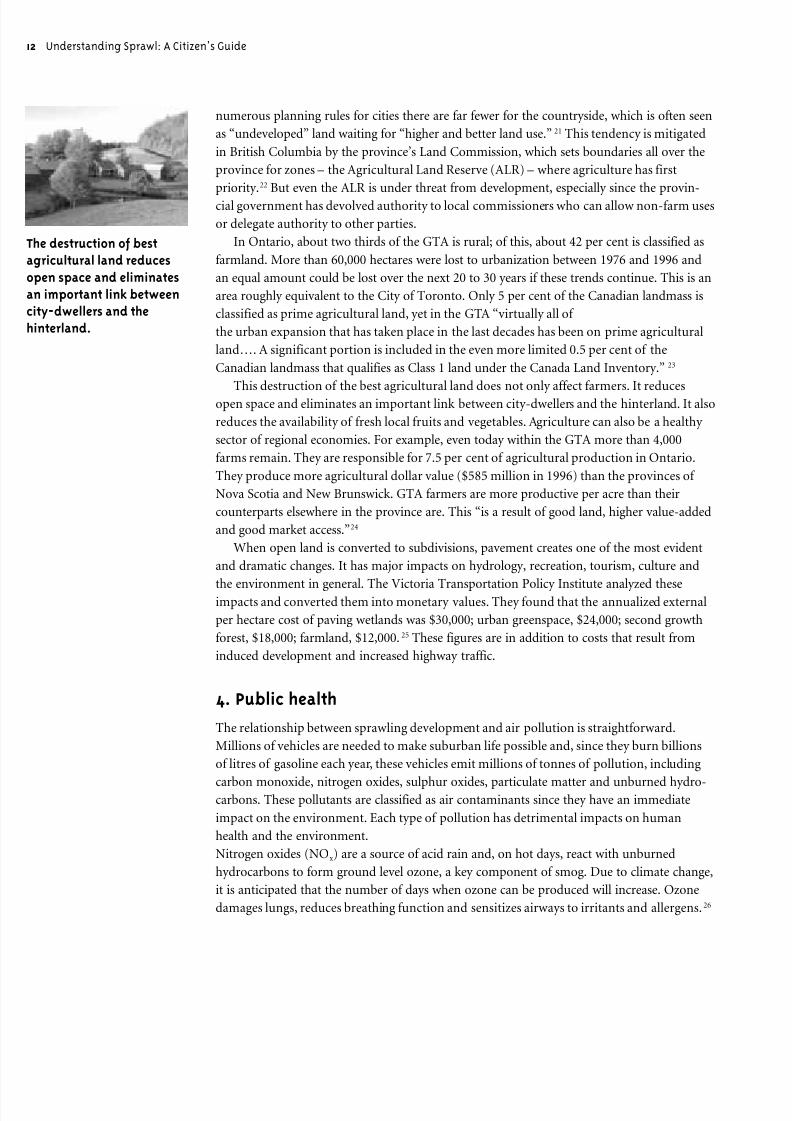
This destruction of the best agricultural land does not only affect farmers. It reducesopen space and eliminates an important link between city-dwellers and the hinterland. It also
reduces the availability of fresh local fruits and vegetables. Agriculture can also be a healthy
sector of regional economies. For example, even today within the GTA more than 4,000
farms remain. They are responsible for 7.5 per cent of agricultural production in Ontario.
They produce more agricultural dollar value ($585 million in 1996) than the provinces of
Nova Scotia and New Brunswick. GTA farmers are more productive per acre than their
counterparts elsewhere in the province are. This “is a result of good land, higher value-added
and good market access.”24
When open land is converted to subdivisions, pavement creates one of the most evident
and dramatic changes. It has major impacts on hydrology, recreation, tourism, culture and
the environment in general. The Victoria Transportation Policy Institute analyzed theseimpacts and converted them into monetary values. They found that the annualized external
per hectare cost of paving wetlands was $30,000; urban greenspace, $24,000; second growth
forest, $18,000; farmland, $12,000.25 These figures are in addition to costs that result from
induced development and increased highway traffic.
4. Public health
The relationship between sprawling development and air pollution is straightforward.
Millions of vehicles are needed to make suburban life possible and, since they burn billions
of litres of gasoline each year, these vehicles emit millions of tonnes of pollution, including
carbon monoxide, nitrogen oxides, sulphur oxides, particulate matter and unburned hydro-carbons. These pollutants are classified as air contaminants since they have an immediate
impact on the environment. Each type of pollution has detrimental impacts on human
health and the environment.
Nitrogen oxides (NOx) are a source of acid rain and, on hot days, react with unburned
hydrocarbons to form ground level ozone, a key component of smog. Due to climate change,
it is anticipated that the number of days when ozone can be produced will increase. Ozone
damages lungs, reduces breathing function and sensitizes airways to irritants and allergens.26
he destruction of best
gricultural land reduces
pen space and eliminates
n important link between
ity-dwellers and the
interland.
8/7/2019 Understanding Sprawl
http://slidepdf.com/reader/full/understanding-sprawl 18/27
The costs of spraw
Groups that are sensitive to ozone include children and adults who are active outdoors, and
people with respiratory disease such as asthma. In some Canadian cities more than one child
in 10 under the age of five suffers from asthma, an illness that until 30 years ago was consid-
ered rare. Over half of the NOx emissions in Canada are from automobiles, with an addi-
tional 15 per cent from petroleum refining and natural gas processing and 10 per cent from
electric utilities.
Carbon monoxide (CO) is a toxic air pollutant that contributes to congestive heart
failure. It is also one of the components of urban smog that contributes to the formation of
ground level ozone.27 Approximately 40 per cent of the CO emissions in Canada are from
transportation sources.
Fine particulate matter is linked to increases in premature mortality, emergency room
visits, hospital admissions for respiratory disease, and asthma attacks.28 The government of
Canada recently began the process of declaring particulate matter a toxic substance under
the Canadian Environmental Protection Act. Particulate matter can be emitted directly from
fossil fuel combustion, but it can also be produced as a secondary pollutant when nitrogen
oxides, sulphur oxides or unburned hydrocarbons undergo chemical reactions in the atmos-phere. The major sources of particulate matter are unpaved roads, construction, agricultural
and forestry operations.
Unburned hydrocarbons, also known as volatile organic compounds (VOCs) are a key
ingredient in smog and contribute to the formation of ozone. They can also include toxic
compounds such as benzene, a known carcinogen. As temperatures increase due to climate
change, the amount of VOCs in the atmosphere will climb due to increased evaporation.
Transportation and upstream oil and gas production account for 40 per cent of Canada’s
VOC emissions.
Sulphur dioxide is a hazardous air pollutant that has been linked to increases in mortality,
shortness of breath and impaired lung function. It is a major cause of acid rain, which is
responsible for significant damage to lakes and forests in eastern Canada. According toEnvironment Canada sulphur dioxide can react with water to form fine sulphate particles
which can lodge deep in the lungs causing inflammation and tissue damage.29 In Canada
approximately 5 per cent of sulphur emissions come from automobiles, while 20 per cent
comes from electric utilities, and 25 per cent is emitted during petroleum refining, tar sands
production and natural gas processing.
As noted, air pollution is a serious health problem. Federal studies show that up to
16,000 premature deaths per year can be attributed to air pollution, and the Ontario Medical
Association says air pollution costs Ontario citizens more than $1 billion a year in hospital
admissions, emergency room visits and absenteeism.30 Toronto Public Health Department
figures show that air pollution causes hundreds of premature deaths a year and numerous
health-related problems.31
A landmark study covering 25 million people in 15 different citieswithin 10 countries of eastern and western Europe also found that even when pollution
levels were well within regulatory limits, they still impacted on mortality and morbidity.32
Decreases in car use result in decreases in air pollution, which lessens the incidence of
respiratory diseases. Results of a study by the Centers for Disease Control and Prevention
during the 1996 Olympic Games in Atlanta, at which time vehicular traffic was kept at
artificially low levels by city authorities, showed that the peak daily ozone concentrations
decreased 27.9 percent and the number of asthma emergency medical events dropped
41.6 percent.
Federal studies show
that up to 16,000 prema
deaths per year can be
attributed to air pollutio
8/7/2019 Understanding Sprawl
http://slidepdf.com/reader/full/understanding-sprawl 19/27
4 Understanding Sprawl: A Citizen’s Guide
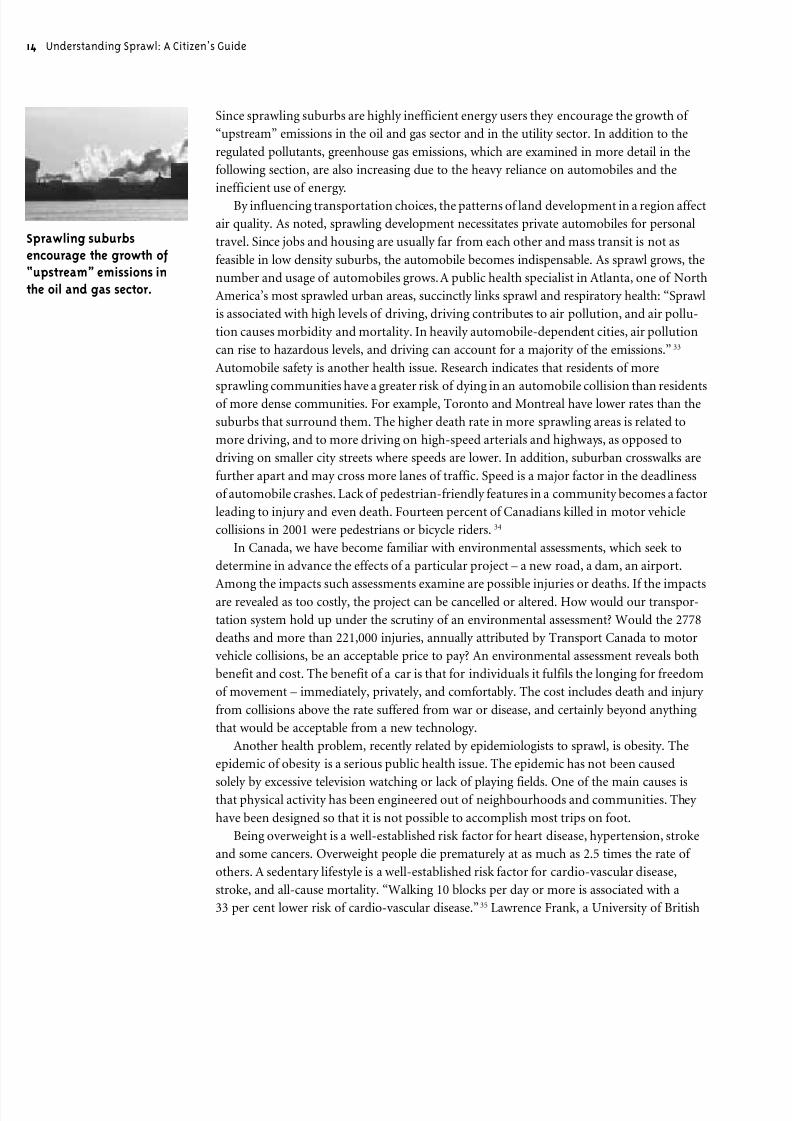
Since sprawling suburbs are highly inefficient energy users they encourage the growth of
“upstream” emissions in the oil and gas sector and in the utility sector. In addition to the
regulated pollutants, greenhouse gas emissions, which are examined in more detail in the
following section, are also increasing due to the heavy reliance on automobiles and the
inefficient use of energy.
By influencing transportation choices, the patterns of land development in a region affect
air quality. As noted, sprawling development necessitates private automobiles for personal
travel. Since jobs and housing are usually far from each other and mass transit is not as
feasible in low density suburbs, the automobile becomes indispensable. As sprawl grows, the
number and usage of automobiles grows. A public health specialist in Atlanta, one of North
America’s most sprawled urban areas, succinctly links sprawl and respiratory health: “Sprawl
is associated with high levels of driving, driving contributes to air pollution, and air pollu-
tion causes morbidity and mortality. In heavily automobile-dependent cities, air pollution
can rise to hazardous levels, and driving can account for a majority of the emissions.”33
Automobile safety is another health issue. Research indicates that residents of more
sprawling communities have a greater risk of dying in an automobile collision than residentsof more dense communities. For example, Toronto and Montreal have lower rates than the
suburbs that surround them. The higher death rate in more sprawling areas is related to
more driving, and to more driving on high-speed arterials and highways, as opposed to
driving on smaller city streets where speeds are lower. In addition, suburban crosswalks are
further apart and may cross more lanes of traffic. Speed is a major factor in the deadliness
of automobile crashes. Lack of pedestrian-friendly features in a community becomes a factor
leading to injury and even death. Fourteen percent of Canadians killed in motor vehicle
collisions in 2001 were pedestrians or bicycle riders.34
In Canada, we have become familiar with environmental assessments, which seek to
determine in advance the effects of a particular project – a new road, a dam, an airport.
Among the impacts such assessments examine are possible injuries or deaths. If the impactsare revealed as too costly, the project can be cancelled or altered. How would our transpor-
tation system hold up under the scrutiny of an environmental assessment? Would the 2778
deaths and more than 221,000 injuries, annually attributed by Transport Canada to motor
vehicle collisions, be an acceptable price to pay? An environmental assessment reveals both
benefit and cost. The benefit of a car is that for individuals it fulfils the longing for freedom
of movement – immediately, privately, and comfortably. The cost includes death and injury
from collisions above the rate suffered from war or disease, and certainly beyond anything
that would be acceptable from a new technology.
Another health problem, recently related by epidemiologists to sprawl, is obesity. The
epidemic of obesity is a serious public health issue. The epidemic has not been caused
solely by excessive television watching or lack of playing fields. One of the main causes isthat physical activity has been engineered out of neighbourhoods and communities. They
have been designed so that it is not possible to accomplish most trips on foot.
Being overweight is a well-established risk factor for heart disease, hypertension, stroke
and some cancers. Overweight people die prematurely at as much as 2.5 times the rate of
others. A sedentary lifestyle is a well-established risk factor for cardio-vascular disease,
stroke, and all-cause mortality. “Walking 10 blocks per day or more is associated with a
33 per cent lower risk of cardio-vascular disease.”35 Lawrence Frank, a University of British
prawling suburbs
ncourage the growth of
upstream” emissions in
he oil and gas sector.
8/7/2019 Understanding Sprawl
http://slidepdf.com/reader/full/understanding-sprawl 20/27
The costs of spraw
Columbia professor who tracked the weight, height, and home location of 12,000 people
in the Atlanta area, found that “people who live in the suburbs tend to drive everywhere and
do not get exercise by walking… Fewer men and women were overweight or obese in dense
neighbourhoods – defined as eight dwelling units per acre – than in places with one home
per acre.”36
Studies by the U.S. Centers for Disease Control and Prevention also found that people
who live in sprawling suburbs weigh more than people who live in denser cities. “How you
build things influences health in a much more pervasive way than I think most health
professionals realize,” concluded Richard J. Jackson, an environmental epidemiologist who
studied the effects of sprawl at the U.S. Centers for Disease Control and Prevention. 37, 38
More than a century ago, when congested slum conditions were prevalent, public health
specialists were concerned with urban design and advocated dwellings that are more spacious
with better plumbing, and more parks and playgrounds. Today a different problem of urban
design – the structure of the suburb – is contributing to critical public and environmental
health issues.
5. Climate change5. Climate change5. Climate change5. Climate change5. Climate changeA natural layer of heat-trapping gases, including water vapour, carbon dioxide and methane
surrounds the earth and produces a natural greenhouse effect. These gases keep the earth
warm enough to support life.
Every day large amounts of gasoline, oil, coal and natural gas are burned to produce
power for automobiles and businesses and to provide electricity. But burning these fossil
fuels also produces harmful greenhouse gas (GHG) emissions. The concentration of these
gases is increasing dramatically. The gases collect in the atmosphere and act like a blanket
to prevent the earth’s excess heat from escaping. As the blanket thickens, the earth’s average
temperature increases. The result is climate change.
Atmospheric concentrations of carbon dioxide – the most common greenhouse gas –
are now 372 parts per million (ppm), 33 percent higher than before the industrial revolution.Scientists can say with certainty that today’s carbon dioxide levels are at a level that has not
been exceeded in 420,000 years and in all likelihood at a level unseen in 20 million years. 39
Recently published peer reviewed analysis indicates that the years from 1980 onwards
constitute the warmest period of the last 2,000 years.40 Scientists estimate that the build
up of greenhouse gases in the atmosphere is likely to raise global temperatures by 1.4° to
5.8° (Celsius) by 2100. The impacts of this warming – a rise in sea level, droughts, floods,
changes in local ecosystems – have been forecast in numerous scientific studies. These
impacts may be especially dramatic in northern countries like Canada where there has
already been permafrost thaw, accelerated coastal erosion, and increasing severity of storms
and droughts in regions of the country.
The Kyoto Protocol, an international agreement to combat climate change, calls forindustrialized nations to cut greenhouse gas emissions. Canada ratified the Protocol in 2002
and has a commitment to reduce emissions to 6 per cent below 1990 levels by the year 2012 –
that’s 25 per cent below today’s levels. Canada’s emissions are currently 18.5 per cent over the
1990 base level. Redirecting urban expansion away from the current sprawling pattern may
be one of the most important measures Canada can take to reduce emissions.
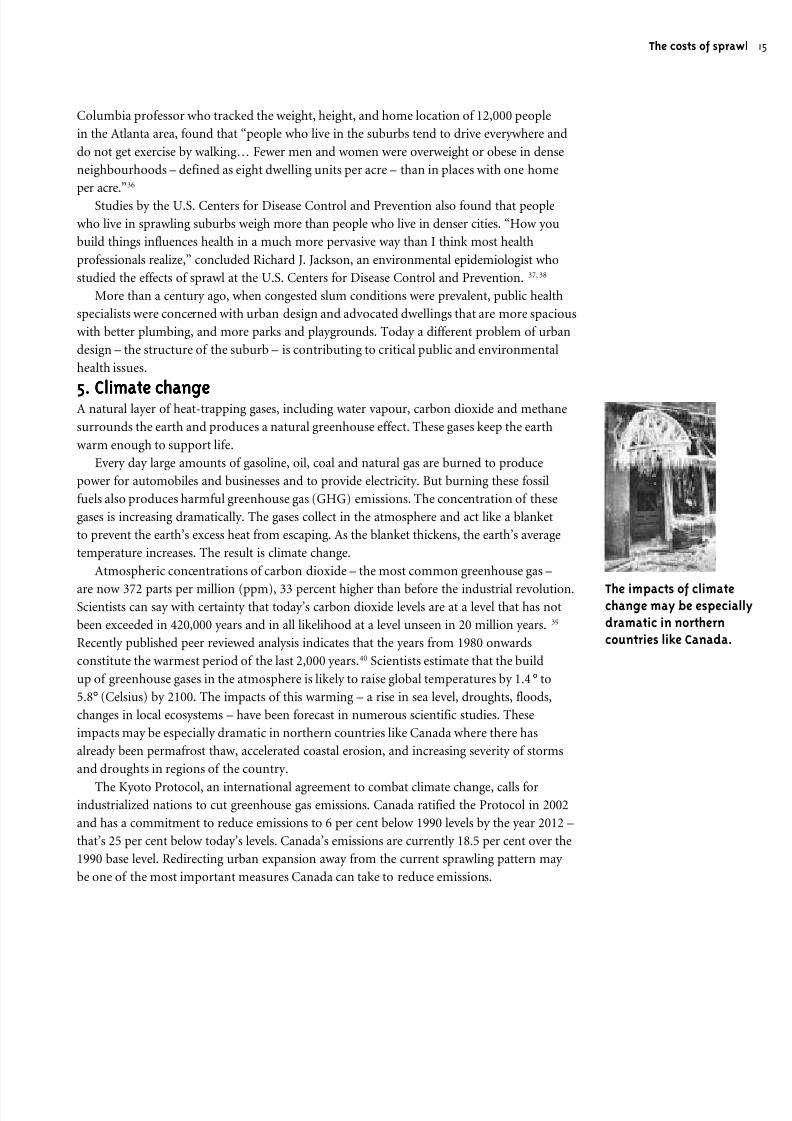
The impacts of climatechange may be especial
dramatic in northern
countries like Canada.
8/7/2019 Understanding Sprawl
http://slidepdf.com/reader/full/understanding-sprawl 21/27
6 Understanding Sprawl: A Citizen’s Guide
If no action is taken, emissions from transportation will continue to increase at an even
greater rate than those from other sources. On a per capita basis, Canada ranks second in the
world in transportation CO2 emissions, after the U.S. About 70 per cent of GHG emissions
from transportation are from cars and trucks; two-thirds of these are generated within urban
areas.41
The more cities are extended outward, the more greenhouse gas emissions grow. It is
possible for auto manufacturers to produce cars that consume less fuel. It is also possible to
reduce the carbon content of fuel. While these are beneficial measures, they can easily be
overwhelmed by increases in the number of vehicles and the distances travelled. The current
mode of planning cities guarantees that people will need more vehicles and travel further in
them. It has long been an axiom in city planning that transportation and land use are closely
linked and determine the character of cities. It now appears that transportation and land use
affects the climate itself.
6. Energy
If all costs are taken into account, including those of building roads or tracks and equipment,
then automobile use consumes between three and ten times more resources than public
transit.42 Sprawl depends on an abundant supply of energy. However, many geologists
predict that oil production is nearing its peak. In addition, as conventional sources of
petroleum are exhausted, other supplies will be brought into production. These new supplies
include tar sands, an extremely energy intensive industry which produces 125 kilograms
of greenhouse emissions for each barrel of oil produced.
Sprawling development requires cheap energy and an unlimited atmospheric repository
for greenhouse gas emissions. In 1974 and 1979 serious shortages of gasoline made life very
difficult in the suburbs. Motorists waited in long lines to get gas. While suburban dwellers
suffered from the shortage, downtown dwellers were relatively unaffected. Sales in downtowndepartment stores went up; suburban malls lost business. By now, due in part to cheap
petroleum, the downtown stores in many cities are gone and the malls and giant retail outlets
surrounded by enormous parking lots flourish instead.
If those who predict that world oil production can no longer keep up with growing
demand are right, then the suburban automobile dependent life cannot be maintained.
The house bought in the suburbs because it was so much cheaper than buying in the city
will rapidly become much more expensive. One analyst goes so far as to predict, “Suburbs as
we know them are doomed by the coming energy crunch.”43 The suburbs that are expanding
into greenfields may be economically obsolete in a few decades.
There is also talk of hydrogen-powered cars and other technological advances. However,
if hydrogen production is dependent on cheap fossil fuels, and if hydrogen-powered carsperpetuate the single passenger vehicle, then many of the problems of the gasoline powered
engine and suburban sprawl will continue.
7. Water
Sprawl affects not only land but also water. As forest cover is cleared for suburban develop-
ment both the quantity and quality of drinking water decline. Less rainfall is absorbed and
returned to recharge groundwater aquifers. With less recharge, communities that depend on
groundwater may face shortages as asphalt and concrete replace the wetlands and forests that
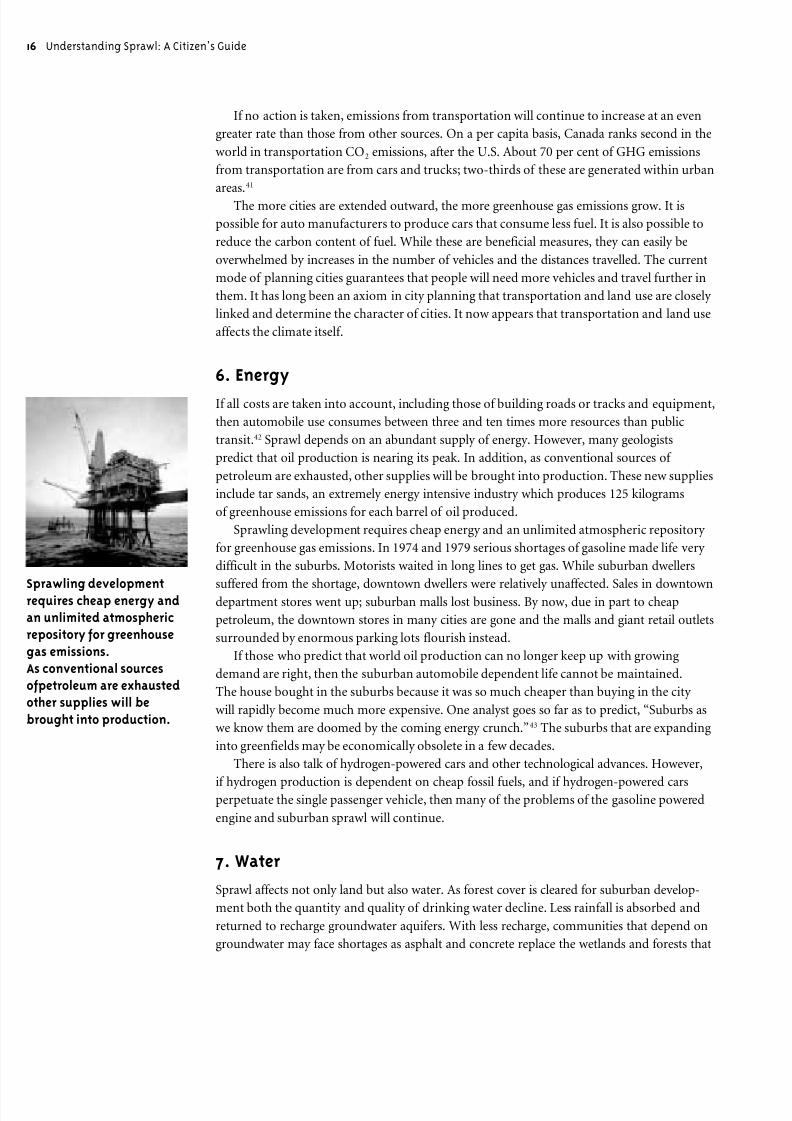
prawling developmentequires cheap energy and
n unlimited atmospheric
epository for greenhouse
gas emissions.
As conventional sources
fpetroleum are exhausted
ther supplies will be
brought into production.
8/7/2019 Understanding Sprawl
http://slidepdf.com/reader/full/understanding-sprawl 22/27
The costs of spraw
absorbed and filtered water. Parking lots, roadways, driveways, roofs, lawns and sewer lines
prevent rainwater from seeping into the ground. Parking lots create about 16 times more rain
runoff than meadows, according to U.S. research.44 Rainwater is treated as a waste product
and runs off pavement and roofs and into storm sewer pipes that empty into rivers and
streams or treatment plants, adding to an already overburdened sewage treatment system.
The runoff, which picks up road residues along the way, pollutes the watercourses it enters
and contributes substantially to the need for more expensive treatment systems.
Water pollution occurs in two ways: the most well known is “point source,” where, for
example, a factory or a sewage outflow discharges directly into a river, stream, lake or reser-
voir. In such cases, a pollution permit and monitoring and compliance regime can be imple-
mented. A more difficult problem is “non-point source” pollution where storm sewers gather
oil, grease and toxic chemicals from roadways and parking lots then deposit them in rivers
and lakes or the ocean. This is one of the most difficult pollution problems since no single
individual is responsible. The environmental and health problems associated with such toxic
water pollution are borne by all of society and the ecosystems on which we depend. These are
more of the hidden costs of sprawl.
8. Wildlife
The expansion of suburbs into woodlands and wetlands deprives wildlife of their habitat.
Each time development displaces forests, fills wetland or paves over prairies and grasslands,
it deprives some species of their homes. Some of these species are rare or endangered; others,
though more abundant, may still suffer decline in numbers, which reduces genetic diversity.
Much of the original woodland that covered Canada has been logged. Today the primary
threat to those woodlands and wetlands that remain near Canada’s cities is urban sprawl.
The Federation of Ontario Naturalists warns, “Woodlands, wetlands and other natural
areas are critical to human and environmental well-being. They provide oxygen, reduceglobal warming, filter pollutants out of air and water, and enrich Ontario’s biodiversity by
providing specialized habitats for plants and animals ... Roads, power lines, subdivisions and
pipelines often cut through natural areas, thereby fragmenting wildlife habitat and altering
wildlife movement patterns... Some forest fragments are too small to maintain viable breed-
ing populations of certain wildlife species, especially bird species that require forest interior
habitats (i.e. nowhere near the forest edge). Ecological changes resulting from fragmentation
include introduction of invasive exotic (non-native) species … .Creating small, isolated
forest patches can also interfere with pollination, seed dispersal, wildlife migration and
breeding. Ultimately, these changes can result in the local loss of species.”45
There is a tendency to see the protection of species as a national or international problem
but it is also a local problem since protecting rich and varied local flora protects wildernessin general.
9. Aesthetics and quality of life
Sprawl, dependent on automotive culture, tends to destroy urban and rural charm by replac-
ing the unique qualities of places with the universal sameness characterized by roadside
franchises. There is an absence of what architects call a “sense of place” in many new suburbs.
What passes for centres – the shopping malls – are islands in a sea of parked cars. Providing
storage spaces for cars at the origin and destination of every trip has become a major
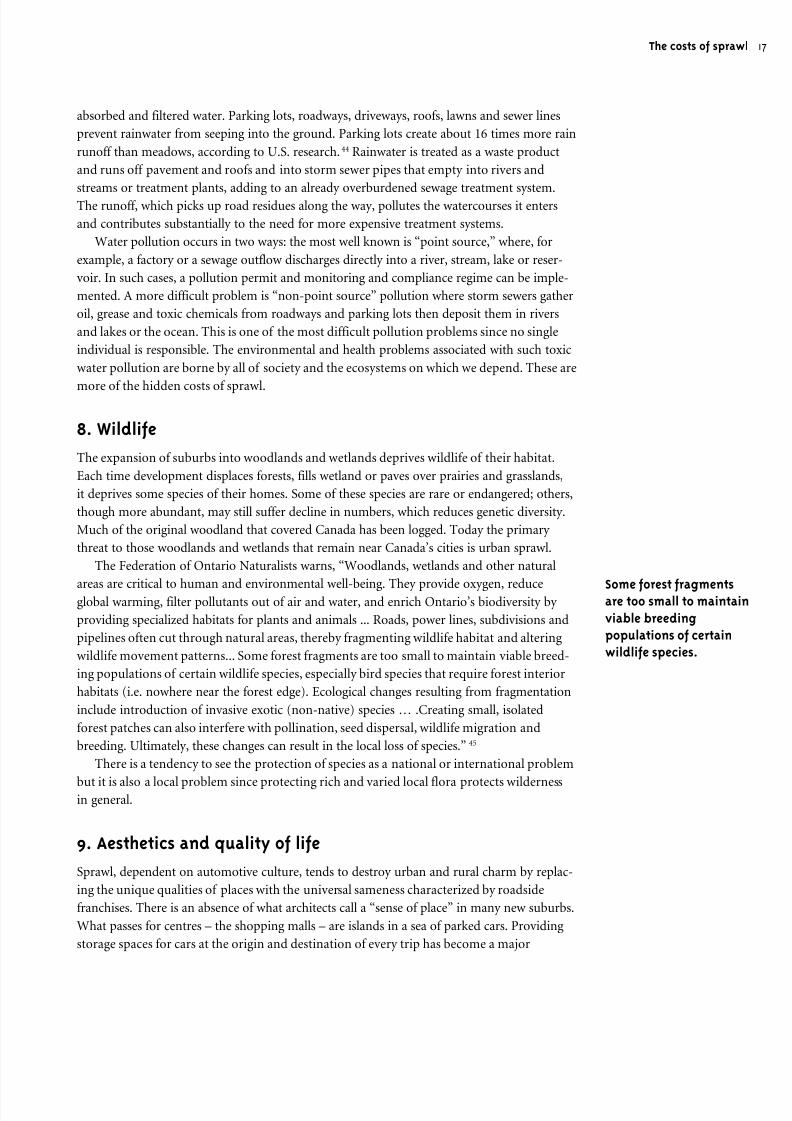
Some forest fragmentsare too small to maintai
viable breeding
populations of certain
wildlife species.
8/7/2019 Understanding Sprawl
http://slidepdf.com/reader/full/understanding-sprawl 23/27
requirement for architects and urban designers. But although individual automobiles
may be smartly designed, no one has yet managed to create a beautiful parking lot.
In addition to the aesthetic loss in suburban life is the social loss. In newer subdivisions
isolation often replaces the conviviality and chance sidewalk meetings of older urban neigh-
bourhoods. Isolation is designed into the land use pattern and the transportation arrange-
ments. There are no casual passers-by on cul-de-sac streets and fewer opportunities for
casual interactions between people. Sociologists have remarked upon this since the beginning
of large-scale suburbanization and it is still true. Auto-dominated suburbs are the antithesis
of cities, which have historically been meeting places, full of opportunity for socializing.
A recent study showed that people living in walkable neighbourhoods were more likely to
know their neighbours, participate politically, trust others, and be socially engaged.46
The architectural theorist Christopher Alexander writes, “It is quite possible that the
collective cohesion people need to form a viable society just cannot develop when the
vehicles which people use force them to be 10 times farther apart, on the average, than they
have to be. This states the possible social cost of cars in its strongest form. It may be that cars
cause the breakdown of society, simply because of their geometry.”
47
Without reliable public transportation the young cannot travel independently. They are
dependent on parents to chauffeur them to friends, playing fields and shopping malls. Not
long ago in most cities children could make these trips on foot or bicycle or, when a little
older, by themselves on a bus. However, destinations became further apart as the city swelled
to accommodate automobiles. Roads became inhospitable to walkers or bicycle riders, and
buses less frequent. Not just the young, but also the elderly, who believed themselves more
mobile than any generation in history, can find themselves too old to drive. As a result, older
people often find themselves immobilized and isolated in suburbs where driving is necessary
to procure the necessities of life. As a result there has been a trend in some cities, like
Vancouver, for older people to relocate back to the denser downtown areas where walking
and transit combine to give greater accessibility.It is a paradox of the automobile age that despite huge increases in the number of vehicles
it is harder than ever for large segments of the population to travel. Those who cannot drive
– the poor, the old, the young – are left behind. Loss of a job can also mean loss of ability to
make payments on a car, and poverty can be hard to climb out of without a car, because it is
hard to get to jobs when there is little or no public transportation. A big difference for the
poor is that a ride on transit costs just a fare but car ownership demands a significant invest-
ment. Some car owners end up meeting the costs of purchase, insurance and gas by doing
without other needs.
It is not just dependence on the auto that limits social interaction in suburbia; it is also
the practice of building communities solely of similarly-priced homes. A neighbourhood of
$400,000 houses typically does not provide less-expensive alternatives for “empty-nesters”to occupy when they downsize their residences. An expanding family may also be forced to
move away from the neighbourhood (and schools) where they first set down roots. So there
is great turnover in the population of the subdivision. This need not happen in a city
neighbourhood where there is typically a variety of different housing forms and styles and
therefore one can stay in the same neighbourhood for a lifetime. Contrary to the suburban
pattern, the new Toronto Official Plan has as a goal of “providing a diversity of housing
options.” The idea is that as people age or otherwise change circumstances in life they can
find accommodations within their community. This creates a more stable community,
making citizens more loyal to it and concerned with its condition.
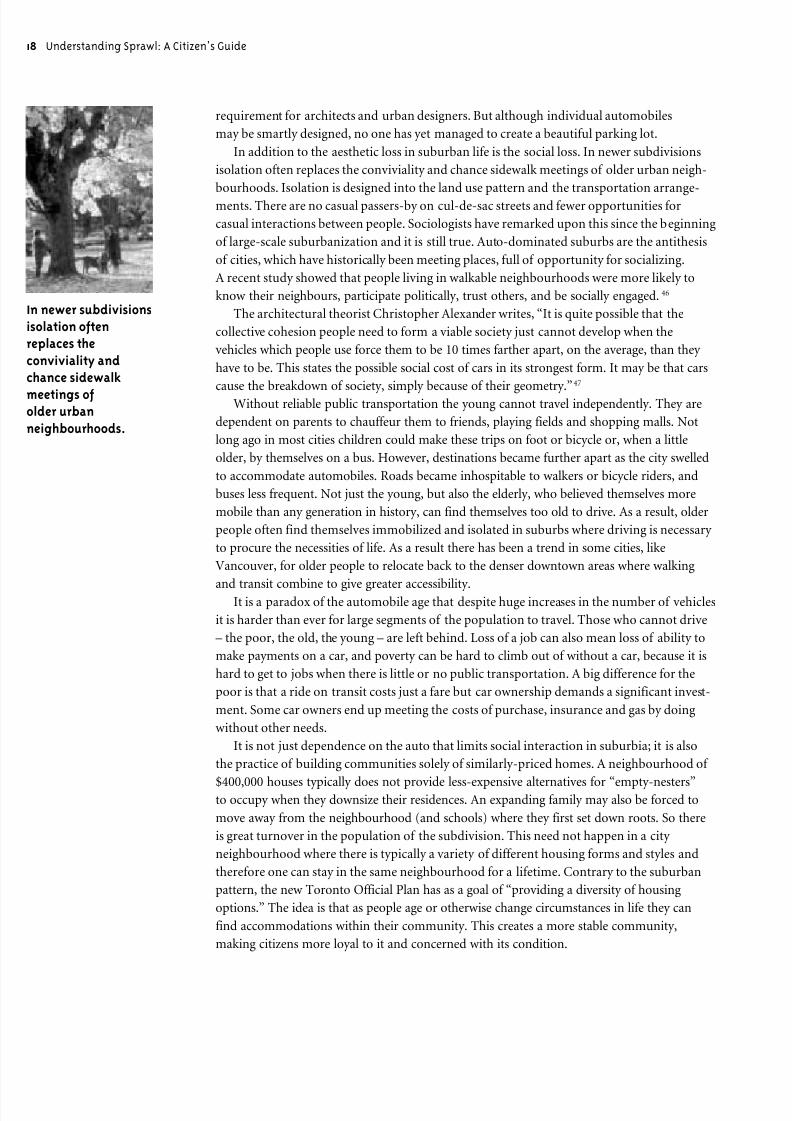
n newer subdivisions
solation often
eplaces the
onviviality and
hance sidewalk
meetings oflder urban
eighbourhoods.
8 Understanding Sprawl: A Citizen’s Guide
8/7/2019 Understanding Sprawl
http://slidepdf.com/reader/full/understanding-sprawl 24/27
Suburban sprawl is changing Canada dramatically. It consumes the farms, forests,
wetlands and prairies around cities. It requires roads, water and sewer lines that are
longer and more costly than those needed for more compact urban settlement.
Sprawling development is difficult to serve with public transportation. It depends on cars
and trucks to move people and goods, which results in more vehicles emitting pollutants
into the atmosphere. These pollutants cause respiratory and other illnesses that are painful
to individuals, costly to the health system and can lead to premature death.
Ultimately, the highest cost of all may be the role of sprawl in inducing climate change.
Transportation is the source of about a quarter of greenhouse gas (GHG) emissions. Sprawl,
because it requires so much automotive transportation, is heavily dependent on energy
consumption from the fossil fuels that produce GHGs.
Sprawl appears to be the product of numerous individual decisions to buy houses and
locate businesses at low densities outside cities. But this consumer preference is heavily
influenced by public construction of the infrastructure that makes ultra-low density
locations possible. The government subsidizes sprawl directly by paying for the facilities
that allow developers to build and, indirectly, by absorbing the costs of air pollution, climate
change, and damage to water and wildlife resources. Individual households also pay, as
sprawl requires householders to have multiple automobiles, that in turn demand increasing
proportions of family budgets. Automobiles are necessary to reach virtually all destinations
and this arrangement tends to isolate people, while the destinations themselves, which are
more attentive to parking than architecture, don’t contribute to aesthetic satisfaction.
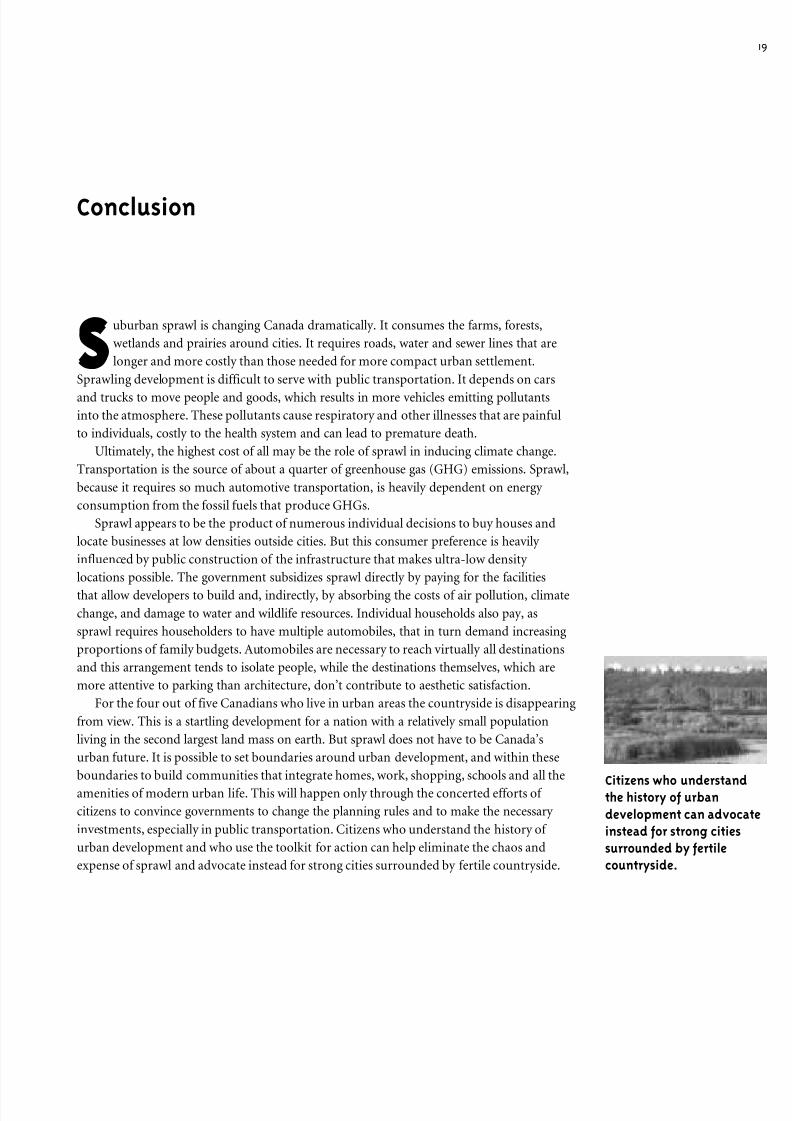
For the four out of five Canadians who live in urban areas the countryside is disappearing
from view. This is a startling development for a nation with a relatively small population
living in the second largest land mass on earth. But sprawl does not have to be Canada’s
urban future. It is possible to set boundaries around urban development, and within these
boundaries to build communities that integrate homes, work, shopping, schools and all the
amenities of modern urban life. This will happen only through the concerted efforts of
citizens to convince governments to change the planning rules and to make the necessary
investments, especially in public transportation. Citizens who understand the history of
urban development and who use the toolkit for action can help eliminate the chaos and
expense of sprawl and advocate instead for strong cities surrounded by fertile countryside.
Conclusion
Citizens who understanthe history of urban
development can advoc
instead for strong cities
surrounded by fertile
countryside.
S
8/7/2019 Understanding Sprawl
http://slidepdf.com/reader/full/understanding-sprawl 25/27
Other resources
A variety of organizations are engaged in urban development issues throughout Canada and
the United States. Many are easily accessible through the Internet. The following are some
of the groups that can provide valuable guidance and knowledge to enhance your campaign:
www.smartgrowthcanada.com
www.smartgrowth.bc.ca
www.kyotoandsprawl.ca
www.ontarionature.org/enviroandcons/issues/sprawl.html
www.sustainablecommunities.org
To help reduce your personal impact on the environment visit the David Suzuki
Foundation website: www.davidsuzuki.org and take the Nature Challenge.
Recommended publications:
The Smartgrowth BC toolkit provides a detailed look at many of the complex technicalissues involved in building “smarter” communities. It includes excellent information on
smart growth, smart growth tools, citizen involvement and references to other sources
of information. It’s at www.smartgrowth.bc.ca
Smart Growth in Ontario: a Provincial Progress Report on Smart Growth and Urban Sprawl ,
by Mark Winfield of the Pembina Institute.
Available at http://www.pembina.org/publications_item.asp?id=149
The Smart Growth Guide to Local Government Law and Advocacy , by Linda Nowlan,
Chris Rolfe and Kathy Grant, Available from West Coast Environmental Law at www.wcel.org
Sprawl Hurts Us All by Kimberley E. Neill, Stephen Bonser and Janet Pelley, is a guide
to the costs of sprawl published by the Sierra Club of Eastern Canada. It’s available at www.sierraclub.ca
0 Understanding Sprawl: A Citizen’s Guide
8/7/2019 Understanding Sprawl
http://slidepdf.com/reader/full/understanding-sprawl 26/27
Notes1 Statistics Canada. 2001 Census of Population. According to the 2001 census, 79.4 per cent of Canadians
live in an urban area. This is up from 78.5 per cent in 1996.2 Pamela Blais. Inching Toward Sustainability: The Evolving Urban Structure of the GTA. Neptis Fondation,
March, 2000. pp. 12-13.3 Canada Housing and Mortgage Corporation. Housing Outlook, 2003.4 Bradford Snell. American Ground Transportation: A Proposal for Restructuring the Automobile, Truck,
Bus and Rail Industries. Hearings before the U.S. Senate Subcommittee on Antitrust and Monopoly.
US Government Printing Office, Washington, 1974.5 Statistics Canada. 2001 Census of Population.6 The New York Times. “On Prince Edward Island.” August 24, 2003. Significantly, this is noted in the
newspaper’s travel section as a detriment to tourism, the province’s second largest industry.7 Christopher A. Kennedy. A Comparison of the Sustainability of Public and Private Transportation Systems:
Study of the Greater Toronto Area, November 2000.8 Conversation with Elizabeth Plater-Zyberk, new urbanist architect.9 IBI Group and Dillon Consulting Ltd. Toronto-Related Futures Study, Interim Report: Implications of
Business-as-Usual Development, August 2002.10
Sierra Club. Sprawl Hurts Us All, A guide to the costs of sprawl development and how to create livablecommunities in Ontario, 2003.
11 “FCM President Launches Grassroots Push for Municipal New Deal” News Release Federation of
Canadian Municipalities, Ottawa, Sept. 17, 200312 Canada Mortgage and Housing Corporation. Infrastructure Costs Associated with Conventional and
Alternative Development Pattern. Research Highlights, Socio-Economic Series, Issue 26. Capital infra-
structure costs decline from $34,564 to $29,263. Some of the more dramatic capital cost savings are for
sanitary sewer and stormwater management, reduced by 37 per cent, and water distribution by 28 per
cent. Infrastructure replacement, and operating and maintenance costs decline from a life-cycle cost
of $125,209 to $114,233.13 Pamela Blais. The Economics of Urban Form. Greater Toronto Area Task Force, 1995. Table 8, p. 42.14 Canadian Automobile Association. Driving Costs, 2002 edition.15 Surface Transportation Policy Project and the Center for Neighborhood Technology. Driven to Spend.
November 2000.16 Statistics Canada. Average household expenditures, 2001 Census of Population.17 Jeffrey Kenworth and Felix Laube. Travel Demand Management: The Potential for Enhancing Urban Rail
Opportunities and Reducing Automobile Dependence in Cities. Institute for Science and Technology Policy,
Murdoch University, Australia, 1999.18 Peter Newman and Jeffrey Kenworthy. Sustainability and Cities, Overcoming Automobile Dependence.
Island Press, Washington, 1999. Table 3.9: average car kmh in U.S., 51.1; Canada, 39.8; Europe, 35.9.19 Ray Tomalty. Growth Management in the Vancouver Region. Department of Environment and Resource
Studies. University of Waterloo. March 200220 Pamela Blais. Inching Toward Sustainability , op.cit.21 Rural GTA Working Group for the Greater Toronto Coordinating Committee. Vision for the Countryside.
June 199922 http://www.alc.gov.bc.ca/publications/Alr_history.htm23 Pamela Blais. The Economics of Urban Form, op.cit.24 Walton & Hunter Planning Associates, Betsy J. Donald, J. Ross Raymond & Associates for GTA Federa-
tions of Agriculture. GTA Agricultural Impact Study, November 199925 Todd Litman. Evaluating Transportation Land Use Impacts, Victoria Policy Institute, 199726 John Last, K. Trouton, and D. Pengelly. “Taking Our Breath Away.” David Suzuki Foundation, Oct, 1998,
p 2127 ibid, p 25-2628 ibid, p24
8/7/2019 Understanding Sprawl
http://slidepdf.com/reader/full/understanding-sprawl 27/27
29 http://www.ec.gc.ca/acidrain/acidair.html30 Submission of the Government of Canada to U.S. EPA. Proposal on Transboundary Air Pollution.
March 16, 1998 p 731 Toronto Health Public Health Department, 200032 K. Katsouyanni, et al. Short Term Effects of Air Pollution on Health: A European Approach Using
Epidemiological Time Series Data The APHEA Protocol , Journal of Epidemiology and Community Health,
50 (1996): ppS12-S1833 Howard Frumkin, M.D. Urban Sprawl and Public Health. Public Health Reports, Volume 117, May-June
200234 Transport Canada. Canadian Motor Vehicle Traffic Collision Statistics 2000 35 Howard Frumkin. op. cit .36 Boston Globe. “Suburban Sprawl Blamed for US Obesity.” June 20, 2003.37 New York Times. “Suburban Sprawl Adds Health Concerns, Studies Say” August 31, 200338 The American Journal of Public Health. September 1 2003, Volume 93, Issue 9, contains a number of
articles on the relationship of the built environment to public health. Dr. Jackson edited the edition.39 Intergovernmental Panel on Climate Change. Climate Change 2001: The Scientific Basis, Cambidge
University Press, 2001, p.740 M. Mann, P.D. Jones. Global Surface Temperatures Over the Past Two Millennia, Geophysical Research
Letters, Vol 30, No. 15, 200341 Government of Canada. Climate Change Plan for Canada,2002.42 Christopher A. Kennedy. op.cit. These calculations are made in terms of the comparative energy needs
to transport one person one kilometre (megajoules per person-kilometre) by different modes.43 The Globe and Mail. Richard Gilbert. “Will the last one out …” May 22, 2003.44 American Rivers, Natural Resources Defense Council, Smart Growth America. How Sprawl Aggravates
Drought. August 2002. www.epa.gov/region8/water45 Linda Pim and Joel Ornoy. A Smart Future for Ontario. How to Protect Nature and Curb Urban Sprawl
in Your Community. Federation of Ontario Naturalists. 2003.46 Kevin M. Leyden, PhD. “Social Capital and the Built Environment: The Importance of Walkable
Neighborhoods.” American Journal of Public Health September 2003, Vol 93, No. 947 Christopher Alexander, et al. A Pattern Language, Oxford University Press, 1977
2 Understanding Sprawl: A Citizen’s Guide