Understanding 802.11 Performance in Heterogeneous...
6
Understanding 802.11 Performance in Heterogeneous Environments Kaushik Lakshminarayanan, Srinivasan Seshan, Peter Steenkiste Carnegie Mellon University {kaushik, srini, prs}@cs.cmu.edu Abstract The availability of unlicensed spectrum coupled with the increas- ing popularity of wireless communication has given rise to a di- verse range of wireless technologies that compete for spectrum. In particular, 802.11 devices face a host of problems such as interfer- ence with other 802.11 devices (hidden terminals) as well as with technologies like Bluetooth and ZigBee. Understanding how the medium is utilized and inferring the cause of interference, based on observations from a single wireless node, is hard. Past work has used monitoring infrastructures to detect interference between 802.11 nodes in enterprise networks. In this paper, we try to an- swer the question: “how can we enable users to reason about wire- less performance variations without requiring elaborate instrumen- tation and infrastructure support?". We propose WiMed, a tool that uses only local measurements from commodity 802.11 NICs (at the node being diagnosed) to construct a time map of how the medium is utilized. We have implemented a WiMed prototype using the MadWifi driver for Atheros NICs. Early results show that WiMed is useful and can characterize non-802.11 interference better than existing systems. Categories and Subject Descriptors C.4 [Performance of Systems]: [Measurement Techniques]; C.2.3 [Computer-Communication Networks]: Network Operations— Network monitoring; C.2.1 [Computer-Communication Networks]: Network Architecture and Design—Wireless Communication General Terms Measurement, Experimentation, Performance Keywords wireless networks, heterogeneous environments, monitoring, diag- nosis, performance, 802.11, Bluetooth, interference 1. INTRODUCTION The dependence on wireless technologies has been increasing continuously over the last decade. Unfortunately, the behavior and Permission to make digital or hard copies of all or part of this work for personal or classroom use is granted without fee provided that copies are not made or distributed for profit or commercial advantage and that copies bear this notice and the full citation on the first page. To copy otherwise, to republish, to post on servers or to redistribute to lists, requires prior specific permission and/or a fee. HomeNets’11, August 15, 2011, Toronto, Ontario, Canada. Copyright 2011 ACM 978-1-4503-0798-7/11/08 ...$10.00. performance of wireless links is often highly dependent on the surrounding environmental conditions. For example, interference from nearby transmitters sharing the same spectrum impacts per- formance. Chaotic environments (e.g., home) are especially chal- lenging as they lack experts that can manage wireless networks. Despite the widespread use of wireless networks, an 802.11 user has few tools to help explain unpredictable wireless performance let alone address any problems. Research on tools for wireless performance diagnosis have pro- duced two types of solutions: infrastructure designs for monitoring wireless networks, and tools for addressing configuration failures. Our work is complementary to efforts that diagnose configuration- based problems [1, 8, 2]. Instead, we aim to build a standalone tool for the user to understand wireless performance variations, which is more related to the former direction of research. Existing wireless monitoring infrastructures have been designed in the con- text of diagnosing performance problems in enterprise wireless net- works [10, 9, 7, 18]. These architectures use monitors throughout the enterprise network and try to get a unified view of the environ- ment by combining the different views provided by these monitors. Another direction of research [1, 8, 19] uses wireless clients around the client being diagnosed to identify causes of wireless problems. There has also been work on identifying hidden and exposed termi- nals in 802.11 using conflict graphs [12, 3]. Most of the above research has been based on the premise that nodes experiencing performance fluctuations cannot do meaning- ful diagnosis in isolation. While using a group of nodes (peers, special purpose monitor nodes) simplifies this process, this is not always practical (e.g., in residential WLANs) due to the overhead in setting up and managing the distributed monitoring infrastruc- ture. Moreover, previous work has largely focused on interference in WiFi-only networks and it does not provide a way for users to understand what is happening in the wireless ether. Recent work [6] attempts to perform cross-protocol interference diagnosis, but the preliminary work presented does not identify interference from different technologies. We make the following contributions in this paper: 1. We have built a tool that provides a time-domain view of how the medium is used in a given 802.11 channel based on local observations alone. 2. We present a study of how physical layer properties such as bit error patterns and medium busy times measured using commodity 802.11 NICs can be used to identify the cause of interference from non-802.11 devices. We first provide a taxonomy for classifying the broad range of problems in the space (Section 2). We then explain the WiMed 43
Transcript of Understanding 802.11 Performance in Heterogeneous...

Understanding 802.11 Performance inHeterogeneous Environments
Kaushik Lakshminarayanan, Srinivasan Seshan, Peter SteenkisteCarnegie Mellon University
{kaushik, srini, prs}@cs.cmu.edu
Abstract
The availability of unlicensed spectrum coupled with the increas-ing popularity of wireless communication has given rise to a di-verse range of wireless technologies that compete for spectrum. Inparticular, 802.11 devices face a host of problems such as interfer-ence with other 802.11 devices (hidden terminals) as well as withtechnologies like Bluetooth and ZigBee. Understanding how themedium is utilized and inferring the cause of interference, basedon observations from a single wireless node, is hard. Past workhas used monitoring infrastructures to detect interference between802.11 nodes in enterprise networks. In this paper, we try to an-swer the question: “how can we enable users to reason about wire-less performance variations without requiring elaborate instrumen-tation and infrastructure support?". We propose WiMed, a tool thatuses only local measurements from commodity 802.11 NICs (at thenode being diagnosed) to construct a time map of how the mediumis utilized. We have implemented a WiMed prototype using theMadWifi driver for Atheros NICs. Early results show that WiMedis useful and can characterize non-802.11 interference better thanexisting systems.
Categories and Subject Descriptors
C.4 [Performance of Systems]: [Measurement Techniques]; C.2.3[Computer-Communication Networks]: Network Operations—Network monitoring; C.2.1 [Computer-Communication Networks]:Network Architecture and Design—Wireless Communication
General Terms
Measurement, Experimentation, Performance
Keywords
wireless networks, heterogeneous environments, monitoring, diag-nosis, performance, 802.11, Bluetooth, interference
1. INTRODUCTIONThe dependence on wireless technologies has been increasing
continuously over the last decade. Unfortunately, the behavior and
Permission to make digital or hard copies of all or part of this work forpersonal or classroom use is granted without fee provided that copies arenot made or distributed for profit or commercial advantage and that copiesbear this notice and the full citation on the first page. To copy otherwise, torepublish, to post on servers or to redistribute to lists, requires prior specificpermission and/or a fee.HomeNets’11, August 15, 2011, Toronto, Ontario, Canada.Copyright 2011 ACM 978-1-4503-0798-7/11/08 ...$10.00.
performance of wireless links is often highly dependent on thesurrounding environmental conditions. For example, interferencefrom nearby transmitters sharing the same spectrum impacts per-formance. Chaotic environments (e.g., home) are especially chal-lenging as they lack experts that can manage wireless networks.Despite the widespread use of wireless networks, an 802.11 userhas few tools to help explain unpredictable wireless performancelet alone address any problems.
Research on tools for wireless performance diagnosis have pro-duced two types of solutions: infrastructure designs for monitoringwireless networks, and tools for addressing configuration failures.Our work is complementary to efforts that diagnose configuration-based problems [1, 8, 2]. Instead, we aim to build a standalonetool for the user to understand wireless performance variations,which is more related to the former direction of research. Existingwireless monitoring infrastructures have been designed in the con-text of diagnosing performance problems in enterprise wireless net-works [10, 9, 7, 18]. These architectures use monitors throughoutthe enterprise network and try to get a unified view of the environ-ment by combining the different views provided by these monitors.Another direction of research [1, 8, 19] uses wireless clients aroundthe client being diagnosed to identify causes of wireless problems.There has also been work on identifying hidden and exposed termi-nals in 802.11 using conflict graphs [12, 3].
Most of the above research has been based on the premise thatnodes experiencing performance fluctuations cannot do meaning-ful diagnosis in isolation. While using a group of nodes (peers,special purpose monitor nodes) simplifies this process, this is notalways practical (e.g., in residential WLANs) due to the overheadin setting up and managing the distributed monitoring infrastruc-ture. Moreover, previous work has largely focused on interferencein WiFi-only networks and it does not provide a way for users tounderstand what is happening in the wireless ether. Recent work[6] attempts to perform cross-protocol interference diagnosis, butthe preliminary work presented does not identify interference fromdifferent technologies.
We make the following contributions in this paper:
1. We have built a tool that provides a time-domain view of howthe medium is used in a given 802.11 channel based on localobservations alone.
2. We present a study of how physical layer properties such asbit error patterns and medium busy times measured usingcommodity 802.11 NICs can be used to identify the causeof interference from non-802.11 devices.
We first provide a taxonomy for classifying the broad range ofproblems in the space (Section 2). We then explain the WiMed
43

Figure 1: Causes of 802.11 performance problems
architecture in Section 3. Section 4 evaluates parts of our systemand Section 5 summarizes our work.
2. TAXONOMY OF CAUSESWe account for the performance degradation that 802.11 clients
can experience by breaking down time utilization into two classes– medium access and packet delivery. This is based on the ob-servation that 802.11 goodput depends on, first, the opportunity tosend a packet (CSMA/CA) and once an opportunity is there, theefficiency of packet delivery. This classification is critical to un-derstanding the wireless performance experienced by clients in an802.11 LAN. We use a time allocation map for the ether (in thechannel used by the 802.11 device) based on this classification tounderstand 802.11 performance. Figure 1 shows some of the prob-lems that could be faced by 802.11 nodes. In this paper, we focusmainly on detecting interferers (packet delivery).
2.1 Medium Access802.11 nodes need to gain access to the medium using CSMA/CA
in order to send a packet. Thus, interframe spacing (contentionslots) and time utilized by other nodes competing for spectrum con-tribute towards medium access time. Other transmissions (802.11and non-802.11) that do not compete with transmissions of the linkin question do not contribute adversely towards performance of thelink, although they add to the time utilization of the medium. Interms of causes for medium access problems, 802.11 nodes facecontention from other 802.11 nodes as well as from non-802.11nodes depending on the CCA (Clear Channel Access) mode used.Other nodes can also delay access to the medium for a sender byusing unnecessarily low transmit rates, which is referred to as rate
anomaly problem. Finally, broadcast traffic and misbehaving 802.11nodes can cause unfairness in channel access.
2.2 Packet DeliveryOnce an 802.11 sender gets access to the medium, it has to use
the opportunity efficiently. This depends on two parameters – the
probability that the packet is delivered successfully to the receiver,and the data rate used (for now, we do not consider the acknowl-edgment). Assuming the SINR model and constant thermal noise,probability of packet delivery for a given data rate depends on sig-nal strength at the receiver (after attenuation or fading) and the pres-ence of interferers (802.11 and non-802.11). In this paper, we focuson interference and break up time into successful receptions (use-ful time) and unsuccessful receptions (wasted time). Further, un-successful receptions due to interference is subdivided into 802.11and non-802.11 interference. We also devise mechanisms to detectspecific interference sources using local measurements from com-
0
0.01
0.02
0.03
0.04
0.05
0.06
0 20 40 60 80 100 120 140 160 0
5
10
15
20
Fra
ctio
n B
usy
Pa
cke
t E
rro
rs
Time (sec)
802.11Medium
CRCPHY
Figure 2: Bluetooth interference (30 to 120 sec) with 802.11
causing CRC and PHY errors
modity 802.11 NICs. However, this paper does not address othercauses of inefficiency such as problems with rate adaptation, over-protective APs [10] and attenuation. We believe some of the tech-niques that have been already developed for detecting these prob-lems can be used by WiMed.
Prior research [11, 14] has shown that commodity 802.11 cardsare vulnerable to both wide-band interference (e.g. microwave ovens)and narrow-band interference (e.g. Bluetooth). There has alsobeen a lot of research on studying 802.11 hidden terminal prob-lem. While hidden terminals are not common in 802.11 infras-tructure deployments, heterogeneous environments that include de-vices with asymmetric transmit power levels are more likely to facesuch hidden terminal scenarios (which cannot be avoided by carriersense) [17]. We performed a controlled experiment on a wirelessemulator [13] to find the impact of Bluetooth interference in a setupwhere we had a Bluetooth link causing interference at an 802.11receiver. Figure 2 shows that 802.11 performance is affected con-siderably in the presence of Bluetooth interference, causing bothCRC errors and PHY errors (as reported by the NIC). It is alsoeasy to see that the medium utilization tracking mechanism used inWiMed (top curve) shows non-802.11 activity when compared tothe MAC busy time calculated using the length of 802.11 frames(bottom curve) between 30 and 120 sec.
3. WiMed FRAMEWORKThe goal of WiMed is to allow 802.11 users to identify perfor-
mance problems in heterogeneous wireless environments (e.g., in-terference) with minimal overhead. To this end, WiMed has beenbuilt to use local measurements alone to provide a meaningful viewof the usage of the wireless medium to the user. WiMed also detectssources of interference (including non-802.11 sources) to try tohelp the user solve performance problems more easily. The WiMedframework consists of a passive monitoring and trace merging stage,an analysis stage and a time allocation stage as shown in Figure 3.
3.1 Passive MonitoringThe passive monitoring stage records two traces – packet traces
with all overheard 802.11 packets and kernel log traces with times-tamped values of relevant registers on the NIC. The traces are col-lected using a secondary 802.11 NIC connected to the node beingdiagnosed. This card is used in monitor mode tuned to the channelused by the primary 802.11 card. Thus, the secondary card over-
44

Figure 3: Illustration of WiMed framework
hears all 802.11 packets in that channel that can be decoded fully orpartially (i.e., with CRC and PHY errors). We require the secondNIC only to overcome limitations in current driver architecturesthat do not enable us to perform monitoring with high fidelity ona NIC that is already associated with an access point. This setupallows us to track the following properties:
• Signal strength, transmission rate, MAC sequence numberand length of all 802.11 frames received
• Type of packet errors (e.g., CRC, PHY errors)
• Medium-busy periods as sensed by the Atheros NIC. This isthe time during which there are active transmissions on thechannel using any technology.
• MAC-busy time. This is the time during which 802.11 trans-missions are active. This is computed using packets decodedin the packet trace.
• 802.11 clients that can be heard
Medium-busy times are recorded as values of a NIC register [5]that keeps track of the cycles (of the NIC clock) when the mediumwas sensed as busy (energy detection). In order to synchronize thekernel log trace with the packet trace, we record the correspondingdriver timestamp also. We track this register at the granularity oftwo microseconds to get an accurate picture of the channel usage,and record only start and end of busy regions.
3.2 Trace MergingThe tcpdump and the kernel log traces are synchronized and
merged to get a unified view of the wireless activity in the medium.Here, we compare busy regions identified by the register (from ker-nel log) with the packet reception regions (from tcpdump) and pro-duce a trace with 802.11 packets and medium busy regions (exclud-ing the time periods with decoded packets) interspersed. We alsoannotate the medium busy regions based on whether they overlapwith the 802.11 packets or not. This annotation is used in the anal-ysis to determine the presence of non-802.11 transmitters. We canalso use this annotated information to find the start or end times ofthe interferer’s transmission whenever there is a collision, thoughthis is not currently implemented in our prototype.
3.3 AnalysisThis stage uses the merged trace as input to extract the features
mentioned in Section 3.1. It then outputs the confidence level forthe existence of performance problems and their causes based onspecific detectors. In the trace merging stage, we identify regionswhere medium was sensed as busy but no 802.11 packets werepresent in the packet trace. In the analysis stage, this is used as
Procedure 1 Interference detection (Passive)
fineErrHigh: isFEH(hashCrcErr, hashPhyErr)
myFineErrHigh: isFEH(hashMyCrcErr,hashMyPhyErr)
if myfineErrHigh then
if nonWiFiTimeHigh then
report(“interference", “non-WiFi")else
report(“interference", “WiFi")end if
else
if fineErrHigh then
report(“potential interference", NULL)end if
end if
Procedure 2 Contention detectioncurrStart: Start time of the current framecurrEnd: End time of the current frameprevEnd: End time of the previous framenextStart: Start time of the next frame
if isDIFSpluskTS(currStart - prevEnd) thenconTentionTime + = (currPktDuration + IFS)
else
if isDIFSpluskTS(nextStart - currEnd) thencontentionTime + = (currPktDuration + IFS)
end if
end if
if contentionTime / totalTime > threshold thenreport("contention", NULL)
end if
an indicator of the level of non-decodable energy present in themedium. We calibrate the environment during a relatively quiet pe-riod when there are no non-802.11 devices active (e.g., nights) toquantify the default level. We perform the calibration to take intoaccount the fact that there could be packets with low RSSI that aredetected partially by the medium-busy register but not decoded bythe NIC. During analysis, as this level increases, we increase theconfidence in the presence of a non-802.11 source.
Procedures 1 and 2 give the methods for detecting interferenceand contention in passive mode. Confidence value is calculated ina similar manner (details in [16]), but instead of giving a Booleanoutput based on a threshold, we map it to the interval [0, 1] based ondeviation from a threshold. In Procedure 1, hashCrcErr(rate)(ss)represents the number of errors found in all packets received atrate Mbps (including packets that were not sent to the node be-ing diagnosed) with signal strength between ss − δ and ss + δ
dBm. hashMyCrcErr(rate)(ss) represents the number of er-rors found in packets destined to the client in question, received atrate Mbps with signal strength between ss − δ and ss + δ dBm.Also, isFEH() finds if any of the elements of the error table exceedsa threshold. Method isDIFSpluskTS() checks to see if the packetspacing is equal to DIFS + k×Slot_Time in which case, the packetis marked as one that contended with some other node.
Further, we use Bit Error Timing Analysis (BETA) to identify thepresence of interference due to specific non-802.11 sources. When-ever we see a packet (destined to the node being diagnosed) thathas been corrupted, we try to find a copy of the packet that wasretransmitted and received successfully. Once we do that, we iden-tify the bit errors in the packet that was corrupted to form bit errorpeaks. These peaks are regions that correspond to transmissions ofthe interfering source. Using these inferred interfering transmis-sions, we do a timing analysis similar to what is done in RFDump[15]. The timing analysis uses known protocol timing parameterssuch as Bluetooth time slots (625 µsec) and microwave oven’s AC
45
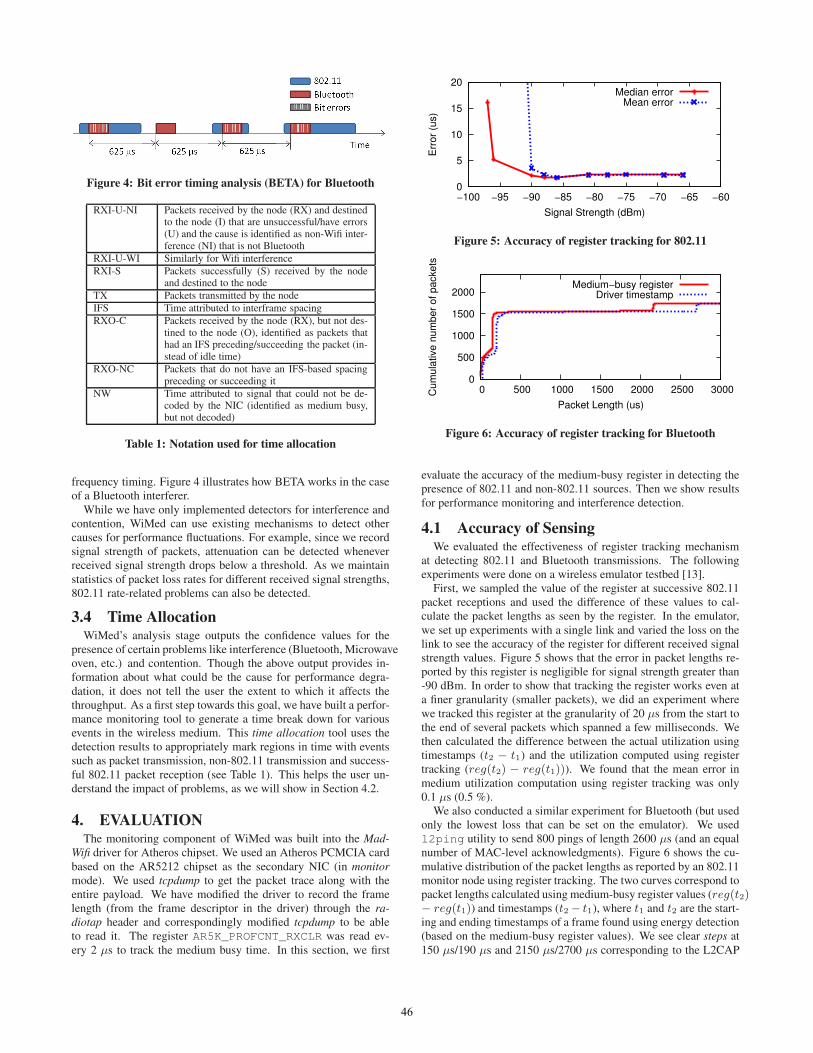
Figure 4: Bit error timing analysis (BETA) for Bluetooth
RXI-U-NI Packets received by the node (RX) and destinedto the node (I) that are unsuccessful/have errors(U) and the cause is identified as non-Wifi inter-ference (NI) that is not Bluetooth
RXI-U-WI Similarly for Wifi interference
RXI-S Packets successfully (S) received by the nodeand destined to the node
TX Packets transmitted by the node
IFS Time attributed to interframe spacing
RXO-C Packets received by the node (RX), but not des-tined to the node (O), identified as packets thathad an IFS preceding/succeeding the packet (in-stead of idle time)
RXO-NC Packets that do not have an IFS-based spacingpreceding or succeeding it
NW Time attributed to signal that could not be de-coded by the NIC (identified as medium busy,but not decoded)
Table 1: Notation used for time allocation
frequency timing. Figure 4 illustrates how BETA works in the caseof a Bluetooth interferer.
While we have only implemented detectors for interference andcontention, WiMed can use existing mechanisms to detect othercauses for performance fluctuations. For example, since we recordsignal strength of packets, attenuation can be detected wheneverreceived signal strength drops below a threshold. As we maintainstatistics of packet loss rates for different received signal strengths,802.11 rate-related problems can also be detected.
3.4 Time AllocationWiMed’s analysis stage outputs the confidence values for the
presence of certain problems like interference (Bluetooth, Microwaveoven, etc.) and contention. Though the above output provides in-formation about what could be the cause for performance degra-dation, it does not tell the user the extent to which it affects thethroughput. As a first step towards this goal, we have built a perfor-mance monitoring tool to generate a time break down for variousevents in the wireless medium. This time allocation tool uses thedetection results to appropriately mark regions in time with eventssuch as packet transmission, non-802.11 transmission and success-ful 802.11 packet reception (see Table 1). This helps the user un-derstand the impact of problems, as we will show in Section 4.2.
4. EVALUATIONThe monitoring component of WiMed was built into the Mad-
Wifi driver for Atheros chipset. We used an Atheros PCMCIA cardbased on the AR5212 chipset as the secondary NIC (in monitor
mode). We used tcpdump to get the packet trace along with theentire payload. We have modified the driver to record the framelength (from the frame descriptor in the driver) through the ra-
diotap header and correspondingly modified tcpdump to be ableto read it. The register AR5K_PROFCNT_RXCLR was read ev-ery 2 µs to track the medium busy time. In this section, we first
0
5
10
15
20
−100 −95 −90 −85 −80 −75 −70 −65 −60
Err
or
(us)
Signal Strength (dBm)
Median errorMean error
Figure 5: Accuracy of register tracking for 802.11
0
500
1000
1500
2000
0 500 1000 1500 2000 2500 3000Cu
mu
lative
nu
mb
er
of
pa
cke
ts
Packet Length (us)
Medium−busy registerDriver timestamp
Figure 6: Accuracy of register tracking for Bluetooth
evaluate the accuracy of the medium-busy register in detecting thepresence of 802.11 and non-802.11 sources. Then we show resultsfor performance monitoring and interference detection.
4.1 Accuracy of SensingWe evaluated the effectiveness of register tracking mechanism
at detecting 802.11 and Bluetooth transmissions. The followingexperiments were done on a wireless emulator testbed [13].
First, we sampled the value of the register at successive 802.11packet receptions and used the difference of these values to cal-culate the packet lengths as seen by the register. In the emulator,we set up experiments with a single link and varied the loss on thelink to see the accuracy of the register for different received signalstrength values. Figure 5 shows that the error in packet lengths re-ported by this register is negligible for signal strength greater than-90 dBm. In order to show that tracking the register works even ata finer granularity (smaller packets), we did an experiment wherewe tracked this register at the granularity of 20 µs from the start tothe end of several packets which spanned a few milliseconds. Wethen calculated the difference between the actual utilization usingtimestamps (t2 − t1) and the utilization computed using registertracking (reg(t2) − reg(t1))). We found that the mean error inmedium utilization computation using register tracking was only0.1 µs (0.5 %).
We also conducted a similar experiment for Bluetooth (but usedonly the lowest loss that can be set on the emulator). We usedl2ping utility to send 800 pings of length 2600 µs (and an equalnumber of MAC-level acknowledgments). Figure 6 shows the cu-mulative distribution of the packet lengths as reported by an 802.11monitor node using register tracking. The two curves correspond topacket lengths calculated using medium-busy register values (reg(t2)− reg(t1)) and timestamps (t2 − t1), where t1 and t2 are the start-ing and ending timestamps of a frame found using energy detection(based on the medium-busy register values). We see clear steps at150 µs/190 µs and 2150 µs/2700 µs corresponding to the L2CAP
46
0
0.1
0.2
0.3
0.4
0.5
0.6
0.7
0.8
0 50 100 150 200 250
Fra
ction o
f tim
e
Time (s)
RXI-U-NIRXI-U-WI
RXI-STX
RXO-C + IFSRXO-NC
NW
Figure 7: Time utilization map of the wireless environment for
the Bluetooth interference experiment
pings and the MAC-level acknowledgments. The number of ping-sized frames (and ACK-sized frames) reported is roughly as ex-pected (i.e., 200 out of 800 as an 802.11 channel occupies 20 MHzout of the 79 Bluetooth channels). However, the reported lengthof both these frames are shorter than the expected length (by about20 %) when using the former method. This indicates that the energydetection as performed by the 802.11 receiver of a Bluetooth sig-nal (narrow-band) is not accurate, but at the granularity of a packet,using the latter method works well.
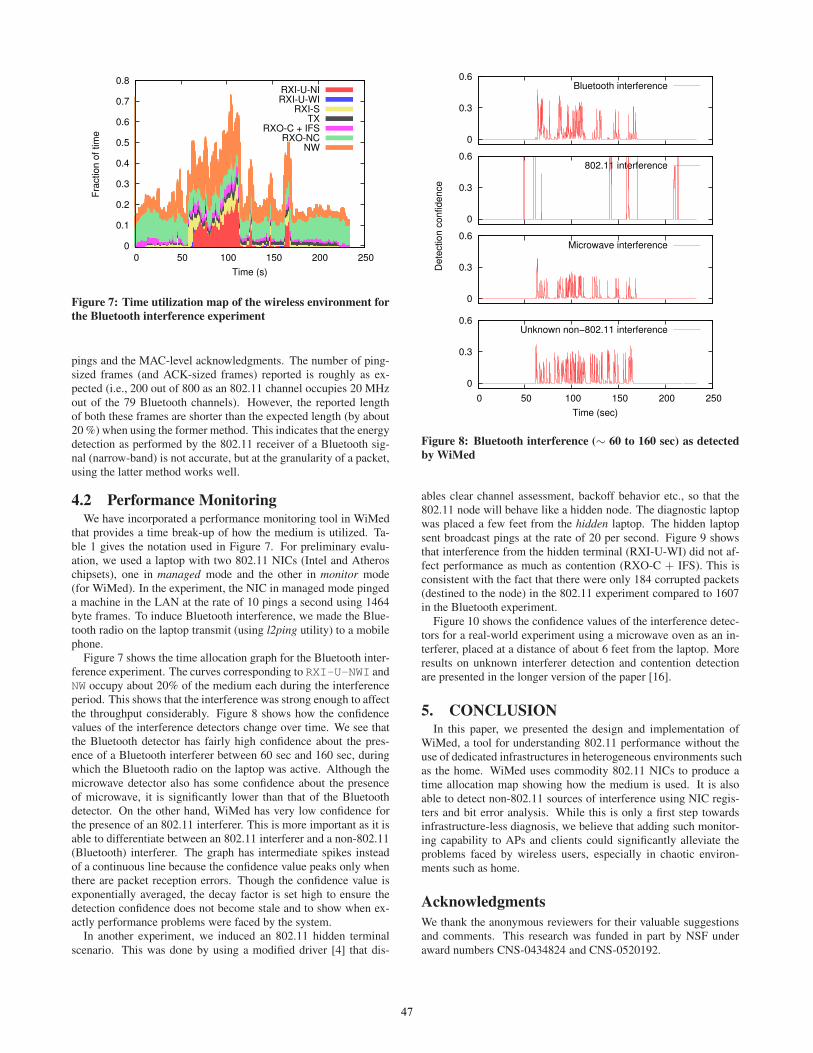
4.2 Performance MonitoringWe have incorporated a performance monitoring tool in WiMed
that provides a time break-up of how the medium is utilized. Ta-ble 1 gives the notation used in Figure 7. For preliminary evalu-ation, we used a laptop with two 802.11 NICs (Intel and Atheroschipsets), one in managed mode and the other in monitor mode(for WiMed). In the experiment, the NIC in managed mode pingeda machine in the LAN at the rate of 10 pings a second using 1464byte frames. To induce Bluetooth interference, we made the Blue-tooth radio on the laptop transmit (using l2ping utility) to a mobilephone.
Figure 7 shows the time allocation graph for the Bluetooth inter-ference experiment. The curves corresponding to RXI-U-NWI andNW occupy about 20% of the medium each during the interferenceperiod. This shows that the interference was strong enough to affectthe throughput considerably. Figure 8 shows how the confidencevalues of the interference detectors change over time. We see thatthe Bluetooth detector has fairly high confidence about the pres-ence of a Bluetooth interferer between 60 sec and 160 sec, duringwhich the Bluetooth radio on the laptop was active. Although themicrowave detector also has some confidence about the presenceof microwave, it is significantly lower than that of the Bluetoothdetector. On the other hand, WiMed has very low confidence forthe presence of an 802.11 interferer. This is more important as it isable to differentiate between an 802.11 interferer and a non-802.11(Bluetooth) interferer. The graph has intermediate spikes insteadof a continuous line because the confidence value peaks only whenthere are packet reception errors. Though the confidence value isexponentially averaged, the decay factor is set high to ensure thedetection confidence does not become stale and to show when ex-actly performance problems were faced by the system.
In another experiment, we induced an 802.11 hidden terminalscenario. This was done by using a modified driver [4] that dis-
0
0.3
0.6
0 50 100 150 200 250
Time (sec)
Unknown non−802.11 interference
0
0.3
0.6Microwave interference
0
0.3
0.6802.11 interference
0
0.3
0.6
Dete
ction c
onfidence
Bluetooth interference
Figure 8: Bluetooth interference (∼ 60 to 160 sec) as detected
by WiMed
ables clear channel assessment, backoff behavior etc., so that the802.11 node will behave like a hidden node. The diagnostic laptopwas placed a few feet from the hidden laptop. The hidden laptopsent broadcast pings at the rate of 20 per second. Figure 9 showsthat interference from the hidden terminal (RXI-U-WI) did not af-fect performance as much as contention (RXO-C + IFS). This isconsistent with the fact that there were only 184 corrupted packets(destined to the node) in the 802.11 experiment compared to 1607in the Bluetooth experiment.
Figure 10 shows the confidence values of the interference detec-tors for a real-world experiment using a microwave oven as an in-terferer, placed at a distance of about 6 feet from the laptop. Moreresults on unknown interferer detection and contention detectionare presented in the longer version of the paper [16].
5. CONCLUSIONIn this paper, we presented the design and implementation of
WiMed, a tool for understanding 802.11 performance without theuse of dedicated infrastructures in heterogeneous environments suchas the home. WiMed uses commodity 802.11 NICs to produce atime allocation map showing how the medium is used. It is alsoable to detect non-802.11 sources of interference using NIC regis-ters and bit error analysis. While this is only a first step towardsinfrastructure-less diagnosis, we believe that adding such monitor-ing capability to APs and clients could significantly alleviate theproblems faced by wireless users, especially in chaotic environ-ments such as home.
Acknowledgments
We thank the anonymous reviewers for their valuable suggestionsand comments. This research was funded in part by NSF underaward numbers CNS-0434824 and CNS-0520192.
47

0
0.1
0.2
0.3
0.4
0.5
0.6
0.7
0.8
0.9
0 50 100 150 200 250
Fra
ction o
f tim
e
Time (s)
RXI-U-NIRXI-U-WI
RXI-STX
RXO-C + IFSRXO-NC
NW
Figure 9: Time utilization map of the wireless environment for
the 802.11 interference experiment
6. REFERENCES[1] A. Adya, P. Bahl, R. Chandra, and L. Qiu. Architecture and
techniques for diagnosing faults in ieee 802.11 infrastructurenetworks. In MobiCom ’04, Philadelphia, PA, USA, 2004.
[2] B. Aggarwal, R. Bhagwan, T. Das, S. Eswaran, V. N.Padmanabhan, and G. M. Voelker. Netprints: diagnosinghome network misconfigurations using shared knowledge. InNSDI’09, Boston, MA, 2009.
[3] N. Ahmed, U. Ismail, S. Keshav, and K. Papagiannaki.Online estimation of rf interference. In CoNEXT ’08,Madrid, Spain, 2008.
[4] E. Anderson, G. Yee, C. Phillips, D. Sicker, andD. Grunwald. Commodity ar52xx-based wireless adapters asa research platform.http://systems.cs.colorado.edu/wiki/CARP,April 2008.
[5] P. Aravinda, K. Acharya, A. Sharma, E. M. Belding, K. C.Almeroth, and K. Papagiannaki. Congestion-aware rateadaptation in wireless networks: A measurement-drivenapproach. In SECON’08, 2008.
[6] A. Baid, S. Mathur, I. Seskar, T. Singh, S. Jain,D. Raychaudhuri, S. Paul, and A. Das. Spectrum mri:Towards automated diagnosis of multi-radio interference inthe unlicensed band. In IEEE Wireless Communications and
Networking Conference, 2011.
[7] R. Chandra, J. Padhye, A. Wolman, and B. Zill. Alocation-based management system for enterprise wirelesslans. In Proc. NSDI’07, Cambridge, MA, Nov. 2007.
[8] R. Chandra, V. N. Padmanabhan, and M. Zhang. Wifiprofiler:cooperative diagnosis in wireless lans. In MobiSys ’06,Uppsala, Sweden, 2006.
[9] Y.-C. Cheng, M. Afanasyev, P. Verkaik, P. Benkö, J. Chiang,A. C. Snoeren, S. Savage, and G. M. Voelker. Automatingcross-layer diagnosis of enterprise wireless networks. InSIGCOMM ’07, Kyoto, Japan, 2007.
[10] Y.-C. Cheng, J. Bellardo, P. Benkö, A. C. Snoeren, G. M.Voelker, and S. Savage. Jigsaw: solving the puzzle ofenterprise 802.11 analysis. In SIGCOMM ’06, Pisa, Italy,2006.
0
0.3
0.6
0.9
0 50 100 150 200 250
Time (sec)
Unknown non−802.11 interference
0
0.3
0.6
0.9Microwave interference
0
0.3
0.6
0.9802.11 interference
0
0.3
0.6
0.9
De
tectio
n c
on
fid
en
ce
Bluetooth interference
Figure 10: Microwave interference (∼ 60 to 160 sec) as detected
by WiMed
[11] R. Gummadi, D. Wetherall, B. Greenstein, and S. Seshan.Understanding and mitigating the impact of rf interferenceon 802.11 networks. In SIGCOMM ’07, Kyoto, Japan, 2007.
[12] K. Jain, J. Padhye, V. N. Padmanabhan, and L. Qiu. Impactof interference on multi-hop wireless network performance.Wirel. Netw., 11(4):471–487, 2005.
[13] G. Judd and P. Steenkiste. Using emulation to understandand improve wireless networks and applications. In Proc.
NSDI’05, Berkeley, CA, USA, 2005.
[14] A. Kamerman and N. Erkocevic. Microwave oveninterference on wireless lans operating in the 2.4 ghz ismband. Proc. PIMRC ’97, 3, Sep 1997.
[15] K. Lakshminarayanan, S. Sapra, S. Seshan, and P. Steenkiste.Rfdump: an architecture for monitoring the wireless ether. InCoNEXT ’09, Rome, Italy, 2009.
[16] K. Lakshminarayanan, S. Seshan, and P. Steenkiste. Wimed:An infrastructure-less approach to wireless diagnosis.Technical Report CMU-CS-11-118, Carnegie MellonUniversity, Department of Computer Science, June 2011.
[17] C.-J. M. Liang, N. B. Priyantha, J. Liu, and A. Terzis.Surviving wi-fi interference in low power zigbee networks.In SenSys ’10, Zürich, Switzerland, 2010.
[18] R. Mahajan, M. Rodrig, D. Wetherall, and J. Zahorjan.Analyzing the mac-level behavior of wireless networks in thewild. In SIGCOMM ’06, Pisa, Italy, 2006.
[19] A. Sheth, C. Doerr, D. Grunwald, R. Han, and D. Sicker.Mojo: a distributed physical layer anomaly detection systemfor 802.11 wlans. In MobiSys ’06, Uppsala, Sweden, 2006.
48