
Unclassified - apps.dtic.mil · A series of fuels were tested on a bench stand designed and...
211
Unclassified EVALUATION OF FUTURE FUELS IN A HIGH PRESSURE COMMON RAIL SYSTEM PART 1 – CUMMINS XPI INTERIM REPORT TFLRF No. 429 by Robert W. Warden Edwin A. Frame Douglas M. Yost U.S. Army TARDEC Fuels and Lubricants Research Facility Southwest Research Institute ® (SwRI ® ) San Antonio, TX for Patsy A. Muzzell Eric R. Sattler U.S. Army TARDEC Force Projection Technologies Warren, Michigan Contract No. W56HZV-09-C-0100 (WD0004–Task VII) Approved for public release: distribution unlimited October 2012 ADA
Transcript of Unclassified - apps.dtic.mil · A series of fuels were tested on a bench stand designed and...

Unclassified
EVALUATION OF FUTURE FUELS IN A HIGH PRESSURE COMMON RAIL SYSTEM
PART 1 – CUMMINS XPI
INTERIM REPORT TFLRF No. 429
by Robert W. Warden
Edwin A. Frame Douglas M. Yost
U.S. Army TARDEC Fuels and Lubricants Research Facility
Southwest Research Institute® (SwRI®) San Antonio, TX
for Patsy A. Muzzell
Eric R. Sattler U.S. Army TARDEC
Force Projection Technologies Warren, Michigan
Contract No. W56HZV-09-C-0100 (WD0004–Task VII)
Approved for public release: distribution unlimited
October 2012
ADA
Report Documentation Page Form ApprovedOMB No. 0704-0188
Public reporting burden for the collection of information is estimated to average 1 hour per response, including the time for reviewing instructions, searching existing data sources, gathering andmaintaining the data needed, and completing and reviewing the collection of information. Send comments regarding this burden estimate or any other aspect of this collection of information,including suggestions for reducing this burden, to Washington Headquarters Services, Directorate for Information Operations and Reports, 1215 Jefferson Davis Highway, Suite 1204, ArlingtonVA 22202-4302. Respondents should be aware that notwithstanding any other provision of law, no person shall be subject to a penalty for failing to comply with a collection of information if itdoes not display a currently valid OMB control number.
1. REPORT DATE 15 OCT 2012
2. REPORT TYPE Interim Report
3. DATES COVERED 01-04-2009 to 01-10-2012
4. TITLE AND SUBTITLE Evaluation of Future Fuels in a High Pressure Common Rail System ?Part 1 Cummins XPI
5a. CONTRACT NUMBER W56HZV-09-C-0100
5b. GRANT NUMBER
5c. PROGRAM ELEMENT NUMBER
6. AUTHOR(S) Robert Warden; Frame Edwin ; Yost Douglas; Eric Sattler; Patsy Muzzell
5d. PROJECT NUMBER SwRI 08.14734.04.261
5e. TASK NUMBER WD 0004 ? Task VII
5f. WORK UNIT NUMBER
7. PERFORMING ORGANIZATION NAME(S) AND ADDRESS(ES) U.S. Army TARDEC Fuels and Lubricants Research Facility(SwRI?),Southwest Research Institute,P.O. Drawer 28510,San Antonio,TX,78228-0510
8. PERFORMING ORGANIZATION REPORT NUMBER TFLRF No. 429
9. SPONSORING/MONITORING AGENCY NAME(S) AND ADDRESS(ES) U.S. Army TARDEC, 6501 E.11 Mile Rd, Warren, MI, 48397-5000
10. SPONSOR/MONITOR’S ACRONYM(S) TARDEC
11. SPONSOR/MONITOR’S REPORT NUMBER(S) #23550
12. DISTRIBUTION/AVAILABILITY STATEMENT Approved for public release; distribution unlimited
13. SUPPLEMENTARY NOTES
14. ABSTRACT A series of fuels were tested on a bench stand designed and constructed for the Cummins XPI HighPressure Common Rail Fuel System. Included were ULSD, JP-8, an FT SPK, and Jet-A. Testing occurredat 60 and 93.3?C over a 400-hour NATO cycle. Fuel viscosity ranged from 1.90 to 0.65 cSt while lubricitywear-scar diameters were from 0.54 to 1.01mm (ASTM D5001) and 0.382 to 0.75mm (ASTM D6079). Atthe conclusion of each 400-hour test, components were evaluated for wear and overall system performancewith the ULSD test acting as a baseline for comparison. Results showed the XPI system to be robust withregards to fuel lubricity and viscosity. Even under the harshest fuels, only small areas of concern werenoted in the injectors. From these results, it is expected that a synthetic fuel such as that used could besuccessfully used, with proper lubricity additives, in military ground vehicle fuel blends.
15. SUBJECT TERMS Fuel Lubricity, Viscosity, HPCR, Synthetic Jet Fuel, Cummins XPI
16. SECURITY CLASSIFICATION OF: 17. LIMITATIONOF ABSTRACT
Same asReport (SAR)
18. NUMBEROF PAGES
209
19a. NAME OFRESPONSIBLE PERSON
a. REPORT unclassified
b. ABSTRACT unclassified
c. THIS PAGE unclassified

Standard Form 298 (Rev. 8-98) Prescribed by ANSI Std Z39-18

Unclassified
Disclaimers Reference herein to any specific commercial company, product, process, or service by trade name, trademark, manufacturer, or otherwise, does not necessarily constitute or imply its endorsement, recommendation, or favoring by the United States Government or the Department of the Army (DoA). The opinions of the authors expressed herein do not necessarily state or reflect those of the United States Government or the DoA, and shall not be used for advertising or product endorsement purposes.
Contracted Author As the author(s) is(are) not a Government employee(s), this document was only reviewed for export controls, and improper Army association or emblem usage considerations. All other legal considerations are the responsibility of the author and his/her/their employer(s)
DTIC Availability Notice Qualified requestors may obtain copies of this report from the Defense Technical Information Center, Attn: DTIC-OCC, 8725 John J. Kingman Road, Suite 0944, Fort Belvoir, Virginia 22060-6218.
Disposition Instructions Destroy this report when no longer needed. Do not return it to the originator.
Unclassified
EVALUATION OF FUTURE FUELS IN A HIGH PRESSURE COMMON RAIL SYSTEM
PART 1 – CUMMINS XPI
INTERIM REPORT TFLRF No. 429
by
Robert W. Warden Edwin A. Frame Douglas M. Yost
U.S. Army TARDEC Fuels and Lubricants Research Facility
Southwest Research Institute® (SwRI®) San Antonio, TX
for Patsy A. Muzzell
Eric R. Sattler U.S. Army TARDEC
Force Projection Technologies Warren, Michigan
Contract No. W56HZV-09-C-0100 (WD0004–Task VII)
SwRI® Project No. 08.14734.04.261
Approved for public release: distribution unlimited
October 2012
Approved by: Gary B. Bessee, Director U.S. Army TARDEC Fuels and Lubricants
Research Facility (SwRI®))

Unclassified
iv
REPORT DOCUMENTATION PAGE Form Approved OMB No. 0704-0188
Public reporting burden for this collection of information is estimated to average 1-hour per response, including the time for reviewing instructions, searching existing data sources, gathering and maintaining the data needed, and completing and reviewing this collection of information. Send comments regarding this burden estimate or any other aspect of this collection of information, including suggestions for reducing this burden to Department of Defense, Washington Headquarters Services, Directorate for Information Operations and Reports (0704-0188), 1215 Jefferson Davis Highway, Suite 1204, Arlington, VA 22202-4302. Respondents should be aware that notwithstanding any other provision of law, no person shall be subject to any penalty for failing to comply with a collection of information if it does not display a currently valid OMB control number. PLEASE DO NOT RETURN YOUR FORM TO THE ABOVE ADDRESS.
1. REPORT DATE (DD-MM-YYYY) 15-10-2012
2. REPORT TYPE Interim Report
3. DATES COVERED (From - To) April 2009 – October 2012
4. TITLE AND SUBTITLE
5a. CONTRACT NUMBER W56HZV-09-C-0100
Evaluation of Future Fuels in a High Pressure Common Rail System – Part 1 Cummins XPI 5b. GRANT NUMBER
5c. PROGRAM ELEMENT NUMBER
6. AUTHOR(S)
5d. PROJECT NUMBER SwRI 08.14734.04.261
Warden, Robert; Frame, Edwin; Yost, Douglas; Sattler, Eric; Muzzell, Patsy 5e. TASK NUMBER WD 0004 – Task VII
5f. WORK UNIT NUMBER
7. PERFORMING ORGANIZATION NAME(S) AND ADDRESS(ES) 8. PERFORMING ORGANIZATION REPORT NUMBER
U.S. Army TARDEC Fuels and Lubricants Research Facility (SwRI®) Southwest Research Institute® P.O. Drawer 28510 San Antonio, TX 78228-0510
TFLRF No. 429
9. SPONSORING / MONITORING AGENCY NAME(S) AND ADDRESS(ES) 10. SPONSOR/MONITOR’S ACRONYM(S)
U.S. Army RDECOM U.S. Army TARDEC 11. SPONSOR/MONITOR’S REPORT
Force Projection Technologies NUMBER(S)
Warren, MI 48397-5000
12. DISTRIBUTION / AVAILABILITY STATEMENT UNCLASSIFIED: Dist A
Approved for public release; distribution unlimited 13. SUPPLEMENTARY NOTES
14. ABSTRACT
A series of fuels were tested on a bench stand designed and constructed for the Cummins XPI High Pressure Common Rail Fuel System. Included were
ULSD, JP-8, an FT SPK, and Jet-A. Testing occurred at 60 and 93.3°C over a 400-hour NATO cycle. Fuel viscosity ranged from 1.90 to 0.65 cSt while lubricity
wear-scar diameters were from 0.54 to 1.01mm (ASTM D5001) and 0.382 to 0.75mm (ASTM D6079). At the conclusion of each 400-hour test, components
were evaluated for wear and overall system performance with the ULSD test acting as a baseline for comparison. Results showed the XPI system to be robust
with regards to fuel lubricity and viscosity. Even under the harshest fuels, only small areas of concern were noted in the injectors. From these results, it is
expected that a synthetic fuel such as that used could be successfully used, with proper lubricity additives, in military ground vehicle fuel blends.
15. SUBJECT TERMS Fuel Lubricity, Viscosity, HPCR, Synthetic Jet Fuel, Cummins XPI
16. SECURITY CLASSIFICATION OF: 17. LIMITATION OF ABSTRACT
18. NUMBER OF PAGES
19a. NAME OF RESPONSIBLE PERSON
a. REPORT
Unclassified
b. ABSTRACT
Unclassified
c. THIS PAGE
Unclassified
Unclassified
209
19b. TELEPHONE NUMBER (include area code)
Standard Form 298 (Rev. 8-98) Prescribed by ANSI Std. Z39.18
Unclassified
v
EXECUTIVE SUMMARY
A series of fuels were tested on a bench stand designed and constructed for the Cummins XPI
High Pressure Common Rail Fuel System. Included were ULSD, JP-8, an FT SPK, and Jet-A.
Testing occurred at 60 and 93.3°C over a 400-hour NATO cycle. Fuel viscosity ranged from
0.650 to 1.90 cSt while lubricity wear-scar diameters were from 0.54 to 1.01mm (ASTM D5001)
and 0.382 to 0.75mm (ASTM D6079). At the conclusion of each 400-hour test, components were
evaluated for wear and overall system performance with the ULSD test as a baseline for
comparison. Results showed that the XPI system to be robust with regards to fuel lubricity and
viscosity. Even with the harshest fuels, only small areas of concern were noted in the injectors.
From these results, it is expected that a synthetic fuel such as that used could be successfully
utilized, with proper lubricity additives, in military ground vehicles with this fuel system.

Unclassified
vi
FOREWORD/ACKNOWLEDGMENTS
The U.S. Army TARDEC Fuel and Lubricants Research Facility (TFLRF) located at Southwest
Research Institute (SwRI), San Antonio, Texas, performed this work during the period of
April 2009 through October 2012 under Contract No. W56HZV-09-C-0100. The U.S. Army
Tank-Automotive RD&E Center, Force Projection Technologies, Warren, Michigan
administered the project. Mr. Eric Sattler (RDTA-DP/MS110) served as the TARDEC
contracting officer’s technical representative. Ms. Patsy Muzzell of TARDEC served as the
project technical monitor.
The authors would like to acknowledge the contribution of the TFLRF technical support staff
along with the administrative and report-processing support provided by Dianna Barrera.

Unclassified
vii
TABLE OF CONTENTS
Section Page
EXECUTIVE SUMMARY .......................................................................................................................... v FOREWORD/ACKNOWLEDGMENTS .................................................................................................... vi TABLE OF CONTENTS ............................................................................................................................ vii LIST OF TABLES ..................................................................................................................................... viii LIST OF FIGURES ................................................................................................................................... viii ACRONYMS AND ABBREVIATIONS .................................................................................................... ix 1.0 BACKGROUND AND OBJECTIVE ................................................................................................. 1 2.0 APPROACH ....................................................................................................................................... 1
2.1 Test Fuels and Temperatures ..................................................................................................... 1 2.2 Test Cycle .................................................................................................................................. 2 2.3 Test Stand and Fuel System ...................................................................................................... 3
2.3.1 Fuel Pump .................................................................................................................... 3 2.3.2 Fuel Injectors .............................................................................................................. 13 2.3.3 Stand Configuration ................................................................................................... 16 2.3.4 Test Components ........................................................................................................ 18
3.0 EVALUATION RESULTS .............................................................................................................. 19 3.1 System Performance and Operation ........................................................................................ 19
3.1.1 Rail Pressure ............................................................................................................... 19 3.1.2 Gear Pump Outlet Pressure ........................................................................................ 20 3.1.3 Injected Fuel Flow Rate ............................................................................................. 21 3.1.4 Bypass and Return Fuel Flow Rate ............................................................................ 23 3.1.5 Drive Motor Power Output ......................................................................................... 24
3.2 Low Pressure Gear Pump Housing.......................................................................................... 25 3.3 Gear Teeth ............................................................................................................................... 30 3.4 Low Pressure Relief Valve ...................................................................................................... 30 3.5 Injector Needle Tip .................................................................................................................. 32 3.6 Injector Needle Mid-Section ................................................................................................... 32 3.7 JP-8 Test Injector Failure ........................................................................................................ 34
4.0 SUMMARY, CONCLUSIONS, AND RECOMMENDATIONS .................................................... 37 5.0 REFERENCES .................................................................................................................................. 38 APPENDIX-A Test Stand Development
APPENDIX-B Evaluation of HPCR Fuel System–Ultra Low Sulfur Diesel
APPENDIX-C Evaluation of HPCR Fuel System–JP-8 (60°C)
APPENDIX-D Evaluation of HPCR Fuel System–JP-8 (93°C)
APPENDIX-E Evaluation of HPCR Fuel System–SPK with 22.5 ppm DCI-4A
APPENDIX-F Evaluation of HPCR Fuel System–SPK/JP-8 Blend (60°C)
APPENDIX-G Evaluation of HPCR Fuel System–SPK/JP-8 Blend (93°C)
APPENDIX-H Evaluation of HPCR Fuel System–Jet-A
APPENDIX-I Evaluation of HPCR Fuel System–SPK (No Additive)
Unclassified
viii
LIST OF TABLES
Table Page
Table 1. Project Test Fuels ............................................................................................................. 2 Table 2. NATO Cycle for XPI Pump Stand .................................................................................. 2
LIST OF FIGURES
Figure Page
Figure 1. XPI Pump – Drive Input ................................................................................................. 3 Figure 2. XPI Pump – Gear Pump Side ......................................................................................... 4 Figure 3. Main Pump Body ............................................................................................................ 5 Figure 4. Roller-Followers ............................................................................................................. 6 Figure 5. High Pressure Pump Head .............................................................................................. 7 Figure 6. High Pressure Fuel Flow Path ........................................................................................ 8 Figure 7. Inlet Check Valves ......................................................................................................... 9 Figure 8. Control Manifold Portion of Pump ............................................................................... 10 Figure 9. Flow Control Gasket..................................................................................................... 10 Figure 10. Low Pressure Gear Pump ........................................................................................... 11 Figure 11. Gear Pump Pressure Relief Valve .............................................................................. 12 Figure 12. XPI Fuel Injector ........................................................................................................ 13 Figure 13. Lower Injector Disassembled ..................................................................................... 14 Figure 14. Injector Needle ........................................................................................................... 14 Figure 15. Control Ball ................................................................................................................ 15 Figure 16. Control Ball Size Comparison .................................................................................... 15 Figure 17. XPI Test Stand Layout ............................................................................................... 17 Figure 18. Completed Test Stand................................................................................................. 18 Figure 19. Fuel Rail Pressure ....................................................................................................... 20 Figure 20. Outlet Pressure of Gear Pump .................................................................................... 21 Figure 21. Injected Fuel Flow Rates ............................................................................................ 22 Figure 22. Bypass and Return Flow ............................................................................................. 23 Figure 23. Drive Motor Power Output ......................................................................................... 24 Figure 24. Low Pressure Pump Housing Wall ............................................................................. 25 Figure 25. Housing Wall – ULSD and Jet-A ............................................................................... 26 Figure 26. Housing Wall – SPK .................................................................................................. 27 Figure 27. Housing Wall - Temperature Comparison ................................................................. 28 Figure 28. Low Pressure Gear Pump Bottom .............................................................................. 29 Figure 29. Gear Teeth Wear ......................................................................................................... 30 Figure 30. Pressure Relief Valve Side A ..................................................................................... 31 Figure 31. Pressure Relief Valve Side B ..................................................................................... 31 Figure 32. Injector Needle Tip ..................................................................................................... 32 Figure 33. Injector Needle – Mid-Section ................................................................................... 33 Figure 34. Solenoid Plunger Removed with Debris .................................................................... 34 Figure 35. Control Ball Seat ........................................................................................................ 35 Figure 36. Solenoid Comparison – Suspected Failed (Left) and Typical (Right) ....................... 36

Unclassified
ix
ACRONYMS AND ABBREVIATIONS
% Percent ASTM American Society for Testing and Materials ˚C Degrees Centigrade CI/LI Corrosion Inhibitor/Lubricity Improver cSt CentiStoke ECM Electronic Control Module ˚F Degrees Fahrenheit FT Fischer-Tropsch HDO Heavy Duty Oil HPCR High Pressure Common Rail mm Millimeter NATO North Atlantic Treaty Organization OEM Original Equipment Manufacturer psi Pounds per square inch RPM Revolutions per minute SAE Society of Automotive Engineers SPK Synthetic-Paraffinic Kerosene SwRI Southwest Research Institute TARDEC Tank Automotive Research, Development and Engineering Center ULSD Ultra Low Sulfur Diesel WSD Wear Scar Diameter

Unclassified
1
1.0 BACKGROUND AND OBJECTIVE
As industries begin to incorporate renewable and synthetic fuel sources into global supply, it is in
the interest of the U.S. Army to ensure satisfactory ground vehicle operation both now and in the
future. With new aviation fuel properties differing from those of their petroleum-based
counterparts, evaluations are required to validate performance in reciprocating engine fuel
injection systems. As environmental regulations drive commercial Original Equipment
Manufacturers (OEM) to reach lower emission levels, the high pressure common rail (HPCR)
injection system has become broadly utilized. These systems can operate at pressure up to
30,000 psi to produce multiple highly atomized injection events per cycle. It is critical for the
U.S. Army to determine the effect of various future fuels on these systems which are intended for
operation on ultra low sulfur diesel. While many older vehicles in the military fleet do not utilize
HPCR, it is likely that future commercial engines adapted for military use will.
2.0 APPROACH
2.1 TEST FUELS AND TEMPERATURES
The initial test plan included four fuels operated at two temperatures each. These fuels were to be
Ultra Low Sulfur Diesel (ULSD), JP-8, a Fischer-Tropsch (FT) process Synthetic Paraffinic
Kerosene (SPK) with a maximum treat rate of corrosion inhibitor/lubricity improver (CI/LI) of
22.5 ppm, and a 50% blend of the JP-8 and SPK test fuels. The temperatures evaluated were
60°C and 93.3°C at the inlet to fuel system components, giving an indication as to possible
performance at elevated ambient conditions and high load. As testing progressed, results
indicated that the system was less sensitive to low viscosity, low lubricity fuels than originally
thought. Due to this, changes to the test plan were made to replace the high temperature ULSD
and SPK tests from the original matrix with 60°C evaluations of Jet-A and SPK test fuels
without lubricity improver. A summary of the fuels is shown in Table 1.

Unclassified
2
Table 1. Project Test Fuels
Fuel Test Temp.
(°C) Viscosity @ Temp. (cSt)
Lubricity (Fresh), WSD (mm) ASTM D5001 ASTM D6079
Ultra Low Sulfur Diesel
60 1.90 0.54 0.382
JP-8 60 0.89 0.67 0.647 JP-8 93.3 0.65 0.67 0.647
SPK (with CI/LI) 60 0.99 0.59 0.681 50% JP-8, 50%
SPK (with CI/LI) 60 0.94 0.67 0.670
50% JP-8, 50% SPK (with CI/LI)
93.3 0.67 0.67 0.670
Jet-A 60 0.81 0.81 0.750 SPK (Neat) 60 0.95 1.01 0.663
2.2 TEST CYCLE
The NATO Standard Engine Laboratory Test AEP-5, Edition 3 is a 400-hour test consisting of
repeated 10-hour cycles. Each cycle has 10 operating modes which speed and load are controlled
to. Since there is no torque feedback available when using the fuel system alone, “load” was
determined based upon the accelerator pedal percentage input supplied to the ECM. This value
was read over the J1939 communications protocol. The pump was driven at the speed which it
would turn if run on an engine, half that of the crankshaft. The operating modes for the cycle are
shown in Table 2.
Table 2. NATO Cycle for XPI Pump Stand
Step Pump Speed, RPM Throttle, % Duration, hrs
1 400 0 0.5
2 1050 100 2
3 1155 0 0.5
4 788 100 1
*5 400 to 1050 0 to 100 2
6 630 100 0.5
7 400 0 0.5
8 1081 70 0.5
9 650 100 2
10 650 50 0.5
*Step 5 cycles between idle and rated conditions

Unclassified
3
2.3 TEST STAND AND FUEL SYSTEM
2.3.1 Fuel Pump
The XPI system was developed jointly between Cummins, Inc. and Scania. Primarily targeted for
Cummins midrange and Scania heavy duty applications, an oil-lubricated fuel pump allows the
system to reach rail and injection pressures of up to 30,000 psi. It is operated at half engine speed
to reach a rated condition of 1050 rpm (based upon the engine calibration used for testing). The
XPI high pressure pump features a combination of low pressure gear pump and high pressure
piston pump driven by a common shaft. The full pump is shown in Figure 1 and Figure 2. It
should be noted that the pump shown was in a state of partial disassembly for information
purposes and that photographs are of the pump used in low temperature ULSD testing.
Figure 1. XPI Pump – Drive Input

Unclassified
4
Figure 2. XPI Pump – Gear Pump Side

Unclassified
5
Power is provided to the pump via the tapered shaft located at the front. The shaft gear, not
shown, meshes with the cam gear on the engine to provide speed and timing. Lubricating oil is
provided through an orifice on the front of the pump from the engine oil galley and is allowed to
drain out through the front bearing. The two cams on the shaft each feature three lobes which
drive the high pressure pistons. The combination of two cams with three lobes each allows the
pump to impart new fuel into the high pressure rail as each injector fires. Figure 3 shows the
oil-lubricated portion of the pump with other components removed.
Figure 3. Main Pump Body

Unclassified
6
Each spring sits in a roller-follower tappet as shown in Figure 4. Oil flowing from the inlet
orifice on the front of the pump passes through the roller on the bottom of the tappets to maintain
lubrication throughout the pump housing.
Figure 4. Roller-Followers

Unclassified
7
These springs are compressed against the underside of the pump head to maintain contact with
the pump camshaft. The underside of the pump head is shown in Figure 5.
Figure 5. High Pressure Pump Head

Unclassified
8
The two barrel retainers located on the underside of the pump head hold the ceramic plungers
which develop the high pressures within the pump. The plungers are driven into the barrels by
the tappets as the shaft turns. They are forced back out by fuel from the low pressure gear pump
using a system of check valves located in the pump head. This is illustrated in Figure 6.
Figure 6. High Pressure Fuel Flow Path

Unclassified
9
Figure 7 shows the lower pressure, inlet check valves within the pump head.
Figure 7. Inlet Check Valves

Unclassified
10
Fuel enters this portion of the head through a volume control manifold located to the rear of the
pump head. This can be seen in Figure 8. Figure 9 shows the gasket with fuel passage between
the two sections of the pump.
Figure 8. Control Manifold Portion of Pump
Figure 9. Flow Control Gasket

Unclassified
11
The XPI system uses the electrically actuated control valve to direct fuel supplied by the low
pressure side into the inlet of the pump head or to the bypass and return line. The low pressure
gear pump, located on the rear of the pump body, draws fuel from the tank and pushes it through
the final filter before entering the volume control area. Figure 10 shows the pump with the rear
cover removed. While the low pressure pump is driven off of the main, oil lubricated shaft, the
gears themselves are fuel-wetted surfaces.
Figure 10. Low Pressure Gear Pump

Unclassified
12
A pressure relief valve is located under the bolt on the top of the pump which prevents excessive
downstream pressure from building at the filter. This valve is shown removed in Figure 11.
Figure 11. Gear Pump Pressure Relief Valve

Unclassified
13
2.3.2 Fuel Injectors The XPI system injectors are solenoid controlled and able to provide multiple injection events
per cycle. Figure 12 shows an injector with the hold-down clamp removed.
Figure 12. XPI Fuel Injector

Unclassified
14
High pressure fuel from the rail enters the injector via a quill tube through the cylinder head. The
tube is held in place against a tapered hole in the side of the injector to form a high-pressure seal.
Fuel enters the injector and fills internal passageways to act as a hydraulic fluid. From there, it is
either directed through the injector tip into the cylinder, or allowed to flow out of the injector and
back through the cylinder head as bypass fuel.
The injector body is made primarily of three sections. The lowest section holds injector tip and
part of the needle. The upper half of the needle resides in the middle section of the injector body
as can be seen in Figure 13. The needle, removed, can be seen in Figure 14.
Figure 13. Lower Injector Disassembled
Figure 14. Injector Needle

Unclassified
15
The middle section of the injector body also contains hydraulic components which allow the
needle to lift. One of particular interest is a small ball which, when seated, prevents the flow of
fuel and closes the injector. This part, in place, can be seen in Figure 15. Figure 16 shows the
ball next to a common penny for size comparison.
Figure 15. Control Ball
Figure 16. Control Ball Size Comparison

Unclassified
16
When the control element is energized, the ball is allowed to lift off the lower seat and fuel flows
past it from the lower section of the injector. This reduces the fuel pressure on the upper side of
the needle and allows lift, letting fuel flow through the tip. When current is removed, the ball is
moved back into place by a combination of spring force and fuel pressure in the upper section of
the injector.
Fuel not injected into the cylinder passes through small orifices in the lower and middle body
pieces as return fuel. Surrounding each injector in the cylinder head is an area, sealed by the
injector at the bottom and an O-ring at the top, which fills with fuel. A passage through the
cylinder head connects the six areas to a return line on the end of the head.
2.3.3 Stand Configuration The pump and hardware was mounted on a test stand specifically configured for the XPI system.
All temperature monitoring, control, and data acquisition was conducted by Southwest Research
Institute (SwRI) developed PRISM software. Fuel injection and rail pressure were controlled by
a Cummins CM2150 engine control module (ECM) modified for use with a bench system. Fluid
temperatures were maintained with the use of liquid-to-liquid heat exchangers and heaters. The
evaluation was conducted using a 55-gallon drum as remote fuel source for the stand. A
diaphragm air pump supplied the fuel to a smaller day tank located on the stand. Fuel was drawn
by an electric lift pump from the day tank to fill heating equipment and prime the main fuel
pump. A MIL-PRF-2104G 15W-40 was used in the oil-lubricated portion of the system. Once
primed, the gear pump supplies fuel through a high efficiency filter and on to the high-pressure
cam driven pump. Fuel then flows to the rail before passing through the injectors. Bypass fuel
collected from the high-pressure pump, rail relief valve, and injector returns was combined and
returned to the day tank located on the test stand. Injected fuel was collected in a common
manifold, cooled, and returned to the remote drum. A schematic of the stand layout is shown in
Figure 17.

Unclassified
17
Figure 17. XPI Test Stand Layout
The stand was designed and constructed as part of the project with the goal of flexibility in
testing. Two shelves provide almost 48 sq. ft. of surface for component mounting. Each shelf has
a 1” lip and multiple drain ports to provide containment in the event of spills or leaks. To
improve adaptability of the stand for future fuel systems, the drive motor was located on the
lower shelf and transferred power to the upper table via a synchronous belt. This allowed the
upper table drive components to fit into a smaller footprint, leaving more space for test
components. The majority of cooling and heating equipment was located on the lower shelf of
the table along with fuel and oil reservoirs. High pressure test components were located on the
upper table and surrounded by a ½” Lexan shield for safety purposes. The electronic control
devices were mounted on the opposite end of the stand from the drive hardware on elevated
isolation mounts. This prevented harm from vibration during testing or liquid accumulation in
the containment area. Additional discussion on the creation and layout of the test stand is
provided in Appendix A. Figure 18 shows the completed test stand.
Fuel Supply – 55 Gallon
Drum
ADay T ki
Lift Pump Heater
High Pressure
Pump
Gear Pump
Filter
Return Fuel HX
Injected Fuel HX
High Pressure Common Rail
Injectors

Unclassified
18
Figure 18. Completed Test Stand
2.3.4 Test Components For each test, the fuel pump, injectors, quill tubes, and fuel filter were replaced with new parts.
Other lines on the system were drained of fuel and rinsed with iso-octane. The larger components
on the stand, such as heaters and heat exchangers, were drained and flushed with new test fuel.
Typical flush volumes were 20 gallons to ensure the previous fuel was thoroughly rinsed through
the system. During testing, a 55-gallon drum was used as the stand fuel source. Every 100-hours
of test time, or 10 cycles, the drum was replaced with fresh fuel. For the high temperature tests,
the lubricating oil, MIL-PRF-2104H SAE 15W-40, was also changed at this point in response to
a decreased viscosity due to fuel dilution.

Unclassified
19
3.0 EVALUATION RESULTS
This section contains a comparison of performance from all completed testing. Individual test
reports are attached as Appendix A through Appendix I.
3.1 SYSTEM PERFORMANCE AND OPERATION
Data from the two-hour “peak power” step, Mode 2, was evaluated as an indicator of overall
system health and performance. The figures that follow show various measured parameters over
the 40 cycles of each test in comparison. Data logging was at a rate of every 60 seconds and the
first two data points from each cycle were eliminated to allow for stabilization before taking the
mean value for the remaining 118 minutes. Tests conducted at 93.3°C are listed as “HT” for
high-temperature.
3.1.1 Rail Pressure
The fuel rail pressure, Figure 19, was controlled by the ECM based upon the system speed and
throttle input. A high pressure transducer provided a voltage signal to both the ECM and the data
acquisition software. Rail pressure remained steady throughout all but the Jet-A test. This
evaluation showed an increase of roughly 450 psi, about 1.5%, over the previous evaluations for
the first twenty six cycles. This change was likely due to the replacement of the high pressure rail
and supply line. It was found that a small blockage was located in the high pressure supply line
where it fed into the rail. After the 26th cycle, the pressure returns to the same value as was seen
prior to, and following the Jet-A test. No fuel based performance issues can be derived from the
system rail pressure for any of the eight evaluations.

Unclassified
20
Figure 19. Fuel Rail Pressure
3.1.2 Gear Pump Outlet Pressure
The gear pump outlet pressure, Figure 20, was measured prior to the final filter element. A
severe decrease in outlet pressure could be an indication of wear on the fuel-wetted gear teeth in
the pump causing leakage. Over the course of the project, there was a tendency for a decline in
pressure early in the test followed by primarily steady operation. This would indicate that the
pumps were undergoing a break-in period after which they stabilized. Other factors which may
influence the pressure at this point of the system include a relief valve on the downstream side of
the pump, the filter condition, and injected and return fuel flow rates. The relief valve likely has
the largest impact on this pressure out of these factors.
29000
29100
29200
29300
29400
29500
29600
29700
29800
29900
30000
0 5 10 15 20 25 30 35 40
Rail Pressure, p
si
Cycle
Fuel Rail Pressure
ULSD
JP8
SPK (CI/LI)
Blend
HT Blend
HT JP8
Jet‐A
SPK (Neat)

Unclassified
21
Figure 20. Outlet Pressure of Gear Pump
3.1.3 Injected Fuel Flow Rate Injected fuel was collected for all six of the injectors in a common manifold before being
returned to the remote fuel source. Data is not available for the first 10 cycles of the ULSD test.
During this time, an oval gear flow meter was being used which was later determined to be
incompatible with the temperatures experienced during the test. Since the temperature of the fuel
impacts the volumetric flow, a coriolis meter was installed to measure mass flow and density.
This allowed the fuel to be cooled without impacting the flow measurement. Once the new style
flow meter and proper cooling equipment were installed, no meaningful changes in flow rate
were seen for the ULSD evaluation. The lower temperature JP-8 evaluation was the only test to
show a substantial change in injected flow rate. Early in the test, a decrease in flow was seen
followed by a sharp drop off. Following this reduction, the flow rate remained stable for the
remaining 28 cycles. Post test inspection of the injectors indicated that there may have been a
failure in the solenoid of the #4 injector. A plunger appeared seized in a way that prevented the
needle from lifting. Based upon the assumption that five out of six injectors were functioning, a
“projected” flow rate was added to the figure which falls closely in line with the other fuels
tested. The lack of wear or debris in the other five injectors, or high temperature evaluation of
100
102
104
106
108
110
112
114
116
0 5 10 15 20 25 30 35 40
Pressure, psi
Cycle
Outlet Pressure of Gear Pump
ULSD
JP8
SPK (CI/LI)
Blend
HT Blend
HT JP8
Jet‐A
SPK (Neat)

Unclassified
22
the JP-8 fuel, along with how early in the test the failure occurred indicate that the issue was
likely an isolated component failure rather than a fuel influenced one. The failure is discussed
further in the “Injectors” section of the report. All other fuels and temperatures evaluated for this
project produced results with very little change over the course of the 400-hour test. It was noted
that the ULSD, with a test viscosity of 1.9 cSt, had a lower flow rate than any other fuel. This
type of change in flow rate has been seen in other HPCR applications and was somewhat
expected. When the same fuel was tested at two temperatures, the JP-8 and Blended fuels, the
higher temperature and lower viscosity fuel produced an increased flow rate compared to the
lower temperature test.
Figure 21. Injected Fuel Flow Rates
800
900
1000
1100
1200
1300
1400
1500
1600
0 10 20 30 40
Injected Flow, m
L/min
Cycle
Injected Fuel Flow Rates
ULSD
JP8 (Actual)
JP (Projected)
SPK(CI/LI)
Blend
HT Blend
HT JP8
Jet‐A
SPK (Neat)

Unclassified
23
3.1.4 Bypass and Return Fuel Flow Rate The bypass and return fuel flow is a combination of high pressure fuel that is not used by the
injectors, what is diverted by the pump before being pressurized, and what, if any, comes
through the high pressure relief valve on the fuel rail. The combined return flow rate for each test
is shown in Figure 22. The step change in return flow for the Jet-A evaluation can be traced back
to the same high pressure supply line issue that impacted the rail pressure. Again, this does not
seem to have had an impact on system performance related to component wear or fuel
compatibility.
Figure 22. Bypass and Return Flow
Since there are multiple sources for this fuel to come from, the number of components which
may impact the flow rate are high. Wear in the low pressure gear pump may lead to additional
leakage, less total flow, and therefore less fuel diverted around the high pressure system and into
the return lines. Combined with the data from the outlet of the gear pump, the reduction in return
flow over the course of testing is likely tied to this. Increased wear in the injectors could allow
0
200
400
600
800
1000
1200
1400
0 5 10 15 20 25 30 35 40
Fuel Flow, m
L/min
Cycle
Total Bypass and Return Fuel Flow
ULSD
JP8
SPK (CI/LI)
Blend
HT Blend
HT JP8
Jet‐A
SPK (Neat)

Unclassified
24
additional fuel to pass through tight clearances and increase the total volume returned.
Component inspection gave no indication to believe this was the occurring. Since the rail
pressure throughout all tests was controlled successfully, it can be assumed that the relief valve
was not unexpectedly opening and increasing the return flow. The relatively high viscosity of the
ULSD fuel is likely the reason for the distinctly lower return flow rate. Since the clearances in
the injectors which return fuel passes through are typically very tight, a lower flow rate would be
expected to come out of the injector returns.
3.1.5 Drive Motor Power Output The combination high pressure and gear pump was driven by an electric motor through a
variable frequency drive. This drive offered the ability to monitor power output to the motor.
While this does not take into account drive system losses, such as bearing friction or coupling
inefficiencies, these losses can be expected to be relatively small and to remain consistent
between tests. The measured power output to the motor is shown in Figure 23.
Figure 23. Drive Motor Power Output
0
2
4
6
8
10
12
0 5 10 15 20 25 30 35 40
Power, kW
Cycle
Drive Motor Power Output
ULSD
JP8
SPK (CI/LI)
Blend
HT Blend
HT JP8
Jet‐A
SPK (Neat)
Unclassified
25
Once again, the impact of the blockage can be seen for the Jet-A evaluation. Since the pump
being controlled by the ECM developed a slightly higher pressure, the power output of the motor
to maintain the desired speed was also higher. As the pressure, and total return flow, of the test
decreased after the 26th cycle, the motor’s power draw returned to typical levels. The assumed
failure of the injector during the low temperature JP-8 evaluation can also been seen in the motor
power. As the injector begins to seize and fuel flow dropped, the pump was able to produce the
required pressure with less power input. For the ULSD test, the low flow rate compared to other
tests is consistent with the reduced amount of high pressure fuel for injection supplied by the
pump.
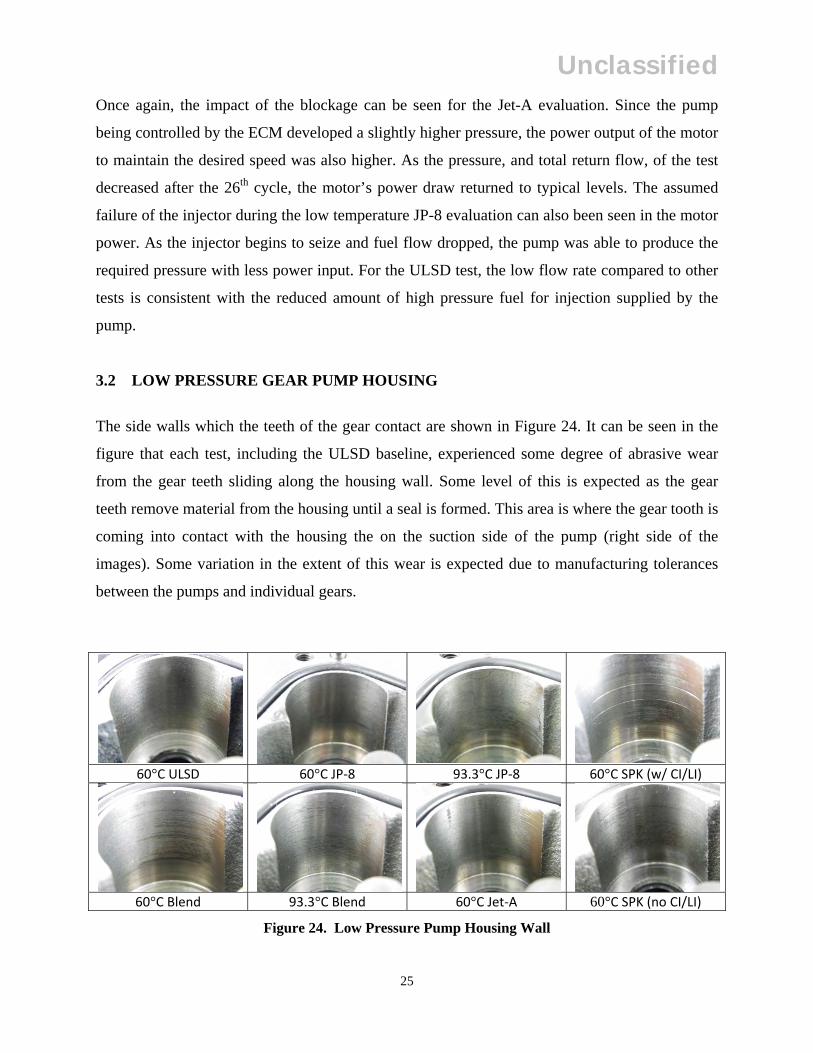
3.2 LOW PRESSURE GEAR PUMP HOUSING
The side walls which the teeth of the gear contact are shown in Figure 24. It can be seen in the
figure that each test, including the ULSD baseline, experienced some degree of abrasive wear
from the gear teeth sliding along the housing wall. Some level of this is expected as the gear
teeth remove material from the housing until a seal is formed. This area is where the gear tooth is
coming into contact with the housing the on the suction side of the pump (right side of the
images). Some variation in the extent of this wear is expected due to manufacturing tolerances
between the pumps and individual gears.
60°C ULSD 60°C JP‐8 93.3°C JP‐8 60°C SPK (w/ CI/LI)
60°C Blend 93.3°C Blend 60°C Jet‐A 60°C SPK (no CI/LI)
Figure 24. Low Pressure Pump Housing Wall

Unclassified
26
While the majority of the tests produced results similar to the baseline, there were a few
instances which require further examination. These are shown in Figure 25, an enlarged view
from four of the above tests. The Jet-A evaluation, viscosity of 0.81 cSt at 60°C and ASTM
D5001 WSD of 0.81mm, produced marks not observed in other tests. These are a group of
markings perpendicular to the direction of travel between the two surfaces. The appearance of
these in distinct locations around the housing wall may indicate formation at either a shut down
or start up event rather than while the pump was rotating. As a 400-hour test, run 100-hours each
week, the marks may have been the result of the stand sitting idle for two days at a time before
restarting. While this cannot be verified, the width of the mark is similar in width to the gear
tooth, making it a possible explanation.
60°C ULSD 60°C Jet‐A
Figure 25. Housing Wall – ULSD and Jet-A
Unclassified
27
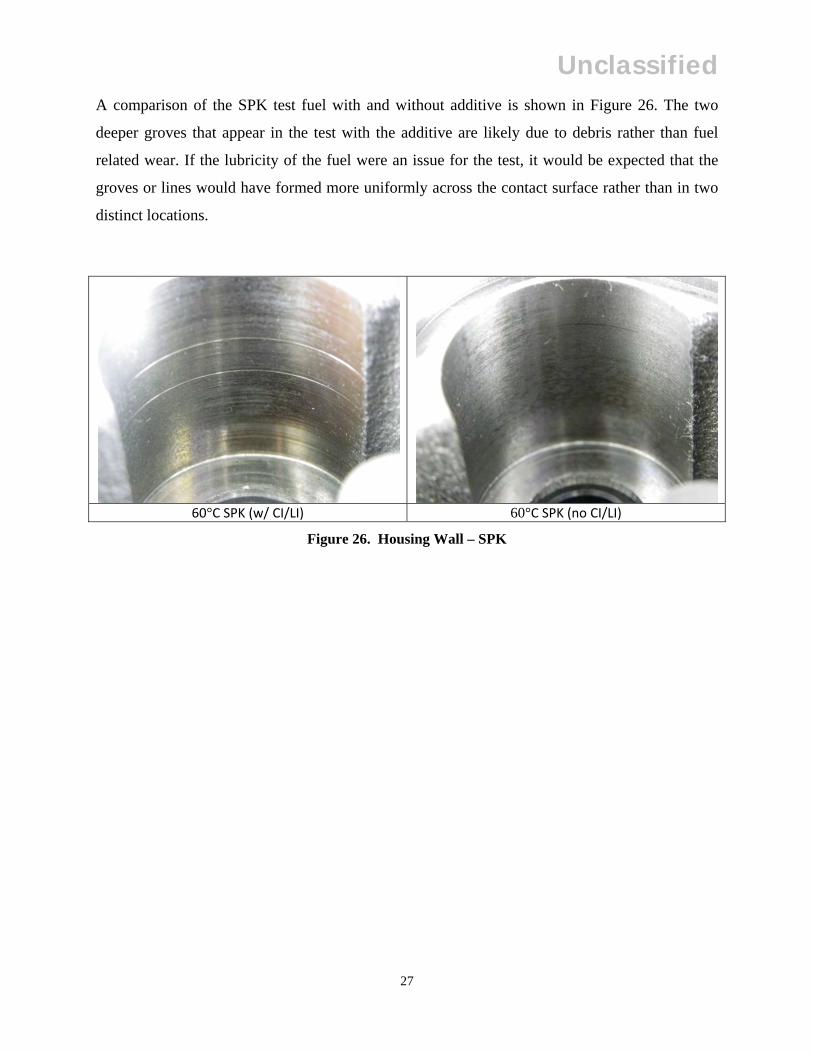
A comparison of the SPK test fuel with and without additive is shown in Figure 26. The two
deeper groves that appear in the test with the additive are likely due to debris rather than fuel
related wear. If the lubricity of the fuel were an issue for the test, it would be expected that the
groves or lines would have formed more uniformly across the contact surface rather than in two
distinct locations.
60°C SPK (w/ CI/LI) 60°C SPK (no CI/LI)
Figure 26. Housing Wall – SPK

Unclassified
28
The influence of temperature of the pump wear characteristics is seen in Figure 27. For the JP-8
tests an increased level of polishing along with limited scoring is seen in the high temperature
test. In the blended fuel the increased level of scoring is seen in some spots, however the lower
temperature test shows a larger area of polished material. It should be noted that while the
scoring marks found in each of the higher temperature evaluations are spread uniformly, they do
not have the depth observed in the 60°C SPK (w/ CI/LI) pump.
60°C JP‐8 93.3°C JP‐8
60°C Blend 93.3°C Blend
Figure 27. Housing Wall - Temperature Comparison

Unclassified
29
The bottom of the pump housing, the surface which the gear ends rotate on, is shown in
Figure 28. The edges of the gear teeth, in most cases, cut noticeable grooves into the metal of the
housing. These grooves have a noticeable depth to them, rather than just a visible appearance. It
should be noted that while these grooves exist, there does not seem to be a strong connection
between fuel selection and wear development in this location. The best lubricity fuel, ULSD at
60°C, produced a groove very similar to Jet-A, one of the worst lubricity fuels. While there is a
large contrast between the JP-8 fuel low and high temperature tests, the same cannot be said for
the blended fuel. A large influencer of the depth of groove is likely the shaft, visible in the
photos, which the second of the gears rotates on. If the shaft is not completely perpendicular to
the face the grooves appear on, the gear teeth would have increased pressure applied at the ends
of the teeth rather than evenly across the end of the gear.
60°C ULSD 60°C JP‐8 93.3°C JP‐8 60°C SPK (w/ CI/LI)
60°C Blend 93.3°C Blend 60°C Jet‐A 60°C SPK (no CI/LI)
Figure 28. Low Pressure Gear Pump Bottom

Unclassified
30
3.3 GEAR TEETH
The seal between the top land of the gear teeth and the pump housing wall is an important one in
developing the supply pressure to the high pressure system. Leakage past this interface would
result in lower supply pressure and reduced fuel flow. A comparison between the gears removed
from each of the tests show very similar and uniform finish and wear patterns. The gears are
likely harder than the cast pump housing, and therefore show less wear due to the surface
contact. The gears themselves do not appear to be heavily impacted by fuel viscosity or lubricity,
as shown in Figure 29.
60°C ULSD 60°C JP‐8 93.3°C JP‐8 60°C SPK (w/ CI/LI)
60°C Blend 93.3°C Blend 60°C Jet‐A 60°C SPK (no CI/LI)
Figure 29. Gear Teeth Wear
3.4 LOW PRESSURE RELIEF VALVE
A relief valve in the gear pump prevented excess downstream pressure from building at the filter
element. The two locations which showed polish and wear are displayed in Figures 30 and 31. A
spring, held in place by the plug on top of the pump, keeps the valve seated until there is
sufficient downstream pressure to overcome the spring force. When operating, the valve likely
spends a substantial amount of time fully or partially open, vibrating in place as the spring and
pressure forces balance each other. While this is occurring, two spots on the cylinder developed
substantial polishing in most cases. The locations were on opposite sides of the piece for each
test, indicating that the component moved through its bore at a slight angle. For the two tests

Unclassified
31
conducted at elevated temperatures, a lesser degree of wear was noted on this component. One
possible explanation for this is that the lower viscosity fluids relieved more pressure through
leakage which then resulted in a reduced actuation of the relief valve. The two tests using the
SPK test fuel, additized and neat, produced very similar polish patterns despite the difference in
lubricity.
60°C ULSD 60°C JP‐8 93.3°C ‐8 60°C SPK (w/ CI/LI)
60°C Blend 93.3°C Blend 60°C Jet‐A 60°C SPK (no CI/LI)
Figure 30. Pressure Relief Valve Side A
60°C ULSD 60°C JP‐8 93.3°C JP‐8 60°C SPK (w/ CI/LI)
60°C Blend 93.3°C Blend 60°C Jet‐A 60°C SPK (no CI/LI)
Figure 31. Pressure Relief Valve Side B
Although each test uses six injectors, only one example is shown per evaluation. When
noticeable differences were seen between injectors in a test, the worst case example is presented.

Unclassified
32
3.5 INJECTOR NEEDLE TIP
The tip of the needle is an area of importance in the injector. If the tip is not seating and sealing
properly, the high pressure fuel will continuously flow into the cylinder. A comparison of the
injector tips from the eight evaluations is shown in Figure 32. No visual indications were seen on
the tips of the injector needles to indicate a fuel related issue or change.
60°C ULSD 60°C JP‐8 93.3°C JP‐8 60°C SPK (w/ CI/LI)
60°C Blend 93.3°C Blend 60°C Jet‐A 60°C SPK (no CI/LI)
Figure 32. Injector Needle Tip
3.6 INJECTOR NEEDLE MID-SECTION
The middle of the needle helps with alignment in the bore of the injector tip. It also acts as the
passageway for fuel to reach the injector tip. By passing fuel through the needle itself, the overall
injector diameter can be held smaller. All tests, including the ULSD baseline, showed some
degree of marking on the needle. For the ULSD, 60°C JP-8, and 60°C SPK (w/ CI/LI) tests these
markings appeared as radial rings along the sections in contact with the needle bore. This is
somewhat unexpected since they are perpendicular to the direction of motion for the needle when
the injector fires. It would appear that the needle was rotating in its bore in addition to the travel
required to open the fuel flow path. The two blended fuel tests and the 93.3°C JP-8 test show a
diagonal wear pattern indicating that the markings were formed during a combination of rotation
and linear movement. While there was some concern that the slanted marks were formed during
disassembly of the injector, the pitch is substantially different from that of the housing threads.

Unclassified
33
The final two tests, Jet-A and SPK (no CI/LI) showed a combination of radial and axial
markings. Additionally, dark spots of heavy wear were seen in both of these tests, something not
observed in any of the previous evaluations. Over time, wear in this location could potentially
cause an injector needle to seize when fired. If seized in a closed position, this would result in a
loss of power and vehicle performance, while seizing in an open position would result in
continuous fuel flow through the injector. It should be noted that for both the Jet-A and SPK
(no CI/LI) tests, the addition of even a small amount of lubricity improver appears to have
improved the fuel properties to levels acceptable for increased injector life. These test results are
shown in Figure 33.
60°C ULSD 60°C JP‐8 93.3°C JP‐8 60°C SPK (w/ CI/LI)
60°C Blend 93.3°C Blend 60°C Jet‐A 60°C SPK (no CI/LI)
Figure 33. Injector Needle – Mid-Section

Unclassified
34
3.7 JP-8 TEST INJECTOR FAILURE
During the first 100-hours of the 60°C JP-8 test, it was noted that the injected flow rate had an
unexpected decrease. While performing post-test component teardown, it was found that the
injector from cylinder #4 had a seized plunger in the solenoid. Upon removal, numerous metallic
shards were found within the bore. While wet with fuel, the material appeared to form spikes
from the component, follow the residual magnetic field lines. The component, at removal, is
shown in Figure 34.
Figure 34. Solenoid Plunger Removed with Debris
Unclassified
35
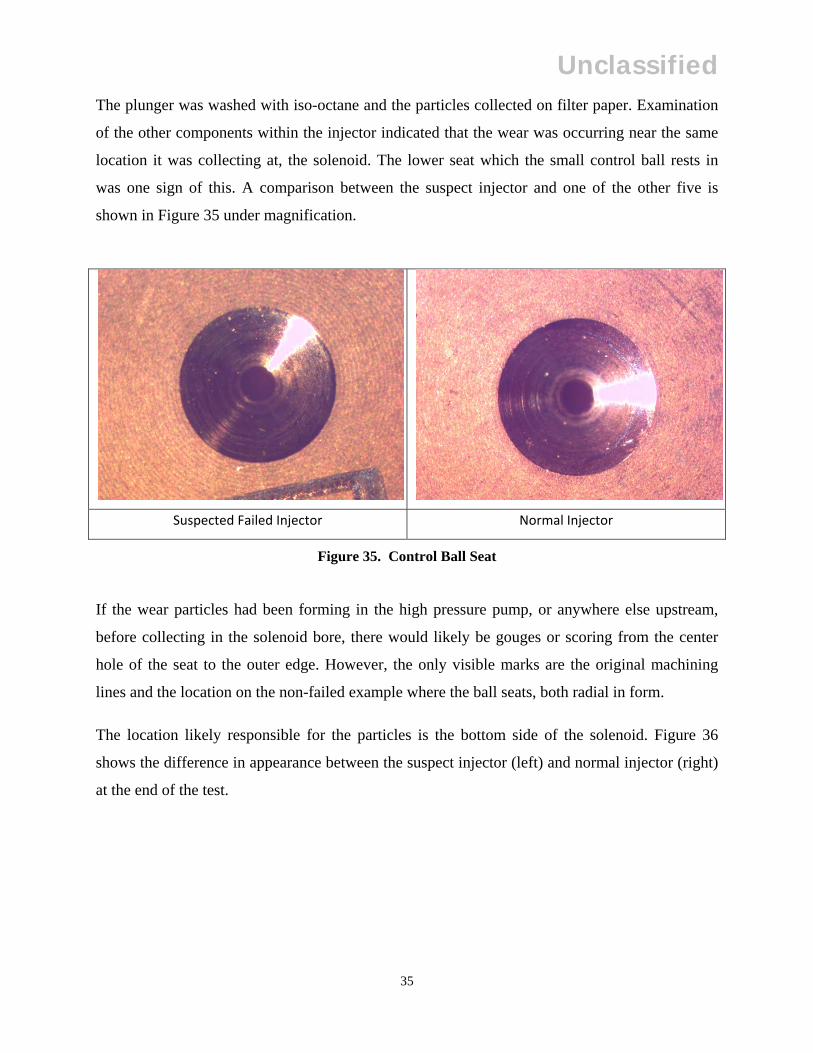
The plunger was washed with iso-octane and the particles collected on filter paper. Examination
of the other components within the injector indicated that the wear was occurring near the same
location it was collecting at, the solenoid. The lower seat which the small control ball rests in
was one sign of this. A comparison between the suspect injector and one of the other five is
shown in Figure 35 under magnification.
Suspected Failed Injector Normal Injector
Figure 35. Control Ball Seat
If the wear particles had been forming in the high pressure pump, or anywhere else upstream,
before collecting in the solenoid bore, there would likely be gouges or scoring from the center
hole of the seat to the outer edge. However, the only visible marks are the original machining
lines and the location on the non-failed example where the ball seats, both radial in form.
The location likely responsible for the particles is the bottom side of the solenoid. Figure 36
shows the difference in appearance between the suspect injector (left) and normal injector (right)
at the end of the test.

Unclassified
36
Figure 36. Solenoid Comparison – Suspected Failed (Left) and Typical (Right)
The metal immediately inside of the black insulating material is substantially rougher in texture
in the failed component. While this is a location that should not come into direct contact with the
component below it, matching wear marks indicate that some degree of contact did occur. Also,
the color of the particles collected from the plunger are consistent with the area in question. The
only way for this to have happened would be for the plunger within the solenoid to have been
forced further in than it normally travels, not an issue likely related to fuel viscosity or lubricity
effects. Additionally, the timing of the failure, early in the test, coupled with the lack of repeated
occurrence within the other injectors of this and other tests, lead to the conclusion that it was an
isolated incident related to the components themselves rather than the fuel used.
Unclassified
37
4.0 SUMMARY, CONCLUSIONS, AND RECOMMENDATIONS
Over the eight sets of components and six fuel types, only one injector failure was noted and that
was not related to the test fluid. Overall, the indications are that the XPI system is robust with
regards to fuel lubricity and viscosity even in relatively extreme combinations such as the
unadditized Jet-A and SPK test fuels. While little was seen based upon performance data for
flow rates, pressures, etc., it should be considered that an electronically controlled engine may be
making adjustments and compensations without operator awareness. Monitoring the motor
power being fed into the pump attempted to quantify this to some extent, however it would not
be able to capture things such as minor high-speed changes in the behavior of injector needle lift.
Visual indicators of wear were noted within the injectors on the final two tests. While these were
not severe enough to cause an issue over the 400-hour duration of the NATO cycle, if ran long
enough, it is unknown what may have occurred. If the XPI fuel system is proliferated through the
Tactical Wheel Vehicle Fleet through Cummins ISC, ISL, ISX and other engines, additional
testing should be conducted with military fuels. Evaluating system performance over the
expected economical useful life of a vehicle, 15-20 years, would prove the apparent ruggedness
of the system in a more appropriate time frame. For this, a three or four repetition NATO test
might be appropriate. Other limitations of bench testing include the actual engine power output
and deposit formation, although the increased volumetric flow rate may help to compensate for
any loss of power due to fuel type. While the fuel utilized for the project had challenging
lubricity and viscosity properties, it was also kept to high cleanliness and filtration standards.
The effect of dust, dirt, water, or silt which may be present in field operation and be limited in
high lubricity diesel fuel, could potentially be compounded by the fluids evaluated in this project.
In future work, it may be beneficial to examine the combined impact of particle size with fuel
lubricity to determine if a synergistic impact on component durability exists.

Unclassified
38
5.0 REFERENCES
ASTM Standard D6079, 2011, “Standard Test Method for Evaluating Lubricity of Diesel Fuels by the
High-Frequency Reciprocating Rig (HFRR)1,” ASTM International, West Conshohocken, PA, 2011,
DOI: 10.1520/ASTM D6079-11
ASTM Standard D5001, 2010, “Standard Test Method for Measurement of Lubricity of Aviation Turbine
Fuels by the Ball-on-Cylinder Lubricity Evaluator (BOCLE)1,” ASTM International, West
Conshohocken, PA, 2010, DOI: 10.1520/ASTM D5001-10
ASTM Standard D445, 2011, “Standard Test Method for Kinematic Viscosity of Transparent and Opaque
Liquids (and Calculation of Dynamic Viscosity)1,” ASTM International, West Conshohocken, PA, 2011,
DOI: 10.1520/ASTM D6079-11
Cummins Inc., Parts Catalog: ISC/ISL with CM2150 Control Module. 2007
Cummins Inc., Service Manual ISLe CM2150 Volume 1 & 2. 2009
Lubricating Oil, Internal Combustion Engine, Combat/Tactical Service, MIL-PRF-2104H, 1997

A-1
APPENDIX - A
Test Stand Development
A-2
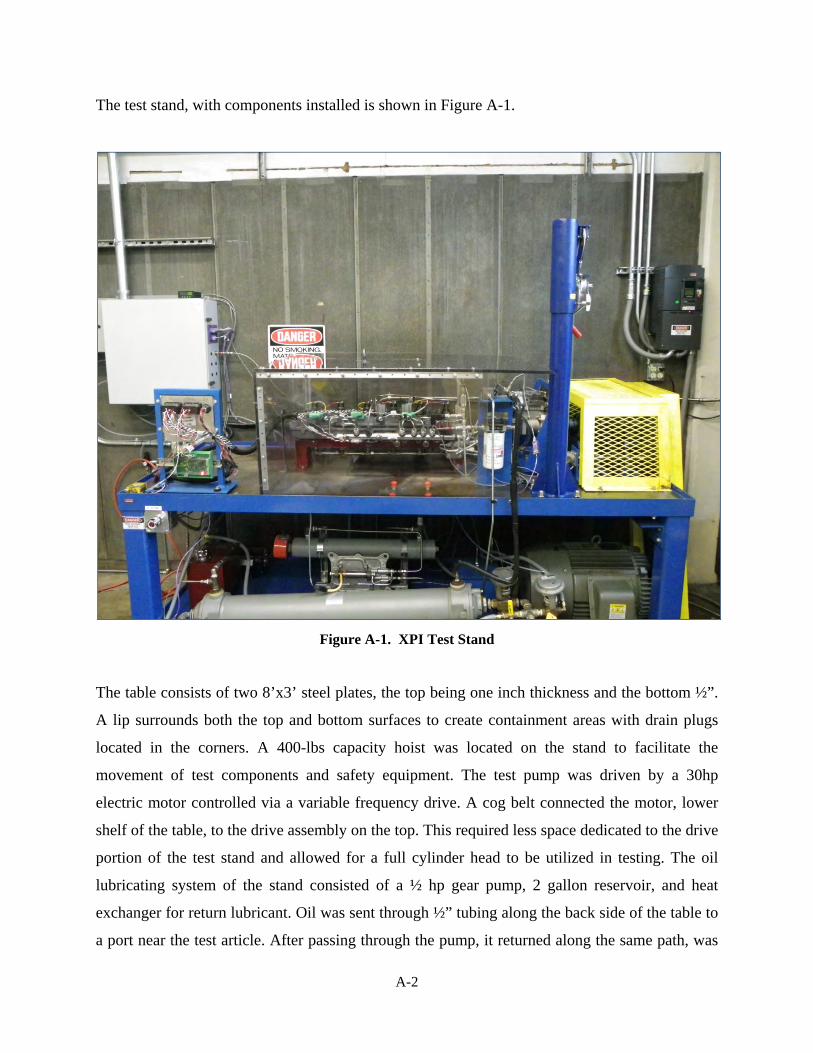
The test stand, with components installed is shown in Figure A-1.
Figure A-1. XPI Test Stand
The table consists of two 8’x3’ steel plates, the top being one inch thickness and the bottom ½”.
A lip surrounds both the top and bottom surfaces to create containment areas with drain plugs
located in the corners. A 400-lbs capacity hoist was located on the stand to facilitate the
movement of test components and safety equipment. The test pump was driven by a 30hp
electric motor controlled via a variable frequency drive. A cog belt connected the motor, lower
shelf of the table, to the drive assembly on the top. This required less space dedicated to the drive
portion of the test stand and allowed for a full cylinder head to be utilized in testing. The oil
lubricating system of the stand consisted of a ½ hp gear pump, 2 gallon reservoir, and heat
exchanger for return lubricant. Oil was sent through ½” tubing along the back side of the table to
a port near the test article. After passing through the pump, it returned along the same path, was

A-3
cooled via a liquid-to-liquid heat exchanger, and flowed back into the reservoir. Fuel entered the
test cell via stainless lines from a remote drum rack. A pressure regulator controlled the supply to
the on-stand day tank at no more than six psig. This prevented the float valve in the day tank
from being over pressurized and spilling. The fuel temperature at the inlet to the test parts was
controlled using a circulation heater. Based upon the outlet temperature of the fuel from the
heater, the power to the heater was adjusted to obtain the desired value. After injection, the hot
fuel was run through a large liquid-to-liquid heat exchanger prior to measuring flow. This did not
impact volumetric flow; the meter was a coriolis mass-flow style, but prevented damage due to
high temperature fuel. After flow was measured, the fuel was routed back to the remote drum
rack. Bypass and return fuel was also measured for flow and cooled before being returned to the
on-stand day tank. The heat exchanger for this fuel was controlled to maintain an elevated, but
below flashpoint, temperature within the day tank. Speed signals, for both the system ECM and
data acquisition software, came from a 3600 pulse-per-revolution rotary encoder. A table
summarizing the major components of the stand is provided in Table A-1.
Table A-1. Test Stand Components
Component Description Supplier
Circulation Heater 4.5kW, CFMNA25J10S Watlow
Injected Fuel HX 6” Diameter, 48” Length, Stainless Steel shell and tube
ITT Standard
Return Fuel and Oil System HX
3” Diameter, 14” Length, Stainless Steel shell and tube
ITT Standard
Drive System Bearings VPS-216 Pillow Block Bearing Browning
Pump Coupling PN 6A52: Clamp Style 2” Bore w/ Keyway x Blank Set Screw A-hub
Zero-Max
Motor 30HP, 230/460V, 286TS, 2-POLE Motor, PN 0302FTSA31B-P
Toshiba
VFD 30HP, 460VAC, 40AMPS, NEMA 1, PN VT130H9U4330
Toshiba
Rotary Encoder XH25D-SS-3600-ABZC-28V/V-SM18 BEI Industrial Oil System Pump ½ hp Rotary Gear Pump McMaster-Carr Oil System Reservoir 2-gallon High Temperature Oil Tank McMaster-Carr

B-1
APPENDIX - B
Evaluation of High Pressure Common Rail Fuel System
Test Fuel: Ultra Low Sulfur Diesel Test Number: ULSD-AF7469-60C-XPI

B-2
EVALUATION OF HIGH PRESSURE COMMON RAIL FUEL SYSTEM
Project 14734.04
Cummins XPI Fuel System
Test Fuel: Ultra Low Sulfur Diesel
Test Number: ULSD-AF7469-60C-XPI
Start of Test Date: November 29, 2010
End of Test Date: February 10, 2011
Test Duration: 400 Hours
Test Procedure: Simulated NATO Standard Engine Laboratory Test
Conducted for
U.S. Army TARDEC
Force Projection Technologies
Warren, Michigan

B-3
TABLE OF CONTENTS
Section Page Introduction and Background ............................................................................................. 5
Test System ......................................................................................................................... 5
Test Stand Configuration .................................................................................................... 5
Test Cycle ........................................................................................................................... 6
System Operating Conditions ............................................................................................. 7
Fuel Analysis .................................................................................................................... 12
Component Wear .............................................................................................................. 15
Fuel Pump ..................................................................................................................... 15 Fuel Injector .................................................................................................................. 18

B-4
LIST OF TABLES
Table Page Table B-1. NATO Cycle for XPI Pump Stand .................................................................. 6 Table B-2. Summarized Operating Conditions ................................................................ 11
LIST OF FIGURES
Figure Page Figure B-1. XPI Stand Layout ........................................................................................ 6 Figure B-2. Fuel Rail Pressure ....................................................................................... 7 Figure B-3. Injected Fuel Flow ...................................................................................... 8 Figure B-4. Return Fuel Flow ........................................................................................ 9 Figure B-5. System Inlet Fuel Temperature ................................................................. 10 Figure B-6. Fuel Filter Pressure ................................................................................... 10 Figure B-7. ASTM D5001 BOCLE ............................................................................. 12 Figure B-8. ASTM D6079 HFRR ................................................................................ 13 Figure B-9. Test Fuel Certificate of Analysis .............................................................. 14 Figure B-10. Low Pressure Gear Pump Housing ........................................................... 15 Figure B-11. Gear Pump Pressure Relief Valve ............................................................. 16 Figure B-12. Pump Gears ............................................................................................... 16 Figure B-13. Gear Tooth Wear ....................................................................................... 17 Figure B-14. High Pressure Check Valve ...................................................................... 17 Figure B-15. Upper Injector Components ...................................................................... 18 Figure B-16. Solenoid Plunger ....................................................................................... 19 Figure B-17. Solenoid Plunger Close-Up....................................................................... 19 Figure B-18. Upper Ball Seat ......................................................................................... 20 Figure B-19. Lower Ball Seat ......................................................................................... 20 Figure B-20. Injector Needle .......................................................................................... 21 Figure B-21. Injector Needle Scuffing ........................................................................... 21 Figure B-22. Injector Needle Tip ................................................................................... 22

B-5
Introduction and Background
The TARDEC Fuels and Lubricants Research Facility located at Southwest Research Institute (SwRI) is working on a project with the U.S. Army TARDEC on synthetic and alternative fuels. The project goal is to assess the changing worldwide fuels supply with a focus on kerosene and diesel boiling range fuels, and of the impact that varying fuel properties may have on current and future military equipment and systems. One of the tasks associated with the project was to determine fuel property requirements of modern common rail fuel injection systems. SwRI was tasked to set up a test bench system to analyze lubricity impacts of various fuels. Using a test bench method is preferred over full scale engine testing due to the low fuel quantities that can be used for long duration testing. Testing was conducted using commercially available ULSD, JP-8, and FT SPK, manufactured by Syntroleum as S-8, treated with corrosion inhibitor/lubricity improver (CI/LI), and a 1:1 blend of the JP-8 and the synthetic fuels. The desire was to perform eight 400-hour durability tests with duty cycles similar to a NATO cycle engine test. Four tests (one for each of the four fuels) conducted at controlled fuel inlet temperatures of 60°C (140 °F) and up to four at 93.3°C (200 °F), for a total of eight tests. The lower temperature ULSD test is considered a baseline for comparison of other tests.
Test System
Test fuel was evaluated in the Cummins XPI fuel system. This system was developed jointly between Cummins, Inc. and Scania. Primarily targeted for Cummins midrange and Scania heavy duty applications, an oil-lubricated fuel pump allows the system to reach rail and injection pressures of up to 30,000 psi. The pump consists of a low pressure gear pump and high pressure piston pump. It is operated at half of the engine angular velocity for a rated condition speed of 1050 rpm. On the high pressure side of the pump, the camshaft drives two plungers which pressurize the fuel entering the rail. Each plunger is driven by three lobes which, when correctly timed, impart new fuel to the high pressure rail as each injector fires. This is designed to reduce pressure pulsations in the high pressure system lines. The low pressure side of the system consists of a gear pump which passes fuel through the final filter before entering the high pressure side. For each fuel test, new pump, filter, and injector components were used.
Test Stand Configuration
The pump and hardware was mounted in a test stand specifically configured for the XPI system testing. System monitoring, control, and data acquisition was supplied by Southwest Research Institute (SwRI) developed PRISM software. Fuel injection and rail pressure were controlled by a Cummins CM2150 engine control module (ECM) modified for use with a bench system. Fluid temperatures were maintained with the use of liquid-to-liquid heat exchangers and heaters. The test was run using a 55-gallon drum as remote fuel source to the stand. A smaller day tank located at the stand provided a reservoir within the test cell. Fuel was drawn by an electric lift pump from the day tank to fill heating equipment and prime the main fuel pump. The fuel pump consisted of a low pressure gear pump to push fuel through a high efficiency filter and send it to the high-pressure cam driven pump. Fuel then flows to the rail before passing through the injectors. Bypass fuel collected from the high-pressure pump, rail relief valve, and injector returns was cooled as needed before returning to the day tank located on the test stand. Injected fuel was collected in a common manifold, cooled below its flash point, and returned to the remote drum. Fuel was checked throughout testing to monitor shifts in fuel lubricity that could impact test results. Every 100 hours of test operation, the 55-gallon fuel source was replaced. Samples of fuel were taken at the start of testing and completion of each100 hour segment. A schematic of the stand layout is shown in Figure B-1.
B-6
Test Cycle
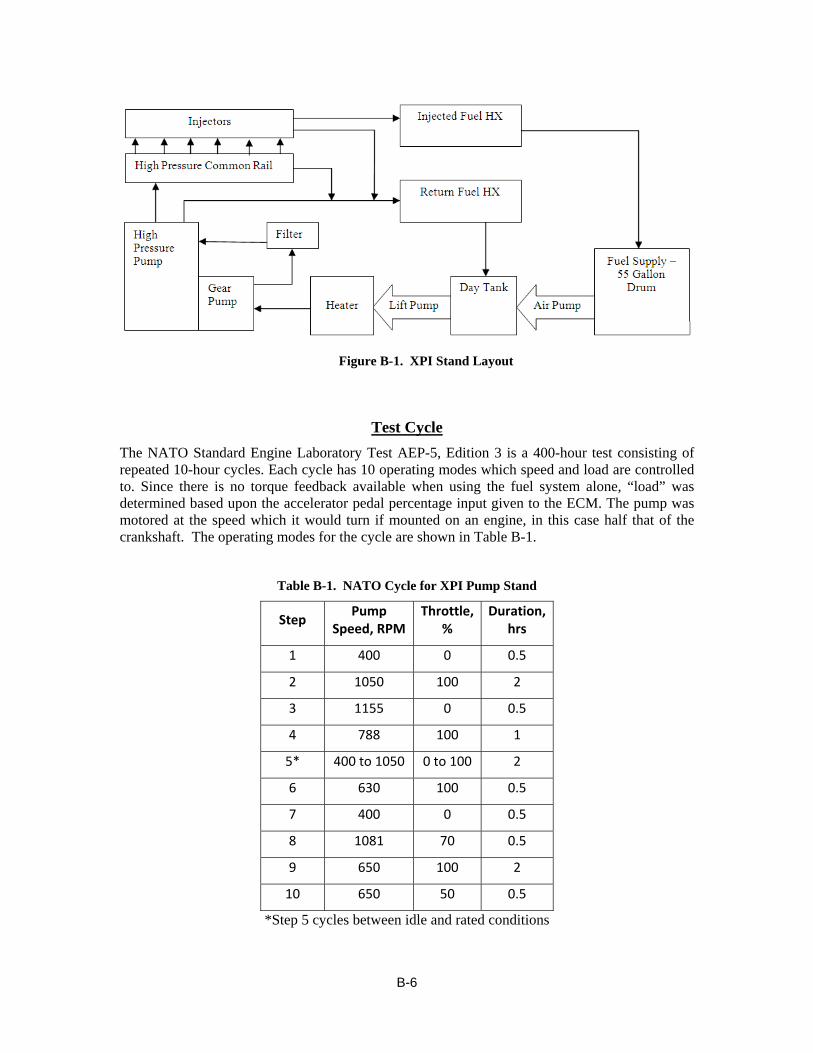
The NATO Standard Engine Laboratory Test AEP-5, Edition 3 is a 400-hour test consisting of repeated 10-hour cycles. Each cycle has 10 operating modes which speed and load are controlled to. Since there is no torque feedback available when using the fuel system alone, “load” was determined based upon the accelerator pedal percentage input given to the ECM. The pump was motored at the speed which it would turn if mounted on an engine, in this case half that of the crankshaft. The operating modes for the cycle are shown in Table B-1.
Table B-1. NATO Cycle for XPI Pump Stand
Step Pump
Speed, RPM Throttle,
% Duration,
hrs
1 400 0 0.5
2 1050 100 2
3 1155 0 0.5
4 788 100 1
5* 400 to 1050 0 to 100 2
6 630 100 0.5
7 400 0 0.5
8 1081 70 0.5
9 650 100 2
10 650 50 0.5
*Step 5 cycles between idle and rated conditions
Figure B-1. XPI Stand Layout

B-7
System Operating Conditions
Graphs shown for System Operating Conditions are average values for Mode 2 (rated conditions, 2 hours). Selected operating parameters are shown which provide an indication of system quality.
Figure B-2. Fuel Rail Pressure
The stock mounted pressure transducer within the high pressure rail was shared by Prism and the Cummins ECM for monitoring purposes. Data for the first two cycles is not available due to test point calibration issues. The test stand did not experience any unusual performance issues related to rail pressure during this, or any other, time.
27000
27500
28000
28500
29000
29500
30000
0 5 10 15 20 25 30 35 40
Rail Pressure, p
si
Cycle
Fuel Pressure in Rail

B-8
Figure B-3. Injected Fuel Flow
Fuel flow over the first 10 hours of testing was recorded using an oval gear style flow meter. As testing continued, it was determined that the electronic components of this meter were not capable of withstanding the temperature of the injected fuel and a new-styled meter was installed. This is the cause of the discrepancy in flow rate between Cycles 9 and 10. Following this change, the injected flow remained stable over the remaining 30 Cycles.
800
900
1000
1100
1200
1300
1400
0 5 10 15 20 25 30 35 40
Injected Flow, m
L/min
Cycle
Fuel Flow Through Injectors

B-9
Figure B-4. Return Fuel Flow
Bypass and return fuel flow is the combined fuel from the high pressure pump relief valve, rail protection check valve, and injectors bypass/cooling flow.
0
100
200
300
400
500
600
700
800
900
1000
0 5 10 15 20 25 30 35 40
Return Flow, m
L/min
Cycle
Bypass and Return Fuel Flow

B-10
Figure B-5. System Inlet Fuel Temperature
Figure B-6. Fuel Filter Pressure
0
10
20
30
40
50
60
70
0 5 10 15 20 25 30 35 40
Inlet Temperature, D
eg C
Cycle
System Inlet Fuel Temperature
0
20
40
60
80
100
120
0 5 10 15 20 25 30 35 40
Filter Inlet Pressure, p
si
Cycle
Fuel Filter Inlet Pressure

B-11
Fuel filter inlet pressure is a measure of the pressure being developed by the gear pump portion of the XPI fuel pump. It is influenced by a combination of pump speed and an internal pressure relief valve.
Shown in Table B-2 are operating conditions for each 100 hours of test time.
Table B-2. Summarized Operating Conditions
Test Hours 0‐100
Mean Std. Dev. Min Max
System Inlet Temperature, deg C 58.1 2.2 48.1 66.1
Injected Fuel Temperature, deg C 146.8 6.8 73.8 149.6
Rail Pressure, psi 29308 487 20088 29629
Injected Flow Rate, mL/min 1197.3 85.6 658.3 1391.6
Return Fuel Flow Rate, mL/min 820 26.0 717.2 1041.9
Fuel Filter Inlet Pressure, psi 110.7 1.2 98.7 113.6
Test Hours 100‐200
Mean Std. Dev. Min Max
System Inlet Temperature, deg C 59.7 1.5 53.7 64.2
Injected Fuel Temperature, deg C 149.2 2.1 118.9 149.6
Rail Pressure, psi 29431 79 29067 29742
Injected Flow Rate, mL/min 1331.6 32.5 1177.9 1403.8
Return Fuel Flow Rate, mL/min 851 13.3 799.9 903.2
Fuel Filter Inlet Pressure, psi 109.4 0.9 103.1 112.8
Test Hours 200‐300
Mean Std. Dev. Min Max
System Inlet Temperature, deg C 59.7 1.9 50.5 64.3
Injected Fuel Temperature, deg C 148.2 6.1 46.3 149.6
Rail Pressure, psi 29410 328 18573 29642
Injected Flow Rate, mL/min 1327.4 29.1 487.7 1375.0
Return Fuel Flow Rate, mL/min 820 16.7 693.0 876.6
Fuel Filter Inlet Pressure, psi 111.0 1.7 63.5 114.1
Test Hours 300‐400
Mean Std. Dev. Min Max
System Inlet Temperature, deg C 59.1 1.8 47.6 63.7
Injected Fuel Temperature, deg C 148.1 4.7 83.2 149.6
Rail Pressure, psi 29418 77 29131 29710
Injected Flow Rate, mL/min 1319.6 28.2 1062.8 1358.0
Return Fuel Flow Rate, mL/min 813 10.9 762.7 845.9
Fuel Filter Inlet Pressure, psi 112.4 0.9 105.4 116.9

B-12
Fuel Analysis
Fuel was evaluated for lubricity at the beginning of the test and the end of each 100 hours, when the supply drum was changed. Because the ULSD fuel was from two separate shipments, there are two “fresh” samples, one for the first two hundred hours and one for the last two hundred. It should be noted that the difference in WSD for fresh samples in the HFRR test type is within the repeatability of the procedure. Results from ASTM D5001 and D6079 are shown in Figures B-7 and B-8. Test results indicate that over the duration of the test the system did not encounter fuel with unusually high lubricity. Figure B-9 shows the Certificate of Analysis received from the supplier for the fuel used in this test. It should be noted that the value for HFRR is outside of the ASTM D975 specification of 0.52 mm according to the CoA, but within the limits when tested at SwRI.
Figure B-7. ASTM D5001 BOCLE
0
0.1
0.2
0.3
0.4
0.5
0.6
0.7
Fresh Used
Wear Scar, m
m
60°C ULSD XPI ‐ D5001 BOCLE
0‐100 Hours
100‐200 Hours
200‐300 Hours
300‐400 Hours

B-13
Figure B-8. ASTM D6079 HFRR
0
0.05
0.1
0.15
0.2
0.25
0.3
0.35
0.4
0.45
Fresh Used
Wear Scar, m
m
60°C ULSD XPI ‐ D6079 HFRR
0‐100 Hours
100‐200 Hours
200‐300 Hours
300‐400 Hours

B-14
Figure B-9. Test Fuel Certificate of Analysis

B-15
Component Wear
Post-test disassembly of the pump and injectors was performed to establish a baseline for typical wear operating on ULSD. Only fuel wetted components are shown in the figures that follow. The most predominant wear following the ULSD test was located on the teeth of the oval gears. This is somewhat expected as this surface slides along the pump housing to produce the low pressure fuel pressure.
Fuel Pump
Figure B-10. Low Pressure Gear Pump Housing

B-16
Figure B-11. Gear Pump Pressure Relief Valve
Figure B-12. Pump Gears

B-17
Figure B-13. Gear Tooth Wear
Figure B-14. High Pressure Check Valve

B-18
Fuel Injector
Figure B-15. Upper Injector Components

B-19
Figure B-16. Solenoid Plunger
Figure B-17. Solenoid Plunger Close-Up

B-20
Figure B-18. Upper Ball Seat
Figure B-19. Lower Ball Seat

B-21
Figure B-20. Injector Needle
Figure B-21. Injector Needle Scuffing

B-22
Figure B-22. Injector Needle Tip

C-1
APPENDIX - C
Evaluation of High Pressure Common Rail Fuel System
Test Fuel: JP-8 Test Number: JP-8-AF7832-60C-XPI

C-2
EVALUATION OF HIGH PRESSURE COMMON RAIL FUEL SYSTEM
Project 14734.04
Cummins XPI Fuel System
Test Fuel: JP-8
Test Number: JP8-AF7832-60C-XPI
Start of Test Date: February 28, 2011
End of Test Date: March 24, 2011
Test Duration: 400 Hours
Test Procedure: Simulated NATO Standard Engine Laboratory Test
Conducted for
U.S. Army TARDEC
Force Projection Technologies
Warren, Michigan

C-3
TABLE OF CONTENTS
Section Page LIST OF TABLES .............................................................................................................. 3 LIST OF FIGURES ............................................................................................................ 3 Introduction and Background ............................................................................................. 4 Test System ......................................................................................................................... 4 Test Stand Configuration .................................................................................................... 4 Test Cycle ........................................................................................................................... 5 System Operating Conditions ............................................................................................. 6 Fuel Analysis .................................................................................................................... 12 Component Wear .............................................................................................................. 13
Fuel Pump ..................................................................................................................... 13 Fuel Injector .................................................................................................................. 16

C-4
LIST OF TABLES
Table Page Table C-1. NATO Cycle for XPI Pump Stand .............................................................. 5 Table C-2. Summarized Operating Conditions ........................................................... 11
LIST OF FIGURES
Figure Page Figure C-1. XPI Stand Layout ........................................................................................ 5 Figure C-2. Fuel Rail Pressure ....................................................................................... 6 Figure C-3. Injected Fuel Flow ...................................................................................... 7 Figure C-4. Return Fuel Flow ........................................................................................ 8 Figure C-5. System Inlet Fuel Temperature ................................................................... 9 Figure C-6. Fuel Filter Pressure ................................................................................... 10 Figure C-7. ASTM D5001 BOCLE ............................................................................. 12 Figure C-8. ASTM D6079 HFRR ................................................................................ 12 Figure C-9. Low Pressure Gear Pump Housing ........................................................... 13 Figure C-10. Gear Pump Pressure Relief Valve ............................................................. 14 Figure C-11. Pump Gears ............................................................................................... 14 Figure C-12. Gear Tooth Wear ....................................................................................... 15 Figure C-13. High Pressure Check Valve ...................................................................... 15 Figure C-14. Upper Injector Components (Typical) ...................................................... 16 Figure C-15. Upper Injector Components (Failed) ........................................................ 17 Figure C-16. Solenoid Units, Failed (Left) and Typical (Right) .................................... 18 Figure C-17. Solenoid Plungers, Failed on Top, Typical Below ................................... 19 Figure C-18. Solenoid Plunger Close-up (Typical)........................................................ 20 Figure C-19. Solenoid Plunger Close-up (Failed) .......................................................... 20 Figure C-20. Upper Ball Seat (Typical) ......................................................................... 21 Figure C-21. Upper Ball Seat (Failed) ........................................................................... 21 Figure C-22. Lower Ball Seat (Typical) ......................................................................... 22 Figure C-23. Lower Ball Seat (Failed) ........................................................................... 22 Figure C-24. Injector Needle (Typical) .......................................................................... 23 Figure C-25. Injector Needle (Failed) ............................................................................ 23 Figure C-26. Injector Needle Scuffing (Typical) ........................................................... 24 Figure C-27. Injector Needle Scuffing (Failed) ............................................................. 24 Figure C-28. Injector Needle Tip (Typical) ................................................................... 25 Figure C-29. Injector Needle Tip (Failed) ...................................................................... 25

C-5
Introduction and Background
The TARDEC Fuels and Lubricants Research Facility located at Southwest Research Institute (SwRI) is working on a project with the U.S. Army TARDEC on synthetic and alternative fuels. The project goal is to assess the changing worldwide fuels supply with a focus on kerosene and diesel boiling range fuels, and of the impact that varying fuel properties may have on current and future military equipment and systems. One of the tasks associated with the project was to determine fuel property requirements of modern common rail fuel injection systems. SwRI was tasked to set up a test bench system to analyze lubricity impacts of various fuels. Using a test bench method is preferred over full scale engine testing due to the low fuel quantities that can be used for long duration testing. Testing was conducted using commercially available ULSD, JP-8, an FT SPK, manufactured by Syntroleum as S-8, treated with corrosion inhibitor/lubricity improver (CI/LI), and a 1:1 blend of the JP-8 and the synthetic fuels. The desire was to perform eight 400-hour durability tests with duty cycles similar to a NATO cycle engine test. Four tests (one for each of the four fuels) conducted at controlled fuel inlet temperatures of 60°C (140 °F) and up to four at 93.3°C (200 °F), for a total of eight tests. The lower temperature ULSD test is considered a baseline for comparison of other tests.
Test System
Test fuel was evaluated in the Cummins XPI fuel system. This system was developed jointly between Cummins Inc. and Scania. Primarily targeted for Cummins midrange and Scania heavy duty applications, an oil-lubricated fuel pump allows the system to reach rail and injection pressures of up to 30,000 psi. The pump consists of a low pressure gear pump and high pressure piston pump. It is operated at half of the engine angular velocity for a rated condition speed of 1050 rpm. On the high pressure side of the pump, the camshaft drives two plungers which pressurize the fuel entering the rail. Each plunger is driven by three lobes which, when correctly timed, impart new fuel to the high pressure rail as each injector fires. This is designed to reduce pressure pulsations in the high pressure system lines. The low pressure side of the system consists of a gear pump which passes fuel through the final filter before entering the high pressure side. For each fuel test, new pump, filter, and injector components were used.
Test Stand Configuration
The pump and hardware was mounted in a test stand specifically configured for the XPI system testing. System monitoring, control, and data acquisition was supplied by Southwest Research Institute (SwRI) developed PRISM software. Fuel injection and rail pressure were controlled by a Cummins CM2150 engine control module (ECM) modified for use with a bench system. Fluid temperatures were maintained with the use of liquid-to-liquid heat exchangers and heaters. The test was run using a 55-gallon drum as remote fuel source to the stand. A smaller day tank located at the stand provided a reservoir within the test cell. Fuel was drawn by an electric lift pump from the day tank to fill heating equipment and prime the main fuel pump. The fuel pump consisted of a low pressure gear pump to push fuel through a high efficiency filter and send it to the high-pressure cam driven pump. Fuel then flows to the rail before passing through the injectors. Bypass fuel collected from the high-pressure pump, rail relief valve, and injector returns was cooled as needed before returning to the day tank located on the test stand. Injected fuel was collected in a common manifold, cooled below its flash point, and returned to the remote drum. Fuel was checked throughout testing to monitor shifts in fuel lubricity that could impact test results. Every 100 hours of test operation, the 55-gallon fuel source was replaced. Samples of fuel were taken at the start of testing and completion of each100 hour segment. A schematic of the stand layout is shown in Figure C-1.

C-6
Figure C-1. XPI Stand Layout
Test Cycle
The NATO Standard Engine Laboratory Test AEP-5, Edition 3 is a 400-hour test consisting of repeated 10-hour cycles. Each cycle has 10 operating modes which speed and load are controlled to. Since there is no torque feedback available when using the fuel system alone, “load” was determined based upon the accelerator pedal percentage input given to the ECM. The pump was motored at the speed which it would turn if mounted on an engine, in this case half that of the crankshaft. The operating modes for the cycle are shown in Table C-1.
Table C-1. NATO Cycle for XPI Pump Stand
Step Pump
Speed, RPM Throttle,
% Duration,
hrs
1 400 0 0.5
2 1050 100 2
3 1155 0 0.5
4 788 100 1
5* 400 to 1050 0 to 100 2
6 630 100 0.5
7 400 0 0.5
8 1081 70 0.5
9 650 100 2
10 650 50 0.5
*Step 5 cycles between idle and rated conditions
Fuel Supply – 55 Gallon
Drum ADay Lift Heater
High Pressure
Pump
Gear Pump
Filter
Return Fuel HX
Injected Fuel HX
High Pressure Common
Injectors

C-7
System Operating Conditions
Graphs shown for System Operating Conditions are average values for Mode 2 (rated conditions, 2 hours). Selected operating parameters are shown which provide an indication of system quality.
The stock mounted pressure transducer within the high pressure rail was shared by Prism and the Cummins ECM for monitoring purposes. The stand did not experience any unusual performance issues related to rail pressure during the course of the test.
Figure C-2. Fuel Rail Pressure
27000
27500
28000
28500
29000
29500
30000
0 5 10 15 20 25 30 35 40
Rail Pressure, p
si
Cycle
Fuel Pressure in Rail

C-8
The reduction in JP-8 flow between cycles 6 and 10 indicates a gradual loss of needle lift, while the steep drop in flow between cycles 10 and 11 indicates complete failure of an injector. During post-test inspection of the injectors, it was found that the solenoid plunger within the #4 injector was seized with debris. The JP-8 (projected) portion of the figure shows what flow rate would be expected, assuming only five of the six injectors were operational for the majority of the test. These projected values show a flow rate similar to that at the start of the test with a slight reduction of flow over time.
Figure C-3. Injected Fuel Flow
900
1000
1100
1200
1300
1400
1500
0 5 10 15 20 25 30 35 40
Injected Flow, m
L/min
Cycle
Fuel Flow Through Injectors
Measured
Projected

C-9
Bypass and return fuel flow is the combined fuel from the high pressure pump relief valve, rail protection check valve, and injectors bypass/cooling flow. The reduction in flow between cycles 6 and 11 is most likely due to the failure of the #4 injector. Since fuel passes through injectors as the needle lifts, degradation of the injectors influences not only the injected flow rate, but the bypass flow rate as well.
Figure C-4. Return Fuel Flow
600
700
800
900
1000
1100
1200
0 5 10 15 20 25 30 35 40
Return Flow, m
L/min
Cycle
Bypass and Return Fuel Flow

C-10
Fuel filter inlet pressure is a measure of the pressure being developed by the gear pump portion of the XPI fuel pump. A slight reduction in pressure was seen over the duration of the test.
Figure C-5. System Inlet Fuel Temperature
0
10
20
30
40
50
60
70
0 5 10 15 20 25 30 35 40
Inlet Temperature, D
eg C
Cycle
System Inlet Fuel Temperature
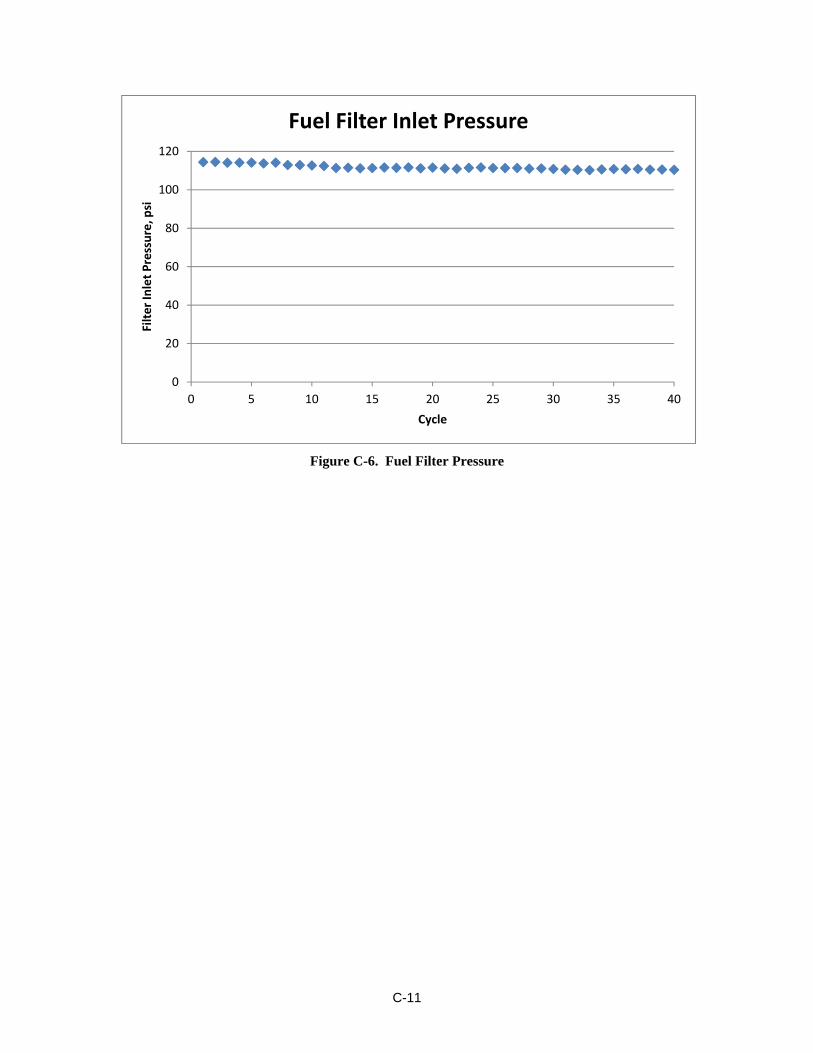
C-11
Figure C-6. Fuel Filter Pressure
0
20
40
60
80
100
120
0 5 10 15 20 25 30 35 40
Filter Inlet Pressure, p
si
Cycle
Fuel Filter Inlet Pressure

C-12
Table C-2. Summarized Operating Conditions
Test Hours 0‐100
Mean Std. Dev. Min Max
System Inlet Temperature, deg C 58.8 2.4 49.9 65.2
Injected Fuel Temperature, deg C 151.8 12.4 4.6 167.2
Rail Pressure, psi 29461 113 28491 29934
Injected Flow Rate, mL/min 1400.6 46.7 1105.8 1499.0
Return Fuel Flow Rate, mL/min 1134.6 25.8 1033.1 1217.8
Fuel Filter Inlet Pressure, psi 113.8 1.3 91.8 118.0
Test Hours 100‐200
Mean Std. Dev. Min Max
System Inlet Temperature, deg C 60.0 1.3 56.3 63.0
Injected Fuel Temperature, deg C 159.2 6.0 111.8 166.4
Rail Pressure, psi 29446 118 29139 29965
Injected Flow Rate, mL/min 1196.0 53.3 961.8 1413.4
Return Fuel Flow Rate, mL/min 1055.1 29.8 978.2 1157.0
Fuel Filter Inlet Pressure, psi 111.5 0.7 108.5 114.5
Test Hours 200‐300
Mean Std. Dev. Min Max
System Inlet Temperature, deg C 60.0 1.3 56.2 64.9
Injected Fuel Temperature, deg C 159.0 6.1 112.7 165.6
Rail Pressure, psi 29444 122 29073 29853
Injected Flow Rate, mL/min 1174.0 21.3 882.9 1237.5
Return Fuel Flow Rate, mL/min 1033.1 18.5 966.9 1090.9
Fuel Filter Inlet Pressure, psi 111.2 0.5 109.4 112.6
Test Hours 300‐400
Mean Std. Dev. Min Max
System Inlet Temperature, deg C 60.0 1.2 56.8 62.5
Injected Fuel Temperature, deg C 159.4 6.0 113.1 165.8
Rail Pressure, psi 29451 131 29068 29966
Injected Flow Rate, mL/min 1168.2 17.0 976.7 1230.7
Return Fuel Flow Rate, mL/min 1027.4 18.2 946.9 1074.4
Fuel Filter Inlet Pressure, psi 110.6 0.5 105.7 114.6

C-13
Fuel Analysis
Fuel was evaluated at the beginning of the test and the end of each 100 hours, when the supply drum was changed. Results from ASTM D5001 and D6079 are shown in Figures C-7 and C-8. Pre and post test fuel analysis did not indicate any unusually large changes in lubricity.
Figure C-7. ASTM D5001 BOCLE
Figure C-8. ASTM D6079 HFRR
0
0.1
0.2
0.3
0.4
0.5
0.6
0.7
0.8
Fresh Used
Wear Scar, m
m
60°C JP‐8 XPI ‐ D5001 BOCLE
0‐100 Hours
100‐200 Hours
200‐300 hours
300‐400 Hours
0
0.1
0.2
0.3
0.4
0.5
0.6
0.7
0.8
0.9
Fresh Used
Wear Scar, m
m
60°C JP‐8 XPI ‐ D6079 HFRR
0‐100 Hours
100‐200 Hours
200‐300 Hours
300‐400 Hours

C-14
Component Wear
Post-test tear down of the pump and injectors was performed to evaluate typical wear operating on JP-8. Only fuel wetted components are shown in the figures that follow.
Fuel Pump
Figure C-9. Low Pressure Gear Pump Housing

C-15
Figure C-10. Gear Pump Pressure Relief Valve
Figure C-11. Pump Gears

C-16
Figure C-12. Gear Tooth Wear
Figure C-13. High Pressure Check Valve

C-17
Fuel Injector It was concluded that injector #4 experienced a failure during the JP-8 test. Photos for this test are shown for both the failed unit one representing a typical condition of the other five injectors. While disassembling the unit, it was found that the solenoid plunger seemed to be seized within its bore. After removal, the plunger would not slide back into the bore as it would in the other injectors. Since no issues of a similar nature were found in the other injectors or the pump, it is assumed this the failure was related to hardware and not the fuel used for testing.
Figure C-14. Upper Injector Components (Typical)

C-18
Figure C-15. Upper Injector Components (Failed)

C-19
It was observed that the material in the solenoid of the failed injector had a rougher and porous surface appearance compared to that of the typical unit. Additionally, the inside surface of the bore (not shown) had a dull appearance rather than the highly polished surface found in others.
Figure C-16. Solenoid Units, Failed (Left) and Typical (Right)

C-20
Upon removal, metallic filings were found on the plunger. It should be noted that the filings are standing out in Figure XX due to the magnetic nature of the piece. While still wet with fuel, the filings were mainly collected between the two wider sections and the top of the plunger. Shown along with plunger from the failed unit is another from the JP-8 test typical of the remaining injectors.
Figure C-17. Solenoid Plungers, Failed on Top, Typical Below

C-21
Figure C-18. Solenoid Plunger Close-up (Typical)
It should be noted the gouges visible on the failed injector plunger in Figure C-11. This is likely the source of the metallic shavings.
Figure C-19. Solenoid Plunger Close-up (Failed)

C-22
Figure C-20. Upper Ball Seat (Typical)
Figure C-21. Upper Ball Seat (Failed)

C-23
Figure C-22. Lower Ball Seat (Typical)
Figure C-23. Lower Ball Seat (Failed)

C-24
Figure C-24. Injector Needle (Typical)
Figure C-25. Injector Needle (Failed)

C-25
Figure C-26. Injector Needle Scuffing (Typical)
Figure C-27. Injector Needle Scuffing (Failed)
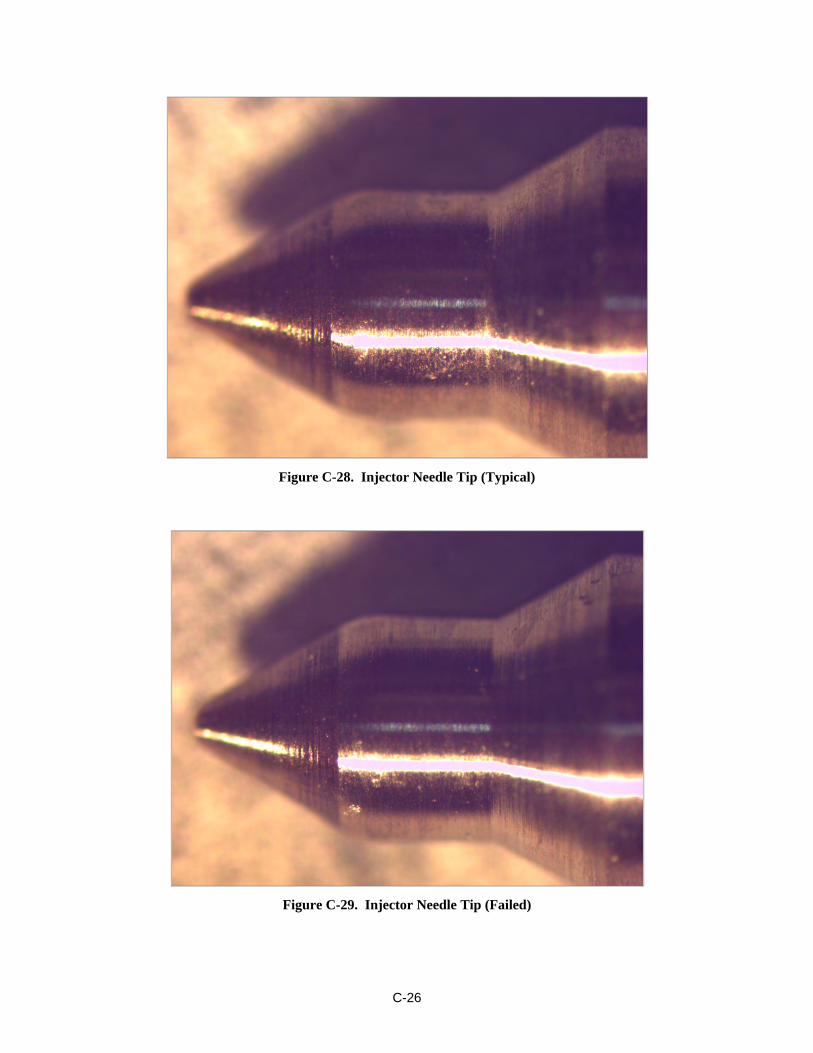
C-26
Figure C-28. Injector Needle Tip (Typical)
Figure C-29. Injector Needle Tip (Failed)
D-1
APPENDIX - D
Evaluation of High Pressure Common Rail Fuel System
Test Fuel: JP-8
Test Number: JP-8-AF7832-93C-XPI

D-2
EVALUATION OF HIGH PRESSURE COMMON RAIL FUEL SYSTEM
Project 14734.04
Cummins XPI Fuel System
Test Fuel: JP-8
Test Number: JP-8-AF7832-93C-XPI
Start of Test Date: August 15, 2011
End of Test Date: September 9, 2011
Test Duration: 400 Hours
Test Procedure: Simulated NATO Standard Engine Laboratory Test
Conducted for
U.S. Army TARDEC
Force Projection Technologies
Warren, Michigan
D-3
TABLE OF CONTENTS
Section Page LIST OF TABLES .............................................................................................................. 4 LIST OF FIGURES ............................................................................................................ 4 Introduction and Background ............................................................................................. 5 Test System ......................................................................................................................... 5 Test Stand Configuration .................................................................................................... 5 Test Cycle ........................................................................................................................... 7 System Operating Conditions ............................................................................................. 8 Fuel Analysis .................................................................................................................... 12 Component Wear .............................................................................................................. 14
Fuel Pump ..................................................................................................................... 14 Fuel Injector .................................................................................................................. 18
D-4
LIST OF TABLES
Table Page Table D-1. NATO Cycle for XPI Pump Stand .............................................................. 7 Table D-2. Summarized Operating Conditions ........................................................... 11
LIST OF FIGURES
Figure Page Figure D-1. XPI Stand Layout ........................................................................................ 6 Figure D-2. Fuel Rail Pressure ....................................................................................... 8 Figure D-3. Injected Fuel Flow ...................................................................................... 9 Figure D-4. Return Fuel Flow ........................................................................................ 9 Figure D-5. System Inlet Fuel Temperature ................................................................. 10 Figure D-6. Fuel Filter Pressure ................................................................................... 10 Figure D-7. ASTM D5001 BOCLE ............................................................................. 12 Figure D-8. ASTM D6079 HFRR ................................................................................ 13 Figure D-9. Low Pressure Gear Pump Housing ........................................................... 14 Figure D-10. Gear Pump Side Wall ................................................................................ 15 Figure D-11. Gear Pump Pressure Relief Valve ............................................................. 15 Figure D-12. Pump Gears ............................................................................................... 16 Figure D-13. Gear Tooth Wear ....................................................................................... 16 Figure D-14. Gear Tooth Chipping ................................................................................ 17 Figure D-15. Upper Injector Components ...................................................................... 18 Figure D-16. Solenoid Plunger Close-Up....................................................................... 18 Figure D-17. Upper Ball Seat ......................................................................................... 19 Figure D-18. Lower Ball Seat ......................................................................................... 19 Figure D-19. Injector Needle .......................................................................................... 20 Figure D-20. Injector Needle Scuffing ........................................................................... 20 Figure D-21. Injector Needle Tip ................................................................................... 21

D-5
Introduction and Background
The TARDEC Fuels and Lubricants Research Facility located at Southwest Research Institute (SwRI) is working on a project with the U.S. Army TARDEC on synthetic and alternative fuels. The project goal is to assess the changing worldwide fuels supply with a focus on kerosene and diesel boiling range fuels, and of the impact that varying fuel properties may have on current and future military equipment and systems. One of the tasks associated with the project was to determine fuel property requirements of modern common rail fuel injection systems. SwRI was tasked to set up a test bench system to analyze lubricity impacts of various fuels. Using a test bench method is preferred over full scale engine testing due to the low fuel quantities that can be used for long duration testing. Testing was conducted using commercially available ULSD, JP-8, an FT SPK, manufactured by Syntroleum as S-8, treated with corrosion inhibitor/lubricity improver (CI/LI), and a 1:1 blend of the JP-8 and the synthetic fuels. The desire was to perform eight 400-hour durability tests with duty cycles similar to a NATO cycle engine test. Four tests (one for each of the four fuels) conducted at controlled fuel inlet temperatures of 60°C (140 °F) and up to four at 93.3°C (200 °F), for a total of eight tests. The lower temperature ULSD test is considered a baseline for comparison of other tests. As the project progressed, it was determined that the 93.3°C ULSD and full synthetic tests would be replaced with 60°C evaluations of Jet-A and the synthetic fuel without any lubricity improver.
Test System
Test fuel was evaluated in the Cummins XPI fuel system. This system was developed jointly between Cummins Inc. and Scania. Primarily targeted for Cummins midrange and Scania heavy duty applications, an oil-lubricated fuel pump allows the system to reach rail and injection pressures of up to 30,000 psi. The pump consists of a low pressure gear pump and high pressure piston pump. It is operated at half of the engine angular velocity for a rated condition speed of 1050 rpm. On the high pressure side of the pump, the camshaft drives two plungers which pressurize the fuel entering the rail. Each plunger is driven by three lobes which, when correctly timed, impart new fuel to the high pressure rail as each injector fires. This is designed to reduce pressure pulsations in the high pressure system lines. The low pressure side of the system consists of a gear pump which passes fuel through the final filter before entering the high pressure side. For each fuel test, new pump, filter, and injector components were used.
Test Stand Configuration
The pump and hardware was mounted in a test stand specifically configured for the XPI system testing. System monitoring, control, and data acquisition was supplied by Southwest Research Institute (SwRI) developed PRISM software. Fuel injection and rail pressure were controlled by a Cummins CM2150 engine control module (ECM) modified for use with a bench system. Fluid temperatures were maintained with the use of liquid-to-liquid heat exchangers and heaters. The test was run using a 55-gallon drum as remote fuel source to the stand. A smaller day tank located at the stand provided a reservoir within the test cell. Fuel was drawn by an electric lift pump from the day tank to fill heating equipment and prime the main fuel pump. The fuel pump consisted of a low pressure gear pump to push fuel through a high efficiency filter and send it to the high-pressure cam driven pump. Fuel then flows to the rail before passing through the injectors. Bypass fuel collected from the high-pressure pump, rail relief valve, and injector returns was cooled as needed before returning to the day tank located on the test stand. Injected fuel was collected in a common manifold, cooled below its flash point, and returned to the remote drum.

D-6
Fuel was checked throughout testing to monitor shifts in fuel lubricity that could impact test results. Every 100 hours of test operation, the 55-gallon fuel source was replaced. Samples of fuel were taken at the start of testing and completion of each 100 hour segment. A schematic of the stand layout is shown in Figure D-1.
Figure D-1. XPI Stand Layout

D-7
Test Cycle
The NATO Standard Engine Laboratory Test AEP-5, Edition 3 is a 400-hour test consisting of repeated 10-hour cycles. Each cycle has 10 operating modes which speed and load are controlled to. Since there is no torque feedback available when using the fuel system alone, “load” was determined based upon the accelerator pedal percentage input given to the ECM. The pump was motored at the speed which it would turn if mounted on an engine, in this case half that of the crankshaft. The operating modes for the cycle are shown in Table D-1.
Table D-1. NATO Cycle for XPI Pump Stand
Step Pump
Speed, RPM Throttle,
% Duration,
hrs
1 400 0 0.5
2 1050 100 2
3 1155 0 0.5
4 788 100 1
5* 400 to 1050 0 to 100 2
6 630 100 0.5
7 400 0 0.5
8 1081 70 0.5
9 650 100 2
10 650 50 0.5
*Step 5 cycles between idle and rated conditions

D-8
System Operating Conditions
Graphs shown for System Operating Conditions are average values for Mode 2 (rated conditions, 2 hours). Selected operating parameters are shown which provide an indication of system quality.
The stock mounted pressure transducer within the high pressure rail was shared by Prism and the Cummins ECM for monitoring purposes. The stand did not experience any unusual performance issues related to rail pressure during the course of the test.
Figure D-2. Fuel Rail Pressure
27000
27500
28000
28500
29000
29500
30000
0 5 10 15 20 25 30 35 40
Rail Pressure, p
si
Cycle
Fuel Pressure in Rail

D-9
Figure D-3. Injected Fuel Flow Both injected and bypass flow rates were consistent throughout the evaluation.
Figure D-4. Return Fuel Flow
900
1000
1100
1200
1300
1400
1500
0 5 10 15 20 25 30 35 40
Injected Flow, m
L/min
Cycle
Fuel Flow Through Injectors
0
200
400
600
800
1000
1200
1400
0 5 10 15 20 25 30 35 40
Fuel Flow, m
L/min
Cycle
Bypass and Return Fuel Flow

D-10
Figure D-5. System Inlet Fuel Temperature
At the flow rate experienced at rated conditions, the test stand heater maintains a temperature below the 93.3° C set point.
Figure D-6. Fuel Filter Pressure Fuel filter inlet pressure is a measure of the pressure being developed by the gear pump portion of the XPI fuel pump.
0
10
20
30
40
50
60
70
80
90
100
0 5 10 15 20 25 30 35 40
Inlet Temperature, D
eg C
Cycle
System Inlet Fuel Temperature
0
20
40
60
80
100
120
0 5 10 15 20 25 30 35 40
Filter Inlet Pressure, p
si
Cycle
Fuel Filter Inlet Pressure

D-11
Table D-2. Summarized Operating Conditions
Test Hours 0‐100
Mean Std. Dev. Min Max
System Inlet Temperature, deg C 85.4 4.7 74.7 94.5
Injected Fuel Temperature, deg C 181.5 7.2 130.6 192.8
Rail Pressure, psi 29476 96.1 28932.4 29872.2
Injected Flow Rate, mL/min 1458.9 23.6 1185.9 1503.7
Return Fuel Flow Rate, mL/min 1133.2 21.5 1016.5 1196.0
Fuel Filter Inlet Pressure, psi 103.5 1.4 101.0 109.1
Test Hours 100‐200
Mean Std. Dev. Min Max
System Inlet Temperature, deg C 88.4 2.8 78.8 94.2
Injected Fuel Temperature, deg C 183.5 7.1 119.8 192.8
Rail Pressure, psi 29481 101.5 29074.4 29801.6
Injected Flow Rate, mL/min 1456.1 18.7 1280.7 1496.3
Return Fuel Flow Rate, mL/min 1117.5 18.6 1014.8 1158.8
Fuel Filter Inlet Pressure, psi 102.3 0.7 100.6 106.1
Test Hours 200‐300
Mean Std. Dev. Min Max
System Inlet Temperature, deg C 89.0 2.9 84.2 93.8
Injected Fuel Temperature, deg C 184.4 6.0 148.7 192.7
Rail Pressure, psi 29471 120.3 29066.6 29878.4
Injected Flow Rate, mL/min 1456.0 17.5 1365.2 1531.7
Return Fuel Flow Rate, mL/min 1111.2 18.9 1032.5 1174.1
Fuel Filter Inlet Pressure, psi 102.0 0.7 99.9 104.1
Test Hours 300‐400
Mean Std. Dev. Min Max
System Inlet Temperature, deg C 87.9 2.8 81.9 93.8
Injected Fuel Temperature, deg C 183.9 5.8 148.3 193.1
Rail Pressure, psi 29481 117.7 29105.0 29874.5
Injected Flow Rate, mL/min 1454.0 17.3 1377.1 1513.1
Return Fuel Flow Rate, mL/min 1115.1 16.1 1047.2 1153.5
Fuel Filter Inlet Pressure, psi 101.9 0.7 100.0 104.0

D-12
Fuel Analysis
Fuel was evaluated at the beginning of the test and the end of each 100 hours, when the supply drum was changed. Results from ASTM D5001 and D6079 are shown in Figures D-7 and D-8. Pre and post test fuel analysis did not indicate any unusually large changes in lubricity.
Figure D-7. ASTM D5001 BOCLE
0
0.1
0.2
0.3
0.4
0.5
0.6
0.7
0.8
Fresh Used
Wear Scar, m
m
93.3°C JP‐8 XPI ‐ D5001 BOCLE
0‐100 Hours
100‐200 Hours
200‐300 hours
300‐400 Hours

D-13
Figure D-8. ASTM D6079 HFRR
0
0.1
0.2
0.3
0.4
0.5
0.6
0.7
0.8
0.9
Fresh Used
Wear Scar, m
m
93.3°C JP‐8 XPI ‐ D6079 HFRR
0‐100 Hours
100‐200 Hours
200‐300 Hours
300‐400 Hours

D-14
Component Wear
Post-test tear down of the pump and injectors was performed to evaluate typical wear operating on JP-8. Only fuel wetted components are shown in the figures that follow.
Fuel Pump
Figure D-9. Low Pressure Gear Pump Housing
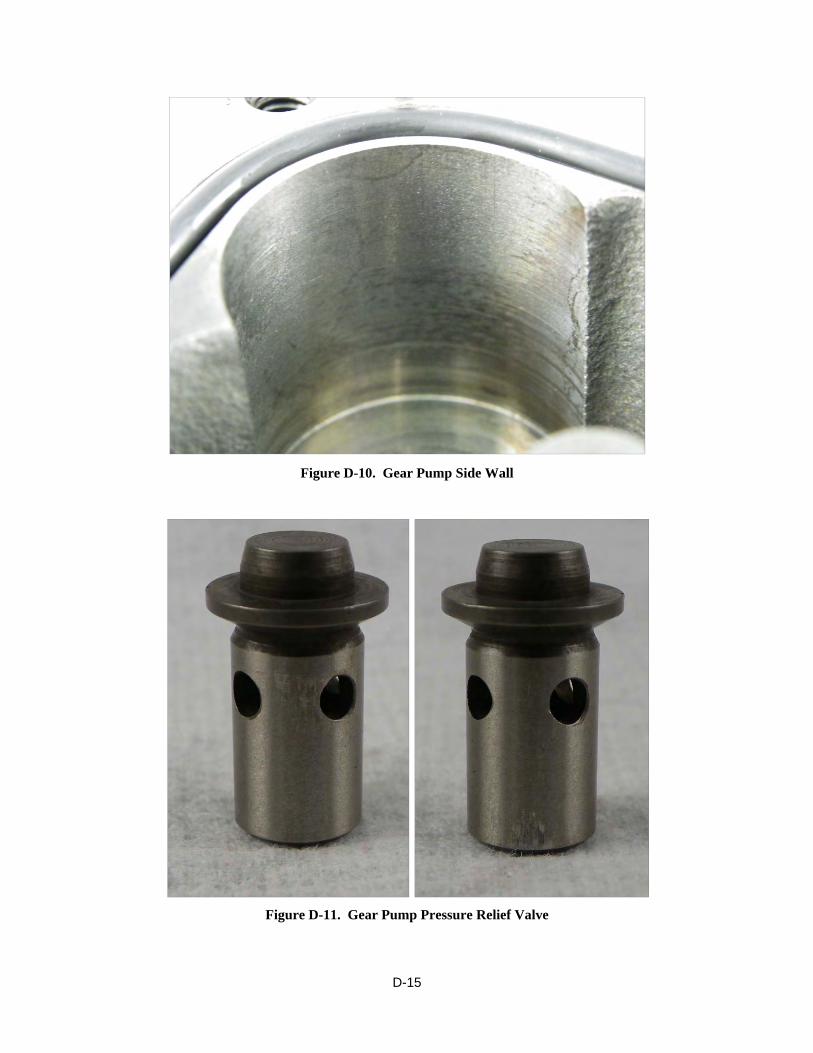
D-15
Figure D-10. Gear Pump Side Wall
Figure D-11. Gear Pump Pressure Relief Valve

D-16
Figure D-12. Pump Gears
Figure D-13. Gear Tooth Wear

D-17
Figure D-14. Gear Tooth Chipping
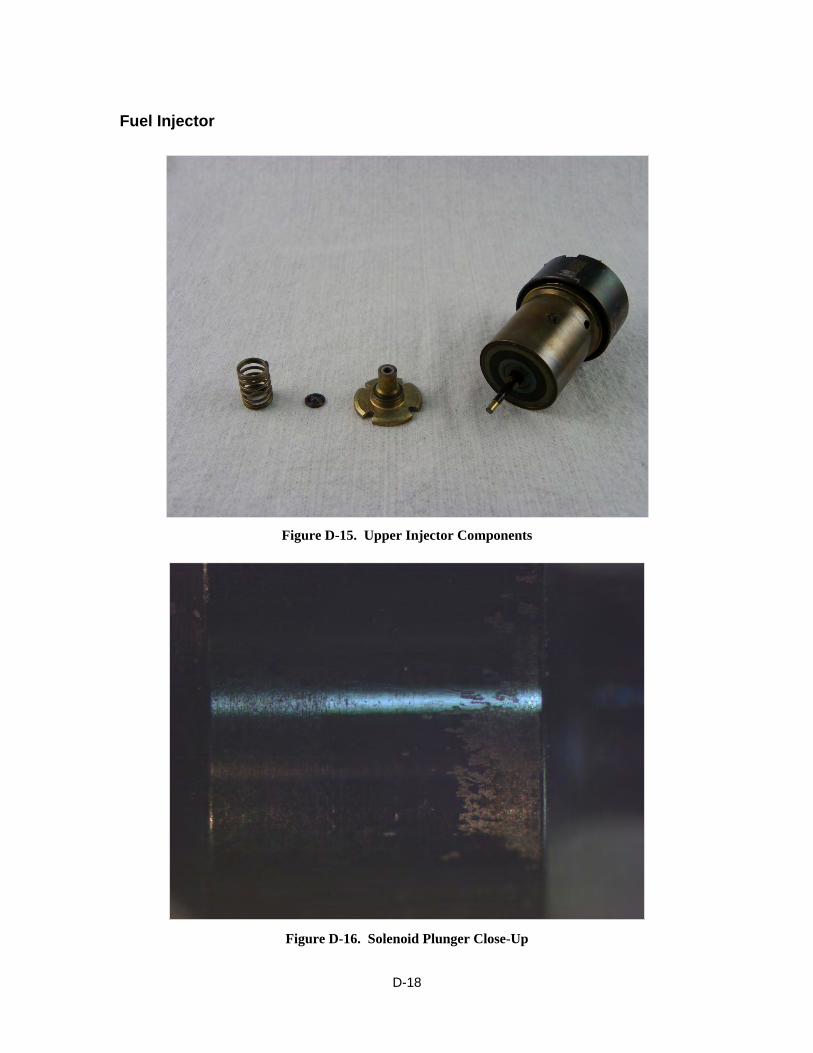
D-18
Fuel Injector
Figure D-15. Upper Injector Components
Figure D-16. Solenoid Plunger Close-Up
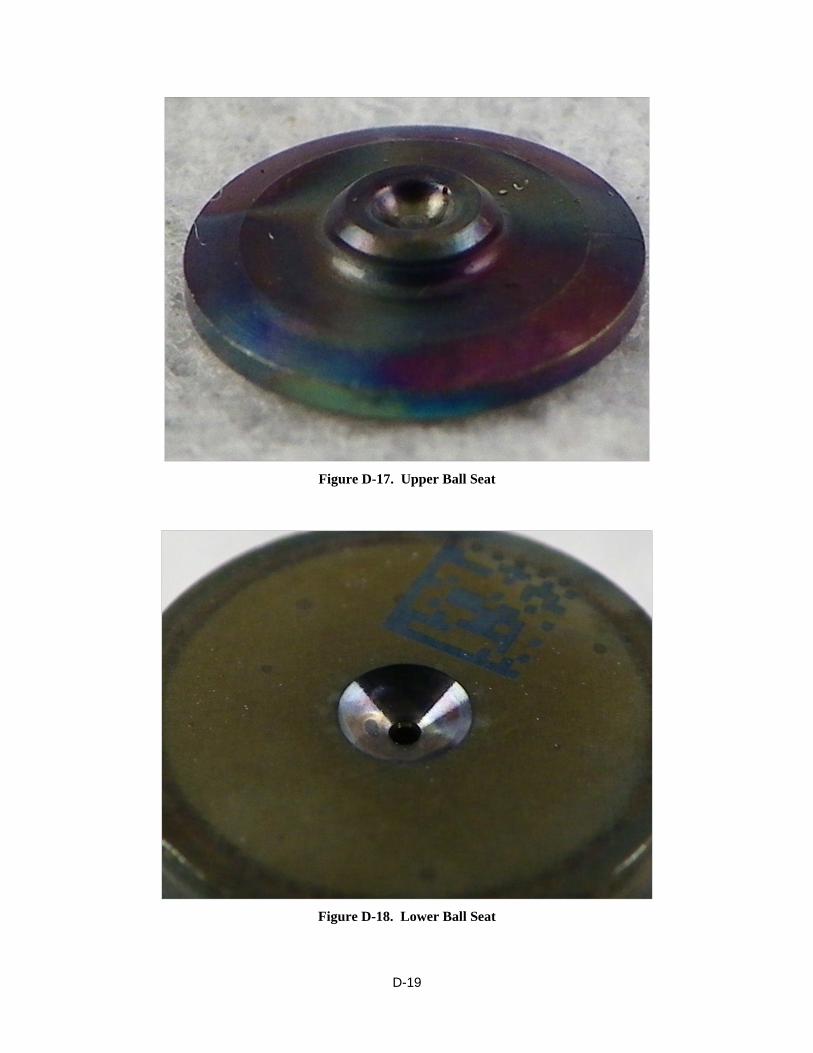
D-19
Figure D-17. Upper Ball Seat
Figure D-18. Lower Ball Seat

D-20
Figure D-19. Injector Needle
Figure D-20. Injector Needle Scuffing

D-21
Figure D-21. Injector Needle Tip

E-1
APPENDIX - E
Evaluation of High Pressure Common Rail Fuel System
Test Fuel: SPK with 22.5 ppm DCI-4A Test Number: ULSD-AF7469-60C-XPI

E-2
EVALUATION OF HIGH PRESSURE COMMON RAIL FUEL SYSTEM
Project 14734.04
Cummins XPI Fuel System
Test Fuel: SPK with 22.5 ppm DCI-4A
Test Number: SPK-AF7876-60C-XPI
Start of Test Date: March 28, 2011
End of Test Date: April 26, 2011
Test Duration: 400 Hours
Test Procedure: Simulated NATO Standard Engine Laboratory Test
Conducted for
U.S. Army TARDEC
Force Projection Technologies
Warren, Michigan

E-3
TABLE OF CONTENTS
Section Page LIST OF TABLES .............................................................................................................. 4 LIST OF FIGURES ............................................................................................................ 4 Introduction and Background ............................................................................................. 5 Test System ......................................................................................................................... 5 Test Stand Configuration .................................................................................................... 5 Test Cycle ........................................................................................................................... 6 System Operating Conditions ............................................................................................. 7 Fuel Analysis .................................................................................................................... 11 Component Wear .............................................................................................................. 12
Fuel Pump ..................................................................................................................... 12 Fuel Injector .................................................................................................................. 15

E-4
LIST OF TABLES
Table Page Table E-1. NATO Cycle for XPI Pump Stand .............................................................. 6 Table E-2. Summarized Operating Conditions ........................................................... 10
LIST OF FIGURES
Figure Page Figure E-1. XPI Stand Layout ........................................................................................ 6 Figure E-2. Fuel Rail Pressure ....................................................................................... 7 Figure E-3. Injected Fuel Flow ...................................................................................... 8 Figure E-4. Return Fuel Flow ........................................................................................ 8 Figure E-5. System Inlet Fuel Temperature ................................................................... 9 Figure E-6. Fuel Filter Pressure ..................................................................................... 9 Figure E-7. ASTM D5001 BOCLE ............................................................................. 11 Figure E-8. ASTM D6079 HFRR ................................................................................ 11 Figure E-9. Low Pressure Gear Pump Housing ........................................................... 12 Figure E-10. Gear Pump Housing Wear ........................................................................ 13 Figure E-11. Gear Pump Pressure Relief Valve ............................................................. 13 Figure E-12. Pump Gears ............................................................................................... 14 Figure E-13. Gear Tooth Wear ....................................................................................... 14 Figure E-14. Upper Injector Components ...................................................................... 15 Figure E-15. Solenoid Plunger ....................................................................................... 15 Figure E-16. Solenoid Plunger Close-Up....................................................................... 16 Figure E-17. Upper Ball Seat ......................................................................................... 16 Figure E-18. Lower Ball Seat ......................................................................................... 17 Figure E-19. Injector Needle .......................................................................................... 17 Figure E-20. Injector Needle Scuffing ........................................................................... 18 Figure E-21. Injector Needle Tip ................................................................................... 18
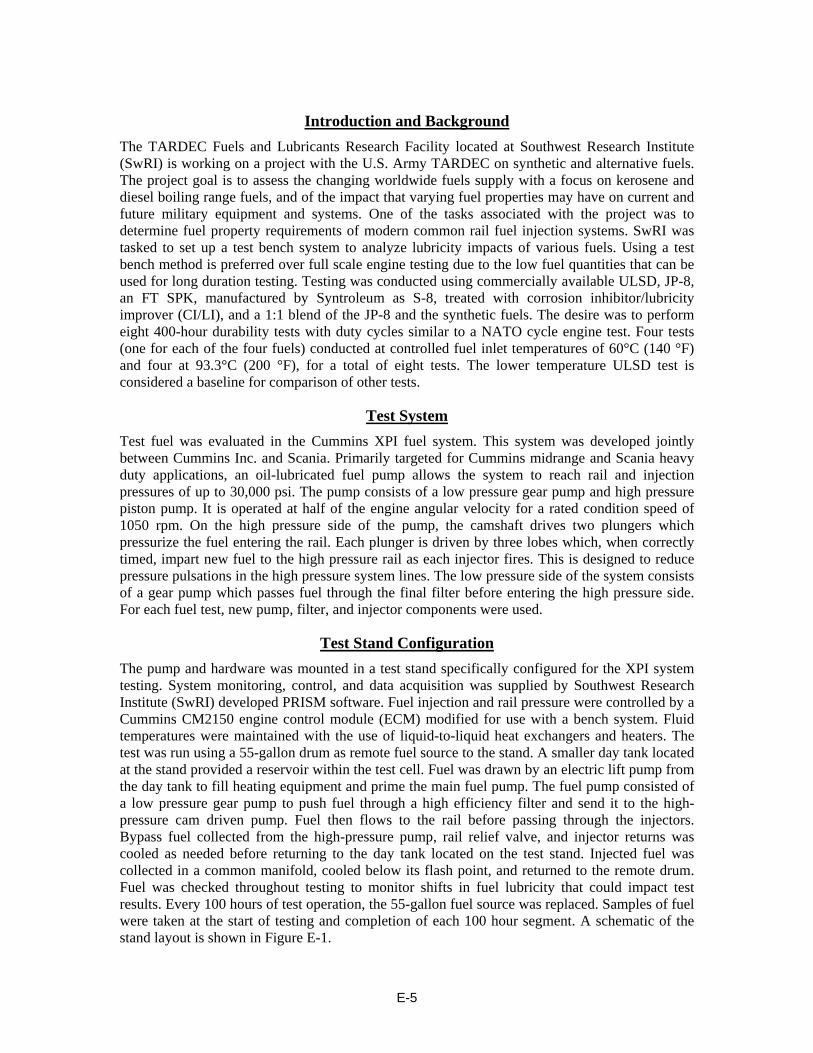
E-5
Introduction and Background
The TARDEC Fuels and Lubricants Research Facility located at Southwest Research Institute (SwRI) is working on a project with the U.S. Army TARDEC on synthetic and alternative fuels. The project goal is to assess the changing worldwide fuels supply with a focus on kerosene and diesel boiling range fuels, and of the impact that varying fuel properties may have on current and future military equipment and systems. One of the tasks associated with the project was to determine fuel property requirements of modern common rail fuel injection systems. SwRI was tasked to set up a test bench system to analyze lubricity impacts of various fuels. Using a test bench method is preferred over full scale engine testing due to the low fuel quantities that can be used for long duration testing. Testing was conducted using commercially available ULSD, JP-8, an FT SPK, manufactured by Syntroleum as S-8, treated with corrosion inhibitor/lubricity improver (CI/LI), and a 1:1 blend of the JP-8 and the synthetic fuels. The desire was to perform eight 400-hour durability tests with duty cycles similar to a NATO cycle engine test. Four tests (one for each of the four fuels) conducted at controlled fuel inlet temperatures of 60°C (140 °F) and four at 93.3°C (200 °F), for a total of eight tests. The lower temperature ULSD test is considered a baseline for comparison of other tests.
Test System
Test fuel was evaluated in the Cummins XPI fuel system. This system was developed jointly between Cummins Inc. and Scania. Primarily targeted for Cummins midrange and Scania heavy duty applications, an oil-lubricated fuel pump allows the system to reach rail and injection pressures of up to 30,000 psi. The pump consists of a low pressure gear pump and high pressure piston pump. It is operated at half of the engine angular velocity for a rated condition speed of 1050 rpm. On the high pressure side of the pump, the camshaft drives two plungers which pressurize the fuel entering the rail. Each plunger is driven by three lobes which, when correctly timed, impart new fuel to the high pressure rail as each injector fires. This is designed to reduce pressure pulsations in the high pressure system lines. The low pressure side of the system consists of a gear pump which passes fuel through the final filter before entering the high pressure side. For each fuel test, new pump, filter, and injector components were used.
Test Stand Configuration
The pump and hardware was mounted in a test stand specifically configured for the XPI system testing. System monitoring, control, and data acquisition was supplied by Southwest Research Institute (SwRI) developed PRISM software. Fuel injection and rail pressure were controlled by a Cummins CM2150 engine control module (ECM) modified for use with a bench system. Fluid temperatures were maintained with the use of liquid-to-liquid heat exchangers and heaters. The test was run using a 55-gallon drum as remote fuel source to the stand. A smaller day tank located at the stand provided a reservoir within the test cell. Fuel was drawn by an electric lift pump from the day tank to fill heating equipment and prime the main fuel pump. The fuel pump consisted of a low pressure gear pump to push fuel through a high efficiency filter and send it to the high-pressure cam driven pump. Fuel then flows to the rail before passing through the injectors. Bypass fuel collected from the high-pressure pump, rail relief valve, and injector returns was cooled as needed before returning to the day tank located on the test stand. Injected fuel was collected in a common manifold, cooled below its flash point, and returned to the remote drum. Fuel was checked throughout testing to monitor shifts in fuel lubricity that could impact test results. Every 100 hours of test operation, the 55-gallon fuel source was replaced. Samples of fuel were taken at the start of testing and completion of each 100 hour segment. A schematic of the stand layout is shown in Figure E-1.

E-6
Figure E-1. XPI Stand Layout
Test Cycle
The NATO Standard Engine Laboratory Test AEP-5, Edition 3 is a 400-hour test consisting of repeated 10-hour cycles. Each cycle has 10 operating modes which speed and load are controlled to. Since there is no torque feedback available when using the fuel system alone, “load” was determined based upon the accelerator pedal percentage input given to the ECM. The pump was motored at the speed which it would turn if mounted on an engine, in this case half that of the crankshaft. The operating modes for the cycle are shown in Table E-1.
Table E-1. NATO Cycle for XPI Pump Stand
Step Pump
Speed, RPM Throttle,
% Duration,
hrs
1 400 0 0.5
2 1050 100 2
3 1155 0 0.5
4 788 100 1
5* 400 to 1050 0 to 100 2
6 630 100 0.5
7 400 0 0.5
8 1081 70 0.5
9 650 100 2
10 650 50 0.5
*Step 5 cycles between idle and rated conditions
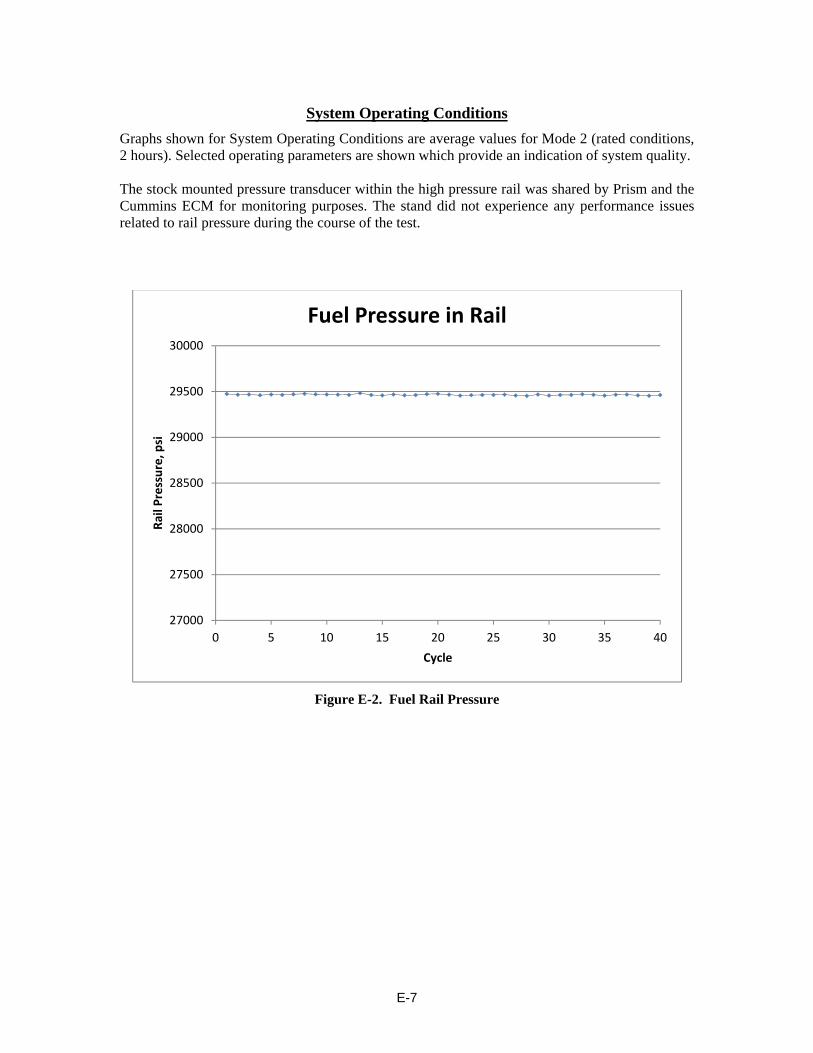
E-7
System Operating Conditions
Graphs shown for System Operating Conditions are average values for Mode 2 (rated conditions, 2 hours). Selected operating parameters are shown which provide an indication of system quality. The stock mounted pressure transducer within the high pressure rail was shared by Prism and the Cummins ECM for monitoring purposes. The stand did not experience any performance issues related to rail pressure during the course of the test.
Figure E-2. Fuel Rail Pressure
27000
27500
28000
28500
29000
29500
30000
0 5 10 15 20 25 30 35 40
Rail Pressure, p
si
Cycle
Fuel Pressure in Rail

E-8
Bypass and return fuel flow is the combined fuel from the high pressure pump relief valve, rail protection check valve, and injectors bypass/cooling flow. There is a reduction in flow over the test, possibly due to wear in the low pressure gear pump.
Figure E-3. Injected Fuel Flow
Figure E-4. Return Fuel Flow
1200
1250
1300
1350
1400
1450
1500
0 10 20 30 40
Injected Flow, m
L/min
Cycle
Fuel Flow Through Injectors
0
200
400
600
800
1000
1200
1400
0 5 10 15 20 25 30 35 40
Return Flow, m
L/min
Cycle
Bypass and Return Fuel Flow

E-9
Fuel filter inlet pressure is a measure of the pressure being developed by the gear pump portion of the XPI fuel pump. An internal bypass valve prevents undesired pressure building.
Figure E-5. System Inlet Fuel Temperature
Figure E-6. Fuel Filter Pressure
0
10
20
30
40
50
60
70
0 5 10 15 20 25 30 35 40
Inlet Temperature, D
eg C
Cycle
System Inlet Fuel Temperature
0
20
40
60
80
100
120
0 5 10 15 20 25 30 35 40
Filter Pressure, p
si
Cycle
Fuel Filter Inlet Pressure

E-10
Table E-2. Summarized Operating Conditions
Test Hours 0‐100
Mean Std. Dev. Min Max
System Inlet Temperature, deg C 59.8 1.5 55.4 63.4
Injected Fuel Temperature, deg C 161.7 5.5 129.2 168.2
Rail Pressure, psi 29468 69 29266 29666
Injected Flow Rate, mL/min 1443.3 23.3 1238.0 1517.9
Return Fuel Flow Rate, mL/min 1160.0 24.2 1063.2 1231.4
Fuel Filter Inlet Pressure, psi 111.5 1.2 107.8 114.7
Test Hours 100‐200
Mean Std. Dev. Min Max
System Inlet Temperature, deg C 60.0 1.4 56.8 63.8
Injected Fuel Temperature, deg C 161.6 5.3 132.6 167.1
Rail Pressure, psi 29466 72 29260 29698
Injected Flow Rate, mL/min 1442.4 31.1 1108.3 1544.9
Return Fuel Flow Rate, mL/min 1137.3 22.1 1056.1 1200.1
Fuel Filter Inlet Pressure, psi 111.3 1.2 107.3 115.7
Test Hours 200‐300
Mean Std. Dev. Min Max
System Inlet Temperature, deg C 60.0 1.4 48.3 62.9
Injected Fuel Temperature, deg C 160.8 6.2 97.9 167.0
Rail Pressure, psi 29461 71 29187 29693
Injected Flow Rate, mL/min 1437.9 29.0 1171.3 1556.2
Return Fuel Flow Rate, mL/min 1123.2 21.2 987.0 1177.1
Fuel Filter Inlet Pressure, psi 111.2 1.3 106.0 119.5
Test Hours 300‐400
Mean Std. Dev. Min Max
System Inlet Temperature, deg C 60.0 1.1 57.2 62.8
Injected Fuel Temperature, deg C 162.0 4.8 133.8 166.9
Rail Pressure, psi 29462 73 29271 29728
Injected Flow Rate, mL/min 1437.1 28.6 1157.1 1519.2
Return Fuel Flow Rate, mL/min 1113.1 18.3 1044.9 1161.2
Fuel Filter Inlet Pressure, psi 111.4 1.1 106.3 118.9

E-11
Fuel Analysis
Fuel was evaluated at the beginning of the test and the end of each 100 hours, when the supply drum was changed. Results from ASTM D5001 and D6079 are shown in Figures E-7 and E-8.
Figure E-7. ASTM D5001 BOCLE
Figure E-8. ASTM D6079 HFRR
0.4
0.45
0.5
0.55
0.6
0.65
0.7
0.75
Fresh Used
Wear Scar, m
m
60°C SPK XPI ‐ D5001 BOCLE
0‐100 Hours
100‐200 Hours
200‐300 Hours
300‐400 Hours
0.6
0.62
0.64
0.66
0.68
0.7
0.72
0.74
Fresh Used
Wear Scar, m
m
60°C SPK XPI ‐ D6079 HFRR
0‐100 Hours
100‐200 Hours
200‐300 Hours
300‐400 Hours

E-12
Component Wear
Post-test tear down of the pump and injectors was performed to evaluate typical wear operating on SPK. Only fuel wetted components are shown in the figures that follow.
Fuel Pump
Figure E-9. Low Pressure Gear Pump Housing

E-13
Figure E-10. Gear Pump Housing Wear
Figure E-11. Gear Pump Pressure Relief Valve

E-14
Figure E-12. Pump Gears
Figure E-13. Gear Tooth Wear

E-15
Fuel Injector
Figure E-14. Upper Injector Components
Figure E-15. Solenoid Plunger

E-16
Figure E-16. Solenoid Plunger Close-Up
Figure E-17. Upper Ball Seat

E-18
Figure E-18. Lower Ball Seat
Figure E-19. Injector Needle

E-19
Figure E-20. Injector Needle Scuffing
Figure E-21. Injector Needle Tip

F-1
APPENDIX - F
Evaluation of High Pressure Common Rail Fuel System
Test Fuel: SPK/JP-8 Blend
Test Number: Blend-AF7879-60C-XPI

F-2
EVALUATION OF HIGH PRESSURE COMMON RAIL FUEL SYSTEM
Project 14734.04
Cummins XPI Fuel System
Test Fuel: SPK/JP-8 Blend
Test Number: Blend-AF7879-60C-XPI
Start of Test Date: May 3, 2011
End of Test Date: June 17, 2011
Test Duration: 400 Hours
Test Procedure: Simulated NATO Standard Engine Laboratory Test
Conducted for
U.S. Army TARDEC
Force Projection Technologies
Warren, Michigan

F-3
TABLE OF CONTENTS
Section Page LIST OF TABLES .............................................................................................................. 4 LIST OF FIGURES ............................................................................................................ 4 Introduction and Background ............................................................................................. 5 Test System ......................................................................................................................... 5 Test Stand Configuration .................................................................................................... 5 Test Cycle ........................................................................................................................... 6 System Operating Conditions ............................................................................................. 7 Fuel Analysis .................................................................................................................... 11 Component Wear .............................................................................................................. 12
Fuel Pump ..................................................................................................................... 12 Fuel Injector .................................................................................................................. 15

F-4
LIST OF TABLES
Table Page Table F-1. NATO Cycle for XPI Pump Stand .............................................................. 6 Table F-2. Summarized Operating Conditions ........................................................... 10
LIST OF FIGURES
Figure Page Figure F-1. XPI Stand Layout ........................................................................................ 6 Figure F-2. Fuel Rail Pressure ....................................................................................... 7 Figure F-3. Injected Fuel Flow ...................................................................................... 8 Figure F-4. Return Fuel Flow ........................................................................................ 8 Figure F-5. System Inlet Fuel Temperature ................................................................... 9 Figure F-6. Fuel Filter Pressure ..................................................................................... 9 Figure F-7. ASTM D5001 BOCLE ............................................................................. 11 Figure F-8. ASTM D6079 HFRR ................................................................................ 11 Figure F-9. Low Pressure Gear Pump Housing ........................................................... 12 Figure F-10. Gear Pump Housing Wall ......................................................................... 13 Figure F-11. Gear Pump Pressure Relief Valve ............................................................. 13 Figure F-12. Pump Gears ............................................................................................... 14 Figure F-13. Gear Tooth Wear ....................................................................................... 14 Figure F-14. Upper Injector Components ...................................................................... 15 Figure F-15. Solenoid Plunger ....................................................................................... 15 Figure F-16. Solenoid Plunger Close-Up....................................................................... 16 Figure F-17. Upper Ball Seat ......................................................................................... 16 Figure F-18. Lower Ball Seat ......................................................................................... 17 Figure F-19. Injector Needle .......................................................................................... 17 Figure F-20. Injector Needle Scuffing ........................................................................... 18 Figure F-21. Injector Needle Tip ................................................................................... 18
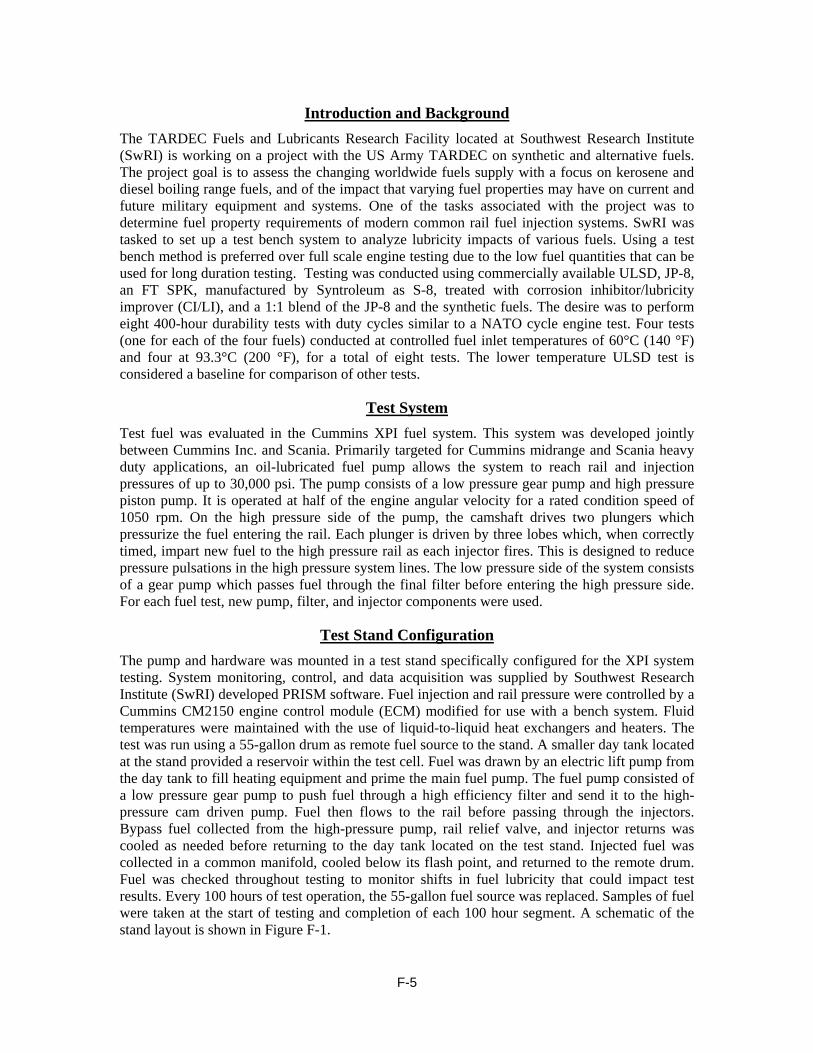
F-5
Introduction and Background
The TARDEC Fuels and Lubricants Research Facility located at Southwest Research Institute (SwRI) is working on a project with the US Army TARDEC on synthetic and alternative fuels. The project goal is to assess the changing worldwide fuels supply with a focus on kerosene and diesel boiling range fuels, and of the impact that varying fuel properties may have on current and future military equipment and systems. One of the tasks associated with the project was to determine fuel property requirements of modern common rail fuel injection systems. SwRI was tasked to set up a test bench system to analyze lubricity impacts of various fuels. Using a test bench method is preferred over full scale engine testing due to the low fuel quantities that can be used for long duration testing. Testing was conducted using commercially available ULSD, JP-8, an FT SPK, manufactured by Syntroleum as S-8, treated with corrosion inhibitor/lubricity improver (CI/LI), and a 1:1 blend of the JP-8 and the synthetic fuels. The desire was to perform eight 400-hour durability tests with duty cycles similar to a NATO cycle engine test. Four tests (one for each of the four fuels) conducted at controlled fuel inlet temperatures of 60°C (140 °F) and four at 93.3°C (200 °F), for a total of eight tests. The lower temperature ULSD test is considered a baseline for comparison of other tests.
Test System
Test fuel was evaluated in the Cummins XPI fuel system. This system was developed jointly between Cummins Inc. and Scania. Primarily targeted for Cummins midrange and Scania heavy duty applications, an oil-lubricated fuel pump allows the system to reach rail and injection pressures of up to 30,000 psi. The pump consists of a low pressure gear pump and high pressure piston pump. It is operated at half of the engine angular velocity for a rated condition speed of 1050 rpm. On the high pressure side of the pump, the camshaft drives two plungers which pressurize the fuel entering the rail. Each plunger is driven by three lobes which, when correctly timed, impart new fuel to the high pressure rail as each injector fires. This is designed to reduce pressure pulsations in the high pressure system lines. The low pressure side of the system consists of a gear pump which passes fuel through the final filter before entering the high pressure side. For each fuel test, new pump, filter, and injector components were used.
Test Stand Configuration
The pump and hardware was mounted in a test stand specifically configured for the XPI system testing. System monitoring, control, and data acquisition was supplied by Southwest Research Institute (SwRI) developed PRISM software. Fuel injection and rail pressure were controlled by a Cummins CM2150 engine control module (ECM) modified for use with a bench system. Fluid temperatures were maintained with the use of liquid-to-liquid heat exchangers and heaters. The test was run using a 55-gallon drum as remote fuel source to the stand. A smaller day tank located at the stand provided a reservoir within the test cell. Fuel was drawn by an electric lift pump from the day tank to fill heating equipment and prime the main fuel pump. The fuel pump consisted of a low pressure gear pump to push fuel through a high efficiency filter and send it to the high-pressure cam driven pump. Fuel then flows to the rail before passing through the injectors. Bypass fuel collected from the high-pressure pump, rail relief valve, and injector returns was cooled as needed before returning to the day tank located on the test stand. Injected fuel was collected in a common manifold, cooled below its flash point, and returned to the remote drum. Fuel was checked throughout testing to monitor shifts in fuel lubricity that could impact test results. Every 100 hours of test operation, the 55-gallon fuel source was replaced. Samples of fuel were taken at the start of testing and completion of each 100 hour segment. A schematic of the stand layout is shown in Figure F-1.
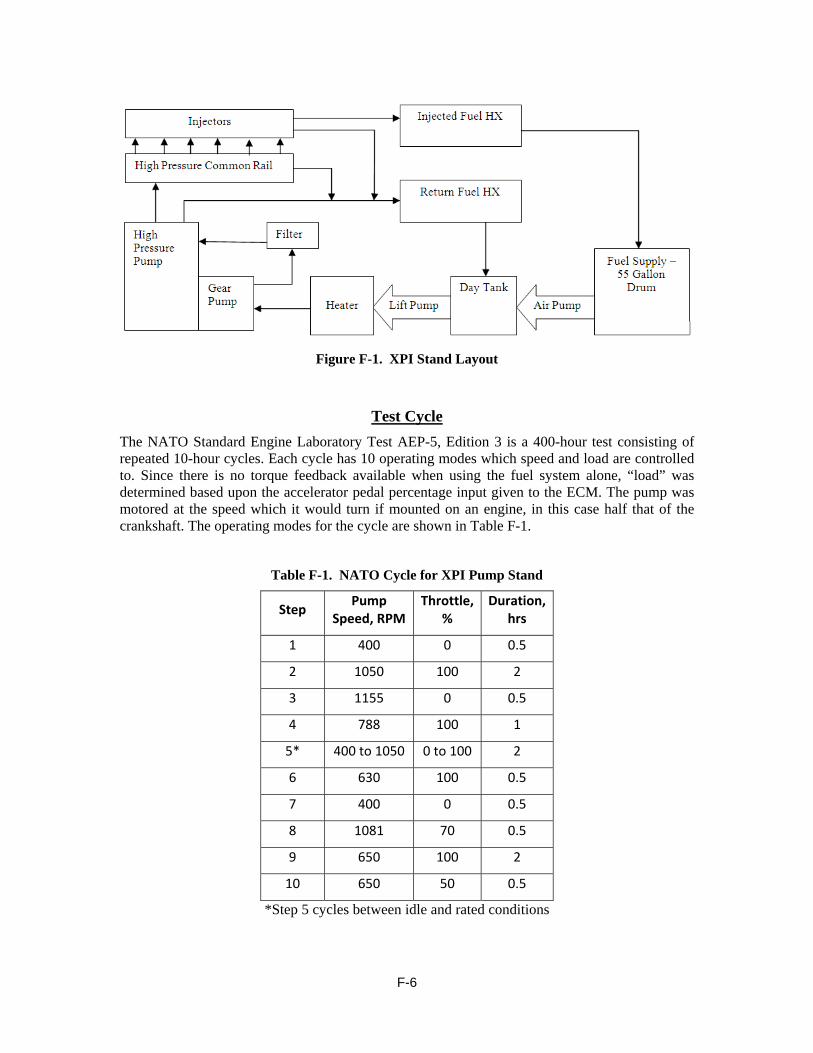
F-6
Figure F-1. XPI Stand Layout
Test Cycle
The NATO Standard Engine Laboratory Test AEP-5, Edition 3 is a 400-hour test consisting of repeated 10-hour cycles. Each cycle has 10 operating modes which speed and load are controlled to. Since there is no torque feedback available when using the fuel system alone, “load” was determined based upon the accelerator pedal percentage input given to the ECM. The pump was motored at the speed which it would turn if mounted on an engine, in this case half that of the crankshaft. The operating modes for the cycle are shown in Table F-1.
Table F-1. NATO Cycle for XPI Pump Stand
Step Pump
Speed, RPM Throttle,
% Duration,
hrs
1 400 0 0.5
2 1050 100 2
3 1155 0 0.5
4 788 100 1
5* 400 to 1050 0 to 100 2
6 630 100 0.5
7 400 0 0.5
8 1081 70 0.5
9 650 100 2
10 650 50 0.5
*Step 5 cycles between idle and rated conditions

F-7
System Operating Conditions
Graphs shown for System Operating Conditions are average values for Mode 2 (rated conditions, 2 hours). Selected operating parameters are shown which provide an indication of system quality. The stock mounted pressure transducer within the high pressure rail was shared by Prism and the Cummins ECM for monitoring purposes. The stand did not experience any performance issues related to rail pressure during the course of the test.
Figure F-2. Fuel Rail Pressure
27000
27500
28000
28500
29000
29500
30000
0 5 10 15 20 25 30 35 40
Rail Pressure, p
si
Cycle
Fuel Pressure in Rail

F-8
Bypass and return fuel flow is the combined fuel from the high pressure pump relief valve, rail protection check valve, and injector’s bypass/cooling flow.
Figure F-3. Injected Fuel Flow
Figure F-4. Return Fuel Flow
1200
1250
1300
1350
1400
1450
1500
0 5 10 15 20 25 30 35 40
Injected Flow, m
L/min
Cycle
Fuel Flow Through Injectors
0
200
400
600
800
1000
1200
1400
0 5 10 15 20 25 30 35 40
Return Flow, m
L/min
Cycle
Bypass and Return Fuel Flow

F-9
Fuel filter inlet pressure is a measure of the pressure being developed by the gear pump portion of the XPI fuel pump. An internal bypass valve prevents undesired pressure building.
Figure F-5. System Inlet Fuel Temperature
Figure F-6. Fuel Filter Pressure
0
10
20
30
40
50
60
70
0 5 10 15 20 25 30 35 40
Inlet Temperature, D
eg C
Cycle
System Inlet Fuel Temperature
0
20
40
60
80
100
120
0 5 10 15 20 25 30 35 40
Filter Pressure, p
si
Cycle
Fuel Filter Inlet Pressure

F-10
Table F-2. Summarized Operating Conditions
Test Hours 0‐100
Mean Std. Dev. Min Max
System Inlet Temperature, deg C 60.8 3.7 23.7 82.6
Injected Fuel Temperature, deg C 160.3 9.2 87.1 170.2
Rail Pressure, psi 29470 125 28356 30719
Injected Flow Rate, mL/min 1435.7 33.8 1120.0 1528.7
Return Fuel Flow Rate, mL/min 1132.8 37.7 968.7 1254.4
Fuel Filter Inlet Pressure, psi 107.2 2.4 64.7 113.7
Test Hours 100‐200
Mean Std. Dev. Min Max
System Inlet Temperature, deg C 60.0 1.2 50.9 63.7
Injected Fuel Temperature, deg C 161.3 6.1 99.7 167.2
Rail Pressure, psi 29462 121 28765 30188
Injected Flow Rate, mL/min 1438.5 21.9 1272.3 1517.7
Return Fuel Flow Rate, mL/min 1110.2 28.3 977.0 1250.3
Fuel Filter Inlet Pressure, psi 106.2 0.7 94.1 108.4
Test Hours 200‐300
Mean Std. Dev. Min Max
System Inlet Temperature, deg C 60.0 1.0 56.7 63.6
Injected Fuel Temperature, deg C 163.5 4.8 135.6 168.5
Rail Pressure, psi 29470 167 26168 30024
Injected Flow Rate, mL/min 1442.8 15.7 1360.5 1518.6
Return Fuel Flow Rate, mL/min 1107.6 23.4 1020.1 1234.4
Fuel Filter Inlet Pressure, psi 105.4 1.3 72.3 111.6
Test Hours 300‐400
Mean Std. Dev. Min Max
System Inlet Temperature, deg C 60.0 0.9 57.2 63.2
Injected Fuel Temperature, deg C 162.9 5.3 134.6 168.8
Rail Pressure, psi 29467 141 28830 30560
Injected Flow Rate, mL/min 1438.2 13.3 1368.9 1502.4
Return Fuel Flow Rate, mL/min 1097.3 24.3 1024.2 1204.3
Fuel Filter Inlet Pressure, psi 105.3 1.1 80.9 108.2

F-11
Fuel Analysis
Fuel was evaluated at the beginning of the test and the end of each 100 hours, when the supply drum was changed. Results from ASTM D5001 and D6079 are shown in Figures F-7 and F-8. It should be noted that a number of results overlap each other.
Figure F-7. ASTM D5001 BOCLE
Figure F-8. ASTM D6079 HFRR
0.4
0.45
0.5
0.55
0.6
0.65
0.7
0.75
Wear Scar, m
m
60°C Blend XPI ‐ D5001 BOCLE
0‐100 Hours
100‐200 Hours
200‐300 Hours
300‐400 Hours
0.62
0.64
0.66
0.68
0.7
0.72
0.74
0.76
0.78
Wear Scar, m
m
60°C Blend XPI ‐ D6079 HFRR
0‐100 Hours
100‐200 Hours
200‐300 Hours
300‐400 Hours
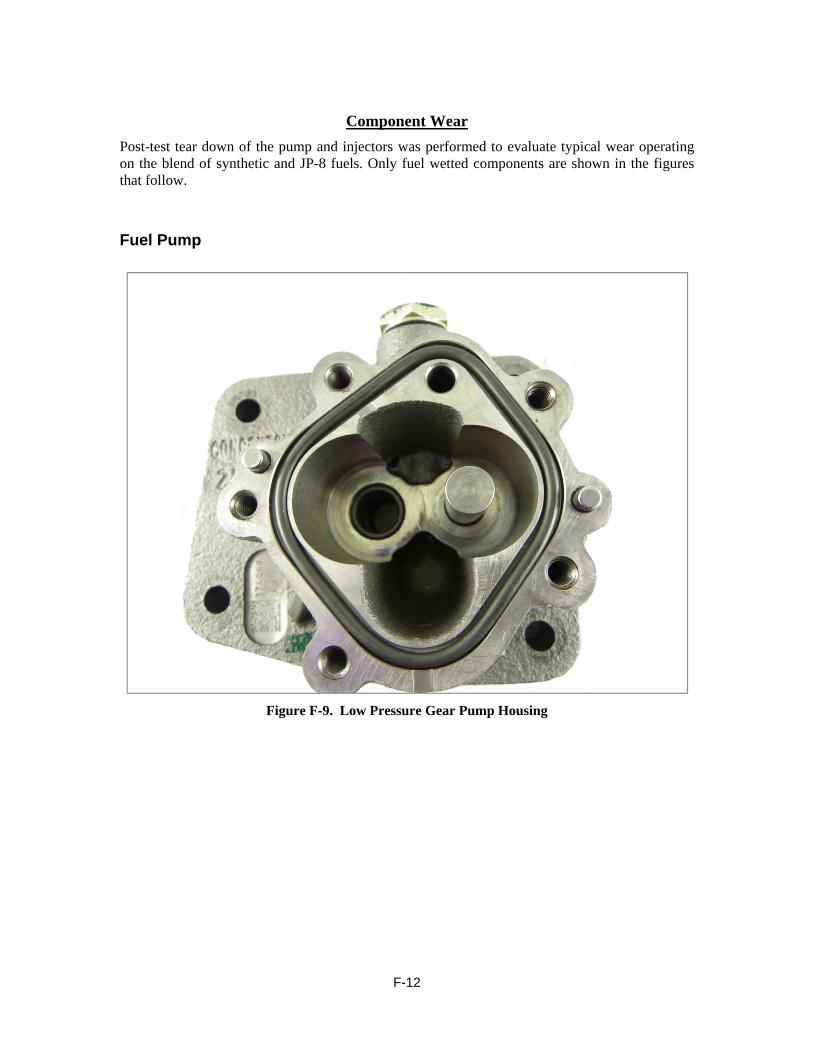
F-12
Component Wear
Post-test tear down of the pump and injectors was performed to evaluate typical wear operating on the blend of synthetic and JP-8 fuels. Only fuel wetted components are shown in the figures that follow.
Fuel Pump
Figure F-9. Low Pressure Gear Pump Housing

F-13
Figure F-10. Gear Pump Housing Wall
Figure F-11. Gear Pump Pressure Relief Valve

F-14
Figure F-12. Pump Gears
Figure F-13. Gear Tooth Wear

F-15
Fuel Injector
Figure F-14. Upper Injector Components
Figure F-15. Solenoid Plunger

F-16
Figure F-16. Solenoid Plunger Close-Up
Figure F-17. Upper Ball Seat

F-17
Figure F-18. Lower Ball Seat
Figure F-19. Injector Needle

F-18
Figure F-20. Injector Needle Scuffing
Figure F-21. Injector Needle Tip

G-1
APPENDIX - G
Evaluation of High Pressure Common Rail Fuel System
Test Fuel: SPK/JP-8 Blend
Test Number: Blend-AF7879-93C-XPI

G-2
EVALUATION OF HIGH PRESSURE COMMON RAIL FUEL SYSTEM
Project 14734.04
Cummins XPI Fuel System
Test Fuel: SPK/JP-8 Blend
Test Number: Blend-AF7879-93C-XPI
Start of Test Date: June 24, 2011
End of Test Date: July 25, 2011
Test Duration: 400 Hours
Test Procedure:
Simulated NATO Standard Engine Laboratory Test
Conducted for
U.S. Army TARDEC
Force Projection Technologies
Warren, Michigan

G-3
TABLE OF CONTENTS
Section Page LIST OF TABLES .............................................................................................................. 4 LIST OF FIGURES ............................................................................................................ 4 Introduction and Background ............................................................................................. 5 Test System ......................................................................................................................... 5 Test Stand Configuration .................................................................................................... 5 Test Cycle ........................................................................................................................... 6 System Operating Conditions ............................................................................................. 7 Fuel Analysis .................................................................................................................... 11 Component Wear .............................................................................................................. 12
Fuel Pump ..................................................................................................................... 12 Fuel Injector .................................................................................................................. 16

G-4
LIST OF TABLES
Table Page Table G-1. NATO Cycle for XPI Pump Stand .............................................................. 6 Table G-2. Summarized Operating Conditions ........................................................... 10
LIST OF FIGURES
Figure Page Figure G-1. XPI Stand Layout ........................................................................................ 6 Figure G-2. Fuel Rail Pressure ....................................................................................... 7 Figure G-3. Injected Fuel Flow ...................................................................................... 8 Figure G-4. Return Fuel Flow ........................................................................................ 8 Figure G-5. System Inlet Fuel Temperature ................................................................... 9 Figure G-6. Fuel Filter Pressure ..................................................................................... 9 Figure G-7. ASTM D5001 BOCLE ............................................................................. 11 Figure G-8. ASTM D6079 HFRR ................................................................................ 11 Figure G-9. Low Pressure Gear Pump Housing ........................................................... 12 Figure G-10. Gear Pump Side ........................................................................................ 13 Figure G-11. Gear Pump Housing Wall ......................................................................... 13 Figure G-12. Gear Pump Pressure Relief Valve ............................................................. 14 Figure G-13. Pump Gears ............................................................................................... 14 Figure G-14. Gear Tooth Wear ....................................................................................... 15 Figure G-15. Upper Injector Components ...................................................................... 16 Figure G-16. Solenoid Plungers ..................................................................................... 16 Figure G-17. Solenoid Plunger Close-Up....................................................................... 17 Figure G-18. Upper Ball Seat ......................................................................................... 17 Figure G-19. Lower Ball Seat ......................................................................................... 18 Figure G-20. Injector Needle .......................................................................................... 18 Figure G-21. Injector Needle Scuffing ........................................................................... 19 Figure G-22. Injector Needle Tip ................................................................................... 19

G-5
Introduction and Background
The TARDEC Fuels and Lubricants Research Facility located at Southwest Research Institute (SwRI) is working on a project with the U.S. Army TARDEC on synthetic and alternative fuels. The project goal is to assess the changing worldwide fuels supply with a focus on kerosene and diesel boiling range fuels, and of the impact that varying fuel properties may have on current and future military equipment and systems. One of the tasks associated with the project was to determine fuel property requirements of modern common rail fuel injection systems. SwRI was tasked to set up a test bench system to analyze lubricity impacts of various fuels. Using a test bench method is preferred over full scale engine testing due to the low fuel quantities that can be used for long duration testing. Testing was conducted using commercially available ULSD, JP-8, an FT SPK, manufactured by Syntroleum as S-8, treated with corrosion inhibitor/lubricity improver (CI/LI), and a 1:1 blend of the JP-8 and the synthetic fuels. The desire was to perform eight 400-hour durability tests with duty cycles similar to a NATO cycle engine test. Four tests (one for each of the four fuels) conducted at controlled fuel inlet temperatures of 60°C (140 °F) and four at 93.3°C (200 °F), for a total of eight tests. The lower temperature ULSD test is considered a baseline for comparison of other tests.
Test System
Test fuel was evaluated in the Cummins XPI fuel system. This system was developed jointly between Cummins Inc. and Scania. Primarily targeted for Cummins midrange and Scania heavy duty applications, an oil-lubricated fuel pump allows the system to reach rail and injection pressures of up to 30,000 psi. The pump consists of a low pressure gear pump and high pressure piston pump. It is operated at half of the engine angular velocity for a rated condition speed of 1050 rpm. On the high pressure side of the pump, the camshaft drives two plungers which pressurize the fuel entering the rail. Each plunger is driven by three lobes which, when correctly timed, impart new fuel to the high pressure rail as each injector fires. This is designed to reduce pressure pulsations in the high pressure system lines. The low pressure side of the system consists of a gear pump which passes fuel through the final filter before entering the high pressure side. For each fuel test, new pump, filter, and injector components were used.
Test Stand Configuration
The pump and hardware was mounted in a test stand specifically configured for the XPI system testing. System monitoring, control, and data acquisition was supplied by Southwest Research Institute (SwRI) developed PRISM software. Fuel injection and rail pressure were controlled by a Cummins CM2150 engine control module (ECM) modified for use with a bench system. Fluid temperatures were maintained with the use of liquid-to-liquid heat exchangers and heaters. The test was run using a 55-gallon drum as remote fuel source to the stand. A smaller day tank located at the stand provided a reservoir within the test cell. Fuel was drawn by an electric lift pump from the day tank to fill heating equipment and prime the main fuel pump. The fuel pump consisted of a low pressure gear pump to push fuel through a high efficiency filter and send it to the high-pressure cam driven pump. Fuel then flows to the rail before passing through the injectors. Bypass fuel collected from the high-pressure pump, rail relief valve, and injector returns was cooled as needed before returning to the day tank located on the test stand. Injected fuel was collected in a common manifold, cooled below its flash point, and returned to the remote drum. Fuel was checked throughout testing to monitor shifts in fuel lubricity that could impact test results. Every 100 hours of test operation, the 55-gallon fuel source was replaced. Samples of fuel were taken at the start of testing and completion of each 100 hour segment. A schematic of the stand layout is shown in Figure G-1.

G-6
Figure G-1. XPI Stand Layout
Test Cycle
The NATO Standard Engine Laboratory Test AEP-5, Edition 3 is a 400-hour test consisting of repeated 10-hour cycles. Each cycle has 10 operating modes which speed and load are controlled to. Since there is no torque feedback available when using the fuel system alone, “load” was determined based upon the accelerator pedal percentage input given to the ECM. The pump was motored at the speed which it would turn if mounted on an engine, in this case half that of the crankshaft. The operating modes for the cycle are shown in Table 1
Table G-1. NATO Cycle for XPI Pump Stand
Step Pump
Speed, RPM Throttle,
% Duration,
hrs
1 400 0 0.5
2 1050 100 2
3 1155 0 0.5
4 788 100 1
5* 400 to 1050 0 to 100 2
6 630 100 0.5
7 400 0 0.5
8 1081 70 0.5
9 650 100 2
10 650 50 0.5
*Step 5 cycles between idle and rated conditions

G-7
System Operating Conditions
Graphs shown for System Operating Conditions are average values for Mode 2 (rated conditions, 2 hours). Selected operating parameters are shown which provide an indication of system quality.
The stock mounted pressure transducer within the high pressure rail was shared by Prism and the Cummins ECM for monitoring purposes. The stand did not experience any performance issues related to rail pressure during the course of the test.
Figure G-2. Fuel Rail Pressure
27000
27500
28000
28500
29000
29500
30000
0 5 10 15 20 25 30 35 40
Rail Pressure, p
si
Cycle
Fuel Pressure in Rail
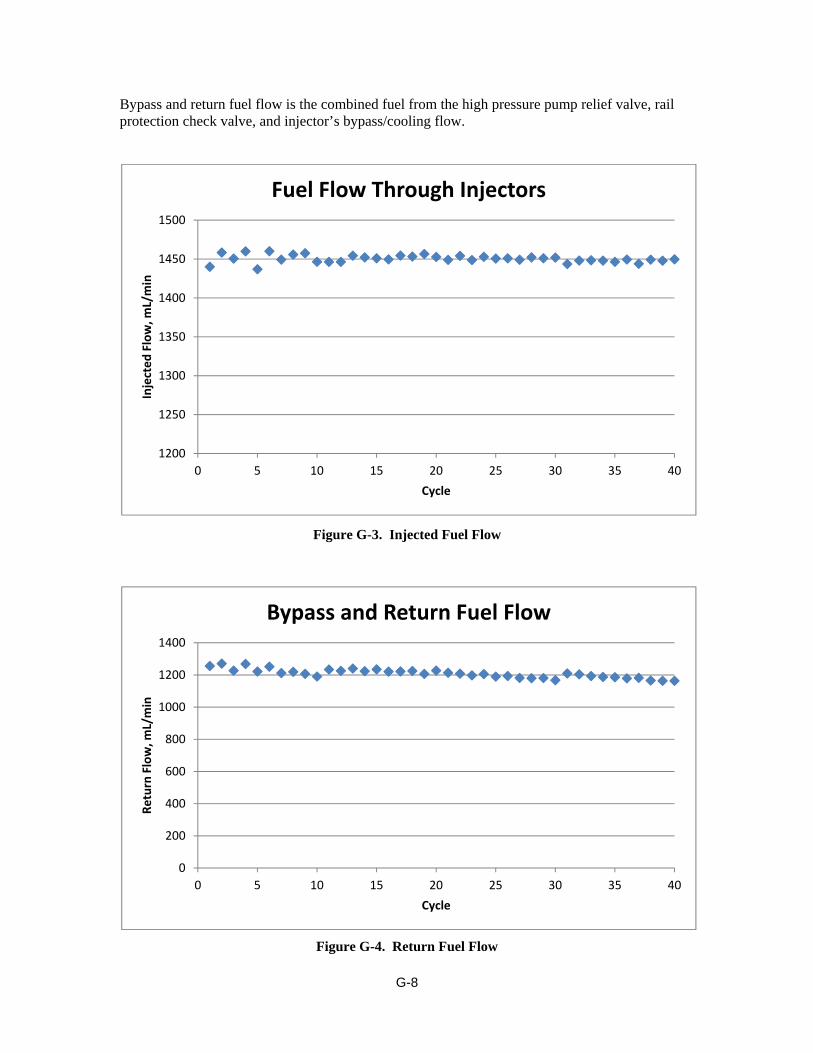
G-8
Bypass and return fuel flow is the combined fuel from the high pressure pump relief valve, rail protection check valve, and injector’s bypass/cooling flow.
Figure G-3. Injected Fuel Flow
Figure G-4. Return Fuel Flow
1200
1250
1300
1350
1400
1450
1500
0 5 10 15 20 25 30 35 40
Injected Flow, m
L/min
Cycle
Fuel Flow Through Injectors
0
200
400
600
800
1000
1200
1400
0 5 10 15 20 25 30 35 40
Return Flow, m
L/min
Cycle
Bypass and Return Fuel Flow

G-9
Fuel filter inlet pressure is a measure of the pressure being developed by the gear pump portion of the XPI fuel pump. An internal bypass valve prevents undesired pressure building.
Figure G-5. System Inlet Fuel Temperature
Figure G-6. Fuel Filter Pressure
0
10
20
30
40
50
60
70
80
90
100
0 5 10 15 20 25 30 35 40
Inlet Temperature, D
eg C
Cycle
System Inlet Fuel Temperature
0
20
40
60
80
100
120
0 5 10 15 20 25 30 35 40
Filter Pressure, p
si
Cycle
Fuel Filter Inlet Pressure

G-10
Table G-2. Summarized Operating Conditions
Test Hours 0‐100
Mean Std. Dev. Min Max
System Inlet Temperature, deg C 88.0 2.9 79.6 95.9
Injected Fuel Temperature, deg C 183.4 7.6 121.9 192.9
Rail Pressure, psi 29482 201 28952 30137
Injected Flow Rate, mL/min 1451.3 20.3 1266.7 1501.9
Return Fuel Flow Rate, mL/min 1231.2 35.8 1018.3 1306.4
Fuel Filter Inlet Pressure, psi 108.3 1.4 106.1 114.5
Test Hours 100‐200
Mean Std. Dev. Min Max
System Inlet Temperature, deg C 87.8 2.6 76.0 96.2
Injected Fuel Temperature, deg C 183.3 6.7 123.7 190.7
Rail Pressure, psi 29484 190 28994 30126
Injected Flow Rate, mL/min 1451.5 24.0 1249.4 1545.8
Return Fuel Flow Rate, mL/min 1224.8 24.5 1113.3 1286.3
Fuel Filter Inlet Pressure, psi 107.4 0.6 105.9 109.9
Test Hours 200‐300
Mean Std. Dev. Min Max
System Inlet Temperature, deg C 87.9 2.3 83.2 96.4
Injected Fuel Temperature, deg C 183.2 5.5 148.7 189.2
Rail Pressure, psi 29486 174 29041 30166
Injected Flow Rate, mL/min 1451.0 22.5 1283.9 1509.4
Return Fuel Flow Rate, mL/min 1191.1 20.3 1098.6 1259.7
Fuel Filter Inlet Pressure, psi 107.4 0.5 106.0 109.2
Test Hours 300‐400
Mean Std. Dev. Min Max
System Inlet Temperature, deg C 87.8 2.4 82.4 96.2
Injected Fuel Temperature, deg C 182.5 5.8 145.6 189.9
Rail Pressure, psi 29478 165 29058 30091
Injected Flow Rate, mL/min 1447.5 22.3 1249.1 1497.6
Return Fuel Flow Rate, mL/min 1182.7 21.7 1063.8 1254.4
Fuel Filter Inlet Pressure, psi 107.2 0.5 105.7 108.8

G-11
Fuel Analysis
Fuel was evaluated at the beginning of the test and the end of each 100 hours, when the supply drum was changed. Results from ASTM D5001 and D6079 are shown in Figures G-7 and G-8.
Figure G-7. ASTM D5001 BOCLE
Figure G-8. ASTM D6079 HFRR
0.5
0.55
0.6
0.65
0.7
0.75
Wear Scar, m
m
93.3°C Blend XPI ‐ D5001 BOCLE
0‐100 Hours
100‐200 Hours
200‐300 Hours
300‐400 Hours
0.6
0.62
0.64
0.66
0.68
0.7
0.72
0.74
0.76
0.78
0.8
Wear Scar, m
m
93.3°C Blend XPI ‐ D6079 HFRR
0‐100 Hours
100‐200 Hours
200‐300 Hours
300‐400 Hours

G-12
Component Wear
Post-test tear down of the pump and injectors was performed to evaluate typical wear operating on the blend of synthetic and JP-8 fuels. Only fuel wetted components are shown in the figures that follow.
Fuel Pump
Figure G-9. Low Pressure Gear Pump Housing

G-13
Figure G-10. Gear Pump Side
Figure G-11. Gear Pump Housing Wall

G-14
Figure G-12. Gear Pump Pressure Relief Valve
Figure G-13. Pump Gears

G-15
Figure G-14. Gear Tooth Wear

G-16
Fuel Injector
Figure G-15. Upper Injector Components
Figure G-16. Solenoid Plungers

G-17
Figure G-17. Solenoid Plunger Close-Up
Figure G-18. Upper Ball Seat

G-18
Figure G-19. Lower Ball Seat
Figure G-20. Injector Needle
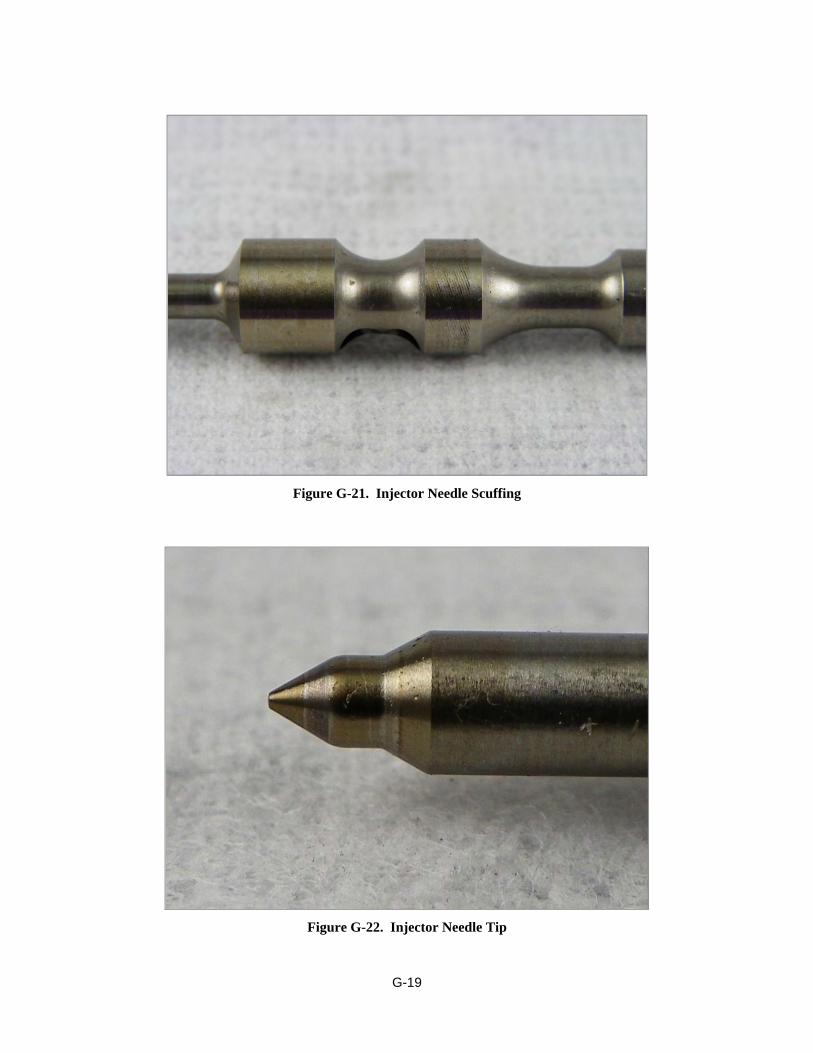
G-19
Figure G-21. Injector Needle Scuffing
Figure G-22. Injector Needle Tip

H-1
APPENDIX - H
Evaluation of High Pressure Common Rail Fuel System
Test Fuel: Jet-A
Test Number: Jet-A-AF7090-60C-XPI

H-2
EVALUATION OF HIGH PRESSURE COMMON RAIL FUEL SYSTEM
Project 14734.04
Cummins XPI Fuel System
Test Fuel: Jet-A
Test Number: Jet-A-AF7090-60C-XPI
Start of Test Date: September 20, 2011
End of Test Date: October 18, 2011
Test Duration: 400 Hours
Test Procedure: Simulated NATO Standard Engine Laboratory Test
Conducted for
U.S. Army TARDEC
Force Projection Technologies
Warren, Michigan

H-3
TABLE OF CONTENTS
Section Page LIST OF TABLES .............................................................................................................. 4 LIST OF FIGURES ............................................................................................................ 4 Introduction and Background ............................................................................................. 5 Test System ......................................................................................................................... 5 Test Stand Configuration .................................................................................................... 5 Test Cycle ........................................................................................................................... 6 System Operating Conditions ............................................................................................. 7 Fuel Analysis .................................................................................................................... 11 Component Wear .............................................................................................................. 12
Fuel Pump ..................................................................................................................... 12 Fuel Injector .................................................................................................................. 15

H-4
LIST OF TABLES
Table Page Table H-1. NATO Cycle for XPI Pump Stand .............................................................. 6 Table H-2. Summarized Operating Conditions ........................................................... 10
LIST OF FIGURES
Figure Page Figure H-1. XPI Stand Layout ........................................................................................ 6 Figure H-2. Fuel Rail Pressure ....................................................................................... 7 Figure H-4. Injected Fuel Flow ...................................................................................... 8 Figure H-5. Return Fuel Flow ........................................................................................ 8 Figure H-6. System Inlet Fuel Temperature ................................................................... 9 Figure H-7. Fuel Filter Pressure ..................................................................................... 9 Figure H-8. ASTM D5001 BOCLE ............................................................................. 11 Figure H-9. ASTM D6079 HFRR ................................................................................ 11 Figure H-10. Low Pressure Gear Pump Housing ........................................................... 12 Figure H-11. Gear Pump Side Wall ................................................................................ 13 Figure H-12. Gear Pump Pressure Relief Valve ............................................................. 13 Figure H-13. Pump Gears ............................................................................................... 14 Figure H-14. Gear Tooth Wear ....................................................................................... 14 Figure H-15. Upper Injector Components ...................................................................... 15 Figure H-16. Upper Ball Seat ......................................................................................... 16 Figure H-17. Lower Ball Seat ......................................................................................... 16 Figure H-18. Injector Needle Scuffing ........................................................................... 17 Figure H-19. Injector Needle Tip ................................................................................... 17

H-5
Introduction and Background
The TARDEC Fuels and Lubricants Research Facility located at Southwest Research Institute (SwRI) is working on a project with the U.S. Army TARDEC on synthetic and alternative fuels. The project goal is to assess the changing worldwide fuels supply with a focus on kerosene and diesel boiling range fuels, and of the impact that varying fuel properties may have on current and future military equipment and systems. One of the tasks associated with the project was to determine fuel property requirements of modern common rail fuel injection systems. SwRI was tasked to set up a test bench system to analyze lubricity impacts of various fuels. Using a test bench method is preferred over full scale engine testing due to the low fuel quantities that can be used for long duration testing. Testing was conducted using commercially available ULSD, JP-8, an FT SPK, manufactured by Syntroleum as S-8, treated with corrosion inhibitor/lubricity improver (CI/LI), and a 1:1 blend of the JP-8 and the synthetic fuels. The desire was to perform eight 400-hour durability tests with duty cycles similar to a NATO cycle engine test. Four tests (one for each of the four fuels) conducted at controlled fuel inlet temperatures of 60°C (140 °F) and up to four at 93.3°C (200 °F), for a total of eight tests. The lower temperature ULSD test is considered a baseline for comparison of other tests. As the project progressed, it was determined that the 93.3°C ULSD and full synthetic tests would be replaced with 60°C evaluations of Jet-A and the synthetic fuel without any lubricity improver.
Test System
Test fuel was evaluated in the Cummins XPI fuel system. This system was developed jointly between Cummins Inc. and Scania. Primarily targeted for Cummins midrange and Scania heavy duty applications, an oil-lubricated fuel pump allows the system to reach rail and injection pressures of up to 30,000 psi. The pump consists of a low pressure gear pump and high pressure piston pump. It is operated at half of the engine angular velocity for a rated condition speed of 1050 rpm. On the high pressure side of the pump, the camshaft drives two plungers which pressurize the fuel entering the rail. Each plunger is driven by three lobes which, when correctly timed, impart new fuel to the high pressure rail as each injector fires. This is designed to reduce pressure pulsations in the high pressure system lines. The low pressure side of the system consists of a gear pump which passes fuel through the final filter before entering the high pressure side. For each fuel test, new pump, filter, and injector components were used.
Test Stand Configuration
The pump and hardware was mounted in a test stand specifically configured for the XPI system testing. System monitoring, control, and data acquisition was supplied by Southwest Research Institute (SwRI) developed PRISM software. Fuel injection and rail pressure were controlled by a Cummins CM2150 engine control module (ECM) modified for use with a bench system. Fluid temperatures were maintained with the use of liquid-to-liquid heat exchangers and heaters. The test was run using a 55-gallon drum as remote fuel source to the stand. A smaller day tank located at the stand provided a reservoir within the test cell. Fuel was drawn by an electric lift pump from the day tank to fill heating equipment and prime the main fuel pump. The fuel pump consisted of a low pressure gear pump to push fuel through a high efficiency filter and send it to the high-pressure cam driven pump. Fuel then flows to the rail before passing through the injectors. Bypass fuel collected from the high-pressure pump, rail relief valve, and injector returns was cooled as needed before returning to the day tank located on the test stand. Injected fuel was collected in a common manifold, cooled below its flash point, and returned to the remote drum. Fuel was checked throughout testing to monitor shifts in fuel lubricity that could impact test results. Every 100 hours of test operation, the 55-gallon fuel source was replaced. Samples of fuel

H-6
were taken at the start of testing and completion of each 100 hour segment. A schematic of the stand layout is shown in Figure H-1.
Figure H-1. XPI Stand Layout
Test Cycle
The NATO Standard Engine Laboratory Test AEP-5, Edition 3 is a 400-hour test consisting of repeated 10-hour cycles. Each cycle has 10 operating modes which speed and load are controlled to. Since there is no torque feedback available when using the fuel system alone, “load” was determined based upon the accelerator pedal percentage input given to the ECM. The pump was motored at the speed which it would turn if mounted on an engine, in this case half that of the crankshaft. The operating modes for the cycle are shown in Table H-1.
Table H-1. NATO Cycle for XPI Pump Stand
Step Pump
Speed, RPM Throttle,
% Duration,
hrs
1 400 0 0.5
2 1050 100 2
3 1155 0 0.5
4 788 100 1
5* 400 to 1050 0 to 100 2
6 630 100 0.5
7 400 0 0.5
8 1081 70 0.5
9 650 100 2
10 650 50 0.5
*Step 5 cycles between idle and rated conditions

H-7
System Operating Conditions
Graphs shown for System Operating Conditions are average values for Mode 2 (rated conditions, 2 hours). Selected operating parameters are shown which provide an indication of system quality.
The stock mounted pressure transducer within the high pressure rail was shared by Prism and the Cummins ECM for monitoring purposes. At the start of the test, the high pressure rail and supply line from the pump were replaced. Between Cycles 26 and 27 it was found that a small shard of metal from the fabrication process of the high pressure line was blocking the inlet port to the rail and increasing the required output from the pump. Once the shard was removed, the rail pressure returned to the value experience during all other testing. It should be noted that the shift in pressure was around 450psi, or 1.5% of the total rail pressure.
Figure H-2. Fuel Rail Pressure
27000
27500
28000
28500
29000
29500
30000
30500
31000
0 5 10 15 20 25 30 35 40
Rail Pressure, p
si
Cycle
Fuel Pressure in Rail
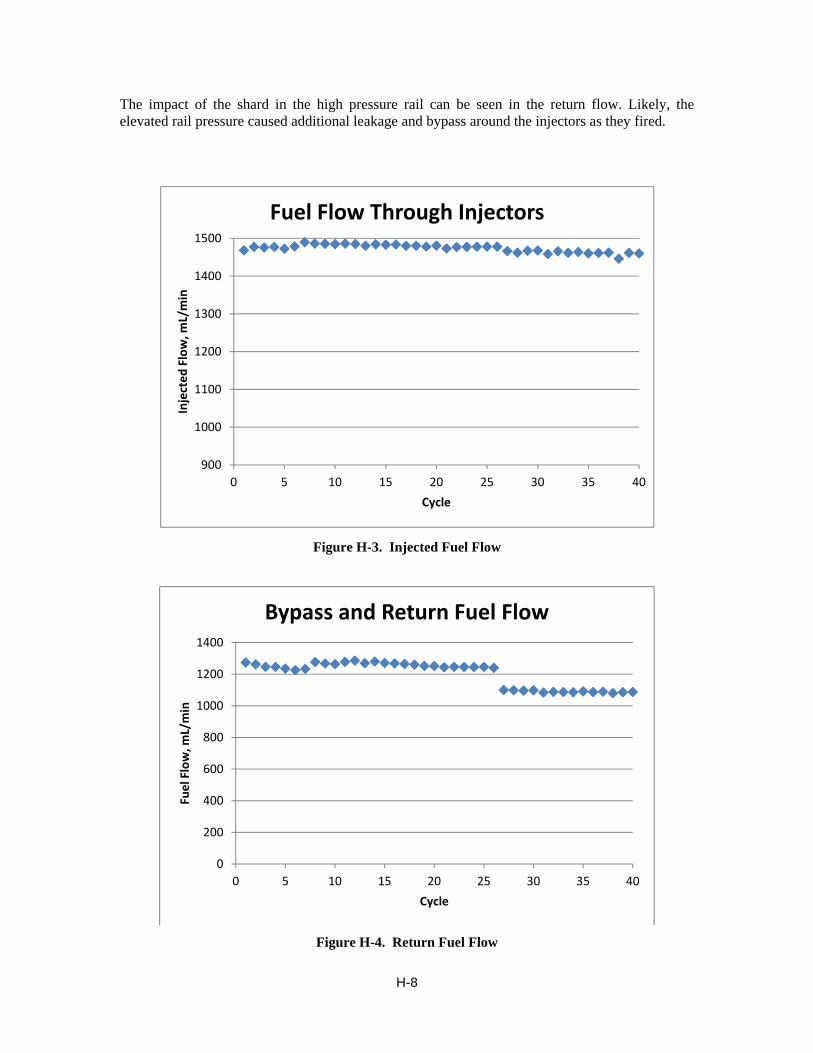
H-8
The impact of the shard in the high pressure rail can be seen in the return flow. Likely, the elevated rail pressure caused additional leakage and bypass around the injectors as they fired.
Figure H-3. Injected Fuel Flow
Figure H-4. Return Fuel Flow
900
1000
1100
1200
1300
1400
1500
0 5 10 15 20 25 30 35 40
Injected Flow, m
L/min
Cycle
Fuel Flow Through Injectors
0
200
400
600
800
1000
1200
1400
0 5 10 15 20 25 30 35 40
Fuel Flow, m
L/min
Cycle
Bypass and Return Fuel Flow

H-9
Fuel filter inlet pressure is a measure of the pressure being developed by the gear pump portion of the XPI fuel pump.
Figure H-5. System Inlet Fuel Temperature
Figure H-6. Fuel Filter Pressure
0
10
20
30
40
50
60
70
0 5 10 15 20 25 30 35 40
Inlet Temperature, D
eg C
Cycle
System Inlet Fuel Temperature
0
20
40
60
80
100
120
0 5 10 15 20 25 30 35 40
Filter Inlet Pressure, p
si
Cycle
Fuel Filter Inlet Pressure

H-10
Table H-2. Summarized Operating Conditions
Test Hours 0‐100
Mean Std. Dev. Min Max
System Inlet Temperature, deg C 60.0 0.7 57.4 62.8
Injected Fuel Temperature, deg C 173.5 6.0 139.4 180.2
Rail Pressure, psi 29911.8 117.8 29431.8 30259.3
Injected Flow Rate, mL/min 1479.8 21.6 1304.6 1510.5
Return Fuel Flow Rate, mL/min 1252.1 24.2 1133.3 1307.1
Fuel Filter Inlet Pressure, psi 112.5 0.9 109.7 115.7
Test Hours 100‐200
Mean Std. Dev. Min Max
System Inlet Temperature, deg C 60.0 0.9 56.1 63.4
Injected Fuel Temperature, deg C 174.7 6.5 117.9 180.5
Rail Pressure, psi 29931.5 221.2 23579.4 30215.3
Injected Flow Rate, mL/min 1482.3 14.5 1393.7 1522.2
Return Fuel Flow Rate, mL/min 1267.1 25.9 912.5 1338.8
Fuel Filter Inlet Pressure, psi 110.5 1.5 68.9 112.9
Test Hours 200‐300
Mean Std. Dev. Min Max
System Inlet Temperature, deg C 60.0 1.0 57.5 64.0
Injected Fuel Temperature, deg C 170.4 7.2 133.4 179.2
Rail Pressure, psi 29735.5 277.0 29078.1 30464.0
Injected Flow Rate, mL/min 1472.5 14.5 1395.4 1506.5
Return Fuel Flow Rate, mL/min 1185.2 74.1 1031.7 1297.7
Fuel Filter Inlet Pressure, psi 110.1 0.9 104.0 115.6
Test Hours 300‐400
Mean Std. Dev. Min Max
System Inlet Temperature, deg C 60.0 1.0 55.7 64.0
Injected Fuel Temperature, deg C 164.1 6.3 96.0 170.4
Rail Pressure, psi 29434.6 128.8 28970.7 29837.3
Injected Flow Rate, mL/min 1460.0 16.2 1362.5 1497.3
Return Fuel Flow Rate, mL/min 1086.4 18.9 991.8 1135.1
Fuel Filter Inlet Pressure, psi 110.4 0.7 103.2 114.4

H-11
Fuel Analysis
Fuel was evaluated at the beginning of the test and the end of each 100 hours, when the supply drum was changed. Results from ASTM D5001 and D6079 are shown in Figures H-7 and H-8. Pre and post test fuel analysis did not indicate any unusually large changes in lubricity.
Figure H-7. ASTM D5001 BOCLE The results from the last 200 hours of the Jet-A test were identical, resulting in the overlay of the lines in the figure above. This is also true for the first 200 hours of HFRR results shown below.
Figure H-8. ASTM D6079 HFRR
0.8
0.805
0.81
0.815
0.82
0.825
0.83
0.835
Fresh Used
Wear Scar, m
m
60°C Jet‐A XPI ‐ D5001 BOCLE
0‐100 Hours
100‐200 Hours
200‐300 hours
300‐400 Hours
0.68
0.7
0.72
0.74
0.76
0.78
0.8
0.82
0.84
0.86
0.88
Fresh Used
Wear Scar, m
m
60°C Jet‐A XPI ‐ D6079 HFRR
0‐100 Hours
100‐200 Hours
200‐300 Hours
300‐400 Hours

H-12
Component Wear
Post-test tear down of the pump and injectors was performed to evaluate typical wear operating on Jet-A. Only fuel wetted components are shown in the figures that follow.
Fuel Pump
Figure H-9. Low Pressure Gear Pump Housing

H-13
Figure H-10. Gear Pump Side Wall
Figure H-11. Gear Pump Pressure Relief Valve

H-14
Figure H-12. Pump Gears
Figure H-13. Gear Tooth Wear

H-15
Fuel Injector
Figure H-14. Upper Injector Components

H-16
Figure H-15. Upper Ball Seat
Figure H-16. Lower Ball Seat

H-17
Figure H-17. Injector Needle Scuffing
Figure H-18. Injector Needle Tip

I-1
APPENDIX - I
Evaluation of High Pressure Common Rail Fuel System
Test Fuel: SPK (no additive)
Test Number: NeatSPK-60C-XPI

I-2
EVALUATION OF HIGH PRESSURE COMMON RAIL FUEL SYSTEM
Project 14734.04
Cummins XPI Fuel System
Test Fuel: SPK (no additive)
Test Number: NeatSPK-60C-XPI
Start of Test Date: October 27, 2011
End of Test Date: November 22, 2011
Test Duration: 400 Hours
Test Procedure: Simulated NATO Standard Engine Laboratory Test
Conducted for
U.S. Army TARDEC
Force Projection Technologies
Warren, Michigan

I-3
TABLE OF CONTENTS
Section Page LIST OF TABLES 4 LIST OF FIGURES 4 Introduction and Background 5 Test System 5 Test Stand Configuration 5 Test Cycle 7 System Operating Conditions 8 Fuel Analysis 12 Component Wear 13
Fuel Pump 13 Fuel Injector 16

I-4
LIST OF TABLES
Table Page Table I-1. NATO Cycle for XPI Pump Stand .............................................................. 7 Table I-2. Summarized Operating Conditions ........................................................... 11
LIST OF FIGURES
Figure Page Figure I-1. XPI Stand Layout ........................................................................................ 6 Figure I-2. Fuel Rail Pressure ....................................................................................... 8 Figure I-3. Injected Fuel Flow ...................................................................................... 9 Figure I-4. Return Fuel Flow ........................................................................................ 9 Figure I-5. System Inlet Fuel Temperature ................................................................. 10 Figure I-6. Fuel Filter Pressure ................................................................................... 10 Figure I-7. ASTM D5001 BOCLE ............................................................................. 12 Figure I-8. ASTM D6079 HFRR ................................................................................ 12 Figure I-9. Low Pressure Gear Pump Housing ........................................................... 13 Figure I-10. Gear Pump Side Wall ................................................................................ 14 Figure I-11. Gear Pump Pressure Relief Valve ............................................................. 14 Figure I-12. Pump Gears ............................................................................................... 15 Figure I-13. Gear Tooth Wear ....................................................................................... 15 Figure I-14. Upper Injector Components ...................................................................... 16 Figure I-15. Upper Ball Seat ......................................................................................... 17 Figure I-16. Lower Ball Seat ......................................................................................... 17 Figure I-17. Injector Needle Scuffing ........................................................................... 18 Figure I-18. Injector Needle Tip ................................................................................... 18

I-5
Introduction and Background
The TARDEC Fuels and Lubricants Research Facility located at Southwest Research Institute (SwRI) is working on a project with the U.S. Army TARDEC on synthetic and alternative fuels. The project goal is to assess the changing worldwide fuels supply with a focus on kerosene and diesel boiling range fuels, and of the impact that varying fuel properties may have on current and future military equipment and systems. One of the tasks associated with the project was to determine fuel property requirements of modern common rail fuel injection systems. SwRI was tasked to set up a test bench system to analyze lubricity impacts of various fuels. Using a test bench method is preferred over full scale engine testing due to the low fuel quantities that can be used for long duration testing. Testing was conducted using commercially available ULSD, JP-8, an FT SPK, manufactured by Syntroleum as S-8, treated with corrosion inhibitor/lubricity improver (CI/LI), and a 1:1 blend of the JP-8 and the synthetic fuels. The desire was to perform eight 400-hour durability tests with duty cycles similar to a NATO cycle engine test. Four tests (one for each of the four fuels) conducted at controlled fuel inlet temperatures of 60°C (140 °F) and up to four at 93.3°C (200 °F), for a total of eight tests. The lower temperature ULSD test is considered a baseline for comparison of other tests. As the project progressed, it was determined that the 93.3°C ULSD and full synthetic tests would be replaced with 60°C evaluations of Jet-A and the synthetic fuel without any lubricity improver.
Test System
Test fuel was evaluated in the Cummins XPI fuel system. This system was developed jointly between Cummins Inc. and Scania. Primarily targeted for Cummins midrange and Scania heavy duty applications, an oil-lubricated fuel pump allows the system to reach rail and injection pressures of up to 30,000 psi. The pump consists of a low pressure gear pump and high pressure piston pump. It is operated at half of the engine angular velocity for a rated condition speed of 1050 rpm. On the high pressure side of the pump, the camshaft drives two plungers which pressurize the fuel entering the rail. Each plunger is driven by three lobes which, when correctly timed, impart new fuel to the high pressure rail as each injector fires. This is designed to reduce pressure pulsations in the high pressure system lines. The low pressure side of the system consists of a gear pump which passes fuel through the final filter before entering the high pressure side. For each fuel test, new pump, filter, and injector components were used.
Test Stand Configuration
The pump and hardware was mounted in a test stand specifically configured for the XPI system testing. System monitoring, control, and data acquisition was supplied by Southwest Research Institute (SwRI) developed PRISM software. Fuel injection and rail pressure were controlled by a Cummins CM2150 engine control module (ECM) modified for use with a bench system. Fluid temperatures were maintained with the use of liquid-to-liquid heat exchangers and heaters. The test was run using a 55-gallon drum as remote fuel source to the stand. A smaller day tank located at the stand provided a reservoir within the test cell. Fuel was drawn by an electric lift pump from the day tank to fill heating equipment and prime the main fuel pump. The fuel pump consisted of a low pressure gear pump to push fuel through a high efficiency filter and send it to the high-pressure cam driven pump. Fuel then flows to the rail before passing through the injectors. Bypass fuel collected from the high-pressure pump, rail relief valve, and injector returns was cooled as needed before returning to the day tank located on the test stand. Injected fuel was collected in a common manifold, cooled below its flash point, and returned to the remote drum. Fuel was checked throughout testing to monitor shifts in fuel lubricity that could impact test results. Every 100 hours of test operation, the 55-gallon fuel source was replaced. Samples of fuel

I-6
were taken at the start of testing and completion of each 100 hour segment. A schematic of the stand layout is shown in Figure I-1.
Figure I-1. XPI Stand Layout

I-7
Test Cycle
The NATO Standard Engine Laboratory Test AEP-5, Edition 3 is a 400-hour test consisting of repeated 10-hour cycles. Each cycle has 10 operating modes which speed and load are controlled to. Since there is no torque feedback available when using the fuel system alone, “load” was determined based upon the accelerator pedal percentage input given to the ECM. The pump was motored at the speed which it would turn if mounted on an engine, in this case half that of the crankshaft. The operating modes for the cycle are shown in Table I-1.
Table I-1. NATO Cycle for XPI Pump Stand
Step Pump
Speed, RPM Throttle,
% Duration,
hrs
1 400 0 0.5
2 1050 100 2
3 1155 0 0.5
4 788 100 1
5* 400 to 1050 0 to 100 2
6 630 100 0.5
7 400 0 0.5
8 1081 70 0.5
9 650 100 2
10 650 50 0.5
*Step 5 cycles between idle and rated conditions

I-8
System Operating Conditions
Graphs shown for System Operating Conditions are average values for Mode 2 (rated conditions, 2 hours). Selected operating parameters are shown which provide an indication of system quality.
The stock mounted pressure transducer within the high pressure rail was shared by Prism and the Cummins ECM for monitoring purposes.
Figure I-2. Fuel Rail Pressure
27000
27500
28000
28500
29000
29500
30000
0 5 10 15 20 25 30 35 40
Rail Pressure, p
si
Cycle
Fuel Pressure in Rail

I-9
Figure I-3. Injected Fuel Flow
Figure I-4. Return Fuel Flow
0
200
400
600
800
1000
1200
1400
1600
0 5 10 15 20 25 30 35 40
Injected Flow, m
L/min
Cycle
Fuel Flow Through Injectors
0
200
400
600
800
1000
1200
0 5 10 15 20 25 30 35 40
Fuel Flow, m
L/min
Cycle
Bypass and Return Fuel Flow

I-10
Figure I-5. System Inlet Fuel Temperature
Fuel filter inlet pressure is a measure of the pressure being developed by the gear pump portion of the XPI fuel pump.
Figure I-6. Fuel Filter Pressure
0
10
20
30
40
50
60
70
0 5 10 15 20 25 30 35 40
Inlet Temperature Deg C
Cycle
System Inlet Fuel Temperature
0
20
40
60
80
100
120
0 5 10 15 20 25 30 35 40
Inlet Pressure, p
si
Cycle
Fuel Filter Inlet Pressure

I-11
Table I-2. Summarized Operating Conditions
Test Hours 0‐100
Mean Std. Dev. Min Max
System Inlet Temperature, deg C 59.9 1.3 46.8 63.3
Injected Fuel Temperature, deg C 161.6 6.1 103.9 168.3
Rail Pressure, psi 29439.8 272.1 28413.0 30181.6
Injected Flow Rate, mL/min 1501.4 22.9 1342.7 1547.2
Return Fuel Flow Rate, mL/min 1072.6 24.2 976.5 1143.3
Fuel Filter Inlet Pressure, psi 107.7 1.0 100.4 110.9
Test Hours 100‐200
Mean Std. Dev. Min Max
System Inlet Temperature, deg C 59.9 1.2 56.4 64.1
Injected Fuel Temperature, deg C 160.5 5.0 128.6 166.3
Rail Pressure, psi 29449.2 232.9 28643.6 30108.7
Injected Flow Rate, mL/min 1494.9 16.5 1438.3 1530.9
Return Fuel Flow Rate, mL/min 1054.9 19.8 997.7 1103.3
Fuel Filter Inlet Pressure, psi 105.8 1.0 96.9 108.9
Test Hours 200‐300
Mean Std. Dev. Min Max
System Inlet Temperature, deg C 59.9 1.1 56.7 64.6
Injected Fuel Temperature, deg C 160.2 5.2 127.7 167.4
Rail Pressure, psi 29440.8 202.8 28836.5 30119.7
Injected Flow Rate, mL/min 1491.1 15.8 1445.5 1532.4
Return Fuel Flow Rate, mL/min 1047.4 18.5 978.9 1098.1
Fuel Filter Inlet Pressure, psi 105.5 0.7 100.7 107.9
Test Hours 300‐400
Mean Std. Dev. Min Max
System Inlet Temperature, deg C 60.0 1.0 57.2 64.5
Injected Fuel Temperature, deg C 160.9 5.1 127.8 166.8
Rail Pressure, psi 29449.4 205.5 28501.6 29974.6
Injected Flow Rate, mL/min 1503.2 16.0 1445.9 1535.8
Return Fuel Flow Rate, mL/min 1051.5 19.7 987.7 1098.6
Fuel Filter Inlet Pressure, psi 104.2 1.0 90.2 108.4

I-12
Fuel Analysis
Fuel was evaluated at the beginning of the test and the end of each 100 hours, when the supply drum was changed. Results from ASTM D5001 and D6079 are shown in Figures I-7 and I-8. Since each drum was clay treated separately, there are four distinct “Fresh” sample values. Pre and post test fuel analysis did not indicate any unusually large changes in lubricity.
Figure I-7. ASTM D5001 BOCLE
Figure I-8. ASTM D6079 HFRR
0.4
0.5
0.6
0.7
0.8
0.9
1
1.1
Fresh Used
Wear Scar, m
m
60°C Neat SPK XPI ‐ D50001 BOCLE
0‐100 Hours
100‐200 Hours
200‐300 Hours
300‐400 Hours
0
0.1
0.2
0.3
0.4
0.5
0.6
0.7
0.8
0.9
Fresh Used
Wear Scar, m
m
60° Neat SPK XPI ‐ D6079 HRFF
0‐100 Hours
100‐200 Hours
200‐300 Hours
300‐400 Hours

I-13
Component Wear
Post-test tear down of the pump and injectors was performed to evaluate typical wear operating on unadditized SPK. Only fuel wetted components are shown in the figures that follow.
Fuel Pump
Figure I-9. Low Pressure Gear Pump Housing

I-14
Figure I-10. Gear Pump Side Wall
Figure I-11. Gear Pump Pressure Relief Valve

I-15
Figure I-12. Pump Gears
Figure I-13. Gear Tooth Wear

I-16
Fuel Injector
Figure I-14. Upper Injector Components

I-17
Figure I-15. Upper Ball Seat
Figure I-16. Lower Ball Seat
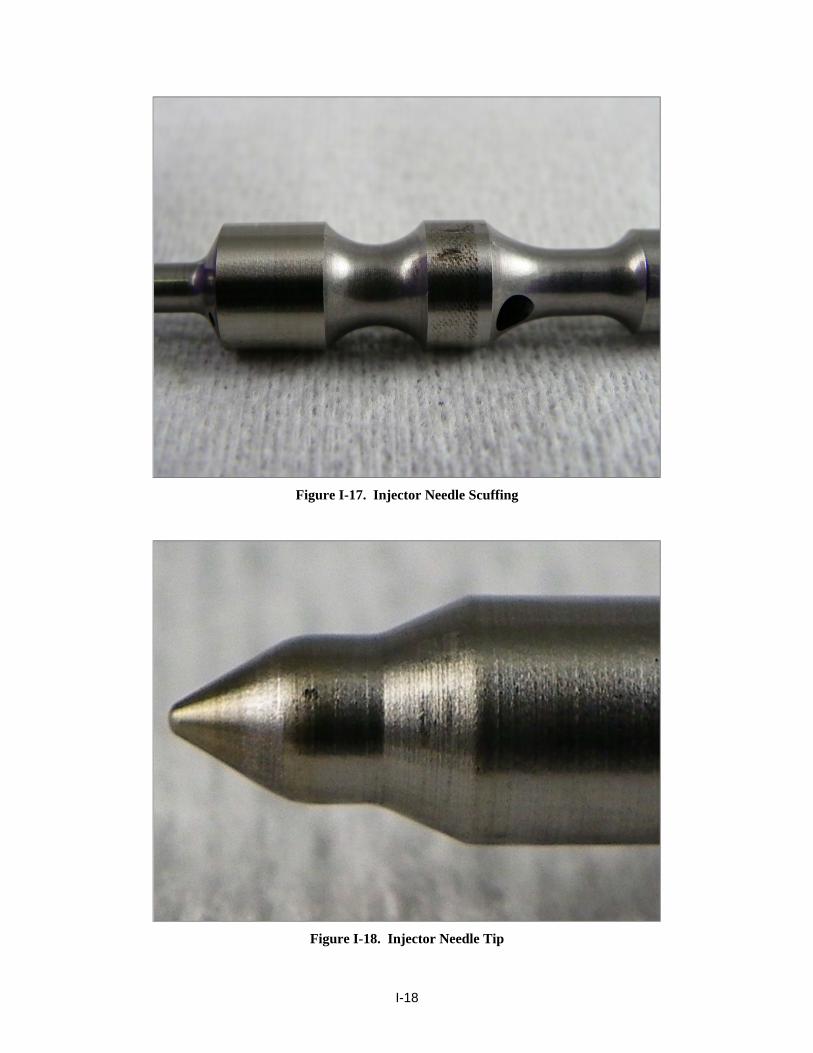
I-18
Figure I-17. Injector Needle Scuffing
Figure I-18. Injector Needle Tip


