UNCLASSIFIED AD NUMBER - Defense Technical Information Center · a stand-mounted hydrophone...
31
UNCLASSIFIED AD NUMBER AD860561 NEW LIMITATION CHANGE TO Approved for public release, distribution unlimited FROM Distribution: Further dissemination only as directed by Naval Oceanographic Office, Attn: Code 4420, Washington, DC 20390, AUG 1969, or higher DoD authority. AUTHORITY USNOO Notice, 25 Jan 1972 THIS PAGE IS UNCLASSIFIED
Transcript of UNCLASSIFIED AD NUMBER - Defense Technical Information Center · a stand-mounted hydrophone...
UNCLASSIFIED
AD NUMBER
AD860561
NEW LIMITATION CHANGE
TOApproved for public release, distributionunlimited
FROMDistribution: Further dissemination onlyas directed by Naval Oceanographic Office,Attn: Code 4420, Washington, DC 20390, AUG1969, or higher DoD authority.
AUTHORITY
USNOO Notice, 25 Jan 1972
THIS PAGE IS UNCLASSIFIED

DOCUMENTS '] r"
sour0A o; ýR'N~r957
INFORMAL REPORT
SHALLOW WATER AMBIENT NOISE
LEVELS IN THE TONGUE OF THE
OCEAN, BAHAMAS, FALL OF 1965
AND SUMMER OF 1966
780 750
ELEUTHERA 1. 40~
250- -- 250[l u
240 • GT
1 0 TEXUMA 1. 1 , j ijj)
............... ......-.1I..." .. '
780 750
AUGUST 1969
This document has been approved for publicrelease and sale; its distribution is unlimited.
NAVAL OCEANOGRAPHIC OFFICE
WASHINGTON, D. C. 20390
]INFORMAL REPORT
The Informal Report (IR) as produced at the Naval Oceanographic Office
is a means for personnel to issue timely scientific and technical preliminaryreports of their investigations. These are primarily informal documentsused to report preliminary findings or useful byproducts of investigationsand work to members of the scientific and industrial communities.
Informal Reports are assigned sequential numbers for each calendar year;the digits preceding the dash indicate the year.
The distribution made of this report is determined primarily by the author.Information concerning obtaining additional copies or being placed on adistribution list for all future Informal Reports in a given area of interestor specialty field, should be obtained from:
Field Management andDissemination DepartmentCode 4420Naval Oceanographic OfficeWashington, D.C. 20390
ABSTRACT
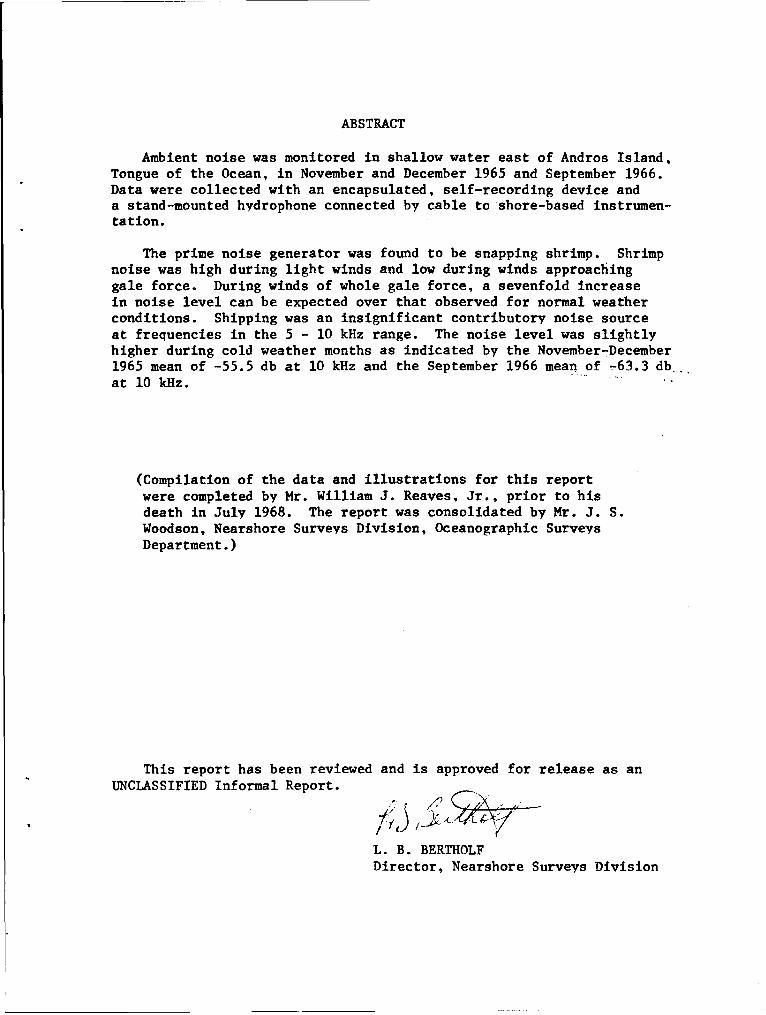
Ambient noise was monitored in shallow water east of Andros Island,Tongue of the Ocean, in November and December 1965 and September 1966.Data were collected with an encapsulated, self-recording device anda stand-mounted hydrophone connected by cable to shore-based instrumen-tation.
The prime noise generator was found to be snapping shrimp. Shrimpnoise was high during light winds and low during winds approachinggale force. During winds of whole gale force, a sevenfold increasein noise level can be expected over that observed for normal weatherconditions. Shipping was an insignificant contributory noise sourceat frequencies in the 5 - 10 kHz range. The noise level was slightlyhigher during cold weather months as indicated by the November-December1965 mean of -55.5 db at 10 kHz and the September 1966 mean of -63.3 db...at 10 kHz.
(Compilation of the data and illustrations for this reportwere completed by Mr. William J. Reaves, Jr., prior to hisdeath in July 1968. The report was consolidated by Mr. J. S.Woodson, Nearshore Surveys Division, Oceanographic SurveysDepartment.)
This report has been reviewed and is approved for release as anUNCLASSIFIED Informal Report.
/.... _L. B. BERTHOLFDirector, Nearshore Surveys Division
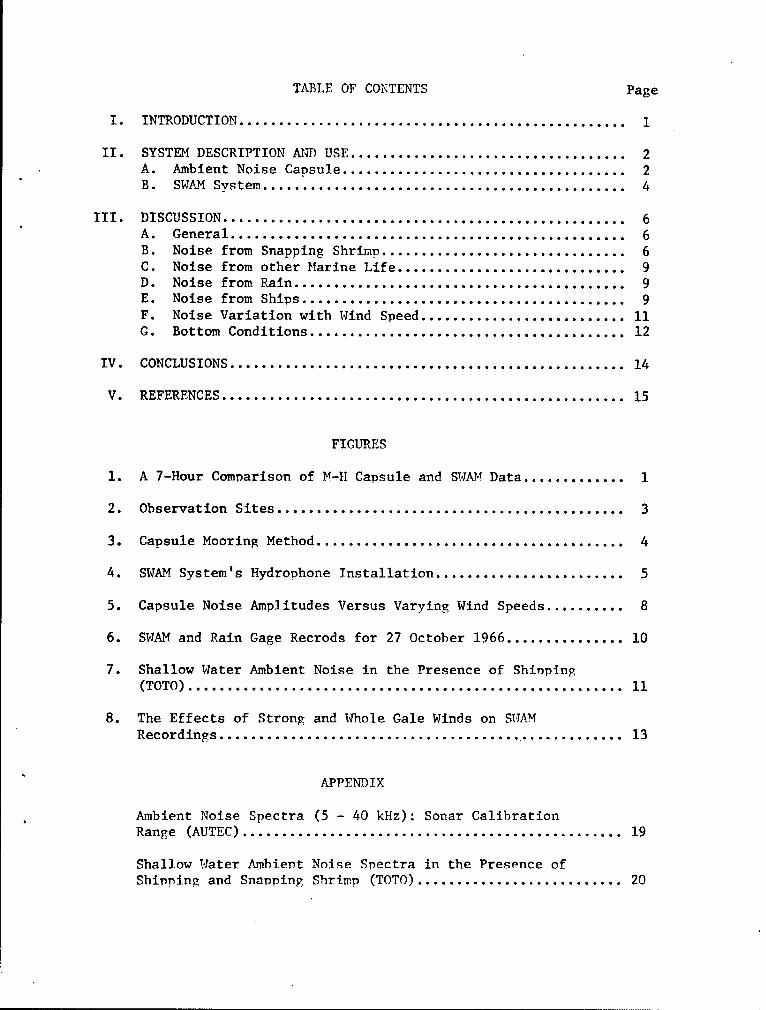
TABLE OF CONTENTS Page
I. INTRODUCTION ................................................. 1
II. SYSTEM DESCRIPTION AND USE ................................... 2A. Ambient Noise Capsule .................................... 2B. SWAM System .............................................. 4
III. DISCUSSION ................................................... 6A. General .................................................. 6B. Noise from Snapping Shrimp ............................... 6C. Noise from other Marine Life ............................. 9D. Noise from Rain .............................. ............ 9E. Noise from Ships ......................................... 9F. Noise Variation with Wind Speed .......................... 11G. Bottom Conditions ........................................ 12
IV. CONCLUSIONS .................................................. 14
V. REFERENCES ................................................... 15
FIGURES
1. A 7-Hour Comparison of M-H Capsule and SWAM Data ............. 1
2. Observation Sites ............................................ 3
3. Capsule Mooring Method ....................................... 4
4. SWAM System's HydroDhone Installation ........................ 5
5. Capsule Noise Amplitudes Versus Varying Wind Speeds .......... 8
6. SWAM and Rain Gage Recrods for 27 October 1966 ............... 10
7. Shallow Water Ambient Noise in the Presence of Shinping(TOTO) ....................................................... 11
8. The Effects of Strong and Whole Gale Winds on SWAMRecordings .................................................... 13
APPENDIX
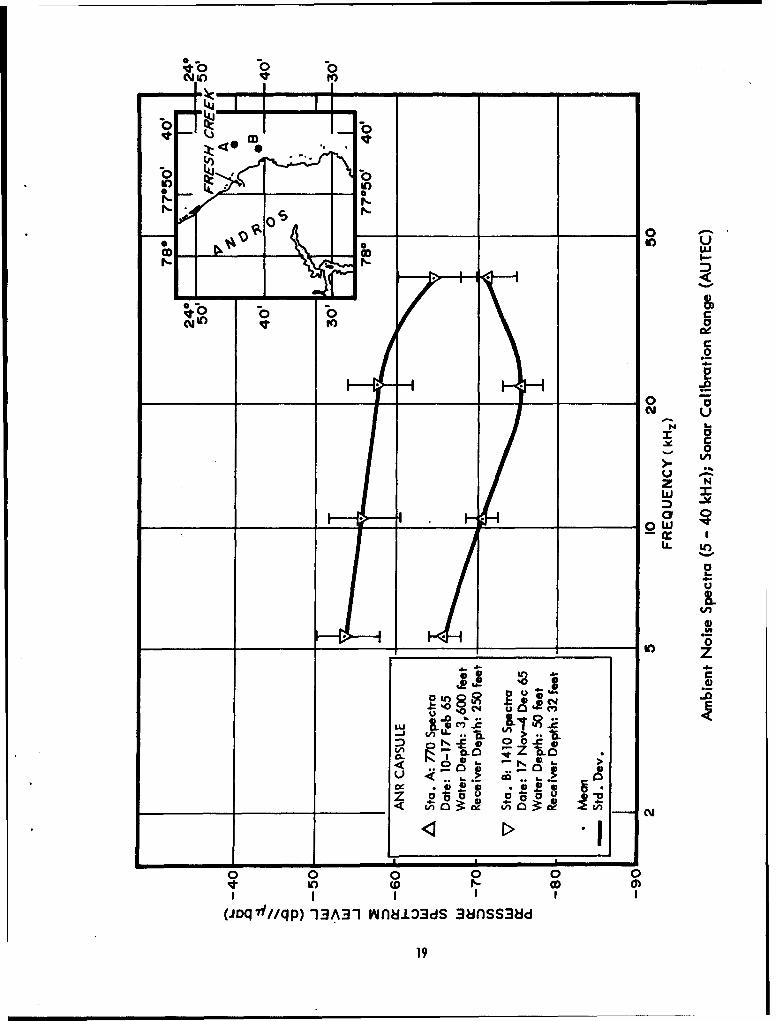
Ambient Noise Spectra (5 - 40 kHz): Sonar CalibrationRange (AUTEC) ................................................ 19
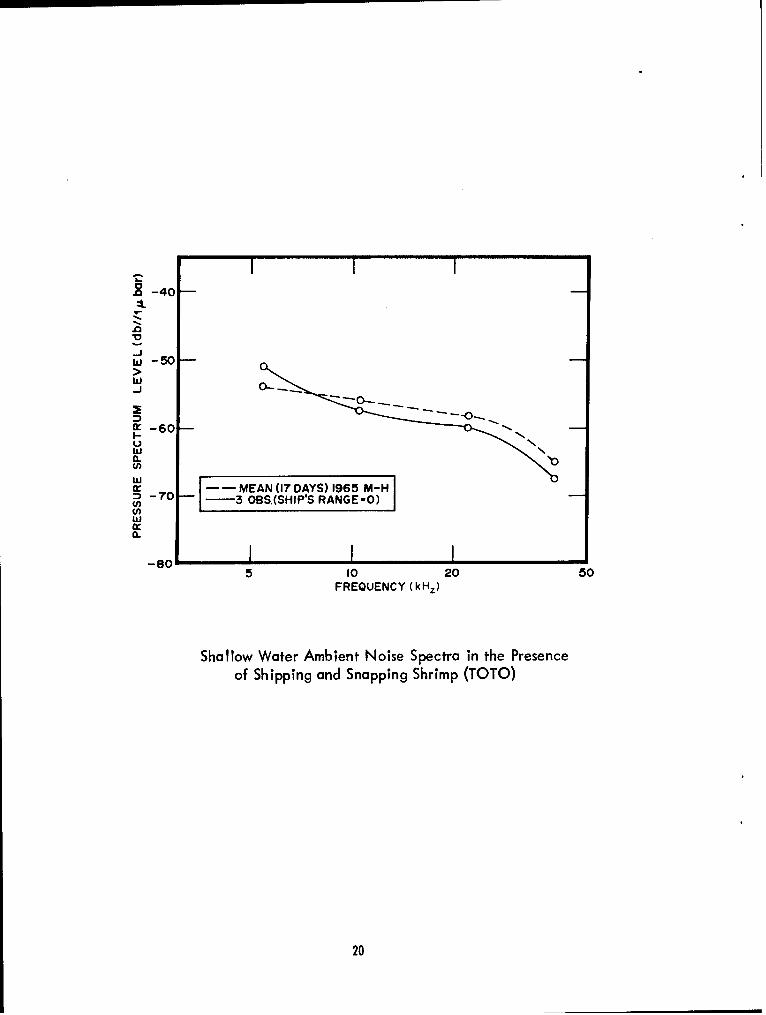
Shallow Water Ambient Noise Spectra in the Presence ofShinping and Snapping Shrimp (TOTO) .......................... 20

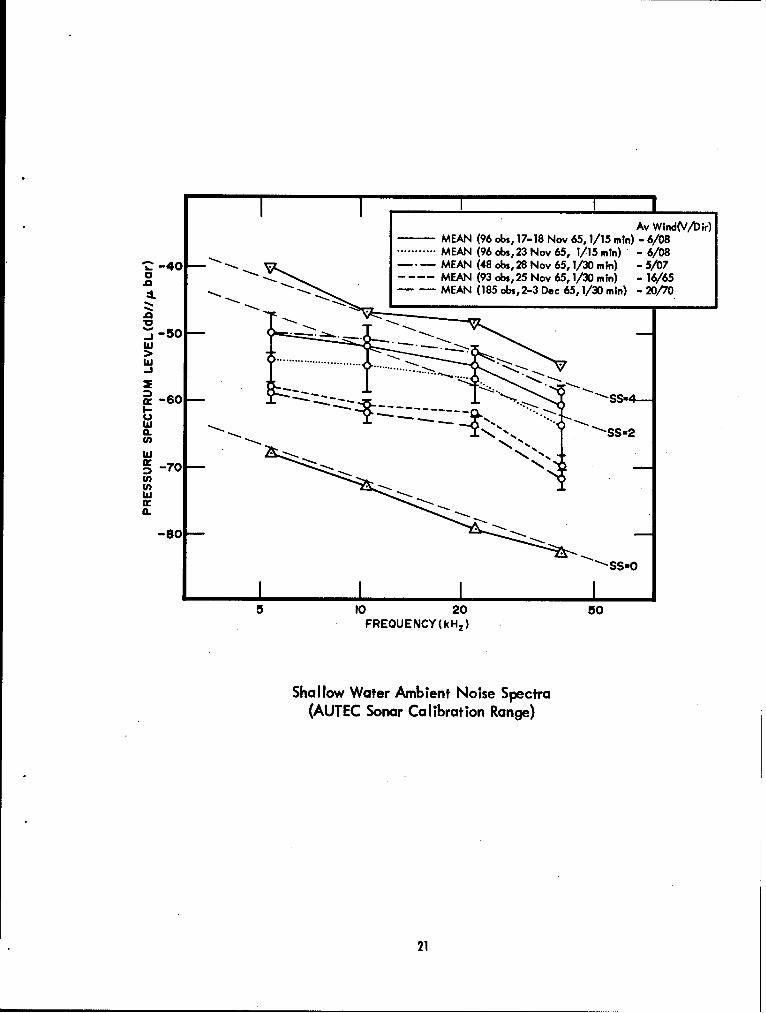
Shallow Water Ambient Noise Spectra (AITTEC Sonar CalibrationRange) ....................................................... 21
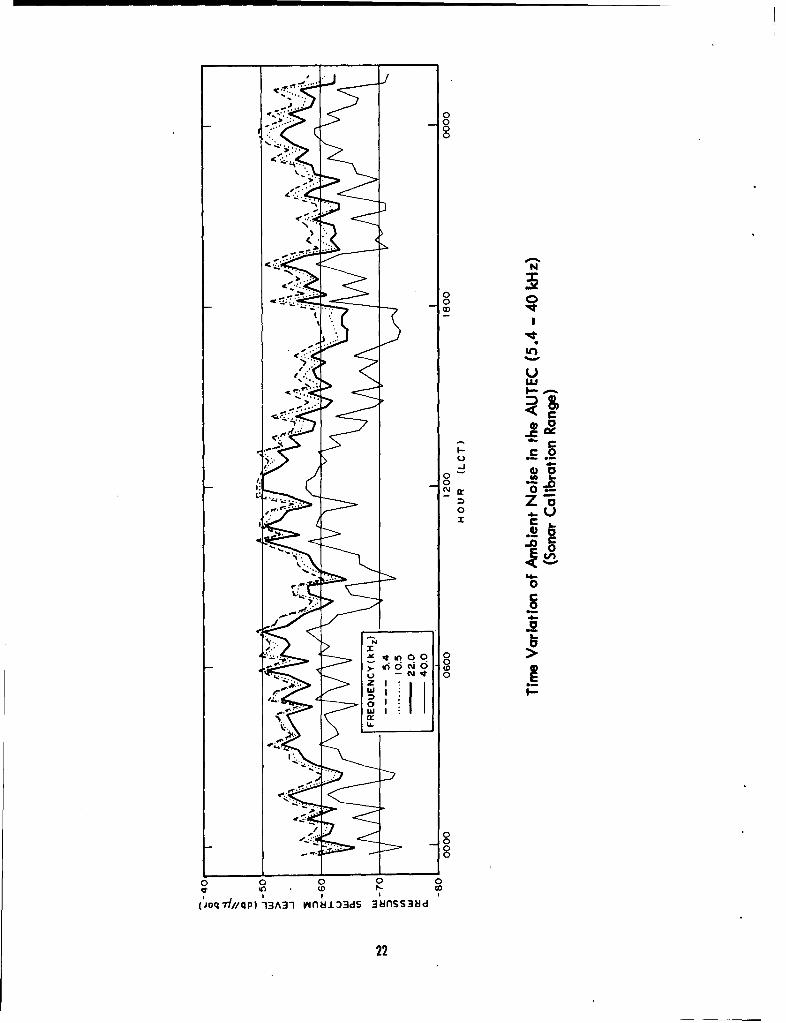
Time Variation of Ambient Noise in the AUTEC (5.4 - 40 kHz)(Sonar Calibration Range) .................................... 22
Variations in Shallow Water Ambient Noise (10 kHz) in thePresence of Snapping Shrimn (TOTO) ........................... 23
List of Wind Speeds and Directions in November 1965 .......... 25

I. INTRODUCTION
During the periods 8 November through 10 December 1965 and 3through 6 September 1966, acoustic monitoring was accomplished inthe Tongue of the Ocean (TOTO) in the shallow water east of AndrosIsland. The data were collected for the AUTEC (Atlantic UnderseaTest and Evaluation Center). Signal receiver-recorders were usedfor automated data collection.
In the September 1966 survey, a back-up system also was utilized.The need for this double monitoring had been demonstrated in thefall 1965 implant when intermittent readings caused gaps in the monitoreddata. The two systems employed were the Minneapolis-Honeywell AmbientNoise Capsule (M-H Capsule) and the Shallow Water Acoustic Monitor(SWAM) designed by William J. Reaves.
The capsule functioned satisfactorily during the 1965 survey• and for about half the time during the 1966 survey. The SWAM system
provided back-up and a cTieck on the time-integrated type readoutof the capsule.
A comparison of the db pressure levels versus time between thecapsule and SWAM systems reveals the similarity of the data (seeFigure 1). Comparisons can be made only in broad terms because the
-75
:-70.t
-60
00
t 60W0 0
LEGEND
-55 x- M-H CAPSULE
-0__---_ SWAM
- oI II0000 0200 0400 0600 0800
TIME (LCT)
FIGURE 1. A 7-Hour Comparson of M-H Capsule and SWAM Data.
capsule integrates its data over a time period prior to recording,whereas, SWAM readings are instantaneous amplitudes. Also, a definitereal time relation is obtained in capsule data by photographing aclock at each data cycle, but in SWIVI data, only time notations aremade on a moving tape. The comparison does establish, however, thatboth the highest and lowest db pressure levels obtained from SWAMare substantiated by the capsule.
II. SYSTEIM DESCRIPTION AND USE
A. Ambient Noise Capsule.
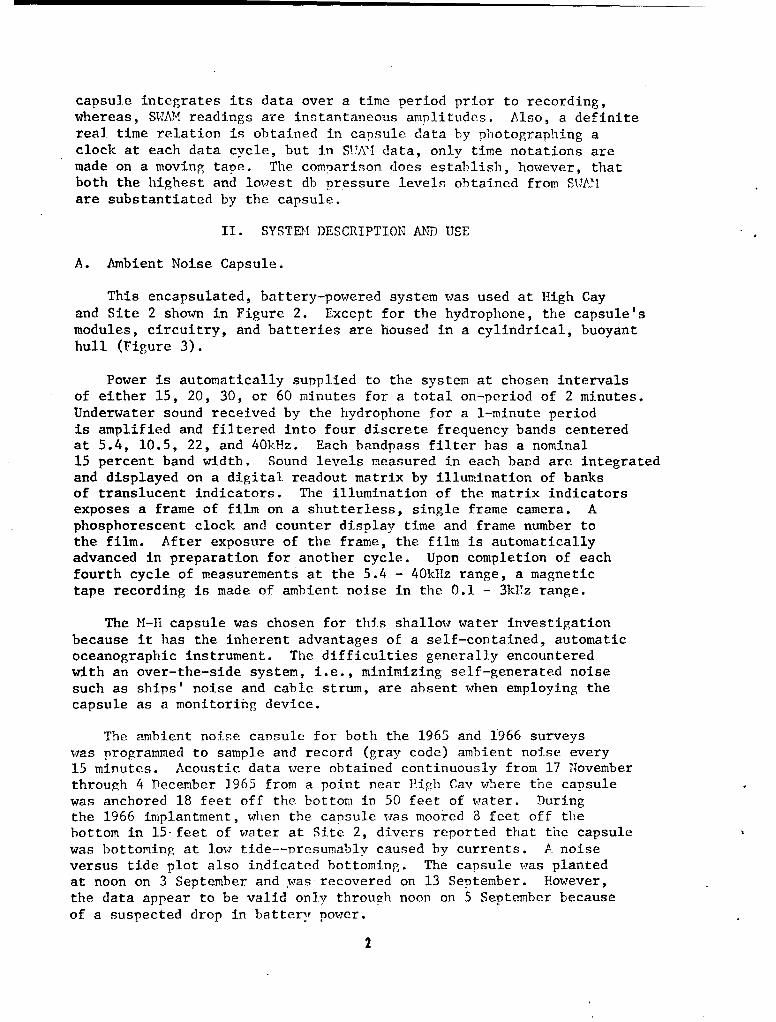
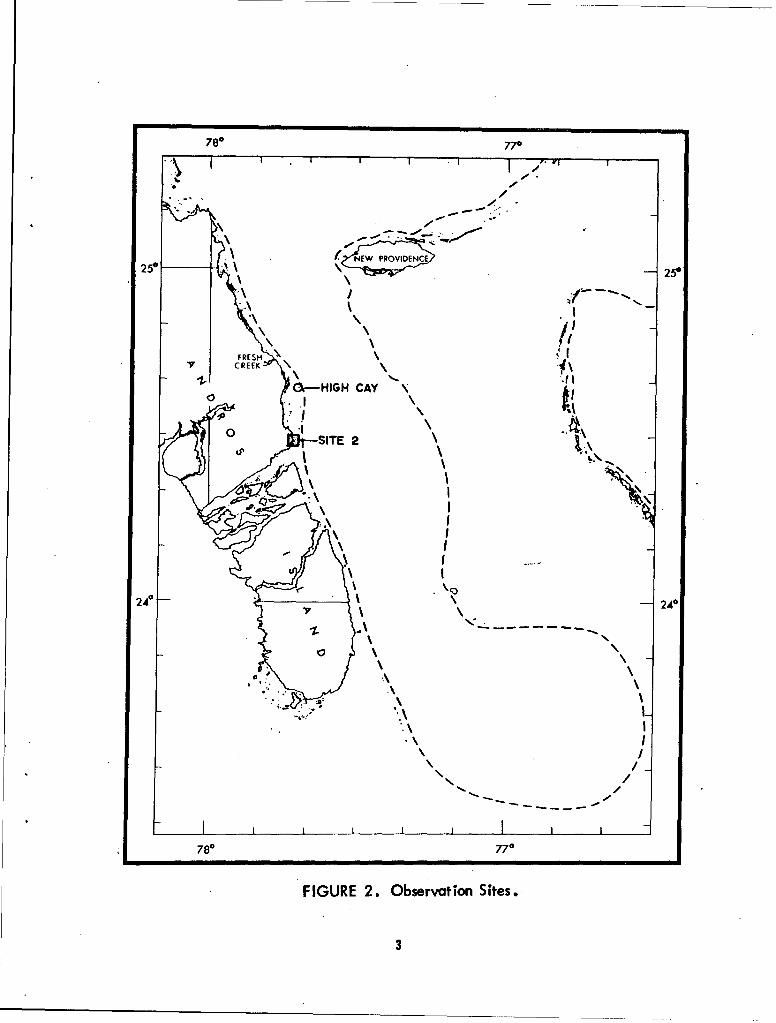
This encapsulated, battery-powered system was used at High Cayand Site 2 shown in Figure 2. Except for the hydrophone, the capsule'smodules, circuitry, and batteries are housed in a cylindrical, buoyanthull (Figure 3).
Power is automatically supplied to the system at chosen intervalsof either 15, 20, 30, or 60 minutes for a total on-period of 2 minutes.Underwater sound received by the hydrophone for a 1-minute periodis amplified and filtered into four discrete frequency bands centeredat 5.4, 10.5, 22, and 40kHz. Each bandpass filter has a nominal15 percent band width. Sound levels measured in each band are integratedand displayed on a digital readout matrix by illumination of banksof translucent indicators. The illumination of the matrix indicatorsexposes a frame of film on a shutterless, single frame camera. Aphosphorescent clock and counter display time and frame number tothe film. After exposure of the frame, the film is automaticallyadvanced in preparation for another cycle. Upon completion of eachfourth cycle of measurements at the 5.4 - 40kHz range, a magnetictape recording is made of ambient noise in the 0.1 - 3k~z range.
The M-11 capsule was chosen for this shallow water investigationbecause it has the inherent advantages of a self-contained, automaticoceanographic instrument. The difficulties generally encounteredwith an over-the-side system, i.e., minimizing self-generated noisesuch as ships' noise and cable strum, are absent when employing thecapsule as a monitoring device.
The ambient noise capsule for both the 1965 and 1966 surveyswas programmed to sample and record (gray code) ambient noise every15 minutes. Acoustic data were obtained continuously from 17 Novemberthrough 4 December 1965 from a point near High Cay where the capsulewas anchored 18 feet off the bottom in 50 feet of water. Duringthe 1966 implantment, when the cansule was moored 8 feet off thebottom in 15-feet of water at Site 2, divers reported that the capsulewas bottoming at low tide--presumably caused by currents. A noiseversus tide plot also indicated bottoming. The capsule was plantedat noon on 3 September and was recovered on 13 September. However,the data appear to be valid only through noon on 5 September becauseof a suspected drop in battery power.
2
780 77o
AA
•- -
AK
--HIGH CAY "
0SITE 2
04 24 0
\ N
• \ ...
F•--IGUE 2. ObevtonSts
II
-5-.--- .,,-
• -- -,
FGURE'2.\ ObevtonSts
I ".\3
S~CAPSULE
FIGUREON 3. C'sl orn ehd
•POLYPROPYLENE LINE (0.50)RING
'.,,• ~SWIVEL--
:."" • SHACKLE(TAPE[-
'j I
POLYPROPYLENE LINE(WITH CHAFING GEAR)
FIGURE 3. Capule Mooring Method.
While the capsule was on station during the 1965 survey, meteorologicaldata were observed and recorded as part of normal operations at thefollowing stations:
1. AUTEC Site 2.2. International Airport, New Providence Island, Bahamas.3. USS LITTLETTALES (PGSC 15) on various oceanographic stations
in the TOTO.
B. STWý" System.
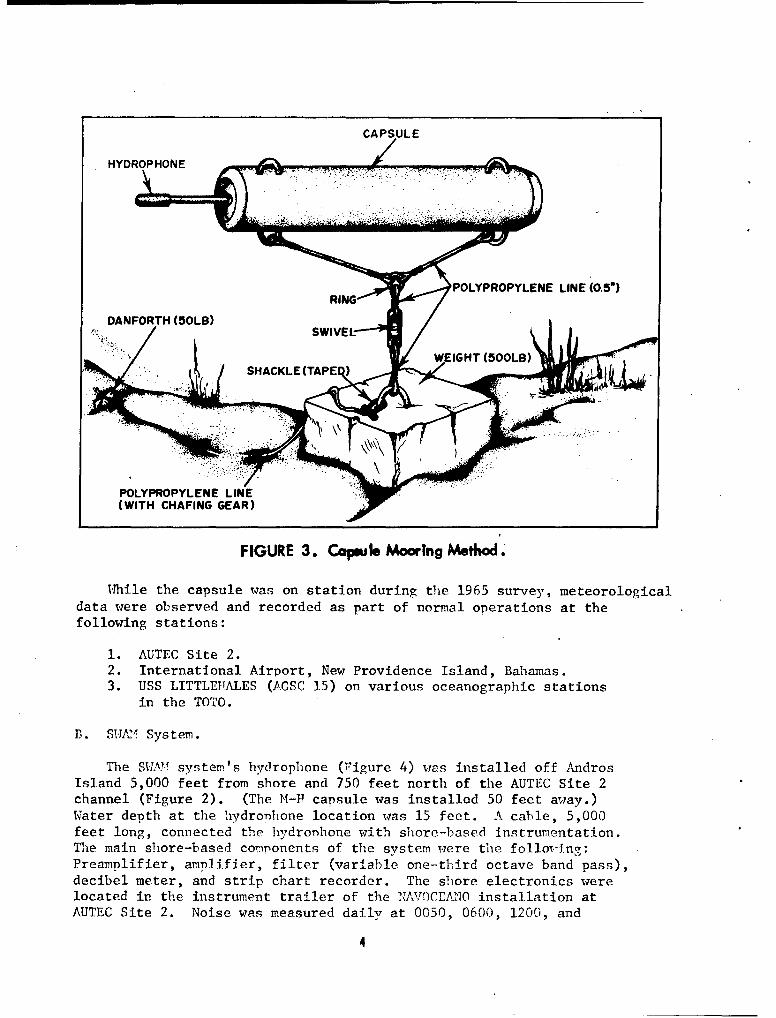
The SWMIT system's hydrophone (Figure 4) was installed off AndrosIsland 5,000 feet from shore and 750 feet north of the AUTEC Site 2channel (Figure 2). (The M-11 capsule was installed 50 feet away.)Water depth at the hydronhone location was 15 feet. A cable, 5,000feet long, connected the hydronhone with shore-based instrumentation.The main shore-based coriponents of the system were the folloi-ing:Preamplifier, amplifier, filter (variable one-third octave band pass),decibel meter, and strip chart recorder. The shore electronics werelocated in the instrument trailer of the NAVOCEA-NO installation atAUTEC Site 2. Noise was measured daily at 0050, 0600, 1200, and
4
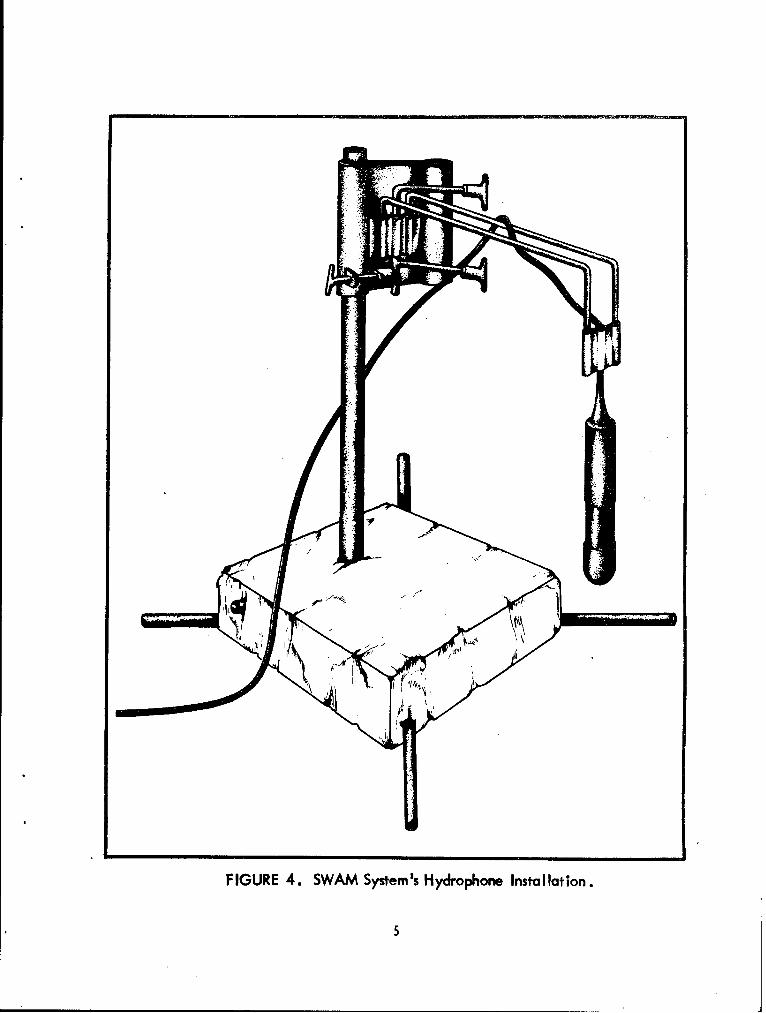
FIGURE 4. SWAM System's Hyclrophone Installation.
5

1800 hours Local Civil Time (LCT) and during extremes of contributoryenvironmental conditions. (In preparing this report, it has becomeclear that monitoring environmental changes is more important thantimed measurements and that all conditions must be monitored simultaneouslyfor a significant time span; i.e., wind, temperature, tide level,noise level, and sea state must all be obtained simultaneously, andthe data records must be well annotated as to the time that a changeappears in the above phenomena.) At Site 2, tide and meteorologicalobservations accompanied each acoustic measurement. SWAN observationswere made intermittently on this station from 2 June 1966 until 18February 1967.
The SWAM acoustic data collected at Site 2 were grouped by periodsof time. The following factors necessitated this type of grouping:
1. The rapid accumulation of fouling on the hydrophone withtime. The decreasing sensitivity of the hydrophones,primarily due to fouling, caused a slight decreasingtrend in the levels of the hydrophone output.
2. The rotation of personnel at Site 2 made it necessary thatthe system be compact and exhibit operational simplicity.The majority of the data was acquired with a db metermonitoring at 10kHz; therefore, levels recorded were"eye-balled" averages of a fluctuating meter. Comparingdata collected by two or more observers could very likelyproduce an unknownm error in the analysis. For thisreason, a Sanborn recorder was patched into and calibratedas part of SWAM prior to the installation of the M-H capsule.
With the effects of the above mentioned factors in mind, datawere collected to observe short term changes and deviations ratherthan absolute spectrum levels. No long-period analysis has been
attempted.
III. DISCUSSION
A. General.
The noise measurements were made as part of an overall objectiveto establish the effects of ambient noise influences on the AUTECrange operations. The summer-fall noise levels are indicated forreef environment in the frequencies monitored, and noise levels areshown for the 40 - 50 mph winds of Hurricane Inez. Noise relationshipto wind and other factors were investigated and are discussed below.
B. Noise from Snapping Shrimp.
A vast colony of snapping shrimp inhabits the shallow waterssurrounding the TOTO. The crackling sound produced by beds of these

crustaceans dominates the noise monitored in audio frequencies higherthan 5kHz. The snapping shrimp crackling was easily detected atranges less than 2 miles from the 30-fathom contour. This.soundwas in evidence on all taped records from the capsule, and it istherefore assumed that snapping shrimp in quantity were in the immediatevicinity of the hydrophone during the measurement interval. It isalso assumed that shrimp are the major contributors to ambient noisein the shallow waters surrounding the TOTO. The appendix containsa summary of ambient noise spectra in the presence of snapping shrimp.See chapter 16 of Underwater Acoustics Handbook for other discussionof snapping shrimp.
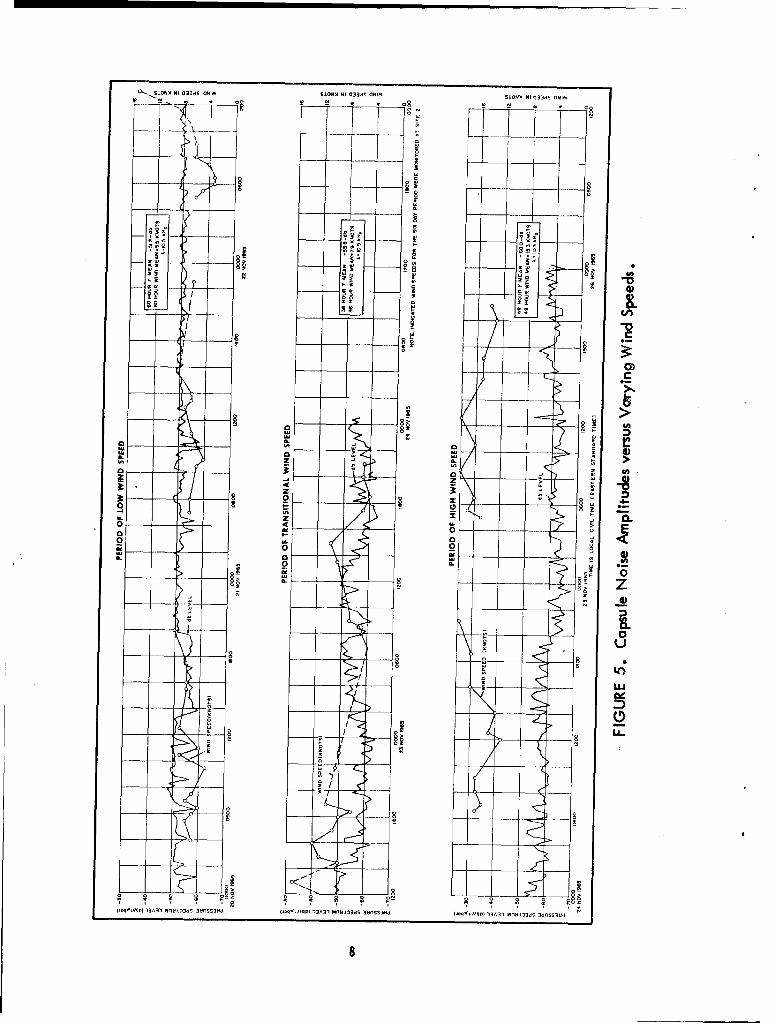
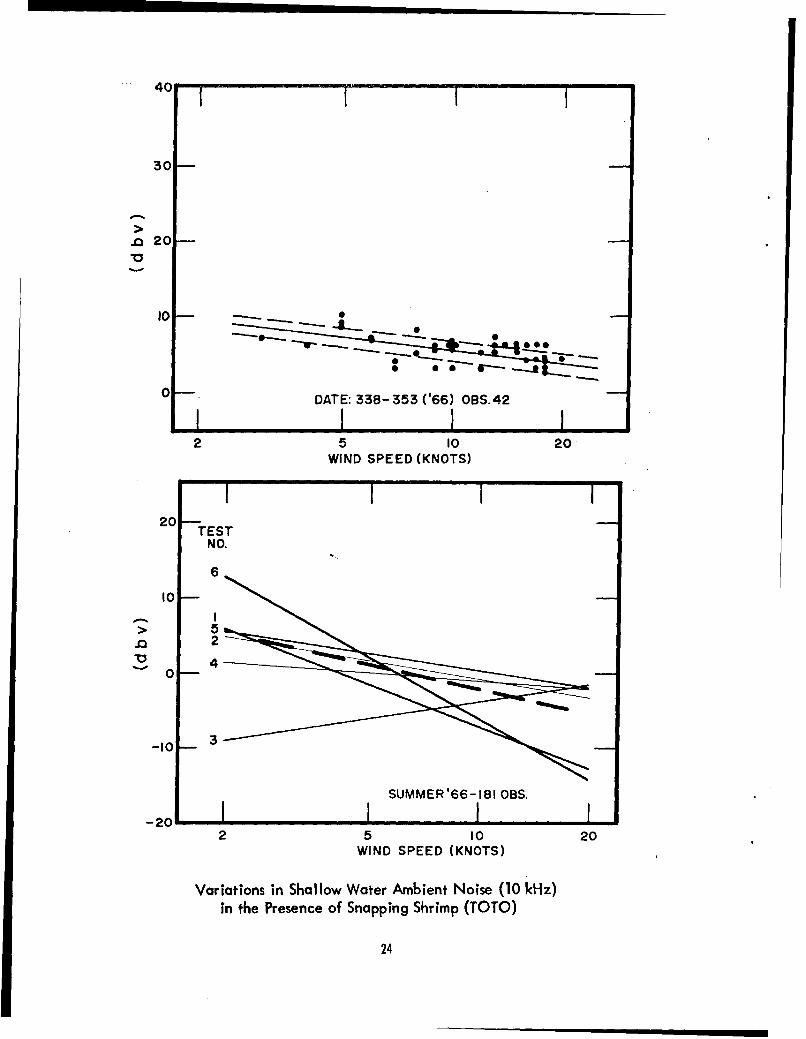
The most predictable variation in the monitored noise levelsis that associated with changes in wind velocity. As indicated bythe capsule data for the 6-day period monitored between 20 and 25November 1965, for winds below gale force, the noise level will behigh during low wind speeds (0-6 knots) and low during higher windspeeds (15-25 knots) (Figure 5). Additional substantiating dataare presented on pages 24 and 25.
The theory advanced for the decreased noise level on the shallowwater during high but below gale force winds is that shrimp tendto "quiet down" during high winds. There is the possibility thatshrimp do not decrease noise generation but rather burrow into thebottom and produce less instrument discernible sound.
It is significant that the data in this report are not in agreementwith the conclusions drawn from six major ambient noise surveys conductedin the TOTO by Columbia University and the University of Miami asto the prime nature of variation in shrimp generated noise levels.The university laboratory data substantiated the existence of highnighttime and low daytime shallow water noise levels. Each universitycompleted three surveys during the period 1943-1959. Factors whichmay account for the differences are: (1) that SWAM and capsule dataare from longer time span measurements, (2) the absence of ship orsmall boat frequently in the vicinity of the monitored area, (3)a much higher percentage of bottom mounted acquired data as opposedto lowered hydrophone measurements, and (4) a larger volume of datafrom one station.
The shallow water sound level variation is different from thatrecorded in a deep water implant of the capsule (February 1965) offFresh Creek where the noise level was significantly higher at nightthan during daylight. The capsule on the February 1965 implant wasplaced at the 250-foot depth in 4,500 feet of water. The periodicityof the February variation is attributed to the abandonment of deepwater by marine life for the more lucrative feeding area of thire photosynthesizedzone during daylight.
7
0., SIOmx N1 aofds OUIm IN NI 033.S ON'. £1000 NIF033dS 02102~ N NQ2 N OE
8j W
0-00
MLL
w -T
100
0 0
N4(- 1 5P 133 MnIU 3UnSIN oJW/lP 13A1(013d U3l3 OSlSSqOS
8
C. Noise from other Marine Life.
A wide range of marine life inhabits the TOTO, and noise fromsoniferous fish has been detected throughout the area. A literaturesurvey of the TOTO by Lieutenant Kral, USN, NAVOCEANO DITi 0-45-62of June 1962, documents the marine life. Turtles, fish, and mammalscontribute to noise, but as has been noted, the dominant contributionis made by snapping shrimp.
D. Noise from Rain.
An effort was made to establish the influence of rain as an isolatedcontributor to the ambient noise level. The meteorological datawere searched for periods of rainfall of at least an inch in whichwind levels remained low. No such periods were discovered duringthe period monitored by the M-H capsule for either the November 1965or September 1966 implants. The SWAM system monitoring on 27 October1966 (between 1656-1705 hours) covered the only rainfall where therain gage and SWAM were simultaneously operating. The better periodto have monitored would have been between 1445 and 1515 hours, butthe Sanborn recorder was not turned on until 1656 hours or near theend of the second accumulation (Figure 6). The noise levels measuredduring rainfall showed an increase in level compared to noon data.There-is no certainty from examination of the data when rain impactedin the hydrophone area, a mile from the rain gage.
In this case, the WAM monitoring coincided with an increasingwind velocity (from 5 kns to 11 kns), and from previous analysis,increasing winds would indicate a noise decrease and not an increase.There is enough indication to warrant further study of rainfall asa variant in noise levels for shallow water. The more sophisticatedmeteorological monitoring equipment now at AUTEC sites will greatlyaid in any future study. A 1967 text, "Principles of UnderwaterSound for Engineers", contains discussion and illustration of rainas a noise contributor.
E. Noise from Ships.
Ship generated noise was investigated as the possible cause offrequent short term variations in levels during midday hours. Thisphenomenon occurred over the entire range of frequencies monitoredby either system with short period variations nearly as high as longperiod changes. The conclusion was reached that in or near theshallow waters adjoining the TOTO shipping is an insignificant contributorynoise source at frequencies in the 5 - 40kHz range.
Examination of data, collected during the time that LITTLEIALESwas directly above the capsule and when LTTTLEHALES' range was over4 miles with no sighted vessel closer to the capsule, revealed thefollowing: In bands centered at 10.5, 22, and 40kHz, there was a
9

t
wN
0 4
01010.. Jt-
.j 0 w
(I-I
0
0
0000 ~0
U C%
-J 0
0 000
0 IIt
Lo 0 -1
o F--J ~0~
100

slight tendency for noise levels to increase as the range to LITTLERALESincreased. The 5.4kHz snectrum level tended to weakly decrease asthe range to LITTLEHALES increased. (see Figure 7).
Measurement and analysis of LITTLEWHALES' acoustic signature whilethe capsule was being installed showed the peak output at a frequencyless than 0.1kHz and spectrum levels decreasing rapidly with increasingfrequency. Assuming that any ships navigating the waters near thestation have signature characteristics similar to LITTLEHALES, thennoise generated by ships is not a major variant in the data.
The noise variation cited above is less than 3 db. The capsuledata short term variations (15-minute interval) were observed tohave a range as high as 11.5 db. This large range was observedat night, a time when ship traffic is unlikely to be in the vicinityof the reef. As with high sea state, the migratory and acousticalactivity of a bed of snapping shrimp would seemingly be affectedby the presence of shipping. If the bed tended to "quiet down" and/ormove away from noise or turbulence resulting from shipping, an explanationwould be furnished for the trend of variation presented in Figure 7.
- -40
~:-50
.--- 0.OkH
S-so
W
a-
"J ,,,. .140 kHz
A, -70" E D A CAPSULE IN AIR""'"Ia CAPSULE ON STATION
hi
a.m LITTLEHALES RANGE =0
CAI I I I
1200 1400 1600 1800 2000TIME (LCT NOV 1965)
FIGURE 7. Shallow Water Ambient Noise in the Presence of Shipping (TOTO).-
P. NToise Variation with Wind Speed.
Earlier in this report, the noise levels as generated by shrimpwere related to wind speeds and found not to change radically upto gale force winds. Hurricane Inez, passing Andros Island during2 - 4 October 1966, provided an opportunity to relate sound levelsto higher winds at the 15-foot depth near the reef. The hurricane
11
traveled north through the Florida Straits to Abaco Island and theninto the Gulf of Mexico via, the same route.
In relating these data to the AUTEC operations, it must be notedthat under such extremes of wind, rain, and sea state the range willbe non-operational. This rise in noise level is applicable onlyto fleet combat units in a nearshore environment.
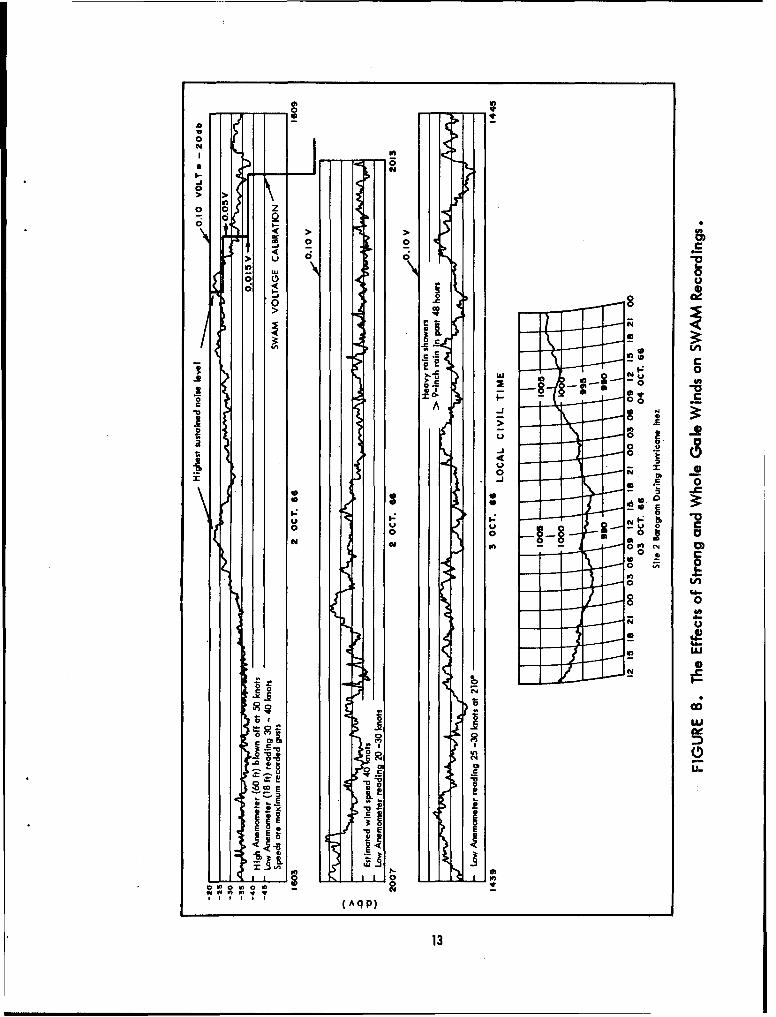
The noise levels recorded, (Figure 8), show a peak just after1600 hours on 2 October 1966, before the low barograph reading. Duringthis period, winds were out of the southeast, a long fetch direction.All later wind directions moved nearer west, or to minimum fetch,and account for the noise level decrease since winds continued over40 knots in very heavy rain showers. The anemometer also is placedon the lee side of the island by the westerly winds.
The SWAM level conversions, voltage to dbv, may be determinedfrom the table below:
1.0 volt = 0 db 0.050 volt = -26.0 db0.10 volt - -20 db 0.030 volt = -30.5 db0.07 volt = -23 db 0.015 volt = -36.5 db
The noise generated during the storm is about seven times theintensity as shown in Figure 6. An increase of this magnitude wouldcarry well offshore, but the same overtopping of deep water wavesoccurring in the open sea would cause a comparable noise increase.
G. Bottom Conditions.
Among the many factors influencing the intensity of noise isthe stability of conditions in which the major noise generator, thesnapping shrimp, exists. The Andros lagoon and the deeper bottom,seaward of the reef adjacent to the TOTO, provide the rough topography,coral heads, caves, shells, rocks, kelp, and vegetable growth whichfavor the growth of shrimp colonies.
The depths best suited to shrimp bed development, 5 to 30 fathoms,along the outer platform are covered in great detail in NAVOCEITOTR-189 of May 1966. The authcrs used SCUM' and Perry Cubmarine (PC3-L)to obtain photographic and artistic documentation.
The ruggedness of the bottom, size of coral and rock outcrops,trenches, and caves probably account for the lack of significantchange during winds of moderate velocity since theV features woulddecrease current velocities. The wird driven wrave cannot bottonin the deeper portions of the TO-'), but 1-knot currents to 70 fathomscould be driven onto the escarpment ton, there to be reflected, refracted,and broken up.
12
00
N>
dC
00> ~>
C-
A Q
o o
0( .2~ 0
6 0
0 1.: -t0 0 V
a- 0
o £ 8Nu
0 0
~ w *.:.3 >C
to 59 D~I
c.-8 -
I0 of 0 a- '
(Aq P)
- 13

To date, there has been no monitoring of temperature seawardof the reef and short of the dropoff. The best information availableat NAVOCEANO is provided by the Office's SCUBA diver oceanographerswho, since 1964, have made many dives in and around the reef anddrop-off areas. The divers have found that in areas of 5- to 30-fathom depths seaward of the reef the water column essentially isisothermal top to bottom, and furthermore, the currents noted havebeen those pouring over the escarpment and sliding down the faceinto deep water. These currents could be water carried by tide andby rip tides from the beach areas and would have little temperaturedifferential but higher salinity and density.
Historically, the top 50 fathoms of the TOTO water is isothermalwith a summer-winter variation of 5*C. There is nothing to indicatethat the deep, cool water of the TOTO is forced by currents impingingon the sides of the basin to rise to the escarpment top. It appearsthat the temperature in the shrimp beds does not radically change.Comparison of November 1965 and September 1966 capsule data indicatesslightly higher noise levels in the 1965 data.
IV. CONCLUSIONS
The prime contributor to normal or typical shallow water noiselevels in waters surrounding the TOTO is marine animal life. Thenoisiest among these marine animals is the snapping shrimp. Shrimpnoise will be high in light winds and low during winds approachinggale force. This variation of noise level is different from thatfor deep water in the TOTO where marine life is again the prime contributorbut where measured noise levels are diurnal, being quieter duringdaylight hours. (Unreported February 1965 M-H capsule data.)
During winds of whole gale force, a sevenfold increase in noiselevel can be expected over that observed for normal weather conditions.The relationship of this increase to open ocean noise levels cannot be determined from the data, but the increase is sufficient tomask ship generated noises.
Shipping is an insignificant contributory noise source at frequenciesin the 5 - 40kIlz range for the shallow waters surrounding the TOTO.
Rain, as an independent contributor, probably does significantlyraise the noise level in the shallow waters, but this report doesnot contain enough information to substantiate this hypothesis.
The noise level along the east coast of Andros Island is slightlyhigher during cold weather months as indicated by the November -
December 1965 mean of -55.5 db at 10k11z and the September 1966 meanof -63.3 db at 10kHz.
14

V. REFERENCES
Busby, Roswell F., Chester V. Bright, and Andres Pruna, 1966. OceanBottom Reconnaissance off the East Coast of Andros Island,Bahamas. TR-189. U.S. Naval Oceanographic Office, Washington,D.C., 58 pp.
Kral, Anthony J., Lt., USN, 1962. Literature Survey, Biology in theTongue of the Ocean and Exuma Sound. IMR No. 0-45-62. U.S.Naval Oceanographic Office, Washington, D.C., UNPUBLISHEDMANUSCRIPT, 46 pp.
Woodson, John S., (In press). Deep Water Ambient Noise Levels inthe Tongue of the Ocean, Bahamas, February 1965. InformalReport, U.S. Naval Oceanographic Office, Washington, D.C.
15

APPENDIX
Ambient Noise Spectra (5 - 40 kHz) Sonar CalibrationRange (AUTEC)
Shallow Water Ambient Noise Spectra in the Presence ofShipping and Snapping Shrimp (TOTO)
Shallow Water Ambient Noise Spectra (AUTEC SonarCalibration Range)
Time Variation of Ambient Noise in the AUTEC (5.4 - kHz)(Sonar Calibration Range)
Variations in Shallow Water Ambient Noise (10 kHz) inthe Presence of Snapping Shrimp (TOTO)
List of Wind Speeds and Directions in November 1965
17
00
03 0
o - -00 0
In 0z
_ _ _4_ _ _ _ u____ 0
K.E~~ 0 C4Zx
0~~ 00
in OD(J~qf//q) -3A3- Pybi.L)3d 38nS3)
19A
S-40
.0
-Jw -50
-60
u
0~"I' I-7 MEAN (17 DAYS) 1965 M-H
:) -70 - 3 OBS.(SHIP'S RANGE-O)U)
-80 I I5 10 20 50
FREQUENCY (kHz)
Shallow Water Ambient Noise Spectra in the Presenceof Shipping and Snapping Shrimp (TOTO)
20
I II IAv Wind(V/Dir)
MEAN (96 obs, 17-18 Nov 65,1/15 min) - 6/08........... MEAN (96 obs, 23 Nov 65, 1/15 min) - 6/08
--40 MEAN (48 obs, 28 Nov 65,1/30 min) -5/070 MEAN (93 obs,25 Nov 65,1/30 min) -16/65.0 - - MEAN (185 obs,2-3 Dec 65,1/30 min) - 20/70
50
w.w ........ . ........ . .
. ...... •..... °
-60 "SS.
I ý -. SS-2U-
D -70U)U)Ir•w
-so-'SS"O
I I I I5 10 20 50
FREQUENCY (kHz)
Shallow Water Ambient Noise Spectra(AUTEC Sonar Calibration Range)
21
NN
co0
- 0
:rU))f
00
0o 0~ I
Ail.-
71//p) 3AT1iqn'.L:3dS3'HnS30
220

401
30
> 20
10- ,o -- - - -0• ; ; -• ___
0 -- DATE: 219- 233 ('66) OBS.49I I5 10 20
WIND SPEED(KNOTS)
30
20[
> 0 -
0-
DATE: 233-249 ('66)OBS. 31-10 --
*
2 5 10 20WIND SPEED(KNOTS)
Variations in Shallow Water Ambient Noise (10 kHz)
in the Presence of Snapping Shrimp (TOTO)
23
4 0 - . I I
30
"20
0 DATE: 338- 353 ('66) OBS.42
2 5 10 20WIND SPEED (KNOTS)
20 • -TEST
NO.
6
I0 I
>52
0 4-10 3
SUMMER'66-181 0BS.
-20 I2 5 10 20
WIND SPEED (KNOTS)
Variations in Shallow Water Ambient Noise (10 kHz)in the Presence of Snapping Shrimp (TOTO)
24
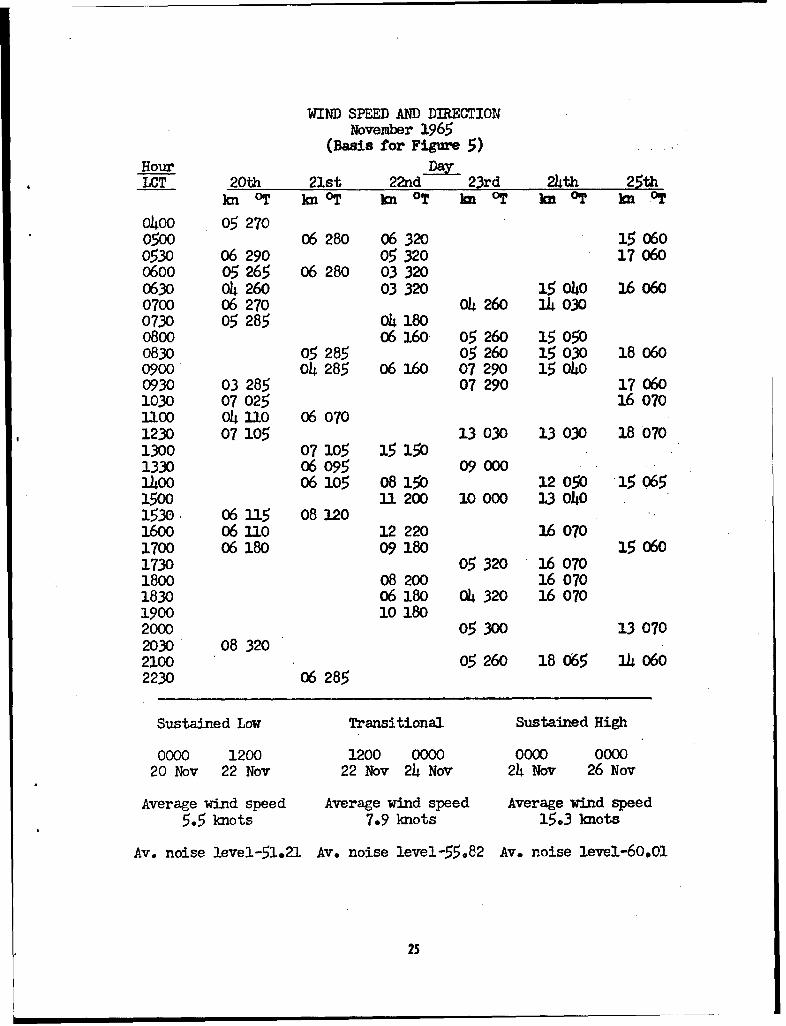
WIND SPEED AND DIRECTIONNovember 1965
(Basis for Figure 5)Hour DayLCT 20th 21st 22nd 23rd 24th 25th
kn OT knOT kn OT ka OT kn OT kn OT
o4oo 05 2700500 06 280 06 320 15 0600530 06 290 05 320 17 0600600 05 265 06 280 03 3200630 04 260 03 320 15 040 16 0600700 06 270 04 260 14 0300730 05 285 04 1800800 06 160 05 260 15 0500830 05 285 05 260 15 030 18 o6o0900 04 285 06 160 07 290 15 0400930 03 285 07 290 17 0601030 07 025 16 0701100 04 110 06 0701230 07 105 13 030 13 030 18 0701300 07 105 15 1501330 06 095 09 0001400 06 105 8150 12 050 15 10651500 1 200 10 000 13 0101530 06 115 08 1201600 06 110 12 220 16 0701700 06 180 09 180 15 0601730 05 320 16 0701800 08 200 16 0701830 06 180 04 320 16 0701900 10 1802000 05 300 13 0702030 08 3202100 05 260 18 o65 14 0602230 06 285
Sustained Low Transitional Sustained High
0000 1200 1200 0000 0000 000020 Nov 22 Nov 22 Nov 24 Nov 24 Nov 26 Nov
Average wind speed Average wind speed Average wind speed5.5 knots 7.9 knots 15.3 knots
Av. noise level-51.21 Av. noise level-55.82 Av. noise level-60.01
25

UNCLAS SI I l )Sec'uritv Ciassification
DOCUMENT CONTROL DATA - R & DS e-rritv classification of title, body of ,[ ,b tract ar! i ; t I itrlototii(n n1st be erntered wvher the ovverall report is classified)
I ORIGINATING ACTIVITS (Corporate muthor) 2a0. REPORT SECURITY CLASSIFICATION
I Unclassified
U.S. NAVAL OCEANOGRAPHIC OFFICE 2h. GROul'
3. REPORT TITLE
SHALLOW WATER AMBIENT NOISE LEVELS IN THE TONGUE OF THE OCEAN, BAHAMAS, FALL OF 1965AND SUMMER OF 1966
4. DESCRIPTIVE NOTES (Type of report and inclusive dates)
Informal Report 8 November 1965 - 6 Sentember 19665 AU THOR(S) (First name, middle initial, 'ast name,)
JOHN S. WOODSON and WILLIAM J. REAVES, JR.
6 REPORT DATE 7a. TOTAL NO. OF PAGES 17b. NO. OF REFS
August 1969 25 38a. CONTRACT OR GRANT NO. 9a. ORIGINATOR'S REPORT NUMBERIS)
b. PROJECT NO. 959-XC IR No. 69-57
C. 9b. OTHER REPORT NO(S) (Any other numbers that may be assignedthis report)
d.
10. DISTRIBUTION STATEMENT
This document has been approved for public release and salez its distribution isunlimited.
11. SUPPLEMENTARY NOTES 12. SPONSORING MILITARY ACTTIVITY
U.S. Naval Oceanographic Office
13. ABSTRACT
Ambient noise was monitored in shallow water east of Andros Island, Tongue ofthe Ocean, in November and December 1965 and September 1966. Data were collected
with an encapsulated, self-recording device and a stand-mounted hydrophone
connected by cable to shore-based instrumentation.
The prime noise generator was found to be snapping shrimp. Shrimp noise was
high during light winds and low during winds approaching gale force. During winds
of whole gale force, a sevenfold increase in noise level can be expected over that
observed for noimal weather conditions. Shipping was an insignificant contributory
noise source at frequencies in the 5 - 10 kHz range. The noise level was slightly
higher during cold weather months as indicated by the November-December 1965 mean
of -55.5 db at 10 kHz and the Sentember 1966 mean of -63.3 db at 10 kHz.
DD FIoR 1473 1) UNCLASSIFIED/ý 010 !( - 907 6 8-0 1 Security Classification
UNCLAS S IFI EDSecurity Classification
14. LINK A LINK 8 LINK CKEY WORDS
ROLE WT ROLE WT ROLE WT
AMBIENT NOISETONGUE OF THE OCEANAUTECMINNEAPOLIS - HONEV.TELL AM'BIETNT NOTSE
CAPSULESHALLOW WATER ACOUSTIC MONITOR (SUAM)
DD •oFORM IMACK)DD* I NOV65 UNCLASS IIED(P AGE' 2) Security Classification